42
Archdiocese of Dublin Projection of position in 2030 A presentation to the Priests Council Conor O’Donovan 16 September 2015 © 2015 Towers Watson. All rights reserved.
Archdiocese of DublinProjection of position in 2030
A presentation to the Priests CouncilConor O’Donovan16 September 2015
© 2015 Towers Watson. All rights reserved.

Estimate the number of active Priests in the Archdiocese of Dublin in 2030Estimate the number of active Priests in the Archdiocese of Dublin in 2030
Analyse the impact of these numbers and options for dealing with the reduction in Priest populationAnalyse the impact of these numbers and options for dealing with the reduction in Priest population
Aims of analysis
© 2015 Towers Watson. All rights reserved.towerswatson.com
Estimate the mass attendance numbers and number of people presenting for sacraments in 2030Estimate the mass attendance numbers and number of people presenting for sacraments in 2030
Outline of items that the Priest Council should considerOutline of items that the Priest Council should consider
Advice in relation to future data which could be collected to assist in ongoing analysis of situationAdvice in relation to future data which could be collected to assist in ongoing analysis of situation
2
Aims of analysis
All of our projections are based on assumptions – we also illustrate how these projections would change if we used different assumptionsAll of our projections are based on assumptions – we also illustrate how these projections would change if we used different assumptions
Data received
l In order to estimate the position in 2030, we received data for the current Priests and the recent trends in relation to mass attendance and presentation for sacraments.
l The data we received includes:
l Mass attendance census results from 2008 to 2014l Number of people presenting for sacraments between 2000 and 2014l Anecdotal information regarding future recruitment of Priests within the Archdiocesel Dates of birth of all of the current active Priests, split between Religious Order and Diocesan
Priests (note that we do not have names of any Priests as this is not relevant for our investigation)
l List of parishes within the Diocesel Information regarding the typical duties of Diocesan Priests
© 2015 Towers Watson. All rights reserved. Proprietary and Confidential. For Towers Watson and Towers Watson client use only.
3towerswatson.com
All work carried out and data received is confidential. This is essential for every piece of work we carry out for clients
Data
Understanding our assumptions
Assumptions - mass attendance
l There were some missing entries in the mass attendance data provided. In order to complete our analysis we made the following assumptions:l Where there are missing 2014 attendance figures, we have assumed the same number of mass attendees as in
2013
l Where attendance figures are missing for any year other than 2014, we have assumed that attendance in that year
is equal to the average of that in the preceding and subsequent years
l It should be noted that the records of mass attendance were mostly complete so we would not expect these
assumptions to have a material impact on the results
l While noting the above limitations in the data, we believe that they are not significant and the analysis will still provide you with a reasonable projection of the dynamics of mass attendance and Priest population
© 2015 Towers Watson. All rights reserved. Proprietary and Confidential. For Towers Watson and Towers Watson client use only.
5towerswatson.com
Understanding our assumptions
Assumptions - mass attendance
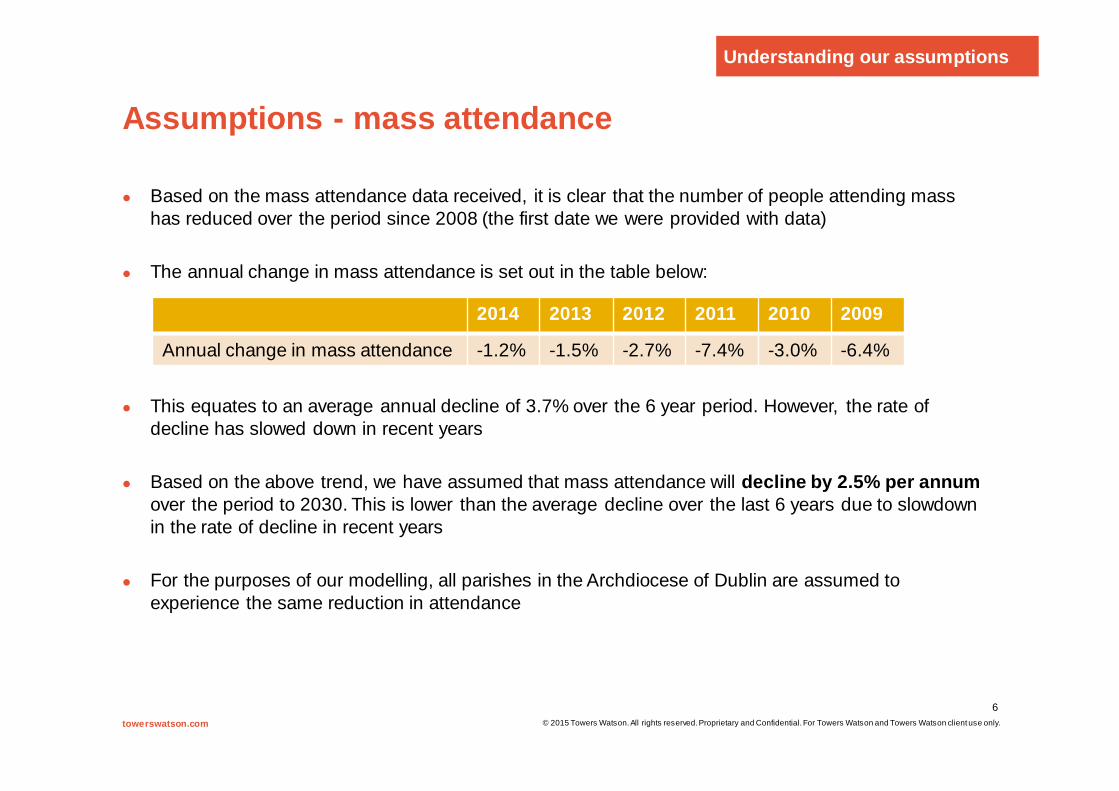
l Based on the mass attendance data received, it is clear that the number of people attending mass has reduced over the period since 2008 (the first date we were provided with data)
l The annual change in mass attendance is set out in the table below:
l This equates to an average annual decline of 3.7% over the 6 year period. However, the rate of decline has slowed down in recent years
l Based on the above trend, we have assumed that mass attendance will decline by 2.5% per annum over the period to 2030. This is lower than the average decline over the last 6 years due to slowdown in the rate of decline in recent years
l For the purposes of our modelling, all parishes in the Archdiocese of Dublin are assumed to experience the same reduction in attendance
© 2015 Towers Watson. All rights reserved. Proprietary and Confidential. For Towers Watson and Towers Watson client use only.
6towerswatson.com
2014 2013 2012 2011 2010 2009
Annual change in mass attendance -1.2% -1.5% -2.7% -7.4% -3.0% -6.4%
Understanding our assumptions
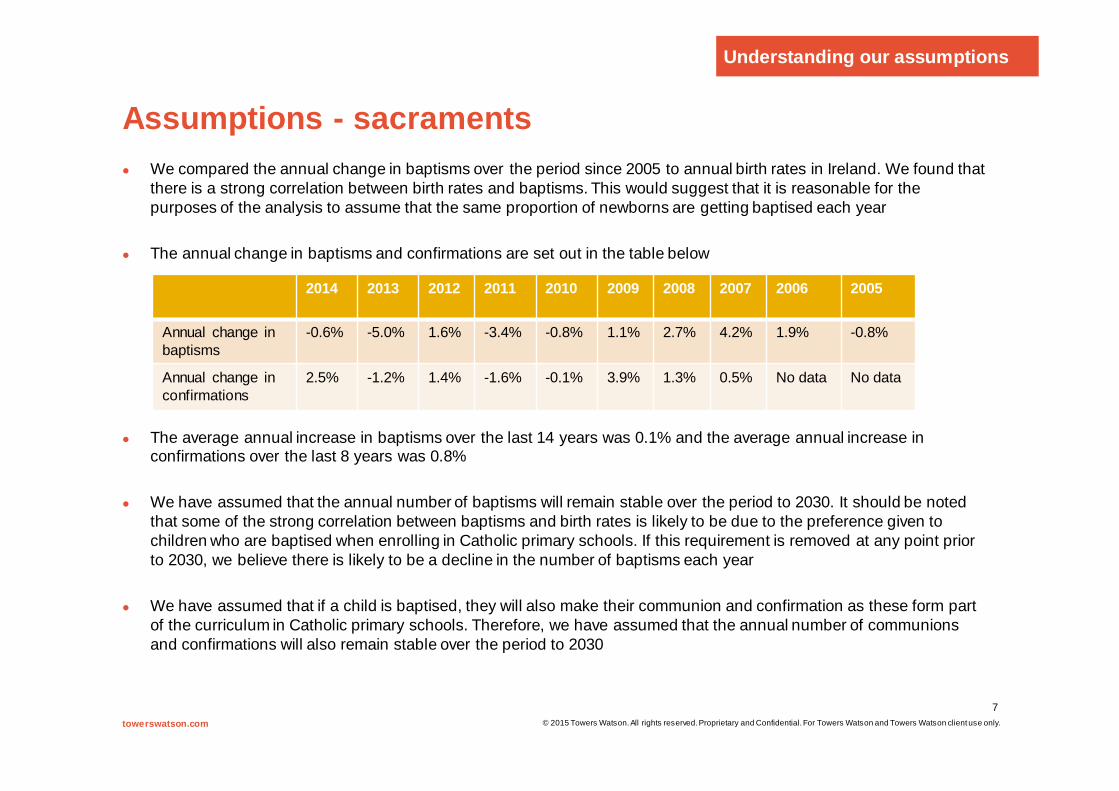
Assumptions - sacramentsl We compared the annual change in baptisms over the period since 2005 to annual birth rates in Ireland. We found that
there is a strong correlation between birth rates and baptisms. This would suggest that it is reasonable for the purposes of the analysis to assume that the same proportion of newborns are getting baptised each year
l The annual change in baptisms and confirmations are set out in the table below
l The average annual increase in baptisms over the last 14 years was 0.1% and the average annual increase in confirmations over the last 8 years was 0.8%
l We have assumed that the annual number of baptisms will remain stable over the period to 2030. It should be noted that some of the strong correlation between baptisms and birth rates is likely to be due to the preference given to children who are baptised when enrolling in Catholic primary schools. If this requirement is removed at any point prior to 2030, we believe there is likely to be a decline in the number of baptisms each year
l We have assumed that if a child is baptised, they will also make their communion and confirmation as these form part of the curriculum in Catholic primary schools. Therefore, we have assumed that the annual number of communions and confirmations will also remain stable over the period to 2030
© 2015 Towers Watson. All rights reserved. Proprietary and Confidential. For Towers Watson and Towers Watson client use only.
7towerswatson.com
2014 2013 2012 2011 2010 2009 2008 2007 2006 2005
Annual change in baptisms
-0.6% -5.0% 1.6% -3.4% -0.8% 1.1% 2.7% 4.2% 1.9% -0.8%
Annual change in confirmations
2.5% -1.2% 1.4% -1.6% -0.1% 3.9% 1.3% 0.5% No data No data
Understanding our assumptions
Assumptions - sacraments
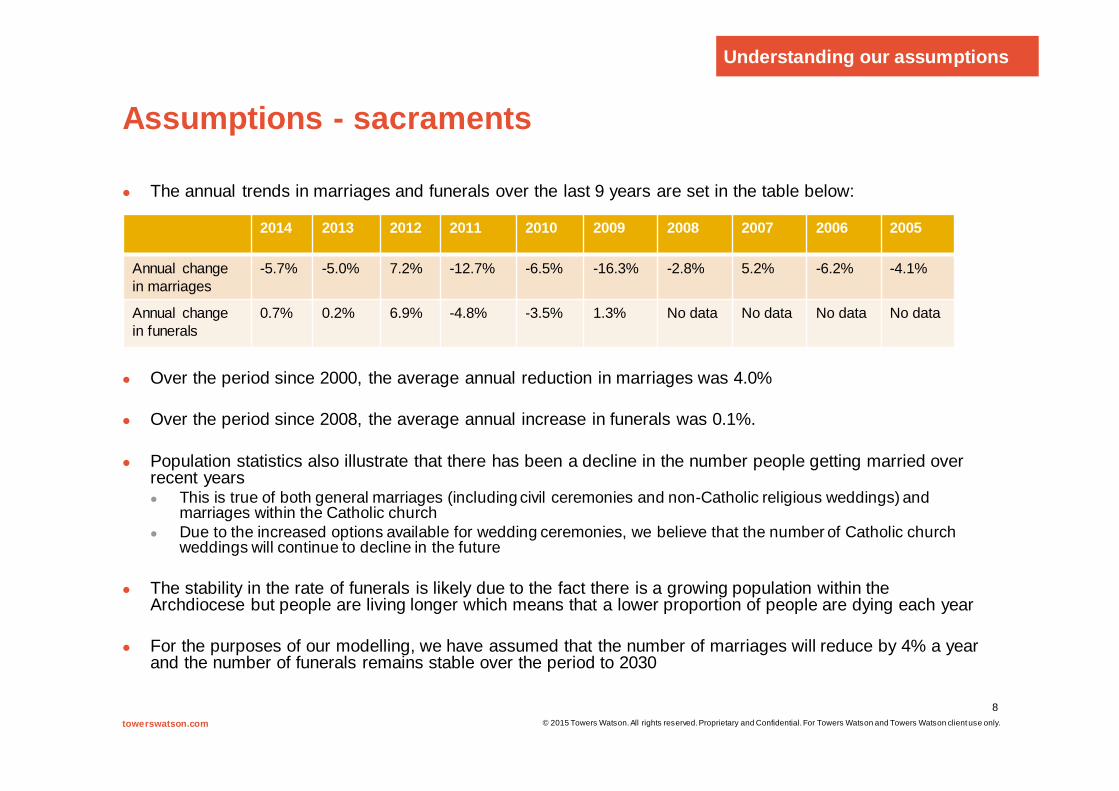
l The annual trends in marriages and funerals over the last 9 years are set in the table below:
l Over the period since 2000, the average annual reduction in marriages was 4.0%
l Over the period since 2008, the average annual increase in funerals was 0.1%.
l Population statistics also illustrate that there has been a decline in the number people getting married over recent yearsl This is true of both general marriages (including civil ceremonies and non-Catholic religious weddings) and
marriages within the Catholic churchl Due to the increased options available for wedding ceremonies, we believe that the number of Catholic church
weddings will continue to decline in the future
l The stability in the rate of funerals is likely due to the fact there is a growing population within the Archdiocese but people are living longer which means that a lower proportion of people are dying each year
l For the purposes of our modelling, we have assumed that the number of marriages will reduce by 4% a year and the number of funerals remains stable over the period to 2030
© 2015 Towers Watson. All rights reserved. Proprietary and Confidential. For Towers Watson and Towers Watson client use only.
8towerswatson.com
2014 2013 2012 2011 2010 2009 2008 2007 2006 2005
Annual change in marriages
-5.7% -5.0% 7.2% -12.7% -6.5% -16.3% -2.8% 5.2% -6.2% -4.1%
Annual change in funerals
0.7% 0.2% 6.9% -4.8% -3.5% 1.3% No data No data No data No data
Understanding our assumptions
Summary of assumptions used to project mass attendance and sacraments
© 2015 Towers Watson. All rights reserved. Proprietary and Confidential. For Towers Watson and Towers Watson client use only.
9towerswatson.com
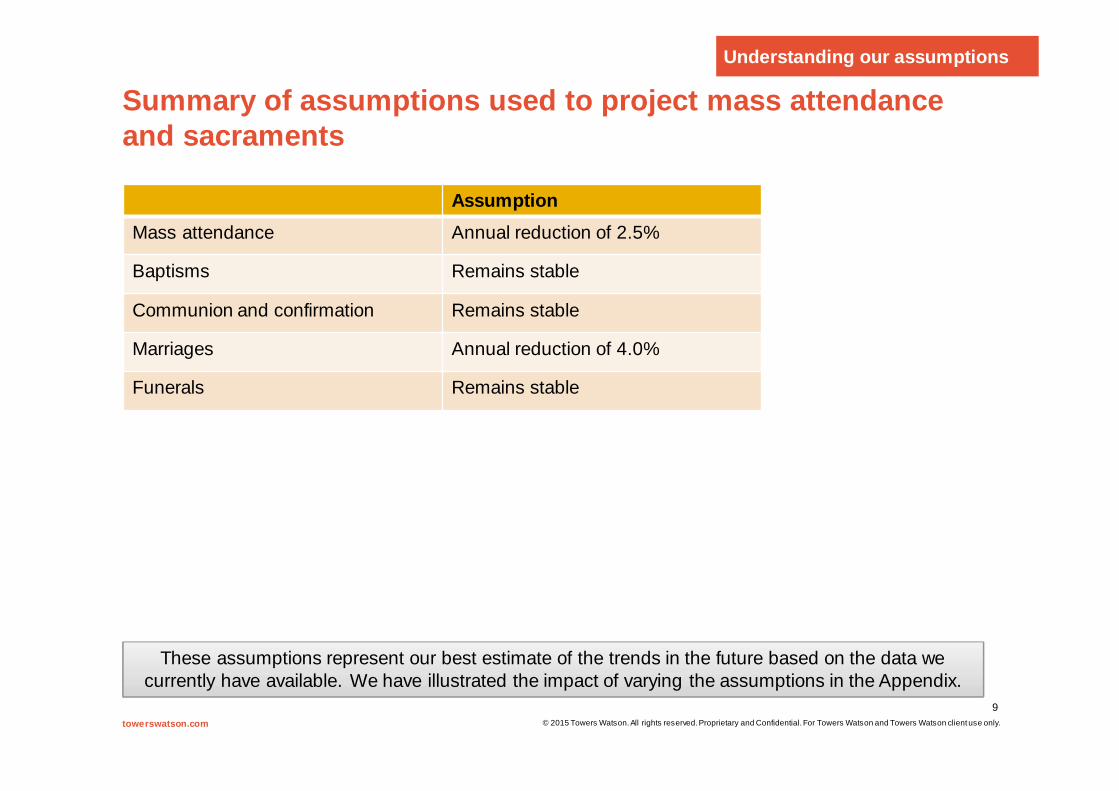
AssumptionMass attendance Annual reduction of 2.5%
Baptisms Remains stable
Communion and confirmation Remains stable
Marriages Annual reduction of 4.0%
Funerals Remains stable
These assumptions represent our best estimate of the trends in the future based on the data we currently have available. We have illustrated the impact of varying the assumptions in the Appendix.
Understanding our assumptions
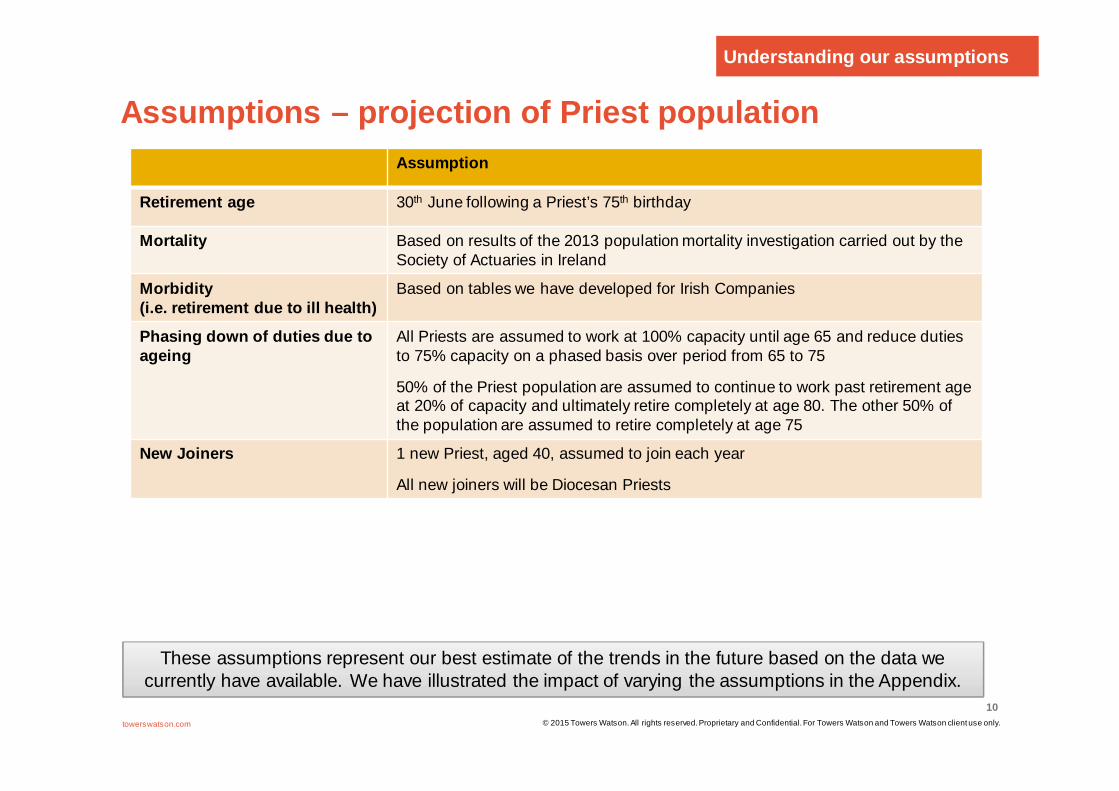
Assumptions – projection of Priest population
towerswatson.com © 2015 Towers Watson. All rights reserved. Proprietary and Confidential. For Towers Watson and Towers Watson client use only.
10
Assumption
Retirement age 30th June following a Priest’s 75th birthday
Mortality Based on results of the 2013 population mortality investigation carried out by the Society of Actuaries in Ireland
Morbidity (i.e. retirement due to ill health)
Based on tables we have developed for Irish Companies
Phasing down of duties due to ageing
All Priests are assumed to work at 100% capacity until age 65 and reduce duties to 75% capacity on a phased basis over period from 65 to 75
50% of the Priest population are assumed to continue to work past retirement age at 20% of capacity and ultimately retire completely at age 80. The other 50% of the population are assumed to retire completely at age 75
New Joiners 1 new Priest, aged 40, assumed to join each year
All new joiners will be Diocesan Priests
Understanding our assumptions
These assumptions represent our best estimate of the trends in the future based on the data we currently have available. We have illustrated the impact of varying the assumptions in the Appendix.
Sensitivity to assumptions
l The population projection outlined in this presentation is dependent on the assumptions we have made. Having examined the model, the assumptions to which the results are most sensitive to (in decreasing order) are: l Continued participation of Religious Ordersl The phasing down of Priest duties up to age 75 and in retirementl New joiners to the priesthoodl Morbidityl Mortality
l The projection of Priests’ duties is dependent on:l Future trends in mass attendancel Future trends in sacraments
l While we could look at varying all of these assumptions, we have focused on the most significant. Hence, later in the presentation, we examine the impact of varying the phasing down of Priest duties assumption and future trends in mass attendance
l Throughout the presentation, we have split the Priests between Diocesan and Religious Order which will allow you to easily analyse the impact of future non-participation of Religious Orders
l We have assumed 16 new joiners to the priesthood over the period to 2030 – given that the new joiners will all be active in 2030, you can easily calculate the impact of more or less new joiners
towerswatson.com © 2015 Towers Watson. All rights reserved. Proprietary and Confidential. For Towers Watson and Towers Watson client use only.
11The impact of using different assumptions is set out in the Appendix
Understanding our assumptions
Summary of our assumptions
l We have had to make a number of assumptions to project the position over the period to 2030 and these were described in the previous slides
l While there are some areas of data missing, we do not believe that these gaps in the data will materially impact the results of our analysis
l Now that you understand the assumptions underlying our projections, we will move on to the results of our analysis
l The sensitivity of the results to the assumptions used is set out in the Appendix
© 2015 Towers Watson. All rights reserved. Proprietary and Confidential. For Towers Watson and Towers Watson client use only.
12towerswatson.com
Understanding our assumptions
Our projections
Projection of Priest population – description of methodology
l As part of the analysis, we have used assumptions to convert each Priest to the equivalent number of Priests working at 100% capacity. For the remainder of the presentation, we have used the term “FTP” to refer to the equivalent number of Priests working at 100% capacity.l For example, if there are four Priests, two working at 100% capacity and two working at 75% capacity (due to the
impact of ageing), the population for the purposes of our analysis would be 3.5 FTPs
l During the remainder of the presentation, this is the methodology used to determine the FTPs
l There are 110 Religious Order Priests and 276 Diocesan Priests (i.e. 386 in total) under age 75 at 30 June 2014. There are also have 14 Religious Order Priests and 19 Diocesan Priests (i.e. 33 in total) between age 75 and 80
l Based on our assumptions, this means that we have a population of 369 FTPs
l This is set out in graphical format on the following slide
© 2015 Towers Watson. All rights reserved. Proprietary and Confidential. For Towers Watson and Towers Watson client use only.
14towerswatson.com
Our projections
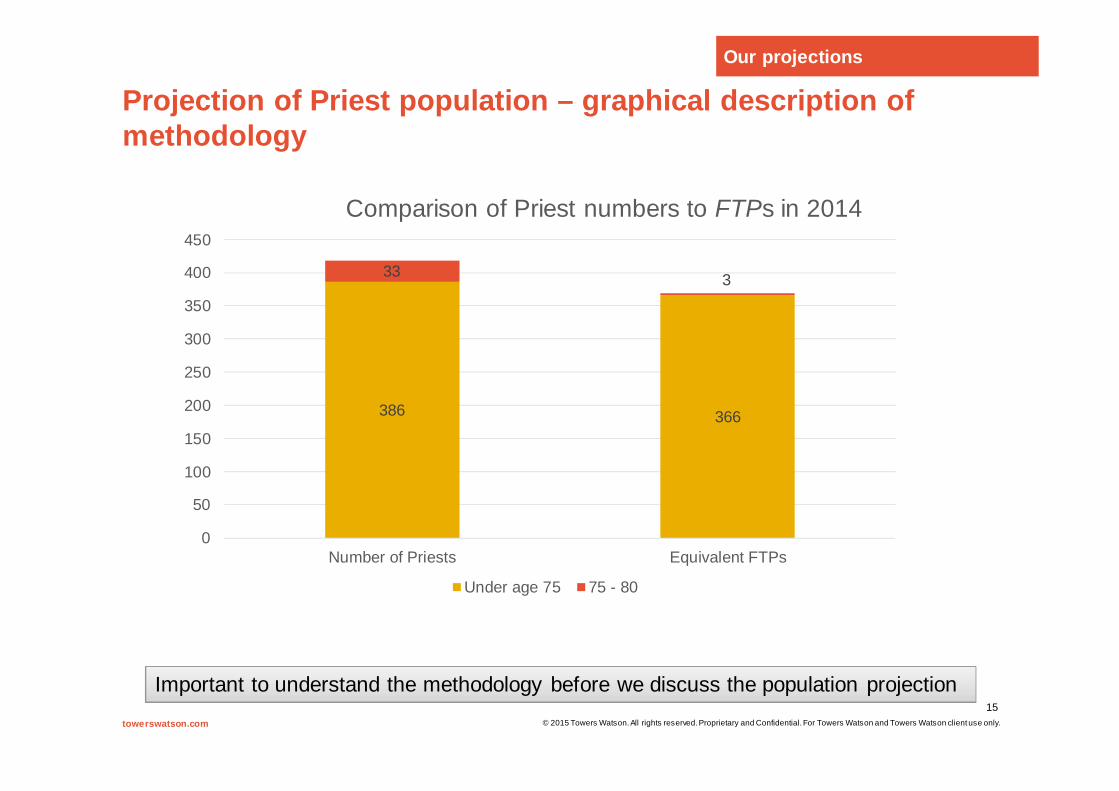
Projection of Priest population – graphical description of methodology
© 2015 Towers Watson. All rights reserved. Proprietary and Confidential. For Towers Watson and Towers Watson client use only.
15towerswatson.com
Our projections
386 366
33 3
0
50
100
150
200
250
300
350
400
450
Number of Priests Equivalent FTPs
Comparison of Priest numbers to FTPs in 2014
Under age 75 75 - 80
Important to understand the methodology before we discuss the population projection
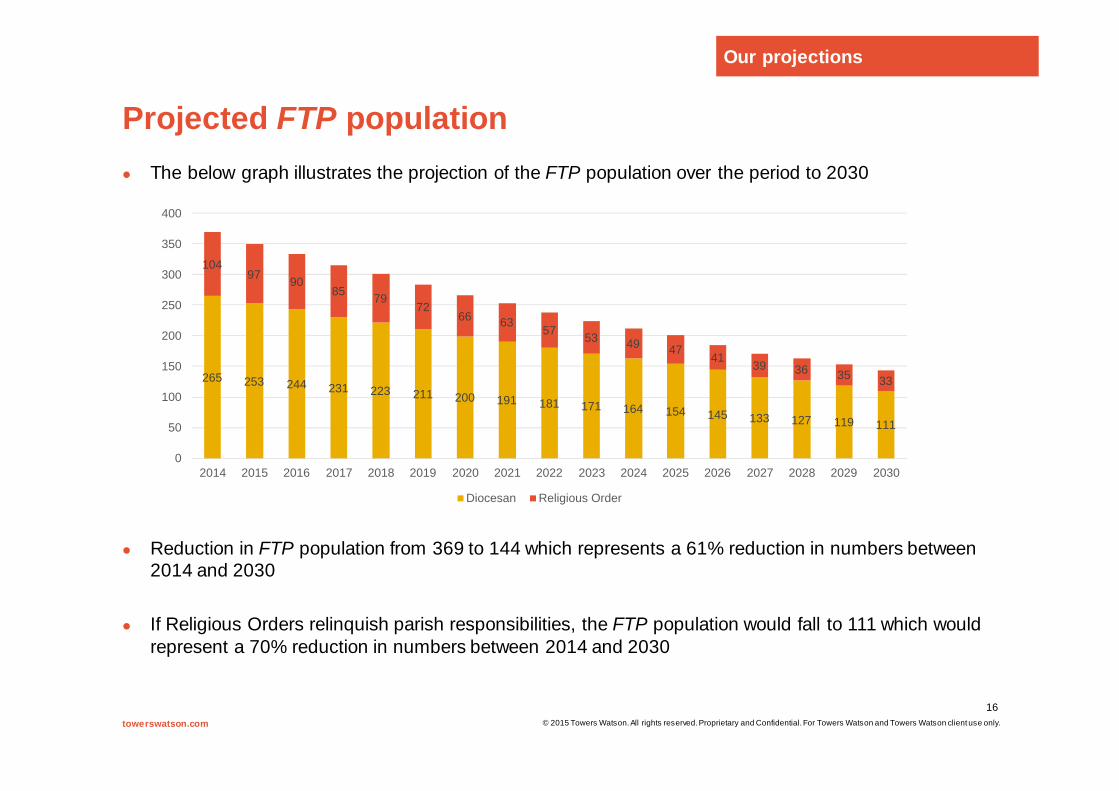
Projected FTP populationl The below graph illustrates the projection of the FTP population over the period to 2030
l Reduction in FTP population from 369 to 144 which represents a 61% reduction in numbers between 2014 and 2030
l If Religious Orders relinquish parish responsibilities, the FTP population would fall to 111 which would represent a 70% reduction in numbers between 2014 and 2030
© 2015 Towers Watson. All rights reserved. Proprietary and Confidential. For Towers Watson and Towers Watson client use only.
16towerswatson.com
265 253 244 231 223 211 200 191 181 171 164 154 145 133 127 119 111
10497 90
85 7972
66 6357 53 49 47
4139 36 35 33
0
50
100
150
200
250
300
350
400
2014 2015 2016 2017 2018 2019 2020 2021 2022 2023 2024 2025 2026 2027 2028 2029 2030
Diocesan Religious Order
Our projections
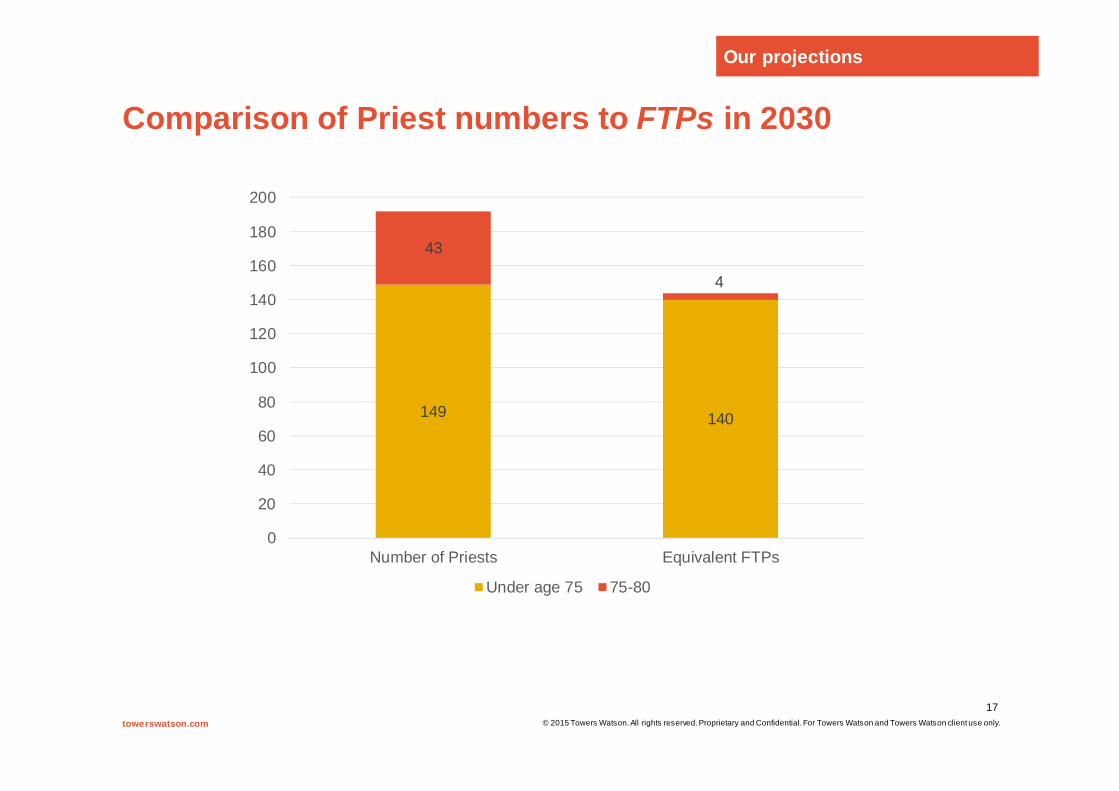
Comparison of Priest numbers to FTPs in 2030
© 2015 Towers Watson. All rights reserved. Proprietary and Confidential. For Towers Watson and Towers Watson client use only.
17towerswatson.com
Our projections
149 140
43
4
0
20
40
60
80
100
120
140
160
180
200
Number of Priests Equivalent FTPs
Under age 75 75-80

Analysis of Priests by age band
l The below graph illustrates how the age distribution of Priests is expected to change by 2030. This age distribution analysis focusses on actual number of Priests rather than the FTP population statistic that we focussed on in the previous slides
l Of the Priests who are under age 75, 57% are currently over age 60 and this is projected to increase to 75% in 2030
l This will create a strain on the younger Priests as the total number of Priests will have reduced significantly in 2030 and only 25% of the remaining Priests are under age 60
l Although it is beyond the scope of the project, this analysis shows that there will be a significant number of retirements in the years after 2030 which will put even further strain on your resources
© 2015 Towers Watson. All rights reserved. Proprietary and Confidential. For Towers Watson and Towers Watson client use only.
18towerswatson.com
As well as declining numbers, the high age profile of the remaining Priests is also a potential issue
Our projections
313
23
53
35
52 48 49
193
6
13
11
7
15 2530
14
0 5 5 7 1219
3928
34
0
0 0 35
10
10
6
9
0
10
20
30
40
50
60
70
2030 Religious
2030 Diocesan
2014 Religious
2014 Diocesan
Comparison of Diocesan and Religious Order Priest numbers
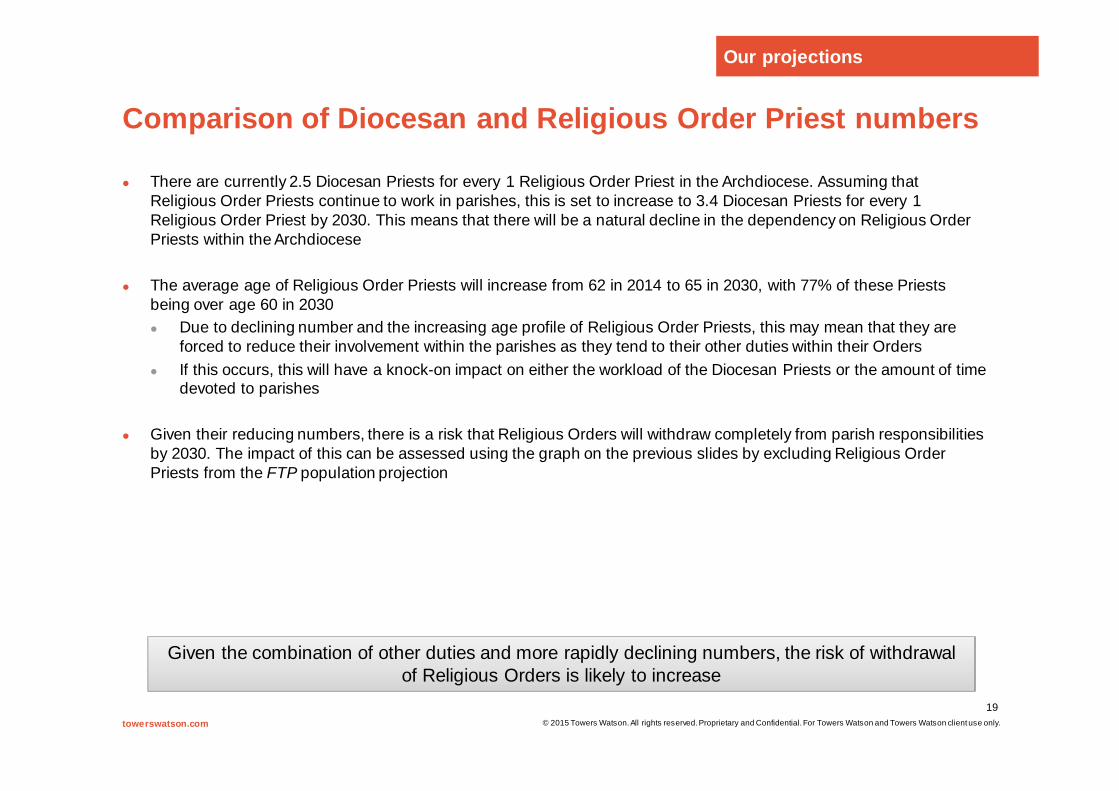
l There are currently 2.5 Diocesan Priests for every 1 Religious Order Priest in the Archdiocese. Assuming that Religious Order Priests continue to work in parishes, this is set to increase to 3.4 Diocesan Priests for every 1 Religious Order Priest by 2030. This means that there will be a natural decline in the dependency on Religious Order Priests within the Archdiocese
l The average age of Religious Order Priests will increase from 62 in 2014 to 65 in 2030, with 77% of these Priests being over age 60 in 2030l Due to declining number and the increasing age profile of Religious Order Priests, this may mean that they are
forced to reduce their involvement within the parishes as they tend to their other duties within their Ordersl If this occurs, this will have a knock-on impact on either the workload of the Diocesan Priests or the amount of time
devoted to parishes
l Given their reducing numbers, there is a risk that Religious Orders will withdraw completely from parish responsibilities by 2030. The impact of this can be assessed using the graph on the previous slides by excluding Religious Order Priests from the FTP population projection
© 2015 Towers Watson. All rights reserved. Proprietary and Confidential. For Towers Watson and Towers Watson client use only.
19towerswatson.com
Given the combination of other duties and more rapidly declining numbers, the risk of withdrawal of Religious Orders is likely to increase
Our projections
Projection of mass attendance
© 2015 Towers Watson. All rights reserved. Proprietary and Confidential. For Towers Watson and Towers Watson client use only.
20towerswatson.com
0
50000
100000
150000
200000
250000
Tota
l wee
kly
mas
s at
tend
ance
Observed
Projected
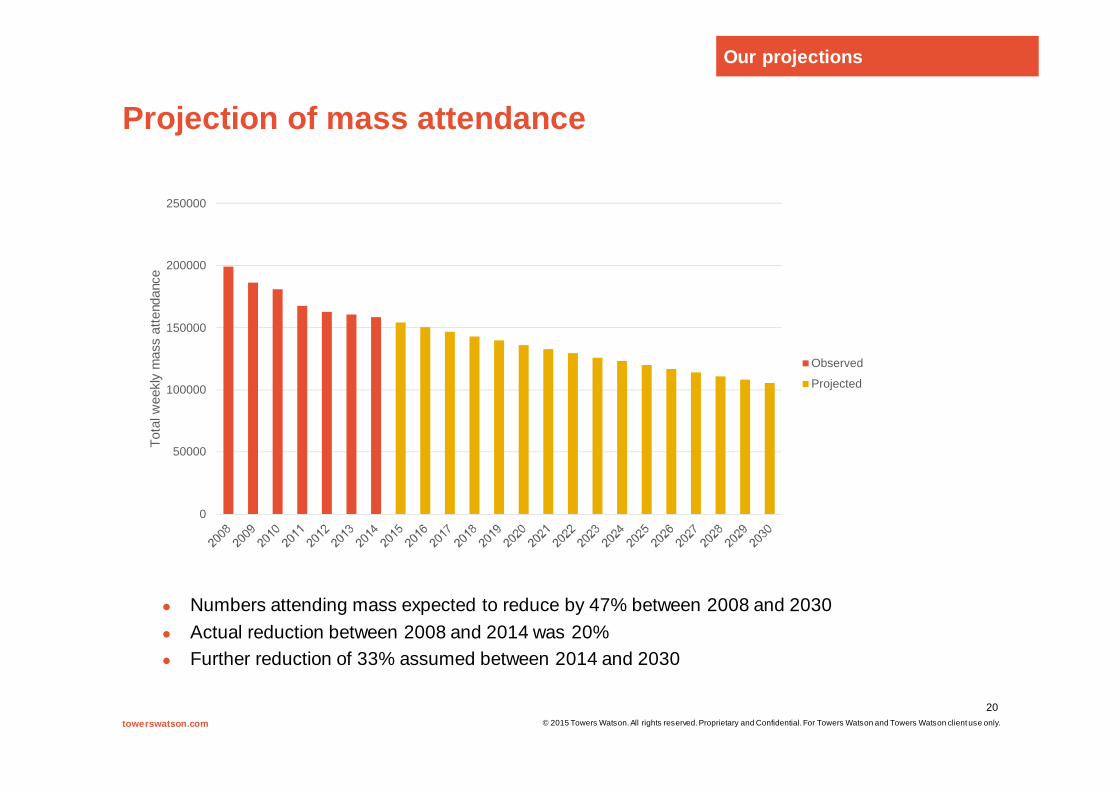
l Numbers attending mass expected to reduce by 47% between 2008 and 2030l Actual reduction between 2008 and 2014 was 20%l Further reduction of 33% assumed between 2014 and 2030
Our projections
Projection of sacraments
© 2015 Towers Watson. All rights reserved. Proprietary and Confidential. For Towers Watson and Towers Watson client use only.
21towerswatson.com
0
2,000
4,000
6,000
8,000
10,000
12,000
14,000
16,000
18,000
Baptism Communion Confirmation Weddings Funerals
Annu
al n
umbe
r of
peo
ple
rece
iving
sac
rem
ents
2014
2030
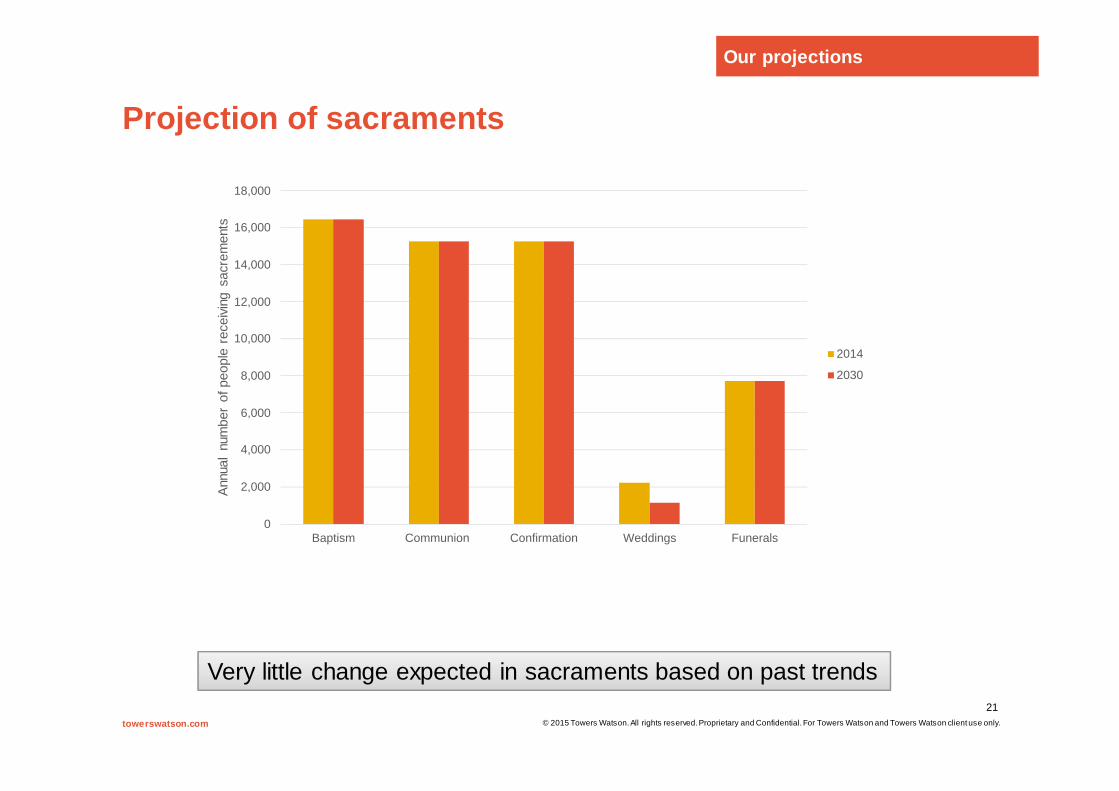
Very little change expected in sacraments based on past trends
Our projections

Headlines from projections
l Projected to be a 61% reduction in FTP population between 2014 and 2030
l This would be a 70% reduction if the Religious Orders relinquished parish responsibilities
l Increased risk of Religious Orders relinquishing responsibilities due to declining numbers and high age profile
l Age profile of Priests in 2030 will be higher than in 2014 and 75% of Priests are projected to be older than 60 which will present a further issue. This also highlights that the issue will be magnified in the years following 2030 when these Priests retire
l Mass attendance projected to decline by 33% between 2014 and 2030
towerswatson.com © 2015 Towers Watson. All rights reserved. Proprietary and Confidential. For Towers Watson and Towers Watson client use only.
22
Our projections
Analysis highlights the need to develop solutions to deal with the issues raised.Status quo extremely unlikely to be sustainable
Initial observations and conclusions
Impact of projections – key statistics
l When analysing the impact of the reduced FTP population and potential options for dealing with this issue, we have focussed on two key statistics:
1. The number of FTPs you would require to continue to provide a service to parishioners similar to what you currently provide. Comparing this required FTP population to the projected FTPpopulation allows you to identify the shortfall.
In assessing the shortfall, we have assumed that the number of masses celebrated would naturally decline in line with the reduction in mass attendance
2. The number of masses that you could celebrate in 2030 without increasing the workload on Priests
towerswatson.com © 2015 Towers Watson. All rights reserved. Proprietary and Confidential. For Towers Watson and Towers Watson client use only.
24
Initial observations and conclusions
Impact of reduced FTP population – shortfall
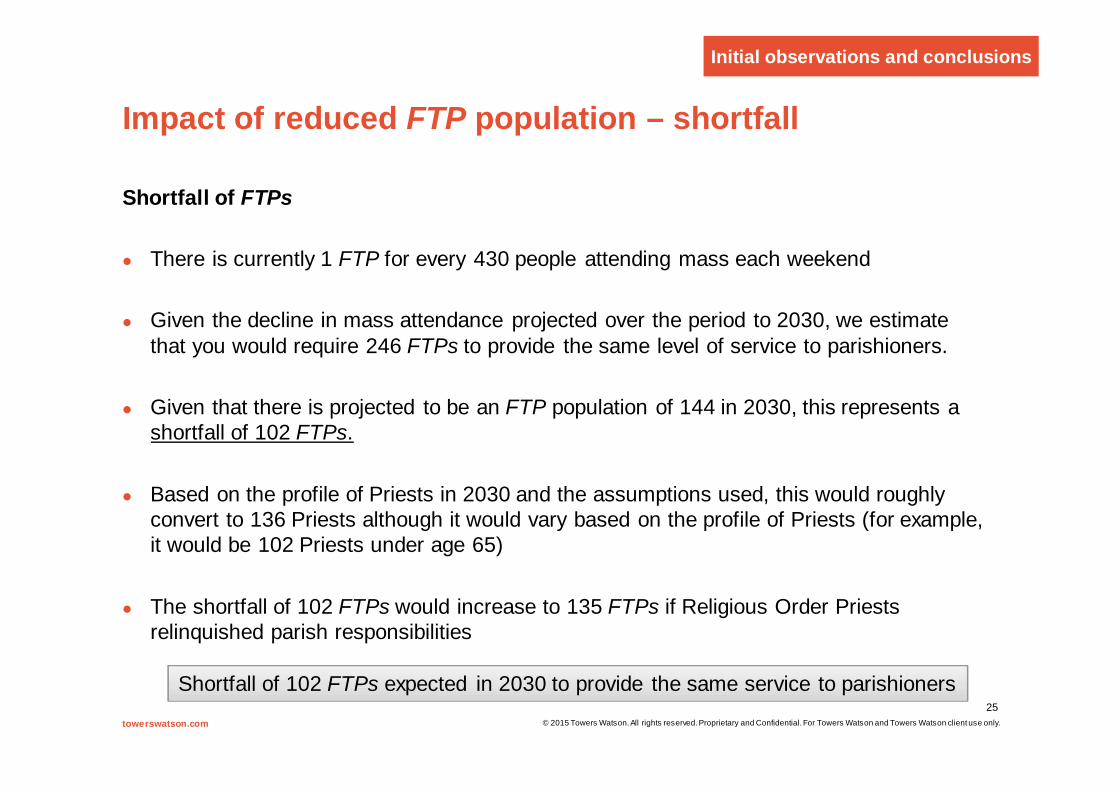
Shortfall of FTPs
l There is currently 1 FTP for every 430 people attending mass each weekend
l Given the decline in mass attendance projected over the period to 2030, we estimate that you would require 246 FTPs to provide the same level of service to parishioners.
l Given that there is projected to be an FTP population of 144 in 2030, this represents a shortfall of 102 FTPs.
l Based on the profile of Priests in 2030 and the assumptions used, this would roughly convert to 136 Priests although it would vary based on the profile of Priests (for example, it would be 102 Priests under age 65)
l The shortfall of 102 FTPs would increase to 135 FTPs if Religious Order Priests relinquished parish responsibilities
towerswatson.com © 2015 Towers Watson. All rights reserved. Proprietary and Confidential. For Towers Watson and Towers Watson client use only.
25
Initial observations and conclusions
Shortfall of 102 FTPs expected in 2030 to provide the same service to parishioners
Potential options for dealing with Priest shortfall
l Recruit new Priests, if possible:l From overseas l From other parts of the country although every Diocese is experiencing similar issues so this is unlikely
l Allocate more work to lay people allowing Priests to concentrate on liturgical tasks. This could be done in different ways:l Volunteer recruitment: This will be difficult as there is a lot of competition for volunteers from charities, sporting and
community organisations. The amount of time allocated to volunteerism has also reduced in society over recent years
l Remunerated work: Likely to be possible to recruit lay people to assist assuming that the remuneration is deemed sufficient. However, this would have a financial impact due to the cost of wages and training
l Make it increasingly attractive for Priests who are over age 75 to remain involved in some capacity. Given that Priests retire on 30th June, you could potentially invest time with upcoming retirees during the first half of the year to encourage them to have a continuing role
towerswatson.com © 2015 Towers Watson. All rights reserved. Proprietary and Confidential. For Towers Watson and Towers Watson client use only.
26
Initial observations and conclusions
Impact of reduced FTP population – masses celebrated
l During 2014, there were 836 masses celebrated on the census weekend. We assume that this represents a typical weekend
l Currently, each FTP celebrates an average of 2.3 masses per weekend
l Given the reduction in FTPs in 2030, this would mean that 331 masses would be celebrated each weekend without increasing the workload of FTPs
l It could be argued that the number of masses should be lower than this as there are projected to be 55,873 sacrament celebrations in 2030 (versus 56,936 in 2014) and these sacraments will be presented by a reduced number of FTPs. Hence, they will have less time to celebrate masses
towerswatson.com © 2015 Towers Watson. All rights reserved. Proprietary and Confidential. For Towers Watson and Towers Watson client use only.
27
Initial observations and conclusions
Number of masses would need to reduce from 836 to 331 to avoid increasing workload
Potential options for reduction in number of masses
l If you are to celebrate 331 masses every week, we estimate that there would be an average of 319 people attending each mass in 2030. Given the capacity of your churches is quite high, this is a valid option for consideration
l There are a number of ways you can reduce your masses and you will need to give this further consideration. Some of the ways this could potentially be achieved are:
l Reduce the number of weekly masses within each parish while maintaining each parish. Given that a number of your parishes are in close proximity, mass times could then be co-ordinated between neighbouring parishes so that the congregation has additional options. In reducing the masses, you could also encourage your congregation to attend neighbouring parishes masses on certain weekends if the times are more suitable. Although these changes will be met with initial opposition by your parishioners, they are likely to get used to the new times and appreciate the rationale. We don’t believe that it will result in a material loss of numbers as people that want to attend mass will make arrangements to do so
l Amalgamate parishes – this would allow you to retain a greater number of masses in the parishes which have better mass attendance while merging other parishes into these parishes. Financial analysis is beyond the scope of this project but it would also have financial advantages as it will avoid the need to maintain as many churches and there may also be opportunities to sell or lease some churches
towerswatson.com © 2015 Towers Watson. All rights reserved. Proprietary and Confidential. For Towers Watson and Towers Watson client use only.
28
Initial observations and conclusions
Potential options for reduction in number of masses (2)
l If you are to reduce the number of masses rather than combine parishes, you could also combine parishes for communions and confirmations
l The analysis only focusses on weekend masses as we do not have data in respect of weekday masses. You will also need to consider options for reducing the number of weekday masses and this is only likely to be possible by combining parishes for the purposes of weekday masses – the parishes could remain separate for weekend masses
l The optimal solution is probably a combination of reduced masses and combined parishes and you will need to discuss this as a group to determine the appropriate balance
towerswatson.com © 2015 Towers Watson. All rights reserved. Proprietary and Confidential. For Towers Watson and Towers Watson client use only.
29
Initial observations and conclusions

Summary of initial observations
l In order to provide a similar service to parishioners, you are projected to need an additional 102 FTPsin 2030 or an additional 135 FTPs if Religious Orders relinquish parish responsibilities
l Potential options to recruit additional numbers include recruitment from abroad and within Ireland, volunteer recruitment, remunerated roles and making it increasingly attractive for Priests over age 75 to remain involved
l Based on the projected FTP population, the number of masses will need to reduce from 836 to 331 if you are to avoid increasing the current Priest workload
l Potential options for reducing masses include reducing the number of masses in each parish and merging parishes
towerswatson.com © 2015 Towers Watson. All rights reserved. Proprietary and Confidential. For Towers Watson and Towers Watson client use only.
30
Initial observations and conclusions
Analysis highlights the need to develop solutions to deal with the issues raised.Status quo extremely unlikely to be sustainable
Next steps
Next steps
l Priests Council to discuss this report in detail and understand the results of the analysis
l Priests Council to ensure they understand the sensitivities of the analysis to the assumptions used
l Priests Council to assess the options they wish to pursue to deal with the issues identified
l Once this process has advanced, you may wish to look at:l Carrying out a financial analysis to determine the implications of various options l Carry out further analysis to determine the results based on alternative assumptions
l Suggest re-running the projections in 3 years with refined assumptions (based on experience and additional data collected) to assess progress versus expected and the likely future projection given experience since the last review. Given that the projection model and process have been set up, subsequent reviews are easier to carry out
l Collect additional data to assist in ongoing analysis of the evolving position – suggestions for additional data is set out on the following slide
l Continue to consider options in light of the evolving conditions
towerswatson.com © 2015 Towers Watson. All rights reserved. Proprietary and Confidential. For Towers Watson and Towers Watson client use only.
32
Next Steps
Future areas of data collection
l We suggest that you collect additional areas of data which will allow you to refine any analysis you do in the future. The areas we suggest that you consider are:
l More regular mass attendance census– Use a regular weekend (i.e. not a bank holiday or Church holiday)– Different times of the year (e.g. summer, winter)– Recommend at least 3 times a year to get a more complete picture – collecting data more often will allow you to get a
more accurate picture of the trends in mass attendance. However, it is a big exercise to collect this data so there is a balance to be struck between imposing additional work on Priests and accuracy of data. We suggest that collecting this data 3-4 times a year represents a good balance.
– Recommend that completion of the census is mandatory to avoid making assumptions in relation to mass attendance where data is not returned
– Carry out a mass attendance census in relation to weekday masses to obtain further information in relation to trends
l Data in relation to recruitment of Priests– Collect all data in relation to Ordination of Priests– Collect all data in relation to Priests recruited from overseas and the term they remain in Ireland
l Data in relation to Religious Orders– Document instances of a Religious Order relinquishing parish duties– Document instances of a Religious Order taking on parish duties
l Continue to maintain an accurate database in relation to sacraments
l Collect financial data from each parish, both income and expenditure, as this will help you to carry out a more accurate analysis of the financial position in the future should you wish to analyse it
l Collect data in relation to the state of repair in each church and an estimate of the financial outlay that may be required to repair existing issues. This may assist you in determining which parishes to merge into other parishes
towerswatson.com © 2015 Towers Watson. All rights reserved. Proprietary and Confidential. For Towers Watson and Towers Watson client use only.
33
Next Steps
Limitations of Reliance
l The information in this pack will have been supplemented by matters arising from any oral presentation by us, and should be considered in the light of this additional information. No responsibility is accepted by us for any consequences arising from any third party relying on this report or any advice relating to its contents.
l Towers Watson (Ireland) Limited is regulated by the Central Bank of Ireland
l If you require any further information or explanations, or specific advice, please contact Conor O’Donovan of Towers Watson
34
Appendix – understanding the sensitivity to assumptions
Sensitivity analysis – FTP population projection
l In order to help you understand the sensitivity of the future FTP population to our assumptions, we have illustrated the impact of varying the assumptions.
l In the projection of FTP population for this analysis, all assumptions are unchanged with the exception of the assumption relating to the phasing down of Priest duties.
l Best estimate assumption used in analysis: 100% capacity until age 65 and reduce duties to 75% capacity on a phased basis over period from 65 to 75. 50% continue to work past retirement age at 20% of capacity and ultimately retire completely at age 80. The other 50% of the population are assumed to retire completely at age 75
l Scenario 1: 100% capacity to age 7560% continue to work past retirement age at 20% of capacity and ultimately retire completely at age 80. The other 40% of the population are assumed to retire completely at age 75
l Scenario 2: 100% capacity until age 65 and reduce duties to 60% capacity on a phased basis over period from 65 to 75 No Priests continue to work past age 75
towerswatson.com © 2015 Towers Watson. All rights reserved. Proprietary and Confidential. For Towers Watson and Towers Watson client use only.
36
Understanding the sensitivity to assumptions
Sensitivity analysis – mass attendance and sacraments
l In order to help you understand the sensitivity of future mass attendance to our assumptions, we have illustrated the impact of varying the assumptions.
l In the projection of mass attendance for the purposes of this analysis, we have used the following assumptions:
l Best estimate assumption used in analysis: Mass attendance assumed to reduce by 2.5% each year
l Scenario 3: Mass attendance assumed to reduce by 0.5% each year
l Scenario 4: Mass attendance assumed to reduce by 4.5% each year
towerswatson.com © 2015 Towers Watson. All rights reserved. Proprietary and Confidential. For Towers Watson and Towers Watson client use only.
37
Understanding the sensitivity to assumptions
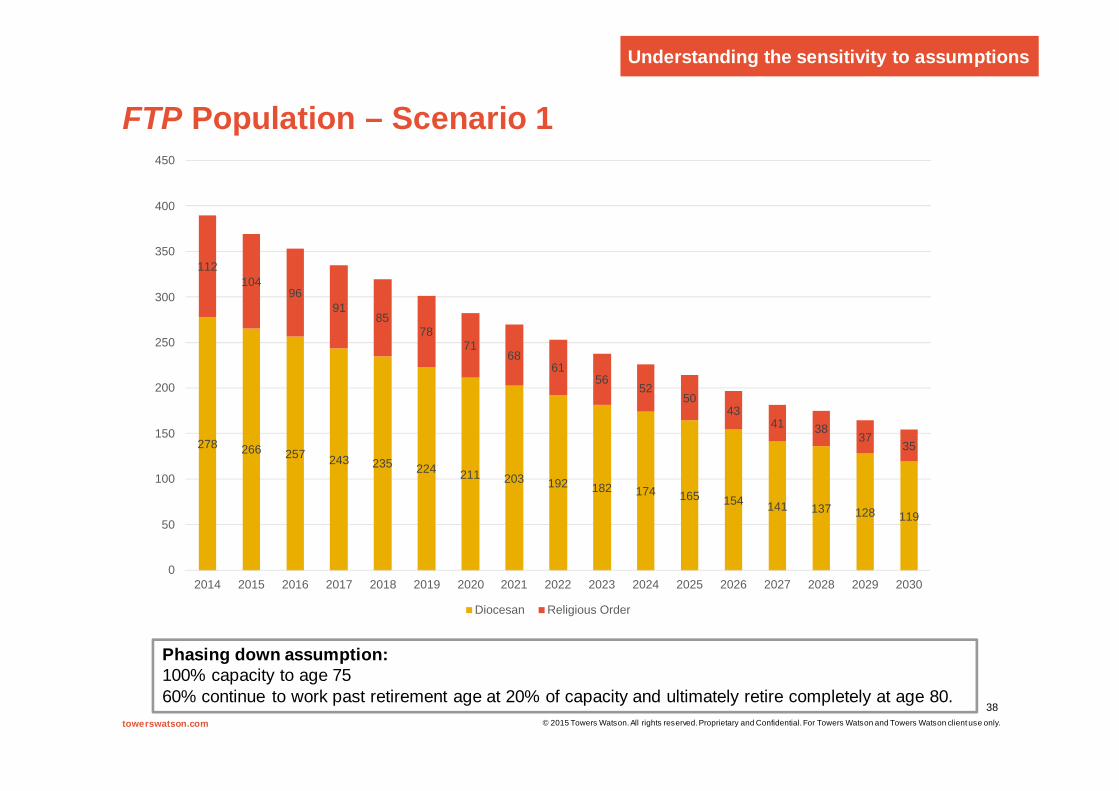
FTP Population – Scenario 1
© 2015 Towers Watson. All rights reserved. Proprietary and Confidential. For Towers Watson and Towers Watson client use only.
38towerswatson.com
278 266 257 243 235 224 211 203 192 182 174 165 154 141 137 128 119
112104
9691
8578
7168
6156
5250
4341 38
3735
0
50
100
150
200
250
300
350
400
450
2014 2015 2016 2017 2018 2019 2020 2021 2022 2023 2024 2025 2026 2027 2028 2029 2030
Diocesan Religious Order
Understanding the sensitivity to assumptions
Phasing down assumption:100% capacity to age 7560% continue to work past retirement age at 20% of capacity and ultimately retire completely at age 80.
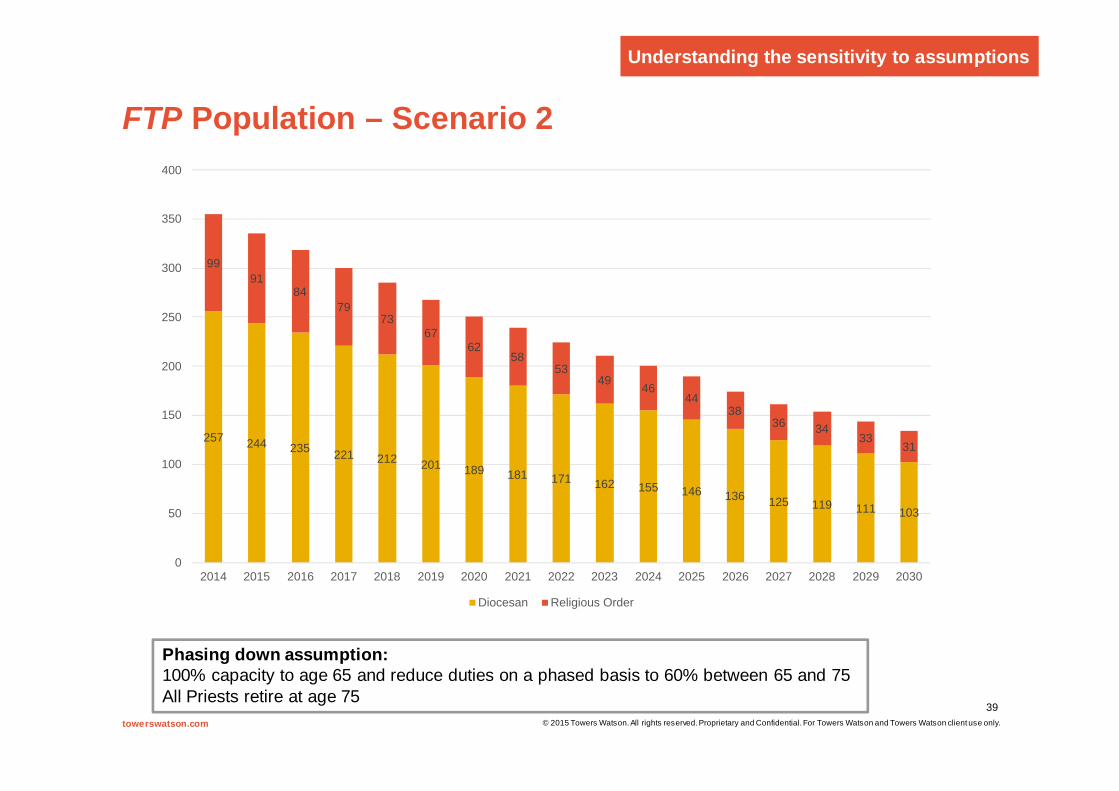
FTP Population – Scenario 2
© 2015 Towers Watson. All rights reserved. Proprietary and Confidential. For Towers Watson and Towers Watson client use only.
39towerswatson.com
257 244 235 221 212 201 189 181 171 162 155 146 136 125 119 111 103
9991
8479
7367
6258
5349
4644
3836 34
3331
0
50
100
150
200
250
300
350
400
2014 2015 2016 2017 2018 2019 2020 2021 2022 2023 2024 2025 2026 2027 2028 2029 2030
Diocesan Religious Order
Understanding the sensitivity to assumptions
Phasing down assumption:100% capacity to age 65 and reduce duties on a phased basis to 60% between 65 and 75All Priests retire at age 75
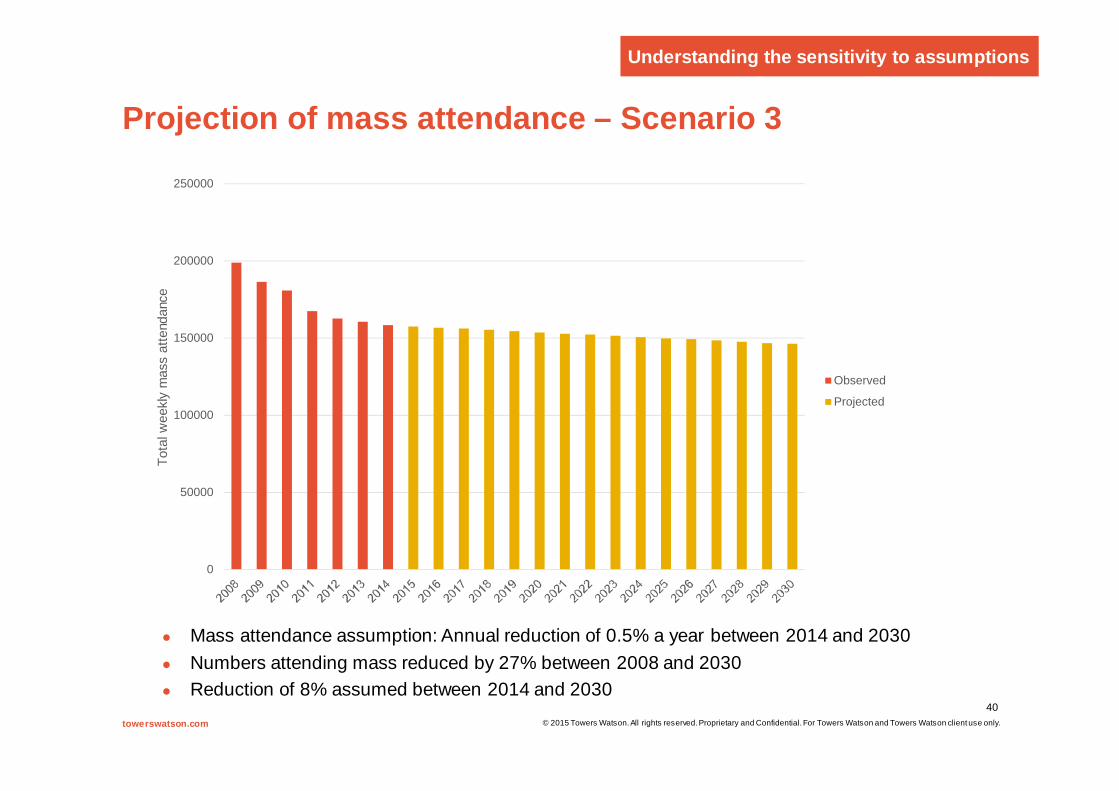
Projection of mass attendance – Scenario 3
© 2015 Towers Watson. All rights reserved. Proprietary and Confidential. For Towers Watson and Towers Watson client use only.
40towerswatson.com
0
50000
100000
150000
200000
250000
Tota
l wee
kly
mas
s at
tend
ance
Observed
Projected
l Mass attendance assumption: Annual reduction of 0.5% a year between 2014 and 2030l Numbers attending mass reduced by 27% between 2008 and 2030l Reduction of 8% assumed between 2014 and 2030
Understanding the sensitivity to assumptions
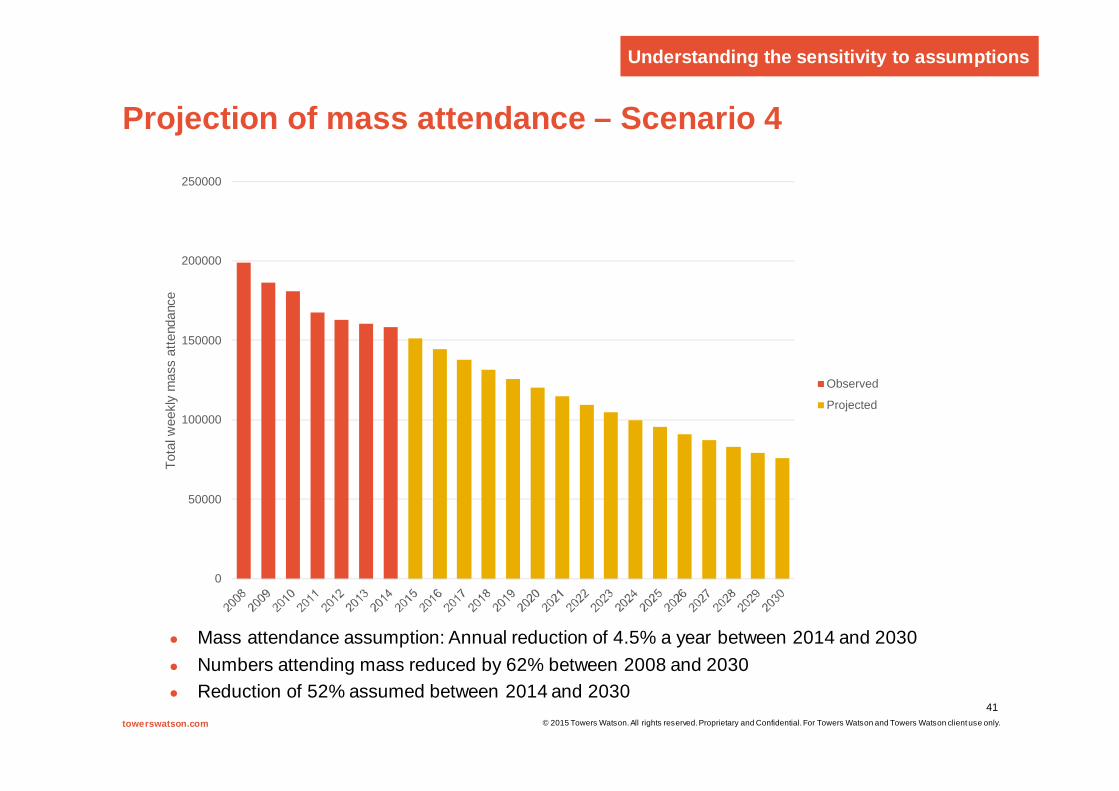
Projection of mass attendance – Scenario 4
© 2015 Towers Watson. All rights reserved. Proprietary and Confidential. For Towers Watson and Towers Watson client use only.
41towerswatson.com
l Mass attendance assumption: Annual reduction of 4.5% a year between 2014 and 2030l Numbers attending mass reduced by 62% between 2008 and 2030l Reduction of 52% assumed between 2014 and 2030
0
50000
100000
150000
200000
250000To
tal w
eekl
y m
ass
atte
ndan
ce
Observed
Projected
Understanding the sensitivity to assumptions

Sensitivity analysis – key statistics
Priest shortfall
l Best estimate analysis: shortfall of 102 FTPs in 2030 and 135 if Religious Order Priests relinquished parish responsibilities
l Scenario 1: shortfall of 92 FTPs in 2030 and 127 if Religious Order Priests relinquished parish responsibilities
l Scenario 2: shortfall of 112 FTPs in 2030 and 143 if Religious Order Priests relinquished parish responsibilities
Number of masses you are able to celebrate
l Best estimate analysis: 331 masses celebrated in 2030 with 319 attendees at each massl Scenario 3: 331 masses celebrated in 2030 with 441 attendees at each massl Scenario 4: 331 masses celebrated in 2030 with 229 attendees at each mass
towerswatson.com © 2015 Towers Watson. All rights reserved. Proprietary and Confidential. For Towers Watson and Towers Watson client use only.
42
Understanding the sensitivity to assumptions


