Important disclosures, including any required research certifications, are provided on the last two pages of this report. Share Price Chart Source: Compiled by Daiwa. Market data 12-month range (Y) 2,030-3,550 Market cap (Y mn; 5 Sep) 47,832 Shares outstanding (000; 9/16) 15,917 Foreign ownership (%; 12/15) 21.2 Investment Indicators 12/15 12/16 E 12/17 E P/E (X) 26.7 24.4 20.4 EV/EBITDA (X) 12.7 11.0 9.2 P/B (X) 3.80 3.37 2.97 Dividend yield (%) 0.67 0.83 1.00 ROE (%) 15.1 14.6 15.5 Net debt/equity (X) -0.5 -0.4 -0.4 Income Summary (Y mn) 12/15 12/16 E 12/17 E Sales 20,942 23,700 26,600 Op profit 2,923 3,390 4,020 Rec profit 2,985 3,430 4,060 Net income 1,792 1,960 2,350 EPS (Y) 112.6 123.1 147.6 DPS (Y) 20.00 25.00 30.00 See end of report for notes concerning indicators. Arcland Service Holdings (3085) Target price: Y3,700 Share price (5 Sep): Y3,005 | Up/downside: +23.1% Restaurant operator undergoing significant changes Operates Katsuya restaurant chain Rollout of Karayama to accelerate as second major brand Coverage initiated with 2 (Outperform) rating What's new: We initiate coverage on Arcland Service Holdings with a 2 (Outperform) rating. Company overview: Arcland Service Holdings is mainly engaged in the operation of the Katsuya chain of tonkatsu (pork cutlet) and katsudon (pork cutlet rice bowl) restaurants. As of 1H FY16 (year ending Dec 2016), the firm had a total of 405 locations (139 directly managed, 266 franchise). Katsuya has an average monthly revenue of roughly Y8mn and an average ticket price of around Y750. Its strengths include the high efficiency of store operations and relatively stable same-store sales. We think the following points warrant attention: (1) prospects for accelerating new store openings, with Karayama, a karaage (fried chicken) restaurant chain firmly positioned as the firm’s second major brand after Katsuya, (2) potential for sustained same-store sales growth (unfavorable weather brought same-store sales into negative territory in August), and (3) the firm’s increasing willingness to expand operations in order to achieve its revenue target of Y100.0bn in 2025. We expect the firm to gradually expand the Karayama chain, opening 12 new locations in FY16, 24 in FY17, and 40 in FY18. Outlook: We estimate operating profit at Y3.39bn (company projection Y3.25bn) for FY16, Y4.02bn for FY17, and Y4.94bn for FY18. We expect profit to exceed the company’s projection in FY16, driven by higher-than- expected same-store sales. We expect earnings growth to continue thereafter, driven by the expansion of both the Katsuya and Karayama chains. What we recommend: We initiate coverage on Arcland Service Holdings with a 2 (Outperform) rating and a six- to 12-month target price of Y3,700. To derive the target price, we applied a P/E of 30X, or the peak current-FY multiple, to our FY16 EPS estimate of Y123.1. We believe that such a high P/E valuation is justified given (1) prospects for the firm accelerating the rollout of new stores with Karayama solidly positioned as the second major brand after Katsuya, and (2) the firm’s increasing willingness to expand its operations, following the shift to a holding company structure in July 2016. Japan Retail trade 6 September 2016 Japanese report: 6 September 2016 Outperform (new) Satoshi Sakae 81-3-5555-7139 [email protected]
Transcript
Important disclosures, including any required research certifications, are provided on the last two pages of this report.
Share Price Chart
Source: Compiled by Daiwa.
Market data
12-month range (Y) 2,030-3,550
Market cap (Y mn; 5 Sep) 47,832
Shares outstanding (000; 9/16) 15,917
Foreign ownership (%; 12/15) 21.2
Investment Indicators
12/15 12/16 E 12/17 E
P/E (X) 26.7 24.4 20.4
EV/EBITDA (X) 12.7 11.0 9.2
P/B (X) 3.80 3.37 2.97
Dividend yield (%) 0.67 0.83 1.00
ROE (%) 15.1 14.6 15.5
Net debt/equity (X) -0.5 -0.4 -0.4
Income Summary
(Y mn) 12/15 12/16 E 12/17 E
Sales 20,942 23,700 26,600
Op profit 2,923 3,390 4,020
Rec profit 2,985 3,430 4,060
Net income 1,792 1,960 2,350
EPS (Y) 112.6 123.1 147.6
DPS (Y) 20.00 25.00 30.00
See end of report for notes concerning indicators.
Rollout of Karayama to accelerate as second major brand
Coverage initiated with 2 (Outperform) rating
What's new: We initiate coverage on Arcland Service Holdings with a
2 (Outperform) rating.
Company overview: Arcland Service Holdings is mainly engaged in
the operation of the Katsuya chain of tonkatsu (pork cutlet) and
katsudon (pork cutlet rice bowl) restaurants. As of 1H FY16 (year
ending Dec 2016), the firm had a total of 405 locations (139 directly
managed, 266 franchise). Katsuya has an average monthly revenue of
roughly Y8mn and an average ticket price of around Y750. Its strengths
include the high efficiency of store operations and relatively stable
same-store sales.
We think the following points warrant attention: (1) prospects for
accelerating new store openings, with Karayama, a karaage (fried
chicken) restaurant chain firmly positioned as the firm’s second major
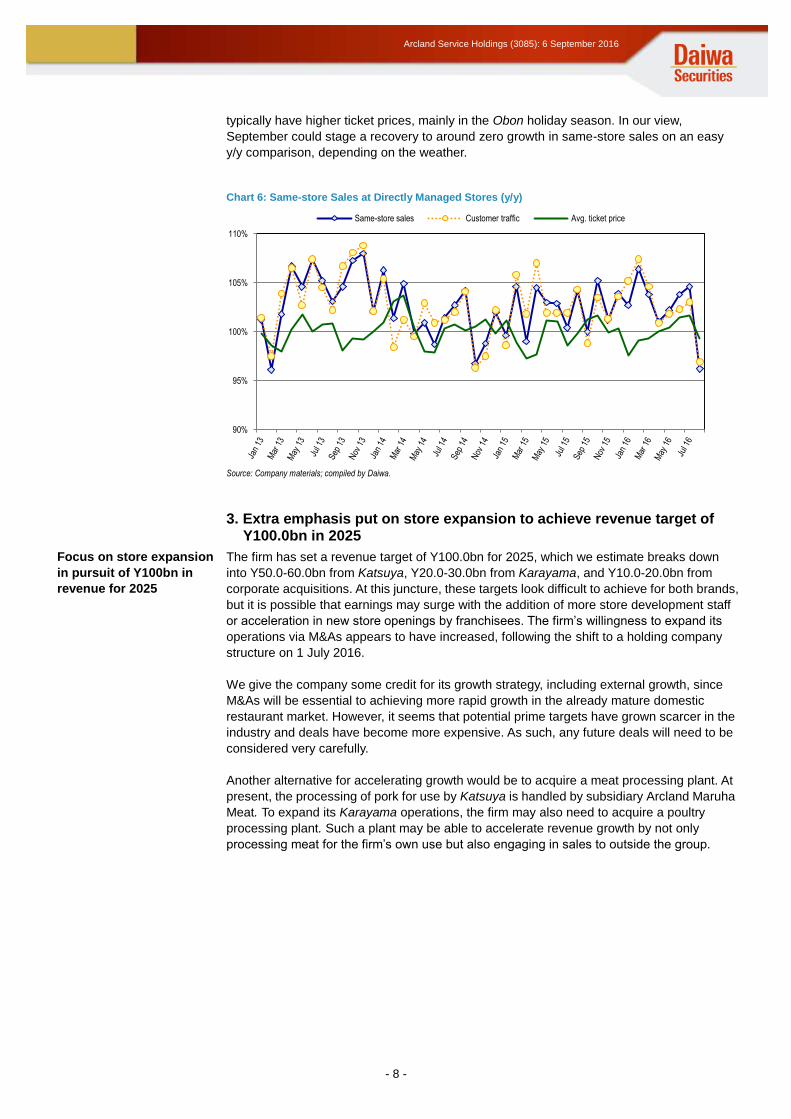
brand after Katsuya, (2) potential for sustained same-store sales
growth (unfavorable weather brought same-store sales into negative
territory in August), and (3) the firm’s increasing willingness to expand
operations in order to achieve its revenue target of Y100.0bn in 2025.
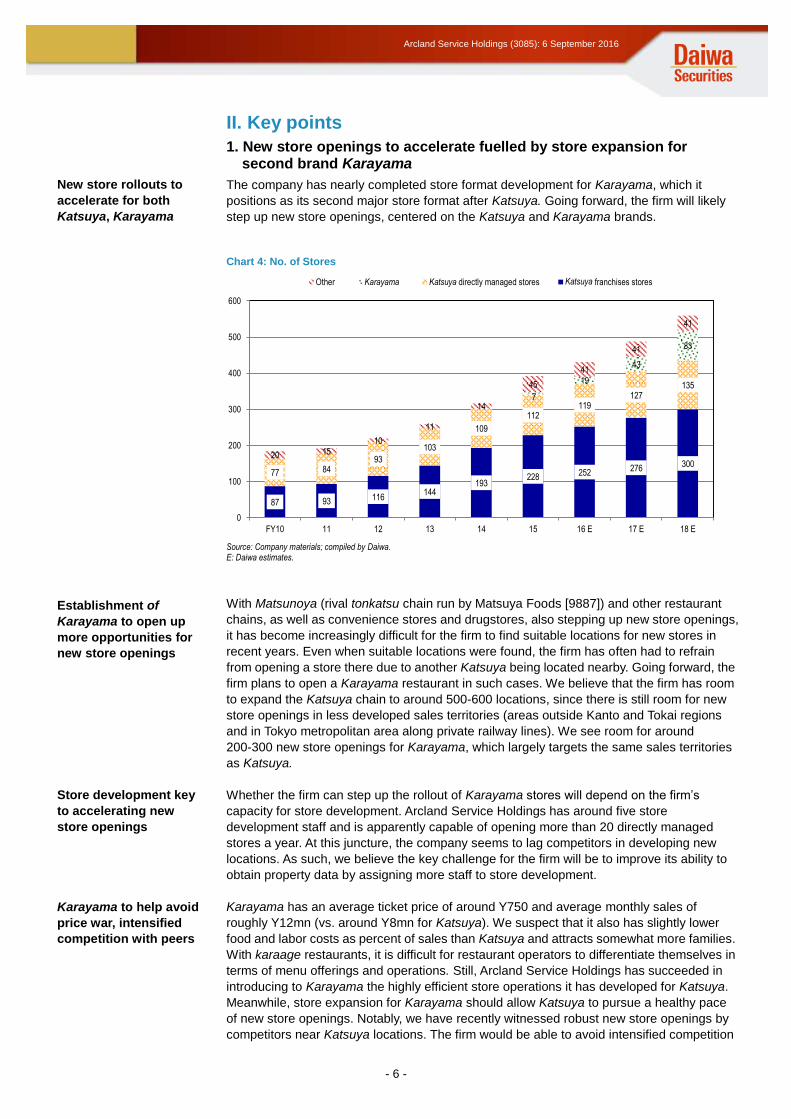
We expect the firm to gradually expand the Karayama chain, opening 12
new locations in FY16, 24 in FY17, and 40 in FY18.
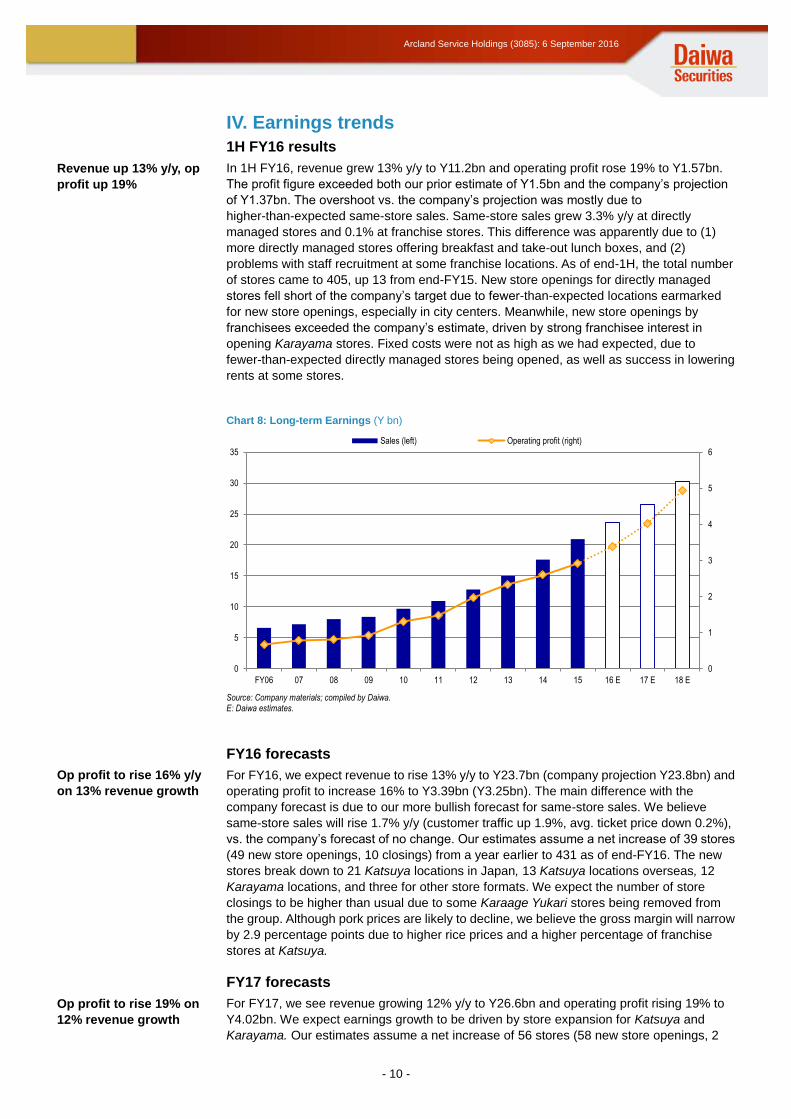
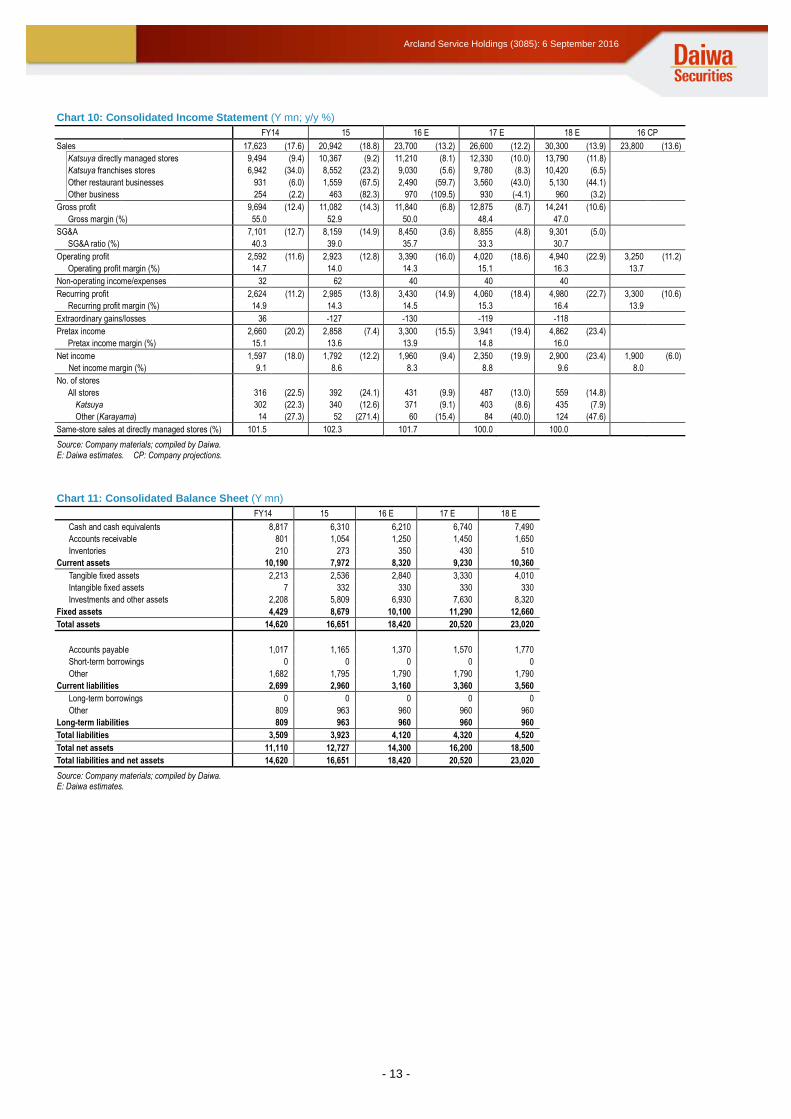
Outlook: We estimate operating profit at Y3.39bn (company projection
Y3.25bn) for FY16, Y4.02bn for FY17, and Y4.94bn for FY18. We expect
profit to exceed the company’s projection in FY16, driven by higher-than-
expected same-store sales. We expect earnings growth to continue
thereafter, driven by the expansion of both the Katsuya and Karayama
chains.
What we recommend: We initiate coverage on Arcland Service Holdings with a 2 (Outperform) rating and a six- to 12-month target price of Y3,700.
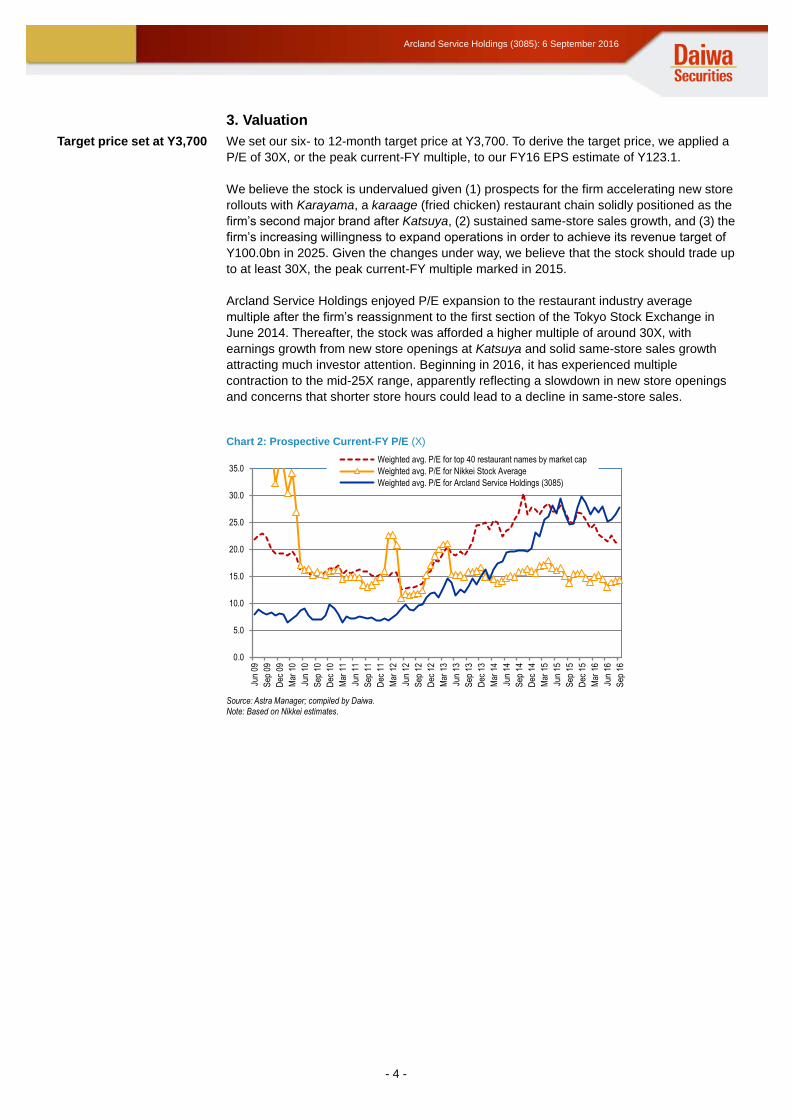
To derive the target price, we applied a P/E of 30X, or the peak current-FY multiple, to our FY16 EPS estimate of Y123.1. We believe that such a high P/E valuation is justified given (1) prospects for the firm accelerating the rollout of new stores with Karayama solidly positioned as the second major brand after Katsuya, and (2) the firm’s increasing willingness to expand its operations,
following the shift to a holding company structure in July 2016.
Japan
Retail trade 6 September 2016 Japanese report: 6 September 2016
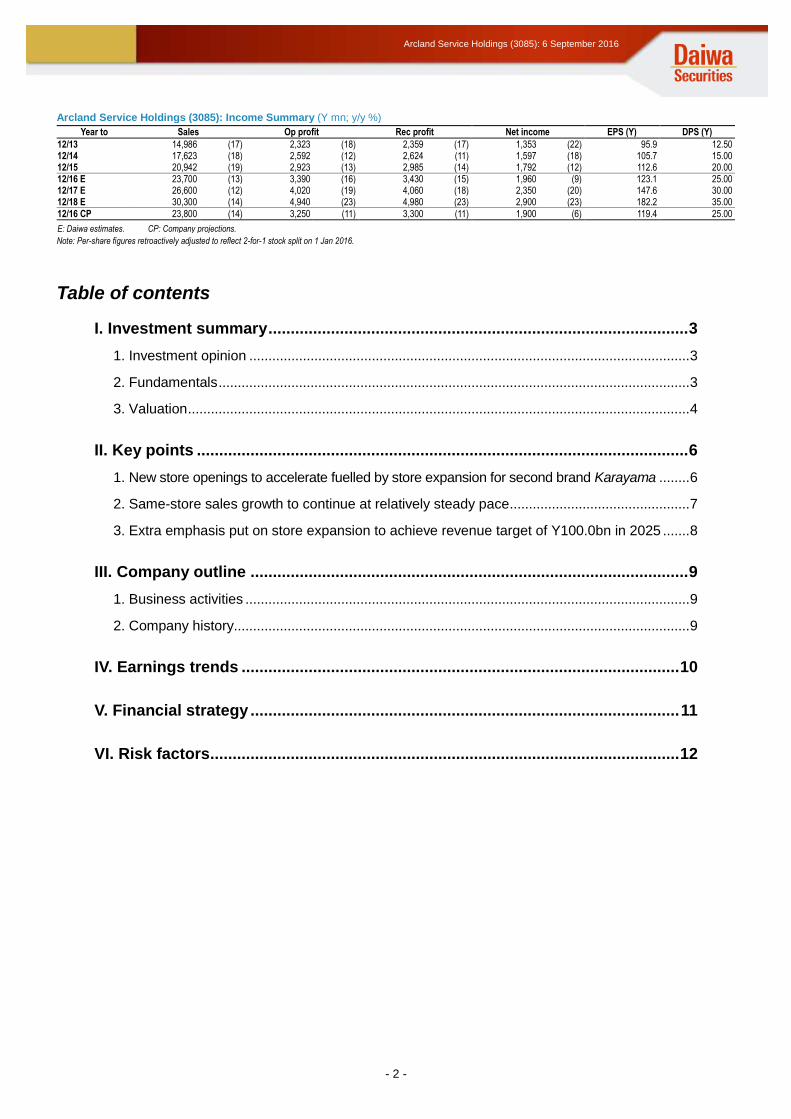
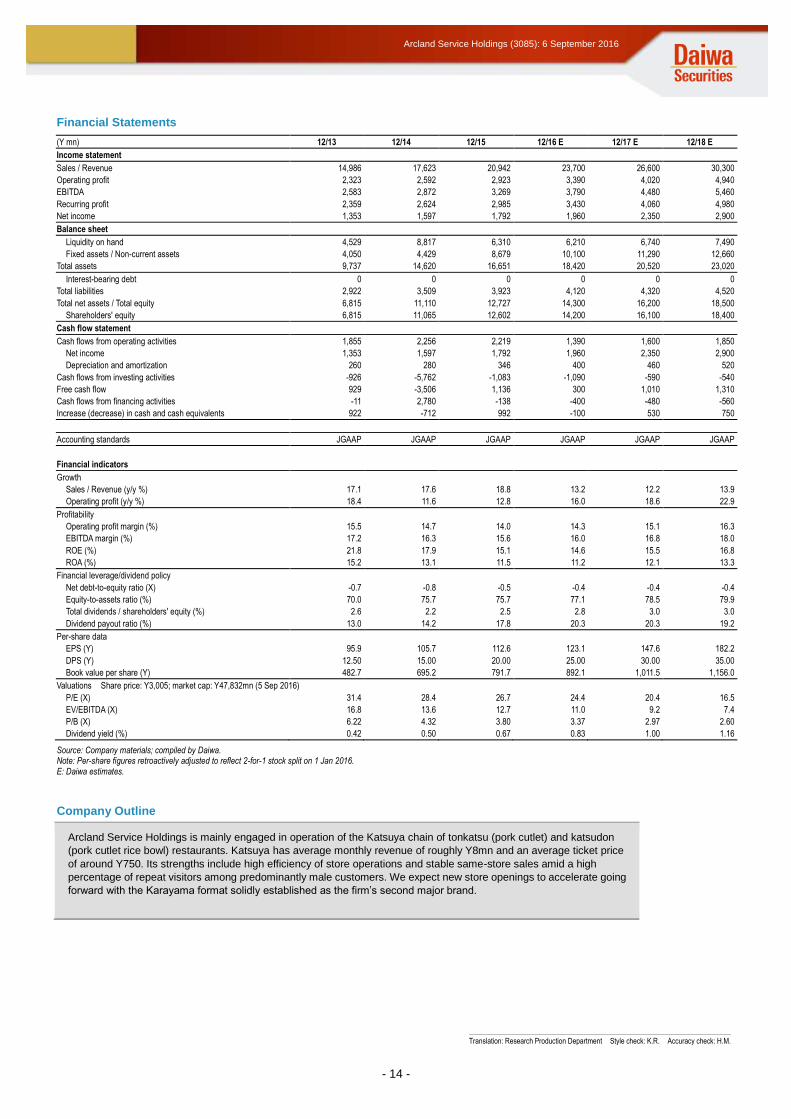
Source: Company materials; compiled by Daiwa. Note: Per-share figures retroactively adjusted to reflect 2-for-1 stock split on 1 Jan 2016. E: Daiwa estimates.
Company Outline
Arcland Service Holdings is mainly engaged in operation of the Katsuya chain of tonkatsu (pork cutlet) and katsudon
(pork cutlet rice bowl) restaurants. Katsuya has average monthly revenue of roughly Y8mn and an average ticket price
of around Y750. Its strengths include high efficiency of store operations and stable same-store sales amid a high
percentage of repeat visitors among predominantly male customers. We expect new store openings to accelerate going
forward with the Karayama format solidly established as the firm’s second major brand.
Translation: Research Production Department Style check: K.R. Accuracy check: H.M.
- 15 -
Arcland Service Holdings (3085): 6 September 2016
Notes concerning market data, investment indicators, and income summary on pages 1-2
Estimates on page 1 by Daiwa Net income is that attributable to shareholders of parent Shares outstanding: Common shares outstanding (excl. treasury stock) Market cap: Based on shares outstanding and closing price as of indicated date EV: Market cap + interest-bearing debt – liquidity on hand EBITDA: Operating profit + depreciation & amortization ROE: Net income / average of start-FY and end-FY shareholders’ equity (figures based on net income attributable to shareholders of parent) Share Price Chart and per-share figures retroactively adjusted to reflect stock splits/reverse stock splits
- 16 -
Arcland Service Holdings (3085): 6 September 2016
IMPORTANT This report is provided as a reference for making investment decisions and is not intended to be a solicitation for investment. Investment decisions should be made at your own discretion and risk. Content herein is based on information available at the time the report was prepared and may be amended or otherwise changed in the future without notice. We make no representations as to the accuracy or completeness. Daiwa Securities Co. Ltd. retains all rights related to the content of this report, which may not be redistributed or otherwise transmitted without prior consent. Ratings Issues are rated 1, 2, 3, 4, or 5 as follows: 1: Outperform TOPIX/benchmark index by more than 15% over the next 12 months. 2: Outperform TOPIX/benchmark index by 5-15% over the next 12 months. 3: Out/underperform TOPIX/benchmark index by less than 5% over the next 12 months. 4: Underperform TOPIX/benchmark index by 5-15% over the next 12 months. 5: Underperform TOPIX/benchmark index by more than 15% over the next 12 months. Benchmark index: TOPIX for Japan, S&P 500 for US, STOXX Europe 600 for Europe, HSI for Hong Kong, STI for Singapore, KOSPI for Korea, TWII for Taiwan, and S&P/ASX 200 for Australia. (Criteria above apply to rating assignments or updates from Jan 2015. For ratings assigned or updated prior to Jan 2015, criteria refer to performance vs. TOPIX/benchmark index over six months.) Japan Conflicts of Interest: Daiwa Securities Co. Ltd. may currently provide or may intend to provide investment banking services or other services to the company referred to in this report. In such cases, said services could give rise to conflicts of interest for Daiwa Securities Co. Ltd. Daiwa Securities Co. Ltd. and Daiwa Securities Group Inc.: Daiwa Securities Co. Ltd. is a subsidiary of Daiwa Securities Group Inc. Ownership of Securities: Daiwa Securities Co. Ltd. may currently, or in the future, own or trade either securities issued by the company referred to in this report or other securities based on such financial instruments. Daiwa Securities Group has filed major shareholding reports for the following companies of which it owns over 5% (as of 15 August 2016): DAISUE CONSTRUCTION (1814); ICHIKEN (1847); NISSEI BUILD KOGYO (1916); Accordia Golf (2131); Samty (3244); Sansei Landic (3277); MUGEN ESTATE (3299); Nippon Healthcare Investment Corporation (3308); KFC (3420); KAWADA TECHNOLOGIES (3443); KI-STAR REAL ESTATE (3465); Billing System (3623); Enigmo (3665); Konoshima Chemical (4026); SEPTENI HOLDINGS (4293); Tri Chemical Laboratories (4369); RaQualia Pharma (4579); NOZAWA (5237); Nakayama Steel Works (5408); Toho Zinc (5707); TOKYO ROPE MFG. (5981); LINKBAL (6046); Allied Architects (6081); WILL GROUP (6089); NS TOOL (6157); Kamakura Shinsho (6184); HOPE (6195); HIRATA Corporation (6258); SANSO ELECTRIC (6518); W-SCOPE (6619); MITSUMI ELECTRIC (6767); SUMIDA CORPORATION (6817); Ferrotec (6890); ENOMOTO (6928); Astmax (7162); GMO Click Holdings (7177); Nojima (7419); V Technology (7717); Daiko Denshi Tsushin (8023); Money Partners Group (8732); Daiwa Office Investment Corporation (8976); Japan Rental Housing Investments (8986); Cerespo (9625); Imperial Hotel (9708); PARKER CORPORATION (9845). Lead Management: Daiwa Securities Co. Ltd. has lead-managed public offerings and/or secondary offerings (excluding straight bonds) in the past twelve months for the following companies: Yoshimura Food Holdings K.K. (2884); Torikizoku (3193); HOTLAND (3196); Activia Properties (3279); SIA REIT (3290); AEON REIT Investment Corporation (3292); Hulic Reit (3295); Nippon Healthcare Investment Corporation (3308); Tosei Reit Investment Corporation (3451); Kenedix Retail REIT Corporation (3453); Samty Residential Investment Corporation (3459); KI-STAR REAL ESTATE (3465); Mitsui Fudosan Logistics Park Inc. (3471); SHOEI YAKUHIN (3537); Nousouken (3541); KOMEDA Holdings (3543); Defactostandard (3545); KUSHIKATSU TANAKA (3547); OPTiM (3694); Mynet (3928); BENEFIT JAPAN (3934); Globalway (3936); Silver Egg Technology (3961); FUSO CHEMICAL (4368); OAT Agrio (4979); Interworks (6032); FIRSTLOGIC (6037); NIPPON VIEW HOTEL (6097); Recruit Holdings (6098); Japan Post Holdings (6178); GMO Media (6180); So-net Media Networks (6185); Atrae (6194); IWAKI (6237); TSUBAKI NAKASHIMA (6464); REFINVERSE (6531); Japan Investment Adviser (7172); Japan Post Insurance (7181); Japan Post Bank (7182); THE FIRST BANK OF TOYAMA (7184); ATOM (7412); AEON Financial Service (8570); ORIX JREIT (8954); HEIWA REAL ESTATE REIT (8966); Daiwa Office Investment Corporation (8976); Japan Hotel REIT Investment Corporation (8985); GAKKYUSHA (9769). (list as of 1 September 2016) Notification items pursuant to Article 37 of the Financial Instruments and Exchange Law
(This Notification is only applicable to where report is distributed by Daiwa Securities Co. Ltd.) If you decide to enter into a business arrangement with our company based on the information described in this report, we ask you to pay close attention to the following items. In addition to the purchase price of a financial instrument, our company will collect a trading commission* for each transaction as agreed beforehand with you. Since commissions
may be included in the purchase price or may not be charged for certain transactions, we recommend that you confirm the commission for each transaction. In some cases, our company also may charge a maximum of ¥ 2 million (including tax) per year as a standing proxy fee for our deposit of your securities, if you are a non-resident.
For derivative and margin transactions etc., our company may require collateral or margin requirements in accordance with an agreement made beforehand with you. Ordinarily in such cases, the amount of the transaction will be in excess of the required collateral or margin requirements.
There is a risk that you will incur losses on your transactions due to changes in the market price of financial instruments based on fluctuations in interest rates, exchange rates, stock prices, real estate prices, commodity prices, and others. In addition, depending on the content of the transaction, the loss could exceed the amount of the collateral or margin requirements.
There may be a difference between bid price etc. and ask price etc. of OTC derivatives handled by our company. Before engaging in any trading, please thoroughly confirm accounting and tax treatments regarding your trading in financial instruments with such experts as certified public
accountants. * The amount of the trading commission cannot be stated here in advance because it will be determined between our company and you based on current market conditions and the content of each transaction etc. When making an actual transaction, please be sure to carefully read the materials presented to you prior to the execution of agreement, and to take responsibility for your own decisions regarding the signing of the agreement with our company.
Corporate Name: Daiwa Securities Co. Ltd. Financial instruments firm: chief of Kanto Local Finance Bureau (Kin-sho) No.108 Memberships: Japan Securities Dealers Association, The Financial Futures Association of Japan, Japan Investment Advisers Association, Type II Financial Instruments Firms Association
Hong Kong This research is distributed in Hong Kong by Daiwa Capital Markets Hong Kong Limited which is regulated by the Hong Kong Securities and Futures Commission. Recipients of this research in Hong Kong may contact Daiwa Capital Markets Hong Kong Limited in respect of any matter arising from or in connection with this research. Singapore This research is distributed in Singapore by Daiwa Capital Markets Singapore Limited and it may only be distributed in Singapore to accredited investors, expert investors and institutional investors as defined in the Financial Advisers Regulations and the Securities and Futures Act. By virtue of distribution to these category of investors, Daiwa Capital Markets Singapore Limited and its representatives are not required to comply with Section 36 of the Financial Advisers Act (Section 36 relates to disclosure of Daiwa Capital Markets Singapore Limited’s interest and/or its representative’s interest in securities). Recipients of this research in Singapore may contact Daiwa Capital Markets Singapore Limited in respect of any matter arising from or in connection with the research.
Australia This research is distributed in Australia by Daiwa Capital Markets Australia Limited and it may only be distributed in Australia to wholesale investors within the meaning of the Corporations Act. Recipients of this research in Australia may contact Daiwa Capital Markets Stockbroking Limited in respect of any matter arising from or in connection with the research. Taiwan This research is distributed in Taiwan by Daiwa-Cathay Capital Markets Co., Ltd and it may only be distributed in Taiwan to institutional investors or specific investors who have signed recommendation contracts with Daiwa-Cathay Capital Markets Co., Ltd in accordance with the Operational Regulations Governing Securities Firms Recommending Trades in Securities to Customers. Recipients of this research in Taiwan may contact Daiwa-Cathay Capital Markets Co., Ltd in respect of any matter arising from or in connection with the research. Thailand This research is distributed to only institutional investors in Thailand primarily by Thanachart Securities Public Company Limited (“TNS”). This report is prepared by analysts who are employed by Daiwa Securities Group Inc. and/or its non-U.S. affiliates. This report is provided to you for informational purposes only and it is not, and is not to be construed as, an offer or an invitation to make an offer to sell or buy any securities. Neither Thanachart Securities Public Company Limited, Daiwa Securities Group Inc. nor any of their respective parent, holding, subsidiaries or affiliates, nor any of their respective directors, officers, servants and employees accept any liability whatsoever for any direct or consequential loss arising from any use of this research or its contents.
- 17 -
Arcland Service Holdings (3085): 6 September 2016
The information and opinions contained herein have been compiled or arrived at from sources believed to be reliable. However, Thanachart Securities Public Company Limited, Daiwa Securities Group Inc. nor any of their respective parent, holding, subsidiaries or affiliates, nor any of their respective directors, officers, servants and employees make no representation or warranty, express or implied, as to their accuracy or completeness. Expressions of opinion herein are subject to change without notice. The use of any information, forecasts and opinions contained in this report shall be at the sole discretion and risk of the user. Daiwa Securities Group Inc. and/or its non-U.S. affiliates perform and seek to perform business with companies covered in this research. Thanachart Securities Public Company Limited, Daiwa Securities Group Inc., their respective parent, holding, subsidiaries or affiliates, their respective directors, officers, servants and employees may have positions and financial interest in securities mentioned in this research. Thanachart Securities Public Company Limited, Daiwa Securities Group Inc., their respective parent, holding, subsidiaries or affiliates may from time to time perform investment banking or other services for, or solicit investment banking or other business from, any entity mentioned in this research. Therefore, investors should be aware of conflict of interest that may affect the objectivity of this research. United Kingdom This research report is produced by Daiwa Securities Co. Ltd. and/or its affiliates and is distributed by Daiwa Capital Markets Europe Limited in the European Union, Iceland, Liechtenstein, Norway and Switzerland. Daiwa Capital Markets Europe Limited is authorised and regulated by the Financial Conduct Authority and is a member of the London Stock Exchange, and Eurex. Daiwa Capital Markets Europe Limited and its affiliates may, from time to time, to the extent permitted by law, participate or invest in other financing transactions with the issuers of the securities referred to herein (the “Securities”), perform services for or solicit business from such issuers, and/or have a position or effect transactions in the Securities or options thereof and/or may have acted as an underwriter during the past twelve months for the issuer of such securities. In addition, employees of Daiwa Capital Markets Europe Limited and its affiliates may have positions and effect transactions in such securities or options and may serve as Directors of such issuers. Daiwa Capital Markets Europe Limited may, to the extent permitted by applicable UK law and other applicable law or regulation, effect transactions in the Securities before this material is published to recipients. This publication is intended for investors who are not Retail Clients in the United Kingdom within the meaning of the Rules of the Financial Conduct Authority and should not therefore be distributed to such Retail Clients in the United Kingdom. Should you enter into investment business with Daiwa Capital Markets Europe’s affiliates outside the United Kingdom, we are obliged to advise that the protection afforded by the United Kingdom regulatory system may not apply; in particular, the benefits of the Financial Services Compensation Scheme may not be available. Daiwa Capital Markets Europe Limited has in place organisational arrangements for the prevention and avoidance of conflicts of interest. Our conflict management policy is available at http://www.uk.daiwacm.com/about-us/corporate-governance-regulatory. Regulatory disclosures of investment banking relationships are available at https://daiwa3.bluematrix.com/sellside/Disclosures.action. Germany This document is distributed in Germany by Daiwa Capital Markets Europe Limited, Frankfurt branch, which is regulated by BaFin (Bundesanstalt fuer Finanzdienstleistungsaufsicht) for the conduct of business in Germany. Bahrain This research material is distributed by Daiwa Capital Markets Europe Limited, Bahrain Branch, regulated by The Central Bank of Bahrain and holds Investment Business Firm – Category 2 license and having its official place of business at the Bahrain World Trade Centre, South Tower, 7th floor, P.O. Box 30069, Manama, Kingdom of Bahrain. Tel No. +973 17534452 Fax No. +973 535113 This material is provided as a reference for making investment decisions and is not intended to be a solicitation for investment. Investment decisions should be made at your own discretion and risk. Accordingly, no representation or warranty, express or implied, is made as to and no reliance should be placed on the fairness, accuracy, completeness or correctness of the information and opinions contained in this document, Content herein is based on information available at the time the research material was prepared and may be amended or otherwise changed in the future without notice. All information is intended for the private use of the person to whom it is provided without any liability whatsoever on the part of Daiwa Capital Markets Europe Limited, Bahrain Branch, any associated company or the employees thereof. If you are in doubt about the suitability of the product or the research material itself, please consult your own financial adviser. Daiwa Capital Markets Europe Limited, Bahrain Branch retains all rights related to the content of this material, which may not be redistributed or otherwise transmitted without prior consent. United States This report is distributed in the U.S. by Daiwa Capital Markets America Inc. (DCMA). It may not be accurate or complete and should not be relied upon as such. It reflects the preparer’s views at the time of its preparation, but may not reflect events occurring after its preparation; nor does it reflect DCMA’s views at any time. Neither DCMA nor the preparer has any obligation to update this report or to continue to prepare research on this subject. This report is not an offer to sell or the solicitation of any offer to buy securities. Unless this report says otherwise, any recommendation it makes is risky and appropriate only for sophisticated speculative investors able to incur significant losses. Readers should consult their financial advisors to determine whether any such recommendation is consistent with their own investment objectives, financial situation and needs. This report does not recommend to U.S. recipients the use of any of DCMA’s non-U.S. affiliates to effect trades in any security and is not supplied with any understanding that U.S. recipients of this report will direct commission business to such non-U.S. entities. Unless applicable law permits otherwise, non-U.S. customers wishing to effect a transaction in any securities referenced in this material should contact a Daiwa entity in their local jurisdiction. Most countries throughout the world have their own laws regulating the types of securities and other investment products which may be offered to their residents, as well as a process for doing so. As a result, the securities discussed in this report may not be eligible for sales in some jurisdictions. Customers wishing to obtain further information about this report should contact DCMA: Daiwa Capital Markets America Inc., Financial Square, 32 Old Slip, New York, New York 10005 (telephone 212-612-7000). Ownership of Securities. For “Ownership of Securities” information please visit BlueMatrix disclosure Link at https://daiwa3.bluematrix.com/sellside/Disclosures.action. Investment Banking Relationships. For “Investment Banking Relationships” please visit BlueMatrix disclosure link at https://daiwa3.bluematrix.com/sellside/Disclosures.action. DCMA Market Making. For “DCMA Market Making” please visit BlueMatrix disclosure link at: https://daiwa3.bluematrix.com/sellside/Disclosures.action. Research Analyst Conflicts. For updates on “Research Analyst Conflicts” please visit BlueMatrix disclosure link at https://daiwa3.bluematrix.com/sellside/Disclosures.action. The principal research analysts who prepared this report have no financial interest in securities of the issuers covered in the report, are not (nor are any members of their household) an officer, director or advisory board member of the issuer(s) covered in the report, and are not aware of any material relevant conflict of interest involving the analyst or DCMA, and did not receive any compensation from the issuer during the past 12 months except as noted: no exceptions. Research Analyst Certification. For updates on “Research Analyst Certification” and “Rating System” please visit BlueMatrix disclosure link at: https://daiwa3.bluematrix.com/sellside/Disclosures.action. The views about any and all of the subject securities and issuers expressed in this Research Report accurately reflect the personal views of the research analyst(s) primarily responsible for this report (or the views of the firm producing the report if no individual analysts[s] is named on the report); and no part of the compensation of such analyst(s) (or no part of the compensation of the firm if no individual analyst[s)] is named on the report) was, is, or will be directly or indirectly related to the specific recommendations or views contained in this Research Report. The following explains the rating system in the report as compared to relevant local indices, based on the beliefs of the author of the report. (Criteria below apply to rating assignments or updates from Jan 2015. For ratings assigned or updated prior to Jan 2015, criteria refer to performance vs. TOPIX/benchmark index over six months.) "1": the security could outperform the local benchmark index by more than 15% over the next 12 months. "2": the security is expected to outperform the local benchmark index by 5-15% over the next 12 months. "3": the security is expected to perform within 5% of the local benchmark index (better or worse) over the next 12 months. "4": the security is expected to underperform the local benchmark index by 5-15% over the next 12 months. "5": the security could underperform the local benchmark index by more than 15% over the next 12 months. Additional information may be available upon request.


![SJDFSDIFVXWHPLVSHFLILFL 8*4&(3085) %- 4045&(/0%&--*/$ … · growing together &.108&3.&/5'&..*/*-& vobqqspddjptusbufhjdp` 1rqrvwdqwhlowhpdghoo ftdmvtjpofgfnnjojmfebjmvphijejqpufsfvldvrvwdq]ldophqwhfrqglylvr](https://static.documents.pub/doc/80x56/5f9bef9738ac6d6c6b5c0286/sjdfsdifvxwhplvshflilfl-843085-40450-growing-together.jpg)


