Annual Review of Marine Science Arctic and Antarctic Sea Ice Change: Contrasts, Commonalities, and Causes Ted Maksym Department of Applied Ocean Physics and Engineering, Woods Hole Oceanographic Institution, Woods Hole, Massachusetts 02543, USA; email: [email protected]Annu. Rev. Mar. Sci. 2019. 11:187–213 First published as a Review in Advance on September 14, 2018 The Annual Review of Marine Science is online at marine.annualreviews.org https://doi.org/10.1146/annurev-marine-010816- 060610 Copyright c 2019 by Annual Reviews. All rights reserved Keywords sea ice, Arctic, Antarctic, climate, satellite Abstract Arctic sea ice has declined precipitously in both extent and thickness over the past four decades; by contrast, Antarctic sea ice has shown little overall change, but this masks large regional variability. Climate models have not captured these changes. But these differences do not represent a paradox. The processes governing, and impacts of, natural variability and human-induced changes differ markedly at the poles largely because of the ways in which differences in geography control the properties of and interactions among the atmosphere, ice, and ocean. The impact of natural variability on the ice cover is large at both poles, so modeled ice trends are not entirely inconsistent with contributions from both natural variability and anthropogenic forcing. Despite this concurrence, the coupling of natural climate variability, climate feedbacks, and sea ice is not well understood, and significant biases remain in model representations of the ice cover and the processes that drive it. 187 Annu. Rev. Mar. Sci. 2019.11:187-213. Downloaded from www.annualreviews.org by Dr John Klinck on 01/10/19. For personal use only.
Transcript
MA11CH09_Maksym ARI 2 November 2018 22:1
Annual Review of Marine Science
Arctic and Antarctic Sea IceChange: Contrasts,Commonalities, and CausesTed MaksymDepartment of Applied Ocean Physics and Engineering, Woods Hole OceanographicInstitution, Woods Hole, Massachusetts 02543, USA; email: [email protected]
Annu. Rev. Mar. Sci. 2019. 11:187–213
First published as a Review in Advance onSeptember 14, 2018
The Annual Review of Marine Science is online atmarine.annualreviews.org
Arctic sea ice has declined precipitously in both extent and thickness overthe past four decades; by contrast, Antarctic sea ice has shown little overallchange, but this masks large regional variability. Climate models have notcaptured these changes. But these differences do not represent a paradox. Theprocesses governing, and impacts of, natural variability and human-inducedchanges differ markedly at the poles largely because of the ways in whichdifferences in geography control the properties of and interactions amongthe atmosphere, ice, and ocean. The impact of natural variability on the icecover is large at both poles, so modeled ice trends are not entirely inconsistentwith contributions from both natural variability and anthropogenic forcing.Despite this concurrence, the coupling of natural climate variability, climatefeedbacks, and sea ice is not well understood, and significant biases remainin model representations of the ice cover and the processes that drive it.
Ice extent: The areaof the ocean surfacethat contains sea iceexceeding somethreshold fractionalcoverage (usually 15%)
GCM: global climatemodel
1. INTRODUCTION
The area of the Northern Hemisphere covered by sea ice has declined dramatically since the1990s (Meier et al. 2014). The decline is particularly evident in summer; in 2007, the summerminimum ice extent dropped to 40% below its long-term mean (Comiso et al. 2008), an anomalythat was almost twice the previous record, from 2005. This record was again surpassed in 2012(Parkinson & Comiso 2013). At the time, global climate models (GCMs) did not capture theobserved declines, even prior to 2007 (Stroeve et al. 2007), which drove suggestions that Arcticsea ice might be nearing a tipping point, beyond which irreversible changes in ice extent changeswould lead rapidly to an ice-free Arctic in summer (e.g., Lenton et al. 2008). Simple projectionsof trends suggested that an essentially ice-free Arctic could be imminent (Maslowski et al. 2012).But despite such concerns, Arctic summer ice cover has not declined further (Swart 2015).
These recent Arctic changes stood in stark contrast to those in the Antarctic, where the icecover overall has increased modestly in extent over the past several decades (e.g., Comiso et al.2017) and reached successive record-high maximum extents from 2012 to 2014 (Reid & Massom2015)—a contrast that has been called an Antarctic paradox (Simmonds 2015). While the increase issmall relative to the decrease in the Arctic, GCMs again failed to accurately capture the observedbehavior, instead suggesting that modest declines due to global warming should have begun(Maksym et al. 2012, Turner et al. 2013).
Several reviews of changes in both Arctic sea ice (Meier 2017, Meier et al. 2014, Stroeveet al. 2012b) and Antarctic sea ice (Hobbs et al. 2016, Stammerjohn & Maksym 2017) have beenrecently published. In this review, I focus on the contrasts and commonalities between the Arcticand Antarctic trends and variability and how specific characteristics of the sea ice cover and itsenvironment can explain these changes.
2. A CONTRAST IN GEOGRAPHY
The defining difference that governs the contrasting behavior of sea ice at the poles is geography.With the exception of some of the peripheral seas, the Arctic ice cover is constrained by land.This restricts the motion of sea ice in the Arctic basin, with the only significant export of icegoing into the North Atlantic (primarily through the narrow Fram Strait between Svalbard andGreenland). While sea ice in the peripheral seas mostly melts completely each summer, most of theice cover survives the summer melt in the high Arctic. In the Antarctic, the ice grows unboundedby land at its northern edge in winter and retreats close to the coast in summer, resulting in twicethe seasonal cycle of growth and retreat in ice extent compared with the Arctic. The maximumnorthward extent of ice is limited principally by the Antarctic Circumpolar Current (Martinson2012). The Antarctic ice edge is constantly buffeted by some of the highest winds and waves onEarth; the frequent passage of cyclones affects ice variability (Uotila et al. 2011), and the wavesbreak up the ice hundreds of kilometers inside the ice edge (Kohout et al. 2014).
2.1. The Atmosphere
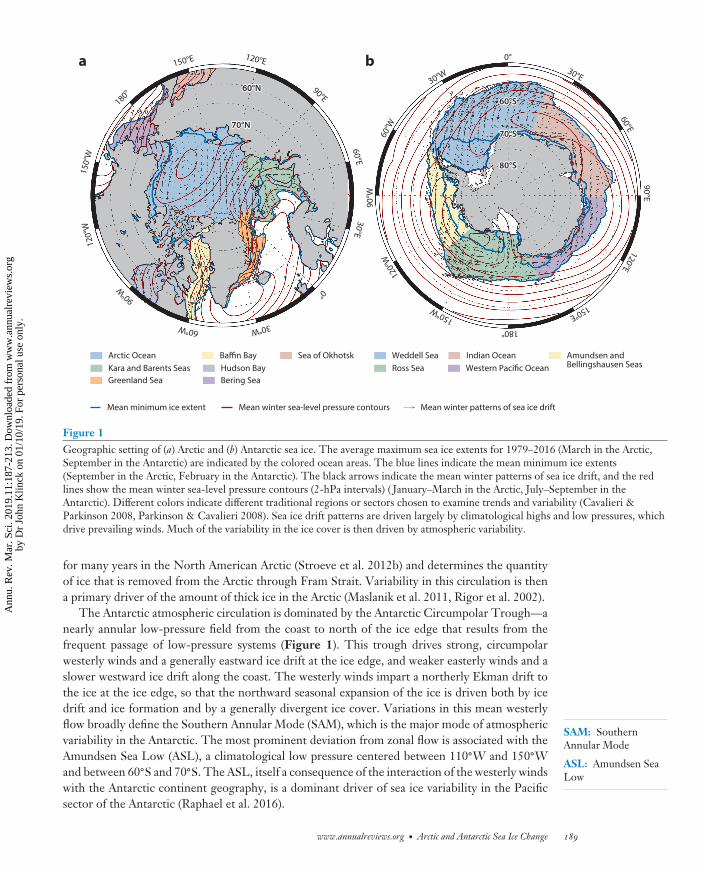
Sea ice drift in the Arctic is dominated by two connected features of the atmospheric circulation.A persistent high pressure over the western Arctic Ocean—the Beaufort High (Serreze & Barrett2011)—drives an anticyclonic sea ice circulation (see Figure 1). Coupled with the trough oflow pressure that extends from the eastern Arctic to the Icelandic Low in the North Atlantic,the Beaufort High also helps drive the Transpolar Drift Stream, which transports ice from theRussian Arctic toward Greenland and Fram Strait. This circulation favors thick ice that can persist
Mean minimum ice extent Mean winter sea-level pressure contours Mean winter patterns of sea ice drift
Figure 1Geographic setting of (a) Arctic and (b) Antarctic sea ice. The average maximum sea ice extents for 1979–2016 (March in the Arctic,September in the Antarctic) are indicated by the colored ocean areas. The blue lines indicate the mean minimum ice extents(September in the Arctic, February in the Antarctic). The black arrows indicate the mean winter patterns of sea ice drift, and the redlines show the mean winter sea-level pressure contours (2-hPa intervals) ( January–March in the Arctic, July–September in theAntarctic). Different colors indicate different traditional regions or sectors chosen to examine trends and variability (Cavalieri &Parkinson 2008, Parkinson & Cavalieri 2008). Sea ice drift patterns are driven largely by climatological highs and low pressures, whichdrive prevailing winds. Much of the variability in the ice cover is then driven by atmospheric variability.
SAM: SouthernAnnular Mode
ASL: Amundsen SeaLow
for many years in the North American Arctic (Stroeve et al. 2012b) and determines the quantityof ice that is removed from the Arctic through Fram Strait. Variability in this circulation is thena primary driver of the amount of thick ice in the Arctic (Maslanik et al. 2011, Rigor et al. 2002).
The Antarctic atmospheric circulation is dominated by the Antarctic Circumpolar Trough—anearly annular low-pressure field from the coast to north of the ice edge that results from thefrequent passage of low-pressure systems (Figure 1). This trough drives strong, circumpolarwesterly winds and a generally eastward ice drift at the ice edge, and weaker easterly winds and aslower westward ice drift along the coast. The westerly winds impart a northerly Ekman drift tothe ice at the ice edge, so that the northward seasonal expansion of the ice is driven both by icedrift and ice formation and by a generally divergent ice cover. Variations in this mean westerlyflow broadly define the Southern Annular Mode (SAM), which is the major mode of atmosphericvariability in the Antarctic. The most prominent deviation from zonal flow is associated with theAmundsen Sea Low (ASL), a climatological low pressure centered between 110◦W and 150◦Wand between 60◦S and 70◦S. The ASL, itself a consequence of the interaction of the westerly windswith the Antarctic continent geography, is a dominant driver of sea ice variability in the Pacificsector of the Antarctic (Raphael et al. 2016).
www.annualreviews.org • Arctic and Antarctic Sea Ice Change 189
Ann
u. R
ev. M
ar. S
ci. 2
019.
11:1
87-2
13. D
ownl
oade
d fr
om w
ww
.ann
ualr
evie
ws.
org
by
Dr
John
Klin
ck o
n 01
/10/
19. F
or p
erso
nal u
se o
nly.
MA11CH09_Maksym ARI 2 November 2018 22:1
Multiyear ice:ice that has survivedthrough one or moresummers
Deformation:the process of icethickening throughrafting and ridging asice floes collide due towinds and currents
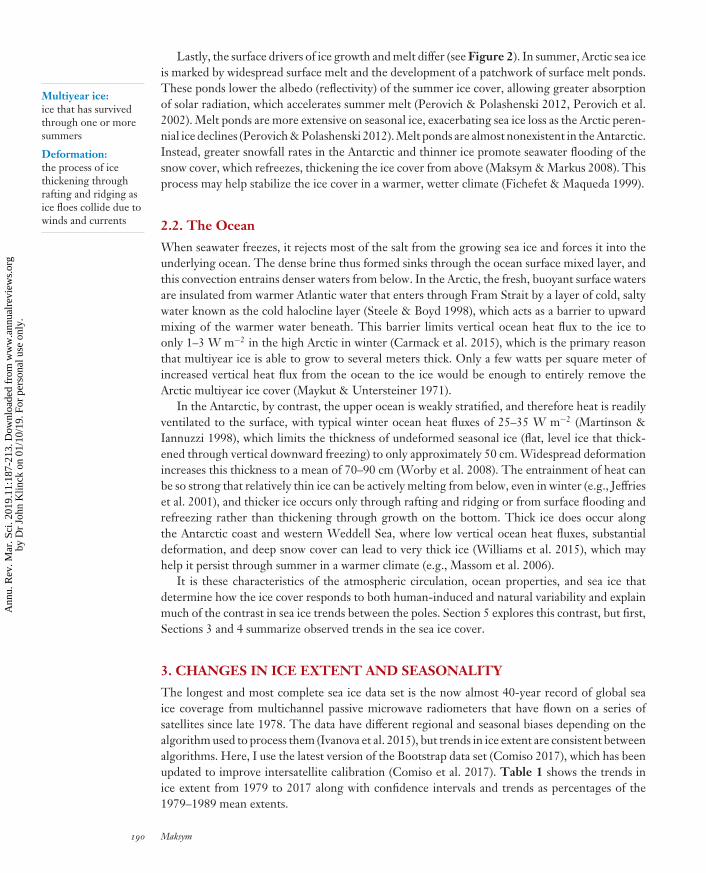
Lastly, the surface drivers of ice growth and melt differ (see Figure 2). In summer, Arctic sea iceis marked by widespread surface melt and the development of a patchwork of surface melt ponds.These ponds lower the albedo (reflectivity) of the summer ice cover, allowing greater absorptionof solar radiation, which accelerates summer melt (Perovich & Polashenski 2012, Perovich et al.2002). Melt ponds are more extensive on seasonal ice, exacerbating sea ice loss as the Arctic peren-nial ice declines (Perovich & Polashenski 2012). Melt ponds are almost nonexistent in the Antarctic.Instead, greater snowfall rates in the Antarctic and thinner ice promote seawater flooding of thesnow cover, which refreezes, thickening the ice cover from above (Maksym & Markus 2008). Thisprocess may help stabilize the ice cover in a warmer, wetter climate (Fichefet & Maqueda 1999).
2.2. The Ocean
When seawater freezes, it rejects most of the salt from the growing sea ice and forces it into theunderlying ocean. The dense brine thus formed sinks through the ocean surface mixed layer, andthis convection entrains denser waters from below. In the Arctic, the fresh, buoyant surface watersare insulated from warmer Atlantic water that enters through Fram Strait by a layer of cold, saltywater known as the cold halocline layer (Steele & Boyd 1998), which acts as a barrier to upwardmixing of the warmer water beneath. This barrier limits vertical ocean heat flux to the ice toonly 1–3 W m−2 in the high Arctic in winter (Carmack et al. 2015), which is the primary reasonthat multiyear ice is able to grow to several meters thick. Only a few watts per square meter ofincreased vertical heat flux from the ocean to the ice would be enough to entirely remove theArctic multiyear ice cover (Maykut & Untersteiner 1971).
In the Antarctic, by contrast, the upper ocean is weakly stratified, and therefore heat is readilyventilated to the surface, with typical winter ocean heat fluxes of 25–35 W m−2 (Martinson &Iannuzzi 1998), which limits the thickness of undeformed seasonal ice (flat, level ice that thick-ened through vertical downward freezing) to only approximately 50 cm. Widespread deformationincreases this thickness to a mean of 70–90 cm (Worby et al. 2008). The entrainment of heat canbe so strong that relatively thin ice can be actively melting from below, even in winter (e.g., Jeffrieset al. 2001), and thicker ice occurs only through rafting and ridging or from surface flooding andrefreezing rather than thickening through growth on the bottom. Thick ice does occur alongthe Antarctic coast and western Weddell Sea, where low vertical ocean heat fluxes, substantialdeformation, and deep snow cover can lead to very thick ice (Williams et al. 2015), which mayhelp it persist through summer in a warmer climate (e.g., Massom et al. 2006).
It is these characteristics of the atmospheric circulation, ocean properties, and sea ice thatdetermine how the ice cover responds to both human-induced and natural variability and explainmuch of the contrast in sea ice trends between the poles. Section 5 explores this contrast, but first,Sections 3 and 4 summarize observed trends in the sea ice cover.
3. CHANGES IN ICE EXTENT AND SEASONALITY
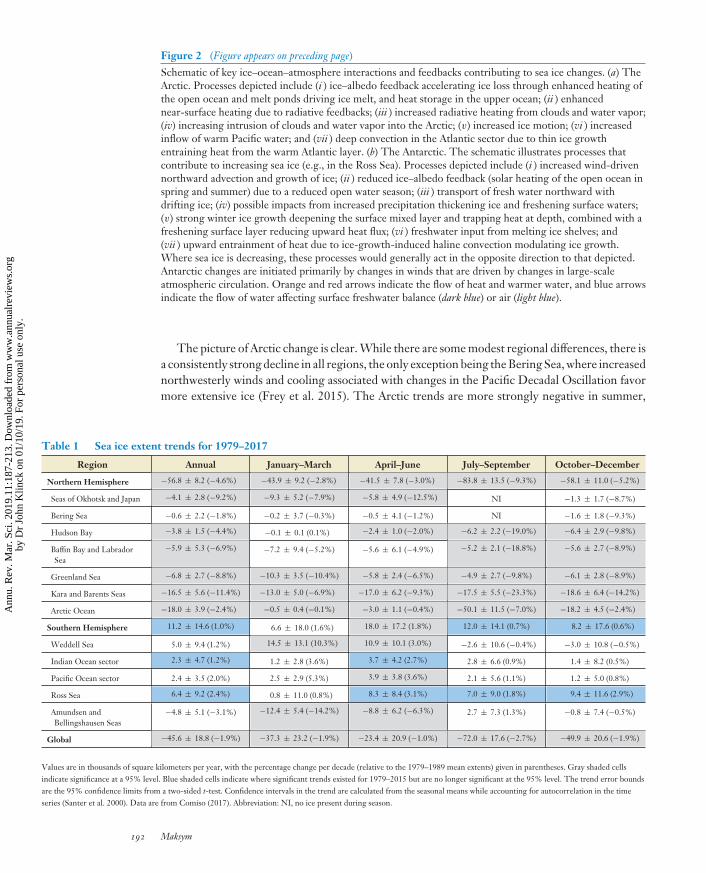
The longest and most complete sea ice data set is the now almost 40-year record of global seaice coverage from multichannel passive microwave radiometers that have flown on a series ofsatellites since late 1978. The data have different regional and seasonal biases depending on thealgorithm used to process them (Ivanova et al. 2015), but trends in ice extent are consistent betweenalgorithms. Here, I use the latest version of the Bootstrap data set (Comiso 2017), which has beenupdated to improve intersatellite calibration (Comiso et al. 2017). Table 1 shows the trends inice extent from 1979 to 2017 along with confidence intervals and trends as percentages of the1979–1989 mean extents.
190 Maksym
Ann
u. R
ev. M
ar. S
ci. 2
019.
11:1
87-2
13. D
ownl
oade
d fr
om w
ww
.ann
ualr
evie
ws.
org
by
Dr
John
Klin
ck o
n 01
/10/
19. F
or p
erso
nal u
se o
nly.
MA11CH09_Maksym ARI 2 November 2018 22:1
Declining thickmultiyear ice
Declining thickmultiyear ice
Radiative warmingby clouds andwater vapor
Radiative warmingby clouds andwater vapor
Solar heating ofexposed oceanSolar heating ofexposed ocean
Reflection ofsolar radiation
by snow and ice
Reflection ofsolar radiation
by snow and ice
Absorption of solarradiation by melt ponds
Absorption of solarradiation by melt ponds
Warming of thenear-surfaceatmosphere
Warming of thenear-surfaceatmosphere
Increased intrusionsof warm, moist air
Increased intrusionsof warm, moist air
Increased intrusionsof warm, moist air
Increased intrusionsof warm, moist air
Increased thin icegrowth driving deep
convection andenhanced vertical
ocean flux
Increased thin icegrowth driving deep
convection andenhanced vertical
ocean flux
Warm Atlantic waterWarm Atlantic water
Cold halocline layerCold halocline layer
Fresh surface waterFresh surface water
IncreasedPacific inflow
IncreasedPacific inflow
Solar heating meltingice and stored in near-
surface waters beneaththe surface mixed layer
Solar heating meltingice and stored in near-
surface waters beneaththe surface mixed layer
Temperature and salinityprofiles of the upper ocean
Temperature and salinityprofiles of the upper ocean
Pacific Atlantic
Increasingice motionIncreasingice motion
Reduced solarheating of the
ocean in springdue to increased
ice cover
Southerly windsexpanding ice cover
and cooling the ocean
Changes inprecipitationChanges in
precipitation
Salt input into the ocean during ice growth drivingmixing and entrainment of heat from deep water
Salt input into the ocean during ice growth drivingmixing and entrainment of heat from deep water
Northward fresh-water transportas ice is pushednorth by winds
Northward fresh-water transportas ice is pushednorth by winds
Meltwaterinput
Meltwaterinput
Freshening of the surfacewater and trapping of heatat depth due to increasedfreshwater transport andstrong winter ice growth
Freshening of the surfacewater and trapping of heatat depth due to increasedfreshwater transport andstrong winter ice growth
Circumpolar deep water
Fresh water frommelting ice shelves
Fresh water frommelting ice shelves
Ice shelfIce shelf
T S
a
b
T
(Caption appears on following page)
www.annualreviews.org • Arctic and Antarctic Sea Ice Change 191
Ann
u. R
ev. M
ar. S
ci. 2
019.
11:1
87-2
13. D
ownl
oade
d fr
om w
ww
.ann
ualr
evie
ws.
org
by
Dr
John
Klin
ck o
n 01
/10/
19. F
or p
erso
nal u
se o
nly.
MA11CH09_Maksym ARI 2 November 2018 22:1
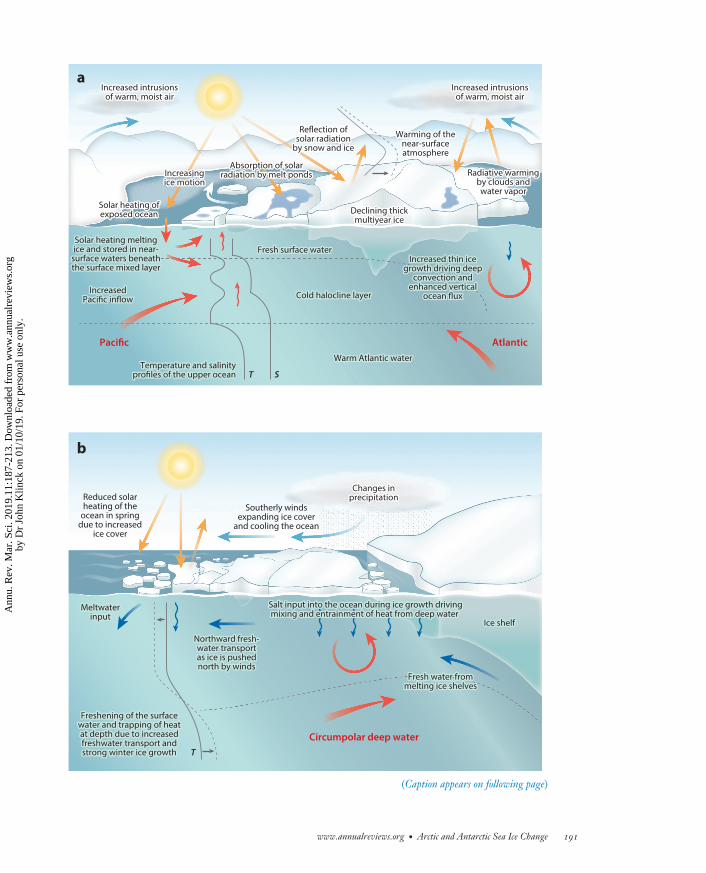
Figure 2 (Figure appears on preceding page)
Schematic of key ice–ocean–atmosphere interactions and feedbacks contributing to sea ice changes. (a) TheArctic. Processes depicted include (i ) ice–albedo feedback accelerating ice loss through enhanced heating ofthe open ocean and melt ponds driving ice melt, and heat storage in the upper ocean; (ii ) enhancednear-surface heating due to radiative feedbacks; (iii ) increased radiative heating from clouds and water vapor;(iv) increasing intrusion of clouds and water vapor into the Arctic; (v) increased ice motion; (vi ) increasedinflow of warm Pacific water; and (vii ) deep convection in the Atlantic sector due to thin ice growthentraining heat from the warm Atlantic layer. (b) The Antarctic. The schematic illustrates processes thatcontribute to increasing sea ice (e.g., in the Ross Sea). Processes depicted include (i ) increased wind-drivennorthward advection and growth of ice; (ii ) reduced ice–albedo feedback (solar heating of the open ocean inspring and summer) due to a reduced open water season; (iii ) transport of fresh water northward withdrifting ice; (iv) possible impacts from increased precipitation thickening ice and freshening surface waters;(v) strong winter ice growth deepening the surface mixed layer and trapping heat at depth, combined with afreshening surface layer reducing upward heat flux; (vi ) freshwater input from melting ice shelves; and(vii ) upward entrainment of heat due to ice-growth-induced haline convection modulating ice growth.Where sea ice is decreasing, these processes would generally act in the opposite direction to that depicted.Antarctic changes are initiated primarily by changes in winds that are driven by changes in large-scaleatmospheric circulation. Orange and red arrows indicate the flow of heat and warmer water, and blue arrowsindicate the flow of water affecting surface freshwater balance (dark blue) or air (light blue).
The picture of Arctic change is clear. While there are some modest regional differences, there isa consistently strong decline in all regions, the only exception being the Bering Sea, where increasednorthwesterly winds and cooling associated with changes in the Pacific Decadal Oscillation favormore extensive ice (Frey et al. 2015). The Arctic trends are more strongly negative in summer,
Table 1 Sea ice extent trends for 1979–2017
Region Annual January–March April–June July–September October–December
Values are in thousands of square kilometers per year, with the percentage change per decade (relative to the 1979–1989 mean extents) given in parentheses. Gray shaded cellsindicate significance at a 95% level. Blue shaded cells indicate where significant trends existed for 1979–2015 but are no longer significant at the 95% level. The trend error boundsare the 95% confidence limits from a two-sided t-test. Confidence intervals in the trend are calculated from the seasonal means while accounting for autocorrelation in the timeseries (Santer et al. 2000). Data are from Comiso (2017). Abbreviation: NI, no ice present during season.
192 Maksym
Ann
u. R
ev. M
ar. S
ci. 2
019.
11:1
87-2
13. D
ownl
oade
d fr
om w
ww
.ann
ualr
evie
ws.
org
by
Dr
John
Klin
ck o
n 01
/10/
19. F
or p
erso
nal u
se o
nly.
MA11CH09_Maksym ARI 2 November 2018 22:1
consistent with GCM predictions (Stroeve et al. 2012a). A clear consensus of an anthropogenicdriver has emerged (Flato et al. 2013, Kay et al. 2011, Min et al. 2008, Notz & Marotzke 2012,Stroeve et al. 2012a).
An important question is whether sea ice decline in the Arctic has accelerated in the wake of thedramatically low sea ice minimum in 2007 (Stroeve et al. 2012b) and indications that the ice covermight continue to decline faster than models predict (Stroeve et al. 2012a). Since 2007, Septembersea ice extent has fluctuated strongly but has shown no significant trend (Swart 2015). Such stepchanges in the ice cover are consistent with similar large declines seen in GCMs, known as rapidice loss events. These events can occur when a weakened ice cover exacerbates the impact of largebut potentially natural variations in the forcing (Holland 2013, Holland et al. 2006). NorthernHemisphere winter trends are consistent across the satellite period (Meier 2017; see also Figure 6in Section 6) and do not show statistically significant differences for different time periods. On theother hand, there has been a steepening of the trend in summer, with the rate of decline doublingsince 2000 (from −55 to −115 km3 y−1). Negative Arctic annual trends become significant by1990.
By contrast, there has recently been a modest increasing trend in the Antarctic. These trends aresimilar to those reported by prior studies (Comiso & Nishio 2008), but as of 2017 are statisticallysignificant (at the 95% level) Antarctic-wide only in autumn. Ice extent increases have been mostprominent in the Ross Sea, with positive trends in all seasons except summer through 2015, but dueto recent record ice extent minima, these trends are no longer statistically significant. Nevertheless,positive trends are generally strongest in autumn, where trends are significant at the 90% levelin all regions. This recent variability is further discussed in Section 6. These findings agree withthe results of Yuan et al. (2017), who, using a more sophisticated trend analysis accounting forpersistence, suggested that significant positive trends are present only in the Ross Sea. Overall,Arctic change dwarfs Antarctic change, so that the global sea ice cover is strongly decreasing.
Negative trends in the Amundsen and Bellingshausen Seas have been noted for the past twodecades, with a loss of most of the perennial ice ( Jacobs & Comiso 1997). These negative trendsare significant for summer and autumn, reflecting a lengthening of the summer season, but bywinter, the ice has recovered. Due to recent years of heavier ice, the annual trend is no longersignificant at the 95% level.
Despite much recent debate on the causes of the Antarctic increase (Hobbs et al. 2016), thetrend is small and potentially short term (the circumpolar trends are statistically significant onlysince 2008, and as of 2017 may no longer be so), and it obscures the much larger regional variability.Antarctic trends depend strongly on the time period and season, with only the opposing trendsin the Ross, Amundsen, and Bellingshausen Seas being relatively consistent over time. Thus, thestory is one of variability and why that variability is centered in the Pacific sector of the SouthernOcean. Section 6 further discusses the significance of these trends in the context of historical andfuture change.
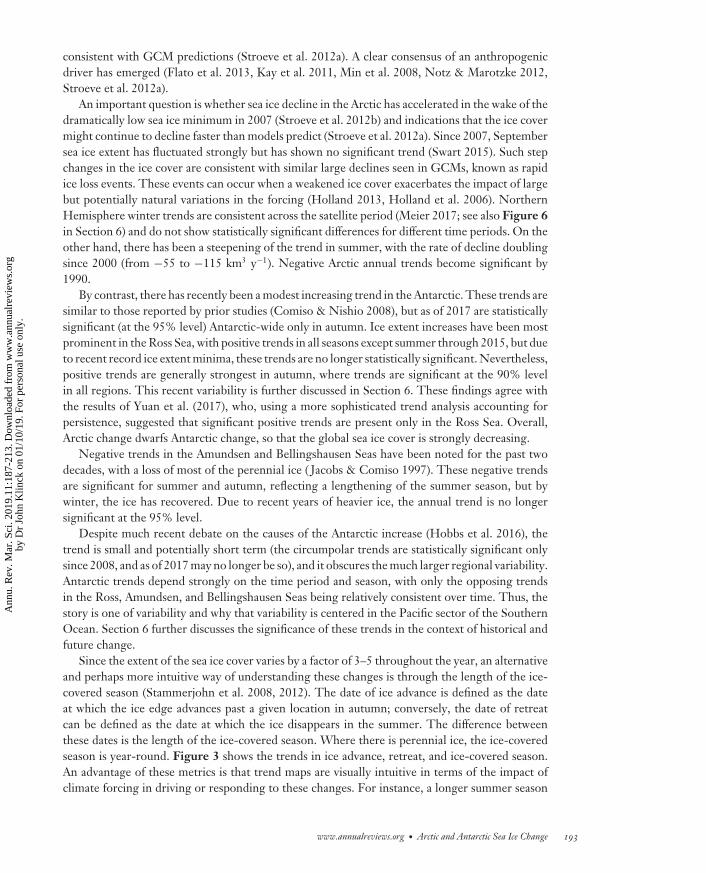
Since the extent of the sea ice cover varies by a factor of 3–5 throughout the year, an alternativeand perhaps more intuitive way of understanding these changes is through the length of the ice-covered season (Stammerjohn et al. 2008, 2012). The date of ice advance is defined as the dateat which the ice edge advances past a given location in autumn; conversely, the date of retreatcan be defined as the date at which the ice disappears in the summer. The difference betweenthese dates is the length of the ice-covered season. Where there is perennial ice, the ice-coveredseason is year-round. Figure 3 shows the trends in ice advance, retreat, and ice-covered season.An advantage of these metrics is that trend maps are visually intuitive in terms of the impact ofclimate forcing in driving or responding to these changes. For instance, a longer summer season
www.annualreviews.org • Arctic and Antarctic Sea Ice Change 193
Ann
u. R
ev. M
ar. S
ci. 2
019.
11:1
87-2
13. D
ownl
oade
d fr
om w
ww
.ann
ualr
evie
ws.
org
by
Dr
John
Klin
ck o
n 01
/10/
19. F
or p
erso
nal u
se o
nly.
MA11CH09_Maksym ARI 2 November 2018 22:1
30°E
60°E90°E
120°E
150°E180°150°W
120°
W90
°W60
°W
30°W0°
60°S60°S
70°S70°S
80°S80°S
30°E
60°E90°E
120°E
150°E180°150°W
120°
W90
°W60
°W
30°W0°
60°S60°S
70°S70°S
80°S80°S
30°E
60°E90°E
120°E
150°E180°150°W
120°
W90
°W60
°W
30°W0°
60°S60°S
70°S70°S
80°S80°S
a Ice advance b Ice retreat c Ice season duration
30°E60°E
90°E
120°E150°E
180°
150°
W12
0°W
90°W
60°W 30°W
0°
60°N60°N
70°N70°N
30°E60°E
90°E
120°E150°E
180°
150°
W12
0°W
90°W
60°W 30°W
0°
60°N60°N
70°N70°N
30°E60°E
90°E
120°E150°E
180°
150°
W12
0°W
90°W
60°W 30°W
0°
60°N60°N
70°N70°N
–2.0 –1.0 0 1.0 2.0
Trend in timing or duration (d y–1)Earlier/shorter Later/longer
Figure 3Trends in (a) the timing of sea ice advance, (b) the timing of sea ice retreat, and (c) the length of the ice-covered season between 1979and 2016. Figure adapted and updated from Stammerjohn et al. (2012).
is directly related to the ice–albedo feedback (see the sidebar titled Ice–Albedo Feedback) throughthe increased absorption of solar heating by the open ocean.
The picture of regional changes is clear. Across the Arctic, autumn ice advance is trending laterand spring/summer retreat earlier in almost all regions, the only exception being the Bering Sea,where there has been very little change. The regions of greatest Arctic change are in the Beaufort,Chukchi, and eastern Siberian Seas in the Canada Basin and the Kara and Barents Seas in theeast (Stammerjohn et al. 2012). Here, sea ice retreat is earlier by approximately 1.5–2 monthsand advance is later by 1–1.5 months, resulting in an ice season that is shorter by approximately2–3.5 months since 1978. In the Antarctic, the trends are much more regionally variable, but thecontrasting trends between the southern Amundsen and Bellingshausen Seas and the western RossSea are as large as those between the Antarctic and the Arctic. In the Amundsen and BellingshausenSeas, ice retreat is approximately 1 month earlier and advance approximately 1–2 months later,
194 Maksym
Ann
u. R
ev. M
ar. S
ci. 2
019.
11:1
87-2
13. D
ownl
oade
d fr
om w
ww
.ann
ualr
evie
ws.
org
by
Dr
John
Klin
ck o
n 01
/10/
19. F
or p
erso
nal u
se o
nly.
MA11CH09_Maksym ARI 2 November 2018 22:1
ICE–ALBEDO FEEDBACK
In the summer, enhanced sea ice loss is dominated by the ice–albedo feedback. Snow-covered sea ice reflects mostof the incident solar radiation. As the ice melts, it reveals the dark ocean, which absorbs more solar radiation. Theheat absorbed by the ocean melts more ice, which in turn promotes more solar heating of the ocean, thus creatinga positive melting feedback (Perovich et al. 2011).
ICESat: Ice, Cloud,and Land ElevationSatellite
First-year ice: icethat has formed duringthe current winterseason
resulting in an ice season that is shorter by approximately 2–3 months. By contrast, the westernRoss Sea has had opposing trends, with a later retreat of approximately 1 month and earlieradvance of approximately 1–2 months (Stammerjohn & Maksym 2017). Note that, while trendsin the Arctic are consistent over time, the impact of recent interannual variability is fairly large inthe Antarctic. Since the study by Stammerjohn et al. (2012), a partial reversal of regional trendshas shortened the sea ice season in the Amundsen Sea and western Ross Sea and increased it in thesouthern Bellingshausen Sea. The magnitude of the trends in ice season length vary over differenttimescales for different regions, with subdecadal variations in the Bellingshausen Sea and a moreconsistent trend in the Ross Sea (Simpkins et al. 2013).
4. CHANGES IN ICE THICKNESS AND DRIFT
The loss of Arctic ice thickness and volume is expected to outpace ice extent declines under globalwarming (Gregory et al. 2002). The only large-scale time series of ice thickness is from sonarmeasurements of ice draft from submarines that have traversed under the ice since 1958. Theavailable data are sparse and cover only approximately 40% of the Arctic, but in the western andcentral Arctic, there was a 36% decline in ice thickness between the 1980s and 2000s (Rothrocket al. 2008).
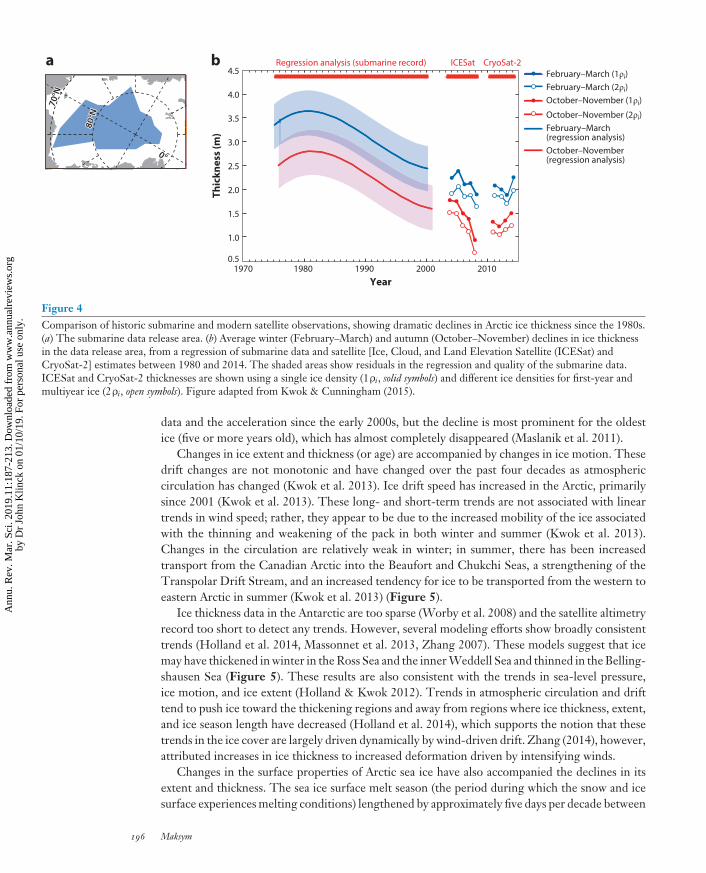
More recently, satellite altimeters on the Ice, Cloud, and Land Elevation Satellite (ICESat)and CryoSat-2 have provided estimates of ice thickness from 2003 to 2009 and from 2009 to thepresent, respectively. These data show an accelerating decline in ice thickness over the ICESatperiod coincident with the rapid loss of perennial ice leading up to and including 2007 (Kwok &Rothrock 2009, Kwok et al. 2009). Remarkably, multiyear ice declined by approximately 40% andthinned by approximately 0.6 m between 2005 and 2008 (Kwok et al. 2009). This loss then leveledoff, with possibly some recovery after 2007 (Kwok & Cunningham 2015) (Figure 4), consistentwith ice extent variability.
There are significant uncertainties in these satellite-based observations, as an independentestimate of snow depth is required to derive ice thickness (Kwok & Cunningham 2015), particularlyover thinner first-year ice. Because interannual variations in first-year ice thickness are then difficultto detect (Kwok & Cunningham 2015, Tilling et al. 2015), the long-term observed changesin ice thickness are primarily (or perhaps entirely) due to changes in multiyear ice. Recently,however, anomalies in the thickness of thin ice have been detected due to reduced ice growth inthe anomalously warm winter of 2015–2016 (Ricker et al. 2017).
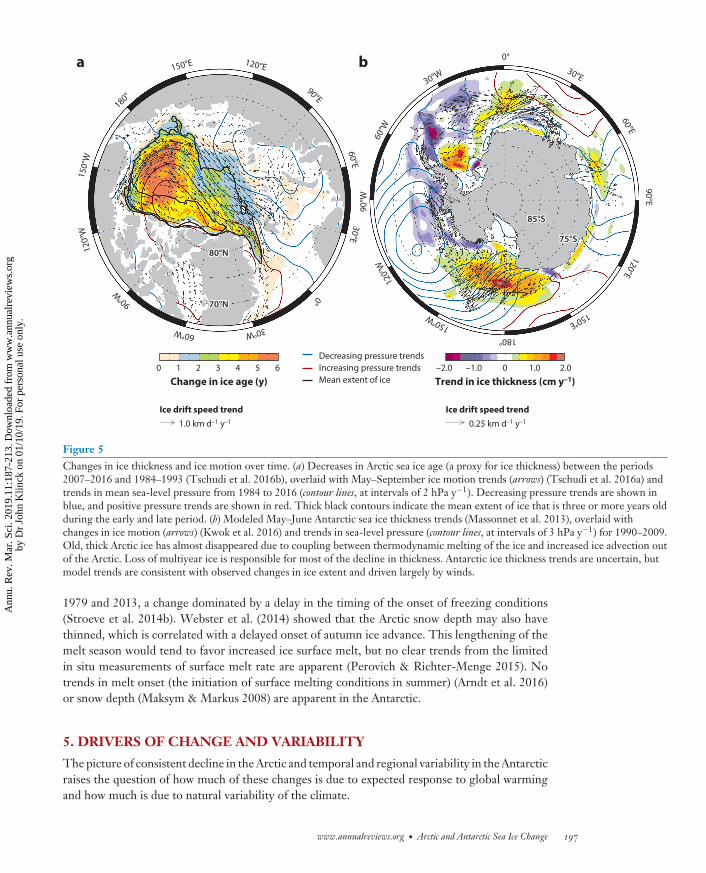
Since Arctic ice thickness and volume changes are due mostly to changes in the amount ofmultiyear ice, the age of the ice provides a proxy for changes in ice thickness. Ice age has beenmonitored since 1983 by tracking ice parcels that survive the summer melt through each subsequentseason that they survive (Maslanik et al. 2011). These data show a dramatic decline in the age ofice since 1984, with almost all of the older, thicker ice having vanished (Figure 5). The pace ofloss of older ice is consistent with both the long-term decline in ice thickness from submarine
www.annualreviews.org • Arctic and Antarctic Sea Ice Change 195
a b Regression analysis (submarine record) ICESat CryoSat-2
Figure 4Comparison of historic submarine and modern satellite observations, showing dramatic declines in Arctic ice thickness since the 1980s.(a) The submarine data release area. (b) Average winter (February–March) and autumn (October–November) declines in ice thicknessin the data release area, from a regression of submarine data and satellite [Ice, Cloud, and Land Elevation Satellite (ICESat) andCryoSat-2] estimates between 1980 and 2014. The shaded areas show residuals in the regression and quality of the submarine data.ICESat and CryoSat-2 thicknesses are shown using a single ice density (1ρi, solid symbols) and different ice densities for first-year andmultiyear ice (2ρi, open symbols). Figure adapted from Kwok & Cunningham (2015).
data and the acceleration since the early 2000s, but the decline is most prominent for the oldestice (five or more years old), which has almost completely disappeared (Maslanik et al. 2011).
Changes in ice extent and thickness (or age) are accompanied by changes in ice motion. Thesedrift changes are not monotonic and have changed over the past four decades as atmosphericcirculation has changed (Kwok et al. 2013). Ice drift speed has increased in the Arctic, primarilysince 2001 (Kwok et al. 2013). These long- and short-term trends are not associated with lineartrends in wind speed; rather, they appear to be due to the increased mobility of the ice associatedwith the thinning and weakening of the pack in both winter and summer (Kwok et al. 2013).Changes in the circulation are relatively weak in winter; in summer, there has been increasedtransport from the Canadian Arctic into the Beaufort and Chukchi Seas, a strengthening of theTranspolar Drift Stream, and an increased tendency for ice to be transported from the western toeastern Arctic in summer (Kwok et al. 2013) (Figure 5).
Ice thickness data in the Antarctic are too sparse (Worby et al. 2008) and the satellite altimetryrecord too short to detect any trends. However, several modeling efforts show broadly consistenttrends (Holland et al. 2014, Massonnet et al. 2013, Zhang 2007). These models suggest that icemay have thickened in winter in the Ross Sea and the inner Weddell Sea and thinned in the Belling-shausen Sea (Figure 5). These results are also consistent with the trends in sea-level pressure,ice motion, and ice extent (Holland & Kwok 2012). Trends in atmospheric circulation and drifttend to push ice toward the thickening regions and away from regions where ice thickness, extent,and ice season length have decreased (Holland et al. 2014), which supports the notion that thesetrends in the ice cover are largely driven dynamically by wind-driven drift. Zhang (2014), however,attributed increases in ice thickness to increased deformation driven by intensifying winds.
Changes in the surface properties of Arctic sea ice have also accompanied the declines in itsextent and thickness. The sea ice surface melt season (the period during which the snow and icesurface experiences melting conditions) lengthened by approximately five days per decade between
196 Maksym
Ann
u. R
ev. M
ar. S
ci. 2
019.
11:1
87-2
13. D
ownl
oade
d fr
om w
ww
.ann
ualr
evie
ws.
org
by
Dr
John
Klin
ck o
n 01
/10/
19. F
or p
erso
nal u
se o
nly.
MA11CH09_Maksym ARI 2 November 2018 22:1
0.25 km d–1 y–11.0 km d–1 y–1
0 1 2 3 4 5 6
Change in ice age (y)–2.0 –1.0 0 1.0 2.0
Trend in ice thickness (cm y–1)
30°E60°E
90°E
120°E150°E
180°
150°
W12
0°W
90°W
60°W 30°W
0°
80°N80°N
70°N70°N
30°E60°E
90°E120°E
150°E
180°150°W
120°
W
90°W
60°W
30°W
0°
75°S75°S
85°S85°S
a b
Ice drift speed trend Ice drift speed trend
Decreasing pressure trendsIncreasing pressure trendsMean extent of ice
Figure 5Changes in ice thickness and ice motion over time. (a) Decreases in Arctic sea ice age (a proxy for ice thickness) between the periods2007–2016 and 1984–1993 (Tschudi et al. 2016b), overlaid with May–September ice motion trends (arrows) (Tschudi et al. 2016a) andtrends in mean sea-level pressure from 1984 to 2016 (contour lines, at intervals of 2 hPa y−1). Decreasing pressure trends are shown inblue, and positive pressure trends are shown in red. Thick black contours indicate the mean extent of ice that is three or more years oldduring the early and late period. (b) Modeled May–June Antarctic sea ice thickness trends (Massonnet et al. 2013), overlaid withchanges in ice motion (arrows) (Kwok et al. 2016) and trends in sea-level pressure (contour lines, at intervals of 3 hPa y−1) for 1990–2009.Old, thick Arctic ice has almost disappeared due to coupling between thermodynamic melting of the ice and increased ice advection outof the Arctic. Loss of multiyear ice is responsible for most of the decline in thickness. Antarctic ice thickness trends are uncertain, butmodel trends are consistent with observed changes in ice extent and driven largely by winds.
1979 and 2013, a change dominated by a delay in the timing of the onset of freezing conditions(Stroeve et al. 2014b). Webster et al. (2014) showed that the Arctic snow depth may also havethinned, which is correlated with a delayed onset of autumn ice advance. This lengthening of themelt season would tend to favor increased ice surface melt, but no clear trends from the limitedin situ measurements of surface melt rate are apparent (Perovich & Richter-Menge 2015). Notrends in melt onset (the initiation of surface melting conditions in summer) (Arndt et al. 2016)or snow depth (Maksym & Markus 2008) are apparent in the Antarctic.
5. DRIVERS OF CHANGE AND VARIABILITY
The picture of consistent decline in the Arctic and temporal and regional variability in the Antarcticraises the question of how much of these changes is due to expected response to global warmingand how much is due to natural variability of the climate.
www.annualreviews.org • Arctic and Antarctic Sea Ice Change 197
Ann
u. R
ev. M
ar. S
ci. 2
019.
11:1
87-2
13. D
ownl
oade
d fr
om w
ww
.ann
ualr
evie
ws.
org
by
Dr
John
Klin
ck o
n 01
/10/
19. F
or p
erso
nal u
se o
nly.
MA11CH09_Maksym ARI 2 November 2018 22:1
5.1. Atmospheric Drivers of Variability
The leading mode of atmospheric variability in the Arctic is the Arctic Oscillation, which describesvariations in air pressure over the central Arctic associated with the Beaufort High (Thompson &Wallace 1998). In its positive phase, circulation is more cyclonic (counterclockwise), which tendsto promote transport of older, thicker ice away from the Eurasian Arctic and out through FramStrait, consequently increasing the production of younger, thinner ice (Rigor & Wallace 2004).A generally positive winter Arctic Oscillation in the 1980s to 1990s has been associated with areduction in multiyear ice, but despite a shift to more neutral conditions in the mid-1990s, sea icecontinued to decline.
The second leading mode of Arctic atmospheric variability, the Dipole Anomaly, is expressedas surface air pressure variability between the North American and Eurasian Arctic (Watanabeet al. 2006). It has different expressions in summer and winter, but in both seasons, its impact isto drive variations in meridional winds across the pole, and it therefore has a major impact onice export via the Transpolar Drift Stream (Wang et al. 2009). Multiyear ice has continued todecline as the Dipole Anomaly favored increased export in the Transpolar Drift Stream throughthe 1990s and 2000s (Maslanik et al. 2011).
Note, however, that the strengthening of the Transpolar Drift Stream noted by Kwok et al.(2013) is not strongly driven by changes in winds; Kwok et al. (2013) found that, while ice exportthrough Fram Strait has increased since 2001, the overall increase in export since 1982 is negligibledue to a compensating decrease in ice concentration. By contrast, Smedsrud et al. (2017) usedcorrelations of drift with geostrophic winds to suggest that export increased by 5.9% per decadefrom 1979 to 2014, with the greatest increases occurring in spring. The long-term trend is largelyattributable not to the Arctic Oscillation but to surface pressure trends with a Dipole Anomaly–likepattern. Ogi et al. (2010) stressed the importance of both winter and summer wind anomalies indriving anomalies in summer sea ice extent.
The results described above paint a complex picture of the role of atmospheric variability inice declines. The impact of the winter Arctic Oscillation on sea ice declines prior to the 1990swould plausibly have a greater impact when the multiyear ice fraction was high. A shift toward acirculation pattern favoring a strengthening of the Transpolar Drift Stream and increasing driftspeed would enhance summer ice export. Strengthening of anticyclonic circulation in the BeaufortGyre (Figure 5) increased the divergence of the pack, enhancing ice melt in summer (Kashiwaseet al. 2017). Loss of multiyear ice is exacerbated by increased transport from north of the CanadianArchipelago into the Beaufort Sea, where it can melt more readily in summer.
These changes can reflect more than a dynamic sea ice response, as atmospheric circulationvariability can also be accompanied by changes in transport of heat and moisture into the Arctic.A warmer, moister atmosphere increases downwelling long-wave radiative forcing and warms thesurface. Several recent studies have shown an increasing frequency of warm air intrusions in theArctic, which can explain a significant fraction of the surface winter warming and sea ice declinesin the Eurasian Arctic (Gong et al. 2017, Park et al. 2015, Woods & Caballero 2016).
The proximate driver of sea ice variability in the Antarctic is winds (Holland & Kwok 2012,Kwok et al. 2016, Matear et al. 2015). Offshore winds can promote expansion either dynamically,by advecting sea ice northward, where this expansion may be reinforced by ocean feedbacks (seeSection 5.2), or by cooling and freezing. Conversely, warmer onshore winds can push the ice edgeback dynamically or through warming. In the Pacific sector, the relationship between winds andice extent trends is clear, and appears to be largely dynamic in the Amundsen and Ross Seas butlargely thermodynamically driven in the Bellingshausen Sea (Holland 2014, Matear et al. 2015).
198 Maksym
Ann
u. R
ev. M
ar. S
ci. 2
019.
11:1
87-2
13. D
ownl
oade
d fr
om w
ww
.ann
ualr
evie
ws.
org
by
Dr
John
Klin
ck o
n 01
/10/
19. F
or p
erso
nal u
se o
nly.
MA11CH09_Maksym ARI 2 November 2018 22:1
ENSO:El Nino–SouthernOscillation
Wind forcing may be sufficient to explain trends in all areas except the western Antarctic Peninsularegions, where warming has contributed to trends (Matear et al. 2015).
Variations in winds are associated with two major modes of climate variability: the SAM andthe El Nino–Southern Oscillation (ENSO). There has been a long-term positive trend in the SAMassociated with ozone depletion (Thompson et al. 2011), which is presumed to have intensifiedwesterly winds. This positive trend in the SAM deepens the ASL, increasing warm, northerly windsover the Bellingshausen Sea and cold southerly winds over the Ross Sea. This deepening is mostprominent in autumn and drives the pattern of sea ice drift shown in Figure 5. A similar patternof sea-level pressure in the high-latitude southeast Pacific is exhibited by ENSO, which drives adipole pattern of opposing sea ice anomalies in the Bellingshausen–Weddell and Amundsen–RossSeas (Yuan 2004). Stammerjohn et al. (2008) showed that when the SAM is positive (and ASLgenerally deeper), the sea ice season is reduced in the eastern Bellingshausen Sea and longer inthe western Ross Sea, consistent with the pattern shown by the trends shown in Figure 3. TheSAM and ENSO can act in concert so that this pattern of variability is strongest when a positiveSAM is coupled with a La Nina. The pattern reverses when a negative SAM is coupled with an ElNino. These links are complicated by the distinct regional and seasonal variability in the SAM,ENSO, and the ASL and their connections with sea ice variability (Hobbs et al. 2016). Climatemodes with multidecadal variability and a tropical origin also affect sea ice variability, particularlyin the Pacific sector (e.g., Li et al. 2014).
While these links are compelling, trends in ice extent are not so easily explained by simpletrends in these climate modes. Simpkins et al. (2012) did not find any significant link between seaice trends and the SAM or ENSO, although the connections were stronger in winter. Kohyama& Hartmann (2016) showed that removing the linear response to climate modes such as the SAMand ENSO can remove much of the sea ice extent trends in some sectors, including the Ross Sea.But because these modes act differently in different areas, it is difficult to explain sea ice trendssolely with known modes of climate variability. Hobbs et al. (2016) showed clearly that whilevarious modes of climate variability affect sea ice variability, they do not fully explain the trends,especially in the Ross Sea.
Meehl et al. (2016) suggested that recent trends in sea ice extent in the Ross Sea are drivenby tropical Pacific variability acting through deepening of the ASL, and that trends in the SAMhave not contributed. This might explain recent increases in the Ross Sea that have contributed tothe recent emergence of a circumpolar positive trend but does not explain the much longer termtrend in the Ross Sea (Simpkins et al. 2012) (also Section 6).
By contrast, Kwok et al. (2016) demonstrated that as much as two-thirds of the winter trend inice edge position is explained by ENSO-driven trends in winds. This finding may be consistentwith other studies, as the regional ice edge trends do not coincide with the broader regions of iceconcentration or ice extent used in earlier studies.
5.2. The Changing Role of the Ocean
Arctic sea ice has historically been largely insulated from the impact of heat trapped beneath thesurface ocean (Section 2.2). While the vertical heat flux to the ice has in the past been very low,allowing very thick, old ice to grow, changes in ocean circulation and upper-ocean propertiesmay be changing this flux and contributing to the thinning of the ice cover. Most solar radiationabsorbed by the ocean in summer is used immediately to melt ice, but some may be trappedbeneath the surface as sea ice melt stratifies the upper ocean and inhibits mixing. This trapped heatis released later as winter cooling and brine released during freezing break down this stratification,and the heat mixes upward. As summer sea ice has declined in the Beaufort and Chukchi Seas,
www.annualreviews.org • Arctic and Antarctic Sea Ice Change 199
Ann
u. R
ev. M
ar. S
ci. 2
019.
11:1
87-2
13. D
ownl
oade
d fr
om w
ww
.ann
ualr
evie
ws.
org
by
Dr
John
Klin
ck o
n 01
/10/
19. F
or p
erso
nal u
se o
nly.
MA11CH09_Maksym ARI 2 November 2018 22:1
the amount of heat stored below the mixed layer in summer has increased and likely slowed icegrowth through the autumn and winter ( Jackson et al. 2012).
There has been a long-term warming of the Atlantic water in the Arctic Ocean (Polyakov et al.2012). While normally sea ice is insulated from this heat by the cold halocline layer, recent pulsesof more weakly stratified Atlantic water have been observed in the Eurasian Basin of the easternArctic (Polyakov et al. 2017). As the ice cover here has retreated, a negative sea ice feedbackcan occur during autumn freeze-up. Increased ice production in autumn drives stronger halineconvection that mixes up more heat from these pulses of warm water (Ivanov et al. 2016), inhibitingwinter ice growth. Modeling results suggest that future rapid ice loss events may be associatedwith increased pulses of ocean heat transport into the Arctic driven by atmospheric circulationvariability (Holland et al. 2006).
At the other side of the Arctic, enhanced inflow of warmer Pacific water through the BeringStrait in the 2000s (Woodgate 2018, Woodgate et al. 2012) has likely contributed to sea ice lossin the Canada Basin (e.g., Shimada et al. 2006). The drivers of this increased inflow include notonly local wind-driven variability but also far-field forcing that may have been driven by increasedanticyclonic circulation in a weaker, faster ice cover (Peralta-Ferriz & Woodgate 2017, Shimadaet al. 2006).
Although the dominant role of the ocean in observed sea ice decline is carried out directlythrough the ice–albedo feedback, there is now emerging evidence that changes in the ocean—possibly driven partly by the thinning and increased seasonality of the ice—may be acceleratingthe sea ice decline. The role that such ice–ocean interactions will have in the future is critical tounderstanding future Arctic change. (For further discussion on the role of the ocean in the Arctic,see Carmack et al. 2015.)
Because of the weak stratification of the Southern Ocean and high ocean heat flux (Martinson& Iannuzzi 1998), most sea ice variability attributed to ocean changes is due to changes in upper-ocean stratification. These changes can occur through a variety of mechanisms that freshen thesurface. Bintanja et al. (2013) suggested that increased ice shelf melt may have driven sea iceexpansion, though the pattern of sea ice change is not consistent with the regions of greatest melt(Swart & Fyfe 2013). Observed freshening in the Ross Sea since 1958 is consistent with increasedmelt from ice shelves upstream in the Amundsen Sea but may also be linked to changes in the SAM( Jacobs & Giulivi 2010). Liu & Curry (2010) argued that increased precipitation in a warmingclimate could drive stratification-driven changes in sea ice extent. Surface stratification changesmay also be achieved via increased northward transport of sea ice from where it forms in the southto where it melts to the north, creating a freshwater pump that favors ice expansion (Haumann et al.2016). Similarly, a positive ice-growth feedback can occur if vigorous winter ice growth drives thebrine released deep into the water column. Summer melt water is confined to a shallower layer,so if this saltier water is not reincorporated into the surface waters in subsequent winters withless vigorous growth, the surface will freshen, increasing stratification and reducing vertical oceanheat fluxes (Goosse & Zunz 2014). Lecomte et al. (2017) have suggested that this process mayhave contributed to increasing sea ice in the Ross Sea. Thus, ice–ocean interactions can provide apositive ice-growth feedback through either dynamics (increased northward advection of ice) orthermodynamics (increased winter ice growth). Zhang (2007) also suggested that a similar processcould occur in a warming climate, with increased ice melt driving increasing stratification.
An ice–albedo feedback also drives Southern Ocean sea ice variability. Increased solar heatingand warming of the upper ocean in response to sea ice decline has been suggested to drive furtherice retreat in the Antarctic Peninsula region (Meredith & King 2005). Stammerjohn et al. (2012)showed that a later autumn ice advance was strongly correlated with a previous earlier spring andsummer ice retreat, but a later autumn ice advance was not strongly correlated with a subsequent
200 Maksym
Ann
u. R
ev. M
ar. S
ci. 2
019.
11:1
87-2
13. D
ownl
oade
d fr
om w
ww
.ann
ualr
evie
ws.
org
by
Dr
John
Klin
ck o
n 01
/10/
19. F
or p
erso
nal u
se o
nly.
MA11CH09_Maksym ARI 2 November 2018 22:1
earlier spring and summer ice retreat. This finding suggests that enhanced solar heating of theocean due to a reduced ice cover delayed subsequent freeze-up, which is supported by connectionsbetween autumn ice production and spring ice reductions (Holland 2014).
As in the Arctic, these ice–ocean feedbacks result partly from wind-driven circulation changesthat can be displaced in time and space. Holland et al. (2017) showed that variability in zonalwinds and ice advection in spring favors decreased open water in the Ross Sea, which reducessummer warming of the ocean and thus favors an earlier autumn ice advance. These effects canexplain approximately 30% of the sea ice increase in the Ross Sea. Pope et al. (2017) showed thatthe impacts of ENSO forcing in the Ross Sea can produce anomalies that propagate temporallyand spatially into the Bellingshausen Sea. These nonlocal and noncontemporaneous links betweenatmospheric forcing and sea ice may help explain why the observed sea ice trends cannot be fullyexplained by simple linkages to trends in major modes of climate variability.
5.3. Arctic Amplification and Anthropogenic Forcing
One of the most striking features of predicted warming due to increasing atmospheric CO2
is the pronounced warming of the Arctic relative to the global average. Perhaps somewhatsurprisingly, no enhanced warming is seen in the Southern Ocean. This Arctic amplification (seethe sidebar titled Arctic Amplification) is both observed and a robust feature of current GCMs(Serreze & Barry 2011). The ice–albedo feedback clearly governs recent extreme summer seaice retreat episodes (Perovich et al. 2008) and is often considered the major contributor to Arcticamplification (Screen & Simmonds 2010). But recent work suggests that other processes in wintermay be as important in enhancing warming at the poles and sea ice decline. The most importantare surface temperature feedbacks that limit the amount of long-wave radiation lost to space for agiven warming. These feedbacks arise because colder Arctic surfaces are less efficient at sheddingincreased heat than surfaces at the warmer lower latitudes (Pithan & Mauritsen 2014). The stablestratification and strong surface inversion in the Arctic atmosphere traps most of the warmingnear the surface (Bintanja et al. 2011). Thus, sea ice changes that warm the near surface (e.g.,Screen & Simmonds 2010) are coupled with this radiative feedback, which tends to reduce winterice growth and further enhance warming.
Reduced sea ice also promotes increases in clouds and water vapor that increase the downwardradiative heating of the surface (Francis & Hunter 2006), but this may be predominantly duenot to a local feedback but rather to increasing transport of warm air from lower latitudes intothe Arctic (Cao et al. 2017). Moreover, estimates of the relative roles of the magnitudes of thesefeedbacks vary considerably, and the magnitudes themselves vary considerably among models
ARCTIC AMPLIFICATION
A robust feature of climate models that is consistent with observations is enhanced warming of the Arctic relativeto lower latitudes. This warming is most often associated with the ice–albedo feedback in autumn. As the ice coverretreats further in summer, this sea ice loss, subsequent release of heat to the atmosphere from the ocean duringautumn freeze-up, and resultant thinner ice cover through the winter and spring warms the atmosphere near the icesurface (Screen & Simmonds 2010). Other important feedbacks that limit radiative cooling of the ice cover, suchas increased humidity and cloud cover and a warming lower atmosphere, also contribute to Arctic amplification(for more details, see Serreze & Barry 2011). The term polar amplification has sometimes been used, but in bothobservations and modern climate models, there is little or no enhanced warming in the Southern Ocean, largelydue to effects of ocean circulation and limited summer sea ice cover.
www.annualreviews.org • Arctic and Antarctic Sea Ice Change 201
Ann
u. R
ev. M
ar. S
ci. 2
019.
11:1
87-2
13. D
ownl
oade
d fr
om w
ww
.ann
ualr
evie
ws.
org
by
Dr
John
Klin
ck o
n 01
/10/
19. F
or p
erso
nal u
se o
nly.
MA11CH09_Maksym ARI 2 November 2018 22:1
(Bintanja et al. 2011, Goosse et al. 2018, Pithan & Mauritsen 2014), so the impacts on Arctic andAntarctic warming and sea ice trends are uncertain.
The role of these feedbacks in the Antarctic has received less attention, but a recent reviewsuggested that most of them are smaller in the Antarctic (Goosse et al. 2018). Because of the lackof melt ponds on Antarctic sea ice and the limited summer ice extent, the ice–albedo feedbackmay be somewhat weaker in the Antarctic. More importantly, the lack of strong inversions overAntarctic sea ice limits the surface radiative feedback.
Perhaps the most important factor governing the differing response in the Arctic and Antarcticis the role of ocean heat uptake and ocean circulation. It has long been assumed that the delayedAntarctic warming was due to the ability of the Southern Ocean to act as a sink for ocean heat. Thisassumption is true to a degree, but it relies on the stored heat being efficiently transported awayto prevent sea ice loss and atmospheric warming. Armour et al. (2016) showed that wind-drivenupwelling south of the Antarctic Circumpolar Current brings unmodified deep waters to thesurface and drives equatorward transport of the warmed surface waters. This means that Antarcticwarming will be paced by the rate at which these deeper waters can be warmed and transportedfrom their source in the North Atlantic.
An important difference in the anthropogenic forcing in the Antarctic is the role of ozone deple-tion. The ozone hole acts to strengthen the SAM, cooling most of coastal Antarctica (Thompson& Solomon 2002). Turner et al. (2009) suggested that this effect would also deepen the ASL anddrive sea ice increases. This response is modulated by the ocean, with the initial response of coolingand ice expansion eventually giving way to warming and sea ice decrease as the increased westerliesdrive upwelling of warmer water (Ferreira et al. 2015). Thus, in the short term, anthropogenicwarming may be countered by the lingering effects of ozone depletion.
6. HISTORICAL VARIABILITY, TRENDS, AND PROJECTIONS
What are we to make of the observed trends and variability? We now have four decades ofconsistent observations of the Arctic and Antarctic ice cover, but evidence from models suggeststhat this time frame may not be long enough to discern a forced trend in Antarctic sea ice (Polvani& Smith 2013).
6.1. The Historical Perspective
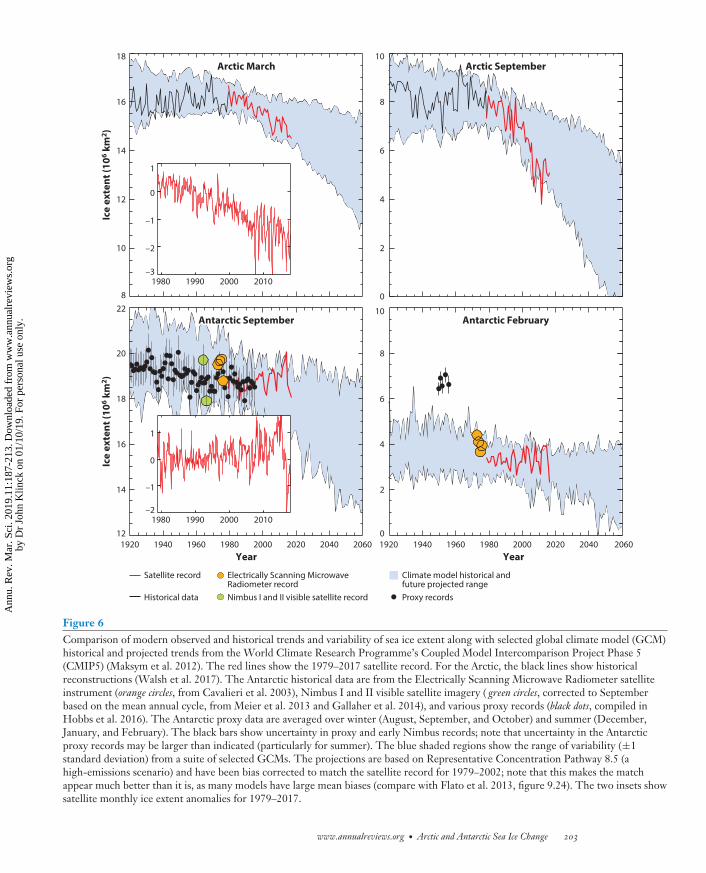
Figure 6 places the 1979–2017 satellite observations in a longer-term context with a variety ofhistorical records, along with a range of historical and projected sea ice extents from selectedGCM runs from the World Climate Research Programme’s Coupled Model IntercomparisonProject Phase 5 (CMIP5) (Maksym et al. 2012). In the Arctic, Walsh et al. (2017) produceda reconstruction from a variety of ice charts and ship-based observations going back to 1850.Because these data are sparse, particularly prior to the 1950s, the accuracy of the observationsfor pan-Arctic reconstruction is uncertain, but it is clear that the current trends in ice extent areanomalous over the last century, particularly in summer. September trends are historically lowfrom the 1990s onward, consistent with the emergence of human influence on the Arctic (Minet al. 2008).
In the Antarctic, observations are exceedingly sparse prior to the satellite record. There aresome data from other satellites from the 1960s and early 1970s, but prior to the 1960s, variousproxies must be used, including whaling records (de la Mare 2009) and glacial ice core proxies forice extent (e.g., Abram et al. 2010; for a description of the proxy records used in Figure 6, seeHobbs et al. 2016). These data suggest that the recent increase in ice extent may be a reversal of
202 Maksym
Ann
u. R
ev. M
ar. S
ci. 2
019.
11:1
87-2
13. D
ownl
oade
d fr
om w
ww
.ann
ualr
evie
ws.
org
by
Dr
John
Klin
ck o
n 01
/10/
19. F
or p
erso
nal u
se o
nly.
MA11CH09_Maksym ARI 2 November 2018 22:1
8
10
12
14
16
18
Ice
exte
nt (1
06 km
2 )
0
2
4
6
8
10
1920 19201940 1960 1980 2000 2020 2040 2060Year
12
14
16
18
20
22
Ice
exte
nt (1
06 km
2 )
1940 1960 1980 2000 2020 2040 2060Year
0
2
4
6
8
10
1980 1990 2000 2010–3
–2
–1
0
1
1980 1990 2000 2010–2
–1
0
1
Arctic March Arctic SeptemberArctic September
Antarctic SeptemberAntarctic September Antarctic February
Satellite record
Historical data
Electrically Scanning MicrowaveRadiometer recordNimbus I and II visible satellite record
Climate model historical andfuture projected rangeProxy records
Figure 6Comparison of modern observed and historical trends and variability of sea ice extent along with selected global climate model (GCM)historical and projected trends from the World Climate Research Programme’s Coupled Model Intercomparison Project Phase 5(CMIP5) (Maksym et al. 2012). The red lines show the 1979–2017 satellite record. For the Arctic, the black lines show historicalreconstructions (Walsh et al. 2017). The Antarctic historical data are from the Electrically Scanning Microwave Radiometer satelliteinstrument (orange circles, from Cavalieri et al. 2003), Nimbus I and II visible satellite imagery ( green circles, corrected to Septemberbased on the mean annual cycle, from Meier et al. 2013 and Gallaher et al. 2014), and various proxy records (black dots, compiled inHobbs et al. 2016). The Antarctic proxy data are averaged over winter (August, September, and October) and summer (December,January, and February). The black bars show uncertainty in proxy and early Nimbus records; note that uncertainty in the Antarcticproxy records may be larger than indicated (particularly for summer). The blue shaded regions show the range of variability (±1standard deviation) from a suite of selected GCMs. The projections are based on Representative Concentration Pathway 8.5 (ahigh-emissions scenario) and have been bias corrected to match the satellite record for 1979–2002; note that this makes the matchappear much better than it is, as many models have large mean biases (compare with Flato et al. 2013, figure 9.24). The two insets showsatellite monthly ice extent anomalies for 1979–2017.
www.annualreviews.org • Arctic and Antarctic Sea Ice Change 203
Ann
u. R
ev. M
ar. S
ci. 2
019.
11:1
87-2
13. D
ownl
oade
d fr
om w
ww
.ann
ualr
evie
ws.
org
by
Dr
John
Klin
ck o
n 01
/10/
19. F
or p
erso
nal u
se o
nly.
MA11CH09_Maksym ARI 2 November 2018 22:1
a previous decline, an idea that is supported by consistent multidecadal variations in sea ice, seasurface and air temperatures, and zonal winds (Fan et al. 2014). The shift in summer ice extent sincethe 1950s suggested by the whaling records may be spurious, as direct historical observations fromthe early 1900s indicate a more modest decline in extent of 14% (Edinburgh & Day 2016), whichis within the satellite summer ice extent variability. Regionally, there is ice core proxy evidencefor long-term positive trends since the mid-twentieth century in the Ross Sea (Thomas & Abram2016) and eastern Antarctic (Curran et al. 2003) and for negative trends in the Bellingshausen Sea(Abram et al. 2010).
6.2. Natural and Forced Variability: Can Models Capture These Trends?
Either Arctic sea ice is less sensitive to global warming in models than it is in reality, or thereis significant natural variability in sea ice extent that the models do not capture (Stroeve et al.2012a). Overland & Wang (2013) have used the recent observed steep trends to extrapolate thatan ice-free Arctic in summer is likely to occur much sooner (within a decade or two) than modelsproject (Boe et al. 2009). But how much of the discrepancy between recent trends and models isdue to inadequate representation of key processes, and how much is due to internal (i.e., natural)variability? Many studies have noted the internal variability in models, which is apparent fromthe variability seen between individual runs of the same model. For example, Kay et al. (2011)and Stroeve et al. (2012a) suggested that internal variability can explain as much as half of theobserved decline, although actually attributing the observed variability to this natural variabilityis more challenging. The recent dramatic summer ice loss and pause since 2007 (see Figure 6)have since sharpened the question of the role of natural variability. Swart (2015) showed that,while Arctic ice extent has decreased faster than most models predict, both the rapid decline from2001 to 2007 and the subsequent pause in sea ice decline fall within the envelope of individualmodel realizations (within both the range of different models and the range of an ensemble of runsfrom the same model), which suggests that simulated and observed Arctic sea ice trends are notinconsistent. Note, however, that while the decline from 2001 to 2007 could plausibly occur, theprobability is quite low in the models (5% or less), so this result does not rule out the possibilitythat the models are indeed not sensitive enough to anthropogenic forcing.
But is modeled natural variability actually representative of true natural variability, and is naturalvariability indeed responsible for a significant portion of the observed trend and variability? Dinget al. (2017) showed that changes in atmospheric circulation over the Arctic are strong drivers ofSeptember near-surface warming and responsible for up to 60% of Arctic sea ice loss since 1979.They also showed that greenhouse gas forcing drives only a modest amount of the circulationchange; hence, they suggested that approximately 40% of the September sea ice decline since1979 is due to internal variability, which is consistent with prior but unattributed estimates (e.g.,Kay et al. 2011, Stroeve et al. 2012a).
The mechanism here is interesting, as it is not low-level circulation driving changes in ice drift(as discussed in Sections 4 and 5) but rather upper-level circulation changes driving increases innear-surface warming, water vapor, and downwelling long-wave radiation, and hence providingthermodynamic forcing of the ice cover. As much as 50% of the circulation changes and warmingin the same area is linked to a negative trend in the North Atlantic Oscillation (related to theArctic Oscillation) that is driven by trends in tropical sea surface temperature. Here we see acommonality with the Antarctic, in that tropical forcing plausibly drives a significant amount ofthe natural sea ice variability, though causal links remain to be demonstrated.
If internal climate variability plays such a large role in recent Arctic sea ice trends, then thisfact would have implications for our ability to predict the future sea ice state. Model variability
204 Maksym
Ann
u. R
ev. M
ar. S
ci. 2
019.
11:1
87-2
13. D
ownl
oade
d fr
om w
ww
.ann
ualr
evie
ws.
org
by
Dr
John
Klin
ck o
n 01
/10/
19. F
or p
erso
nal u
se o
nly.
MA11CH09_Maksym ARI 2 November 2018 22:1
suggests that there is a two-decade uncertainty in any prediction of when a mostly ice-free Arcticmight occur ( Jahn et al. 2016).
The potential concurrence between models and observations does not on its own mean thatmodels simulate the Arctic properly. There is a large intermodal spread in simulated Arctic seaice extent (Massonnet et al. 2012) and significant model mean biases (Flato et al. 2013). Modelsalso poorly represent the thickness and spatial distribution of sea ice (Stroeve et al. 2014a), largelybecause of their poor representation of the atmospheric circulation that drives sea ice motion andhence thickness distribution. This poor representation is generally due to a displaced BeaufortHigh and inability to capture the Transpolar Drift Stream (Kwok 2011), but even models that dosimulate thickness distribution well do not necessarily capture these features (Stroeve et al. 2014a).Models also do not capture the observed acceleration of sea ice drift (Rampal et al. 2011). All ofthese issues raise concerns about the ability of climate models to realistically simulate Arctic seaice decline.
The fact that internal variability is a significant contributor to sea ice decline does not di-minish the central role of anthropogenic forcing in the disappearance of Arctic sea ice—there iswidespread evidence for the role of greenhouse gases in this respect (Flato et al. 2013, Notz &Marotzke 2012). Min et al. (2008) showed that the human impact on Arctic sea ice emerged inthe early 1990s. Historical evidence suggests that the decline of ice has been greater since the1990s than at any time in the historical record (i.e., since the mid-nineteenth century) (Figure 6).Other paleoclimate evidence suggests that the current Arctic warming (Kaufman et al. 2009) andsea ice decline (Kinnard et al. 2011) may be greater than at any time in the past millennium. Notz& Stroeve (2016) showed that Arctic sea ice area is strongly correlated with cumulative anthro-pogenic CO2 emissions and suggested that models underestimate the sea ice response to CO2
emissions.Climate models predict a much more muted response in the Antarctic (Figure 6), with an
approximately 30% decline in ice extent by the end of the century (Arzel et al. 2006, Bracegirdleet al. 2008), which is consistent with the reduced warming in the Antarctic. Ice volume is projectedto decrease at a similar rate to ice extent, in contrast to the rapid thinning predicted (and observed)in the Arctic (Arzel et al. 2006), which is expected because thicker ice thins more in response to awarming perturbation than thin ice (Bitz & Roe 2004).
The seasonal response in the Antarctic is notably the reverse of that in the Arctic. Modelspredict the greatest decline in winter and little to no decline in summer (Figure 6). These differentdeclines may be due partly to the geographic constraints imposed by the Antarctic continent onthe ice cover (Eisenman et al. 2011), but summer sea ice extent is poorly represented in mostmodels (Turner et al. 2013).
Overall, models do not capture key features of the Antarctic ice cover. Large biases in ice extentoccur in many models, and the interannual variability in models is much larger than the observedvariability (Maksym et al. 2012, Zunz et al. 2013). Models also do not capture the observed increasein ice extent (Maksym et al. 2012, Turner et al. 2013, Zunz et al. 2013) (Figure 6). Several studieshave, however, shown that the observed trends are within the range of natural variability in themodels (Polvani & Smith 2013). However, the negative trend in sea ice extent in most modelsover the modern period is a continuation of a decline originating from the mid-nineteenth century(Turner et al. 2013) (Figure 6), suggesting that the models cannot adequately capture the processesdriving sea ice extent over the past four decades. Notably, models do not adequately capture theASL, a major driver of Antarctic sea ice variability (Hosking et al. 2013).
As shown by the discussion in Section 3, the real story of Antarctic change is not the smallcircumpolar trend but the much larger, contrasting regional trends. Examining regional trends,Hobbs et al. (2016) showed that the observed trends fall within the model spread, with the exception
www.annualreviews.org • Arctic and Antarctic Sea Ice Change 205
Ann
u. R
ev. M
ar. S
ci. 2
019.
11:1
87-2
13. D
ownl
oade
d fr
om w
ww
.ann
ualr
evie
ws.
org
by
Dr
John
Klin
ck o
n 01
/10/
19. F
or p
erso
nal u
se o
nly.
MA11CH09_Maksym ARI 2 November 2018 22:1
of the western Ross Sea and the Bellingshausen Sea in summer and autumn—which, notably, aretwo of the regions of greatest change (Figure 6). Clearly, understanding the role of naturalvariability is key to improving model predictions of Antarctic sea ice.
6.3. Recent Variability: Is Further Change Imminent?
In the last few years, variability has increased in both hemispheres (insets in Figure 6). Extremesummer anomalies have occurred for several years in the Arctic, and extreme anomalies in wintertemperatures that affected ice extent and thickness occurred during the winters of 2014–2015and 2016–2017 due to increased intrusions of cyclones (Graham et al. 2017). These anomaliesculminated in the extreme warm autumn and record-low winter ice extent anomalies in 2016(Simpkins 2017), raising the question of whether human-induced change and reduced sea ice coverare now contributing to a greater frequency of warm, moist air intrusions that will accelerate thepace of Arctic change, particularly in winter.
In the Antarctic, recent variability has been even more dramatic. Three consecutive recordhighs in sea ice extent occurred from 2012 to 2014, but with different causes driving each (Reid& Massom 2015). These record highs were followed in 2016–2017 by a record-low anomaly inspring that rivaled those seen recently in the Arctic summer. As discussed in Section 2, these recentnegative anomalies in ice extent have been so large that the previously reported increasing trendsare mostly no longer statistically significant except in autumn. Stuecker et al. (2017) attributed thisrecord low to two unusual events: a strong El Nino in summer that drove sea surface temperatureanomalies, and a subsequent anomalously low SAM index that drove anomalous warming inNovember–December 2016. These recent events highlight the important role of both naturalvariability and climate feedbacks in driving future sea ice changes.
7. CONTRASTS AND COMMONALITIES
The changes in sea ice between the Arctic and Antarctic are a study in contrast: The Arctic hasexperienced dramatic and consistent losses of ice extent, thickness, and volume over the past severaldecades, while in the Antarctic the picture is one of regional and temporal variability. But thiscontrast can plausibly be attributed to an expected response due to both (a) the differing role ofvarious processes that are ultimately controlled by contrasts in geography and (b) the differing roleof key processes that drive an amplified response to anthropogenic forcing in the Arctic and a moremuted response overall in the Antarctic. But despite a growing understanding of how both forcedand natural variability is driving changes in both regions, current climate models cannot robustlycapture these changes, limiting our ability to project future changes on decadal timescales.
Given the contrasting changes in sea ice in the north and south, are there connections andcommonalities between the two? First, we have seen the important impact that modes of naturalvariability have on the ice cover at both poles. There is emerging evidence that ice extent in theArctic, as has been well established for the Antarctic, is governed partially by natural variabilitythat may originate from the tropics. Although this variability manifests differently at each poledue to differences in geography, evidence is emerging that wind-driven variability and oceanfeedbacks such as the ice–albedo feedback act in concert to drive sea ice trends. Moreover, as theArctic ice cover continues to shrink and thicker, multiyear ice continues to disappear, the Arcticis becoming more like the Antarctic. In 2012, for instance, the summer minimum extent in theArctic matched that in the Antarctic for the first time. The thinner Arctic ice is more dynamic, withmore fractures and changes in the role of deformation, increasing the fluxes of heat and moisturefrom the ocean. As open water fetch increases, the impact of waves and storms on the ice cover
206 Maksym
Ann
u. R
ev. M
ar. S
ci. 2
019.
11:1
87-2
13. D
ownl
oade
d fr
om w
ww
.ann
ualr
evie
ws.
org
by
Dr
John
Klin
ck o
n 01
/10/
19. F
or p
erso
nal u
se o
nly.
MA11CH09_Maksym ARI 2 November 2018 22:1
will become more important, and changes in ocean heat (through both insolation and increasedintrusion of subarctic waters into the Arctic Ocean) may enhance the ocean heat supplied to thebase of the ice. Furthermore, increased poleward heat and moisture transport in the Arctic maystrengthen linkages to lower-latitude modes of variability.
Despite an emerging understanding of the observed changes in the sea ice cover over thepast four decades, it is clear that the response of the ice to both forced and natural variabilityis governed by complex interactions and feedbacks among the atmosphere, ocean, and ice. Ourability to predict future changes in sea ice rests on improved understanding of the role of theseinteractions and feedbacks, particularly the role of natural variability. Many of these processes,such as ice–ocean interactions and feedbacks, are poorly observed. Improved understanding willrequire a sustained network of both satellite and in situ observations of these interactions as theice cover continues to change.
DISCLOSURE STATEMENT
The author is not aware of any affiliations, memberships, funding, or financial holdings that mightbe perceived as affecting the objectivity of this review.
ACKNOWLEDGMENTS
This work was supported by National Science Foundation grant OPP-1341513 and NASA grantNNX15AC69G. I would like to thank the following individuals for generously contributing dataused in this article: Ron Kwok for the Antarctic sea ice drift data and Figure 4, Francois Massonnetfor the Antarctic sea ice thickness reanalysis, Will Hobbs for the Antarctic sea ice extent proxydata, and Marika Holland and Julienne Stroeve for the CMIP5 model output.
LITERATURE CITED
Abram NJ, Thomas ER, McConnell JR, Mulvaney R, Bracegirdle TJ, et al. 2010. Ice core evidence for a 20thcentury decline of sea ice in the Bellingshausen Sea, Antarctica. J. Geophys. Res. Atmos. 115:D23101
Armour KC, Marshall J, Scott JR, Donohoe A, Newsom ER. 2016. Southern Ocean warming delayed bycircumpolar upwelling and equatorward transport. Nat. Geosci. 9:549–54
Arndt S, Willmes S, Dierking W, Nicolaus M. 2016. Timing and regional patterns of snowmelt on Antarcticsea ice from passive microwave satellite observations. J. Geophys. Res. Oceans 121:5916–30
Arzel O, Fichefet T, Goosse H. 2006. Sea ice evolution over the 20th and 21st centuries as simulated bycurrent AOGCMs. Ocean Model. 12:401–15
Bintanja R, Graversen RG, Hazeleger W. 2011. Arctic winter warming amplified by the thermal inversionand consequent low infrared cooling to space. Nat. Geosci. 4:758–61
Bintanja R, van Oldenborgh GJ, Drijfhout SS, Wouters B, Katsman CA. 2013. Important role for oceanwarming and increased ice-shelf melt in Antarctic sea-ice expansion. Nat. Geosci. 6:376–79
Bitz CM, Roe GH. 2004. A mechanism for the high rate of sea ice thinning in the Arctic Ocean. J. Clim.17:3623–32
Boe JL, Hall A, Qu X. 2009. September sea-ice cover in the Arctic Ocean projected to vanish by 2100. Nat.Geosci. 2:341–43
Bracegirdle TJ, Connolley WM, Turner J. 2008. Antarctic climate change over the twenty first century.J. Geophys. Res. Atmos. 113:D03103
Cao YF, Liang SL, Chen XN, He T, Wang DD, Cheng X. 2017. Enhanced wintertime greenhouse effectreinforcing Arctic amplification and initial sea-ice melting. Sci. Rep. 7:8462
Carmack E, Polyakov I, Padman L, Fer I, Hunke E, et al. 2015. Toward quantifying the increasing role ofoceanic heat in sea ice loss in the new Arctic. Bull. Am. Meteorol. Soc. 96:2079–105
www.annualreviews.org • Arctic and Antarctic Sea Ice Change 207
Ann
u. R
ev. M
ar. S
ci. 2
019.
11:1
87-2
13. D
ownl
oade
d fr
om w
ww
.ann
ualr
evie
ws.
org
by
Dr
John
Klin
ck o
n 01
/10/
19. F
or p
erso
nal u
se o
nly.
MA11CH09_Maksym ARI 2 November 2018 22:1
Cavalieri DJ, Parkinson CL. 2008. Antarctic sea ice variability and trends, 1979–2006. J. Geophys. Res. Oceans113:C07004
Cavalieri DJ, Parkinson CL, Vinnikov KY. 2003. 30-year satellite record reveals contrasting Arctic and Antarc-tic decadal sea ice variability. Geophys. Res. Lett. 30:1970
Comiso JC. 2017. Bootstrap sea ice concentrations from Nimbus-7 SMMR and DMSP SSM/I-SSMIS, version 3.Data Set NSIDC-0079, NASA Natl. Snow Ice Data Cent. Distrib. Act. Arch. Cent., Boulder, CO.Accessed July 2018. https://doi.org/10.5067/7Q8HCCWS4I0R
Comiso JC, Gersten RA, Stock LV, Turner J, Perez GJ, Cho K. 2017. Positive trend in the Antarctic sea icecover and associated changes in surface temperature. J. Clim. 30:2251–67
Comiso JC, Nishio F. 2008. Trends in the sea ice cover using enhanced and compatible AMSR-E, SSM/I,and SMMR data. J. Geophys. Res. Oceans 113:C02S07
Comiso JC, Parkinson CL, Gersten R, Stock L. 2008. Accelerated decline in the Arctic Sea ice cover. Geophys.Res. Lett. 35:L01703
Curran MAJ, van Ommen TD, Morgan VI, Phillips KL, Palmer AS. 2003. Ice core evidence for Antarctic seaice decline since the 1950s. Science 302:1203–6
de la Mare WK. 2009. Changes in Antarctic sea-ice extent from direct historical observations and whalingrecords. Clim. Change 92:461–93
Ding QH, Schweiger A, L’Heureux M, Battisti DS, Po-Chedley S, et al. 2017. Influence of high-latitudeatmospheric circulation changes on summertime Arctic sea ice. Nat. Clim. Change 7:289–95
Edinburgh T, Day JJ. 2016. Estimating the extent of Antarctic summer sea ice during the Heroic Age ofAntarctic Exploration. Cryosphere 10:2721–30
Eisenman I, Schneider T, Battisti DS, Bitz CM. 2011. Consistent changes in the sea ice seasonal cycle inresponse to global warming. J. Clim. 24:5325–35
Fan TT, Deser C, Schneider DP. 2014. Recent Antarctic sea ice trends in the context of Southern Oceansurface climate variations since 1950. Geophys. Res. Lett. 41:2419–26
Ferreira D, Marshall J, Bitz CM, Solomon S, Plumb A. 2015. Antarctic ocean and sea ice response to ozonedepletion: a two-time-scale problem. J. Clim. 28:1206–26
Fichefet T, Maqueda MAM. 1999. Modelling the influence of snow accumulation and snow-ice formation onthe seasonal cycle of the Antarctic sea-ice cover. Clim. Dyn. 15:251–68
Flato G, Marotzke J, Abiodun B, Braconnot P, Chou SC, et al. 2013. Evaluation of climate models. In ClimateChange 2013: The Physical Science Basis: Contribution of Working Group I to the Fifth Assessment Report of theIntergovernmental Panel on Climate Change, ed. TF Stocker, D Qin, G-K Plattner, M Tignor, SK Allen,et al., pp. 741–866. Cambridge, UK: Cambridge Univ. Press
Francis JA, Hunter E. 2006. New insight into the disappearing Arctic sea ice. Eos Trans. AGU 87:509–11Frey KE, Moore GWK, Cooper LW, Grebmeier JM. 2015. Divergent patterns of recent sea ice cover across
the Bering, Chukchi, and Beaufort seas of the Pacific Arctic Region. Prog. Oceanogr. 136:32–49Gallaher DW, Campbell GG, Meier WN. 2014. Anomalous variability in Antarctic sea ice extents during the
1960s with the use of Nimbus data. IEEE J. Sel. Top. Appl. Earth Obs. Remote Sens. 7:881–87Gong TT, Feldstein S, Lee S. 2017. The role of downward infrared radiation in the recent Arctic winter
warming trend. J. Clim. 30:4937–49Goosse H, Kay JE, Armour KC, Bodas-Salcedo A, Chepfer H, et al. 2018. Quantifying climate feedbacks in
polar regions. Nat. Commun. 9:1919Goosse H, Zunz V. 2014. Decadal trends in the Antarctic sea ice extent ultimately controlled by ice-ocean
feedback. Cryosphere 8:453–70Graham RM, Cohen L, Petty AA, Boisvert LN, Rinke A, et al. 2017. Increasing frequency and duration of
Arctic winter warming events. Geophys. Res. Lett. 44:6974–83Gregory JM, Stott PA, Cresswell DJ, Rayner NA, Gordon C, Sexton DMH. 2002. Recent and future changes
in Arctic sea ice simulated by the HadCM3 AOGCM. Geophys. Res. Lett. 29:28-1–4Haumann FA, Gruber N, Munnich M, Frenger I, Kern S. 2016. Sea-ice transport driving Southern Ocean
salinity and its recent trends. Nature 537:89–92Hobbs WR, Massom R, Stammerjohn SE, Reid P, Williams G, Meier W. 2016. A review of recent changes
in Southern Ocean sea ice, their drivers and forcings. Glob. Planet. Change 143:228–50
Holland MM. 2013. The great sea-ice dwindle. Nat. Geosci. 6:10–11Holland MM, Bitz CM, Tremblay B. 2006. Future abrupt reductions in the summer Arctic sea ice. Geophys.
Res. Lett. 33:L23503Holland MM, Landrum L, Raphael M, Stammerjohn SE. 2017. Springtime winds drive Ross Sea ice variability
and change in the following autumn. Nat. Commun. 8:731Holland PR. 2014. The seasonality of Antarctic sea ice trends. Geophys. Res. Lett. 41:4230–37Holland PR, Bruneau N, Enright C, Losch M, Kurtz NT, Kwok R. 2014. Modeled trends in Antarctic sea
ice thickness. J. Clim. 27:3784–801Holland PR, Kwok R. 2012. Wind-driven trends in Antarctic sea-ice drift. Nat. Geosci. 5:872–75Hosking JS, Orr A, Marshall GJ, Turner J, Phillips T. 2013. The influence of the Amundsen-Bellingshausen
Seas low on the climate of West Antarctica and its representation in coupled climate model simulations.J. Clim. 26:6633–48
Ivanov V, Alexeev V, Koldunov NV, Repina I, Sando AB, et al. 2016. Arctic Ocean heat impact on regionalice decay: a suggested positive feedback. J. Phys. Oceanogr. 46:1437–56
Ivanova N, Pedersen LT, Tonboe RT, Kern S, Heygster G, et al. 2015. Inter-comparison and evaluationof sea ice algorithms: towards further identification of challenges and optimal approach using passivemicrowave observations. Cryosphere 9:1797–817
Jackson JM, Williams WJ, Carmack EC. 2012. Winter sea-ice melt in the Canada Basin, Arctic Ocean. Geophys.Res. Lett. 39:L03603
Jacobs SS, Comiso JC. 1997. Climate variability in the Amundsen and Bellingshausen Seas. J. Clim. 10:697–709Jacobs SS, Giulivi CF. 2010. Large multidecadal salinity trends near the Pacific-Antarctic continental margin.
J. Clim. 23:4508–24Jahn A, Kay JE, Holland MM, Hall DM. 2016. How predictable is the timing of a summer ice-free Arctic?
Geophys. Res. Lett. 43:9113–20Jeffries MO, Krouse HR, Hurst-Cushing B, Maksym T. 2001. Snow-ice accretion and snow-cover depletion
on Antarctic first-year sea-ice floes. Ann. Glaciol. 33:51–60Kashiwase H, Ohshima KI, Nihashi S, Eicken H. 2017. Evidence for ice-ocean albedo feedback in the Arctic
Ocean shifting to a seasonal ice zone. Sci. Rep. 7:8170Kaufman DS, Schneider DP, McKay NP, Ammann CM, Bradley RS, et al. 2009. Recent warming reverses
long-term arctic cooling. Science 325:1236–39Kay JE, Holland MM, Jahn A. 2011. Inter-annual to multi-decadal Arctic sea ice extent trends in a warming
world. Geophys. Res. Lett. 38:L15708Kinnard C, Zdanowicz CM, Fisher DA, Isaksson E, de Vernal A, Thompson LG. 2011. Reconstructed changes
in Arctic sea ice over the past 1,450 years. Nature 479:509–12Kohout AL, Williams MJM, Dean SM, Meylan MH. 2014. Storm-induced sea-ice breakup and the implications
for ice extent. Nature 509:604–7Kohyama T, Hartmann DL. 2016. Antarctic sea ice response to weather and climate modes of variability.
J. Clim. 29:721–41Kwok R. 2011. Observational assessment of Arctic Ocean sea ice motion, export, and thickness in CMIP3
climate simulations. J. Geophys. Res. Oceans 116:C00D05Kwok R, Comiso JC, Lee T, Holland PR. 2016. Linked trends in the South Pacific sea ice edge and Southern
Oscillation Index. Geophys. Res. Lett. 43:10295–302Kwok R, Cunningham GF. 2015. Variability of Arctic sea ice thickness and volume from CryoSat-2. Philos.
Trans. R. Soc. A 373:20140157Kwok R, Cunningham GF, Wensnahan M, Rigor I, Zwally HJ, Yi D. 2009. Thinning and volume loss of the
Arctic Ocean sea ice cover: 2003–2008. J. Geophys. Res. Oceans 114:C07005Kwok R, Rothrock DA. 2009. Decline in Arctic sea ice thickness from submarine and ICESat records: 1958–
2008. Geophys. Res. Lett. 36:L15501Kwok R, Spreen G, Pang S. 2013. Arctic sea ice circulation and drift speed: decadal trends and ocean currents.
J. Geophys. Res. Oceans 118:2408–25Lecomte O, Goosse H, Fichefet T, de Lavergne C, Barthelemy A, Zunz V. 2017. Vertical ocean heat redis-
tribution sustaining sea-ice concentration trends in the Ross Sea. Nat. Commun. 8:258
www.annualreviews.org • Arctic and Antarctic Sea Ice Change 209
Ann
u. R
ev. M
ar. S
ci. 2
019.
11:1
87-2
13. D
ownl
oade
d fr
om w
ww
.ann
ualr
evie
ws.
org
by
Dr
John
Klin
ck o
n 01
/10/
19. F
or p
erso
nal u
se o
nly.
MA11CH09_Maksym ARI 2 November 2018 22:1
Lenton TM, Held H, Kriegler E, Hall JW, Lucht W, et al. 2008. Tipping elements in the Earth’s climatesystem. PNAS 105:1786–93
Li XL, Holland DM, Gerber EP, Yoo C. 2014. Impacts of the north and tropical Atlantic Ocean on theAntarctic Peninsula and sea ice. Nature 505:538–42
Liu JP, Curry JA. 2010. Accelerated warming of the Southern Ocean and its impacts on the hydrological cycleand sea ice. PNAS 107:14987–92
Maksym T, Markus T. 2008. Antarctic sea ice thickness and snow-to-ice conversion from atmospheric reanal-ysis and passive microwave snow depth. J. Geophys. Res. Oceans 113:C02S12
Maksym T, Stammerjohn SE, Ackley S, Massom R. 2012. Antarctic sea ice—a polar opposite? Oceanography25(3):140–51
Martinson DG. 2012. Antarctic circumpolar current’s role in the Antarctic ice system: an overview. Palaeogeogr.Palaeoclimatol. Palaeoecol. 335:71–74
Martinson DG, Iannuzzi RA. 1998. Antarctic ocean-ice interaction: implications from ocean bulk propertydistributions in the Weddell gyre. In Antarctic Sea Ice: Physical Processes, Interactions, and Variability, ed.MO Jeffries, pp. 243–71. Washington, DC: Am. Geophys. Union
Maslanik J, Stroeve J, Fowler C, Emery W. 2011. Distribution and trends in Arctic sea ice age through spring2011. Geophys. Res. Lett. 38:L13502
Maslowski W, Kinney JC, Higgins M, Roberts A. 2012. The future of Arctic sea ice. Annu. Rev. Earth Planet.Sci. 40:625–54
Massom RA, Stammerjohn SE, Smith RC, Pook MJ, Iannuzzi RA, et al. 2006. Extreme anomalous atmosphericcirculation in the West Antarctic Peninsula region in austral spring and summer 2001/02, and its profoundimpact on sea ice and biota. J. Clim. 19:3544–71
Massonnet F, Mathiot P, Fichefet T, Goosse H, Beatty CK, et al. 2013. A model reconstruction of the Antarcticsea ice thickness and volume changes over 1980–2008 using data assimilation. Ocean Model. 64:67–75
Matear RJ, O’Kane TJ, Risbey JS, Chamberlain M. 2015. Sources of heterogeneous variability and trends inAntarctic sea-ice. Nat. Commun. 6:8656
Maykut GA, Untersteiner N. 1971. Some results from a time-dependent thermodynamic model of sea ice.J. Geophys. Res. 76:1550–75
Meehl GA, Arblaster JM, Bitz CM, Chung CTY, Teng HY. 2016. Antarctic sea-ice expansion between 2000and 2014 driven by tropical Pacific decadal climate variability. Nat. Geosci. 9:590–95
Meier WN. 2017. Losing Arctic sea ice: observations of the recent decline and the long-term context. In SeaIce, ed. DN Thomas, pp. 290–303. Chichester, UK: Wiley & Sons
Meier WN, Gallaher D, Campbell GG. 2013. New estimates of Arctic and Antarctic sea ice extent duringSeptember 1964 from recovered Nimbus I satellite imagery. Cryosphere 7:699–705
Meier WN, Hovelsrud GK, van Oort BEH, Key JR, Kovacs KM, et al. 2014. Arctic sea ice in transformation:a review of recent observed changes and impacts on biology and human activity. Rev. Geophys. 52:185–217
Meredith MP, King JC. 2005. Rapid climate change in the ocean west of the Antarctic Peninsula during thesecond half of the 20th century. Geophys. Res. Lett. 32:L19604
Min SK, Zhang XB, Zwiers FW, Agnew T. 2008. Human influence on Arctic sea ice detectable from early1990s onwards. Geophys. Res. Lett. 35:L21701
Notz D, Marotzke J. 2012. Observations reveal external driver for Arctic sea-ice retreat. Geophys. Res. Lett.39:L08502
Notz D, Stroeve J. 2016. Observed Arctic sea-ice loss directly follows anthropogenic CO2 emission. Science354:747–50
Ogi M, Yamazaki K, Wallace JM. 2010. Influence of winter and summer surface wind anomalies on summerArctic sea ice extent. Geophys. Res. Lett. 37:L07701
Overland JE, Wang MY. 2013. When will the summer Arctic be nearly sea ice free? Geophys. Res. Lett.40:2097–101
Park HS, Lee S, Son SW, Feldstein SB, Kosaka Y. 2015. The impact of poleward moisture and sensible heatflux on Arctic winter sea ice variability. J. Clim. 28:5030–40
210 Maksym
Ann
u. R
ev. M
ar. S
ci. 2
019.
11:1
87-2
13. D
ownl
oade
d fr
om w
ww
.ann
ualr
evie
ws.
org
by
Dr
John
Klin
ck o
n 01
/10/
19. F
or p
erso
nal u
se o
nly.
MA11CH09_Maksym ARI 2 November 2018 22:1
Parkinson CL, Cavalieri DJ. 2008. Arctic sea ice variability and trends, 1979–2006. J. Geophys. Res. Oceans113:C07003
Parkinson CL, Comiso JC. 2013. On the 2012 record low Arctic sea ice cover: combined impact of precon-ditioning and an August storm. Geophys. Res. Lett. 40:1356–61
Peralta-Ferriz C, Woodgate RA. 2017. The dominant role of the East Siberian Sea in driving the oceanicflow through the Bering Strait—conclusions from GRACE ocean mass satellite data and in situ mooringobservations between 2002 and 2016. Geophys. Res. Lett. 44:11472–81
Perovich DK, Grenfell TC, Light B, Hobbs PV. 2002. Seasonal evolution of the albedo of multiyear Arcticsea ice. J. Geophys. Res. Oceans 107:8044
Perovich DK, Jones KF, Light B, Eicken H, Markus T, et al. 2011. Solar partitioning in a changing Arcticsea-ice cover. Ann. Glaciol. 52:192–96
Perovich DK, Polashenski C. 2012. Albedo evolution of seasonal Arctic sea ice. Geophys. Res. Lett. 39:L08501Perovich DK, Richter-Menge JA. 2015. Regional variability in sea ice melt in a changing Arctic. Philos. Trans.
R. Soc. A 373:20140165Perovich DK, Richter-Menge JA, Jones KF, Light B. 2008. Sunlight, water, and ice: extreme Arctic sea ice
melt during the summer of 2007. Geophys. Res. Lett. 35:L11501Pithan F, Mauritsen T. 2014. Arctic amplification dominated by temperature feedbacks in contemporary
climate models. Nat. Geosci. 7:181–84Polvani LM, Smith KL. 2013. Can natural variability explain observed Antarctic sea ice trends? New modeling
evidence from CMIP5. Geophys. Res. Lett. 40:3195–99Polyakov IV, Pnyushkov AV, Alkire MB, Ashik IM, Baumann TM, et al. 2017. Greater role for Atlantic inflows
on sea-ice loss in the Eurasian Basin of the Arctic Ocean. Science 356:285–91Polyakov IV, Pnyushkov AV, Timokhov LA. 2012. Warming of the intermediate Atlantic water of the Arctic
Ocean in the 2000s. J. Clim. 25:8362–70Pope JO, Holland PR, Orr A, Marshall GJ, Phillips T. 2017. The impacts of El Nino on the observed sea ice
budget of West Antarctica. Geophys. Res. Lett. 44:6200–8Rampal P, Weiss J, Dubois C, Campin JM. 2011. IPCC climate models do not capture Arctic sea ice drift
acceleration: consequences in terms of projected sea ice thinning and decline. J. Geophys. Res. Oceans116:C00D07
Raphael MN, Marshall GJ, Turner J, Fogt RL, Schneider D, et al. 2016. The Amundsen Sea low: variability,change, and impact on Antarctic climate. Bull. Am. Meteorol. Soc. 97:111–21
Reid P, Massom RA. 2015. Successive Antarctic sea ice extent records during 2012, 2013, and 2014. Bull. Am.Meteorol. Soc. 96(7):S163–64
Ricker R, Hendricks S, Girard-Ardhuin F, Kaleschke L, Lique C, et al. 2017. Satellite-observed drop of Arcticsea ice growth in winter 2015–2016. Geophys. Res. Lett. 44:3236–45
Rigor IG, Wallace JM. 2004. Variations in the age of Arctic sea-ice and summer sea-ice extent. Geophys. Res.Lett. 31:L09401
Rigor IG, Wallace JM, Colony RL. 2002. Response of sea ice to the Arctic oscillation. J. Clim. 15:2648–63Rothrock DA, Percival DB, Wensnahan M. 2008. The decline in Arctic sea-ice thickness: separating the
spatial, annual, and interannual variability in a quarter century of submarine data. J. Geophys. Res. Oceans113:C05003
Santer BD, Wigley TML, Gaffen DJ, Bengtsson L, Doutriaux C, et al. 2000. Interpreting differential tem-perature trends at the surface and in the lower troposphere. Science 287:1227–32
Screen JA, Simmonds I. 2010. The central role of diminishing sea ice in recent Arctic temperature amplification.Nature 464:1334–37
Serreze MC, Barrett AP. 2011. Characteristics of the Beaufort Sea High. J. Clim. 24:159–82Serreze MC, Barry RG. 2011. Processes and impacts of Arctic amplification: a research synthesis. Glob. Planet.
Change 77:85–96Shimada K, Kamoshida T, Itoh M, Nishino S, Carmack E, et al. 2006. Pacific Ocean inflow: influence on
catastrophic reduction of sea ice cover in the Arctic Ocean. Geophys. Res. Lett. 33:L08605Simmonds I. 2015. Comparing and contrasting the behaviour of Arctic and Antarctic sea ice over the 35 year
period 1979–2013. Ann. Glaciol. 56:18–28
www.annualreviews.org • Arctic and Antarctic Sea Ice Change 211
Ann
u. R
ev. M
ar. S
ci. 2
019.
11:1
87-2
13. D
ownl
oade
d fr
om w
ww
.ann
ualr
evie
ws.
org
by
Dr
John
Klin
ck o
n 01
/10/
19. F
or p
erso
nal u
se o
nly.
MA11CH09_Maksym ARI 2 November 2018 22:1
Simpkins GR. 2017. Extreme Arctic heat. Nat. Clim. Change 7:95Simpkins GR, Ciasto LM, England MH. 2013. Observed variations in multidecadal Antarctic sea ice trends
during 1979–2012. Geophys. Res. Lett. 40:3643–48Simpkins GR, Ciasto LM, Thompson DWJ, England MH. 2012. Seasonal relationships between large-scale
climate variability and Antarctic sea ice concentration. J. Clim. 25:5451–69Smedsrud LH, Halvorsen MH, Stroeve JC, Zhang R, Kloster K. 2017. Fram Strait sea ice export variability
and September Arctic sea ice extent over the last 80 years. Cryosphere 11:65–79Stammerjohn SE, Maksym T. 2017. Gaining (and losing) Antarctic sea ice: variability, trends and mechanisms.
In Sea Ice, ed. DN Thomas, pp. 261–89. Chichester, UK: Wiley & SonsStammerjohn SE, Martinson DG, Smith RC, Yuan X, Rind D. 2008. Trends in Antarctic annual sea ice retreat
and advance and their relation to El Nino-Southern Oscillation and Southern Annular Mode variability.J. Geophys. Res. Oceans 113:C03S90
Stammerjohn SE, Massom R, Rind D, Martinson D. 2012. Regions of rapid sea ice change: an inter-hemispheric seasonal comparison. Geophys. Res. Lett. 39:L06501
Steele M, Boyd T. 1998. Retreat of the cold halocline layer in the Arctic Ocean. J. Geophys. Res. Oceans103:10419–35
Stroeve JC, Barrett A, Serreze M, Schweiger A. 2014a. Using records from submarine, aircraft and satellitesto evaluate climate model simulations of Arctic sea ice thickness. Cryosphere 8:1839–54
Stroeve JC, Holland MM, Meier W, Scambos T, Serreze M. 2007. Arctic sea ice decline: faster than forecast.Geophys. Res. Lett. 34:L09501
Stroeve JC, Kattsov V, Barrett A, Serreze M, Pavlova T, et al. 2012a. Trends in Arctic sea ice extent fromCMIP5, CMIP3 and observations. Geophys. Res. Lett. 39:L16502
Stroeve JC, Markus T, Boisvert L, Miller J, Barrett A. 2014b. Changes in Arctic melt season and implicationsfor sea ice loss. Geophys. Res. Lett. 41:1216–25
Stroeve JC, Serreze MC, Holland MM, Kay JE, Malanik J, Barrett AP. 2012b. The Arctic’s rapidly shrinkingsea ice cover: a research synthesis. Clim. Change 110:1005–27
Stuecker MF, Bitz CM, Armour KC. 2017. Conditions leading to the unprecedented low Antarctic sea iceextent during the 2016 austral spring season. Geophys. Res. Lett. 44:9008–19
Swart NC. 2015. Influence of internal variability on Arctic sea-ice trends. Nat. Clim. Change 5:86–89Swart NC, Fyfe JC. 2013. The influence of recent Antarctic ice sheet retreat on simulated sea ice area trends.
Geophys. Res. Lett. 40:4328–32Thomas ER, Abram NJ. 2016. Ice core reconstruction of sea ice change in the Amundsen-Ross Seas since
1702 A.D. Geophys. Res. Lett. 43:5309–17Thompson DWJ, Solomon S. 2002. Interpretation of recent Southern Hemisphere climate change. Science
296:895–99Thompson DWJ, Solomon S, Kushner PJ, England MH, Grise KM, Karoly DJ. 2011. Signatures of the
Antarctic ozone hole in Southern Hemisphere surface climate change. Nat. Geosci. 4:741–49Thompson DWJ, Wallace JM. 1998. The Arctic Oscillation signature in the wintertime geopotential height
and temperature fields. Geophys. Res. Lett. 25:1297–300Tilling RL, Ridout A, Shepherd A, Wingham DJ. 2015. Increased Arctic sea ice volume after anomalously
low melting in 2013. Nat. Geosci. 8:643–46Tschudi M, Fowler C, Maslanik J, Stewart JS, Meier W. 2016a. EASE-grid sea ice age, version 3. Data Set
NSIDC-0611, NASA Natl. Snow Ice Data Cent. Distrib. Act. Arch. Cent., Boulder, CO. Accessed Jan.2018. https://doi.org/10.5067/PFSVFZA9Y85G
Tschudi M, Fowler C, Maslanik J, Stewart JS, Meier W. 2016b. Polar Pathfinder daily 25 km EASE-grid seaice motion vectors, version 3. Data Set NSIDC-0116, NASA Natl. Snow Ice Data Cent. Distrib. Act. Arch.Cent., Boulder, CO. Accessed Jan. 2018. https://doi.org/10.5067/O57VAIT2AYYY
Turner J, Bracegirdle TJ, Phillips T, Marshall GJ, Hosking JS. 2013. An initial assessment of Antarctic seaice extent in the CMIP5 models. J. Clim. 26:1473–84
Turner J, Comiso JC, Marshall GJ, Lachlan-Cope TA, Bracegirdle T, et al. 2009. Non-annular atmosphericcirculation change induced by stratospheric ozone depletion and its role in the recent increase of Antarcticsea ice extent. Geophys. Res. Lett. 36:L08502
Uotila P, Vihma T, Pezza AB, Simmonds I, Keay K, Lynch AH. 2011. Relationships between Antarcticcyclones and surface conditions as derived from high-resolution numerical weather prediction data.J. Geophys. Res. Atmos. 116:D07109
Walsh JE, Fetterer F, Scott SJ, Chapman WL. 2017. A database for depicting Arctic sea ice variations backto 1850. Geogr. Rev. 107:89–107
Wang J, Zhang JL, Watanabe E, Ikeda M, Mizobata K, et al. 2009. Is the Dipole Anomaly a major driver torecord lows in Arctic summer sea ice extent? Geophys. Res. Lett. 36:L05706
Watanabe E, Wang J, Sumi A, Hasumi H. 2006. Arctic dipole anomaly and its contribution to sea ice exportfrom the Arctic Ocean in the 20th century. Geophys. Res. Lett. 33:L23703
Webster MA, Rigor IG, Nghiem SV, Kurtz NT, Farrell SL, et al. 2014. Interdecadal changes in snow depthon Arctic sea ice. J. Geophys. Res. Oceans 119:5395–406
Williams G, Maksym T, Wilkinson J, Kunz C, Murphy C, et al. 2015. Thick and deformed Antarctic sea icemapped with autonomous underwater vehicles. Nat. Geosci. 8:61–67
Woodgate RA. 2018. Increases in the Pacific inflow to the Arctic from 1990 to 2015, and insights into seasonaltrends and driving mechanisms from year-round Bering Strait mooring data. Prog. Oceanogr. 160:124–54
Woodgate RA, Weingartner TJ, Lindsay R. 2012. Observed increases in Bering Strait oceanic fluxes from thePacific to the Arctic from 2001 to 2011 and their impacts on the Arctic Ocean water column. Geophys.Res. Lett. 39:L24603
Woods C, Caballero R. 2016. The role of moist intrusions in winter Arctic warming and sea ice decline.J. Clim. 29:4473–85
Worby AP, Geiger CA, Paget MJ, Van Woert ML, Ackley SF, DeLiberty TL. 2008. Thickness distributionof Antarctic sea ice. J. Geophys. Res. Oceans 113:C05S92
Yuan NM, Ding MH, Ludescher J, Bunde A. 2017. Increase of the Antarctic sea ice extent is highly significantonly in the Ross Sea. Sci. Rep. 7:41096
Yuan XJ. 2004. ENSO-related impacts on Antarctic sea ice: a synthesis of phenomenon and mechanisms.Antarct. Sci. 16:415–25
Zhang JL. 2007. Increasing Antarctic sea ice under warming atmospheric and oceanic conditions. J. Clim.20:2515–29
Zhang JL. 2014. Modeling the impact of wind intensification on Antarctic sea ice volume. J. Clim. 27:202–14Zunz V, Goosse H, Massonnet F. 2013. How does internal variability influence the ability of CMIP5 models
to reproduce the recent trend in Southern Ocean sea ice extent? Cryosphere 7:451–68
www.annualreviews.org • Arctic and Antarctic Sea Ice Change 213
Marine Metazoan Modern Mass Extinction: Improving Predictionsby Integrating Fossil, Modern, and Physiological DataPiero Calosi, Hollie M. Putnam, Richard J. Twitchett, and Fanny Vermandele � � � � � � � � 369
The Scientific Legacy of the CARIACO Ocean Time-Series ProgramFrank E. Muller-Karger, Yrene M. Astor, Claudia R. Benitez-Nelson,
Kristen N. Buck, Kent A. Fanning, Laura Lorenzoni, Enrique Montes,Digna T. Rueda-Roa, Mary I. Scranton, Eric Tappa, Gordon T. Taylor,Robert C. Thunell, Luis Troccoli, and Ramon Varela � � � � � � � � � � � � � � � � � � � � � � � � � � � � � � � � � � 413
The Formation and Distribution of Modern Ooids on GreatBahama BankPaul (Mitch) Harris, Mara R. Diaz, and Gregor P. Eberli � � � � � � � � � � � � � � � � � � � � � � � � � � � � � � 491
Errata
An online log of corrections to Annual Review of Marine Science articles may be found athttp://www.annualreviews.org/errata/marine