a Vision Science Program, Uni�ersity of California, Berkeley, CA 94720-2020, USAb Department of Psychology, Uni�ersity of California, Berkeley, CA 94720-2020, USA
Received 16 October 2000; received in revised form 30 January 2001
A primary function of the visual system is to estimatethe three-dimensional positions of objects in space. Thisestimation problem can be divided into two parts:estimating direction and estimating distance. Here, weconsider the problem of obtaining one estimate ofdirection for an object seen binocularly.
For a monocular observer, direction can bequantified by the azimuth and elevation (respectively,horizontal and vertical angles) of the retinal pointstimulated. There is a one-to-one mapping betweenspherical coordinates (�, �) of a retinal surface andperceived azimuth and elevation (a, e) (Hering, 1879).For a binocular observer, the mapping from retinal-im-age coordinates to perceived direction is more compli-cated. For every point in the left eye (�L, �L), there is a
point in the right eye (�R, �R) that is seen in the samedirection (apart from monocular portions of the visualfield). These pairs of points are corresponding points.From the retinal coordinates of corresponding pointsand an appropriate model of the eye’s optics, we cancalculate object locations that stimulate correspondingpoints. It is useful to know where corresponding objectlocations are because they are where fusion is easiest,stereoacuity is highest, and depth discrimination is best(Ogle, 1953; Blakemore, 1970; Krekling, 1974; West-heimer & McKee, 1978). It would be straightforward topredict these locations if corresponding points werefixed in retinal coordinates. The intersections of raystraced from corresponding retinal-image points out tothe external scene would be the predicted correspondingobject locations. Unfortunately, there are numerousreports that corresponding points are not fixed reti-nally. Clark (1936), Amigo (1965), Flom and Eskridge(1968), Shipley and Rawlings (1970b), Remole (1985),Robertson and Schor (1986), Kertesz and Lee (1987),
J.M. Hillis, M.S. Banks / Vision Research 41 (2001) 2457–24732458
and Fogt and Jones (1998a,b) all concluded that theretinal positions of corresponding points shift withhorizontal vergence. In this paper, we re-examine thestability of corresponding retinal points.
1.1. Corresponding points and the horopter: mappingbetween spatial and retinal-image coordinates
To determine if corresponding retinal points arefixed, one would ideally stimulate candidate retinalpoints directly without going through the eyes’ optics.
Because this is not possible, the positions of a pair ofcorresponding points have to be determined by findingthe points in space that give rise to the same perceiveddirections in both eyes. The locations of such pointsdefine the empirical horopter. This horopter containsthe fixation point and object points located by experi-mental measurement. If the angle subtended by eachobject point and the fixation point is the same in botheyes, the horopter is the Vieth–Muller Circle. TheVieth–Muller Circle is shown in the upper panel of Fig.1; it is the circle containing the fixation point and thetwo eyes’ optical centers. The empirical horopter andVieth–Muller Circle lie in the visual plane that weassume projects to the horizontal meridians of the twoeyes. The empirical horopter typically deviates from theVieth–Muller Circle (Ames, Ogle, & Gliddon, 1932b;Shipley & Rawlings, 1970a,b) in the fashion depicted inFig. 1: with increasing azimuth, object points thatstimulate corresponding points lie increasingly fartherbehind the Circle. This deviation suggests that corre-sponding points along the horizontal meridians do nothave the same retinal-image coordinates.
We can quantify the difference between the empiricalhoropter and Vieth–Muller Circle by plotting disparityas a function of azimuth (Shipley & Rawlings, 1970a,b).Alternatively, one can use conic sections to fit theempirical data and then quantify the deviation betweenthe empirical and geometric horopters with:
H=cot(�R)−Lcot(�L) (1)
where �L and �R refer to azimuths with vertices at theleft and right eyes, respectively (Ogle, 1932).1 L is askew factor and is related to the magnification of oneeye’s image relative to the other eye’s. Measurements ofcorresponding points in normal observers show thatdisparity increases as a function of absolute azimuthand, therefore, that H is greater than 0. Equivalently,the empirical horopter is less concave than the Vieth–Muller Circle (Fig. 1).
Once we measure the empirical horopter, the retinalcoordinates of corresponding points can be determinedby tracing rays from horopter points onto the retinas.Obviously, one needs an appropriate model of the eyes’optics to do the ray tracing.
Many investigators (Ames et al., 1932b; Shipley &Rawlings, 1970a,b; Fogt & Jones, 1998b) have reportedchanges in the empirical horopter with changes in view-ing distance. These changes suggest that the positionsof corresponding retinal points shift (e.g. Amigo, 1965).The empirical evidence and theoretical discussions can
Fig. 1. Geometric and empirical horopters. The upper and lowerpanels are overhead views of a binocular observer fixating point, F.The foveas are represented by fL and fR. A second point, P, posi-tioned to the left of the fixation point, creates the horizontal angles �L
and �R. The disparity of P relative to F is �L–�R. The disparity in theupper panel is zero (�L=�R), so P lies on the Vieth–Muller Circle (acircle running through the fixation point and the optical centers of thetwo eyes). The disparity in the lower panel is positive (�L��R), so Plies on an ellipse (that runs through the fixation point and the eyes’optical centers).
1 This equation differs from Ogle’s because we use the conventionthat positive angles are counter-clockwise.
J.M. Hillis, M.S. Banks / Vision Research 41 (2001) 2457–2473 2459
Fig. 2. Flattening and local shift hypotheses. The upper panels depict the flattening hypothesis. The foveas, FL and FR, are fixating a point inspace. With near and far viewing, corresponding points cL and cR are stimulated by object points on the horopter labeled H=0.4 (black line).With near viewing (left upper), that horopter is reasonably flat. With far viewing (right upper), the horopter associated with H=0.4 is convex.To obtain a horopter with the same shape as the flat one at near view, H would have to decrease to a value of �0.3. Similarly, correspondingpoints cL and cR would have to shift to retinal positions cL� and cR� . The lower panels depict the local shift hypothesis. Again, the foveas, FL andFR, are fixating a point in space. The horopter for H=0.3 is indicated by the dashed gray line. According to the local shift hypothesis, a shiftin correspondence occurs in one direction with near viewing and in the opposite direction with far viewing. With near viewing (left lower panel),the corresponding point for FL, the fovea of the left eye, shifts temporally in the right eye to fR� and a similar shift occurs for the correspondingpoint for FR, the fovea of the right eye. As a consequence, the horopter bows inward toward the intended fixation point as indicated by thesolid-line curve. With far viewing (right lower panel), the opposite shifts occur, so the horopter bows outward toward the intended fixation point.
be categorized into two specific claims: the flatteninghypothesis and the local shift hypothesis.
The flattening hypothesis states that the disparitybetween corresponding points increases with decreasedviewing distance. If true, the change in the disparity ofcorresponding points would yield a flatter horopteracross a range of viewing distances than fixed corre-sponding points. There might be an advantage to suchflattening because it would make flat surfaces easier tofuse.
Predictions for the flattening hypothesis are illustratedin the upper panels of Fig. 2. The solid lines representthe horopter when H=0.4 and the dashed lines thehoropter when H=0.3. The left and right panels showthose horopters for near and far viewing, respectively.The hypothesis predicts that H decreases as viewingdistance increases. This implies that corresponding reti-nal points cL and cR, measured at a near viewing distance,shift to cL� and cR� at a far viewing distance. These shifts,if they were appropriate for the viewing distance, wouldmake the horopter flatter at all viewing distances than itwould be if corresponding points did not shift.
The predictions are plotted in terms of disparity as afunction of azimuth in the upper panel of Fig. 3. Thehorizontal line at 0 disparity is the Vieth–Muller Circle.If corresponding points were fixed, the disparity patternwould be the same for all viewing distances. The flat-tening hypothesis predicts that disparities increase as afunction of azimuth more rapidly as the observer fixatescloser; the three curves show such a change withfixation.
Ames et al. (1932b) measured the horopter at differ-ent fixation distances. Fig. 4 shows the results. Theupper panel plots disparity as a function of azimuth,and the lower panel plots H as a function of fixationdistance. As predicted by the flattening hypothesis, Hdecreases, and the disparity between correspondingpoints decreases with increased viewing distance. Ship-ley and Rawlings (1970b) reported similar results.
The local shift hypothesis states that correspondingpoints shift in and near the foveas. The shifts yieldpartial compensation for fixation disparity and therebyaid fusion near fixation. Predictions for this hypothesisare illustrated in the lower panels of Fig. 2. The dashed
J.M. Hillis, M.S. Banks / Vision Research 41 (2001) 2457–24732460
visual lines that intersect on the Vieth–Muller Circlerepresent the visual axes (lines from the anatomicalfoveas out through the eyes’ optical centers). The solidlines represent visual lines from the attempted fixationtarget though the eyes’ optical centers. The dashedcurves show the shape of the horopter for a fixed set ofcorresponding points. In the lower left panel (nearviewing), the eyes are converged behind the attemptedtarget, and in the lower right (far viewing), they areconverged in front of the attempted target. The dispar-ity between the solid and dashed lines is the fixationdisparity. The local shift hypothesis predicts that corre-sponding points FL and FR (the anatomical foveas) shiftto fL� and fR� when the observer attempts to look at anear or distant target. With near viewing, the point inthe right eye that corresponds with the fovea in the lefteye shifts temporally on the retina (and the point in theleft eye corresponding with the right eye’s fovea alsoshifts temporally). With far viewing, the reverse occurs.Points near the fovea also undergo shifts, but they aresmaller. By �1.5° retinal eccentricity, no shifts occur(Fogt & Jones, 1998b). The predicted horopters arerepresented by the solid curves.
Fig. 4. Horopter data of Ames et al. (1932b). Upper panel: Disparityof the horopter settings is plotted as a function of azimuth. Differentsymbols represent data collected at different fixation distances. Adisparity of zero (indicated by the horizontal line) corresponds withsettings on the Vieth–Muller Circle (Fig. 1). Disparities greater thanzero correspond with settings behind the Vieth–Muller Circle. Lowerpanel: H values as a function of distance. Different symbols representdata collected from different observers.
Fig. 3. Disparity of points on the empirical horopter as a function ofazimuth according to the flattening and local shift hypotheses. Theupper panel shows the predicted change in disparity for the flatteninghypothesis. As vergence increases (distance decreases), the H valueassociated with the horopter increases as shown (near=solid line;average= long dashed line; far=short dashed line). The lower panelshows the predicted change for the local shift hypothesis. With nearviewing, the horopter bows inward (Fig. 2), so the disparity near theshifted foveas approaches zero (with respect to the intended fixationpoint). With far viewing, the horopter bows outward (Fig. 2), so thedisparity near the shifted foveas again approaches zero.
The predictions of the local shift hypothesis can alsobe represented as changes in disparity as a function ofazimuth. The lower panel of Fig. 3 shows the predicteddisparity changes at near, medium, and far fixationdistances.
The main claim of the local shift hypothesis is re-markable, so it is worth emphasizing its consequences.According to Hering’s Laws of perceived visual direc-tion, when the eyes are symmetrically converged at anydistance, stimulation of the foveas (FL and FR) yields asingle percept that is straight ahead. The local shifthypothesis violates Hering’s Laws. Specifically, it claimsthat stimulation of the foveas when the eyes are sym-metrically converged at a very near distance yields thepercept of two different directions, one for each eye. Anobject would actually have to stimulate non-fovealpoints ( fL� and fR� ) to be perceived in the same directionby both eyes.
The evidence for local correspondence shifts comesfrom comparisons of the objective and subjective mea-surements of eye position (Robertson & Schor, 1986;Kertesz & Lee, 1987; Fogt & Jones, 1998a,b). Forexample, Fogt and Jones (1998a) reported that objec-tive measurements of vergence differed from subjectivemeasurements by as much as 40 arcmin when theobserver attempted to fixate a very near target and 50
J.M. Hillis, M.S. Banks / Vision Research 41 (2001) 2457–2473 2461
arcmin when the observer attempted to fixate a veryfar target.
There are two ways to explain the global and localshifts reported in studies of corresponding points. (1)The neural explanation : with changes in fixation dis-tance, the neural mapping between retinal surface co-ordinates and perceived direction changes. This is theexplanation adopted by Amigo (1965), Flom and Es-kridge (1968), Jones (1974), Nelson (1977), Remole(1985), Robertson and Schor (1986), Kertesz and Lee(1987), and Fogt and Jones (1998a,b). (2) The opticalexplanation : with changes in fixation distance, the op-tical mapping between object space and retinal-surfacecoordinates changes and not the mapping betweenretinal coordinates and perceived direction. This is theexplanation given by Ames et al. (1932b), Ogle (1950),Bourdy (1972), Miles (1975), and Reading (1980).
To determine whether the apparent change in corre-sponding points is neural or optical in origin, onerequires an appropriate model of the optical mappingbetween object points and retinal-image points. Previ-ous work has assumed a model eye with an opticalcenter at a fixed position relative to the center of eyerotation (Ames, Ogle, & Gliddon, 1932a; Ames et al.,1932b; von Tschermak, 1942; Fogt & Jones, 1998a,b;Amigo, 1965). Using this assumption, correspondingretinal points appear to change with viewing distance.For example, consider the data in Fig. 4. The anglesused to determine disparity—�L–�R—were measuredwith vertices at fixed nodal point positions (Ames etal., 1932a,b). Furthermore, the disparity calculationsassumed that the eyes were verged accurately duringthe experimental measurements.
We next examine how the assumptions of a fixedoptical center and accurate fixation affect the interpre-tation of horopter data.
1.2. Changes in positions of the nodal points
If we know the positions of the eyes’ nodal points,we can map positions of points in space into retinalcoordinates. The human eye has a primary and sec-ondary nodal point. A ray passing through the pri-mary nodal point exits from the secondary point atthe same angle relative to the optical axis. Tracingthese rays yields an accurate mapping from objectpoints into retinal coordinates.
In most horopter experiments, including the Ameset al. (1932b) experiment, observers set rods in spaceuntil the parts seen by the left and right eyes ap-peared in the same direction. The rod settings are,therefore, defined in head-centered coordinates. Toconvert from these coordinates into retinal coordi-nates, we need to know the head-centered coordinatesof the primary and secondary nodal points and thehead-centered coordinates of retinal surface points.
Unfortunately, nodal-point positions in head-centeredcoordinates change with eye rotation and accommo-dation (and retinal positions change with eye posi-tion).
With eye rotation, the nodal points translate rela-tive to the head because the nodal points are in frontof the eyes’ centers of rotation. Fig. 5A illustrates thiseffect. For simplicity, the primary and secondarynodal points are represented by one point. The upperand lower panels show nodal-point positions for farand near viewing, respectively. Notice that nodalpoints translate nasally with convergence. By changingthe head-centered positions of the nodal points, eyerotations change the ray tracing from object points toretinal points. This effect must be eliminated or takeninto account in order to determine the retinal posi-tions of corresponding points from horopter data.
With accommodation, the positions of the nodalpoints shift toward and away from the cornea, andthis has a small effect on the ray tracing from objectpoints to retinal coordinates. This is illustrated in Fig.5B. With the positive accommodation associated withnear viewing (right half of panel), the primary andsecondary nodal points move toward the cornea alongthe optical axis (the distance between them also in-creases slightly).2 The shift toward the cornea causes avery small change in the optical projection from ob-ject to retinal points. For example, the largest changein disparity induced by a 10-diopter change in accom-modation would be 1.1 arcsec at an azimuth of 6 deg;smaller changes would occur at smaller azimuths.3 Be-cause the effect is so small, we can ignore it for thepurposes of this paper.
1.3. Fixation error
Binocular fixation is typically not completely accu-rate, particularly at near and far fixation distances(Ames & Gliddon, 1928; Clark, 1936; Ogle, 1950;Hebbard, 1962). Observers tend to fixate nearer thandistant fixation targets and farther than near ones. Ifsuch fixation errors are not eliminated or taken intoaccount, the disparity of horopter settings (Fig. 4) willbe misestimated. Fig. 6 shows how fixation errors canconfound the interpretation of horopter data. The ob-server is converged behind the fixation target (under-
2 The right panel of Fig. 5B shows that the size of the image isincreased slightly with positive accommodation. A point in space, �°,from the visual axis stimulates the retinal surface coordinate, afar,when accommodation is minimal. With positive accommodation, theimage of the point at �° from the visual axis stimulates the retinalsurface coordinate anear.
3 Image position shifts by about 0.96 arcmin. The shift is in thesame direction in both eyes, so the change in disparity due toaccommodation is very small.
J.M. Hillis, M.S. Banks / Vision Research 41 (2001) 2457–24732462
Fig. 5. Effect of eye rotation and accommodation on the optical projection from object points to retinal-image points. (A) Effect of eye rotation.The upper and lower parts are overhead views of the binocular viewing situation. The centers of rotation are represented by white dots. The nodalpoints (a single point is used to represent the primary and secondary points) for the depicted viewing situation are represented by black dots. Theoptical and visual axes are represented by black and gray lines, respectively. The foveas are represented by the gray dots labeled f. The upper partof the panel shows the positions of these points at a long viewing distance. The lower part shows the positions at a near viewing distance; thegray dots labeled ‘far nodal points’ represent the positions of the nodal points in the upper part of the figure. The nodal points translate nasallyin head-centered coordinates when the eyes converge. (B) Effect of accommodation. The dots and lines represent the same things as in panel Awith the following exceptions. The single nodal point is now replaced by primary and secondary nodal points that are represented by a pair ofblack dots. � represents a fixed horizontal angle between the visual axis and a ray projected from the eye. With far viewing (left part of panel),� projects to position afar on the retina. With near viewing (right part of panel), � now projects to position anear, which is shifted temporallyrelative to afar. Thus, the same angle in space projects to a slightly different retinal position as the accommodative state of the eye changes.
converged). If the experimenter assumes the observer isfixating the fixation point, the measurements of theangles to horopter points will be incorrect. In thedepicted case, the resulting error in the estimated dispar-ity between corresponding points would be �L+�R. Twotypes of fixation error may have affected the interpreta-tion of previous horopter data: static and transienterrors. Static errors occur when the observer systemati-cally fixates farther or nearer than the fixation target.Transient errors occur when the observer shifts eyeposition during an experimental measurement. Transienterrors could have easily occurred in many of the previousexperiments. For example, the observers in the Ames etal. (1932b) study were instructed to maintain fixation ona central point while making fine adjustments of avertical rod presented in the retinal periphery. It seemslikely that observers would have occasionally madesaccades in the direction of the peripheral rod whilemaking those settings.
1.4. The current project
We measured the horopter using techniques thatcircumvented the above-mentioned problems. Fromthese data, we can determine if corresponding retinalpoints shift as a function of fixation distance.
2. Experiment 1
2.1. Subjects
Three observers participated. Two were aware of theexperimental hypotheses, and one was not. All three hadnormal stereopsis and did not manifest eye misalignmentin normal viewing situations.
2.2. Apparatus
2.2.1. Eliminating the effect of nodal point translationduring �ergence
The stimuli were displayed on a haploscope with twomirrors (one for each eye) and two CRTs (one for eacheye) (for details, see Backus, Banks, van Ee, & Crowell,1999). Each mirror and CRT was attached to an arma-ture that rotated about a vertical axis passing through theeye’s center of rotation. With this arrangement, the eyeand haploscope arm rotate on a common axis, so whenwe change the vergence distance, the mapping betweenthe stimulus array and the retina is unaltered (for fixedaccommodation). Thus, the retinal images are unaffectedby a change in the vergence of the fixation target. Theupper and lower panels of Fig. 7 show the arm positionsfor a long and a near fixation distance, respectively.
J.M. Hillis, M.S. Banks / Vision Research 41 (2001) 2457–2473 2463
2.2.2. Positioning the eyesFor the haploscope arrangement to achieve the de-
sired result, the rotation axes of the haploscope armsand eyes must be co-linear. To assure that they were,we used a sighting technique. The sighting apparatushad two pairs of sight lines (Fig. 8). Each sight lineconsisted of two sighting targets: an aperture and asmall target. One pair of sight lines—one line for eacheye—was rotated clockwise so the observer had to lookright to sight down them. The other pair was rotatedcounter-clockwise so the observer looked left to sightdown them. The distance between the left- and right-eye sight lines was set equal to the observer’s inter-ocu-lar distance. With this arrangement, the sight linesintersect in two spatial positions that are an inter-ocu-lar distance apart. The trick is to get the eyes’ centers ofrotation to those intersection points.
The observer’s bite bar was mounted on a stand thatcould translate in three orthogonal directions and ro-tate about three orthogonal axes. The observer wastranslated and rotated until he reported alignment of all
Fig. 7. Haploscope and projection of the stimuli to the two eyes at farand near fixation distances. The eyes’ rotation centers are representedby the white dots and the nodal points by black dots. The haploscopearms each contain a mirror and a CRT that rotate as a rigid unitabout an axis through the eye’s center of rotation. The upper andlower panels show three nodal rays in each eye for far and nearfixation distances, respectively. The far ends of the rays correspond tolocations on the CRTs. Notice that the rays project to the sameretinal points for all fixation distances (assuming no accommodationand accurate fixation).
Fig. 6. Errors in assumed vergence affect the interpretation ofhoropter data. The observer attempts to fixate F, but is actuallydirecting the visual axes toward point I. Point P is on the horopter(with fixation on I). The angles between the visual axes (the linesthrough I) and the visual lines to P are �L and �R for the left andright eyes, respectively. If the experimenter assumes that the eyes aredirected toward F, the estimated angles will be �L+�L and �R+�R
where �L and �R are the errors in assumed directions of the visual axesof the left and right eyes, respectively. The resulting error in thedisparity estimate is �L+�R.
four sight lines. That head position places the eyes’rotation centers at the intersections of the sight lines.Once the head was in the correct position, we lockedthe bite bar mount. The locked mount was then used toposition the observer precisely in the haploscope duringexperimental sessions.
2.2.3. Spatial calibrationThe stimuli consisted of lines and dots. The line and
dot positions in our displays were specified to within20–30 arcsec. To achieve such high spatial precision,we used anti-aliasing and a spatial calibration proce-dure. Each texture element in our stimuli was a dotcomposed of four pixels (2×2). For anti-aliasing, theintensities of the four pixels were adjusted to place thedot’s apparent center at the desired location (takinginto account adjacent pixel non-linearities, Klein, Hu,& Carney, 1996). To implement spatial calibration, anobserver, correctly positioned in the haploscope, per-ceptually aligned dots on the screen with the intersec-tions of a planar grid positioned just in front of thescreen. From the resulting settings, we constructed a
J.M. Hillis, M.S. Banks / Vision Research 41 (2001) 2457–24732464
look-up table that converted the desired x–y positionon the grid plane into screen coordinates (Backus et al.,1999).
2.2.4. Pinhole pupilsThe distance from the eye to the CRT was fixed at 39
cm, so the accommodative stimulus was fixed at 2.6diopters. Of course, vergence can also stimulate accom-modation. In pilot work, the observers were hyperopi-cally focused with respect to the CRTs in the 172 cmvergence condition and myopically focused in the 19 cmvergence condition. The resulting blur made the Noniustask difficult to perform. To circumvent this problem,we placed pinholes on the two corneas. The pinholesallowed the observers to see the test lines clearly so theycould perform the task with high precision. Observerswore opaque contact lenses with a central aperture1.7–1.8 mm in diameter. The lenses were Alden HPSoft Contact Lenses with a power of 0 diopters.
2.3. Stimuli
It was important to hold fixation stable, so we used aspecially designed fixation stimulus (Fig. 9). The large
Fig. 9. Schematic of the fixation and test stimuli used in Experiment1. The central fixation target consisted of a binocular dot (the pointobservers were instructed to fixate) surrounded by dichoptic Noniuslines 0.5 deg in length. The observer used the perceived alignment ofthe dichoptic Nonius lines to assess the accuracy of fixation. Thelarge propeller pattern surrounding the central target consisted of sixbinocular lines 12.4 deg in length and was used to help maintainaccurate fixation on the central target. The test stimuli consisted ofdichoptic Nonius lines, one presented just above the visual plane andthe other just below it. The length of these lines and the verticalseparation between them varied with retinal eccentricity. Observersindicated whether the upper line appeared to be to the left or right ofthe lower line. The upper line was presented to the left eye half thetime and to the right eye the other half.
Fig. 8. Schematic of the sighting device used to position the observer.There are four sight lines. Each sight line contains a near apertureand a far point viewed through the aperture. The observer looksleftward to sight down two of the sight lines (represented by graylines) and rightward to sight down the other two (black lines). Theleft and right pairs are separated by the observer’s inter-pupillarydistance (IPD). Two sight lines (the left gray and left black lines)intersect at one point and the other two (right gray and right black)intersect at a second point. We position the observer such that theeyes’ centers of rotation are coincident with the intersections.
propeller pattern and central fixation dot were binocu-lar. The small propeller pattern surrounding the centraldot was dichoptic. The top was presented to the left eyeand the bottom to the right. The fixation pattern pro-duced stable fixation near the desired plane. The fixa-tion target was always presented straight ahead atvergence distances of 19.1 or 171.9 cm.
We used vertical Nonius test lines to measure thepositions of corresponding points and fixation dispar-ity. They were presented at one of 25 azimuths (−6° to6°).4 The upper line was presented randomly, trial bytrial, to the left or right eye. Observers could not tellwhich eye was stimulated by the upper or lower line.The gaps5 between the Nonius lines and the lengths ofthe lines varied with azimuth in order to make themroughly equally visible.
4 Some pilot data were collected for points beyond 6°, but themeasurements were unreliable so we restricted the main experiment tosmaller azimuths.
5 The gap sizes used were slightly less than the vertical separationthat yields the lowest threshold for detecting Nonius offsets nearfixation (McKee & Levi, 1987), but are also large enough to preventfusion. For example, at azimuths of 0° and 6°, the vertical separationswere 10� and 21.6�.
J.M. Hillis, M.S. Banks / Vision Research 41 (2001) 2457–2473 2465
A Macintosh 840/AV computer generated the stim-uli, controlled the staircases, and tabulated responses.Each CRT could display 1280×1024 pixels at a refreshrate of 75 Hz. The angular subtense of a pixel was 2.5arcmin at screen center.
2.3.1. Eliminating effects of binocular targets onmonocular direction
In most horopter experiments, the observer is given abinocular fixation target. Unfortunately, the presenceof a binocular target within 30–60 arcmin of a monoc-ular target influences the perceived direction of themonocular target (van Ee, Backus, & Banks, 1999). Themagnitude of the influence depends on the absolutedisparity of the binocular target, so the effect couldvary with viewing distance (because fixation disparityvaries with distance). This effect on perceived direction,which has been called binocular capture (Erkelens &van Ee, 1997) and monocular ordering (Erkelens & vande Grind, 1994), could affect measurements near thefovea, but not measurements in the parafovea or pe-riphery. In order to eliminate intrusion due to binocularcapture, we removed the fixation target immediatelybefore the Nonius test lines were flashed. The fixationtarget reappeared immediately after the test lines wereextinguished.6
2.3.2. Eliminating effects of transient and sustainedfixation error
The observer was instructed to make sure that thefixation marker was aligned before initiating a stimuluspresentation with a button press. Nonetheless, precise,stable alignment of the Nonius targets was difficult forsome observers in some of the vergence distances. If theobserver could not align the fixation targets precisely,he made sure that the apparent offset was similar fromtrial to trial before initiating a stimulus presentation.The test lines appeared for 100 ms in one of 25 az-imuths (randomly chosen). With this brief stimulusduration, the observer could not make an eye move-ment toward the target; thus, systematic effects oftransient fixation errors were eliminated. On each trial,the observer indicated whether the upper test line wasto the left or right of the lower one. The disparitybetween the left- and right-eye lines was varied accord-ing to a 1-up/1-down staircase. The staircase reversed12 times before completion; step size decreased frombeginning to end. The average of the last six reversalswas the estimate of the disparity that equated perceiveddirection for the two eyes. All azimuths were testedsimultaneously by running 25 interleaved staircases.The disparity required to align the test lines at 0° wasthe measure of sustained horizontal fixation error.
Fig. 10. Horopter settings from Experiment 1. Each panel shows datafrom a different observer. The disparity of the horopter settings isplotted as a function of azimuth. The horizontal lines represent theVieth–Muller Circle. The unfilled triangles represent data collected ata viewing distance of 172 cm and the filled squares data collected at19 cm. Error bars represent �1 S.D. of the last six reversals in eachstaircase (S.D. for each point was determined from four, two and onestaircases, respectively, for MSB, JMH, and ND).
6 The binocular target may affect the perceived alignment of theNonius target near fixation because the neural response associatedwith the binocular target may persist. One could potentially test forthis possibility by adding a long blank interval between the binocularand Nonius targets. We tried this and found that observers could notobtain stable fixation. Thus, we could not make the experimentaldesign completely immune to a potential effect of visual persistence.We believe, however, that no such effect influenced the data becausethe horopter curves that we obtained were smooth through thefixation point.
J.M. Hillis, M.S. Banks / Vision Research 41 (2001) 2457–24732466
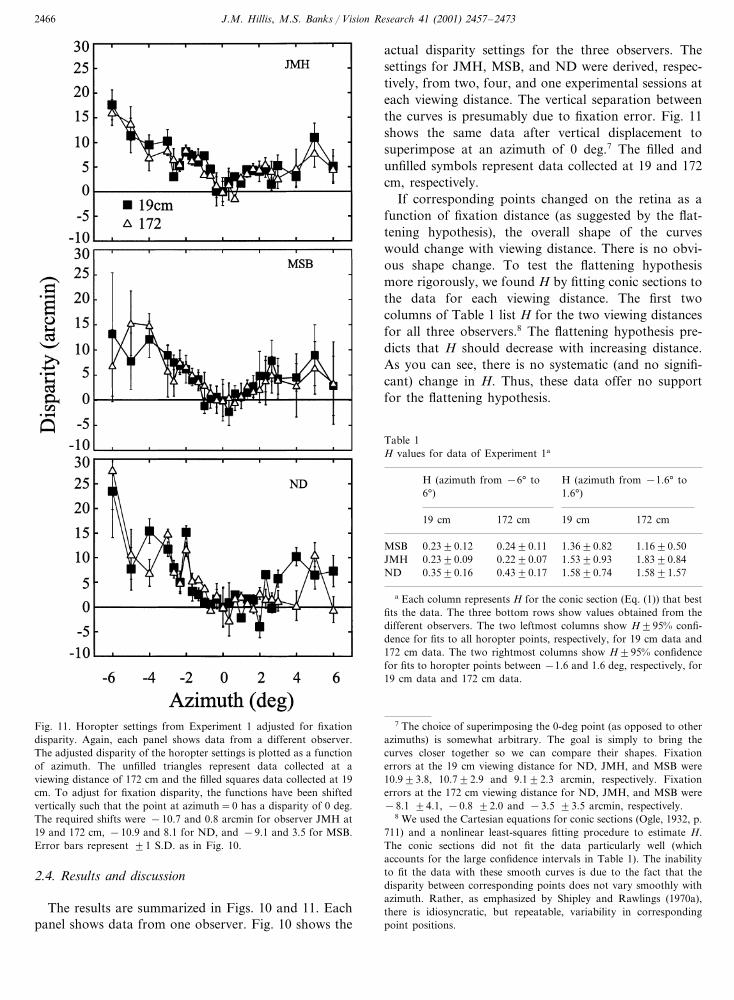
Fig. 11. Horopter settings from Experiment 1 adjusted for fixationdisparity. Again, each panel shows data from a different observer.The adjusted disparity of the horopter settings is plotted as a functionof azimuth. The unfilled triangles represent data collected at aviewing distance of 172 cm and the filled squares data collected at 19cm. To adjust for fixation disparity, the functions have been shiftedvertically such that the point at azimuth=0 has a disparity of 0 deg.The required shifts were −10.7 and 0.8 arcmin for observer JMH at19 and 172 cm, −10.9 and 8.1 for ND, and −9.1 and 3.5 for MSB.Error bars represent �1 S.D. as in Fig. 10.
actual disparity settings for the three observers. Thesettings for JMH, MSB, and ND were derived, respec-tively, from two, four, and one experimental sessions ateach viewing distance. The vertical separation betweenthe curves is presumably due to fixation error. Fig. 11shows the same data after vertical displacement tosuperimpose at an azimuth of 0 deg.7 The filled andunfilled symbols represent data collected at 19 and 172cm, respectively.
If corresponding points changed on the retina as afunction of fixation distance (as suggested by the flat-tening hypothesis), the overall shape of the curveswould change with viewing distance. There is no obvi-ous shape change. To test the flattening hypothesismore rigorously, we found H by fitting conic sections tothe data for each viewing distance. The first twocolumns of Table 1 list H for the two viewing distancesfor all three observers.8 The flattening hypothesis pre-dicts that H should decrease with increasing distance.As you can see, there is no systematic (and no signifi-cant) change in H. Thus, these data offer no supportfor the flattening hypothesis.
Table 1H values for data of Experiment 1a
H (azimuth from −6° to H (azimuth from −1.6° to1.6°)6°)
a Each column represents H for the conic section (Eq. (1)) that bestfits the data. The three bottom rows show values obtained from thedifferent observers. The two leftmost columns show H�95% confi-dence for fits to all horopter points, respectively, for 19 cm data and172 cm data. The two rightmost columns show H�95% confidencefor fits to horopter points between −1.6 and 1.6 deg, respectively, for19 cm data and 172 cm data.
7 The choice of superimposing the 0-deg point (as opposed to otherazimuths) is somewhat arbitrary. The goal is simply to bring thecurves closer together so we can compare their shapes. Fixationerrors at the 19 cm viewing distance for ND, JMH, and MSB were10.9�3.8, 10.7�2.9 and 9.1�2.3 arcmin, respectively. Fixationerrors at the 172 cm viewing distance for ND, JMH, and MSB were−8.1 �4.1, −0.8 �2.0 and −3.5 �3.5 arcmin, respectively.
8 We used the Cartesian equations for conic sections (Ogle, 1932, p.711) and a nonlinear least-squares fitting procedure to estimate H.The conic sections did not fit the data particularly well (whichaccounts for the large confidence intervals in Table 1). The inabilityto fit the data with these smooth curves is due to the fact that thedisparity between corresponding points does not vary smoothly withazimuth. Rather, as emphasized by Shipley and Rawlings (1970a),there is idiosyncratic, but repeatable, variability in correspondingpoint positions.
2.4. Results and discussion
The results are summarized in Figs. 10 and 11. Eachpanel shows data from one observer. Fig. 10 shows the
J.M. Hillis, M.S. Banks / Vision Research 41 (2001) 2457–2473 2467
The local shift hypothesis predicts that disparityshould increase from an azimuth of 0–1.5 deg morerapidly at 19 than at 172 cm. No such change wasobserved. To test the local shift hypothesis more rigor-ously, we found H for the most relevant range ofazimuths (given Fogt and Jones’ description of theshifts): −1.6 to 1.6 deg. The last two columns of Table1 list H for the two viewing distances for all threeobservers. There is no systematic (and no significant)change in H for all three observers. Thus, these dataalso offer no support for the local shift hypothesis.
We could not necessarily fix accommodation in ourexperiments because vergence-accommodation couldhave occurred. Such changes in accommodation wouldcause a small shift in the position of the nodal point.We are confident, however, that vergence-accommoda-tion did not affect the data, primarily because the effectof residual accommodation would be vanishinglysmall.9
In summary, once we eliminate the confounding ef-fects of previous experiments, there is no evidence forchanges in corresponding retinal points as suggested bythe flattening and local shift hypotheses. However,there is one particular shift that would not be detectedby our technique: if all corresponding points from −6to 6 deg azimuth shifted by the same amount, it wouldaffect all settings by the same amount. We would beunable to detect such a shift. Notice that such a shiftpattern is inconsistent with the flattening and local shifthypotheses as presented in the literature. Nonetheless,the possibility remains that a uniform shift occurred.We conducted another experiment to test thispossibility.
3. Experiment 2
One can use afterimages to investigate the positionsof corresponding retinal points as a function of viewingdistance. The idea is to create an afterimage of avertical line segment in one eye that initially appearsaligned with an afterimage of a vertical line segment inthe other eye; one segment should be above and theother below the fixation plane so they do not appearfused. If the local shift hypothesis is correct, or if allcorresponding points shift by the same amount, dichop-tic afterimages that appear aligned near the foveasshould appear misaligned when vergence changes (withdecreasing vergence distance, the right eye’s imageshould appear to move rightward relative to the lefteye’s image). However, if corresponding retinal pointsare fixed, dichoptic afterimages that appear aligned atone vergence position should appear aligned at all othervergence positions. Because the afterimages are pro-duced on the retina, the optical mapping between theexternal scene and the retinal image has no effect on theoutcome.
Flom and Eskridge (1968) and Wick (1991) used thistechnique to look for correspondence shifts. Flom andEskridge created afterimages by flashing dichoptic ver-tical lines, one higher than the other, onto the periph-eral retinas (12, 18, and 24 deg). Observers judged thelines’ perceived alignment as they changed vergencefrom 10 to 600 cm. The afterimages usually appearedaligned, but in some cases, they seemed to move slightlyleft or right relative to one another. The changes inalignment were equivalent to 3–4 arcmin at 12 deg and6–9 arcmin at 24 deg. Wick (1991) created afterimagesin a similar fashion at the fixation point. Observersmade judgments of alignment as they diverged to main-tain fusion of a random-dot stereogram receding indepth. Three of the six observers reported changesconsistent with a shift in correspondence. Flom andEskridge (1968) and Wick (1991) concluded that corre-sponding points shifted slightly with changes in fixationdistance. This conclusion disagrees with the results ofExperiment 1, so we decided to re-examine the per-ceived alignment of dichoptic afterimages.
It is not clear from their reports whether Flom andEskridge or Wick made sure that the afterimages wereinitially perfectly aligned. If they were not, perceivedalignment could have been affected by the well-knownchange in apparent image size that occurs with vergence(vergence micropsia). Consider a subject who views aslightly misaligned pair of lines with the eyes fixatingfar away. As he or she makes a vergence movement tofixate nearer, the afterimage will appear smaller, and sothe misalignment might appear smaller as well. Thus,changes in perceived alignment of misaligned segmentscould be due to correspondence shifts or to vergencemicropsia.
9 We can reject the idea that vergence-accommodation affected ourinterpretation for three reasons. (1) The effect would be too small toobserve. The dioptric distances associated with the nearest and far-thest stimuli were 5.3 and 0.6 D, respectively. The dioptric distance tothe CRTs was 2.6 D. The gain of vergence-accommodation when theaccommodation stimulus is fixed at 2.6 D is less than 0.5 (Hung &Semmlow, 1980). With pinhole pupils, the gain is probably higher,but no one has made the appropriate measurements to our knowl-edge. None the less, the largest accommodative response that couldhave occurred would be between 2.4 and 4.7 D. The largest change indisparity due to this change in accommodation would be 0.26–0.50arcsec at an azimuth of 6 deg, and this would produce a tiny andundetectable change in H. (2) Observer MSB is a presbyope, so ifvergence-accommodation affected our results, it should have had thesmallest effect on his data. Actually, his data show the same effect ofchanges in vergence, as was observed in JMH and ND, whichsuggests that accommodation changes played no role. (3) We ob-served no change in the disparity of horopter settings as we changedvergence. Thus, the only way accommodation could have affected ourinterpretation is if it masked a change in retinal correspondence. Tomask the correspondence change, the accommodation effect wouldhave to be essentially identical, but opposite, to the effect of corre-spondence changes. This seems very unlikely.
J.M. Hillis, M.S. Banks / Vision Research 41 (2001) 2457–24732468
Flom and Eskridge made their measurements at reti-nal eccentricities of 12–24 deg. JudingJuAlignmentjudgments are very difficult at those eccentricities (e.g.Levi, Klein, & Aitsebaomo, 1985), so the data werenoisy. It would make more sense to make measure-ments at or near the fovea where alignment judgmentsare more accurate and where the local shift hypothesispredicts the largest correspondence shifts (Fogt &Jones, 1998b). Notice that the uniform shift (that wecould not rule out in Experiment 1) predicts the sameshift at the fovea as in the periphery. Again, thishypothesis is best tested at the fovea where misalign-ment is easiest to detect.
Wick had a binocular stimulus present while observ-ers made alignment judgments of Nonius lines at fixa-tion. Shimono, Ono, Saida, and Mapp (1998) showedthat apparent direction of Nonius lines at fixation isinfluenced by the presence of binocular features, soWick’s data may have been adversely affected.
For these reasons, we repeated the afterimage studywith vertical lines just above and below fixation and at2.5° azimuth. Shifts of corresponding points on theretina will cause a change in perceived alignment of theafterimages as fixation distance changes.
3.1. Methods
The same three observers participated. A verticalstrobe light was flashed to create vertical afterimages.Each line segment was 4 deg tall at the 244 cm viewingdistance. Observers were dark-adapted for a few min-utes before beginning the experiment.
We first measured Vernier acuity for a monocularafterimage composed of two vertical line segments. Thisgave us a measure of smallest discernible misalignment.The observers could reliably detect offsets of 1.5 arcminin monocular afterimages. Therefore, the shift of 5–10arcmin suggested by Fogt and Jones (1998b) should beeasily detectable.
In the dichoptic experiment, the observer fixated aluminescent spot on the strobe in an otherwise darkroom. The strobe was then flashed to one eye with thelight above the fixation point and then to the other eyewith the light below. Because vergence micropsia couldaffect judgments of the size of an existing misalignment,we made sure that the observer saw the images asperfectly aligned before conducting the rest of the ex-periment. Frequently, the afterimages did not appearaligned initially, so we waited several minutes until theimages were no longer visible and then repeated thestrobe presentation. After perfectly aligned afterimageswere created, observers fixated points at three distances:less than 10 cm, 244 cm, and 700 cm. They thenreported the perceived alignment of the afterimages atthe three distances.
The afterimages were created in two parts of thevisual field: 0 deg (just above and below the fovea) and2.5 deg (to the right of the fixation point). Notice thatthe local shift hypothesis of Fogt and Jones (1998b)predicts shifts at 0 deg, but none at 2.5 deg. Ames et al.(1932b), Flom and Eskridge (1968), and Shipley andRawlings (1970b) observed shifts at azimuths greaterthan 2 deg, so they would predict shifts at the 2.5 degazimuth. A uniform shift predicts changes in perceivedalignment at both 0 and 2.5 deg.
3.2. Results and discussion
All three observers reported no change in the appar-ent alignment of the afterimages at either azimuth.Given that they should have been able to detect align-ment changes of 1.5 arcmin or larger, these data showthat correspondence shifts as large as those claimed byFogt and Jones (�15 arcmin; Fogt & Jones, 1998b)and Flom and Eskridge (3–9 arcmin; Flom & Eskridge,1968) do not occur. Thus, these data are strong evi-dence that corresponding retinal points do not shiftwith changes in vergence. They do not shift locally, asproposed by Fogt and Jones (1998a,b) and others, andthey do not shift uniformly.
4. General discussion
We find that corresponding retinal points along theeyes’ horizontal meridians do not shift with vergenceeye movements. Siderov, Harwerth, and Bedell (1999)concluded that corresponding points along the eyes’vertical meridians do not shift with vergence eye move-ments. Herzau and Ogle (1937) concluded that corre-spondence along the horizontal meridians does notchange with horizontal version eye movements.Nonetheless, our finding directly contradicts severalprevious studies (Flom & Eskridge, 1968; Shipley &Rawlings, 1970b; Remole, 1985; Robertson & Schor,1986; Kertesz & Lee, 1987, 1988; Fogt & Jones,1998a,b). Here, we discuss the likely causes of thedisagreement. There are four potential sources of errorin interpreting horopter or fixation disparity data:movement of the nodal points with vergence, fixationerror, retinal stretch, and effects of nearby binocularstimuli on perceived direction.
4.1. The eye’s optics
Calculating corresponding retinal points fromhoropter data requires an appropriate model of theeye’s optics. Most previous work on correspondence asa function of fixation distance has not taken intoaccount the translation of the nodal points as the eyesrotate (Ames et al., 1932a,b; Fogt & Jones, 1998a,b).
J.M. Hillis, M.S. Banks / Vision Research 41 (2001) 2457–2473 2469
We can calculate the expected change in H if corre-spondence is fixed, and nodal-point translation is nottaken into account. Ames et al. (1932a,b) used a fixednodal-point position 7.3 mm behind the cornea (seeFig. 5B) and a fixed distance between the two eyes’nodal points (Fig. 5A). By our calculation, they shouldhave observed a decrease in H of 0.03 for an increase inviewing distance from 20 to 76 cm. This predictedchange is in the direction of, but is smaller than, theobserved change (Fig. 4). Thus, this error probablycaused some, but not all, of the H change observed byAmes and colleagues.
We eliminated this problem in Experiment 1 by usingan optical set-up that maintained the same opticalprojection to the retinas as the eyes rotated. We elimi-nated the problem in Experiment 2 by using an afterim-age technique.
4.2. Fixation error
Calculating corresponding retinal points fromhoropter data also requires knowledge of where theeyes were fixated when the measurements were made.Most observers tend to fixate farther than a near targetand nearer than a far target (e.g. Ogle, Martens, &Dyer, 1967), so a failure to measure fixation error canconfound assessments of correspondence at differentdistances. Flom and Eskridge (1968), Reading (1980),and Shipley and Rawlings (1970b) acknowledged theimportance of correcting fixation errors in interpretinghoropter data. They showed that the distance-depen-dent changes in the horopter settings of Ames et al.(1932b) were reduced after correction for fixation error.
Some previous work on correspondence near thefovea measured fixation disparity subjectively and ob-jectively and found that disparity differed in the twocases (Hebbard, 1962; Kertesz, Hampton, & Sabrin,1983; Robertson & Schor, 1986; Remole, Cole, Matyas,McLeod, & White, 1986; Kertesz & Lee, 1987, 1988;Reading, 1989; Fogt & Jones, 1998a). However, the twomeasurements did not necessarily measure fixation dis-parity when the eyes were in the same state. Thedemands on the observer differ during objective andsubjective measurements. During objective measure-ments, the observer fixates a binocular target, and aninstrument records eye position over some time inter-val. In the Fogt and Jones (1998a) experiment, theobjective measure was the average vergence over a 2 sinterval. During subjective measurements, the observeris actively involved in a perceptual task (e.g. judging thealignment of two lines), so he/she knows precisely whenthe judgment is being made and, therefore, when tomake the greatest effort to verge the eyes. In the Fogtand Jones (1998a) experiment, the observer made aNonius line setting and, therefore, only needed to holdthe eyes at the desired vergence position long enough to
make the perceptual judgment. Because the observer islikely to report the subjective appearance when thegreatest vergence effort is being made, we suspect thatfixation is more accurate in subjective than in objectivemeasurements. This concern about the comparability ofobjective and subjective measures of fixation disparityapplies to Hebbard (1962), Kertesz et al. (1983),Kertesz and Lee (1987, 1988), Remole et al. (1986),Robertson and Schor (1986), Reading (1989), and Fogtand Jones (1998a,b).10
In Experiment 1, we took fixation error into accountby estimating fixation disparity subjectively during thecourse of the experimental measurements; specifically,we measured the eyes’ vergence at the same time as thecorrespondence measurements were made. Fixation er-ror could not affect the results of Experiment 2 afterthe afterimages were created.
4.3. Retinal stretching
Muscle forces that occur during accommodationcause stretching of the retina (Aubert, 1857; Hensen &Voelckers, 1873; Jaensch & Schonheinz, 1924; Moses,1970). Specifically, contraction of the ciliary musclecauses the leading edge of the retina to advance by asmuch as 0.5 mm. Non-uniform stretching would changethe mapping between object points and the retina;Blank and Enoch (1973) showed that it can affectperceived direction. If the stretching differed in the twoeyes, the accommodation that accompanies vergencecould also affect horopter settings.
This potential source of error could have affected theinterpretation of our data in Experiment 1, but appar-ently, it did not because we observed fixed correspon-dence across a wide range of viewing distances. Theabsence of a stretching effect is probably due to the factthat we did not present accommodation demandsnearly as large as Blank and Enoch (1973). Retinalstretching would have no effect on the interpretation ofExperiment 2 because the percepts were created byafterimages.
10 Another problem has arisen in comparisons of objective andsubjective measures of fixation disparity (Remole et al., 1986; Robert-son & Schor, 1986; Kertesz & Lee, 1987, 1988; Fogt & Jones,1998a,b). An appropriate comparison would use the same point in theeye as the vertex of the measured angles. The eye trackers used forobjective measurements measure the angular rotation of the eyesrelative to a fixed vertex, which is generally the eye’s center ofrotation. The vertex in subjective measurements is the eye’s nodalpoint. The nodal points are closer to the cornea than the center ofrotation is, so objective and subjective methods measure differentangles. The difference is small, but probably accounts for some of thedifference between subjective and objective methods observed in therange of normal viewing distances (Remole et al., 1986; Robertson &Schor, 1986; Kertesz & Lee, 1987, 1988; Fogt & Jones, 1998a).
J.M. Hillis, M.S. Banks / Vision Research 41 (2001) 2457–24732470
Fig. 12. Effect of nearby binocular stimuli on the perceived direction of a monocular stimulus. The left panel is a schematic of the Fogt and Jones’(1998b) stimulus. The binocular square that served as the fixation target is represented by B. The Nonius lines presented to the left and right eyesare represented by ML and MR, respectively. The gap between the binocular square and the Nonius lines was varied in the experiment. The twopanels on the right depict perceived directions of the Nonius lines according to different rules: Hering’s Laws (A) and the monocular-ordering rule(B). The left and right eyes are shown along with the cyclopean eye (CE). The observer is fixating behind the binocular box (B). The visual axesare indicated by the rays labeled FL and FR. The angles between the visual axes and the center of B are indicated by �L and �R. The Nonius linesML and MR are positioned such that ML is physically aligned with B, as seen by the left eye, and MR is physically aligned with B, as seen bythe right eye. According to Hering’s Laws, ML and MR should be seen in different directions than B. Those directions are indicated by the raysM� L and M� R, which differ from the perceived direction, B� , by the angles �L and �R. According to the monocular-ordering rule, the perceiveddirections of adjacent monocular and binocular stimuli are assigned according to the angles in the eye that sees both. Thus, these rules predictthat M� L, M� R, and B� will all be seen in the same direction.
4.4. Effects of nearby binocular stimuli on percei�eddirection.
In most studies of correspondence at the fovea, abinocular fixation target is presented adjacent tomonocular Nonius lines (Hebbard, 1962; Bourdy, 1973;de Decker & Scheffel, 1978; Remole, 1985; Kertesz &Lee, 1987, 1988; Fogt & Jones, 1998a,b). The presenceof a binocular target within 30–60 arcmin of a monoc-ular target influences the perceived direction of themonocular target (van Ee et al., 1999). Specifically, theperceived directions of the monocular and binocularstimuli appear to be assigned by the eye that sees both.This behavior of monocular ordering (or binocularcapture) violates Hering’s Laws of perceived direction(Erkelens & van de Grind, 1994). With increasing sepa-ration between the binocular and monocular targets,there is a smooth transition from monocular orderingto Hering’s Laws (van Ee et al., 1999). The differencesin the forms of behavior are illustrated in the middleand right panels of Fig. 12. We tried to eliminate theinfluence of binocular capture in Experiment 1 by re-moving the fixation target just before the Nonius testlines were flashed.
The binocular capture effect probably affected theinterpretation of many previous studies. Consider, forexample, the stimulus used by Fogt and Jones (1998b)that is depicted in the left panel of Fig. 12. Observersfixated the binocular square and aligned the monocularNonius lines above and below the square. Fogt andJones found that settings varied as a function of gapsize. According to van Ee et al. (1999), the monocular-
ordering rule applies to the calculation of perceiveddirection when the gap is small, and Hering’s Lawsapply when the gap is large. van Ee et al. reported asmooth transition from the monocular-ordering rule toHering’s Laws of perceived direction as a function ofgap size. Can this model plus an assumption of fixedretinal correspondence predict Fogt and Jones’ results?Or does one have to assume that corresponding pointsshift on the retinas to explain their results? To find out,we derived the predictions of van Ee et al. (1999) forthe conditions of Fogt and Jones’ (1998b) first experi-ment. The averaged results of four observers from vanEe et al. (their Fig. 9) were used to determine theweights given to Hering’s Laws and monocular order-ing for each gap size. The weights reflect how well thedifferent rules of perceived direction predict the resultsfrom van Ee et al. These weights were then used topredict the perceived directions of Nonius lines in Fogtand Jones (1998b).
The predictions of Hering’s Laws and monocularordering are schematized in Fig. 12. The visual axes arerepresented by FL and FR, the binocular target by B,and the monocular Nonius lines by ML and MR. Themonocular and binocular targets are superimposed inspace. The binocular target is presented at a very neardistance, so the observer is fixating behind the target.The deviations of the left and right eyes are representedby the angles �L and �R, respectively. According toHering’s Laws, the fused binocular square should beperceived in the head’s median plane because the per-ceived direction, B� , of a fused binocular point is theaverage of the directions reported by the two eyes. The
J.M. Hillis, M.S. Banks / Vision Research 41 (2001) 2457–2473 2471
monocular Nonius lines should be seen in differentdirections, M� L and M� R, as shown. According to themonocular-ordering rule, the perceived directions of themonocular line seen by the left eye should be the sameas the direction of the binocular target because, accord-ing to these rules, the assigned directions preserve theangles seen by the left eye. The same argument appliesto the line seen by the right eye. Thus, when the objectsare superimposed in space, they should be seen in thesame direction even when the observer is not fixating inthe plane of the binocular stimulus.
Fig. 13 plots Fogt and Jones’ (1998b) data and thepredictions of the model. The angle between the Noniusline settings is plotted as a function of the separationbetween the binocular and monocular stimuli. Themonocular-ordering predictions are represented by thedashed horizontal line at 0 deg. Settings based onmonocular ordering could lead one to believe that therewas no fixation disparity. The predictions of van Ee etal. (1999) and Hering’s Law are represented by theupper and lower solid lines, respectively. We used theobjective eye-position measurements from Fogt andJones (1998b) to derive those predictions. They wiggle
slightly because objective position varied with gap size.Fogt and Jones’ subjective data are represented by thefilled circles. The model predicts the data reasonablywell. Thus, an apparent difference can occur betweenobjectively and subjectively measured fixation disparitywithout a shift in the retinal positions of correspondingpoints or a change in eye position.
4.5. Strabismus
Our observers had normal binocular vision with nomeasurable eye misalignment. Their behavior was com-pletely consistent with fixed retinal correspondence.There have been numerous reports that strabismicsexhibit correspondence shifts that depend on eye posi-tion (e.g. Flom, 1980; Schor, 1991). The most persua-sive observation is that strabismics with anomalousretinal correspondence show changes in the perceiveddirections of dichoptic afterimages as they move theireyes. Thus, our conclusion does not apply to patientswith anomalous retinal correspondence. It would beinteresting to know whether strabismics with normalretinal correspondence truly behave as if their corre-sponding points are fixed.
5. Conclusion
Since the beginning of the 20th century, investigatorshave asked whether corresponding points are fixed inretinal coordinates. Much of the data has suggestedthat corresponding points shift along the retinas withchanges in fixation distance. This conclusion is notnecessarily justified unless one can eliminate or takeinto account alterations in the projection of horopterpoints in space to corresponding locations on the tworetinas. Four effects can alter this relationship: (1)changes in the projection from object to image pointsthat accompany eye rotation and accommodation, (2)fixation errors during the experimental measurements,(3) non-uniform retinal stretching, and (4) changes inperceived direction of a monocular point when pre-sented adjacent to a binocular point. We eliminated theinfluence of these four effects and found no evidencefor shifts in the retinal coordinates of correspondingpoints. Thus, we conclude that corresponding pointshave fixed positions on the two retinas.
Acknowledgements
This work was supported by research grants fromNSF (DBS-9309820), NIH (EY-12851) and Fight forSight (SF20027). We thank Cliff Schor, Mike Landy,and Marc Ernst for comments on an earlier draft. Wealso thank Nick Davidenko for participating as an
Fig. 13. Fogt and Jones’ (1998b) data and the predictions of Hering’sLaws, the monocular-ordering rule, and the model of van Ee et al.(1999). The observed and predicted disparities of alignment settingsare plotted as a function of the gap between the binocular box andmonocular Nonius lines (left side of Fig. 13). Fogt and Jones’ dataare represented by the filled circles. In calculating the predictions ofthe van Ee et al. model (gray line), we assumed that no shift in retinalcorrespondence occurs and that Fogt and Jones’ objective measure-ments of eye position were correct. The monocular-ordering rulepredicts that all settings should have a disparity of zero; this isindicated by the horizontal dashed line. Hering’s Laws predict thatthe settings will vary with fixation disparity; they are represented bythe black line. The van Ee et al. (1999) model predicts that settingswill vary significantly with gap size because of changes in eye positionand because the weight given to monocular ordering as opposed toHering’s Laws varies with gap size.
J.M. Hillis, M.S. Banks / Vision Research 41 (2001) 2457–24732472
observer and Meng Lin for assistance in obtaining andfitting the pinhole contact lenses, and getting them inand out of MSB’s eyes. We thank Ben Backus forassistance in the design and construction of the sightingdevice.
References
Ames, A., & Gliddon, G. H. (1928). Ocular measurements. Transac-tions of the Section of Ophthalmology, AMA, 102–175.
Ames, A., Ogle, K., & Gliddon, G. H. (1932a). Corresponding retinalpoints, the horopter, and size and shape of ocular images: Part 1.Journal of the Optical Society of America, 22, 538–574.
Ames, A., Ogle, K., & Gliddon, G. H. (1932b). Corresponding retinalpoints, the horopter, and size and shape of ocular images: Part 2.Journal of the Optical Society of America, 22, 575–631.
Amigo, G (1965). The mathematical treatment of horopter dataobtained with the eyes in asymmetric convergence. Optica Acta,12, 305–315.
Aubert, H. (1857). Spatial direction in indirect vision. In H. Aubert,Physiologie der Netzhaut (pp. 235–253). Breslau: Verlag von E.Morgenstern.
Backus, B. T., Banks, M. S., van Ee, R., & Crowell, J. A. (1999).Horizontal and vertical disparity, eye position, and stereoscopicslant perception. Vision Research, 29, 1143–1170.
Blakemore, C. (1970). The range and scope of binocular depthdiscrimination in man. Journal of Physiology, 211, 599–622.
Blank, K., & Enoch, J. M. (1973). Monocular spatial distortionsinduced by marked accommodation. Science, 182, 393–395.
Bourdy, C. (1972). Directionnalite optique des recepteurs retiniens etpoints correspondants. II. Variations de forme de l’horoptereexperimental, et possibilite de reorganisation de la correspondanceraetinienne selon l’orientation des yeux. Vision Research, 12,1831–1839.
Bourdy, C. (1973). Etude des variations des disparitaes retiniennesautour du point de fixation par la methode du Vernier binoculairedans la region foveale. Vision Research, 13, 149–159.
Clark, B. (1936). An eye movement study of stereoscopic vision.American Journal of Psychology, 48, 82–97.
de Decker, W, & Scheffel, T. (1978). Simultaneous investigation offixation disparity stereothreshold and horopter balance. Albrecht�on Graefes Archi� fur Klinische und Experimentelle Ophthalmolo-gie, 207, 97–109.
Erkelens, C. J., & van Ee, R. (1997). Capture of visual direction ofmonocular objects by adjacent binocular objects. Vision Research,37, 1735–1745.
Erkelens, C. J., & van de Grind, W. A. (1994). Binocular visualdirection. Vision Research, 34, 2963–2969.
Flom, M. C. (1980). Corresponding and disparate retinal points innormal and anomalous correspondence. American Journal of Op-tometry and Physiological Optics, 57, 656–665.
Flom, M. C., & Eskridge, J. B. (1968). Change in retinal correspon-dence with viewing distance. Journal of the American OptometricAssociation, 39, 1094–1097.
Fogt, N., & Jones, R. (1998a). Comparison of fixation disparitiesobtained by objective and subjective methods. Vision Research,38, 411–421.
Fogt, N., & Jones, R. (1998b). The effect of forced vergence onretinal correspondence. Vision Research, 38, 2711–2719.
Hebbard, F. W. (1962). Comparison of objective and subjectivemeasurements of fixation disparity. Journal of the Optical Societyof America, 52, 706–712.
Hensen, V., & Voelckers, C. (1873). Experimental investigation onthe mechanism of accommodation. Graefes Archi� fur Ophthal-molgie, 18, 156.
Hering, E. (1879). Spatial sense and mo�ements of the eye. Baltimore,MD: American Academy of Optometry translation by C.A.Rahde.
Herzau, W., & Ogle, K. N. (1937). U� ber den Grossenunterschiedder Bilder beider Augen bei asymmetrischer Konvergenz undseine Bedeutung fur das zweiaugige Sehen (Ein Beitrag zur ‘Ani-seikonia’-Forschung). Graefes Archi� fur Ophthalmolgie, 137,328–363.
Hung, G. K., & Semmlow, J. L. (1980). Static behavior of accommo-dation and vergence: computer simulation of an interactive dual-feedback system. IEEE Transactions on Biomedical Engineering,27, 439–447.
Jaensch, E. R., & Schonheinz, W. (1924). Some of the more generalquestions of the perception theory. Archi�es of Psychology, 46,3–60.
Jones, R. (1974). On the origin of changes in the horopter deviation.Vision Research, 14, 1047–1049.
Kertesz, A. E., & Lee, H. J. (1987). Comparison of simultaneouslyobtained objective and subjective measurements of fixation dis-parity. American Journal of Optometry and Physiological Optics,64, 734–738.
Kertesz, A. E., & Lee, H. J. (1988). The nature of sensory compensa-tion during fusional response. Vision Research, 28, 313–322.
Kertesz, A. E., Hampton, D. R., & Sabrin, H. W. (1983). Theunreliability of nonius line estimates of vertical fusional vergenceperformance. Vision Research, 23, 295–297.
Klein, S. A., Hu, Q., & Carney, T. (1996). The adjacent pixelnonlinearity: problems and solutions. Vision Research, 36, 3167–3181.
Krekling, S. (1974). Stereoscopic thresholds within the stereoscopicrange in central vision. American Journal of Physiological Optics,51, 626–634.
Levi, D. M., Klein, S. A., & Aitsebaomo, A. P. (1985). Vernieracuity, crowding and cortical magnification. Vision Research, 25,963–977.
McKee, S. P., & Levi, D. (1987). Dichoptic hyperacuity: the precisionof nonius alignment. Journal of the Optical Society of America A,4, 1104–1108.
Miles, P. W. (1975). Errors in space perception due to accommoda-tive retinal advance. American Journal of Optometry and Physio-logical Optics, 52, 600–603.
Moses, R. A. (1970). Adler’s physiology of the eye : clinical application.St. Louis, MO: Mosby.
Nelson, J. I. (1977). The plasticity of correspondence: after-effects,illusions and horopter shifts in depth perception. Journal ofTheoretical Biology, 66, 203–266.
Ogle, K. N. (1932). An analytical treatment of the longitudinalhoropter; its measurement and application to related phenomena,especially to the relative size and shape of the ocular images.Journal of the Optical Society of America, 22, 665–728.
Ogle, K. N. (1950). Researches in binocular �ision. Philadelphia, PA:Saunders.
Ogle, K. N. (1953). Precision and validity of stereoscopic depthperception from double images. Journal of the Optical Society ofAmerica, 43, 906–913.
Ogle, K. N., Martens, T. G., & Dyer, J. A. (1967). Oculomotorimbalance in binocular �ision and fixation disparity. Philadelphia,PA: Lea & Febiger.
Reading, R. W. (1980). A disparity analysis of some horopter data.American Journal of Optometry and Physiological Optics, 57,815–821.
Reading, R. W. (1989). Comparison of two fixation disparity determi-nations. Optometry and Vision Science, 66, 612–615.
Remole, A. (1985). Fixation disparity vs. binocular fixation misalign-ment. American Journal of Optometry and Physiological Optics,62, 25–34.
J.M. Hillis, M.S. Banks / Vision Research 41 (2001) 2457–2473 2473
Remole, A., Code, S. M., Matyas, C. E., McLeod, M. A., & White,D. J. (1986). Objective measurement of binocular fixation mis-alignment. American Journal of Optometry and Physiological Op-tics, 63, 631–638.
Robertson, K., & Schor, C. M. (1986). Changes in retinal correspon-dence induced by disparity vergence. In�estigati�e Ophthalmologyand Visual Science, 27(Supplement), 72.
Schor, C. M. (1991). Binocular sensory disorders. In D. Regan,Vision and �isual disorders : binocular �ision. London: Macmillan.
Shimono, K., Ono, H., Saida, S., & Mapp, A. P. (1998). Methodolog-ical caveats for monitoring binocular eye position with noniusstimuli. Vision Research, 38, 591–600.
Shipley, T., & Rawlings, S. C. (1970a). The nonius horopter. I.History and theory. Vision Research, 10, 1225–1262.
Shipley, T., & Rawlings, S. C. (1970b). The nonius horopter. II. Anexperimental report. Vision Research, 10, 1263–1299.
Siderov, J., Harwerth, R. S., & Bedell, H. E. (1999). Stereopsis,cyclovergence, and the backwards tilt of the vertical horopter.Vision Research, 39, 1347–1357.
van Ee, R., Backus, B. T., & Banks, M. S. (1999). Perceived visualdirection near an occluder. Vision Research, 39, 4085–4097.
von Tschermak, A. (1942). Introduction to physiological optics.Springfield: Charles C. Thomas translated by P. Boeder.
Westheimer, G., & McKee, S. P. (1978). Stereoscopic acuity formoving retinal images. Journal of the Optical Society of America,68, 450–455.
Wick, B. (1991). Stability of retinal correspondence in normal binoc-ular vision. Optometry and Vision Science, 68, 46–58.