K.7 Are euro-area corporate bond markets irrelevant? The effect of bond market access on investment von Beschwitz, Bastian and Conor T. Howells International Finance Discussion Papers Board of Governors of the Federal Reserve System Number 1176 August 2016 Please cite paper as: von Beschwitz, Bastian and Conor T. Howells (2016). Are euro-area corporate bond markets irrelevant? The effect of bond market access on investment. International Finance Discussion Papers 1176. http://dx.doi.org/10.17016/IFDP.2016.1176
Transcript
K.7
Are euro-area corporate bond markets irrelevant? The effect of bond market access on investment von Beschwitz, Bastian and Conor T. Howells
International Finance Discussion Papers Board of Governors of the Federal Reserve System
Number 1176 August 2016
Please cite paper as: von Beschwitz, Bastian and Conor T. Howells (2016). Are euro-area corporate bond markets irrelevant? The effect of bond market access on investment. International Finance Discussion Papers 1176. http://dx.doi.org/10.17016/IFDP.2016.1176
Board of Governors of the Federal Reserve System
International Finance Discussion Paper
Number 1176
August 2016
Are euro-area corporate bond markets irrelevant?The effect of bond market access on investment
Bastian von BeschwitzConor T. Howells
NOTE: International Finance Discussion Papers are preliminary materials circulated to stim-ulate discussion and critical comment. References to Internatoinal Finance Discussion Pa-pers (other than an acknowledgment that the writer has had access to unpublished material)should be cleared with the author or authors. Recent IFDPs are available on the Web atwww.federalreserve.gov/pubs/ifdp/. This paper can be downloaded without charge fromSocial Science Research Network electronic library at www.ssrn.com.
Are euro-area corporate bond markets irrelevant?
The effect of bond market access on investment∗
Bastian von Beschwitz† and Conor T. Howells‡
June 30, 2016
Abstract
We compare how bond market access affects firms’ investment decisions in the
United States and the euro area. Having a bond rating enables US corporations to
invest more and undertake more acquisitions. In contrast, in the euro area, bond
ratings have no effect on investment decisions. Similarly, firms with bond ratings have
higher leverage in the United States, but not in the euro area. This difference may
be due to euro-area firms getting sufficient financing from banks. Consistent with this
explanation, euro-area bond ratings became more relevant for investment after the
banking crisis of 2008, when banks reduced their lending to firms.
JEL classification: G31, G32, G34
Keywords: Mergers and acquisitions, Bond ratings, Investment, Financing con-
straints
∗The views in this paper are solely the responsibility of the authors and should not be interpreted as reflectingthe views of the Board of Governors of the Federal Reserve System or any other person associated with theFederal Reserve System. Special thanks to Federal Reserve seminar participants for helpful comments.†Bastian von Beschwitz, Federal Reserve Board, International Finance Division, 20th Street and Constitu-tion Avenue N.W., Washington, D.C. 20551, tel. +1 202 475 6330, e-mail: [email protected](corresponding author).‡Conor T. Howells, Federal Reserve Board, International Finance Division, 20th Street and ConstitutionAvenue N.W., Washington, D.C. 20551, tel. +1 202 475 6379, e-mail: [email protected].
1 Introduction
Under the assumption of perfect capital markets (e.g. Modigliani and Miller (1958)), a firm’s
investment policy is independent of its financing. However, in reality, capital markets are not perfect
and firms must forego profitable projects due to financial constraints. When profitable projects are
not undertaken, welfare is lost, which is one of the reasons why developed capital markets are good
for economic growth (e.g. Rajan and Zingales (1998), King and Levine (1993)).
While the academic literature generally focuses more on equity markets, U.S. firms actually raise
more funds via bond issuance than via equity issuance. For example, in 2015, U.S. non-financial
firms had a net issuance of bonds worth $400 billion, which was more than double their issuance of
equity ($174 billion).1 Compared to the United States, corporate bond markets have a much lower
importance in the euro area: While total issuance of corporate bonds was 1.7 percent of GDP in
the United States in 2005, it was only 0.9 percent in the euro area and, similarly, small and medium
enterprises (SMEs) in the United States receive five times as much financing from capital markets
as SMEs in Europe.2
Hoping to promote economic growth, recent policy initiatives in Europe have been designed to
increase the importance of the corporate bond market. For example, the European Commission
proclaimed the goal to create a Capital Market Union, which it defines as “a true single market for
capital” within the 28 member states of European Union.3 Similarly, in March 2016, the European
Central Bank (ECB) decided to purchase corporate bonds as part of its quantitative easing program.
By increasing the demand for corporate bonds, the purchase program of the ECB may increase the
size and liquidity of the corporate bond market in the euro area.
Would a larger bond market in the euro area really allow firms to invest more? How much would
firm investment increase if the euro-area corporate bond market had the same size as its counterpart
in the United States? We address these questions by comparing how bond market access affects1These values are based on aggregating data from Securities Data Company.2According to the “Action Plan on Building a Capital Markets Union” (http://ec.europa.eu/finance/capital-markets-union/docs/building-cmu-action-plan_en.pdf)
3See for example the “Action Plan on Building a Capital Markets Union” (http://ec.europa.eu/finance/capital-markets-union/docs/building-cmu-action-plan_en.pdf)
1
firm investment in the euro area and the United States. Following Harford and Uysal (2014) and
Faulkender and Petersen (2006), we use the fact that firms without a bond rating generally cannot
access bond markets. Therefore, we compare how investment and leverage differs between firms
with and without a bond rating in the United States and the euro area. Our main finding is that
having a bond rating affects investment and capital structure in the United States, but not in the
euro area.
To enable a direct comparison between Europe and the United States, we use only datasets with
detailed global coverage: We obtain information on S&P and Moody’s issuer credit ratings from
Moody’s CreditEdge. We match this information to balance sheet data provided by Worldscope
and acquisition information from Thomson Reuter’s SDC Platinum. Our sample period runs from
2005 to 2014.
We start by focusing on the United States. We find that bond ratings affect firm investment
policies in the United States. Controlling for various other characteristics, a U.S. corporation is 3.5
percentage points more likely to undertake an acquisition in a given year if it has a bond rating.
This is an increase of 23 percent compared to the average acquisition probability of 14.9 percentage
points. Firms with a bond rating also spend more on acquisitions (as a share of their assets).
Furthermore, capital expenditures, as a share of assets, are 0.8 percentage points higher for firms
with a bond rating. This is an increase of 24 percent compared to the median capital expenditure
to assets share of 3.3 percentage points. In sum, these findings suggest that U.S. firms without
a bond rating are financially constrained, which leads them to invest less than firms with a bond
rating. Our results confirm prior evidence by Harford and Uysal (2014) who find that U.S. firms
with a bond rating undertake more acquisitions.
However, when we conduct the same analysis on our sample of euro-area firms, we find no effect
of bond ratings on investment: European firms with a rating are only an insignificant 0.7 percentage
points more likely to undertake an acquisition. Furthermore, the effect of having a rating on the
value of acquisitions and capital expenditures is actually insignificantly negative. Next, studying
a combined dataset of euro-area and U.S. firms, we show that the difference in the effect of bond
ratings on capital expenditures and the value of acquisitions between the United States and the
2
euro area is also statistically significant. Taken together, these findings suggest that access to bond
markets in the euro area is irrelevant to a firm’s investment decisions.
How do we explain these surprising differences between the United States and the euro area?
We propose two potential explanations: the weak bond market hypothesis and the strong banking
hypothesis. The weak bond market hypothesis suggests that bond market access is less important
in the euro area because bond markets in the euro area are underdeveloped and cannot supply
sufficient amounts of financing. Thus, even euro-area firms with bond market access are financially
constrained and would like to access a stronger bond market. This hypothesis assumes one or
both of the following: either there are not sufficient funds available through the bond market, or the
funds are too expensive to be attractive. In contrast, the strong banking hypothesis argues that good
access to bank financing in the more bank-based euro area makes bond market access redundant.
This hypothesis assumes that all euro-area firms have good access to financing through their banks
and thus do not need access to bond markets.
If the weak bond market hypothesis were true, we would expect euro-area firms with a bond
rating to expand investment to the levels of their U.S. peers if the euro-area bond market was able
to grow to the size of the its U.S. counterpart. We estimate this increase in investment to be $100
billion or approximately 0.8 percent of euro-area GDP. However, we would not expect these benefits
to materialize under the strong banking hypothesis.
We try to distinguish between these two hypotheses by focusing on a time when bank lending
was severely constrained: the financial crisis of 2008. The financial crisis was mainly a banking crisis
and corporate lending by banks contracted significantly following the crisis (Becker and Ivashina
(2014)). If the strong banking hypothesis is correct, and our results are at least partly explained by
the importance of bank financing in the euro area, we would expect bond ratings to become more
important at such a time because bank loans are unavailable. Indeed, we find that this is the case.
We estimate a difference-in-difference set-up examining the change in the effect of bond rating on
capital expenditures following the financial crisis. We find that having a bond rating becomes more
important in the euro area after the financial crisis. The relative increase in capital expenditures as
a fraction of assets for firms with a bond rating is 0.6 percentage points, or 17 percent relative to
3
the mean, consistent with the strong banking hypothesis. Taken together, our results suggest that
in normal times bond market access is not important to investment in the euro area, as firms have
access to enough bank financing. However, after the crisis, when bank financing became scarce,
euro-area firms with a bond rating could invest more relative to their unrated peers.
In addition to investments, we find that having a bond rating also has a differential effect on
capital structure in the euro area and the United States. While we confirm the results of Faulkender
and Petersen (2006) that firms with a bond rating have higher leverage in the United States, we
do not find any effect of bond ratings on leverage in the euro area. The difference in the effect
of bond ratings on leverage (defined as debt over market value of equity) between the euro area
and the United States is about 10 percentage points, which is economically large and statistically
significant at the 1 percent level. This additional result shows a potential negative effect of stronger
bond markets: If stronger bond markets allow firms to take more leverage, they may be more likely
to go bankrupt in an economic downturn.
In our analyses, we follow the assumption of Harford and Uysal (2014) and Faulkender and
Petersen (2006) that the lack of a bond rating is a supply-side effect rather than indicating the
missing demand for a rating, i.e. we assume that there is no reverse causality. To support this
assumption, we show in a robustness check that our results hold when lagging our rating dummy
variable by two years. Furthermore, we control for many firm characteristics that could be correlated
with having a rating. More generally, given that we mainly focus on the difference between the
United States and the euro area, our results are somewhat less subject to endogeneity concerns.
Indeed, for our results to hold, bond market access must not be totally exogenous: It is enough if
the endogeneity bias is similar in the euro area and the United States, a much milder assumption.
Our paper has important policy implications for the debate on capital market development in the
European Union. Our findings suggest that euro-area bond markets are irrelevant for investment,
implying that there may be potential to boost investment by creating stronger capital markets.
However, this conclusion is limited by our evidence in favor of the strong banking hypothesis, which
implies that bond market access may have been irrelevant before the crisis, because firms had access
to sufficient bank financing. If bank financing is sufficient, one would not expect improved bond
4
market financing to lead to an increase in investment.
Our paper contributes to a broad literature on the effect of financing on investment choices. Many
papers in that literature study the effect of internal financing via investment-cash flow sensitivities
and debate how to interpret the results of investment-cash flow regressions.4 Other papers study
how access to external financing affects investment. Measures of access to external financing include
the amount of collateral available (Gan (2007), Chaney, Sraer and Thesmar (2012)), negative shocks
to the health of the firm’s banks (e.g. Peek and Rosengren (2000), Schnabl (2012)), and the amount
of debt maturing (Almeida et al. (2009)). Our paper is most closely related to studies that use
the existence of a bond rating as a proxy for access to external financing. For example, Chava
and Purnanandam (2011) show that U.S. firms with a debt rating are less negatively affected by
the Russian crisis in 1998, which is used as a negative shock to bank lending. Sufi (2009) shows
that firms with a syndicated bank loan rating undertake more cash acquisitions. Faulkender and
Petersen (2006) show that firms with a corporate bond rating have higher leverage, and Harford
and Uysal (2014) show that firms with a corporate bond rating undertake more acquisitions. We
make the important contribution that the positive effect of a bond rating on investment depends on
the institutional environment of the firm by showing that no such effect can be found in the euro
area.
Furthermore, our paper adds to a literature that studies the effect of capital market development
on economic growth. This literature finds mixed results. While Rajan and Zingales (1998) and King
and Levine (1993) find that developed financial markets are beneficial for growth, Cecchetti and
Kharroubi (2012) and Law and Singh (2014) show that financial development is only beneficial
to growth up to a certain threshold. Our paper provides insight into these contrasting results
by showing that certain conditions need to be met for market access to have a positive effect on
investment. We show that in a bank-based economy, such as the euro area, having access to a bond
market is much less important but can gain importance when the banking system experiences a4These papers study investment-cash flow sensitivities: Fazzari, Hubbard and Petersen (1988), Hoshi, Kashyap andScharfstein (1990), Whited (1992), Almeida and Campello (2007), while these paper debate how investment-cash flowsensitivities should be interpreted: Fazzari, Hubbard and Petersen (2000), Kaplan and Zingales (1997), Kaplan andZingales (2000), Erickson and Whited (2000), Gomes (2001), Alti (2003), Moyen (2004).
5
negative shock.
The rest of the paper is structured as follows. In Section 2, we describe our data. In Section 3,
we present our empirical results. In Section 4, we present robustness checks and Section 5 concludes
the paper.
2 Data
In this section, we describe the construction of the dataset and present summary statistics.
2.1 Sample and Variable Construction
We create a yearly panel of firms in the United States and the euro area by merging the following
three datasets: issuer rating information from Moody’s Analytics, firm balance sheet information
from Worldscope, and acquisition information from Thomson’s SDC platinum. All three data
sources provide coverage for both the United States and the euro area, which ensures comparability.
We restrict our sample to years from 2005 to 2014, because Moody’s Analytics is only available
from 2004, and we lag independent variables by one year.
We will now describe our three data sources in more detail. Moody’s Analytics provides data
on whether a firm has either an S&P or a Moody’s firm-level issuer rating at a daily frequency. We
aggregate this information at the yearly level. We define Rating as a dummy variable equal to one
if the firm has an S&P and/or a Moody’s issuer rating at the end of the year.
Using firm ISIN, we merge this information with consolidated balance sheet information from
Worldscope. Worldscope is the standard data source for international balance sheet information
of publicly-listed companies and has been used in many studies (e.g. Faccio and Masulis (2005)).
We use Worldscope to obtain information on capital expenditures, cash and EBITDA – all as a
fraction of total firm assets – as well as market-to-book and leverage ratios. We follow Harford and
Uysal (2014) in constructing these variables. We present more details on variable construction in
Appendix B.
6
We use acquisitions data from Thomson’s SDC platinum. Following Harford and Uysal (2014),
we only include acquisitions that fulfill the following two criteria: the acquisitions must be “domestic”
–defined as U.S. acquisitions for U.S. firms and euro-area acquisitions for euro area firms– and the
ratio of the total value of an acquirer’s acquisitions in a year to the acquirer’s total assets in the
year prior must be greater than one percent. After these filters, we are left with 3,374 acquisitions
for the United States and 863 acquisitions for the euro area. Using these acquisitions, we construct
the following two yearly variables: Acquisition Dummy, which is equal to one if the firm undertakes
at least one acquisition in a given year and Acquisition Value, defined as the aggregate value of
all qualifying acquisitions in a year divided by the acquirer’s total assets. For firms in the United
States, we match this information to our dataset using the CUSIP of the acquirer or its ultimate
parent, while we use the SEDOL of the acquirer or its ultimate parent for euro area firms.
On our combined dataset, we employ the following filters that follow Harford and Uysal (2014):
we exclude financial firms and regulated utilities (SIC codes 6000-6999 and 4900-4999), drop firms
with sales under 10 million when adjusted to 1990 U.S. dollars, and keep only observations where
no independent and dependent variables are missing. Our final dataset includes 22,573 firm-year
observations for the United States and 15,054 for the euro area. To limit the effect of outliers, we
further winsorize all continuous variables at the 1 and 99 percent level. All euro area information
is converted to U.S. dollars using year-end exchange rates.
2.2 Summary Statistics
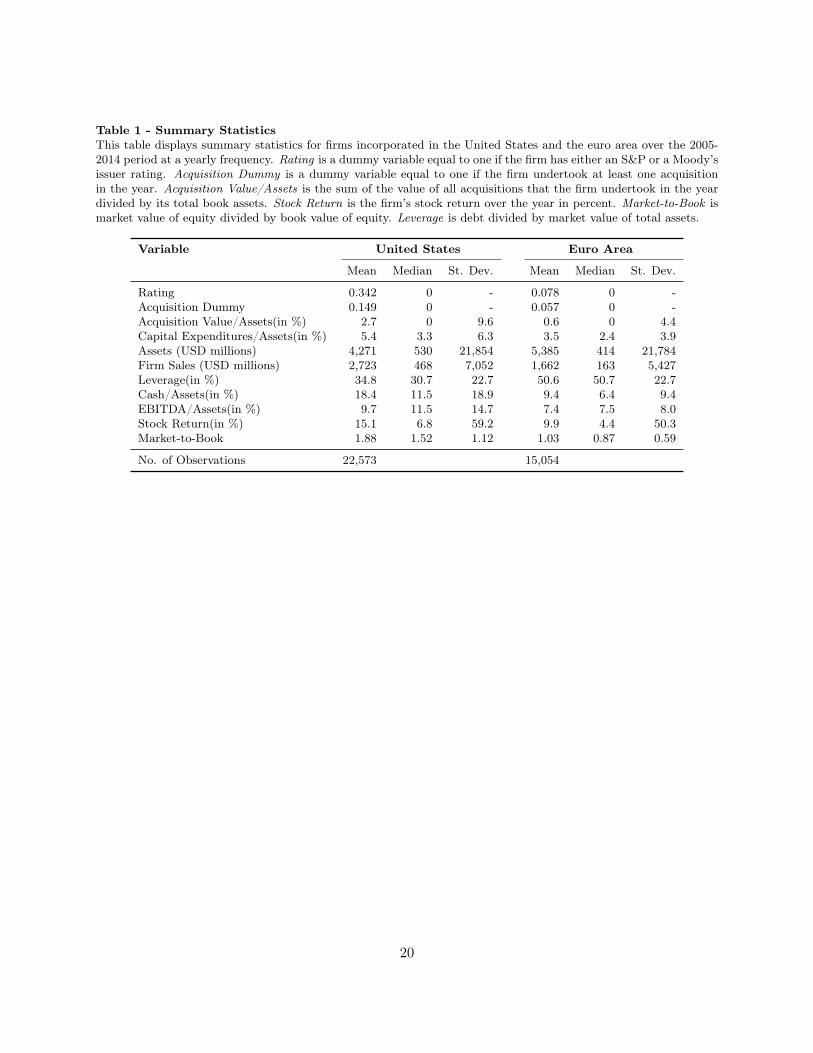
In Table 1, we display summary statistics for the United States and the euro area. As one would
expect given the smaller bond market, only 7.8 percent of euro area firms are rated compared to
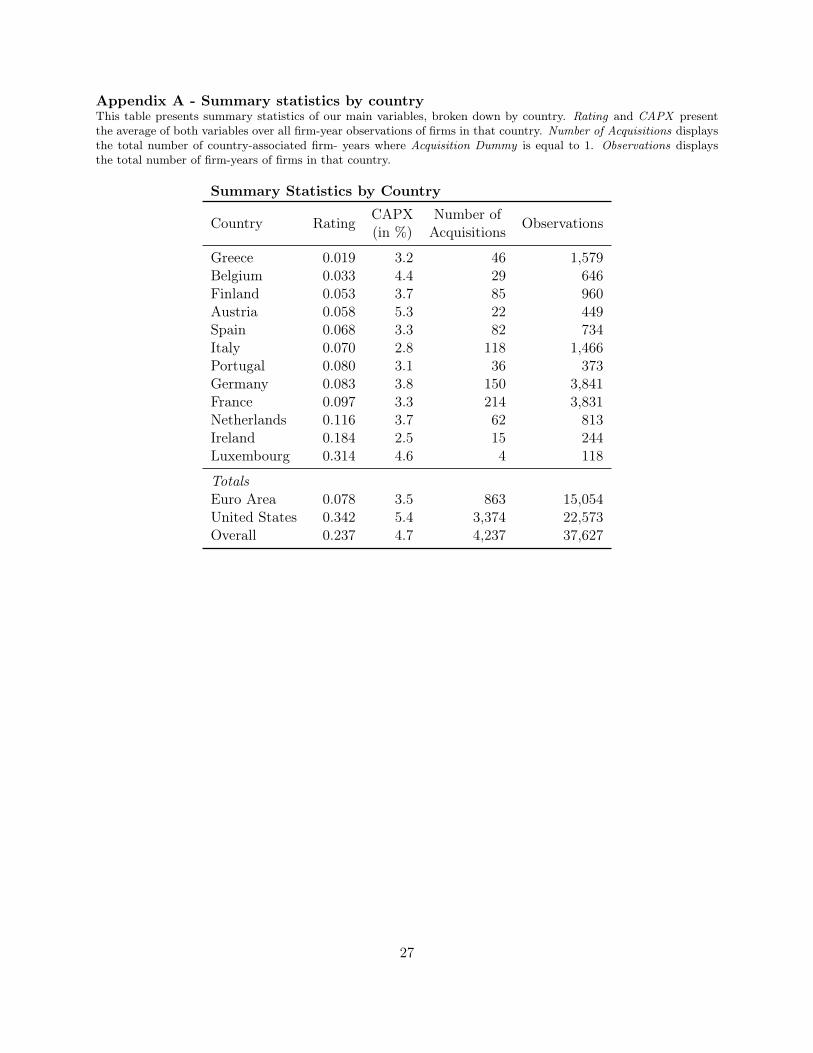
34.2 percent in the United States. In Appendix A, we present country-level summary statistics for
Rating, CAPX and the number of acquisitions. Euro-area countries differ in how many firms have
a rating. While Luxembourg with 31.4 percent of firms being rated is close to the United States,
in Greece - the country with the fewest ratings - only 2 percent of firms have a rating. The largest
economies are close to the sample mean, with 8.3 percent of German and 9.7 percent of French firms
having a rating.
7
Similarly, acquisitions are less common in the euro area: the probability of undertaking an
acquisition is only 5.7 percent compared to 14.9 percent in the United States. Furthermore, the value
of acquisitions as a share of assets is only 0.6 percent compared to 2.7 percent in the United States.
Euro area firms also spend less on capital expenditures: the median firm has capital expenditures
of 2.4 percent of assets in the euro area compared to 3.3 percent in the United States. While firms
in the two samples are of roughly similar size in terms of assets, U.S. firms have higher sales (mean
of 2.7 billion vs. 1.7 billion).
Firms in the United States seem to be in better financial conditions: their average leverage
(defined as debt over market value of equity) is only 35 percent compared to 50 percent in the euro
area and they on average hold almost twice as much cash as a fraction of assets. More generally,
U.S. firms seem to be more profitable. They have higher average earnings of 9.7 percent compared
to 7.4 percent for euro-area firms, higher average stock returns (15.1 percent vs. 9.9 percent), and
a higher market-to-book ratio of (1.88 vs 1.03). While there are clear differences between firms
in the United States and the euro area, it is unlikely that they are driving our results. In fact,
given that euro-area firms have weaker financial conditions, we would expect their investment to be
more responsive to their access to external financing, which would make bond market access more
important for euro-area firms. It must be noted that some of the differences may be due to different
accounting standards in the two regions.
The summary statistics for our United States subsample are fairly similar to those in Harford
and Uysal (2014), which are based on COMPUSTAT/CRSP data. This gives us confidence in using
Worldscope data for the United States.
3 Results
3.1 Bond market access and investment in the United States
In this subsection we study how access to bond markets affects investment in the United States. This
question is addressed by Harford and Uysal (2014), who find that firms with a rating are more likely
8
to undertake an acquisition. To replicate their analysis, we regress Acquisition Dummy on Rating in
our panel of U.S. firms. We follow Harford and Uysal (2014) and control for several variables that
likely affect the acquisition probability and may be correlated with having a rating. These variables
include the following: firm size, measured by the logarithm of sales, cash holdings, leverage, prior
year’s stock return, market-to-book ratio and earnings.We also control for two industry specific
variables: market concentration within the industry measured as the Herfindahl index and M&A
liquidity measured as the value of acquisitions in the industry divided by the industry’s total assets.
We form industries based on 3-digit SIC codes. We also include year fixed effects. Because our
dependent variable, Acquisition Dummy, is binary, we run a probit regression. To account for
autocorrelation within firms, we cluster standard errors at the firm level.
The results are presented as Regression 1 in Table 2. We clearly confirm the finding of Harford
and Uysal (2014) that U.S. firms with a rating undertake more acquisitions. According to our
results, a U.S. corporation is 3.5 percentage points more likely to undertake an acquisition in a
given year if it has a bond rating. This is slightly smaller than the 4.6 percentage points increase
that Harford and Uysal (2014) find, but still constitutes an increase of 23 percent relative to the
mean acquisition probability. Also, our control variables generally affect acquisitions in the same
direction as in Harford and Uysal (2014) with the exception of Cash, which is insignificant.
Next, we extend their paper by studying how much firms spend on acquisitions. We use Acqui-
sition Value as the dependent variable, which is defined as the total value of all acquisitions made
within a year as a share of the firm’s assets. Because this variable is continuous, we use OLS rather
than probit analysis though otherwise the set-up is the same as before. We present the result in
Regression 2 of Table 2. We find that U.S. firms with a rating spend 0.6 percent of assets more on
acquisitions than firms without a rating, which corresponds to a 22 percent increase relative to the
sample mean. This finding shows that rated U.S. firms spend more on acquisitions in addition to
being more likely to undertake them.
Besides acquisitions, firms can also invest via capital expenditures. Thus, we now study whether
U.S. firms with a rating also have higher capital expenditures. We use the same regression set-up
as before, but drop M&A liquidity and the Herfindahl index, because these control variables are
9
specific to analyzing acquisitions. We present the result in Regression 3 of Table 2. We find that
U.S. firms with a rating spend 0.8 percent more of assets on capital expenditures per year. This
value corresponds to a 15 percent increase relative to the sample mean. Thus, debt market access
leads not only to more acquisitions, but also to higher capital expenditures. Taken together, our
results confirm the findings of Harford and Uysal (2014) for the United States subsample: bond
market access seems to reduce a firm’s financial constraints and allows it to invest more, both
through higher capital expenditures and more acquisitions.
3.2 Bond market access and investment in the euro area
We proceed by testing whether bond market access also increases investment in the euro area. We
conduct the same analysis used in our United States subsample for our subsample of euro area firms.
We present the results in Regressions 4 to 6 of Table 2. In contrast to our results for the United
States, we are unable to detect any effect of bond ratings on investment in our euro-area sample.
The marginal effect of having a rating on the annual acquisition probability of firms in the euro
area is only 0.7 percentage points and this effect is not statistically significant. Moreover, the effect
of having a rating on the value of acquisitions and capital expenditures as a percentage of assets
is actually insignificantly negative. In sum, these results suggest that having access to the bond
market has no effect on investment in the euro area.
Furthermore, we test whether the difference in the effect of having a rating between the United
States and the euro area is statistically significant. For this analysis, we study a combined sample
including both euro-area and U.S. firms. Our explanatory variable of interest is an interaction
between Rating and Euro Area, which is a dummy variable equal to one for firms in the euro area.
We use the same dependent and control variables as before. In addition, we include each control
variable interacted with Euro Area to allow control variables to have a different effect in the United
States and the euro area. Different effects of control variables may be driven by differences in the
institutional environments, accounting rules and taxation rules.
We present the results in Table 3. The effect of having a rating on the probability of undertaking
10
an acquisition is 1.7 percentage points lower in the euro area. While this difference is large, it is not
statistically significant. The effect of having a rating on the value of acquisitions is 0.7 percentage
points lower in the euro area, which is significant at the 1 percent threshold. Similarly, having
a rating increases capital expenditures by 0.9 percentage points less in the euro area, which is
also significant at the 1 percent threshold. In sum, our results suggest that bond market access
has almost no effect on investment in the euro area and that the effect of bond market access is
substantially less important in the euro area than in the United States.
3.3 Why is corporate bond market access less important in the euro area?
In this section, we discuss potential explanations for the surprising result that corporate bond
market access has almost no effect on investment in the euro area, while it has a large effect in
the United States. In particular, we will relate this finding to the theory of financial constraints.
According to this theory, firms are financially constrained from undertaking profitable investment
opportunities. If these constraints are lifted, firms can invest more. With respect to this theory, our
findings suggest that bond market access alleviates financial constraints in the United States, while
it does not change financial constraints for euro-area firms. There are two fundamental explanations
why bond market access does not affect financial constraints in the euro area. We will refer to them
as the weak bond market hypothesis and the strong banking hypothesis.
The weak bond market hypothesis states that bond market access is less important in the euro
area, because bond markets in the euro area are underdeveloped and can supply only little financing.
Indeed, the EU investment grade corporate bond market is only about 60 percent the size of the US
corporate bond market and the high yield market is only a third the size of the US market.5 Thus,
there may not be sufficient funds available through the corporate bond market and/or the available
funds may be too expensive to be attractive. According to the weak bond market hypothesis, even
euro-area firms with bond market access are financially constrained and would like to access a
stronger bond market.5See “Stimulating EU corporate bond and equity markets” http://www.eurofi.net/wp-content/uploads/2014/09/Stimulating-EU-corporate-bond-Web.pdf
11
In contrast, the strong banking hypothesis argues that good access to bank financing in the more
bank-based economies of the euro area makes bond market access redundant. Bank financing plays
a much more prominent role in the euro area: In 2001, bank loans to the corporate sector were 43
percent of GDP in the euro area, while they were only 19 percent of GDP in the United States
(De Fiore and Uhlig (2005)). The literature has proposed several reasons why bank financing can
be cheaper than bond financing: For example, banks may have an advantage in monitoring the
borrower (Diamond (1984)), they may have access to inside information (Fama (1985)) and they
may have better incentives to monitor and acquire information (Boot and Thakor (2010)). Thus, the
finding that bond market access matters less in the euro area may not be driven by the weakness
of the euro-area bond market, but the strength of the euro-area banking system. Indeed, if all
euro-area firms have sufficient access to financing through their banks, we would expect the bond
market to have little effect on investment decisions. Under this assumption, all euro-area firms are
financially unconstrained, even those that do not have a bond rating.
In the remainder of the paper, we examine which of the two hypotheses is more likely to drive
our results. This question has profound policy implications. If the weak bond market hypothesis is
true, euro-area investment and growth could be improved by regulation that supports a stronger
bond market in the euro area. We can use our results to estimate how much investment in the
euro area may go up if its bond market were as strong as the one in the United States (and the
weak bond market hypothesis holds). As mentioned above, the differential effect of having a bond
rating in the United States vs. the euro area is 0.7 percent on acquisitions and 0.9 percent on
capital expenditures. If euro-area firms with a bond rating increase their investment activity by
that much, it would result in yearly additional investments of approximately $100 billion ( $45
billion via acquisitions and $57 billion via capital expenditures), because euro-area firms with a
rating have combined assets of $6.4 trillion. However, the effect might be even larger if bond ratings
would become as prevalent in the euro-area as in the United States. In the United States, rated
firms account for 92 percent of total assets of publicly-traded companies, while it is only 68 percent
in the euro area. If 92 percent of euro-area firms were rated (by assets), the effect of a stronger
bond market on investment could be $138 billion ( $60 billion via acquisitions and $78 billion via
12
capital expenditures) per year, which corresponds to 1.1 percent of GDP.6
However, these calculation only hold under the weak bond market hypothesis. In contrast, if the
strong banking hypothesis is true, it implies that the irrelevance of the euro-area bond market is
no reason for concern. Rather, one might argue that U.S. regulators should try to improve the
U.S. banking system to relieve financial constraints to U.S. firms without a bond rating. Of course,
both hypotheses are highly stylized and they may both be true to some extent. Also possible are
interactions between the two hypotheses. For example, a strong banking system may prevent the
development of a strong corporate bond market or vice versa.
3.4 Change in bond market importance after the financial crisis
In this section, we try to distinguish between our two hypotheses by studying how the importance of
the bond market changed after the financial crisis of 2008. We use the fact that the financial crisis
was mainly a banking crisis, and that corporate lending by banks contracted significantly following
the crisis (Becker and Ivashina (2014)). If the strong banking hypothesis is correct, and our results
are explained by the importance of bank financing in the euro area, we would expect bond ratings
to become more important at such a time as bank financing becomes unavailable.
We run a difference-in-difference regression to examine how investment changes for firms with
and without a rating after the crisis.We use 2009 to 2014 as the post-event period and 2005 to
2007 as the pre-event period. We exclude the year of 2008, because bank funding to firms only
started to contract strongly towards the end of 2008. Our treated group consists of firms that have
a rating in 2004, the first year of our sample. We fix Rating at the beginning of the sample period
to avoid endogeneity issues, and to ensure that our treatment group does not change from one
year to the next. Because it is unlikely that firms undertake many acquisitions during a financial
crisis, we focus our attention on investment measured by capital expenditures. As is standard in
difference-in-difference analyses, we include firm and year fixed effects. Furthermore, we cluster
standard errors at the firm level to control for autocorrelation (Bertrand, Duflo, and Mullainathan6$100 billion = (0.007×$6.4 trillion + 0.009×$6.4 trillion). Our estimate for GDP is calculated based on current U.S.dollar market prices available via The World Bank.
13
(2004)).
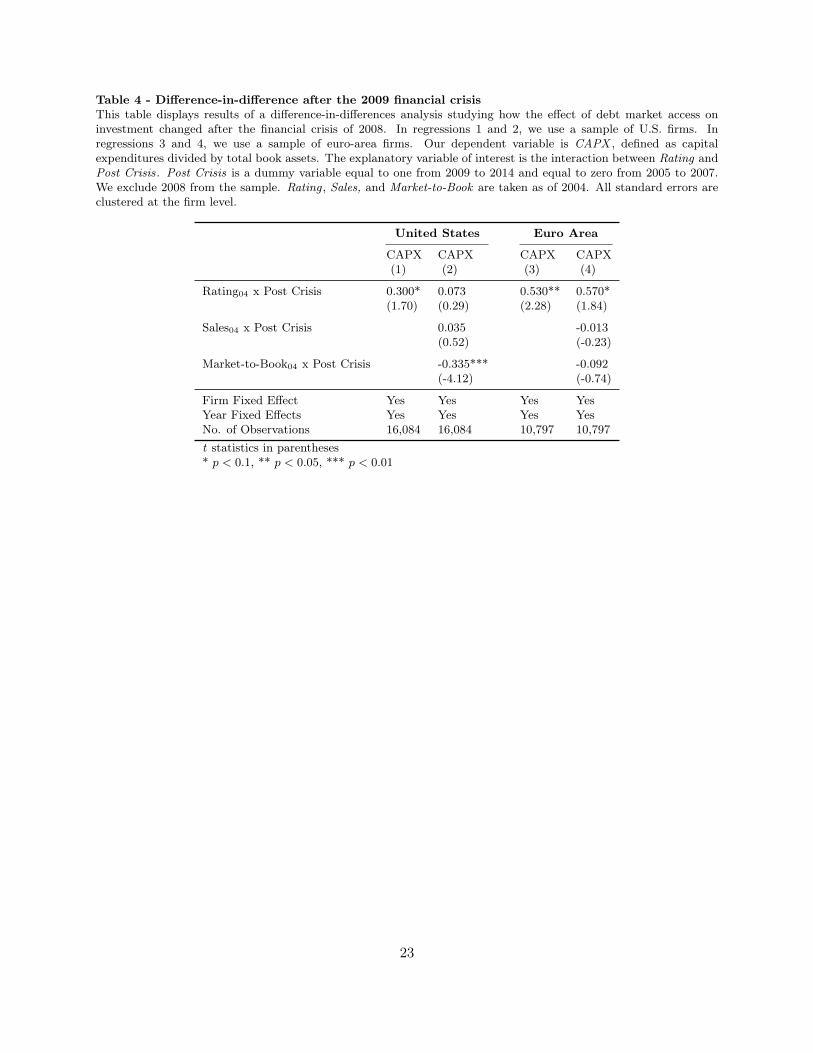
We present the results in Table 4. We start by examining the United States. We find that
firms with a bond rating in 2004 increase their investment somewhat more after the financial crisis.
The effect size is 0.3 percentage points in terms of assets and is marginally significant at the 10
percent level. One concern in this set-up is that Rating is correlated with other characteristics such
as size or market-to-book ratio and that these variables are causing the effect on investment. In
general, it is not a good idea to include time-varying control variables in a difference-in-difference
specification, because these variables can be effected by the event and thus are endogenous. Instead,
it is a common methodology to fix control variables before the event and interact them with the
post event dummy variable. This set-up controls for a differential effect of the event depending on
the control variable, such as a bigger effect on larger firms. In Regression 2, we implement this
methodology by adding Sales and Market-to-Book measured in 2004 interacted with Post Crisis.
After we add these additional controls, the effect of Rating becomes insignificant. This suggests
that bond market access does not become more important after the financial crisis for firms in the
United States.
Next, we conduct the same analysis for our euro area sample. We present the results in Re-
gressions 3 and 4 of Table 4. In the euro area, we see a clear increase in the importance of bond
market access after the financial crisis. After the crisis, firms with a bond rating increase their
capital expenditures by 0.5 percentage points compared to firms without a bond rating. This result
is significant at the 5 percent level. After we include the additional Sales and Market-to-Book mea-
sured in 2004 interacted with Post Crisis, the effect increases to 0.6 percentage points. This finding
is consistent with the strong banking hypothesis: it suggests that firms issue more bonds after the
financial crisis when they have less access to bank financing. It is also consistent with the idea that
bond market access was less relevant in the euro area before the crisis, because firms had sufficient
bank financing and did not need bond market access to fund their investments.
14
3.5 The effect of bond ratings on capital structure
In addition to investment activity, access to a bond rating may also affect a firm’s capital structure.
In fact, you would expect a rated firm’s leverage to be higher if having a rating allows it to take more
credit to invest more. This question is addressed by Faulkender and Petersen (2006), who show
that U.S. firms with a bond rating have higher leverage. We replicate their analysis for the United
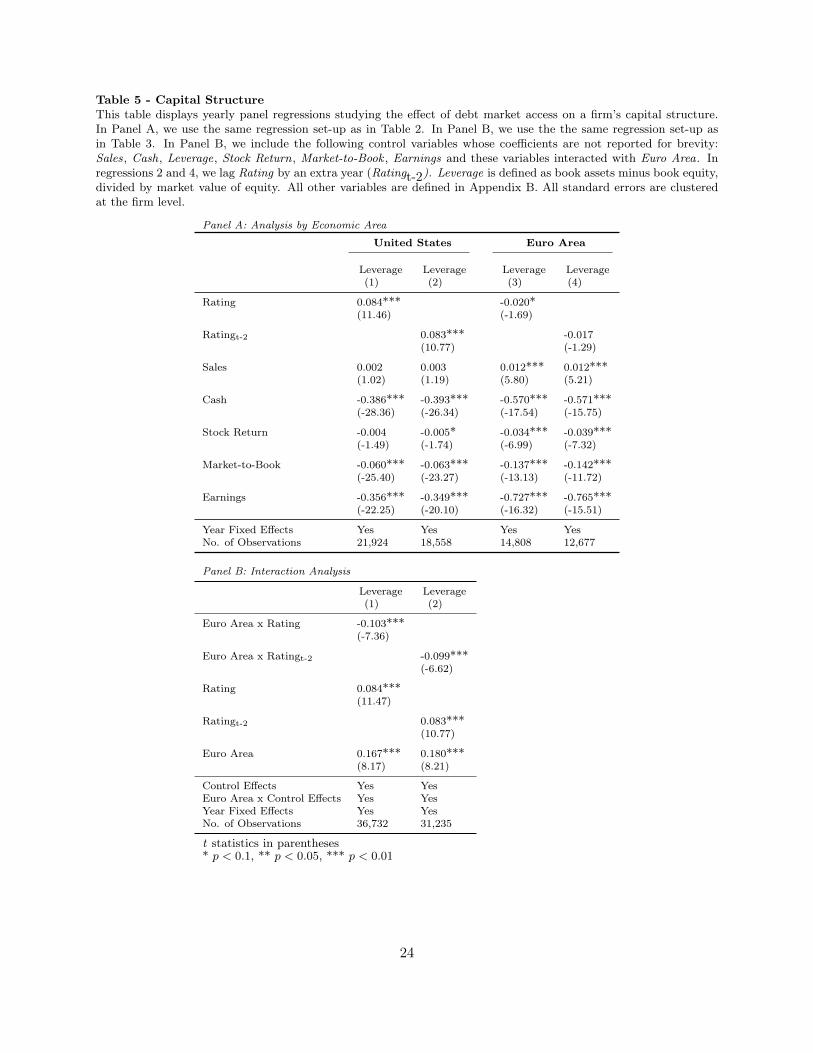
States and extend it to the euro area. We present the results in Table 5. We use the same regression
set-up as in Tables 2 and 3. In addition, we also report results lagging Rating by an additional year
to better control for endogeneity. We can confirm the result of Faulkender and Petersen (2006) for
the United States. U.S. firms with a corporate bond rating have leverage that is 8.4 percentage
points or 24 percent higher than that of unrated companies. In contrast, in the euro area we do not
find any effect of rating on leverage. In fact the coefficient is actually negative (but only marginally
significant). Next, we run our interaction analysis with leverage as the dependent variable. We find
that the difference in the effect of bond rating on leverage between the euro area and the United
States is both statistically and economically significant. Bond market access increases leverage by
10 percentage points more in the United States than in the euro area. This result is significant at
the 1 percent level. Our finding is consistent with the interpretation that a bond rating reduces
financial constraints in the United States but not in the euro area. However, it also points to a
potential negative effect of stronger bond markets: If stronger bond markets allow firms to take
more leverage, they may be more likely to go bankrupt in an economic downturn.
4 Robustness check
4.1 Addressing reverse causality
One concern is that our results may be affected by reverse causality. It is possible that a firm gets
a bond rating in order to invest more and that this behavior is causing the positive association
between bond ratings and investment. However it is not clear why such reverse causality would
differ between the United States and the euro area, which is necessary for it to drive our effects.
15
Nonetheless, we try to address this reversed causality issue by lagging Rating by an additional year,
following Harford and Uysal (2014).
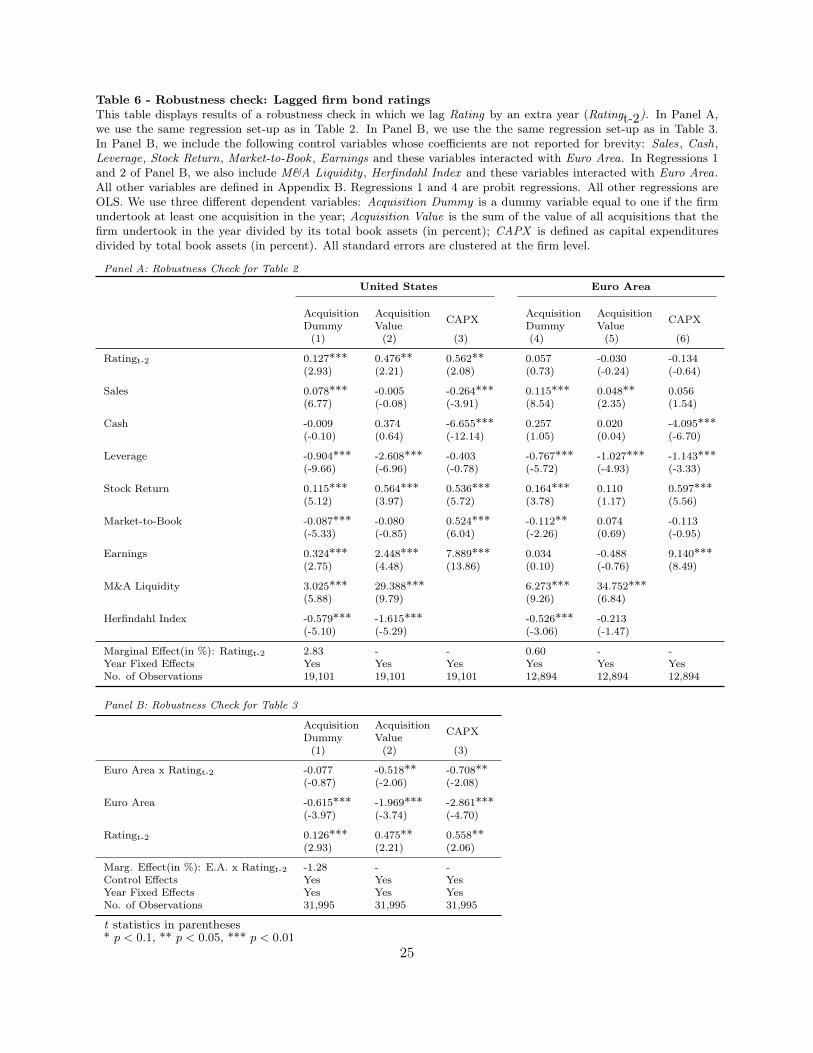
We present the results in Table 6. In Panel A, we repeat our analysis for the separate US and
euro area samples. Lagging Rating by an additional year does not significantly change our results.
The results for the United States remain statistically significant and of similar economic magnitude.
The effects in the euro area remain close to zero.
In Panel B, we repeat our analysis on the full sample, where we interact Rating with the euro
area dummy variable. For brevity, we do not report the coefficients of the control variables. Similar
to Panel A, the extra lag of one year does not change our results. Taken together, these findings
suggest that our effect is not driven by reverse causality.
4.2 Include only firms with at least one acquisition
One concern with Thomson’s SDC platinum is that it only includes acquisitions, but it does not
provide a list of firms for which it does not find any acquisitions. In our main specification, we assume
that a firm does not undertake an acquisition if no acquisition is listed for it in SDC Platinum. In
this robustness check, we conduct a more conservative approach in which we exclude all firms from
our sample for which we do not observe at least one acquisition. This ensures that the firm has
been successfully matched to Thomson’s SDC platinum.
The results are presented in Table 7. Panel A contains a replication of our specification in Table
2, while Panel B contains a replication of our specification in Table 3. In both cases, our results
remain of similar statistical and economic magnitude. The difference between the United States
and the euro area in terms of Acquisition Value is even slightly larger. This suggests that issues
with matching to SDC Platinum are not driving our results.
16
5 Conclusion
We compare how access to corporate bond markets affects a firm’s investment policy and capital
structure differently in the United States and the euro area. We measure bond market access by
whether a firm has a debt rating. For the United States, we find that firms with a debt rating
undertake more acquisitions, spend more on acquisitions, invest more via capital expenditures and
have higher leverage. In contrast, we do not find any effects of bond market access on investment
in the euro area. These findings suggest that bond market access alleviates financial constraints in
the United States, but has no effect in the euro area.
We propose two potential hypotheses to explain why the euro-area corporate bond market seems
to be irrelevant for investment. The weak bond market hypothesis suggests that the bond market
is too small and insufficiently developed to provide substantial financing to firms. In contrast,
the strong banking hypothesis suggests that euro-area firms do not rely much on the bond market,
because they can get cheaper financing from euro-area banks. Consistent with the later explanation,
we find that the importance of bond market access increases in the euro area when banks are reducing
their lending to firms, such as after the 2008-2009 financial crisis.
Our research contributes to a important policy debate on the importance of corporate bond
markets for firm investment and whether regulation should help to improve the quality of bond
markets in the euro area. Our results suggest that investment in the euro-area would increase by X
percent of GDP per year if rated euro-area firms would invest as much as rated U.S. firms. It would
increase by an additional X percent of GDP if bond ratings would become as common in the euro
area as in the United States. However, our result in favor of the strong banking hypothesis suggest
that it is unlikely that such increases in investment would occur even if the euro-area corporate bond
markets reaches the size of its U.S. counterpart. Rather, our results seem consistent with euro-area
firms choosing not to raise money from corporate bond markets, because they have sufficient access
to bank financing (at least before the crisis). Thus, our paper also highlights that prior evidence
on the importance of bond market access in the United States cannot be directly applied to more
bank-based economies such as the euro area.
17
References
Almeida, Heitor, and Murillo Campello, 2007, Financial constraints, asset tangibility, and corporateinvestment, Review of Financial Studies 20, 1429-1460.
Almeida, Heitor, Murillo Campello, Bruno Laranjeira, and Scott Weisbenner, 2009, Corporate debtmaturity and the real effects of the 2007 credit crisis, NBER Working Paper No. 14990.
Alti, Aydogan, 2003, How sensitive is investment to cash flow when financing is frictionless? Journalof Finance 58, 707-722.
Becker, Bo, and Victoria Ivashina, 2014, Cyclicality of credit supply: Firm level evidence, Journalof Monetary Economics 62, 76-93.
Bertrand, Marianne, Esther Duflo, and Sendhil Mullainathan, 2004, How much should we trustdifferences-in-differences estimates? Quarterly Journal of Economics 119, 249-275.
Boot, Arnoud WA, and Anjan V. Thakor, 2010, The Accelerating Integration of Banks and Marketsand its Implications for Regulation, The Oxford Handbook of Banking, 58-89. n.p.: Oxford and NewYork: Oxford University Press.
Cecchetti, Stephen G., and Enisse Kharroubi, 2012, Reassessing the impact of finance on growth,BIS Working Papers No. 381.
Chaney, Thomas, David Sraer, and David Thesmar, 2012, The collateral channel: How real estateshocks affect corporate investment, American Economic Review 102, 2381-2409.
Chava, Sudheer, and Amiyatosh Purnanandam, 2011, The effect of banking crisis on bank-dependentborrowers, Journal of Financial Economics 99, 116-135.
De Fiore, Fiorella, and Harald Uhlig, 2005, Bank finance versus bond finance, ECB Working PaperNo. 0547.
Diamond, Douglas W, 1984, Financial intermediation and delegated monitoring, Review of Eco-nomic Studies 51, 393-414.
Erickson, Timothy, and Toni M. Whited, 2000, Measurement error and the relationship betweeninvestment and q, Journal of Political Economy 108, 1027-1057.
Faccio, Mara and Ronald W. Masulis, 2005, The Choice of Payment Method in European Mergersand Acquisitions, Journal of Finance 60, 1345-1388.
Fama, Eugene F., 1985, What’s different about banks? Journal of Monetary Economics 15, 29-39.
Faulkender, Michael, and Mitchell A. Petersen, 2006, Does the source of capital affect capitalstructure? Review of Financial Studies 19, 45-79.
Fazzari, Steven, R. Glenn Hubbard, and Bruce Petersen, 1988, Investment, financing decisions, andtax policy, American Economic Review 78, 200-205.
18
Fazzari, Steven M., R. Glenn Hubbard, and Bruce C. Petersen, 2000, Investment-cash flow sen-sitivities are useful: A comment on Kaplan and Zingales, Quarterly Journal of Economics 115,695-705.
Gan, Jie, 2007, Collateral, debt capacity, and corporate investment: Evidence from a natural ex-periment, Journal of Financial Economics 85, 709-734.
Harford, Jarrad, and Vahap B. Uysal, 2014, Bond market access and investment, Journal of Finan-cial Economics 112, 147-163.
Hoshi, Takeo, Anil Kashyap, and David Scharfstein, 1990, The role of banks in reducing the costsof financial distress in Japan, Journal of Financial Economics 27, 67-88.
Kaplan, Steven N., and Luigi Zingales, 1997, Do investment-cash flow sensitivities provide usefulmeasures of financing constraints?, Quarterly Journal of Economics 112, 169-215.
Kaplan, Steven N., and Luigi Zingales, 2000, Investment-cash flow sensitivities are not valid mea-sures of financing constraints, Quarterly Journal of Economics 115, 707-712.
King, Robert G., and Ross Levine, 1993, Finance, entrepreneurship and growth, Journal of Mone-tary Economics 32, 513-542.
Law, Siong Hook, and Nirvikar Singh, 2014, Does too much finance harm economic growth? Journalof Banking & Finance 41, 36-44,
Modigliani, Franco, and Merton H. Miller, 1958, The cost of capital, corporation finance and thetheory of investment, American Economic Review 48, 261-297.
Moyen, Nathalie, 2004, Investment cash flow sensitivities: Constrained versus unconstrained firms,Journal of Finance 59, 2061-2092.
Peek, Joe and Eric S. Rosengren, 1990, Collateral Damage: Effects of the Japanese Bank Crisis onReal Activity in the United States, American Economic Review 90, 30-45.
Rajan, Raghuram G., and Luigi Zingales, 1996, Financial dependence and growth, American Eco-nomic Review 88, 559-586.
Schnabl, Philipp, 2012, The International Transmission of Bank Liquidity Shocks: Evidence froman Emerging Market, Journal of Finance 67, 897-932.
Sufi, Amir, 2009, The real effects of debt certification: Evidence from the introduction of bank loanratings, Review of Financial Studies 22, 1659-1691.
Whited, Toni M., 1992, Debt, liquidity constraints, and corporate investment: Evidence from paneldata, Journal of Finance 47, 1425-1460.
19
Table 1 - Summary StatisticsThis table displays summary statistics for firms incorporated in the United States and the euro area over the 2005-2014 period at a yearly frequency. Rating is a dummy variable equal to one if the firm has either an S&P or a Moody’sissuer rating. Acquisition Dummy is a dummy variable equal to one if the firm undertook at least one acquisitionin the year. Acquisition Value/Assets is the sum of the value of all acquisitions that the firm undertook in the yeardivided by its total book assets. Stock Return is the firm’s stock return over the year in percent. Market-to-Book ismarket value of equity divided by book value of equity. Leverage is debt divided by market value of total assets.
Table 2 - Investment and acquisitionsThis table displays yearly panel regressions studying the effect of debt market access on investment. Regressions1 and 4 are probit regressions. All other regressions are OLS. In regressions 1 through 3, we use a sample of U.S.firms. In regressions 4 through 6, we use a sample of firms from the euro area. We use three different dependentvariables: Acquisition Dummy is a dummy variable equal to one if the firm undertook at least one acquisition in theyear; Acquisition Value is the sum of the value of all acquisitions that the firm undertook in the year divided by itstotal book assets (in percent); CAPX is defined as capital expenditures divided by total book assets (in percent).All other variables are defined in Appendix B. For probit regressions, we display the marginal effect of the variableRating at the bottom of the table. All standard errors are clustered at the firm level.
Table 3 - Interaction analysisThis table displays yearly panel regressions studying the relative effect of debt market access on investment for firmsin the euro area compared to firms in the United States. The sample consists of both U.S. and euro area firms.Regressions 1 is a probit regression. All other regressions are OLS. We use three different dependent variables:Acquisition Dummy is a dummy variable equal to one if the firm undertook at least one acquisition in the year;Acquisition Value is the sum of the value of all acquisitions that the firm undertook in the year divided by its totalbook assets (in percent); CAPX is defined as capital expenditures divided by total book assets (in percent). All othervariables are defined in Appendix B. For probit regressions, we display the marginal effect of the variable interactionEuro Area x Rating at the bottom of the table. All standard errors are clustered at the firm level.
Euro Area x Earnings -0.370 -2.704*** 0.946(-1.12) (-3.30) (0.81)
M&A Liquidity 2.430*** 27.021***(8.19) (10.82)
Euro Area x M&A Liquidity 3.598*** 7.201(5.80) (1.43)
Herfindahl Index -0.550*** -1.503***(-5.23) (-4.93)
Euro Area x Herfindahl -0.045 1.231***(-0.23) (3.67)
Marg. Effect(in %): Euro Area x Rating -1.70 - -Year Fixed Effects Yes Yes YesNo. of Observations 37,627 37,627 37,627t statistics in parentheses* p < 0.1, ** p < 0.05, *** p < 0.01
22
Table 4 - Difference-in-difference after the 2009 financial crisisThis table displays results of a difference-in-differences analysis studying how the effect of debt market access oninvestment changed after the financial crisis of 2008. In regressions 1 and 2, we use a sample of U.S. firms. Inregressions 3 and 4, we use a sample of euro-area firms. Our dependent variable is CAPX , defined as capitalexpenditures divided by total book assets. The explanatory variable of interest is the interaction between Rating andPost Crisis. Post Crisis is a dummy variable equal to one from 2009 to 2014 and equal to zero from 2005 to 2007.We exclude 2008 from the sample. Rating , Sales, and Market-to-Book are taken as of 2004. All standard errors areclustered at the firm level.
United States Euro Area
CAPX CAPX CAPX CAPX(1) (2) (3) (4)
Rating04 x Post Crisis 0.300* 0.073 0.530** 0.570*(1.70) (0.29) (2.28) (1.84)
Sales04 x Post Crisis 0.035 -0.013(0.52) (-0.23)
Market-to-Book04 x Post Crisis -0.335*** -0.092(-4.12) (-0.74)
Firm Fixed Effect Yes Yes Yes YesYear Fixed Effects Yes Yes Yes YesNo. of Observations 16,084 16,084 10,797 10,797t statistics in parentheses* p < 0.1, ** p < 0.05, *** p < 0.01
23
Table 5 - Capital StructureThis table displays yearly panel regressions studying the effect of debt market access on a firm’s capital structure.In Panel A, we use the same regression set-up as in Table 2. In Panel B, we use the the same regression set-up asin Table 3. In Panel B, we include the following control variables whose coefficients are not reported for brevity:Sales, Cash, Leverage, Stock Return, Market-to-Book , Earnings and these variables interacted with Euro Area. Inregressions 2 and 4, we lag Rating by an extra year (Ratingt-2). Leverage is defined as book assets minus book equity,divided by market value of equity. All other variables are defined in Appendix B. All standard errors are clusteredat the firm level.
Year Fixed Effects Yes Yes Yes YesNo. of Observations 21,924 18,558 14,808 12,677
Panel B: Interaction Analysis
Leverage Leverage(1) (2)
Euro Area x Rating -0.103***(-7.36)
Euro Area x Ratingt-2 -0.099***(-6.62)
Rating 0.084***(11.47)
Ratingt-2 0.083***(10.77)
Euro Area 0.167*** 0.180***(8.17) (8.21)
Control Effects Yes YesEuro Area x Control Effects Yes YesYear Fixed Effects Yes YesNo. of Observations 36,732 31,235
t statistics in parentheses* p < 0.1, ** p < 0.05, *** p < 0.01
24
Table 6 - Robustness check: Lagged firm bond ratingsThis table displays results of a robustness check in which we lag Rating by an extra year (Ratingt-2). In Panel A,we use the same regression set-up as in Table 2. In Panel B, we use the the same regression set-up as in Table 3.In Panel B, we include the following control variables whose coefficients are not reported for brevity: Sales, Cash,Leverage, Stock Return, Market-to-Book , Earnings and these variables interacted with Euro Area. In Regressions 1and 2 of Panel B, we also include M&A Liquidity , Herfindahl Index and these variables interacted with Euro Area.All other variables are defined in Appendix B. Regressions 1 and 4 are probit regressions. All other regressions areOLS. We use three different dependent variables: Acquisition Dummy is a dummy variable equal to one if the firmundertook at least one acquisition in the year; Acquisition Value is the sum of the value of all acquisitions that thefirm undertook in the year divided by its total book assets (in percent); CAPX is defined as capital expendituresdivided by total book assets (in percent). All standard errors are clustered at the firm level.
t statistics in parentheses* p < 0.1, ** p < 0.05, *** p < 0.01
25
Table 7 - Robustness check: Only firms with at least one acquisitionThis table displays results of a robustness check in which we exclude all firms from our sample for which we do notobserve at least one acquisition. In Panel A, we use the same regression set-up as in Table 2. In Panel B, we use thethe same regression set-up as in Table 3. In Panel B, we include the following control variables whose coefficients arenot reported for brevity: Sales, Cash, Leverage, Stock Return, Market-to-Book , Earnings, M&A Liquidity , HerfindahlIndex and these variables interacted with Euro Area. All other variables are defined in Appendix B. Regressions 1and 3 are probit regressions. All other regressions are OLS. We use two different dependent variables: AcquisitionDummy is a dummy variable equal to one if the firm undertook at least one acquisition in the year; Acquisition Valueis the sum of the value of all acquisitions that the firm undertook in the year divided by its total book assets (inpercent). All standard errors are clustered at the firm level.
Panel A: Robustness Check for Table 2
United States Euro Area
Acquisition Acquisition Acquisition AcquisitionDummy Value Dummy Value(1) (2) (3) (4)
Euro Area x Rating -0.056 -0.882***(-0.69) (-2.68)
Euro Area -0.006 -2.423**(-0.03) (-2.51)
Rating 0.128*** 0.865***(3.30) (3.08)
Marg. Effect(in %): Euro Area x Rating -1.46 -Control Effects Yes YesYear Fixed Effects Yes YesNo. of Observations 20,461 20,461
t statistics in parentheses* p < 0.1, ** p < 0.05, *** p < 0.01
26
Appendix A - Summary statistics by countryThis table presents summary statistics of our main variables, broken down by country. Rating and CAPX presentthe average of both variables over all firm-year observations of firms in that country. Number of Acquisitions displaysthe total number of country-associated firm- years where Acquisition Dummy is equal to 1. Observations displaysthe total number of firm-years of firms in that country.
Summary Statistics by Country
Country Rating CAPX Number of Observations(in %) Acquisitions
TotalsEuro Area 0.078 3.5 863 15,054United States 0.342 5.4 3,374 22,573Overall 0.237 4.7 4,237 37,627
27
Appendix B - Variable definitionsThis table shows variable definitions of all variables used in the regressions in alphabetical order. All variables areon the firm-year level. Firm subscripts are omitted for brevity. All continuous variable are winsorized at the 1 and99 percent levels.
Variable Definitions
Acquisition Dummyt Equal to one if a firm makes one or more acquisition(s)in a given year.
Acquisition Valuet Total value of acquisitions (SDC VAL)t
Assetst−1
Assetst The total book value of assets of a firm at the endof a year according to its balance sheet. (WS 07230)
Book Equityt Assetst + Ititct − Liabilitiest − Preferred Stock t
CAPX t Total capital expenditures (WS 04601)t
Assetst−1
Casht A firm’s cash holdings (WS 02001)t
Assetst.
Common Out t Common shares outstanding at the end of a yearaccording to a firm’s balance sheet. (WS 05301)
EBITDAt A firm’s earnings before interest, taxes, depreciation andamortization at the end of a year according toits balance sheet. (WS 18198)
Earningst EBITDAt
Assetst
Euro Area Equal to one (1) if a firm is incorporatedin the Euro Area. (WS 06026)
Firm Sales The sales, net of excise taxes, of a firm throughout aperiod adjusted to 2004 dollars. (WS 01001)
Herfindahl The sum of (Market Sharet)2 for firms sharing a 3-digit SIC-code.
Ititct Deferred taxes and investment tax credit at theend of the year according to a firm’s balance sheet. (WS 04101)
Leveraget Assetst − Book Equityt
Market Valuet
Liabilitiest The total book value of liabilities of a firm at the endof a year according to its balance sheet. (WS 03351)
M&A Liquidityt The sum of Acquisition Valuet for firms sharing a 3-digit SIC code
The sum of Assetst for firms sharing a 3-digit SIC code
Market Equityt Common Out t x Stock Pricet
Market Sharet Firm Salest
The sum of Firm Salest for firms sharing a 3-digit SIC-code
Data Source in parentheses:WS = Worldscope Item, SDC = SDC Platinum M&A Item, MCE = Moody’s CreditEdge