30
FINANCIAL STATEMENTS 31.12.2013 INVESTOR PRESENTATION 26 FEBRUARY 2014

FINANCIAL STATEMENTS 31.12.2013
INVESTOR PRESENTATION26 FEBRUARY 2014
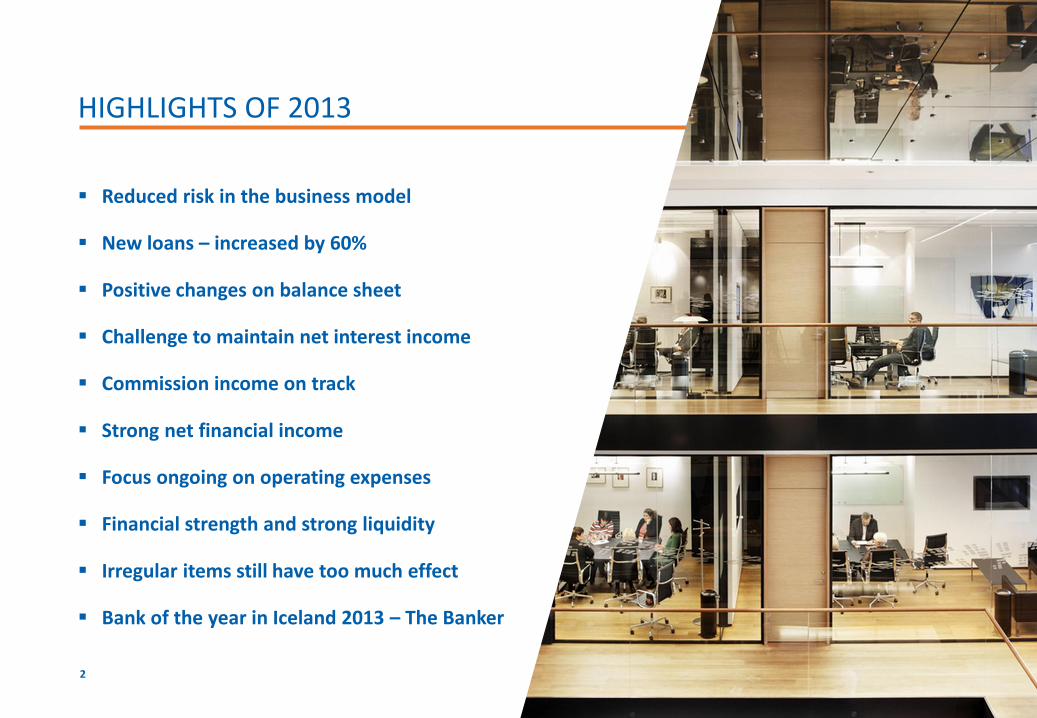
Reduced risk in the business model
New loans – increased by 60%
Positive changes on balance sheet
Challenge to maintain net interest income
Commission income on track
Strong net financial income
Focus ongoing on operating expenses
Financial strength and strong liquidity
Irregular items still have too much effect
Bank of the year in Iceland 2013 – The Banker
HIGHLIGHTS OF 2013
2
HIGHLIGHTS OF 2013
3
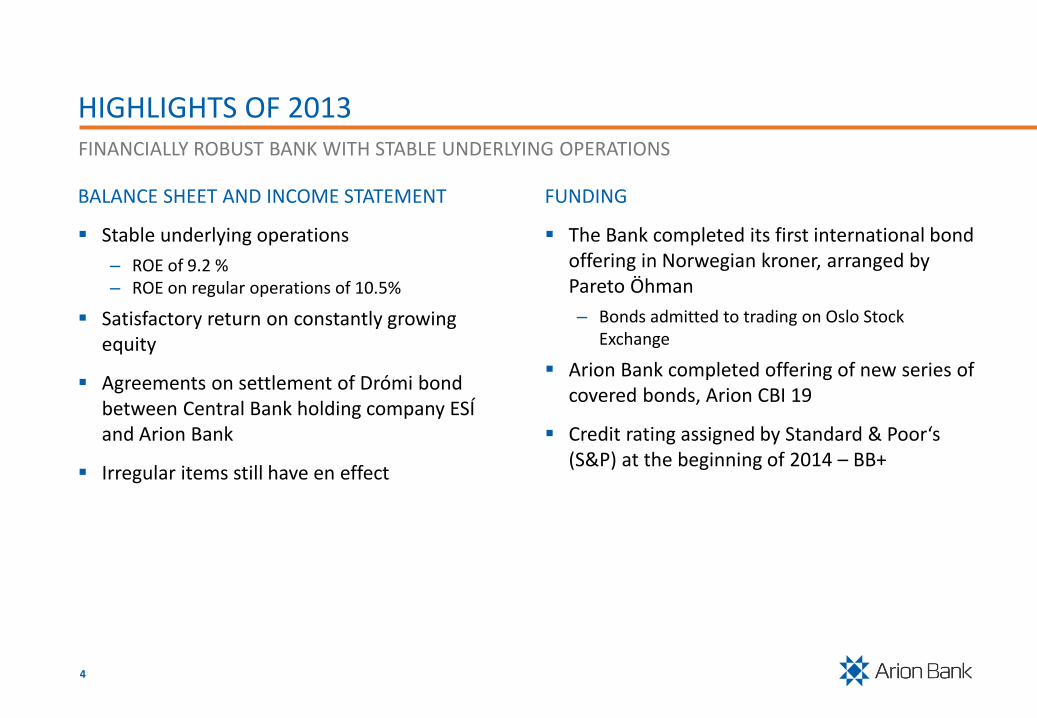
BALANCE SHEET AND INCOME STATEMENT
Stable underlying operations
– ROE of 9.2 % – ROE on regular operations of 10.5%
Satisfactory return on constantly growing equity
Agreements on settlement of Drómi bond between Central Bank holding company ESÍ and Arion Bank
Irregular items still have en effect
FUNDING
The Bank completed its first international bond offering in Norwegian kroner, arranged by Pareto Öhman
– Bonds admitted to trading on Oslo Stock Exchange
Arion Bank completed offering of new series of covered bonds, Arion CBI 19
Credit rating assigned by Standard & Poor‘s (S&P) at the beginning of 2014 – BB+
HIGHLIGHTS OF 2013FINANCIALLY ROBUST BANK WITH STABLE UNDERLYING OPERATIONS
4

OPERATIONS
Arion Bank chosen bank of year in Iceland for 2013 by The Banker magazine
Frjálsi Pension Fund named best pension fund in European country with under 1 million inhabitants
Strong performance by Asset Management –assets under management increased by 9% between years
Growth in loan portfolio
– High relative increase in retail loans in past few years – from 25% to 50% since 2010
Problem loans
– Ratio of problem loans dropped from 12.5% to 6.3%
– Would have fallen to 4.5% without Drómi bond
The Bank is a leader in major new investment opportunities – Alvogen
Implementation of A Plus went well in 2013
Branch at Smári celebrated its 30th anniversary
CEO held 10 meetings with more than 100 employees in total to further discuss the results of the employee survey
New managing director of Corporate Banking in June – Freyr Thórdarson
Two new Directors elected to the Board
– Benedikt Olgeirsson– Björgvin Skúli Sigurdsson
HIGHLIGHTS OF 2013STRONG PERFORMANCE BY ALL BUSINESS SEGMENTS
5

SERVICE
Good results of service indicators
Wider choice of non-indexed mortgages
– Non-indexed mortgages based on Central Bank interest rates
– Non-indexed mortgages with fixed interest for three years
New features in Arion app:
– Pay bills– Fast payments– Deposit into credit card– Fetch PIN
Fjárhæðaþrep 30 account – new way to save
– Non-indexed high interest account with 30 day minimum investment term after withdrawal request submitted
The Bank began to offer clients insurance quotes in collaboration with insurance company Euler Hermes
Pension Portal allowed fund members to view all their acquired pension rights
The Bank began to issue new credit card with travel-related benefits in cooperation with Icelandair
The Bank bought the property Borgartún 18 –a new branch of Arion Bank will open there this summer
HIGHLIGHTS OF 2013RANGE OF PRODUCTS AND GOOD SERVICE
6

INVESTMENT BANKING
HIGHLIGHTS OF 2013GROWING BUSINESS IN INVESTMENT BANKING
7
IPO2013
Bond offering2013
Direct sale2013
Advice on acquisition
2013
RestructuringIn progress
Bond offering2013
IPO2013
Bond offering2013
IPOIn progress

INNOVATION AND EDUCATION
Business accelerator Startup Reykjavík held for second time with great success
– We have invested in 20 innovation projects
Arion Bank was one of founders of Startup Energy Reykjavík business accelerator
Number of meetings, courses, conferences and lectures held in Borgartún
SOCIAL ISSUES
Arion Bank supported the distribution of Christmas aid organized by Icelandic Church Aid, Mæðrastyrksnefnd and the Icelandic Red Cross
The Bank supported the awareness and fundraising campaigns Moustache March and Pink Ribbon
Employees raised ISK 1.5 million for the Icelandic Cancer Society
Arion Bank and Disney Reading Week – held in January and October
Reflectors distributed to all 6-year old children
Arion Bank football tournament held in Reykjavík. Total of 2,100 children took part
HIGHLIGHTS OF 2013SOCIALLY RESPONSIBLE BANK – FOCUS ON INNOVATION AND FINANCIAL EDUCATION
8

FINANCIAL STATEMENTS
9
10
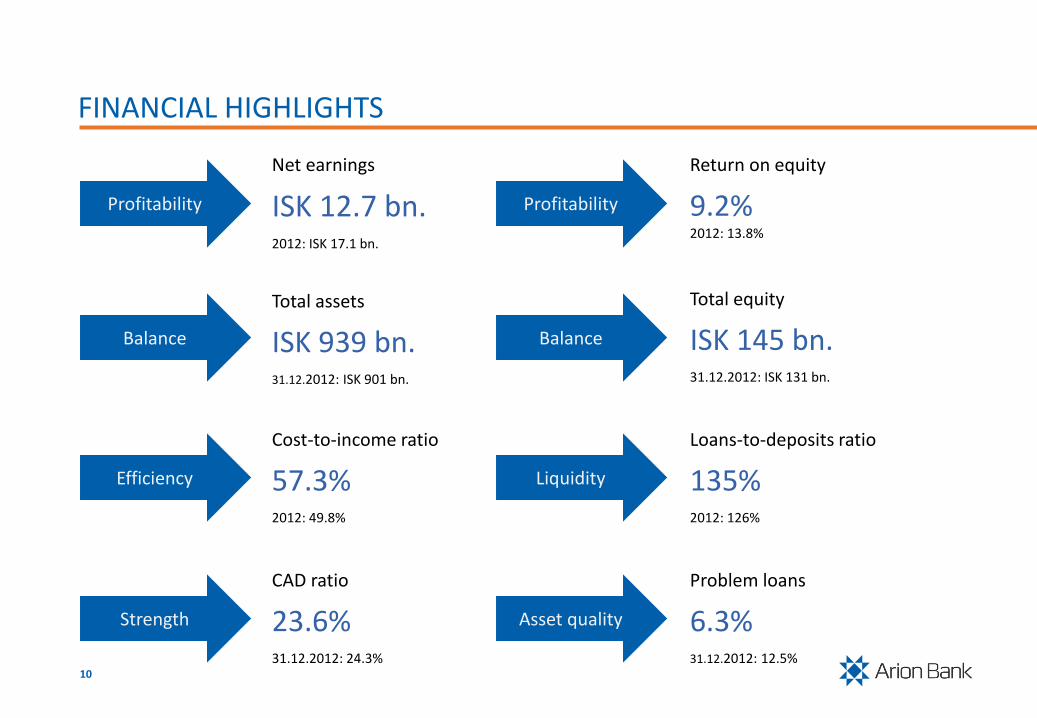
FINANCIAL HIGHLIGHTS
Total assets
ISK 939 bn.31.12.2012: ISK 901 bn.
Loans-to-deposits ratio
135%2012: 126%
Cost-to-income ratio
57.3%2012: 49.8%
Balance
Total equity
ISK 145 bn.31.12.2012: ISK 131 bn.
Profitability
Net earnings
ISK 12.7 bn.2012: ISK 17.1 bn.
Return on equity
9.2%2012: 13.8%
Liquidity
Profitability
Balance
Efficiency
Problem loans
6.3%31.12.2012: 12.5%
CAD ratio
23.6%31.12.2012: 24.3%
Asset qualityStrength

INCOME STATEMENT
11
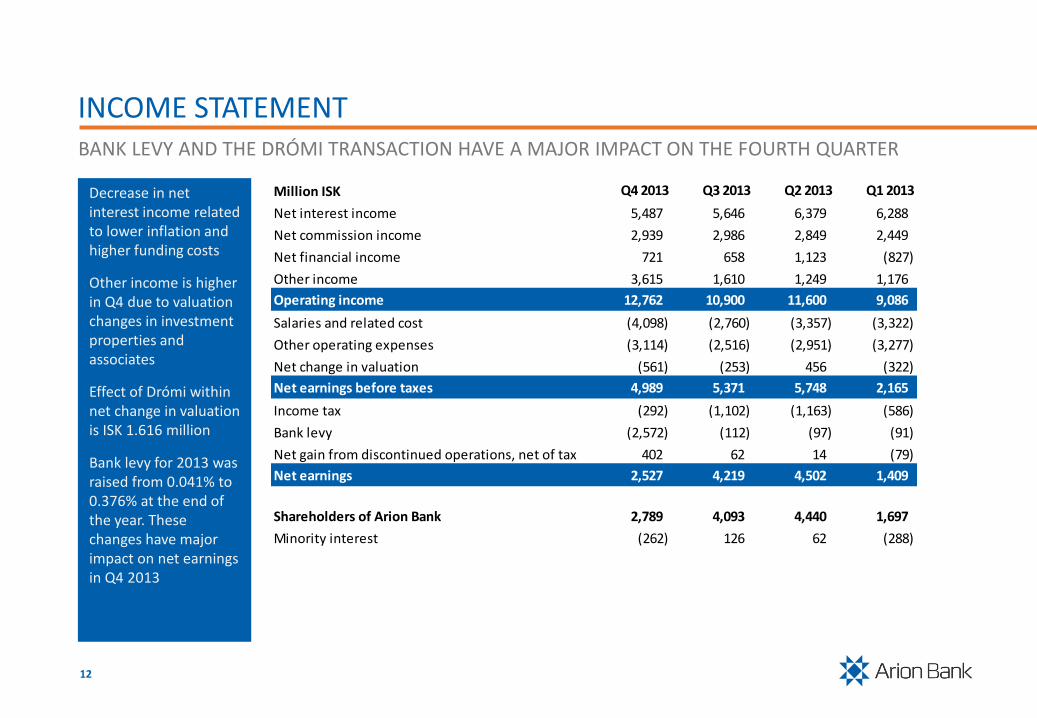
INCOME STATEMENT
Decrease in net interest income related to lower inflation and higher funding costs
Other income is higher in Q4 due to valuation changes in investment properties and associates
Effect of Drómi within net change in valuation is ISK 1.616 million
Bank levy for 2013 was raised from 0.041% to 0.376% at the end of the year. These changes have major impact on net earnings in Q4 2013
BANK LEVY AND THE DRÓMI TRANSACTION HAVE A MAJOR IMPACT ON THE FOURTH QUARTER
12
Million ISK Q4 2013 Q3 2013 Q2 2013 Q1 2013
Net interest income 5,487 5,646 6,379 6,288
Net commission income 2,939 2,986 2,849 2,449
Net financial income 721 658 1,123 (827)
Other income 3,615 1,610 1,249 1,176
Operating income 12,762 10,900 11,600 9,086
Salaries and related cost (4,098) (2,760) (3,357) (3,322)
Other operating expenses (3,114) (2,516) (2,951) (3,277)
Net change in valuation (561) (253) 456 (322)
Net earnings before taxes 4,989 5,371 5,748 2,165
Income tax (292) (1,102) (1,163) (586)
Bank levy (2,572) (112) (97) (91)
Net gain from discontinued operations, net of tax 402 62 14 (79)
Net earnings 2,527 4,219 4,502 1,409
Shareholders of Arion Bank 2,789 4,093 4,440 1,697
Minority interest (262) 126 62 (288)

INCOME STATEMENT
In addition to increased mortgage portfolio a lower net interest income is mainly due to lower inflation and increased demand deposits resulting in higher interest expenses
Commission income continues to increase
REDUCED RISK IN THE BUSINESS MODEL EFFECTS NET INTEREST INCOME
13
Million ISK 2013 2012 %
Net interest income 23,800 27,142 (12%)
Net commission income 11,223 10,748 4%
Net financial income 1,675 2,017 (17%)
Other income 7,650 9,595 (20%)
Operating income 44,348 49,502 (10%)
Salaries and related cost (13,537) (12,459) 9%
Other operating expenses (11,858) (12,209) (3%)
Net change in valuation (680) (4,690) (86%)
Net earnings before taxes 18,273 20,144 (9%)
Income tax (3,143) (3,633) (13%)
Bank levy (2,872) (1,062) 170%
Net gain from discontinued operations, net of tax 399 1,607 (75%)
Net earnings 12,657 17,056 (26%)
Shareholders of Arion Bank 13,019 16,622 (22%)
Minority interest (362) 434 (183%)

CORE INCOME
FX loss included in core operating income
• Has a negative effect on performance
Challenging to maintain core ROE due to high capitalization
Decrease in net interest margin have the most single negative effect on core operations
Aim for cost-to-income ratio below 50% is optimistic in changed business model
CHALLENGING TO MAINTAIN ACCEPTABLE PROFITABILITY WITH INCREASED EQUITY
14
Net earnings (ISK bn.) Return on equity (%) Net interest margin (%) Cost-to-income ratio (%)
2011 2012 20132010 2011 2012 20132010 2011 2012 20132010 2011 2012 20132010
12,65711,534
- 1,326
- 371- 1,709
- 778
561
2,500
Net earnings2013
Net effectof real estate
companies
Net effectof assets
held for sale
Income fromvaluation
changes ofovertakencompanies
Net valuationchanges
on loans
Tax effectof changes
Bank levy Net earningsfrom
Coreoperations
2013
11.112.9 11.6 11.5 11.4 11.5 11.4 10.5
3.1 3.4 3.4 3.0
53.3 53.9 55.5 61.2
Net earnings from core operations (ISK bn.)
9.413.0 13.3
4.1 4.8 4.72.3 2.7
0.3
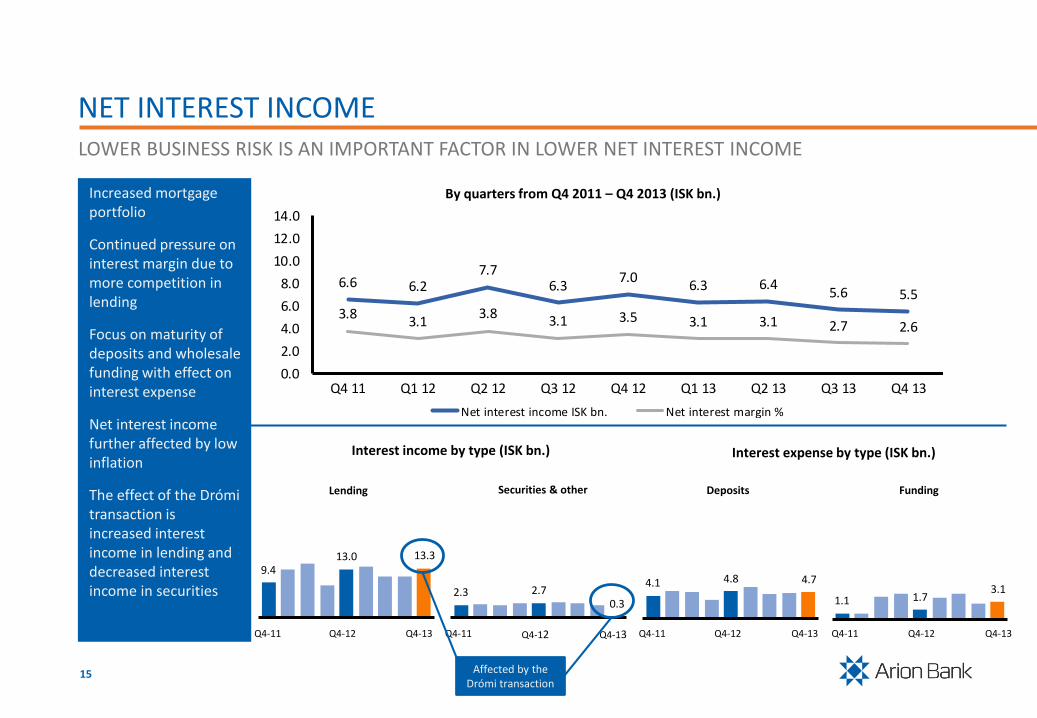
NET INTEREST INCOME
Increased mortgage portfolio
Continued pressure on interest margin due to more competition in lending
Focus on maturity of deposits and wholesale funding with effect on interest expense
Net interest income further affected by low inflation
The effect of the Drómi transaction is increased interest income in lending and decreased interest income in securities
LOWER BUSINESS RISK IS AN IMPORTANT FACTOR IN LOWER NET INTEREST INCOME
15
By quarters from Q4 2011 – Q4 2013 (ISK bn.)
Lending
Interest income by type (ISK bn.)
Q4-11 Q4-12 Q4-13 Q4-11 Q4-12 Q4-13
Deposits FundingSecurities & other
Q4-11 Q4-12 Q4-13 Q4-11 Q4-12 Q4-13
Interest expense by type (ISK bn.)
Affected by theDrómi transaction
6.6 6.27.7
6.37.0
6.3 6.45.6 5.5
3.83.1
3.83.1 3.5 3.1 3.1 2.7 2.6
0.0
2.0
4.0
6.0
8.0
10.0
12.0
14.0
Q4 11 Q1 12 Q2 12 Q3 12 Q4 12 Q1 13 Q2 13 Q3 13 Q4 13
Net interest income ISK bn. Net interest margin %
1.1 1.73.1

3.1
2.33.0
2.7 2.7 2.42.8 3.0 3.0
0.0
1.0
2.0
3.0
4.0
5.0
6.0
Q4-11 Q1-12 Q2-12 Q3-12 Q4-12 Q1-13 Q2-13 Q3-13 Q4-13
NET COMMISSION INCOME
Commission income from cards increasing again after changes in revenue model at Valitor
Gradual increase in commission from asset management
Other commission mainly from investment banking activities
Commission income expected to have bottomed out in Q1 2013
STRONG PLATFORM FOR FUTURE GROWTH
16
Net commission income from Q4 2011 – Q4 2013 (ISK bn.)
By type from Q4 2011 – Q4 2013 (ISK bn.)
Asset management Cards Collection, Payment services, Lending and Guarantees
Other commission
Q4-11 Q4-12 Q4-13 Q4-11 Q4-12 Q4-13 Q4-11 Q4-12 Q4-13 Q4-11 Q4-12 Q4-13
0.60.8 0.9
1.5
1.1 1.2
0.50.4
0.60.5
0.4 0.3

NET FINANCIAL INCOME
Good performance in bonds and equity markets
Increasing FX imbalance resulting from revaluation of FX loans and changes in associated company
The gain from shares in Q4 is mainly explained by Stodir
The increase in FX imbalance from Q3 2013 is mainly due to Bakkavör Group Ltd.
GOOD PERFORMANCE OF SECURITIES BUT AFFECTED BY STRENGTHENING ISK
17
By quarters from Q4 2011 – Q4 2013 (ISK bn)
FX imbalance from Q4 2011 – Q4 2013 (ISK bn.)
Q4-11 Q4-13Q4-12
Other financial income from Q4 2011 – Q4 2013 (ISK bn.)
24
18 *19
*13
*At year end Arion Bank has ISK 19 bn. and subsidiaries ISK 13 bn. in FX imbalance
0.0
1.4
-1.2
0.9 1.0
-0.8
1.10.7 0.7
-3.0
-2.0
-1.0
0.0
1.0
2.0
3.0
Q4 11 Q1 12 Q2 12 Q3 12 Q4 12 Q1 13 Q2 13 Q3 13 Q4 13
Total net financial income FX gain (loss)
-0.5
0.0
0.5
1.0
1.5
2.0
Q4-11 Q4-12 Q4-13
Shares Bonds Derivatives

OTHER INCOME
The increase in Q4 2012 and Q4 2013 is mainly due to valuation changes in investment properties and fair value changes in associated companies
Income from investment properties are from real estate subsidiaries Landfestarand Landey
Stable insurance income from Okkar lífwhich is a core life insurance subsidiary
VALUATION CHANGES HAVE A STRONG IMPACT
18
By quarters from Q4 2011 – Q4 2013
Investment properties (ISK bn.)
Q4-11 Q4-13Q4-12 Q4-11 Q4-13Q4-12 Q4-11 Q4-13Q4-12
Insurance income (ISK bn.) Other income (ISK bn.)
Other income by type from Q4 2011 – Q4 2013
2.0
0.9
2.11.6
5.0
1.2 1.21.6
3.6
0.0
1.0
2.0
3.0
4.0
5.0
6.0
Q4 11 Q1 12 Q2 12 Q3 12 Q4 12 Q1 13 Q2 13 Q3 13 Q4 13
1.72.1
1.6
0.2 0.3 0.30.1
2.7
1.7

913 949 911
245 240 234
1,158 1,190 1,145
Parent company Subsidiaries
TOTAL OPERATING EXPENSEAFFECTED BY ONE OFF ITEMS
19
Large one-off expense in Q4 2013.
• Depreciation on Housing and IT software
Number of employees gradually reducing
By quarters from Q4 2011 – Q4 2013 (ISK bn.)
Total employees
Q4-11 Q4-13Q4-12Q4-11 Q4-13Q4-12 Q4-11 Q4-13Q4-12
6.2 5.8 5.85.2
7.86.6 6.3
5.3
7.2
0.0
2.0
4.0
6.0
8.0
10.0
12.0
Q4 11 Q1 12 Q2 12 Q3 12 Q4 12 Q1 13 Q2 13 Q3 13 Q4 13
3.24.1
3.1
3.0
3.64.1
6.2
7.87.2
Salaries & related exp. Other oper.exp.
53.3 49.956.5
By type (ISK bn.) Cost-to-income ratio (%)

0.3
1.0 1.1
2.9
3.5
1.93.0
2.3
0.60.9
3.5
1.9
3.63.1
Income tax Additional 6% Tax
TAX EXPENSE
Income tax rate has increased from 18% to 20% on taxable income from 2010
Financial institutions pay an additional 6% income tax on taxable income above ISK 1 bn.
Bank levy is calculated on total debt above ISK 50 bn. Bank levy has increased from 0.041% in 2010 to 0.376% in 2013.
Financial institutions pay an additional 6.75% tax on employee salaries
TAXES INCREASE DUE TO NEW TAXES ON FINANCIAL INSTITUTIONS AND HIGHER TAX RATES
20
Tax expense from 2010-2013 (ISK bn.)
Bank levy
2010 2011 2012 2013 2010 2011 2012 2013 2010 2011 2012 2013
Income tax and special taxes on financial institutions (ISK bn.)
3.8
3.0
4.5
5.7
2.0
3.0
4.0
5.0
6.0
2010 2011 2012 2013
0.50.6
Additional tax on employee salariesIncome tax and additional 6% income tax

BALANCE SHEET
21

BALANCE SHEET
Increase in loans to customers is largely explained by the Drómi transaction. The transaction also reduces financial assets
Loans to customers increased by 12% from year end 2012
Moderate growth in deposits
Funding profile is strong
SUCCEEDED IN MAINTAINING BALANCE SHEET IN A LOW INVESTMENT ENVIRONMENT
22
Assets
Billion ISK 31.12.2013 31.12.2012 Diff% 31.12.2011 Diff%
Cash & balances with CB 38 30 28% 29 30%
Loans to credit institutions 102 101 1% 69 48%
Loans to customers 636 567 12% 562 13%
Financial assets 87 138 (37%) 158 (45%)
Investments properties 29 29 (1%) 27 5%
Other assets 48 37 29% 47 2%
Total assets 939 901 4% 892 5%
Liabilities and Equity
Billion ISK 31.12.2013 31.12.2012 Diff% 31.12.2011 Diff%
Due to credit institutions & CB 28 33 (15%) 16 73%
Deposits from customers 472 449 5% 490 (4%)
Other liabilities 58 59 (2%) 52 10%
Borrowings 205 195 5% 187 9%
Subordinated loans 32 34 (7%) 32 (1%)
Equity 145 131 11% 115 27%
Total liabilities and equity 939 901 4% 892 5%

49
13
10
4
94
43 32
Individuals
Real Estate & Construction
Fishing
Information & Communication
Wholesale & Retail
Finance & Insurance
Industry, Energy & Manufacturing
Transportation
Services
Other sectors
LOANS TO CUSTOMERS ARE WELL DIVERSIFIED
Slow growth in the corporate portfolio is in line with moderate economic growth and modest investment climate
Arion Bank has a strong position on the mortgage loan market and has increased the mortgage portfolio by 36% since year end 2012
It is the strategic objective of the Bank to maintain a well diversified loan portfolio in all corporate sectors
WITH LOANS TO INDIVIDUALS REPRESENTING 49% OF TOTAL LOANS TO CUSTOMERS
23
By sectors 31.12.2013 (%)
Development (ISK bn.)
By currencies 31.12.2013 (%)
Mortgage loans (ISK bn.)
636 ISK bn.
239 243 247 254 257 311
322 324 318 313 320 325
562 567 566 567 576 636
2011 2012 Q1-13 Q2-13 Q3-13 Q4-13
Individuals Corporate
196 195 201 207 212266
2011 2012 Q1-13 Q2-13 Q3-13 Q4-13
30 24 22 22 22 19
3031 34 34 34 36
40 45 44 44 44 45
0%
20%
40%
60%
80%
100%
2011 2012 Q1-13 Q2-13 Q3-13 Q4-13
FX Non-CPI linked CPI linked

3.5
0.40.10.3
3.4
Real estate
Fishing vessels
Cash & listed securities
Other collateral
Unsecured credit exposure
IMPROVING ASSET QUALITY
Problem loans have continued to decrease since their peak in 2010
Loans in over 90 days default have also been decreasing
The Bank focuses on problem loans and would have achieved its objective to get problem loans below 5% if not for the Drómi transaction
THE BANK HAS FOCUSED ON REDUCING PROBLEM LOANS
24
Development of problem loans (%)
Collateral behind problem loans (%)
6.3% 6.3%
The Bank defines problem loans as book value of loans ( i.e. net of impairment) that are either individuallyimpaired or are in over 90 days past due and not impaired as % of total book value of loans to customers
24.7
10.66.0 5.6 5.6 5.6 4.5
29.1
5.26.5 4.6 2.9 2.6 1.7
53.8
15.812.5 10.2 8.5 8.2 6.3
2010 2011 2012 Q1-13 Q2-13 Q3-13 Q4-13
Other problem loans Loans in >90 days past due
4.5
0.30.10.2
1.1>90 days facility default
FX rulings
Previously restructured
Not classified
Problem loans by status (%)

56
7
23
13Covered bonds
Issued bonds
Other loans
Subord.loans
77%
23%
58%
42%53%47%
STRONG FUNDING PROFILE
Limited need for refinancing
First Icelandic bank since 2007 to access international markets in February 2013
New bond with maturity in 2016
Successfully increased term deposits
A new BB+ credit rating from Standard & Poor’s increases possibilities for new funding and potential refinancing
NO SIGNIFICANT REDEMPTION OF LONG-TERM FUNDING IN THE MEDIUM TERM
25
Maturity of long-term funding 31.12.2013 (ISK bn.)Funding mix (%)
Development of total deposits by maturity
236 ISK bn.
31.12.2012
On Demanddeposits
Term deposits
506 ISK bn.
482 ISK bn.
On Demanddeposits
Term deposits
On Demanddeposits
Term deposits
500 ISK bn.
31.12.2011
4 5 134 7 4
30
10
59
101
2014 2015 2016 2017 2018 2019 2020 2021 2022 >2022
ISK FX
31.12.2013

16.4 16.0 17.5 18.2 19.1 19.1 19.5 19.5 19.2
4.8 4.84.7 4.8
5.2 4.8 4.8 4.7 4.421.2 20.8
22.3 23.024.3 23.9 24.3 24.2 23.6
Tier 1 ratio Tier 2 ratio
109 114 120 123 125 127 131 135 139
32 34 32 33 34 32 32 33 32141148 152 155 160 159 163 167 171
Tier 1 capital Tier 2 capital
VERY SOLID CAPITAL BASE
Arion Bank has maintained very solid levels of capitalization due to strong profit generation and dividend payment restrictions
The Bank’s capital base is composed of core Tier 1 and Tier 2 capital
Higher risk weight because of the Drómitransaction results in a lower capital ratio
WITH HIGH QUALITY CAPITAL WITH NO RELIANCE ON HYBRID INSTRUMENTS
26
Total capital base (ISK bn.) Total capital ratio (%)
Q4-11 Q4-13Q4-12 Q4-11 Q4-13Q4-12

KEY FINANCIAL INDICATORS
27

-8.2
8.2 7.4
28
KEY FINANCIAL INDICATORSVOLATILITY IN PROFITABILITY DUE TO IRREGULAR ITEMS
Return on equity (%) Cost-to-income ratio (%)without net valuation change
Total capital ratio (%)
Problem loans* (%)
* Problem loans (past due but not impaired loans over 90 days + individually impaired loans) as % of loans to customers
Net interest margin (%)
Q4-11 Q4-13Q4-12 Q4-11 Q4-13Q4-12 Q4-11 Q4-13Q4-12 Q4-11 Q4-13Q4-12
Q4-11 Q4-13Q4-12 Q4-11 Q4-13Q4-12
Loans-to-deposits ratio (%)without loans financed with covered bonds
Core return on equity (%)
2010 2011 2012 2013
Liquidity coverage ratio (LCR) (%)
123
2013
9198
107
115126 135
53.3 49.956.5
3.8 3.5 2.615.8 12.5
6.3
21.224.3 23.6
11.4 11.5 11.4 10.5
29
This document has been prepared for information purposes only and should not be relied upon, or form the basis of any action or decision, by any person. Nothing in this document is, nor shall be relied on as, a promise or representation as to the future. In supplying this document, Arion Bank does not undertake any obligation to provide the recipient with access to any additional information or to update this document or to correct any inaccuracies herein which may become apparent.
The information relating to Arion Bank, its subsidiaries and associates and their respective businesses and assets contained in, or used in preparing, this document has not been verified or audited. Further, this document does not purport to provide a complete description of the matters to which it relates.
Some information may be based on assumptions or market conditions and may change without notice. Accordingly, no representation or warranty, express or implied, is made as to the fairness, accuracy, completeness or correctness of the information, forecasts, opinions and expectations contained in this document and no reliance should be placed on such information, forecasts, opinions and expectations. To the extent permitted by law, none of Arion Bank or any of their affiliates or advisers, any of their respective directors, officers or employees, or any other person, accepts any liability whatsoever for any loss howsoever arising from any use of this document or its contents or otherwise arising in connection with this document.
By accepting this document you agree to be bound by the foregoing instructions and limitations.
DISCLAIMER
WWW.ARIONBANKI.IS
30


