23
Investor Highlights Investor Highlights November 2018

Investor HighlightsInvestor Highlights
November 2018

Forward-Looking Statements
Various statements contained in this presentation, including those that express a belief, expectation or intention, as well as those that are not statements of
historical fact, are forward-looking statements. These forward-looking statements may include projections and estimates concerning the timing and success
of our strategies, plans or intentions. Forward-looking statements are generally accompanied by words such as “estimate,” “project,” “predict,” “believe,”
“expect,” “intend,” “anticipate,” “potential,” “plan,” “goal” or other words that convey the uncertainty of future events or outcomes. We have based these
forward-looking statements on our current expectations and assumptions about future events. These assumptions include, among others, our projections
and expectations regarding: market trends in the single-family home rental industry and in the local markets where we operate, our ability to institutionalize
a historically fragmented business model, our business strengths, our ideal tenant profile, the quality and location of our properties in attractive
neighborhoods, the scale advantage of our national platform and the superiority of our operational infrastructure, the effectiveness of our investment
philosophy and diversified acquisition strategy, our ability to grow our portfolio and to create a cash flow opportunity with attractive current yields and
upside from increasing rents and cost efficiencies and our understanding of our competition and general economic, demographic and real estate conditions
that may impact our business. While we consider these expectations and assumptions to be reasonable, they are inherently subject to significant business,
economic, competitive, regulatory and other risks, contingencies and uncertainties, most of which are difficult to predict and many of which are beyond our
control and could cause actual results to differ materially from any future results, performance or achievements expressed or implied by these forward-
looking statements. Investors should not place undue reliance on these forward-looking statements, which speak only as of the date of this presentation,
November 6, 2018. We undertake no obligation to update any forward-looking statements to conform to actual results or changes in our expectations,
unless required by applicable law. For a further description of the risks and uncertainties that could cause actual results to differ from those expressed in
these forward-looking statements, as well as risks relating to the business of the Company in general, see the “Risk Factors” disclosed in the Company’s
Annual Report on Form 10-K for the year ended December 31, 2017 and in the Company’s subsequent filings with the Securities and Exchange Commission.
Non-GAAP Financial Measures
This presentation includes certain financial measures that were not prepared in accordance with U.S. generally accepted accounting principles (GAAP)
because we believe they help investors understand our performance. Any non-GAAP financial measures presented are not, and should not be viewed as,
substitutes for financial measures required by U.S. GAAP and may not be comparable to the calculation of similar measures of other companies.
Legal Disclosures
2
About American Homes 4 Rent
American Homes 4 Rent (NYSE: AMH) is a leader in the single-family home rental industry and “American Homes 4 Rent” is fast becoming a nationally
recognized brand for rental homes, known for high quality, good value and tenant satisfaction. We are an internally managed Maryland real estate
investment trust, or REIT, focused on acquiring, renovating, leasing, and operating attractive, single-family homes as rental properties. As of
September 30, 2018, we owned 52,464 single-family properties in selected submarkets in 22 states.
Contact
American Homes 4 Rent Investor Relations
Phone: (855) 794-2447 / Email: [email protected]

SFR Sector: Macro Landscape Drives Strong Demand ……….…………… 4
AMH At A Glance ………………………………………………………….................. 5
AMH Strategy ……………………………………………………………..................... 6
AMH Operating Approach ……..……………………………………………………… 7
How & Where We Invest ..………......................................................... 8-9
Operational Update .………………………................................................. 10
Financial Results .……………………......................................................... 11-13
Defined Terms ……………………………………………………………………………… 14-22
2018 Outlook ……..………………………………………………………………………… 23
Atlanta, GA
Table of Contents
3

Strong AMH Profile
10 Year Sequential Growth in Single-Family Rental Stock Household Formations Outpace Housing Supply
(In
millio
ns)
(1) Federal Reserve Bank of St. Louis Economic Data and U.S. Census Bureau. U.S. Census Bureau 1Q18.
(2) Pub: Aug-18. JBREC estimates using 2010 Census figures and trending data from ACS/HVS. Source: U.S. Census Bureau ACS; John Burns Real Estate Consulting, LLC
(Data; 2Q18, updated quarterly † )
(3) Source: John Burns Real Estate Consulting, LLC Pub: Mar-18
(4) Source: John Burns Real Estate Consulting, LLC (Data: 2016/2017 Pub: Mar-18 ) citing Freddie Mac Profile of Today’s Renter
Fundamental Shifts Support Single-Family Rental Demand
Macro Landscape Drives Strong Demand
0.0
0.5
1.0
1.5
2.0
1980 1985 1990 1995 2000 2005 2010 2015
Single Family Starts Multi Family Starts Long Term Average Household Formation Rate
4
• Over 600,000 inbound sales calls to Las Vegas Leasing
Call Center in 2017
• Nearly 28 million AMH website page views in 2017, a
20% increase over 2016
• 30% year-over-year increase via mobile users
illustrating the value and accessibility of our
mobile platform
• 350,000 distinct automated access home showings in
2017
• Accelerating demand for single-family rental housing
supported by fundamental shifts in demographics and
consumer preferences
• 39% of renters planning to rent their next residence expect
to rent a single-family home instead of an apartment,
townhouse or condo – a 26% increase year-over-year
(per Freddie Mac)
• Percentage of 30-year olds hitting life-stage milestones
have fallen representing significant demand in the pipeline
for single-family rental operators
(1) (2)
(4)
(3)
(3)

AMH At A Glance
52,464 high-quality
properties in 22
states (1)
~ 200,000 residents
Only Investment
Grade Rated
balance sheet in
SFR sector
95.8% Same-Home
3Q 2018 ending
occupancy
percentage
6.2% Same Home
FY 2017 Core NOI
after Capex
growth
Approx. $250
million of annual
retained cash flow
(1) As of September 30, 2018
Average property
age of 15.2 years
Phoenix, AZ
Boise, ID
~ 1,292 employees,
of which over 800
are field based or
delivering customer
service
Best-in-class call
center and
proprietary
technology Net debt to TTM
Adjusted EBITDAre of
4.7 x
$11.3 billion total
market
capitalization
5
(1)
(1)
(1)
(1)
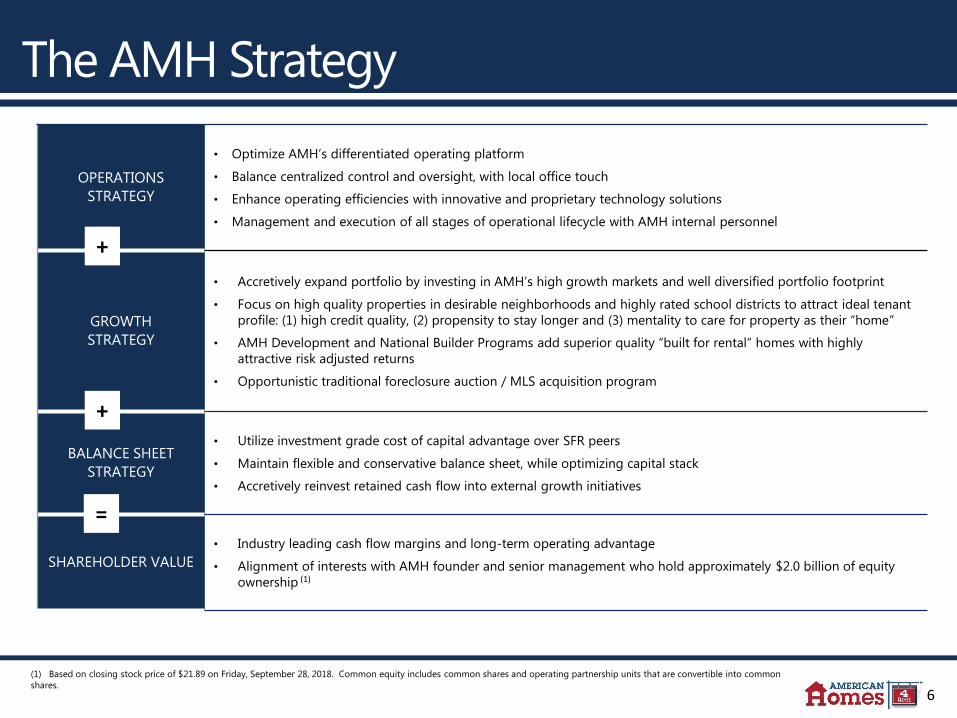
The AMH Strategy
OPERATIONS
STRATEGY
• Optimize AMH’s differentiated operating platform
• Balance centralized control and oversight, with local office touch
• Enhance operating efficiencies with innovative and proprietary technology solutions
• Management and execution of all stages of operational lifecycle with AMH internal personnel
GROWTH
STRATEGY
• Accretively expand portfolio by investing in AMH’s high growth markets and well diversified portfolio footprint
• Focus on high quality properties in desirable neighborhoods and highly rated school districts to attract ideal tenant
profile: (1) high credit quality, (2) propensity to stay longer and (3) mentality to care for property as their “home”
• AMH Development and National Builder Programs add superior quality “built for rental” homes with highly
attractive risk adjusted returns
• Opportunistic traditional foreclosure auction / MLS acquisition program
BALANCE SHEET
STRATEGY
• Utilize investment grade cost of capital advantage over SFR peers
• Maintain flexible and conservative balance sheet, while optimizing capital stack
• Accretively reinvest retained cash flow into external growth initiatives
SHAREHOLDER VALUE
• Industry leading cash flow margins and long-term operating advantage
• Alignment of interests with AMH founder and senior management who hold approximately $2.0 billion of equity
ownership
+
+
=
(1)
(1) Based on closing stock price of $21.89 on Friday, September 28, 2018. Common equity includes common shares and operating partnership units that are convertible into common
shares.
6

The AMH Operating Approach
Centralized Support
• Call centers
• Tenant U/W
• Lease execution
• Rental pricing
• Maintenance
oversight
Boots on
The Ground
• Leasing agents
• Property managers
• Maintenance
technicians
Field
Management
• Local district office
• Regional & district
managers
Centralized approach differentiates AMH operating efficiency
Enhanced efficiency
Superior control
Ability to make nimble
enhancements
Standardized processes
Efficient management of
multiple satellite markets
Local customer service
delivery
Exceptional customer service
Accelerated leasing process
Asset preservation
Efficient maintenance delivery
7

(1)
MLS/Foreclosure Auction Built for Rental Bulk/Portfolio Opportunities
• AMH personnel underwrite and
inspect all homes acquired through
foreclosure auction & MLS
• Create additional value through
national renovation program
• Additional scale leverages highly
efficient operating platform
• 5% to 6% economic yields after
CapEx
• Consists of: AMH Development &
National Builder Program
• Newly built homes expected to
have rental premium and lower
expenditure levels
• Attractive risk adjusted returns
• Premium stabilized investment
returns: AMH Development 100+
bps yield premium, National
Builder Program 50 bps yield
premium
• Further leverage mature and
scalable operating platform
• Accretive cost synergy
opportunities
• Integration risk mitigated by
successful track record of portfolio
acquisitions
• Bullish view on consolidation
opportunities, but timing will be
lumpy and unpredictable
How we Invest
• Expect to invest $500 to $600 million through the following channels:
• Traditional MLS purchases/Foreclosure Auction
• AMH Development & National Builder Program
• Bulk/Portfolio opportunities would be in addition to the above channels
2018 Acquisition & Development Outlook
8

Where We Invest
Note: Total properties percentage based on counts as of September 30, 2018.
(1) Source: Bureau of Labor Statistics August 2018
(2) Source: JBREC Single Family Rent Index for the twelve months ended August 2018
Diversified footprint, comprised of high growth markets, ideally positioned for long-term sustainable
growth and portfolio optimization flexibility
Southwest:
% of Total Properties: 25.9%
3Q18 SH Avg. Occupied Days: 94.8%
3Q18 Blended Rate Spread: 4.5%
Southeast:
% of Total Properties: 47.3%
3Q18 SH Avg. Occupied Days: 95.2%
3Q18 Blended Rate Spread: 4.0%
Midwest:
% of Total Properties: 17.3%
3Q18 SH Avg. Occupied Days: 95.4%
3Q18 Blended Rate Spread: 3.4%
West:
% of Total Properties: 9.5%
3Q18 SH Avg. Occupied Days: 95.8%
3Q18 Blended Rate Spread: 5.7%
Employment Growth:
- US national average: 1.6%
- All AMH markets: 2.4%
Single-Family New Lease Rental
Rate Growth:
- US national average: 2.0%
- All AMH Markets: 2.2%
Favorable AMH market trends
relative to national averages:
(1)
9
(2)

10
Same-Home Operational Update
3Q18 Highlights
• Core revenues increased 4.4% to $172.0 million,
compared to $164.8 million for the prior year
• Core property operating expenses growth
increased 5.4% to $63.0 million over prior year
• Core NOI After Capital Expenditures growth was
up 3.4% to $100.1 million, compared to $96.8
million for the prior year
Strong
Occupancy Levels
• 3Q18 Average Occupied Days Percentage
increased 110 bps over prior year, to 95.2%
• October Average Occupied Days Percentage up
80 bps over prior year, to 94.6%
Continued
Pricing Power
• 3Q18 blended rental rate spreads of 4.1%
• Preliminary blended October spreads are
approximately 3.5%, in-line with prior year
(1) Refer to Slide 23 for 2018 Outlook disclosure
(1)
2018 Same-Home Outlook
Average Occupied Days Percentage 94.75% - 95.25%
Core revenues growth 3.75% - 4.25%
Property tax expense growth 2.75% - 3.75%
Average R&M and turnover costs, net, plus
Recurring Capital Expenditures per property$2,100 - $2,150
Core property operating expenses growth 5.5% - 6.0%
Core NOI margin 64.0% - 65.0%
Core NOI After Capital Expenditures growth 2.5% - 3.0%
(1)
Jacksonville, FL

Capital Structure Debt Maturity Schedule
(Figures in millions, except per share amounts)
12/31/2016
(In thousands, except share and per share amounts)
Note: Refer to Defined Terms and Non-GAAP Reconciliations in the Appendix, as well as the 3Q18 Supplemental Information Package, for definitions of metrics and reconciliations to GAAP.
Investment Grade Balance Sheet
Fixed Rate Debt
23.1%
Floating Rate
Debt
0.9%
Preferred
Shares
7.8%
Common Shares
& OP Units
68.2%
Balance Sheet Philosophy
Maintain flexible investment grade
balance sheet with diverse access to
capital
Continue optimizing capital stack
and utilize investment grade rating
to reduce cost of capital
Expand sources of available capital
as the Company and the SFR sector
evolves and matures
Prudent retention of operating cash
flow
Credit Ratings & Ratios
Moody’s Investor Service
S&P Global Ratings
Baa3 / (Stable)
BBB- / (Stable)
Net Debt to Adjusted EBITDAre
Debt and Preferred Shares to Adjusted EBITDAre
Fixed Charge Coverage
Unencumbered Core NOI percentage
4.7 x
6.7 x
3.2 x
65.6%
11
$910
$120
$21 $21 $21
$121
$21
$956
$10 $10 $10
$1,402
Liquidity (3) Exchangeable Senior Notes Asset-backed Securitizations
Term Loan Facility Unsecured Senior Notes Principal Amortization
(In millions))
(1) As of September 30, 2018.
(2) As of September 30, 2018, reflects maturity of entire principal balance at the fully extended maturity date inclusive of regular scheduled amortization.
(3) As of September 30, 2018, liquidity represents the sum of $110 million of cash on the balance sheet and $800 million of undrawn capacity under our revolving credit facility.
(4) The unsecured senior notes have a maturity date in 2028, and the asset-backed securitizations maturing in 2045 on a fully extended basis have anticipated repayment dates in 2025.
(2) (4)
(3)
(1)

Strong Same-Home Performance
Operating Highlights
3Q17 4Q17 1Q18 2Q18 3Q18
Number of Same-Home properties 38,168 38,168 38,168 38,168 38,168
Rents from single-family properties $ 164,466 $ 165,786 $ 168,210 $ 170,666 $ 171,991
Fees from single-family properties 2,184 1,943 1,959 1,989 2,013
Bad debt (1,813) (1,607) (1,486) (1,170) (1,981)
Core revenues $ 164,837 $ 166,122 $ 168,683 $ 171,485 $ 172,023
R&M and turnover costs, net 14,052 11,290 13,331 13,832 14,957
Property tax, insurance and HOA fees, net 33,328 33,850 34,055 34,660 35,350
Property management, net 12,368 12,112 13,147 12,592 12,661
Core property operating expenses $ 59,748 $ 57,252 $ 60,533 $ 61,084 $ 62,968
Core net operating income (“Core NOI”) 105,089 108,870 108,150 110,401 109,055
Core NOI margin 63.8% 65.5% 64.1% 64.4% 63.4%
Recurring Capital expenditures 8,258 5,806 5,685 6,463 8,942
Core NOI after Capital Expenditures $ 96,831 $ 103,064 $ 102,465 $ 103,938 $ 100,113
Property Enhancing Capex – Resilient flooring $ 988 $ 1,504 $ 1,310 $ 2,444 $ 3,173
YOY growth in quarterly Core NOI after capex (1) 5.5% 1.5% (0.7%) 3.5% 3.4%
Average R&M, turnover, in-house maintenanceand Recurring Capital Expenditures per property
$ 585 $ 447 $ 498 $ 531 $ 627
(Amounts in thousands, except property data)
Increasing revenues driven
by solid rental rate growth
1
Long runway for continued
operational optimization
and cash flow growth
2
Best-in-class operating
platform drives industry
leading expenditure
efficiencies
3
1
2
2
3 ∑ $ 2,103
Note: Refer to Defined Terms and Non-GAAP Reconciliations in the Appendix for definitions of metrics and reconciliations to GAAP.
(1) Year-over-year percentage growth comparisons based on quarterly same-home populations presented in the Company’s supplemental for the respective period.
12

Industry Leading Efficiency Metrics(Dollars in thousands) 3Q17 4Q17 1Q18 2Q18 3Q18
Adjusted EBITDAre Margins
Total revenues, excluding tenant charge-backs $ 210,742 $ 214,569 $ 222,197 $ 231,566 $ 235,900
Property operating expenses, net (63,110) (60,929) (66,353) (67,131) (70,758)
Property management expenses, net (15,770) (15,664) (17,437) (16,988) (17,214)
General & administrative expenses, net (7,826) (7,340) (8,633) (9,157) (8,774)
Other expenses, net 14 91 (127) (88) (509)
Adjusted EBITDAre $ 124,050 $ 130,727 $ 129,647 $ 138,202 $ 138,645
Margin 58.9 % 60.9 % 58.3% 59.7% 58.8%
Recurring Capital Expenditures (10,316) (7,501) (7,386) (8,489) (11,467)
Leasing costs (1,960) (2,029) (2,723) (3,111) (3,722)
Adjusted EBITDAre after Capex & Leasing Costs $ 111,774 $ 121,197 $ 119,538 $ 126,602 $ 123,456
Margin 53.0% 56.5% 53.8% 54.7% 52.3%
Platform Efficiency Percentage
Rents & fees from single-family properties $ 210,333 $ 213,368 $ 220,856 $ 229,965 $ 234,035
Property management expenses, net $ 15,770 $ 15,664 $ 17,437 $ 16,988 $ 17,214
General & administrative expenses, net 7,826 7,340 8,633 9,157 8,774
Leasing costs 1,960 2,029 2,723 3,111 3,722
Total platform costs $ 25,556 $ 25,033 $ 28,793 $ 29,256 $ 29,710
Platform Efficiency Percentage 12.2 % 11.7 % 13.0 % 12.7% 12.7%
Note: Refer to Defined Terms and Non-GAAP Reconciliations in the Appendix for definitions of metrics and reconciliations to GAAP.
13

Highlights(1)
Defined Terms and Non-GAAP Reconciliations
Core Net Operating Income ("Core NOI") and Same-Home Core NOI After Capital Expenditures
Core NOI, which we also present separately for our Same-Home portfolio, unencumbered and encumbered portfolios, is a supplemental non-GAAP financial
measure that we define as core revenues, which is calculated as rents and fees from single-family properties, net of bad debt expense, less core property
operating expenses, which is calculated as property operating and property management expenses, excluding noncash share-based compensation expense,
expenses reimbursed by tenant charge-backs and bad debt expense. A property is classified as Same-Home if it has been stabilized longer than 90 days
prior to the beginning of the earliest period presented under comparison and if it has not been classified as held for sale, identified for future sale or taken
out of service as a result of a casualty loss.
Core NOI also excludes (1) noncash fair value adjustments associated with remeasuring our participating preferred shares derivative liability to fair value, (2)
noncash gain or loss on conversion of shares or units, (3) gain or loss on early extinguishment of debt, (4) hurricane-related charges, net, (5) gain or loss on
sales of single-family properties and other, (6) depreciation and amortization, (7) acquisition fees and costs expensed incurred with business combinations
and the acquisition of individual properties, (8) noncash share-based compensation expense, (9) interest expense, (10) general and administrative expense,
(11) other expenses and (12) other revenues. We believe Core NOI provides useful information to investors about the operating performance of our single-
family properties without the impact of certain operating expenses that are reimbursed through tenant charge-backs. We further adjust Core NOI for our
Same-Home portfolio by subtracting recurring capital expenditures to calculate Same-Home Core NOI After Capital Expenditures, which we believe provides
useful information to investors because it more fully reflects our operating performance after the impact of all property-level expenditures, regardless of
whether they are capitalized or expensed.
Core NOI and Same-Home Core NOI After Capital Expenditures should be considered only as supplements to net income or loss as a measure of our
performance and should not be used as measures of our liquidity, nor are they indicative of funds available to fund our cash needs, including our ability to
pay dividends or make distributions. Additionally, these metrics should not be used as substitutes for net income or loss or net cash flows from operating
activities (as computed in accordance with GAAP).
Average Occupied Days Percentage
The number of days a property is occupied in the period divided by the total number of days the property is owned during the same period. This calculation
excludes properties identified as part of our disposition program, comprised of properties classified as held for sale and properties identified for future sale.
14

(1)
The following are reconciliations of core revenues, core property operating expenses, Core NOI, Same-Home Core NOI and Same-Home Core NOI After
Capital Expenditures to their respective GAAP metrics for the trailing five quarters (amounts in thousands):
Sep 30,
2017
Dec 31,
2017
Mar 31,
2018
Jun 30,
2018
Sep 30,
2018
Core revenues
Total revenues 246,836$ 242,801$ 258,004$ 264,483$ 280,052$
Tenant charge-backs (36,094) (28,232) (35,807) (32,917) (44,152)
Bad debt expense (2,299) (2,186) (2,000) (1,616) (2,749)
Other revenues (409) (1,201) (1,341) (1,601) (1,865)
Core revenues 208,034 211,182 218,856 228,349 231,286
Less: Non-Same-Home core revenues 43,197 45,060 50,173 56,864 59,263
Same-Home core revenues 164,837$ 166,122$ 168,683$ 171,485$ 172,023$
For the Three Months Ended
Sep 30,
2017
Dec 31,
2017
Mar 31,
2018
Jun 30,
2018
Sep 30,
2018
Core property operating expenses
Property operating expenses 97,944$ 87,871$ 100,987$ 98,843$ 113,600$
Property management expenses 17,447 17,345 18,987 18,616 18,865
Noncash share-based compensation - property management (417) (391) (377) (423) (341)
Expenses reimbursed by tenant charge-backs (36,094) (28,232) (35,807) (32,917) (44,152)
Bad debt expense (2,299) (2,186) (2,000) (1,616) (2,749)
Core property operating expenses 76,581 74,407 81,790 82,503 85,223
Less: Non-Same-Home core property operating expenses 16,833 17,155 21,257 21,419 22,255
Same-Home core property operating expenses 59,748$ 57,252$ 60,533$ 61,084$ 62,968$
For the Three Months Ended
Defined Terms and Non-GAAP Reconciliations
15

Highlights(1)
Sep 30,
2017
Dec 31,
2017
Mar 31,
2018
Jun 30,
2018
Sep 30,
2018
Net income 19,097$ 30,533$ 21,525$ 25,898$ 30,281$
Remeasurement of participating preferred shares (8,391) (1,500) (1,212) - -
Loss on early extinguishment of debt - - - 1,447 -
Hurricane-related charges, net 10,136 (2,173) - - -
Gain on sale of single-family properties and other, net (1,895) (451) (2,256) (3,240) (4,953)
Depreciation and amortization 74,790 75,831 79,303 78,319 79,940
Acquisition fees and costs expensed 1,306 809 1,311 1,321 1,055
Noncash share-based compensation - property management 417 391 377 423 341
Interest expense 26,592 25,747 29,301 31,978 30,930
General and administrative expense 8,525 7,986 9,231 9,677 9,265
Other expenses 1,285 803 827 1,624 1,069
Other revenues (409) (1,201) (1,341) (1,601) (1,865)
Core NOI 131,453 136,775 137,066 145,846 146,063
Less: Non-Same-Home Core NOI 26,364 27,905 28,916 35,445 37,008
Same-Home Core NOI 105,089 108,870 108,150 110,401 109,055
Same-Home capital expenditures 8,258 5,806 5,685 6,463 8,942
Same-Home Core NOI After Capital Expenditures 96,831$ 103,064$ 102,465$ 103,938$ 100,113$
For the Three Months Ended
Defined Terms and Non-GAAP Reconciliations
16

Credit Metrics
We present the following selected metrics because we believe they are helpful as supplemental measures in assessing our ability to service our
financing obligations and in evaluating balance sheet leverage against that of other real estate companies. The tables below reconcile these metrics,
which are calculated in part based on several non-GAAP financial measures (amounts in thousands).
Fixed Charge Coverage
Defined Terms and Non-GAAP Reconciliations
Debt and Preferred Shares to Adjusted EBITDAre:
Sep 30,
2018
Total Debt 2,712,688$
Preferred shares at l iquidation value 883,750
Total Debt and preferred shares 3,596,438$
Adjusted EBITDAre - TTM 537,221$
Debt and Preferred Shares to Adjusted EBITDAre 6.7 x
17
For the Trailing Twelve Months EndedSep 30, 2018
Interest expense per income statement $ 117,956Less: noncash interest expense related to acquired debt (3,735)Less: amortization of discount, loan costs and cash flow hedge (7,288)Add: capitalized interest 7,698 Cash interest 114,631 Dividends on preferred shares 53,400 Fixed charges $ 168,031
Adjusted EBITDAre $ 537,221
Fixed Charge Coverage 3.2 x

Defined Terms and Non-GAAP Reconciliations
Net Debt to Adjusted EBITDAre
Sep 30,
2018
Total Debt 2,712,688$
Less: cash and cash equivalents (110,138)
Less: asset-backed securitization certificates (25,666)
Less: restricted cash related to securitizations (45,478)
Net debt 2,531,406$
Adjusted EBITDAre TTM 537,221$
Net Debt to TTM Adjusted EBITDAre 4.7 x
Unencumbered Core NOI Percentage
18
For the Three Months EndedSep 30, 2018
Unencumbered Core NOI $ 95,882 Core NOI $ 146,063 Unencumbered Core NOI Percentage 65.6%

EBITDA / EBITDAre / Adjusted EBITDAre / Adjusted EBITDAre after Capex and Leasing Costs / Adjusted EBITDAre Margin / Adjusted EBITDAre
after Capex and Leasing Costs Margin
EBITDA is defined as earnings before interest, taxes, depreciation and amortization. EBITDA is a non-GAAP financial measure and is used by us and
others as a supplemental measure of performance. EBITDAre is a supplemental non-GAAP financial measure, which we calculate in accordance with the
definition approved by the National Association of Real Estate Investment Trusts ("NAREIT") in the September 2017 White Paper by adjusting EBITDA
for the net gain or loss on sales / impairment of single-family properties and other. Adjusted EBITDAre is a supplemental non-GAAP financial measure
calculated by adjusting EBITDAre for (1) acquisition fees and costs expensed incurred with business combinations and the acquisition of individual
properties, (2) noncash share-based compensation expense, (3) hurricane-related charges, net, (4) gain or loss on early extinguishment of debt, (5) gain
or loss on conversion of shares and units and (6) noncash fair value adjustments associated with remeasuring our participating preferred shares
derivative liability to fair value. Adjusted EBITDAre after Capex and Leasing Costs is a supplemental non-GAAP financial measure calculated by adjusting
Adjusted EBITDAre for (1) recurring capital expenditures and (2) leasing costs. Adjusted EBITDAre Margin is a supplemental non-GAAP financial
measure calculated as Adjusted EBITDAre divided by total revenues, net of tenant charge-backs. Adjusted EBITDAre after Capex and Leasing Costs
Margin is a supplemental non-GAAP financial measure calculated as Adjusted EBITDAre after Capex and Leasing Costs divided by total revenues, net of
tenant charge-backs. We believe these metrics provide useful information to investors because they exclude the impact of various income and expense
items that are not indicative of operating performance.
Defined Terms and Non-GAAP Reconciliations
19

Sep 30,
2017
Dec 31,
2017
Mar 31,
2018
Jun 30,
2018
Sep 30,
2018
Net income 19,097$ 30,533$ 21,525$ 25,898$ 30,281$
Interest expense 26,592 25,747 29,301 31,978 30,930
Depreciation and amortization 74,790 75,831 79,303 78,319 79,940
EBITDA 120,479 132,111 130,129 136,195 141,151
Net (gain) loss on sale / impairment of single-family properties and other (596) 443 (1,556) (1,704) (4,393)
EBITDAre 119,883 132,554 128,573 134,491 136,758
Noncash share-based compensation - general and administrative 699 646 598 520 491
Noncash share-based compensation - property management 417 391 377 423 341
Acquisition fees and costs expensed 1,306 809 1,311 1,321 1,055
Hurricane-related charges, net 10,136 (2,173) - - -
Loss on early extinguishment of debt - - - 1,447 -
Remeasurement of participating preferred shares (8,391) (1,500) (1,212) - -
Adjusted EBITDAre 124,050$ 130,727$ 129,647$ 138,202$ 138,645$
Recurring capital expenditures (10,316)$ (7,501)$ (7,386)$ (8,489)$ (11,467)$
Leasing costs (1,960) (2,029) (2,723) (3,111) (3,722)
Adjusted EBITDAre after Capex and Leasing Costs 111,774 121,197 119,538 126,602 123,456
Total revenues 246,836$ 242,801$ 258,004$ 264,483$ 280,052$
Less: tenant charge-backs (36,094) (28,232) (35,807) (32,917) (44,152)
Total revenues, net of tenant charge-backs 210,742 214,569 222,197 231,566 235,900
Adjusted EBITDAre Margin 58.9% 60.9% 58.3% 59.7% 58.8%
Adjusted EBITDAre after Capex and Leasing Costs Margin 53.0% 56.5% 53.8% 54.7% 52.3%
For the Three Months Ended
The following is a reconciliation of net income, determined in accordance with GAAP, to EBITDA, EBITDAre, Adjusted EBITDAre, Adjusted EBITDAre after
Capex and Leasing Costs, Adjusted EBITDAre Margin and Adjusted EBITDAre after Capex and Leasing Costs Margin for the trailing five quarters (amounts
in thousands):
Defined Terms and Non-GAAP Reconciliations
20

Platform Efficiency Percentage
Management costs, including (1) property management expenses, net of tenant charge-backs and excluding noncash share-based compensation
expense, (2) general and administrative expense, excluding noncash share-based compensation expense and (3) leasing costs, as a percentage of total
portfolio rents and fees.
Sep 30,
2017
Dec 31,
2017
Mar 31,
2018
Jun 30,
2018
Sep 30,
2018
Property management expenses 17,447$ 17,345$ 18,987$ 18,616$ 18,865$
Less: tenant charge-backs (1,260) (1,290) (1,173) (1,205) (1,310)
Less: noncash share-based compensation - property management (417) (391) (377) (423) (341)
Property management expenses, net 15,770 15,664 17,437 16,988 17,214
General and administrative expense 8,525 7,986 9,231 9,677 9,265
Less: noncash share-based compensation - general and administrative (699) (646) (598) (520) (491)
General and administrative expense, net 7,826 7,340 8,633 9,157 8,774
Leasing costs 1,960 2,029 2,723 3,111 3,722
Platform costs 25,556$ 25,033$ 28,793$ 29,256$ 29,710$
Rents from single-family properties 207,490$ 210,778$ 218,023$ 227,211$ 231,324$
Fees from single-family properties 2,843 2,590 2,833 2,754 2,711
Total portfolio rents and fees 210,333$ 213,368$ 220,856$ 229,965$ 234,035$
Platform Efficiency Percentage 12.2% 11.7% 13.0% 12.7% 12.7%
For the Three Months Ended
(In Thousands)
Defined Terms and Non-GAAP Reconciliations
21

Property Enhancing Capex
Includes elective capital expenditures to enhance the operating profile of a property, such as investments to increase future revenues or reduce
maintenance expenditures.
Defined Terms and Non-GAAP Reconciliations
Recurring Capital Expenditures
For our Same-Home portfolio, recurring capital expenditures includes replacement costs and other capital expenditures recorded during the period that
are necessary to help preserve the value and maintain functionality of our properties. For our total portfolio, we calculate recurring capital expenditures by
multiplying (a) current period actual recurring capital expenditures per Same-Home property by (b) our total number of properties, excluding non-
stabilized properties and properties identified as part of our disposition program, which is comprised of properties classified as held for sale and
properties identified for future sale.
22

23
Full Year 2018Same-Home Previous Guidance Current Guidance
Average Occupied Days Percentage 95.0% - 95.5% 94.75% - 95.25%Core revenues growth 4.0% - 4.5% 3.75% - 4.25%Property tax expense growth 2.75% - 3.75% 2.75% - 3.75%Average R&M and turnover costs, net, plus Recurring Capital Expenditures per property $2,050 - $2,150 $2,100 - $2,150Core property operating expenses growth 5.0% - 6.0% 5.5% - 6.0%
Core NOI margin 64.0% - 65.0% 64.0% - 65.0%Core NOI After Capital Expenditures growth 3.25% - 3.75% 2.5% - 3.0%
Property Enhancing Capex $8 - $12 million $8 - $12 million
General and administrative expense, excluding noncash share-based compensation $34.5 - $35.5 million $34.5 - $35.5 million
Acquisition and development volume $500 - $600 million $500 - $600 million
2018 Outlook
(1) As previously communicated, we expected the full year Average Occupied Days Percentage to be below the midpoint of previous guidance range due to modest leasing
disruption from Hurricane Florence. Additionally, as a result of recent field personnel turnover, we now expect occupancy softness in certain markets in the fourth quarter of
2018 and are therefore revising the guidance range to 94.75% to 95.25%.
(2) Revised as a result of lowered Average Occupied Days Percentage guidance.
2018 Outlook Disclosure
The Company does not provide guidance for the most comparable GAAP financial measures of net income or loss, total revenues and property
operating expenses, or a reconciliation of the above-listed forward-looking non-GAAP financial measures to the comparable GAAP financial
measures because we are unable to reasonably predict certain items contained in the GAAP measures, including non-recurring and infrequent
items that are not indicative of the Company's ongoing operations. Such items include, but are not limited to, net gain or loss on sales and
impairment of single-family properties, casualty loss, Non-Same-Home revenues and Non-Same-Home property operating expenses. These
items are uncertain, depend on various factors and could have a material impact on our GAAP results for the guidance period.
(1)
(2)
(2)


