42
1 ARM Holdings plc Q2 2013 Results ROADSHOW SLIDES v2

1
ARM Holdings plc
Q2 2013 Results
ROADSHOW SLIDES
v2
2
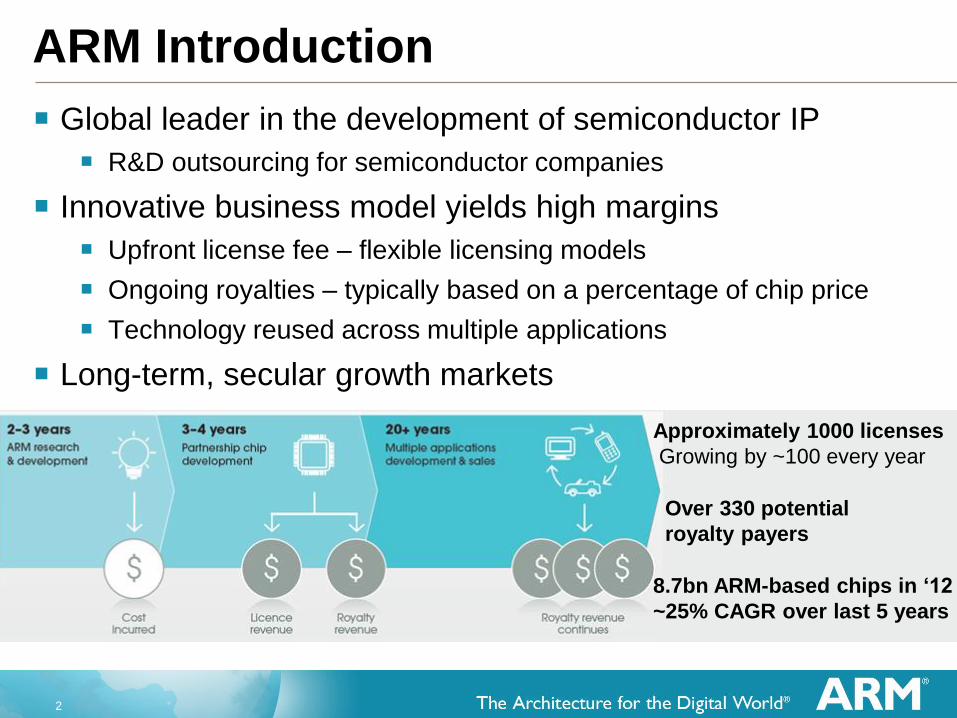
Approximately 1000 licenses
Growing by ~100 every year
Over 330 potential
royalty payers
8.7bn ARM-based chips in ‘12
~25% CAGR over last 5 years
ARM Introduction
Global leader in the development of semiconductor IP
R&D outsourcing for semiconductor companies
Innovative business model yields high margins
Upfront license fee – flexible licensing models
Ongoing royalties – typically based on a percentage of chip price
Technology reused across multiple applications
Long-term, secular growth markets

3
Key Growth Drivers
Increasing breadth
of ARM penetration
Growth in royalty
from smart products
Extending IP
Outsourcing
Growth into more markets
Increasing ARM penetration into broader
range of digital products
Growth in value per smart product
ARM’s processor content per chip increasing
More chips per product and higher priced chips
Growth into new technology outsourcing
Physical IP and graphics IP further increase
ARM’s value per chip
Growth
Opportunities

4
Licensing Drives Future Royalties
Licensing base grows by 25 in Q2 2013
ARM’s current royalty revenues are derived from licenses
signed many years ago
Growing base yields royalty revenues over long period
$0m
$50m
$100m
$150m
$200m
$250m
$300m
H2 H1 H2 H1 H2 H1 H2 H1 H2 H1 H2 H1 H2 H1 H2 H1 H2 H1 H2 H1 H2 H1 H2 H1
2002 2003 2004 2005 2006 2007 2008 2009 2010 2011 2012 2013
2009 to present
2004-2008
Pre 2004
Significant Royalty Potential
from Recent Licenses ~450
~1000
~450 most recent
licenses are
drivers of ARM’s
future royalty
Pre 2009 2010 2011 2012 YTD
2009 2013
Cu
mu
lati
ve
Lic
en
se
s
1000
500
0
~550
+87
+91
+122
+110
+47
~250 licenses
~300

5
Strong Growth in all Markets
Increasing penetration as semiconductor
companies deploy ARM technology into broad
range of end markets
Mobile devices is still our largest market with
embedded and enterprise the fastest growing
Licenses Royalty Units
2012 Licensing and Royalty
Mobile
Embedded
Enterprise
Home
4.6bn
2.3bn
1.4bn
0.4bn
25%
in 2012
3%
in 2012
10%
in 2012
40%
in 2012

6
Q2 2013 Revenues $m £m %revs
Licensing 102.6 60.6 39%
Royalty 135.3 91.1 51%
Other 15.1 18.6 10%
Total 264.3 171.2 100%
COGS 9.8
Gross Margin 94.3%
Operating Costs 78.2
Operating Margin 48.6%
Profit Before Tax 86.6
EPS 4.89
Cash Generation £95.0
Total Cash £613.1
From Revenue to Profits and Cash
95% of revenues earned in
US dollars
Cash generative, debt free
Royalty growth has driven higher
operating margins and earnings
Royalties more than 50% of
revenues
R&D expensed as incurred
Approximately 50% of costs in USD
10% move in $/£ impacts EPS
by ~15%
Note: Normalised numbers

7
Long-Term Growth Opportunity
ARM’s opportunity to increase revenue and profitability
2003-2012 Route from 2013 to 2020
PD Licensing CAGR 15% High single digits
PD Royalty CAGR* 22% ARM to outperform industry by 15-20%
Revenue CAGR 18%
Operating Margin 20% to 47% Operating leverage continues**
Earnings Per Share
CAGR
26% Revenue growth, margin expansion and
decreasing tax rate driving EPS growth***
* 7% semiconductor revenue CAGR 2003 to 2012. SIA data excluding memory and analog, January 2013
** Assuming Q4 2012 exchange rate of 1.58 and a <1% share dilution

8
Mo
bile
Markets for ARM in 2012
* Including tablets, netbooks and laptops * * Includes other applications not listed such as headsets, DVD, game consoles, etc
Devices Shipped
(Million of Units)
2012
Devices
Chips/
Device
TAM 2012
Chips
2012
ARM
2012
Share
Smart Phone 730 3-5 2,500 2,200 90%
Feature Phone 460 2-3 1,200 1,100 95%
Low End Voice 730 1-2 730 700 95%
Portable Media Players 130 1-3 250 220 90%
Mobile Computing* (apps only) 400 1 400 160 40%
Digital Camera 150 1-2 230 180 80%
Digital TV & Set-top-box 420 1-2 640 290 45%
Desktop PCs & Servers (apps) 200 1 200 - 0%
Networking 1,200 1-2 1,300 420 35%
Printers 120 1 120 85 70%
Hard Disk & Solid State Drives 700 1 700 620 90%
Automotive 2,600 1 2,600 210 8%
Smart Card 6,000 1 6,000 710 13%
Microcontrollers 8,700 1 8,700 1,500 18%
Others ** 2,000 1 2,000 300 15%
Total 25,500 27,000 8,700 32%
Ho
me
En
terp
ris
e
Em
bed
ded
Source:
Gartner, IDC, SIA, and
ARM estimates
Year Market
Share
2007 17%
2008 20%
2009 22%
2010 25%
2011 29%
2012 32%

9
Mo
bile
Markets for ARM in 2017
* Including tablets, netbooks and laptops * * Includes other applications not listed such as headsets, DVD, game consoles, etc
Devices Shipped
(Million of Units)
2017
Devices
Device
CAGR
Chips/
Device
2017
Chips
Chip
CAGR
Smart Phone 1,800 20% 3-5 6,800 20%
Feature Phone - - - - -
Low End Voice 710 -1% 1-2 1,400 15%
Portable Media Players 90 -10% 1-3 180 -5%
Mobile Computing* (apps only) 850 20% 1 850 20%
Digital Camera 130 -5% 1-2 200 -5%
Digital TV & Set-top-box 600 10% 1-4 2,000 25%
Desktop PCs & Servers (apps) 200 Flat 1 200 Flat
Networking 1,500 5% 1-2 1,700 5%
Printers 130 2% 1-3 130 2%
Hard Disk & Solid State Drives 1,100 10% 1 1,100 10%
Automotive 3,800 10% 1 3,800 10%
Smart Card 8,500 10% 1 8,500 10%
Microcontrollers 11,400 5% 1 11,400 5%
Others ** 3,000 10% 1-2 3,000 10%
Total 34,000 5% 41,000 10%
Ho
me
En
terp
ris
e
Em
bed
ded
Key Growth Areas for ARM
Source:
Gartner, IDC, SIA, and
ARM estimates

10
Average Selling Price of a Semiconductor Chip
ARM’s Opportunity at all Price Points
Opportunity
ARM Usage Today
>$25 $10-15 $3-6 $1-2
Vo
lum
e

11
Cortex
Mass market tablets, smartphones and
digital TVs
ARM’s Opportunity in Apps Processors
Devices Vol. (m) ARM (%) Chip ASP
Smartphones 730 >95% $5 to $20
Mobile Computing 400 40% $5 to $20
DTVs & STB 420 45% $5 to $10
Other 280 65% $5 to $20
Total 1,800 70%
2012 2017
Devices Vol. (m)
Smartphones 1,700
Mobile Computing 850
DTVs & STB 600
Other 850
Total 4,000
ARM Technology Penetration in Devices
Smartphones
ARM11Cortex-A >95%
Mali 15%
Physical IP 40%
Mobile Computing
Cortex-A 40%
Mali 10%
Physical IP 30%
DTVs & STB
ARM9Cortex-A 45%
Mali <10%
Physical IP <25%
ARM Technology
big.LITTLE
Mid-range and high end smartphones and tablets
64bit
Super smartphones and mobile
computers
Mali
Mali T6XX for super smartphones and tablets
Mali 4XX for smartphones, tablets and DTVs
Physical IP
POP IP available for all Cortex-A processors and
MaliT6xx
(laptops and tablets)

12
New Opportunities Driving Licensing
Cortex-A
Family
Cortex-R
Family
Cortex-M
Family
Mali
Graphics
179 (+9)
143 (+5)
37 (+3)
80 (+7)
Classic Processors: 532, Architecture: 15, Subscription: 11 (+1) *Note: Licensing numbers adjusted for licenses that are no longer expected to generate royalties.
Cumulative licenses (Q1 2013 licensing shown in parentheses*)
Estimated Royalty
Opportunity
for 2017
Real-time
Embedded
14bn units
per year
Micro-
controllers
23bn units
per year
Application
Processors
4bn units
per year Mobile computing, digital TVs Servers, networking and embedded computers
Networking equipment Mobile broadband (basestation and modem)
Internet of Things: personal GPS, medical Microcontrollers, automotive, storage

13
-30%
-20%
-10%
0%
10%
20%
30%
40%
0
50
100
150
200
250
300
350
400
450
2007 2008 2009 2010 2011 2012 H12013
ARM Royalty Revenue
ARM Royalty Revenue (Q1-Q2)
Q2 royalty revenues nearly $119m
Up 24% YoY, industry up 2%
Helped by near trebling of Cortex-A and
5x increase in Mali shipments
2.4 billion units in Q2
Up 20% YoY, industry down 2%
Mobile: up 12% YoY, industry flat
Storage: up 5% YoY, industry down 7%
DTV: up 90% YoY, industry up 5%
MCU: up 20% YoY, industry down 5%
Processor Royalties
Non-mobile 48%
Q2 2013: ARM Outperforms Industry
Gro
wth
Rate
(%)
AR
M R
oyalt
y R
even
ue (
$M
)
Q2 2013 royalty revenue up 24% YoY
Industry up 2% over the relevant period
ARM $ Royalty CAGR (08-12) = 17% Industry $ Revenue CAGR (08-12) = 1%
Source: SIA May 2013, excludes memory and analog * Industry data offset one quarter to align with ARM’s royalty revenue
Q2 Market Analysis
Mobile, 51%
Embedded, 26%
Enterprise, 18%
Home, 5%

14
Licensing Increases Market Opportunity
Application Penetration of Key
Companies’ Products
2012
Share
Smartphone – Apps >95%
Mobile Computer – Apps* 40%
Mobile – Modems >95%
Mobile – BT & WiFi** 75%
Digital Camera*** 80%
Digital TV / Set-Top-Box 45%
Networking 25%
Printers*** 70%
Disk Drives (HDD & SSD) 90%
Automotive 8%
Smart Card 15%
Microcontrollers 18%
3D Graphics**** 13%
Public ARM design wins, but not yet shipping
Shipping mainly ARM-based chips
Shipping some ARM-based chips
No ARM design win or not yet public
* Includes handheld computers, tablets, and laptops
** Includes standalone WiFi and BT chips and BT-WiFI combo chips
***Based on OEM market share rather than semiconductor vendor
****Includes all smartphones, mobile computing and DTV devices, including those that don’t currently contain a GPU
ARM gains share by winning designs at leading semiconductor companies
Based on current market shares
and ARM’s view of how these
markets may develop.
ARM will update the chart on the left
only as design wins become public
Movement in H1 2013
4 companies reequipped
Movement from 2011 to 2012
1 company
1 company
1 company
5 companies
4 companies

15
Servers
AR
Mv
7 M
PC
ore
Relative TCO
Incu
mb
en
t
ARM Partner Chip Price: <$100
ARM technology suitable for
scale-out server workloads and energy constrained environments
Integration of hardware blocks
into SoCs reduces power and costs
Entry-level Smartphones & Tablets
Co
rtex-A
7
Relative
Performance
Co
rtex-A
7
Clo
vert
rail
+
Relative Power C
lov
ert
rail+
Relative Size
Clo
vert
rail
+
Co
rtex-A
7
ARM Partner Chip Price: ~$5
Mid-range Smartphones & Tablets
Co
rtex-A
9
Relative
Performance
Co
rtex-A
9
Clo
vert
rail
+
Relative Power
Clo
vert
rail
+
Relative Size
Co
rtex-A
9
Clo
vert
rail
+
ARM Partner Chip Price: ~$10
Low Power Leadership
Premium Smartphones & Tablets
AR
Mv
7 b
ig.L
ITT
LE
Relative
Performance
big
.LIT
TL
E
Clo
vert
rail+
Relative Power
Clo
vert
rail
+
Relative Size
Clo
vert
rail+
ARM Partner Chip Price: ~$15
big
.LIT
TL
E
Source: see appendix for details

16
2017 Royalty Opportunity in Mobile $
= U
nit o
f R
oya
lty R
eve
nu
e
Baseband - $
1 x $
Voice Only
Phones
Apps Processor .
& baseband - $
Connectivity - $
2 x $
Feature
Phones
Apps Processor .
& baseband - 8x$
Connectivity - $
Peripherals - $
10 x $
Mid-Range
Smartphone
4 x $
Entry-Level
Smartphones
Apps Processor .
& baseband - 3x$
Connectivity - $
Applications - 15$
3G/LTE BB - 3x$
Connectivity –$
Peripherals - $
20 x $
Premium
Smartphone
1.8 billion handset opportunity for Cortex-A processors and Mali graphics
550m devices in 2017
400m devices in 2017
850m devices in 2017
710m devices in 2017
0m devices in 2017
Assumptions in Smartphones
100% penetration of Cortex-A processors
100% penetration of big.LITTLE in mid-range and premium
30% to 50% penetration of Mali graphics

17
2017 Smartphone
Chip ASPs
2017 Royalty Opportunity in Mobile S
ourc
e: G
art
ner
and
AR
M
$15-$20
<$5
$5-$15
Sm
art
ph
on
e S
hip
me
nts
(m
, u
nit
s)
2,000
1,800
1,600
1,400
1,200
1,000
800
600
400
200
2012 2017
ARMv8 big.LITTLE
Multi-core Cortex-A
Mali (GPU Compute)
Physical IP
20x$
10x$
4x$
2017 Smartphone
Technology 2017 ARM Royalty
per Device
(typical range)
big.LITTLE
Multi-core Cortex-A
Mali (GPU Compute)
Physical IP
Multi-core Cortex-A
Mali (3D-graphics)
Physical IP
$5-$10
$2-$3
$1-$2
Overall Smartphone
Device CAGR: 20% Overall Smartphone
Silicon Value CAGR: >10%
Overall Smartphone ARM
Royalty CAGR: 15-25%
Where 1x$ is a unit of
royalty equal to the royalty
that ARM receives from a
voice only phone
Premium smartphones Mid-range smartphones Entry-level smartphones

18
Billions of Internet-Connected Screens
With choice of suppliers, OEMs are
innovating with new types of products
ARM technology can be used for applications
processing, connectivity and storage
Standard software is available
today and enables all form factors to
connect to the internet and display all the web
pages, play videos, network with friends ...
ABI Research, IDC, Gartner and ARM forecasts
Form Factor TAM(m)
2017
Mobile Phones 1,700
Media players 90
Mobile Computers 850
Desktop PCs 150 Digital TV/STB 600
Automotive Infotainment 110
Other* 900
Total 4 billion
*Includes PND, photo-frames, etc

19
Toys
Billions of Microcontrollers
Microcontrollers make the world smarter
Motor control, smart metering, security, air
bags, toys, heating and air-conditioning
Government low-energy policy and
green initiatives
Innovation driving system cost of 32-bit
ARM microcontrollers toward levels of
traditional 8-bit solutions
End-Market TAM(m)
2017 Automotive 3,800
Smartcards 8,500 Microcontrollers 11,500
Total 23 billion
ABI Research, IDC, Gartner and ARM forecasts
Equipment Adopting
32-bit ARM Microcontrollers
Environmental
Control
Smartcards
Medical
Devices
Secure
Payment
Consumer
Goods
Smartmeter
In Vehicle Infotainment
Gadgets

20
Billions of Real-Time Devices
Consumer products becoming
increasingly connected
Mobile baseband, WiFi, Bluetooth & GPS
Local storage increasing for when we
are not connected
ARM provides efficient, reliable
processors for real-time communication
and control
Device TAM(m)
2017 Mobile baseband 3,500
Other mobile connectivity
2,000
Home & Computing 1,500
Networking & Printers 1,600 Industrial 2,000
Disk drives 1,100 Other* 2,000
Total 14 billion
*Includes medical, media players, etc
ABI Research, IDC, Gartner and ARM forecasts

21
Software Ecosystem
RedHat Fedora 19 demonstrated on ARM
64-bit
Oracle optimising Java for ARM on 64-bit
Linaro Enterprise Group continues to grow
ARM in Servers
Source: Gartner and ARM estimates
ARM-based Low Power Servers
Highly Integrated Server Chips
Calxeda
15x power/
performance
improvement
Calxeda
EnergyCore
5.3W
102W
Current
Incumbent
Source: Calxeda, 19 June 2012, Ubuntu Server v12.04;
Apache Server v2.4.2, ApacheBench v2.3 (16k request size)
2017 Server
Opportunity
Chip Tam (m) 50
Chip Value ($bn) 3.5
Target ARM
Penetration 10-15%
Multi-core ARM processors: Cortex-A and
ARMv8
Integrated server fabric and high speed
interfaces. Includes: PCIe, 10 GbE, SATA, USB
Recent Design Wins
15 licenses now signed for server
applications
ARM-based 32-bit and 64-bit servers now
shipping
Multiple design wins expected in 2013

22
ARM in Enterprise Networking
Source: Gartner and ARM estimates
3G/4G
Macro
Enterprise
Small Cell
Metro Cell
Home
Small Cell
Enterprise Small
Cell
WiFi
Distributed
Antenna
WiFi Hotspots
Technology Requires high performance, but constrained
power budget
Higher royalties as Cortex-A and ARMv8 and
more expensive chips
Connectivity Driving Infrastructure
50bn installed internet devices
by 2020
2x increase in mobile computers
& smartphones by 2017
18x
Data traffic
increase on
mobile
networks
2012-17
110% LTE Capex CAGR
2010-14
60-80% Energy consumption
attributed to base stations
Base Station Equipment
Enterprise Access
Points L2/L3 Switching
Routers
Enterprise Networking Opportunity
2017 Enterprise
Networking
Opportunity
Chip
TAM (m)
Chip
Value
($bn)
Target
Penetrat
-ion
Base station equipment 65 $3.5 60%
Carrier Infrastructure 75 $3.0 <5%
Enterprise Access Points 270 $2.0 50%
L2/L3 Switching 150 $3.0 20%
Routing 80 $2.5 20%
Other 100 $2.5 20%
Total 700 $16.5

23
ARM in Embedded
Source: Gartner and ARM estimates
A Smarter More Connected World
ARM 32-bit Growing Quickly
12bn Install base of
Internet embedded
devices by 2020
Connected Medical
Personal devices Connected Cities
Connected Home
0
2
4
6
8
10
12
14
16
2006 2007 2008 2009 2010 2011 2012
Indexed MCU Growth by Bit Width (2006=1)*
ARM 32-bit 4, 8 &16-bit Non-ARM 32-bit
Smarter Processors for a Smarter
World
65%ARM’s share of
the 32-bit MCU
market in 2012*
18% ARM’s share of
the total MCU
market in 2012*
200
100
150
50
Cu
mu
lati
ve L
icen
sin
g
Cortex-M Licensing and
Shipments
Cumulative Licenses
Co
rtex-M
Sh
ipm
en
ts
2bn
1bn
1.5bn
0.5bn
Shipping Licenses

24
Innovating for Mobile and Computing
big: Cortex-A15
2x performance of current smartphones in
same low-power envelope
8x performance for mobile computing
LITTLE: Cortex-A7
1/5th the size and 5x energy-efficiency of
current smartphones
Multi-core capable – delivering higher
performance
big.LITTLE
High-performance and low power
Automatically selects the right processor for
the right job
Increases power efficiency
Available for both Cortex-A7 and Cortex-A15,
and Cortex-A53 and Cortex-A57
big
“Demanding tasks”
LITTLE
“Always on, always
connected tasks”50% of the Power
Current
smartphone
big.LITTLECurrent
smartphone
big.LITTLE
>2x Performance
Redefining the efficiency/
performance trade-off
Relative Performance
Co
rtex
-15
Co
rtex
-A7
big
.LIT
TL
E
Cu
rren
t
sm
art
ph
on
e
Co
rtex
-57
Co
rtex
-53
big
.LIT
TL
E
Relative Power
Co
rtex
-15
Co
rtex
-A7
big
.LIT
TL
E
Cu
rren
t
sm
art
ph
on
e
Co
rtex
-57
Co
rtex
-53
big
.LIT
TL
E Number of Partners Enabled with big.LITTLE
ARMv7 big,LITTLE
(Cortex-A7 and Cortex-A15)
ARMv8 big,LITTLE
(Cortex-A53 and Cortex-A57)
15 7

25
ARMv8 Processors
Cortex-A57: 3x performance of 2012 smartphone
64-bit support for enterprise applications
Scalable beyond 16 cores
Common OS across
multiple devices
Greater scalability
Increased addressability
Memory-intensive
applications
Hi-resolution media,
rich applications
Energy-efficient processors for high-
end networking and server applications
big.LITTLE configuration allows high
performance at low power
First Cortex-A50 series chips available
from 2014
Chips containing ARM’s Cortex-A50
series processors will command higher
royalty rates
Memory intensive applications driving
adoption of 64-bit in mobile devices
Cortex-A53: Equivalent performance of Cortex-A9 but
40% smaller and 4x more efficient
64-bit support
26
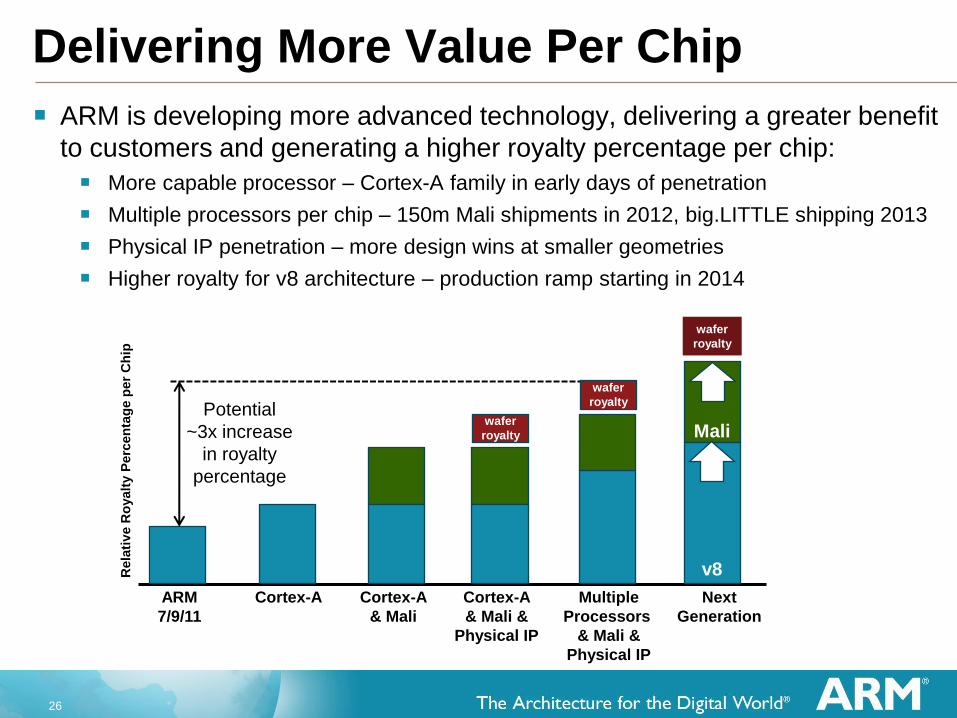
Delivering More Value Per Chip
ARM is developing more advanced technology, delivering a greater benefit
to customers and generating a higher royalty percentage per chip:
More capable processor – Cortex-A family in early days of penetration
Multiple processors per chip – 150m Mali shipments in 2012, big.LITTLE shipping 2013
Physical IP penetration – more design wins at smaller geometries
Higher royalty for v8 architecture – production ramp starting in 2014
Rela
tiv
e R
oyalt
y P
erc
en
tag
e p
er
Ch
ip
Cortex-A ARM
7/9/11
Potential
~3x increase
in royalty
percentage
Multiple
Processors
& Mali &
Physical IP
wafer
royalty
wafer
royalty
Next
Generation
Mali
v8
Cortex-A
& Mali
Cortex-A
& Mali &
Physical IP
wafer
royalty

27
Impact of Functional Integration
Integration of multiple functions into a single chip has limited overall
impact on ARM total royalty revenue
Chips containing multiple ARM processors yield higher royalties
Function X
$5
$2.50
Function Y
$6
Combination
Function X & Y
Integrated chip reduces cost for OEM and
increases profitability for the
semiconductor manufacturer
ARM royalty rate at
2% per chip ARM royalty rate at
2% for 1st processor
1% for 2nd processor
For this high volume application example:
ARM gets full royalty for first processor per chip;
discounted royalty for subsequent processors
15c
royalty 18c
royalty ($5@2%)+ ($2.50@2%)
Average of 7.5c
royalty per chip
$6@(2% + 1%)
Average of 18c
royalty per chip
OEM, semi and ARM all benefit from integration
Chips with multiple ARM-based processors
expected to increase

28
Physical IP Benefits Processors
POP IP
Optimised physical IP for improved
processor/graphics implementation
5 more POPs in Q2
1/. TSMC 28HPM, Typical Silicon 85C,
Overdrive 2/. TSMC 28HPM, Slow Silicon, 0C,
Worst case Vdd
3/. TSMC 28HPM Mali T600 Series
POP-Optimised
Mali
Graphics3
30% Higher
Frequency
25% Lower
Area
20% Lower
Power
Platform Licenses
Physical IP enables the optimized
implementation of SoC designs
99 royalty-bearing platform licenses
signed to date
First end user license for FinFET
Physical IP
Shipments from 32nm and below now
make up nearly 35% of royalties
PIPD royalty increased +20% YoY in
Q2 2013
Cumulative POPs
*Gartner 4Q12, Relevant shipment period
offset one quarter to align with ARM
POP Optimised1 ARM Cortex-A15 MP Core
Dual Core
POP Optimised2 ARM Cortex-A7 MP Core
Dual Core
Reach Higher
Frequency
up to 2.0 GHz Smaller Area Lower Power
15% 20%
Reach Higher
Frequency
850MHz Smaller Area Lower Power
10% 20%
Foundry32/28nm
Bulk CMOS
20nm
Bulk CMOS
16/14nm
FinFET
N/A N/A
0
10
20
30
40
50
60
Q1 Q2 Q3 Q4 Q1 Q2 Q3 Q4 Q1 Q2
2011 2012 2013
29
150m
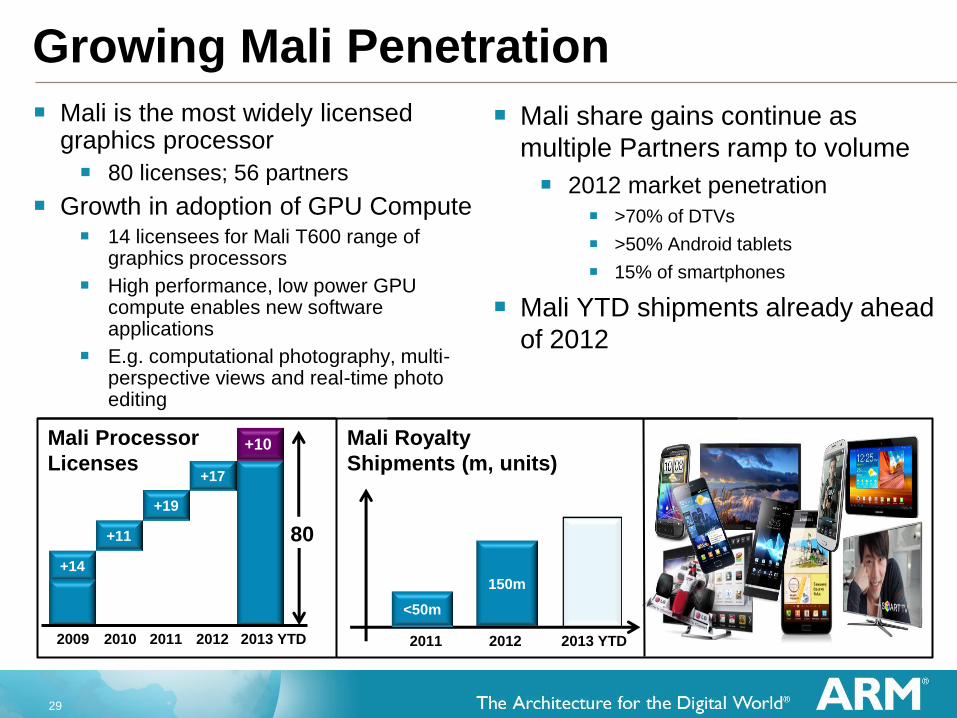
Growing Mali Penetration
Mali is the most widely licensed graphics processor
80 licenses; 56 partners
Growth in adoption of GPU Compute
14 licensees for Mali T600 range of graphics processors
High performance, low power GPU compute enables new software applications
E.g. computational photography, multi-perspective views and real-time photo editing
Mali share gains continue as
multiple Partners ramp to volume
2012 market penetration
>70% of DTVs
>50% Android tablets
15% of smartphones
Mali YTD shipments already ahead
of 2012
Mali Processor
Licenses
+14
+11
+19
2009 2010 2011 2012 2013 YTD
80
+10
+17
<50m
Mali Royalty
Shipments (m, units)
2011 2012 2013 YTD

30
Scalable Mali GPU solutions
Performance
Mali-T604 First Midgard architecture product
OpenGL ES 3.0 support
Scalable to 4 cores
Mali-T628 50% performance uplift
OpenGL ES 3.0 support
Scalable to 8 cores
Mali-T678 High end solution
Max compute capability
Optimized for tablets
Performance
Mali-400 MP First OpenGL ES 2.0 multicore GPU
Scalable from 1 to 4 cores
Low cost solution with Mali-300
Mali-300 OpenGL® ES 2.0 compliant
Mali-450 MP 2x Mali-400 performance
Scalable up to 8 cores
Leading OpenGL ES 2.0
performance
Graphics Only Graphics and GPU Compute
Mali-T622 Smallest Full Profile GPU Compute
Enables mid-range smartphone
50% more energy efficient than
Mali-T604
Scalable to 2 cores
Mali-T624 50% performance uplift
OpenGL ES 3.0 support
Scalable to 4 cores

31
Effective Tax Rate Decreasing
ARM’s effective normalised tax rate is expected to decrease
UK Corporation Tax rate reducing to 21% from April 2014 and to
20% from April 2015
Patent box introducing 10% tax rate from April 2013
ARM’s normalised tax rate in 2013 expected to be just under 20%
Patent box applies to qualifying profits
Phased introduction: 60% of the benefit applying to qualifying profits
from April 1 2013, increasing in 10% increments per annum
Covers patents granted by UK IPO and European Patent Office
Applies to existing as well as new IP, and to acquired IP
2008 2009 2010 2011 2012
Tax rate could decline 1-2% per year
from 2013*
2013 2014 2015 2016
28% 27% 25% 25%
2017
* Before potential reclassification of R&D tax credits
26%
<20%

32
ARM Holdings plc
Q2 2013 Results

33
Major semiconductor companies
continue to invest in ARM
technology
ARM continues to outperform the
semiconductor industry
Licensing and royalty growth
driving 24% YoY revenue growth
ARM continues to invest whilst
delivering profits and record cash
Q2 2013 Highlights
37% YoY normalised EPS growth
25 PD Licenses
7 Mali licenses
24% YoY royalty growth
$264m Q2 Revenues
£96m Record cash generation

34
Outlook
ARM entered H2 2013 with:
Healthy opportunity pipeline and record order backlog
New product introductions and growing new markets
Q3 Outlook
Licensing revenue expected to be $80m +/-
ARM’s royalty revenues for Q3 based on shipments in Q2 2013
Small sequential increase in semiconductor industry revenues in Q2 2013
Normalised Opex expected to be £79-81 million
FY 2013
Building on our strong performance in the first half, we expect overall Group dollar revenues for full year 2013 to be at least in line with market expectations

35
Q2 2013 – Revenue Summary ($)
Q2 2013
$m
Q2 2012
$m
PD
Licensing 88.3 67.0 32%
Royalties 119.3 96.3 24%
PD Total 207.6 163.3 27%
PIPD
Licensing 14.3 11.6 23%
Royalties* 16.0 13.7 17%
PIPD Total 30.3 25.3 20%
Development Systems 13.4 13.3 1%
Services 13.0 11.1 17%
Total Revenue 264.3 213.0 24%
* Includes catch-up royalties in Q2 2013 of $1.4m and $1.5m in Q2 2012

36
Q2 2013 – Revenue Summary (£)
Q2 2013
£m
Q2 2012
£m
PD
Licensing 56.9 42.6 34%
Royalties 77.7 61.5 26%
PD Total 134.6 104.1 29%
PIPD
Licensing 9.2 7.3 26%
Royalties* 10.4 8.6 21%
PIPD Total 19.6 15.9 23%
Development Systems 8.7 8.5 3%
Services 8.3 7.0 19%
Total Revenue 171.2 135.5 26%
* Includes catch-up royalties in Q2 2013 of £0.9m and £1.0m Q2 2012

37
Backlog Analysis – End Q2 2013
Backlog by Maturity Profile Backlog Composition
76%
11%
13%
Processors
Physical IP
Support, Maintenance & Other
26%
18%
56%
Q313/Q413 Q114/Q214 Q314+

38
Backlog Underpins Licensing Revenue
*Some architecture licenses are recognised in a similar way to
subscription licenses
Group order backlog at record levels
Opportunity pipeline healthy for 2013
Backlog underpins future licensing
revenue
Over 2 years quarterly revenue from
backlog has doubled
Revenue from backlog consists of
Quarterly contribution from subscription
and architecture licenses*
Processors that are in development and
that have reached milestones
Backlog underpins future licensing
revenue
0
1
2
3
4
5
6
H1 H2 H1 H2 H1 H2 H1 H2 H1 H2 H1 H2 H1
2007 2008 2009 2010 2011 2012 2013
Indexed License Revenue vs. Backlog (H1 2007=1)
License Revenue
Backlog
$0m
$50m
$100m
$150m
$200m
$250m
H1 H2 H1 H2 H1 H2 H1 H2 H1 H2 H1 H2 H1
2007 2008 2009 2010 2011 2012 2013
Licensing: Backlog versus Turns
Turns Business
BacklogBusiness
5x
1.75x

39
Converting Profit into Cash
0
20
40
60
80
100
120
Q211 Q311 Q411 Q112 Q212 Q312 Q412 Q113 Q213
EBITDA Cash from operations
No
rma
lis
ed
(£
Ms)
(£m) Q211 Q311 Q411 Q112 Q212 Q312 Q412 Q113 Q213 Total
Normalised
EBITDA 55 56 69 61 66 69 81 90 88 635
Normalised
Cash from
Operations*
47 56 57 71 60 94 83 82 104 654
% Cash
Conversion 86% 99% 83% 116% 91% 136% 102% 91% 117% 103%
* Net cash inflow from operating activities (per IFRS cash flow), adding back tax and cash outflows from normalised items

40
Summary Balance Sheet
IFRS 30 Jun 13 31 Dec 12
£MM £MM
Assets
Cash (net of accrued interest) 613.1 520.2
Accounts receivable (including AROC) 136.5 124.5
Other assets, inventory and investments 139.0 151.7
Available-for-sale financial assets - current 66.3 -
Prepayment (advance contribution to consortium) - 103.7
Property and equipment 35.0 36.1
Goodwill 555.6 519.4
Other intangibles 69.5 11.2
Total assets 1,615.0 1,466.8
Liabilities & shareholders’ equity
Deferred revenue 179.0 150.6
Other creditors 131.8 110.1
Shareholders’ equity 1,304.2 1,206.1
Total liabilities & shareholders’ equity 1,615.0 1,466.8

41
Cash Flow Summary
£MM Q2 13 H1 13
Operating activities 101.2 167.7
Interest received, net 2.8 7.2
Tax (0.2) (9.2)
Capital and other intangible expenditure (9.7) (29.2)
Investments and acquisitions (net of disposals) (4.2) (7.6)
Dividends payable (39.5) (39.5)
Share options 0.3 2.7
Other (forex) - 0.8
Cash flow 50.7 92.9
Opening cash (net of accrued interest) 562.4 520.2
Closing cash (net of accrued interest) 613.1 613.1
Profit before tax (normalised) 86.6 176.0
Interest income, depreciation and amortisation 1.6 2.7
Cash flows from items excluded from normalised profits (2.3) (17.9)
Movements in working capital 15.3 6.9
Operating activities 101.2 167.7

42
Contact Information
Contact Title Contact
Ian
Thornton
Head of Investor
Relations
+44 1223 400796
Jonathan
Lawton
Director, Investor
Relations
+44 1223 400533
Philip
Sparks
Investor Relations
Manager
+44 1223 400566


