39
OPERATIONAL REVIEWS 29 OPERATIONAL REVIEWS

OPERATIONAL REVIEWS
29OPERATIONAL REVIEWS

Thando Mkatshana, Chief Executive
ARM PLATINUM
* Two Rivers received consent during August 2017 i) to transfer the Tamboti rights to it and ii) to have its mining right amended accordingly. The amended mining right will be issued to Two Rivers imminently, at which point ARM’s interest in Two Rivers will increase to 54%.
ARM Mining Consortium
Anglo American PlatinumModikwa
Two Rivers* Impala Platinum
Modikwa communities
Nkomati Norilsk Nickel
Kalplats prospect
Anglo American
Stella Platinum
100%
83%
17%
51%
50%
46%
50%
49%
50%
10%
44%
50%
FREE STATE
LESOTHO
KWAZULU-NATAL
NORTHERN CAPE
LIMPOPO
NORTH WEST
KALPLATS PROSPECT
MPUMALANGA
GAUTENG
EASTERN CAPE
WESTERN CAPE
TWO RIVERS PLATINUM MINE
MODIKWA PLATINUM MINE
NKOMATI NICKEL MINE
30 INTEGRATED ANNUAL REPORT

PRODUCTION PROCESS
Ore extraction Froth fl otation
Drying and smelting @ 1 500ºC
Sm
all
ro
ck Ext
ract
s va
lua
ble
m
ate
ria
l
Co
nve
rte
r m
att
e
PGM
Ironsulphur
Copper Nickel Cobalt
Insoluble PGM
Crushing and milling
PLATINUM
PALLADIUM
RHODIUM
GOLD
Converterair blower
Refi nery(electrolysis)
Separation and
purifi cation
MATERIAL MATTERS
Delivering financial returns to shareholders and other providers of capital
Low PGM and nickel prices
Chrome a signifi cant contributor to Nkomati and Two Rivers
Inclusion of Tamboti right into Two Rivers
Continuously improving operational performance
High unit costs at Modikwa Mine
Head grade decline at Two Rivers Mine
Increased waste stripping at Nkomati Mine
Maintaining our social licence to operate
Regulatory uncertainty
Community unrest and expectations for mines to address high unemployment and service delivery issues
KEY FEATURES FOR F2017
Modikwa unit costs per 6E PGM increased below
infl ation.
Headline earnings increased to
R350 million from a headline loss of
R10 million.
Chrome as a by-product contributed
signifi cantly to profi t at Two Rivers and
Nkomati.
Nkomati had no lost time injury for the fi nancial
year.
PGMs
OPERATIONAL REVIEWS: ARM PLATINUM 31

SCORECARD
MODIKWA
F2017 OBJECTIVES PERFORMANCE AGAINST F2017 OBJECTIVES F2018 OBJECTIVES
Achieve 300 thousand 6E PGM ounces
while continuing to improve Modikwa
Mine’s position on the global PGM unit
cost curve.
Achieved Achieve 315 thousand 6E PGM ounces
while continuing to improve Modikwa
Mine’s position on the global PGM unit
cost curve.
Modikwa Mine produced 301 thousand
PGM ounces and improved from the 77th
percentile to the 70th percentile of the
global PGM cost curve.
Continue South 2 Shaft ramp-up towards
60 thousand tonnes per month, which
will be achieved in F2018.
Not achieved Continue South 2 Shaft ramp-up towards
60 thousand tonnes per month, which
will be achieved in F2019.The ramp-up of South 2 was delayed
in response to the weak platinum price
outlook.
Complete feasibility for installation of a
chrome recovery plant.
TWO RIVERS
F2017 OBJECTIVES PERFORMANCE AGAINST F2017 OBJECTIVES F2018 OBJECTIVES
Produce 380 thousand 6E PGM ounces
while maintaining Two Rivers Mine’s
position on the cost curve.
Achieved Produce 375 thousand 6E PGM ounces
while maintaining Two Rivers Mine’s
position on the cost curve. Production
volumes are expected to be lower due
to grade decline caused by mining of
split reef.
Two Rivers Mine produced 390 thousand
6E PGM ounces and remains positioned
on the 20th percentile of the global PGM
cost curve.
Achieve sales volumes of 280 thousand
tonnes of chrome concentrate.
Not achieved Achieve sales volumes of 275 thousand
tonnes of chrome concentrate.Lower grade resulted in lower chrome
yield. Sales volumes were 275 thousand
tonnes.
NKOMATI
F2017 OBJECTIVES PERFORMANCE AGAINST F2017 OBJECTIVES F2018 OBJECTIVES
Improve recoveries and the average
milling rate to 300 thousand tonnes per
month at the PCMZ plant.
Not achieved Increase milling rate to 300 thousand
tonnes per month and sustain recoveries.Recoveries were achieved, however,
tonnes milled were lower due to mine
industrial action and safety stoppages.
Maintain milling rate and improve
recoveries at the MMZ plant.
Not achieved Increase milling rate to 400 thousand
tonnes per month and maintain the
recovery.Recoveries were not achieved as a result
of lower head grades. Tonnes milled
were not achieved due to lower MMZ
ore availability and mine stoppages as
discussed above.
Continue with spot sales of chrome
concentrate subject to market conditions.
Achieve sales of 330 thousand tonnes of
chrome concentrate.
Not achieved Achieve sales of 360 thousand tonnes
of chrome concentrate and establish a
long-term off-take agreement for chrome.Chrome sales were 241 thousand tonnes
as the chrome washing plant was stopped
during the fi rst four months of the year
due to depressed prices at the time.
ARM PLATINUM continued
32 INTEGRATED ANNUAL REPORT

COMMODITY MARKETS
PlatinumThe platinum price decreased gradually from around US$1 180
per ounce in August 2016 to US$925 on 30 June 2017. Negative
news coverage around diesel engines caused demand from the
automotive sector to reduce during the last year, and jewellery
demand from China also decreased. The decline in China’s
jewellery demand is expected to be offset by increased demand
from India. Industrial demand remained high with strong buying
from China. ARM is of the view that the underlying long-term
fundamentals of platinum remain sound.
ARM Platinum achieved an average platinum price of US$987 per
ounce for F2017 (F2016: US$953 per ounce).
PalladiumThe palladium price continued to improve during F2017, reaching
a 15-year high of US$920 per ounce and closing the year at
US$864 per ounce. Global vehicle sales increased, especially
in China, strengthening the demand for palladium. Improved
industrial demand, together with a signifi cantly reduced Exchange
Traded Funds (ETFs) position, also contributed positively to
palladium prices.
The average price achieved in F2017 by ARM Platinum for
palladium was US$734 per ounce (F2016: US$578 per ounce).
RhodiumAs with palladium, the rhodium price improved steadily during
the period under review, with strong purchases by auto and glass
companies in China, moving the rhodium market closer to balance
(Johnson Matthey’s Platinum 2017 report).
ARM Platinum achieved an average rhodium price of US$783 per
ounce (F2016: US$684 per ounce).
NickelDespite a depressed nickel market during the last four months of
F2017, the average US Dollar nickel price increased by 7% during
F2017. Much of the world’s supply is not on fi nancially stable
footing and high stock levels are not expected to be cleared in the
short- to medium-term. ARM Platinum achieved an average nickel
price of US$9 882 per tonne (F2015: US$9 275 per tonne).
FINANCIAL PERFORMANCEARM Platinum’s attributable headline earnings increased to
R350 million (F2016: R10 million headline loss). This increase is
mainly as a result of Nkomati Mine, which benefi ted from the
sharp increase in chrome prices and reported a R78 million
positive mark-to-market adjustment on the realisation of debtors
at 30 June 2017 (F2016: R242 million negative adjustment). Two
Rivers Mine also benefi ted from higher chrome prices.
ARM PLATINUM ATTRIBUTABLE HEADLINE EARNINGS
BY OPERATION
R million
12 months ended 30 June
2017 2016 % change
Two Rivers Mine 325 318 2
Modikwa Mine (66) (84) 21
Nkomati Mine 91 (244) 137
Total 350 (10) >200
Average US Dollar prices, particularly of palladium (27%) and
chrome concentrate (65%) were higher than the previous
corresponding period. A 6% strengthening of the Rand against
the US Dollar resulted in platinum prices being slightly lower in
Rand terms, compared to F2016. Due to the higher palladium
content at Modikwa Mine, the average Rand 6E basket price
increased by 6% to R334 051 per kilogram (F2016: R315 748 per
kilogram), whereas the average basket price at Two Rivers Mine
increased by 4% to R333 749 per 6E kilogram (F2016: R320 977).
Reduced PGM production at the Nkomati (21%) and Two Rivers
(3%) mines resulted in ARM Platinum’s PGM ounces (on a 100%
basis) decreasing by 4% to 815 188 6E ounces (F2016: 851 924
6E ounces). Nkomati Mine’s nickel production decreased to
15 875 tonnes (F2016: 21 592 tonnes) as a result of reduced
tonnes mined, combined with lower grades and lower plant
recoveries.
Chrome 10% (7%)
Nickel 19% (21%)
Platinum 33% (37%)
Palladium 24% (20%) Rhodium 5% (4%)
Copper 4% (7%)
ARM PLATINUM REVENUE PER COMMODITY(comparative period in brackets)
Other 5% (4%)
4%
Capital expenditure at ARM Platinum operations (on a 100% basis)
increased to R1.3 billion (F2016: R1.1 billion).
As previously reported, market conditions necessitated Modikwa
Mine’s capital projects to be reviewed to reduce capital expenditure
without adversely affecting the mine’s future ability to ramp up
production. Capital expenditure reduced by 7% to R262 million
(F2016: R282 million).
32% of the capital spent at Two Rivers Mine is associated with
fl eet replacement and refurbishment. The deepening of the Main
and North declines, together with their electrical and mechanical
installations, comprised 57% of the total capital expenditure.
Nkomati Mine’s capital expenditure was mainly for the com-
mencement of the construction of a second anchored pile
wall (R69 million) as well as a pit proximity movement detection
system (R21 million). Capitalised waste stripping cost increased
by 76% to R617 million as waste mining volumes increased after
being reduced in F2016 to preserve cash. This is required to open
up the ore reserves and gain mining fl exibility.
Nkomati R718 million 56% (46%)
Modikwa R262 million 21% (27%)
Two Rivers R293 million 23% (27%)
ARM PLATINUM CAPITAL EXPENDITURE – 100% BASIS(comparative percentage in brackets)
4%
OPERATIONAL REVIEWS: ARM PLATINUM 33

ARM PLATINUM continued
CONTINUOUSLY IMPROVING OPERATIONAL PERFORMANCE
Two Rivers MineTwo Rivers Mine PGM production declined to 390 214 6E ounces
(F2016: 400 722 6E ounces) due to a 4% reduction in head
grade. The ore body south of the Main Shaft historically indicated
a decline in grades. Lower grades have, however, been inter-
sected sooner than expected due to split reef. Undercutting of
the lower grade ore and scalping of waste rock on surface are
some of the measures implemented to improve the Two Rivers
Mine’s head grade.
Of the 3.5 million tonnes milled, 58 689 tonnes were toll treated at
Modikwa Mine as part of Two Rivers Mine’s working capital
reduction initiatives.
The Two Rivers UG2 Mineral Reserves (Proved and Probable)
decreased from 43.25 million tonnes at 3.56g/t (6E) in F2016
to 33.25 million tonnes at 3.47g/t (6E) in F2017. In addition to
mining depletion during the year, the net loss in tonnage and 6E
ounces was due to undercut mining in the split reef area, a
reduction in the mining height in some areas as a result of
remodelling and mining design changes in the faulted area on
the North Decline area.
Two Rivers Mine received consent during August 2017 (i) to
transfer the Tamboti rights to it; and (ii) to have its mining right
amended accordingly. The amended mining right will be issued
to Two Rivers Mine imminently, at which point ARM’s interest in
Two Rivers will increase to 54%. The addition of the Tamboti
mining right to the Two Rivers mining area will result in the
deepening of the main decline.
Two Rivers Mine’s chrome concentrate sales contributed
R352 million (F2016: R130 million) to cash operating profi t.
Unit production costs per tonne milled increased by 7% while
unit costs per 6E PGM ounce increased by 10% to R6 195 per
6E ounce (F2016: R5 624 per 6E ounce). Two Rivers Mine remains
well within the fi rst quartile of the global PGM cost curve. There
was a 155 806 tonne decrease in the UG2 run-of-mine stockpile
to a total of 216 752 tonnes of ore.
Modikwa MineAn increase in head grade and concentrator recovery negated
the lower milled tonnes, resulting in Modikwa Mine’s PGM volumes
increasing by 3% to 301 228 6E ounces (F2016: 293 604 6E ounces).
Unit costs increased by only 3% to R8 463 per 6E PGM ounce
(F2016: R8 244 per 6E PGM ounce), mainly due to restructuring
initiatives at the mine.
Production ramp-up at South 2 Shaft has been slower than
expected, however, an upward trend has commenced, particularly
in the last quarter of F2017. The focus will remain on ramping up
of production from South 2 Shaft. Mining in areas that are producing
at a loss is being stopped.
Management is currently involved in an optimisation initiative,
which will see Modikwa Mine performing concentrated mining.
As reported in the 1H F2017 results, ARM recorded an attributable
impairment of R734 million after tax and non-controlling interest
of Modikwa Mine assets during the year.
Nkomati MineChrome concentrate sales from Nkomati Mine decreased by 12%
to 241 265 tonnes (F2016: 272 817 tonnes), but contributed
R408 million to cash operating profi t due to a substantial increase
in the realised Rand chrome prices. The decrease in chrome
production was mainly a result of the chrome washing plant being
stopped in November 2015 due to low prices at the time. The
chrome washing plant was restarted during October 2016.
Nkomati Mine’s total tonnes milled decreased by 9% to 7.49 million
tonnes. Nickel units produced decreased by 26% to 15 875 tonnes
(F2016: 21 592 tonnes). The main reasons for this underperformance
were:
> Poor mining effi ciencies in the fi rst half of the year, resulted
in lower ore supply to both the PCMZ and MMZ plants.
Furthermore, the mining contractor was impacted by a 15-day
unprotected strike and safety stoppages, which negatively
affected production. Corrective action was taken with regards
to the safety stoppages with changes implemented to the shift
arrangements and fatigue management.
> A change in the mining sequence caused by insuffi cient
waste stripping and geotechnical challenges, which resulted
in a decrease in the ore mined, reduced ore feed, head grade
and plant recoveries.
> The construction of a second pile wall, which commenced to
achieve slope stability on the Western perimeter of the open
pit. This resulted in mining being confi ned to the Eastern
benches only, which are lower grade. The mining of the Western
benches will commence in the second half of F2018, once Pile
Wall 2 construction is completed.
Nkomati Mine’s C1 unit cash costs net of by-products increased
by 15% to US$4.81/lb (F2016: US$4.18/lb) largely due to the
decrease in nickel units produced. Higher waste stripping
volumes resulted in unit cost per tonne milled (including capitalised
waste stripping costs) increasing to R367 per tonne milled.
The R617 million capitalised waste stripping is included in the
on-mine cash cost per tonne milled and the C1 cash unit cost
net of by-products.
As reported in the 1H F2017 results, ARM recorded an attributable
impairment of R711 million after tax of Nkomati Mine assets
during the year.
34 INTEGRATED ANNUAL REPORT

ENSURING A SAFE, HEALTHY AND SKILLED WORKFORCE
The ARM Platinum total workforce decreased by 10% to 10 340
at 30 June 2017 (F2016: 11 543), of which 69% were Full-Time
Employees (FTEs) (F2016: 68% FTEs) and 31% contractors.
The division invested R54 million in training initiatives.
SafetyLost Time Injuries (LTIs) decreased to 47 (F2016: 56) and the
LTIFR improved to 0.38 (F2016: 0.44) per 200 000 man-hours
worked. The last fatality in the division was in June 2014.
Nkomati Mine recorded zero LTIs during the year and Modikwa
Mine completed three million fatality-free shifts.
1.2
1.0
0.6
— Platinum Division Modikwa Mine Two Rivers Mine — Nkomati Mine
0.4
0.2
F2013 F2014 F2015 F2016 F2017
0.70
0.52
0.440.48
0.38
LTIFR(per 200 000 man-hours)
0.8
0.2
Operation
Total fatality-free
shifts worked Last fatality
Modikwa Mine 3 985 316 June 2014
Two Rivers Mine 3 907 495 January 2012
Nkomati Mine 5 768 196 September 2008
There were 20 Section 54 Notices resulting in safety stoppages
during the year (F2016: 27). There was one Section 55 Notice
issued, although this did not result in any shifts lost (F2016: 2,
no shifts lost).
Production at Modikwa Mine was affected by operators' poor
attendance around the holidays in December, January and April,
as well as by the stoppages due to Section 54 Notices.
The shift cycle for mining operations at Nkomati Mine was changed
from two 12-hour shifts to three eight-hour shifts after several
fatigue-related mobile machinery accidents. Fatigue in the workforce
is exacerbated as travelling times for operators to and from the
mine average an hour and a half to two hours.
ARM Platinum lost no man-days due to industrial action in F2017
(F2016: 1 607).
HealthNoise Induced Hearing Loss (NIHL) continues to be a focus
across the group and 18 410 audiometric tests were conducted
during F2017. Of these, 19 NIHL cases were submitted for
compensation (F2016: 16).
HIV counselling is offered to all employees who visit the site
clinics. HIV testing remains voluntary, and is referred to as
Counselling and Voluntary Testing (CVT). 16 602 employees
received counselling during F2017 (2016: 16 347). HIV prevalence
rates at the operations are estimated to be below those of the
districts in which the mines operate.
In terms of our integrated HIV, Tuberculosis (TB) and Sexually
Transmitted Infections (STI) policy, 19 942 employees were
screened for TB in the year to December 2016 (C2015: 21 286)
using the Department of Health’s passive screening form as
part of the TB management programme. 44 new cases of TB
were identifi ed (F2016: 63) and 49 were cured. Three cases of
multi-drug or extreme drug resistant TB (MDR or XDR TB) were
reported at ARM Platinum operations during F2017.
Group awareness discussions were implemented at the Modikwa
Mine clinic to raise awareness among employees waiting for
their annual medical examination. This led to the number of
employees electing to be tested after HIV counselling increasing
to 100%.
Two Rivers Mine concluded a memorandum of understanding
with the Department of Health to enable the Two Rivers Mine clinic
to provide primary healthcare services and specifi c medication
(including treatment for chronic diseases and TB) to employees
and contractors on behalf of the Department.
DiversityHDSA representation at management level in the Platinum Division
was 64% and remains an area of focus. All three mines in the
division submitted reports in terms of the existing Mining Charter
as required by the Mineral and Petroleum Resources Development
Act (MPRDA).
OPERATIONAL REVIEWS: ARM PLATINUM 35

ARM PLATINUM continued
ENSURING RESPONSIBLE STEWARDSHIP OF NATURAL RESOURCES
EmissionsARM Platinum’s combined Scope 1 (direct) and Scope 2 (indirect)
carbon emissions were 434 988 equivalent tonnes of CO2 (tCO2e)
on an attributable basis (F2016: 456 780 tCO2e), a decrease of
5%. Modikwa Mine produced 26% of the division’s total emissions,
Nkomati Mine 46% and Two Rivers Mine 28%.
500 000
400 000
300 000
200 000
100 000
F2013 F2014 F2015 F2016 F2017
408 360 416 829
456 780424 622 434 988
SCOPE 1 AND 2 CARBON EMISSIONS(tCO2e)
— Platinum Division Modikwa Mine Two Rivers Mine — Nkomati Mine
Energy useThe division’s electricity consumption was 804 597 megawatt
hours (MWh) on a 100% basis. This represents a decrease of
3% compared to consumption of 829 484 MWh in F2016. The
decrease is mainly attributable to a 6% decrease in electricity
consumed at Nkomati Mine, which put its underground section
under care and maintenance and did not run its chrome washing
plant for part of the year.
1 000 000
800 000
600 000
400 000
200 000
F2013 F2014 F2015 F2016 F2017
772 435810 310 829 484824 432 804 597
ELECTRICITY CONSUMPTION(MWh)
— Platinum Division Modikwa Mine Two Rivers Mine — Nkomati Mine
Various energy effi ciency initiatives were implemented during
F2017.
> Two Rivers Mine implemented a compressor effi ciency initiative,
a power factor correction project, improved ventilation effi ciency,
rolled out behaviour change awareness and maintenance
programmes and installed energy effi cient lighting;
> Modikwa Mine implemented projects to improve compressor
effi ciency, increase energy effi ciency of fans, introduced guide
vane controls, installed variable speed drives on cooling
towers, reduced pumping energy requirements and associated
costs by cutting back on water abstraction and installed
energy effi cient lighting; and
> Nkomati Mine removed redundant transformers, which
reduced no-load losses; installed energy effi cient equipment
and lighting; and ran building awareness initiatives.
8
7
6
4
1
F2013 F2014 F2015 F2016 F2017
6.0
6.6 6.76.3
2
3
5
4.2
WATER ABSTRACTED(million m3)
— Platinum Division Modikwa Mine Two Rivers Mine — Nkomati Mine
ARM Platinum abstracted 4.2 million m3 of water in F2017, 38%
less than in F2016 mainly due to decreased activity at Nkomati
Mine. Nkomati and Modikwa mines accounted for 30% of the
division’s total water withdrawal each, with Two Rivers Mine
abstracting 40%.
36 INTEGRATED ANNUAL REPORT

MAINTAINING OUR SOCIAL LICENCE TO OPERATE
ARM Platinum invested R29 million in LED in terms of our SLPs
(F2016: R17 million). CSI expenditure was R11 million (F2016:
R5 million), bringing the total investment in CSR projects to
R40 million (F2016: R22 million).
Two Rivers Mine lost three mining production days due to
community unrest during F2017 and Modikwa obtained an
urgent interdict to stop illegal mining activities on its premises,
which was followed by disruptions to employee transport.
LED projects included the following:
> Modikwa Mine resurfaced gravel and paving access roads
to the graveyards in the villages of Matimatjatji, Mooihoek,
Mamphahlane and Sehlaku, creating 27 temporary jobs.
> Modikwa Mine also regravelled the access road to
Mamphahlane village, creating seven temporary jobs.
> Modikwa Mine installed Apollo overhead lights at Hwashi
and Mamphahlane, creating four temporary jobs.
> Two Rivers Mine constructed a new administration block at
Maremele Primary School in Kutullo village, benefi tting
approximately 500 pupils and creating 10 jobs.
> Two Rivers Mine contracted a local supplier to support road
safety in Ngwaabe village and Sekhukhune Road by fi lling
potholes, improving the condition of the road and introducing
traffi c calming measures. The project created 15 jobs.
> Two Rivers Mine also renovated Mashishing Community Hall,
which had been unused since 2000, reviving this recreational
facility for the local community and creating 7 jobs.
> Nkomati Mine contributed to the Badplaas community security
services and repaired drainage systems as a CSI initiative.
PROJECTS
Two Rivers Platinum MineThe addition of the Tamboti mining right to the mining area of
Two Rivers Mine will result in the deepening of the main decline.
Modikwa MineIn order to improve mining fl exibility, a decision was taken to
deepen North Shaft and sink the new South 2 Shaft. The status
of these projects is detailed below:
> Deepening of the North Shaft – This project entails the
deepening of North Shaft from Level 7 to Level 9, thereby
establishing three new mining levels. To curtail capital
expenditure, portions of this project were deferred during
F2015, resulting in current development being delayed at
Level 9. Level 7 and 8 are both fully equipped with all the
required mining infrastructure and the chairlift installation and
construction to surface was commissioned in February 2017.
> Sinking of the new South 2 Shaft – This project entails
the establishment of an additional new decline shaft system
South of the current South Shaft Infrastructure. The fi rst phase
of the project will enhance mining fl exibility while also contributing
to the overall production build-up of the mine. Phase 1 of the
project has almost been completed and will take the production
capacity to 50 000 tonnes of ore per month by 2019. The
second phase will follow and increase the design capacity
of this shaft system to 100 000 tonnes per month.
Production and sales volumes from F2013 to F2020 (100% basis)
1 000
800
600
Modikwa Two Rivers Nkomati
400
200
F2013a F2014a F2015a F2016a F2020eF2017a F2018e F2019e
PGM PRODUCTION(000oz)
25
20
15
10
5
F2013a F2014a F2015a F2016a F2020eF2017a F2018e F2019e
NKOMATI NICKEL PRODUCTION(000t)
700
600
500
Nkomati chrome concentrate Two Rivers chrome concentrate
400
300
F2013a F2014a F2015a F2016a F2020eF2017a F2018e F2019e
200
100
CHROME SALES(000t)
OPERATIONAL REVIEWS: ARM PLATINUM 37

ARM PLATINUM continued
SUMMARY ARM PLATINUM SUSTAINABILITY STATISTICS (100% BASIS)
F2017 F2016 F2015 F2014 F2013
Employee indicators
Average number of permanent employees
and contractors* 9 321 9 704 10 413 10 184 11 249
– Permanent employees 5 724 5 992 6 347 6 061 5 853
– Contractors 3 597 3 712 4 066 4 123 5 396
LTIFR per 200 000 man-hours 0.38 0.44 0.48 0.52 0.70
Environmental indicators
Scope 1 and 2 carbon emissions tCO2e 434 988 456 780 424 622 416 829 408 360
Total water withdrawn** million m3 4.2 6.7 6.3 6.6 6.0
Energy usage
– Electricity MWh 804 597 829 484 824 432 810 310 772 435
– Diesel 000 litres 34 029 33 361 34 875 34 257 41 197
Community investment indicators
Total CSR 40 22 36 40 30
– CSI R million 11 5 11 9 10
– LED R million 29 17 25 31 20
* The number of permanent employees and contractors are reported on an average for the year basis, consistent with the calculation of safety statistics.
** Includes municipal, surface and ground water.
38 INTEGRATED ANNUAL REPORT

SUMMARY OPERATIONAL AND FINANCIAL INDICATORS (100% BASIS)
MODIKWA PLATINUM MINE
Ownership:
Effective 41.5% shareholding held through ARM Mining Consortium. 8.5% is held by local communities and 50% by Anglo American Platinum.
Management:
Jointly managed by ARM and Anglo American Platinum.
Refi ning:
All metal in concentrate produced is sold to Anglo American Platinum.
F2017 F2016 F2015 F2014 F2013
OPERATIONAL
Production volumes
Platinum oz 116 531 113 792 100 593 111 310 128 142
Palladium oz 114 274 111 507 99 082 106 654 122 213
Rhodium oz 24 144 23 605 20 802 21 933 25 598
Gold oz 3 014 3 011 2 694 3 382 3 444
Ruthenium oz 34 965 33 637 29 762 31 065 36 544
Iridium oz 8 302 8 051 7 104 7 361 8 685
PGMs oz 301 228 293 604 260 037 281 706 324 626
Nickel t 589 597 531 667 648
Copper t 365 364 321 409 400
Other operational indicators
Tonnes milled Mt 2.01 2.05 1.86 2.10 2.33
Head grade g/t 6E 5.43 5.27 5.17 5.06 5.35
Basket price R/kg 6E 334 051 315 748 336 699 322 789 287 424
Cash cost R/t 1 265 1 182 1 187 1 010 876
Cash cost R/PGM oz 8 463 8 244 8 481 7 545 6 275
Cash cost R/Pt oz 21 878 21 271 21 924 19 095 15 897
Cash cost R/kg 6E 272 104 265 046 272 676 242 577 201 752
FINANCIAL
Sales revenue R million 2 513 2 409 2 164 2 457 2 465
Cash operating cost R million 2 549 2 420 2 205 2 125 2 037
Cash operating (loss)/profit R million (36) (11) (41) 332 428
Capital expenditure R million 262 282 646 570 286
Refer to Note 2 of the Annual Financial Statements for the Modikwa Mine segmental information.AFS
OPERATIONAL REVIEWS: ARM PLATINUM 39
ARM PLATINUM continued
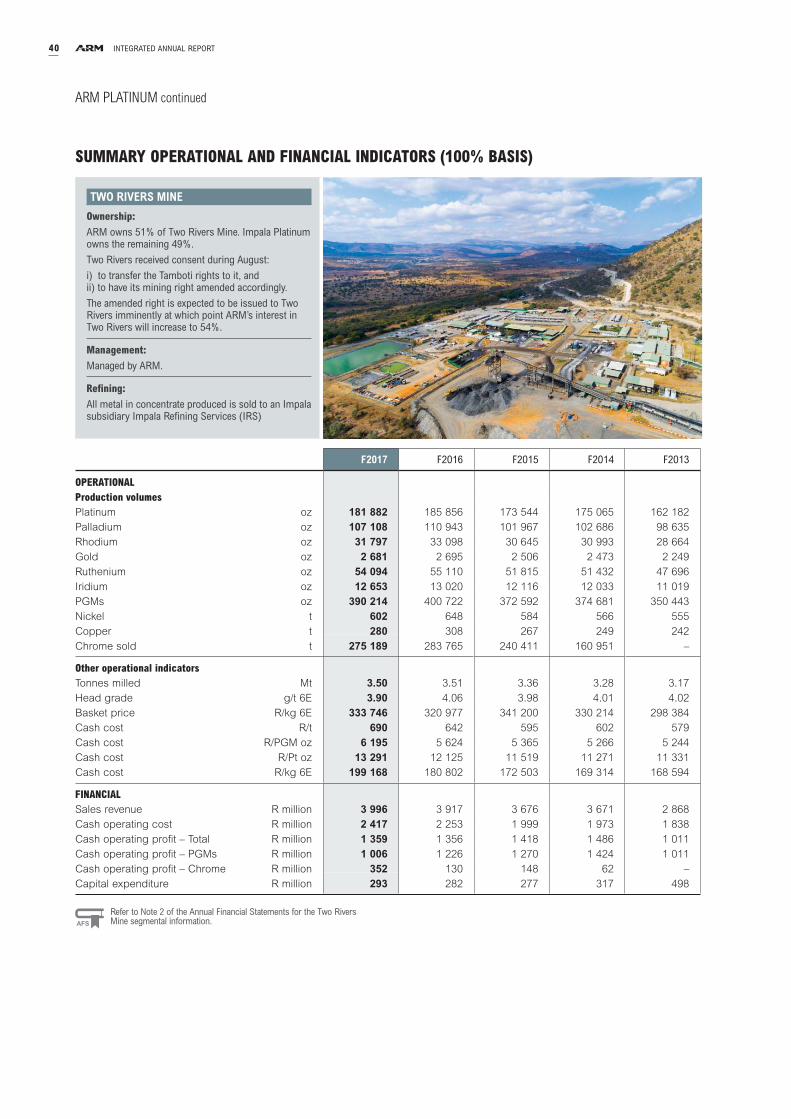
SUMMARY OPERATIONAL AND FINANCIAL INDICATORS (100% BASIS)
TWO RIVERS MINE
Ownership:
ARM owns 51% of Two Rivers Mine. Impala Platinum owns the remaining 49%.
Two Rivers received consent during August:
i) to transfer the Tamboti rights to it, andii) to have its mining right amended accordingly.
The amended right is expected to be issued to Two Rivers imminently at which point ARM’s interest in Two Rivers will increase to 54%.
Management:
Managed by ARM.
Refi ning:
All metal in concentrate produced is sold to an Impala subsidiary Impala Refi ning Services (IRS)
F2017 F2016 F2015 F2014 F2013
OPERATIONAL
Production volumes
Platinum oz 181 882 185 856 173 544 175 065 162 182
Palladium oz 107 108 110 943 101 967 102 686 98 635
Rhodium oz 31 797 33 098 30 645 30 993 28 664
Gold oz 2 681 2 695 2 506 2 473 2 249
Ruthenium oz 54 094 55 110 51 815 51 432 47 696
Iridium oz 12 653 13 020 12 116 12 033 11 019
PGMs oz 390 214 400 722 372 592 374 681 350 443
Nickel t 602 648 584 566 555
Copper t 280 308 267 249 242
Chrome sold t 275 189 283 765 240 411 160 951 –
Other operational indicators
Tonnes milled Mt 3.50 3.51 3.36 3.28 3.17
Head grade g/t 6E 3.90 4.06 3.98 4.01 4.02
Basket price R/kg 6E 333 746 320 977 341 200 330 214 298 384
Cash cost R/t 690 642 595 602 579
Cash cost R/PGM oz 6 195 5 624 5 365 5 266 5 244
Cash cost R/Pt oz 13 291 12 125 11 519 11 271 11 331
Cash cost R/kg 6E 199 168 180 802 172 503 169 314 168 594
FINANCIAL
Sales revenue R million 3 996 3 917 3 676 3 671 2 868
Cash operating cost R million 2 417 2 253 1 999 1 973 1 838
Cash operating profit – Total R million 1 359 1 356 1 418 1 486 1 011
Cash operating profit – PGMs R million 1 006 1 226 1 270 1 424 1 011
Cash operating profit – Chrome R million 352 130 148 62 –
Capital expenditure R million 293 282 277 317 498
Refer to Note 2 of the Annual Financial Statements for the Two Rivers Mine segmental information.AFS
40 INTEGRATED ANNUAL REPORT

SUMMARY OPERATIONAL AND FINANCIAL INDICATORS (100% BASIS)
NKOMATI MINE
Ownership:
ARM owns 50% of Nkomati Mine. Norilsk Nickel Africa (Pty) Ltd owns the remaining 50%
Management:
The mine is managed as a 50:50 unincorporated joint venture with Norilsk Nickel Africa (Pty) Ltd.
Refi ning:
All metal in concentrate produced (excluding chrome) is sold to Metal Trade Overseas AG. Chrome concentrate is sold on the spot market, through marketing agents, to various end-users.
F2017 F2016 F2015 F2014 F2013
OPERATIONAL
Production volumes
Nickel t 15 875 21 592 21 298 22 874 23 220
Copper t 7 637 9 893 9 666 10 116 9 877
Cobalt t 813 1 065 1 116 1 133 1 101
PGMs oz 123 745 157 598 144 368 185 194 111 185
Chrome concentrate sold 000t 241 273 377 342 225
Other operational indicators
Tonnes milled Mt 7.49 8.24 8.03 7.93 7.59
Head grade % 0.30 0.36 0.36 0.39 0.41
Average nickel price US$/t 9 882 9 275 15 102 15 488 16 245
Nickel on-mine cash cost per tonne
treated R/t 284 295 296 308 292
Nickel on-mine cash cost per tonne
milled (including capitalised waste
stripping costs) R/t 367 338 347 328 308
Cash cost net of by-products US$/lb 4.81 4.18 4.85 4.81 4.98
FINANCIAL
Sales revenue R million 3 991 4 491 5 372 6 063 4 488
Cash operating cost R million 2 128 2 435 2 380 2 444 2 218
Cash operating profit/ (loss) – Total R million 660 (112) 815 1 813 1 178
Cash operating profit – Nickel Mine R million 252 (232) 537 1 656 1 054
Cash operating profit – Chrome R million 408 120 278 157 124
Capital expenditure R million 718 488 666 258 189
Refer to Note 2 of the Annual Financial Statements for the Nkomati Mine segmental information.AFS
OPERATIONAL REVIEWS: ARM PLATINUM 41

André Joubert, Chief Executive
ARM FERROUS
MANGANESE DIVISION Cato Ridge Ferromanganese Works
Durban
Cape Town
Saldanha
Maputo Port
NORTHERN CAPE
MOZAMBIQUE
RAILAGE ROUTES
ROAD ROUTES
IRON ORE DIVISION
Khumani and Beeshoek mines
CHROME AND MANGANESE DIVISION Machadodorp Ferrochrome and Ferromanganese Works*
MANGANESE DIVISION
Nchwaning and Gloria mines
Johannesburg
East LondonCoega (Ngqura)
Port Elizabeth
FREE STATE
LESOTHO
KWAZULU-NATAL
LIMPOPO
NORTH WESTMPUMALANGAGAUTENG
EASTERN CAPE
WESTERN CAPE
Kimberly
100%
50%
50% 54%
100%
100%
100%
Nchwaning Mine Gloria Mine Machadodorp Works Cato Ridge Works
Khumani MineBeeshoek Mine
Cato Ridge Alloys (Pty) Ltd
Mizushima Ferroalloy
Company Limited
Sumitomo Corporation
Machadodorp Works*Chrome
Sakura Ferroalloys Sdn Bhd
Sumitomo Corporation
China Steel Corporation19%
Iron ore
Assmang
Assore
27%
* Machadodorp Works is currently recovering ferrochrome from historical slag dumps through the metal recovery plant.
* Machadodorp Works is currently recovering ferrochrome from historical slag dumps through the metal recovery plant.
50%
Manganese
40%
10%
South China Sea
Brunei
SARAWAK
SABAH
SAKURAFerroalloys Project
42 INTEGRATED ANNUAL REPORT

PRODUCTION PROCESSESIRON ORE MANGANESE ORE
Slimes fractions(-1mm)
PR
OD
UC
TS
Washing & screening and tertiary crushing
Washing & screening and tertiary crushing
WHIMS
Underground mining (primary crushing)
Fines
Super fi nes
Lumpy
Lumpy
Fines
Ore storage according to manganese ore grade (High, Medium, Low)
Processing plant(secondary crushing, washing & screening)
Fines & lumpy jigging
Continuously improving operational performance
Logistics for manganese ore and iron ore to the ports
Impact of higher than infl ation labour and electricity cost increases on unit production costs
MATERIAL MATTERS
Delivering financial returns to shareholders and other providers of capital
Volatility in commodity prices
Maintaining production of high quality manganese ore and iron ore
Profi tability of smelters
Completion and ramp-up of Black Rock Project on schedule and on time
PRODUCTSLumpy
fractionsFines
fractions
KEY FEATURES FOR F2017
Headline earnings increased by 157% to
R3.7billion.
Realised US Dollar
prices for iron ore and manganese ore
were 43% and 93% higher
respectively.
Below inflation unit
production cost increases were
achieved at both the iron ore and
manganese ore operations.
Black Rock Project
currently 80% spent or
committed.
Record LTIFR of
0.17per 200 000 man-hours achieved.
Maintaining our social licence to operate
Regulatory uncertainty
Stakeholder expectations (mainly communities, unions and government) from the mines
Achieving transformation targets
Ore extraction, primary and secondary crushing
Off-grade ore
On-grade ore
43OPERATIONAL REVIEWS: ARM FERROUS

SCORECARD
KHUMANI MINE
F2017 OBJECTIVES PERFORMANCE AGAINST F2017 OBJECTIVES F2018 OBJECTIVES
Maintain the good safety performance
achieved to date.
Achieved Maintain the good safety performance
achieved to date.LTIFR reduced by 39% year-on-year.
Increase production to 14.5 million
tonnes per annum.
Achieved Sustain production output at 14.3 million
tonnes per annum.14.6 million tonnes produced.
Produce 350 000 tonnes of ultra-fines
product for the year.
Achieved Increase ultra-fines product to 600 000
tonnes per annum.453 000 tonnes of ultra-fi nes product
produced.
Target iron ore sales on the export
market of 14 million tonnes per annum.
Achieved Maintain export iron ore sales of
14 million tonnes per annum.Total export sales achieved were
14.06 million tonnes.
Complete the evaluation of technology to
upgrade low grade iron ore feed
material.
Achieved Evaluate when to implement technology
to recover low grade feed material.Final report completed.
Complete the drilling of five boreholes
to improve water supply options.
Achieved Evaluate the equipping and extraction of
water from the five boreholes.Drill-work and sampling of the boreholes
completed.
Contain unit cost escalations below
inflation.
Achieved Contain unit cost escalations within
inflation.On-mine unit production costs increased
by 4% year-on-year.
Secure an offset area for Khumani Mine. Achieved Execute a management program for the
offset area.Offset area procured.
BEESHOEK MINE
F2017 OBJECTIVES PERFORMANCE AGAINST F2017 OBJECTIVES F2018 OBJECTIVES
Maintain the good safety performance
achieved to date.
Achieved Maintain the good safety performance
achieved to date.3.5 million fatality-free shifts.
Sustain production of 3 million tonnes
per annum.
Achieved Increase production output to 3.7 million
tonnes per annum.3.15 million tonnes produced.
Target iron ore sales to the local market
of 3 million tonnes.
Achieved Target iron ore sales to the local market
of 3.5 million tonnes per annum.
Target iron ore sales to the export market
of 300 000 tonnes.
Local sales were 3.2 million tonnes.
Accelerate the mining programme in the
East Pit to manage the slope stability.
Achieved Complete the mining activities in East Pit
by December 2018.The accelerated mining programme is
on schedule.
Evaluate product recovery options for
the Beeshoek tailings stream.
Achieved Complete feasibility study for the tailings
recovery project.Pre-feasibility study and test work
indicates good potential.
ARM FERROUS continued
44 INTEGRATED ANNUAL REPORT

BLACK ROCK MINE
F2017 OBJECTIVES PERFORMANCE AGAINST F2017 OBJECTIVES F2018 OBJECTIVES
Maintain the good safety performance
achieved to date.
Achieved Maintain the good safety performance
achieved to date.5.5 million fatality-free shifts achieved.
Ramp up production in line with the
Transnet expansion schedule.
Achieved Ramp up production in line with the
Transnet expansion schedule. Target
3.6 million tonnes of product for 2018.
Complete the following: Achieved as follows: Complete the following:
> Commissioning and licensing of the
Nchwaning II winder.
> Winder successfully commissioned. > Stacker 2 commissioning.
Commissioning of the product
stockyard, load-out station and
rail balloon.
> Commissioning the Nchwaning II
Shaft upgrade.
> Nchwaning II Shaft upgraded. > Rail link line. Performance testing of
product load-out system.
> Nchwaning II underground mining
development at shaft bottom.
> Underground mining completed. > Nchwaning I key underground
infrastructure.
> Nchwaning I key underground
infrastructure development.
> Nchwaning I key infrastructure
developed.
> Nchwaning II underground sliping
and support.
> Construction and commissioning of
the new rail balloon.
> New rail commissioned. > Nchwaning II underground silos at
station ore handling system.
> New stacker, product reclaimer and
load-out station.
> New stacker, product reclaimer and
load-out station constructed.
> Nchwaning III underground sliping
and support in Satellite Tip 1 Area.
> Commissioning of new time-and-
attendance system.
> New time-and-attendance system
commissioned.
> Nchwaning III underground Silos at
Satellite Tip 1 Area.
> Commissioning of Nchwaning II
surface plant.
> Commissioned Nchwaning II surface
plant.
> Nchwaning III underground mining
development. Gloria second escape
shaft commissioning and winder
licencing.
> Evaluation of Gloria underground
infrastructure development.
> Evaluated Gloria underground
infrastructure development.
> Gloria decline design and
procurement process. Commence
with design on Gloria underground
infrastructure.
CATO RIDGE WORKS
F2017 OBJECTIVES PERFORMANCE AGAINST F2017 OBJECTIVES F2018 OBJECTIVES
Assess which furnaces are the lowest
cost and operate the lowest cost
combination.
Achieved Contain unit production cost increases.
The lowest cost combination of
furnaces was assessed and is now fully
operational.
Ladle carrying equipment will be tested
so that it becomes possible to transfer
hot metal from Furnace 2 to the refined
alloy business.
Achieved
The ladle carrying equipment to transfer
hot metal to Cato Ridge Alloys (CRA)
was successfully implemented and
currently fully operational.
Assess the use of self-reducing pellets
to enhance furnace efficiencies.
Achieved Assess furnace performance and cost
when using lower grade N-Ore from the
mine.Self-reducing pellets were tested and
enhanced furnace performance was
achieved during the trial.
Progress technology to pilot testing
phase if feasible (direct reduction).
Achieved Design and build a demonstration
furnace if approval is obtained.Proof of concept achieved.
45OPERATIONAL REVIEWS: ARM FERROUS

Structurally, the iron ore market remains oversupplied and
increased supply from lower cost producers over the next two
years is expected to continue driving the need for higher cost
displacement. Consensus remains that the current price rally,
which started at the end of the fi nancial year and continued into
F2018, may not be sustainable past the fi rst half of the 2018
calendar year as supply of iron ore increases.
The geographical sales distribution refl ected Assmang’s stable
sales and marketing strategy, targeting not only nett return but
also less volatile markets, mostly to end steel mill consumers.
China remains the largest market for Assmang’s iron ore.
Domestic sales in South Africa increased to 19% of total sales
volumes. The negative outlook for the South African economy
remains a concern, particularly as the domestic steel industry is
not experiencing similar positive conditions to major international
steel markets.
Manganese ore Manganese ore prices were volatile in F2017, with prices reaching
an eight-year high of US$9.22/mtu for 44% manganese ore CIF
China and US$7.45/mtu for 37% manganese ore FOB Port
Elizabeth in December 2016. The rally was driven by reduced
supply caused by a series of production cuts in the industry
in late 2015 and early 2016, which were implemented after a
sustained period of low prices.
With prices increasing during most of 2016 and most signifi cantly
from August to December 2016, production cutbacks were
reversed, with some small volumes brought back into production.
This coincided with the increase in Chinese crude steel production,
increasing demand for manganese alloys. Other factors contributing
to the manganese ore price rally on both high grade (oxide
ores) and medium grade (semi-carbonate ores) were logistical
bottlenecks in South Africa’s ports and rail infrastructure. The
railway line to Port Elizabeth experienced several interruptions,
while the port experienced loading issues due to the refurbishment
of the two tipplers which had commenced in July 2016.
The second half of the fi nancial year saw a sharp downward
correction in prices due to weakening market demand going into
the Chinese New Year (in February) and an increase in available
material. This was driven mostly by suppliers responding to the
higher prices by selling off stocks and increasing capacity
utilisation at existing assets.
COMMODITY MARKETS
Crude steelGlobal steel demand grew by approximately 1% in the 2016
calendar year compared to 2015. Most of the growth was
reported in Asia, but Europe also contributed positively. World
crude steel production increased marginally by 0.6% in 2016 after
a contraction of 3% in 2015. Chinese crude steel production
increased by 1.2% to 808 million tonnes.
Most economies outperformed market expectations and steel
demand has been stronger than expected. Steel mills, particularly
in China, continue to report strong margins on the back of
government construction and infrastructure spending. Market
sentiment remains positive for the 2017 calendar year as the
Chinese government implements curtailment of outdated and
ineffi cient steel production capacity. Environmental restrictions
introduced for the winter season have also added to positive
sentiment for steel mills and contributed to higher steel prices.
Fiscal, environmental and monetary policies in China are expected
to continue to shape demand for steel and related commodities.
Iron oreA robust Chinese steel sector assisted in driving and maintaining
higher than expected prices for iron ore, with the price for 62%
iron ore fi nes (delivered in China) reaching US$95 per tonne
during February 2017, a level last recorded in August 2014. Iron
ore prices did not, however, sustain the upward trend and
reduced slightly from these highs towards the end of F2017 as
increased supply of high-cost iron ore entered the market
again. This was in contrast with steel prices, which continued to
strengthen.
For the fi nancial year ended 30 June 2017, the average market
price for 62% iron ore fi nes (CIF North China) increased by 37%
to US$69.41/t compared to the corresponding comparative
period. The lumpy premium weakened signifi cantly in the year
under review to a historical low of US$1/mt during April 2017,
mainly as a result of additional lumpy ore supplied to the market,
as well as high stock levels. Increased focus on productivity
by steel mills as well as environmental restrictions assisted to
increase the demand for lumpy iron ore and the lumpy premium
recovered to US$13/mt by year-end.
ARM FERROUS continued
SAKURA FERROALL0YS
F2017 OBJECTIVES PERFORMANCE AGAINST F2017 OBJECTIVES F2018 OBJECTIVES
Optimisation of the raw material mix feed
into the furnaces to reduce costs.
Commission the Brex Plant to full
production to consume fines on site.
Complete slag test work to determine
suitability for application in the
aggregate industry
46 INTEGRATED ANNUAL REPORT

ARM FERROUS HEADLINE EARNINGS BY DIVISION
R million
12 months ended 30 June
2017 2016%
change
Iron ore division 4 373 2 429 80
Manganese division 2 322 396 >200
Chrome division 749 111 >200
Total (100% basis) 7 444 2 936 154
ARM share 3 723 1 468 154
Consolidation adjustments (14) (27)
Headline earnings
attributable to ARM 3 709 1 441 157
ARM FERROUS UNIT COST AND EBITDA MARGIN
PERFORMANCE
Commodity group
Unit costof sales
% change
On-mine unit
productioncost
% change
EBITDAmargin
%
Iron ore 2 3 45
Manganese ore 12 1 45
Manganese alloys 5 5 4
CONTINUOUSLY IMPROVING OPERATIONAL PERFORMANCE
Iron oreIron ore contributed a signifi cant R4 373 million to the ARM Ferrous
headline earnings (on a 100% basis).
ARM Ferrous iron ore sales volumes were up 2% to 17.3 million
tonnes, of which 14.1 million tonnes were sold into the export
market and 3.2 million tonnes were sold locally. Iron ore production
volumes were a record 17.7 million tonnes, a million tonnes higher
than F2016.
Khumani Mine production volumes increased 6% to 14.5 million
tonnes. The increased volumes were achieved through better in-
pit blending of ore, together with improvements to the benefi ciation
plant’s availability, performance and maintenance planning.
Khumani Mine also successfully commissioned an ultra-fi nes
recovery circuit in March 2017 to recover an additional 250 thousand
tonnes of ultra-fi ne iron ore product per annum. The circuit is now
fully operational.
Beeshoek Mine production volumes increased marginally to
3.2 million tonnes as the mine continued to deliver as per its
off-take agreement with a South African steel producer. The
Beeshoek Village Pit is now in full production. In collaboration
with Transnet, a link to the export line to Saldanha Port has been
created for additional fl exibility.
Inventories at Chinese ports during this period rose to levels of
around 3.3 million tonnes, resembling a time when the market
was in a state of oversupply. The average index price for F2017
for the high grade lumpy ore (44% manganese content) was
US$5.77/mtu (delivered in China) (F2016: US$2.88/mtu), while
the average medium grade (lumpy) ore price index (37%
manganese content) for F2017 was US$4.56/mtu (FOB Port
Elizabeth) (F2016: US$2.31/mtu).
Manganese alloysConsistent with the previous years, the start of the fi nancial year
was marked with weak demand and an oversupply in the
manganese alloy market. Toward the end of the fi rst half of the
fi nancial year, manganese alloy prices rallied, fi rst in Asia and
then, from November onwards, in the USA and Europe as a
result of higher input costs and increased steel demand.
The tight market experienced in the USA and Europe persisted
throughout the second half of the fi nancial year, with supply
insuffi cient to meet strong demand. The overall market tightness
in supply led to signifi cantly more resilient alloy prices compared
to previous years. The last time prices were around F2017 levels
was the end of 2009 to early 2010.
OutlookThe outlook for world economic growth continues to improve in
most regions and is expected to result in a more positive outlook
for commodities compared to a year ago. Underlying market
fundamentals remain positive, but the impact of additional supply
is expected to affect iron ore prices with many analysts predicting
a price of around US$60/t by the end of F2018. Credit tightening
in China together with weaker sentiment could impact demand
and price negatively in the short-term.
The high manganese ore inventory in China and increased
production levels globally (since the cuts in early 2016) are
expected to affect the supply/demand balance in the short term,
with analysts’ expectations of a weaker manganese ore price.
FINANCIAL PERFORMANCEARM Ferrous headline earnings increased by 157% to R3 709 million
(F2016: R1 441 million) mainly driven by a signifi cant increase
in the iron ore, manganese ore and manganese alloy US Dollar
prices. These increases were partially offset by a 6% strengthening
of the Rand versus the US Dollar.
The operations were able to deliver into this improved price
environment, realising average US Dollar prices that were 43%
and 93% better for exported iron ore and manganese ore,
respectively.
In addition to improved realised prices, disciplined unit production
cost containment and increased volumes at the iron ore and
manganese alloy operations also contributed to higher earnings.
47OPERATIONAL REVIEWS: ARM FERROUS

ENSURING A SAFE, HEALTHY AND SKILLED WORKFORCE
The Ferrous Division employed 4 816 full-time employees and
7 102 contractors at 30 June 2017 (F2016: 4 497 full-time
employees and 5 213 contractors). The division invested
R121 million in training initiatives, which represents 7.5% of payroll
for the division.
SafetyARM Ferrous achieved its best ever safety performance in F2017,
with total LTIs declining to 15 for the year (F2016: 25). There were
no fatalities in the division (F2016: nil) and the LTIFR per 200 000
man-hours at ARM Ferrous improved to 0.17 (F2016: 0.22).
1.0
0.8
0.6
0.4
0.2
F2013 F2014 F2015 F2016 F2017
0.220.17
0.320.26
0.25
LTIFR(per 200 000 man-hours)
— Ferrous Division Beeshoek Mine Khumani Mine Black Rock Mine Cato Ridge Works Machadodorp Works
Black Rock Mine exceeded fi ve million fatality-free shifts and
Khumani Mine passed one million fatality-free shifts.
OperationTotal fatality-free
shifts worked Last fatality
Beeshoek Mine 3 503 758 March 2003
Black Rock Mine 5 579 010 April 2009
Khumani Mine 1 456 515 April 2015
Cato Ridge Works 2 169 396 February 2008
Machadodorp Works 1 020 169 February 2011
While overall LTIs declined, the ongoing focus on safe working
practices in the Ferrous Division led to a special drive being
initiated to address an increase in LTIs among contractors. The
drive focused on numerous actions to improve awareness, com-
mitment and enforcement of safety policies, procedures and
practices in the workplace.
All the ARM Ferrous operations contained on-mine unit production
cost increases below infl ation. Khumani Mine unit production
costs were 4% higher than F2016, while Beeshoek Mine reported
a unit production cost increase of 2%. Unit production costs at
Beeshoek Mine have been kept at relatively constant levels for the
past fi ve years.
Manganese ore and alloysManganese ore production volumes increased by 5% to 3.1 million
tonnes, despite Nchwaning 2 Shaft being out of commission
for six months in F2017 as the modernisation and upgrading
of Black Rock Mine continued. During the six months, teams
from Nchwaning 2 were re-deployed to Gloria Mine. The newly
refurbished Nchwaning II Shaft was commissioned and successfully
handed over to the operations in January 2017.
There was an improvement in employee engagement and
communication through the “Black Rock Mine Operation
(BRMO) Connect” project, which allowed the mine to achieve its
highest level of productivity in tonnes per employee and an all-
time production record in the month of June 2017.
Manganese ore sales volumes were down by 4% to 3 million
tonnes, of which 2.9 million tonnes were export sales and
0.1 million tonnes were sold into the local market.
Manganese alloy production at Cato Ridge Works was 5%
better than in F2016 at 161 thousand tonnes, due to improved
availability of furnaces and a reduction in the variability of the
ore from Black Rock Mine.
Cato Ridge Works sales volumes increased by 7% to
168 thousand tonnes. Cato Ridge Works continued to focus on
improving furnace effi ciencies and operational fl exibility. The
fabrication of a bridle, enabling the transport of metal ladles
with a slag hauler, now allows Cato Ridge Works to transfer
molten metal to Cato Ridge Alloys from all operating furnaces,
further enhancing fl exibility. Input cost pressures have been
mitigated by utilising briquettes comprising bag house dust,
metal fi nes, carbon fi nes and other fi ne materials. These are
agglomerated on site, thereby reducing the requirement for
expensive ore by 10%. Further raw material trials are being
conducted to reduce costs.
Sakura commissioned both furnaces successfully and is
producing high carbon ferromanganese at levels in excess of
nameplate capacity. The alloy production is also meeting
customer specifi cations.
FerrochromeMachadodorp Works is currently only recovering ferrochrome
from its historical slag dumps through the Metal Recovery Plant.
Sales increased by 20% from F2016.
ARM FERROUS continued
48 INTEGRATED ANNUAL REPORT

ENSURING RESPONSIBLE STEWARDSHIP OF NATURAL RESOURCES
EmissionsARM Ferrous accounted for 58% of ARM’s total Scope 1
and 2 carbon footprint for F2017, producing an estimated
608 040 equivalent tonnes of CO2 (tCO2e) on an attributable basis
(F2016: 615 843 tCO2e). Cato Ridge Works, which accounts for
58% of the division’s emissions, increased carbon emissions by
5%. However, this was offset by the sale of Dwarsrivier Mine in
July 2016, which is no longer included in the calculation.
F2013 F2014 F2015 F2016 F2017
1 000 000
800 000
600 000
400 000
200 000
829 829 845 947
615 834
813 691
608 040
SCOPE 1 AND 2 CARBON EMISSIONS(tCO2e)
— Ferrous Division Beeshoek Mine Khumani Mine Black Rock Mine Cato Ridge Works Machadodorp Works
Energy useARM Ferrous is a member of the Energy Intensive Users
Association and has an Energy Efficiency Charter to map its
development and implementation of energy-efficient practices.
During F2017, the division consumed 875 415 MWh (F2016:
887 382 MWh) of electricity. Energy effi cient LED lighting
replacements were performed at Beeshoek and Black Rock
Mines and Khumani Mine is investigating the feasibility of installing
a solar PV plant.
1 500 000
1 200 000
900 000
600 000
300 000
F2013 F2014 F2015 F2016 F2017
1 199 190 1 215 622
887 382
1 164 218
875 415
ELECTRICITY CONSUMPTION(MWh)
— Ferrous Division Beeshoek Mine Khumani Mine Black Rock Mine Cato Ridge Works Machadodorp Works
Black Rock Mine received an award from the DMR for being the
safest underground mine in the Northern Cape. Presidential
audits were conducted by the DMR at all three of the mines in
the Ferrous Division, with no Section 54 Notices being issued
during the visit.
ARM Ferrous had one Section 54 Notice which resulted in a
safety stoppage in F2017 (F2016: 6), but no shifts were lost as
a result (F2016: 11). No Section 55 Notices were issued in the
Ferrous Division (F2016: 1).
A human resource operational excellence project has been
rolled out across the Ferrous Division operations in the Northern
Cape and is progressing well. Two project streams have been
identifi ed and prioritised – employee relations and contingent
worker management. Extensive engagement took place at
the Northern Cape operations to expand union recognition
agreements to foster broader union representation and a more
inclusive workplace.
HealthThere were 20 313 audiometric tests conducted on employees
and contractors to monitor NIHL during F2017. Of these, two
cases (F2016: four) were submitted for compensation for NIHL.
13 725 employees and contractors received counselling for HIV
& Aids (F2016: 9 860) and 2 250 were tested (F2016: 1 662).
Employees and contractors on disease management programmes
decreased to 1 431 and those receiving anti-retrovirals increased
to 2 451 (F2016: 1 940).
TB screening was conducted on 27 213 employees and
contractors (F2016: 23 957), with 18 new cases identified (F2016:
39) and 29 cases cured. One case of MDR TB was identifi ed and
admitted to a special MDR hospital for further management, as
required by the Department of Health.
During F2017, Black Rock Mine achieved certifi cation in terms
of SANS 16001 2013, the Wellness and Diseases Management
Standard. All three mines in the Northern Cape are now SANS
16001 certifi ed.
A gap analysis audit was conducted at the Northern Cape
mining operations to assess compliance with recent changes in
reporting requirements by the Northern Cape DMR, specifi cally
regarding reporting of pulmonary TB. A corporate standard
was drafted detailing the required reporting procedures to
various regulatory and statutory bodies and is in the process of
being implemented by the operations.
Khumani, Beeshoek and Black Rock mines partner with the
Northern Cape Department of Health to improve access to
treatment for HIV, TB, STIs and chronic diseases.
DiversityThe Ferrous Division’s transformation performance continued to
improve and HDSA representation at management level increased
to 61%. The three mines in the division reported against the
existing Mining Charter as required by the MPRDA. Black Rock
Mine is in the process of training safety representatives to meet
the requirements of the Mining Charter.
49OPERATIONAL REVIEWS: ARM FERROUS

MAINTAINING OUR SOCIAL LICENCE TO OPERATE
ARM Ferrous’s investment in LED in terms of our SLPs decreased
1% to R63 million in F2017 (F2016: R64 million). CSI expenditure
was R6 million (F2016: R9 million), bringing the total investment
in CSR projects to R69 million (F2016: R73 million).
ARM Ferrous initiated the formation of a working committee with
the other manganese producers in the region and the Chamber
of Mines to develop sustainable solutions to the various CSR
challenges in the Northern Cape.
Significant LED projects supported by ARM Ferrous include:
> Beeshoek Mine completed the construction of a 2.5 million litre
elevated steel tank to improve access to potable water for the
4 118 residents of the Postdene community.
> Beeshoek Mine initiated an Small, Medium and Micro Enterprises
(SMME) incubation programme focusing on alternative building
methods, decorative concrete, gemazine and paintless dent
repair for 20 local SMMEs.
> Beeshoek Mine supported 11 SMMEs from Tsantsabane
through its enterprise and supplier development programme
to support entrepreneurs in the mining value chain. Enterprises
supported include a canteen, general dealer and a car wash.
> Black Rock Mine completed the refurbishment of the Ncweng
Community Hall in the Ga-Segonyana Local Municipality. Six
temporary jobs were created during the project and the hall is
used by 279 households in the community.
> Black Rock Mine created 20 temporary jobs through a project
that resealed internal roads infrastructure used by 3 188 house-
holds in Kuruman and Wrenchville.
> Black Rock Mine constructed a 2.5 kilometer tarred access
road in Maruping village, creating 20 temporary local jobs
and involved two companies from the mine’s enterprise
and supplier development programme. 6 233 households
in Maruping will benefi t from the road, and the neighbouring
villages of Vergenoeg and Batlharos.
> Khumani Mine constructed a second reservoir to expand
water storage for the benefi t of the 14 751 members of the
Olifantshoek community, creating 67 part-time and 24 full-
time jobs.
> Khumani Mine upgraded 1.7 kilometers of gravel internal road
to a paving standard road in the Deben community.
> Khumani Mine constructed 750 sanitation toilets at Magojaneng
and Seoding Villages in Kuruman.
CSI projects included:
> Khumani Mine contributed to a feasibility study for the Gamagara
local municipality.
> Khumani Mine donated a modifi ed wheelchair to a child with
disabilities.
Water useWater is a scarce resource in the Northern Cape, where Black
Rock, Beeshoek and Khumani mines are located. Ensuring a
consistent supply of water is a key concern in the area and a
potential constraint to future growth.
ARM Ferrous operations accounted for 69% of the total water
abstracted by ARM operations. Beeshoek Mine accounted for
46% of the division’s water abstracted although most of the
mine’s water is supplied to local communities. The volume of
water abstracted by the ARM Ferrous operations reduced to
9.8 million m3 in F2017 (F2016: 11.5 million m3).
15
12
3
F2013 F2014 F2015 F2016 F2017
13.7
11.7 11.5
10.8
6
9
9.8
WATER ABSTRACTED(million m3)
— Ferrous Division Beeshoek Mine Khumani Mine Black Rock Mine Cato Ridge Works Machadodorp Works
Khumani Mine has undertaken a detailed groundwater study
and boreholes have been sunk at key marked areas. These will
form the basis for an abstraction model to supplement water
from Sedibeng Water once approved by the Department of
Water and Sanitation.
Since August 2016, ARM has taken a strategic role in the Vaal
Gamagara Water Supply Scheme project to develop a collaborative
response to the requirements for bulk water supply and pricing
over the next 25 years.
ARM FERROUS continued
50 INTEGRATED ANNUAL REPORT

Sales volumes from F2013 to F2020
IRON ORE(000t)
20 000
15 000
10 000
5 000
Export Local
F2019eF2018eF2017F2013 F2014 F2015 F2016 F2020e
4 500
4 000
2 000
500
F2019eF2018eF2017F2013 F2014 F2015 F2016 F2020e
1 500
1 000
2 500
3 000
3 500
MANGANESE ORE(000t)
400
250
200
50
Cato Ridge Sakura
350
300
150
100
F2019eF2018eF2017F2013 F2014 F2015 F2016 F2020e
FERROMANGANESE(000t)
PROJECTS
Black Rock ProjectThe total capital requirement for the Black Rock Project has
been re-evaluated in line with the better outlook for manganese
ore. The scope of the project has been revised from R6 billion
to the original Board-approved R6.7 billion. Due to the poor
outlook in F2016 and cutbacks on capital, some of the key
underground elements of the project were delayed. All of this
work has been re-commissioned and the revised timeline
indicates that some of the underground installations will lag the
original schedule.
The underground development and infrastructure work proceeded
according to plan and budget. The shutdown to upgrade
Nchwaning II Shaft and surface plant infrastructure was completed
successfully and the Nchwaning II Shaft was handed over for
production in early January 2017.
The primary focus of the project remains:
> The modernisation of the mine to optimise resource exploitation
and to maximise utilisation of production hours, production
fl eet and mining equipment.
> The cost-effective exploitation of the Seam 1 and Seam 2
manganese resources at the Nchwaning mining complex,
targeting the production of high-grade manganese products.
> The modernisation of the surface plant infrastructure to ensure
the cost-effective processing and separation of the various
high-grade manganese products from the two Seams.
> Creating the fl exibility within the underground operations at
the Nchwaning Shafts to ensure the mine can react more
effectively to changes in market product requirements.
> Creating the ability to exploit the high-grade ore within
Nchwaning 1.
> Establishing the load-out capacity and effi ciencies to meet the
requirements as set by Transnet for the Ngqura Port facility.
Sakura Ferroalloys Project The Sakura Project is complete and both furnaces 1 and 2 are
producing high carbon ferromanganese. Production levels exceed
design capacity, and process effi ciencies and unit costs are in
line with planned expectations. The high carbon ferromanganese
being sold to customers has met all fi nal product quality
specifi cations.
The construction of the agglomeration plant (Brex) is complete
and various feed constituents are being trialled and tested on
the furnaces. Sakura is now utilising the Bintulu Port as well as
the Samalaju Port for the movement of fi nal products and raw
materials. Sakura is now classifi ed as fully operational.
Khumani Mine – Ultra Fines Recovery ProjectThe design work for the ultra-fi nes recovery circuit was completed
and successfully commissioned. This project will enable the
recovery of additional iron ore units from the tailings stream
and will see the production of an additional 200 000 tonnes
per annum of ultra-fi nes iron ore product for the next fi nancial
year.
This project was completed on time and within budget.
51OPERATIONAL REVIEWS: ARM FERROUS

SUMMARY ARM FERROUS SUSTAINABILITY STATISTICS (100% BASIS)
F2017 F2016 F2015 F2014 F2013
Employee indicators
Average number of permanent employees
and contractors* 8 662 9 953 10 759 10 858 11 557
– Permanent employees 4 522 5 638 6 138 6 306 6 561
– Contractors 4 140 4 315 4 621 4 552 4 996
LTIFR per 200 000 man-hours 0.17 0.22 0.26 0.25 0.32
Environmental indicators
Scope 1 and 2 carbon emissions tCO2e 608 040 615 843 813 691 845 947 829 829
Total water withdrawn** million m3 9.8 11.5 10.8 11.7 13.7
Energy usage
– Electricity MWh 875 415 887 382 1 164 218 1 215 622 1 199 190
– Diesel 000 litres 49 837 54 264 58 387 54 007 62 686
Community investment indicators
Total CSR R million 69 73 107 136 101
– CSI R million 6 9 28 25 21
– LED R million 63 64 17 111 80
* The number of permanent employees and contractors are reported on an average for the year basis, consistent with the calculation of safety statistics.
** Includes municipal, surface and ground water.
SUMMARY OPERATIONAL AND FINANCIAL INDICATORS (100% BASIS)
IRON ORE DIVISION
Operations:
Khumani and Beeshoek mines
Ownership:
50% held through Assmang (Pty) Ltd.
Management:
Jointly managed by ARM and Assore through Assmang. ARM provides administration and technical services, while Assore performs the sales and marketing function as well as technical consulting services.
F2017 F2016 F2015 F2014 F2013
OPERATIONAL
Production volumes 000t 17 714 16 726 16 076 16 054 16 103
Khumani Mine 000t 14 560 13 616 12 649 12 930 13 167
Beeshoek Mine 000t 3 154 3 110 3 427 3 124 2 936
Sales volumes 000t 17 275 17 008 16 185 15 640 16 070
Export iron ore 000t 14 061 14 103 13 658 13 646 14 057
Local iron ore 000t 3 214 2 905 2 527 1 994 2 013
Unit cost changes
On-mine production unit costs % 3 (8) 3 10 20
Unit cost of sales % 2 (2) (4) 11 9
FINANCIAL
Sales revenue R million 15 853 12 110 12 197 17 667 15 690
Total cost R million 10 091 9 149 9 106 9 334 8 223
Operating profit R million 5 762 2 961 3 091 8 333 7 467
EBITDA R million 7 179 4 478 4 517 9 629 8 647
Headline earnings R million 4 373 2 430 2 494 6 356 5 532
Cash generated R million 1 090 2 110 1 436 3 605 1 180
Capital expenditure R million 1 169 901 1 646 2 058 2 709
Refer to Note 2 of the Annual Financial Statements for the Iron Ore segmental information.AFS
ARM FERROUS continued
52 INTEGRATED ANNUAL REPORT

SUMMARY OPERATIONAL AND FINANCIAL INDICATORS (100% BASIS)
MANGANESE DIVISION
Operations:
Nchwaning and Gloria mines (collectively Black Rock Mine), Cato Ridge Works, Machadodorp Ferrochrome and Ferromanganese Works and Sakura Ferroalloys
Ownership:
50% held through Assmang (Pty) Ltd.
Management:
Jointly managed by ARM and Assore through Assmang. ARM provides administration and technical services, while Assore performs the sales and marketing function as well as technical consulting services.
F2017 F2016 F2015 F2014 F2013
OPERATIONAL
Production volumes
Manganese ore 000t 3 069 2 934 3 087 3 358 3 199
Ferromanganese 000t 403 204 319 342 332
Sales volumes
Manganese ore 000t 2 974 3 090 2 736 2 708 2 856
Ferromanganese 000t 303 175 223 279 260
Unit cost changes – Mn Ore
On-mine production unit costs % 1 (6) 17 14 23
Unit cost of sales % 12 (5) 2 14 15
FINANCIAL
Manganese ore
Sales revenue R million 8 322 4 841 4 909 5 556 4 950
Total cost R million 4 971 4 140 3 843 3 962 3 545
Operating profit R million 3 351 701 1 066 1 594 1 405
EBITDA R million 3 759 1 056 1 328 1 883 1 722
Headline earnings R million 2 407 527 762 1 132 986
Cash generated R million 2 762 929 1 313 1 389 330
Capital expenditure R million 1 617 1 939 1 889 1 269 777
Ferromanganese
Sales revenue R million 1 897 1 810 2 219 2 730 2 486
Total cost R million 1 887 1 930 2 588 2 849 2 337
Operating profit R million 10 (120) (369) (119) 149
EBITDA R million 67 (3) 18 98 168
Headline (loss)/earnings R million (85) (132) (185) (74) 159
Cash generated R million 32 252 13 166 203
Capital expenditure R million 31 (11) 95 73 446
Refer to Note 2 of the Annual Financial Statements for the Manganese segmental information.AFS
53OPERATIONAL REVIEWS: ARM FERROUS

Francois Uys, Chief Executive
ARM COAL
* ARM Coal holds the following: – Access to Glencore Operations South Africa’s interest and entitlement in the Richards Bay Coal Terminal (RBCT); and – An export entitlement of 3.2 Mtpa in the Phase V expansion at the RBCT. ** Participating Coal Business (PCB) refers to the Impunzi and Tweefontein operations.
Glencore Operations South Africa
*
Participating Coal Business (PCB)**
Goedgevonden (GGV)
51%
20%
10%
70%
49%
49%
51%
100%Glencore Holdings
South Africa (Pty) Ltd
Legend Goedgevonden Mine PCB operations Undeveloped Resources
Paardekop
Trichardtsfontein
Boschmanspoort
ZonnenbloemWildfontein
HendrinaDelmas
BalfourSecunda
Standerton
Bethal
Amersfoort
Volksrust
Ermelo
Carolina
BelfastMiddelburg
Witbank
Ogies
MATLA
TUTUKA
KRIEL
KENDAL
ARNOTHENDRINA
DUVHA
KOMATI
MAJUBA
CAMDEN
54 INTEGRATED ANNUAL REPORT

THERMAL COAL
Cyclone
Spirals
Coarse
Small
Fine
PRODUCTION PROCESS
Opencastmining
Raw coal stockpile
Primary and secondary crushing
SIZING
CLEANING
Screens
DEWATERING
PRODUCTSTOCKPILE
KEY FEATURES FOR F2017
Average
realised
US Dollar export
prices increased by
51%.
Headline earnings of
R82 milliona significant turnaround
from the headline loss of R297 million reported
in F2016.
GGV Mine on-mine unit
costs per saleable tonne
increased by
35%.
MATERIAL MATTERS
Delivering financial returns to shareholders and other providers of capital
Change in global seaborne market dynamics which is leading to demand for lower quality coal from South Africa
Continuously improving operational performance
High unit production cost increases at GGV Mine
Safety-related stoppages
Maintaining our social licenceto operate
Regulatory uncertainty
Community unrest
55OPERATIONAL REVIEWS: ARM COAL
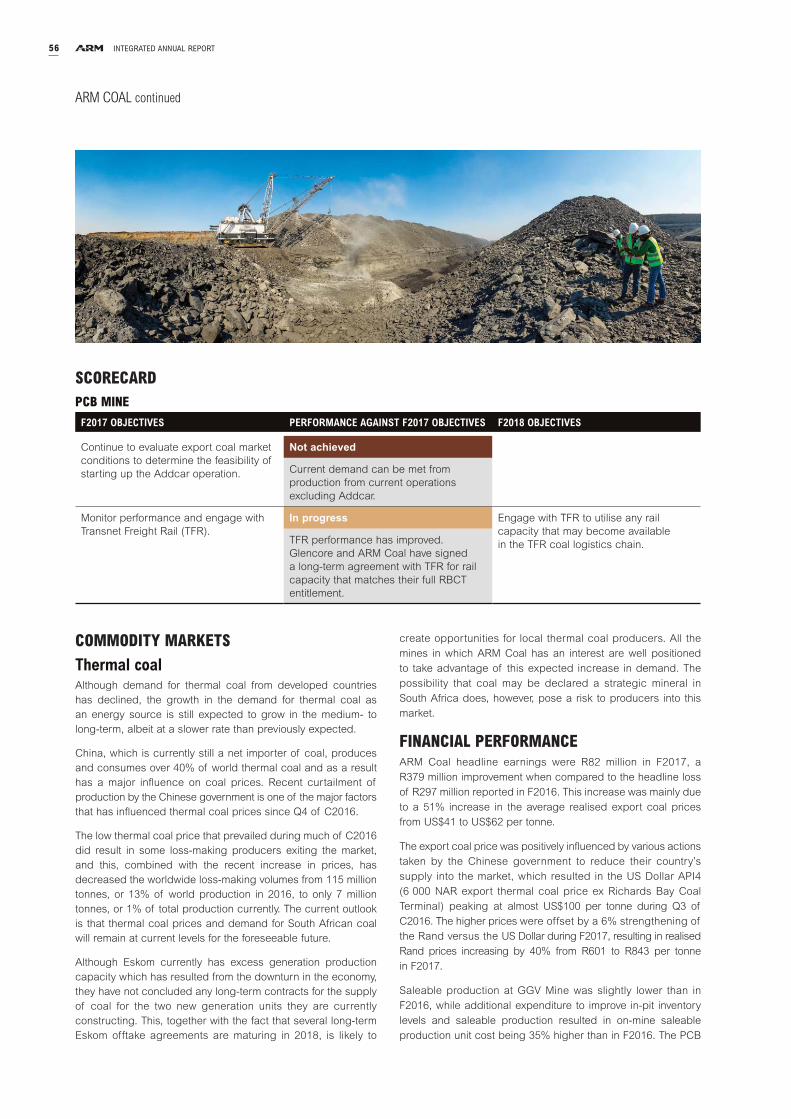
SCORECARD
PCB MINE
F2017 OBJECTIVES PERFORMANCE AGAINST F2017 OBJECTIVES F2018 OBJECTIVES
Continue to evaluate export coal market
conditions to determine the feasibility of
starting up the Addcar operation.
Not achieved
Current demand can be met from
production from current operations
excluding Addcar.
Monitor performance and engage with
Transnet Freight Rail (TFR).
In progress Engage with TFR to utilise any rail
capacity that may become available
in the TFR coal logistics chain.TFR performance has improved.
Glencore and ARM Coal have signed
a long-term agreement with TFR for rail
capacity that matches their full RBCT
entitlement.
ARM COAL continued
COMMODITY MARKETS
Thermal coalAlthough demand for thermal coal from developed countries
has declined, the growth in the demand for thermal coal as
an energy source is still expected to grow in the medium- to
long-term, albeit at a slower rate than previously expected.
China, which is currently still a net importer of coal, produces
and consumes over 40% of world thermal coal and as a result
has a major infl uence on coal prices. Recent curtailment of
production by the Chinese government is one of the major factors
that has infl uenced thermal coal prices since Q4 of C2016.
The low thermal coal price that prevailed during much of C2016
did result in some loss-making producers exiting the market,
and this, combined with the recent increase in prices, has
decreased the worldwide loss-making volumes from 115 million
tonnes, or 13% of world production in 2016, to only 7 million
tonnes, or 1% of total production currently. The current outlook
is that thermal coal prices and demand for South African coal
will remain at current levels for the foreseeable future.
Although Eskom currently has excess generation production
capacity which has resulted from the downturn in the economy,
they have not concluded any long-term contracts for the supply
of coal for the two new generation units they are currently
constructing. This, together with the fact that several long-term
Eskom offtake agreements are maturing in 2018, is likely to
create opportunities for local thermal coal producers. All the
mines in which ARM Coal has an interest are well positioned
to take advantage of this expected increase in demand. The
possibility that coal may be declared a strategic mineral in
South Africa does, however, pose a risk to producers into this
market.
FINANCIAL PERFORMANCEARM Coal headline earnings were R82 million in F2017, a
R379 million improvement when compared to the headline loss
of R297 million reported in F2016. This increase was mainly due
to a 51% increase in the average realised export coal prices
from US$41 to US$62 per tonne.
The export coal price was positively infl uenced by various actions
taken by the Chinese government to reduce their country’s
supply into the market, which resulted in the US Dollar API4
(6 000 NAR export thermal coal price ex Richards Bay Coal
Terminal) peaking at almost US$100 per tonne during Q3 of
C2016. The higher prices were offset by a 6% strengthening of
the Rand versus the US Dollar during F2017, resulting in realised
Rand prices increasing by 40% from R601 to R843 per tonne
in F2017.
Saleable production at GGV Mine was slightly lower than in
F2016, while additional expenditure to improve in-pit inventory
levels and saleable production resulted in on-mine saleable
production unit cost being 35% higher than in F2016. The PCB
56 INTEGRATED ANNUAL REPORT

operations performed well and achieved an increase of 13%
in saleable production, with only a 2% increase in on-mine
saleable production unit costs.
CONTINUOUSLY IMPROVING OPERATIONAL PERFORMANCE
All the ARM Coal operations are now in steady state and the
objective of changing to large scale low cost opencast mines
has been successfully achieved. Most of the production issues
experienced at GGV Mine during the current year have been
addressed and it is expected that ARM Coal will continue to
produce thermal coal at a unit cost per tonne that is amongst
the lowest in the world.
GGV MineLow opening in-pit stock levels at the start of F2017, as a result
of a delay in the issuance of the Amended Environmental
Management Program (EMP) by the DMR in F2016, continued
to impact negatively on production. The delay resulted in mining
of the lower strip ratio pits being delayed, adversely affecting
unit costs. This, together with excessive rain, unplanned break-
downs on major mining equipment during Q1 of C2017, and
community unrest (which caused the mine to lose almost fi ve
production days since October 2016), resulted in a decrease in
production.
Attributable operating profi t of R235 million was 15% higher
than F2016, mainly due to a 15% increase in export revenue.
A 42% increase in realised Rand prices contributed R206 million
to revenue which was partially offset by a 19% reduction in
export sales volumes. Run-of-mine coal buy-ins and contractor
cost (to assist with overburden stripping) resulted in on-mine
production unit cost being 35% higher than in F2016. Lower
distribution costs and an increase in stock levels reduced
the over-expenditure on total cost of sales to R68 million. The
attributable headline loss of R99 million was 14% higher than
the headline loss of R87 million realised in F2016. Finance
costs were 16% higher than in the previous year.
PCB OperationsThe mines comprising the PCB all performed well during F2017,
and achieved increases of 4% and 13% in run-of-mine and
saleable production, respectively. Although total on-mine costs
increased, the cost per saleable tonne produced increased by
only 2% from R273 to R278 per tonne. The Tweefontein Mine
continued to benefi t from feeding signifi cant volumes of run-of-
mine coal into its plant from the raw coal stockpile built during the
construction phase of the Tweefontein Optimisation Project.
The attributable cash operating profi t increased by 146% from
R397 million to R976 million as a result of a 31% increase in
revenue, offset by an 8% increase in cost of sales.
Export revenue was R480 million higher than in F2016 mainly as a
result of a 49% increase in US Dollar sales prices which was
partly offset by a 9% decrease in sales volumes and a 6%
strengthening of the Rand against the US Dollar. PCB recorded
a headline profi t of R181 million for F2017 compared to headline
loss of R210 million in F2016.
Sales volumes from F2013 to F2020 (100% basis)
20
15
10
5
F2013 F2014 F2015 F2016 F2020eF2017 F2018e F2019e
EXPORT THERMAL COAL SALES VOLUMES(Mtpa)
PCB GGV
8
7
6
5
F2013 F2014 F2015 F2016 F2020eF2017 F2018e F2019e
LOCAL THERMAL COAL SALES VOLUMES(Mtpa)
PCB GGV
4
3
2
1
57OPERATIONAL REVIEWS: ARM COAL
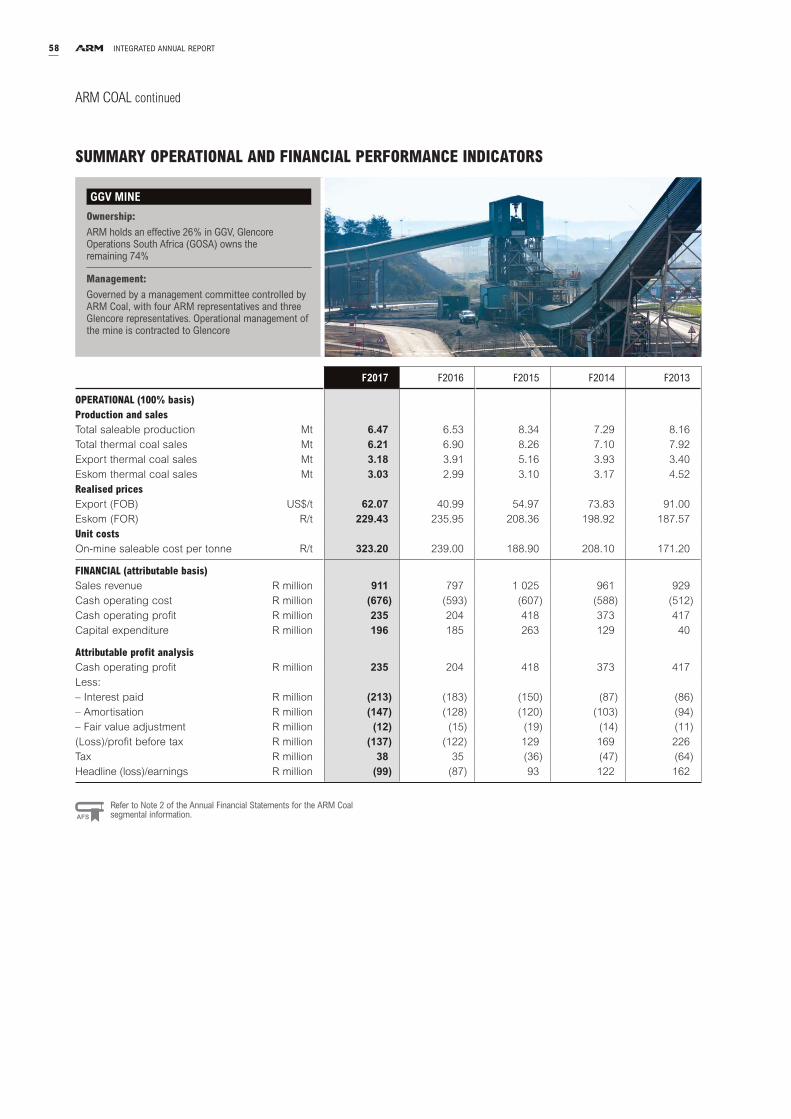
ARM COAL continued
SUMMARY OPERATIONAL AND FINANCIAL PERFORMANCE INDICATORS
GGV MINE
Ownership:
ARM holds an effective 26% in GGV, Glencore Operations South Africa (GOSA) owns the remaining 74%
Management:
Governed by a management committee controlled by ARM Coal, with four ARM representatives and three Glencore representatives. Operational management of the mine is contracted to Glencore
F2017 F2016 F2015 F2014 F2013
OPERATIONAL (100% basis)
Production and sales
Total saleable production Mt 6.47 6.53 8.34 7.29 8.16
Total thermal coal sales Mt 6.21 6.90 8.26 7.10 7.92
Export thermal coal sales Mt 3.18 3.91 5.16 3.93 3.40
Eskom thermal coal sales Mt 3.03 2.99 3.10 3.17 4.52
Realised prices
Export (FOB) US$/t 62.07 40.99 54.97 73.83 91.00
Eskom (FOR) R/t 229.43 235.95 208.36 198.92 187.57
Unit costs
On-mine saleable cost per tonne R/t 323.20 239.00 188.90 208.10 171.20
FINANCIAL (attributable basis)
Sales revenue R million 911 797 1 025 961 929
Cash operating cost R million (676) (593) (607) (588) (512)
Cash operating profit R million 235 204 418 373 417
Capital expenditure R million 196 185 263 129 40
Attributable profit analysis
Cash operating profit R million 235 204 418 373 417
Less:
– Interest paid R million (213) (183) (150) (87) (86)
– Amortisation R million (147) (128) (120) (103) (94)
– Fair value adjustment R million (12) (15) (19) (14) (11)
(Loss)/profit before tax R million (137) (122) 129 169 226
Tax R million 38 35 (36) (47) (64)
Headline (loss)/earnings R million (99) (87) 93 122 162
Refer to Note 2 of the Annual Financial Statements for the ARM Coal segmental information.AFS
58 INTEGRATED ANNUAL REPORT

SUMMARY OPERATIONAL AND FINANCIAL PERFORMANCE INDICATORS
PCB OPERATIONS
Ownership:
ARM holds an effective 20.2% in PCB, Glencore Operations South Africa (GOSA) owns remaining 79.8%
Management:
Governed by a supervisory committee with fi ve Glencore representatives and three ARM representatives. Operational management of the PCB mines is contracted to Glencore
F2017 F2016 F2015 F2014 F2013
OPERATIONAL (100% basis)
Production and sales
Total saleable production Mt 16.55 14.63 13.61 12.10 12.70
Impunzi Mt 7.20 6.53 6.31 5.30 5.7
South Stock Mt 0 0.41 1.90 1.90 1.6
Tweefontein Mt 9.35 7.69 5.40 4.90 5.4
Total thermal coal sales Mt 16.06 16.98 13.50 11.49 11.91
Export thermal coal sales Mt 13.42 14.76 10.73 8.90 9.81
Eskom thermal coal sales Mt 1.53 1.39 1.74 1.90 1.65
Other local thermal coal sales Mt 1.11 0.83 1.03 0.69 0.45
Realised prices
Export (FOB) US$/t 61.89 41.66 55.12 65.71 83.88
Eskom (FOR) R/t 242.43 223.13 214.64 202.81 157.70
Other local thermal coal sales R/t 757.73 384.24 361.99 330.93 262.24
Unit costs
On-mine saleable cost per tonne R/t 277.91 272.60 333.39 395.64 326.29
FINANCIAL (attributable basis)
Sales revenue R million 2 528 1 930 1 519 1 352 1 642
Cash operating cost R million (1 552) (1 533) (1 190) (1 220) (1 237)
Cash operating profit R million 976 397 329 132 405
Capital expenditure R million 246 214 557 765 936
Attributable profit analysis
Cash operating profit R million 976 397 329 132 405
Less:
– Interest paid R million (320) (308) (263) (189) (125)
– Amortisation R million (355) (321) (300) (265) (270)
– Fair value adjustment R million (50) (59) (25) (13) (29)
Profit/(loss) before tax R million 251 (291) (259) (335) (19)
Tax R million (70) 81 73 93 5
Headline earnings/(loss) attributable
to ARM R million 181 (210) (186) (242) (14)
59OPERATIONAL REVIEWS: ARM COAL
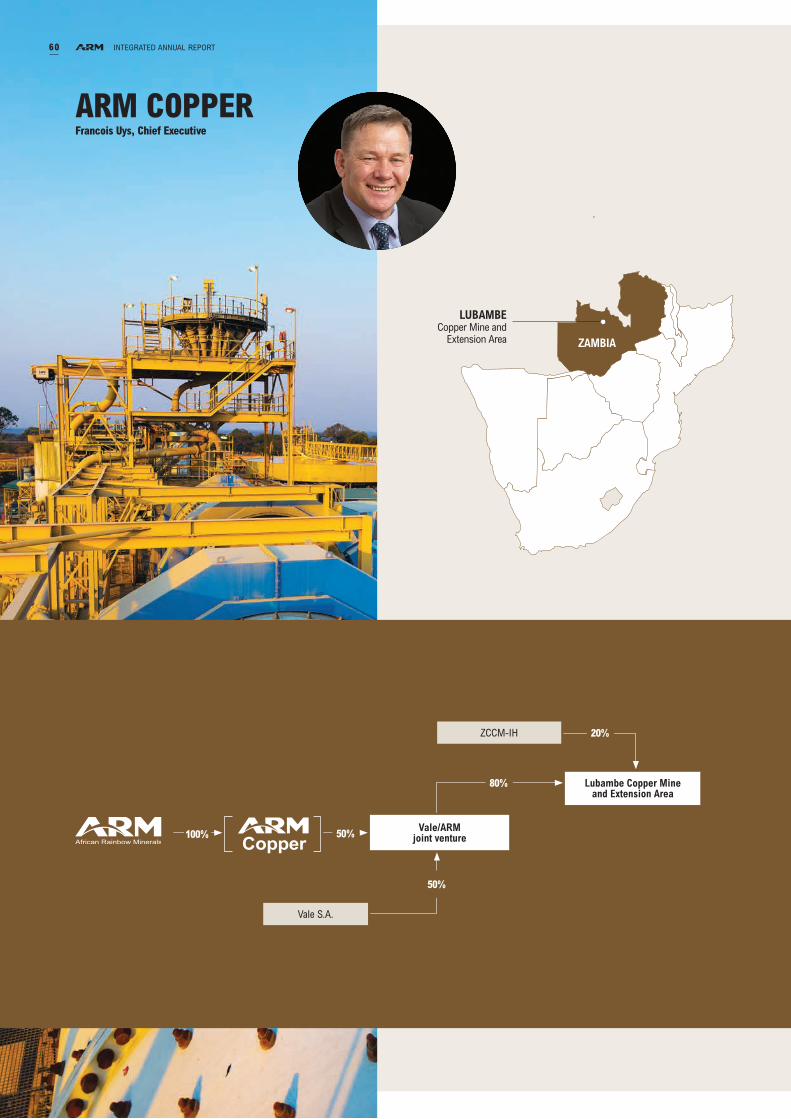
Francois Uys, Chief Executive
ARM COPPER
Lubambe Copper Mine and Extension Area
ZCCM-IH
Vale S.A.
Vale/ARM joint venture100%
50%
50%
80%
20%
LUBAMBECopper Mine and
Extension Area ZAMBIA
60 INTEGRATED ANNUAL REPORT

Fines
Anode copperConcentrate Matte
Tailings Slag
CATHODECOPPER
Ore extraction
Froth fl otation
Crushing & milling
Flash/Isa smelt smelting
Refi ning
Refi ning
Electro-refi ning
Blister copper
PRODUCTION PROCESSCOPPER
MATERIAL MATTERS
Delivering financial returns to shareholders and other providers of capital
Low copper prices
Minimising cash requirements from partners
Completion of Lubambe Mine disposal
Continuously improving operational performance
Lubambe Mine is positioned very high on the global unit copper cost curve
Managing water and pumping capacity at Lubambe Mine
KEY FEATURES FOR F2017
Headline loss reduced by
44% from R361 million to R203 million.
Production volumes reduced in line with decision
taken in F2016 to reduce tonnes milled to
80 000 tonnes per month.
The LTIFR decreased from 0.21 to
0.14 per 200 000 man-hours.Lubambe Mine has been
fatality-free since inception.
ARM and Vale
announced the
disposal of their 80% interest
in Lubambe Mine.
61OPERATIONAL REVIEWS: ARM COPPER

ARM COPPER continued
SCORECARDS
LUBAMBE MINE
F2017 OBJECTIVES PERFORMANCE AGAINST F2017 OBJECTIVES F2018 OBJECTIVES
Continue to operate the mine at 80 000
tonnes per month while focusing on
productivity gains and cost effi ciency.
Unit production costs will be optimised
by focusing on quality mining and cost
effi ciency.
This period is to be utilised to upgrade
the underground water infrastructure
to set up the mine for ramp up in more
favourable copper market conditions.
Achieved Complete the disposal of the Lubambe
Mine by fulfi lling the conditions
precedent to the disposal agreement.The mining rate was reduced to 80 000
tonnes per month.
The underground water pumping
capacity was increased from 6 million
litres per day to 20 million litres per day.
Continue with implementation of cost
and productivity effi ciency improvements
while focusing on quality mining.
Achieved
Productivity effi ciency improvements
resulted in unit production cost
increasing below infl ation. Despite
lower production volumes, C1 unit costs
increased by only 2%.
LUBAMBE EXTENSION AREA
F2017 OBJECTIVES PERFORMANCE AGAINST F2017 OBJECTIVES F2018 OBJECTIVES
Continue to hold off further drilling until
conditions in the copper market improve.
Achieved
No drilling was done in the Extension
Area in F2017.
62 INTEGRATED ANNUAL REPORT

COMMODITY MARKET REVIEW
Copper After lagging other commodities for most of the 2016 calendar
year, copper prices surged in November from approximately
US$4 700/t to US$6 283/t at the end of June 2017. The copper
price rally was initiated by supply disruptions at a number of
large mines in Peru, Chile, Australia and Indonesia and has been
supported by ongoing improvements in China’s underlying demand
for copper as the two largest components of demand (namely
grid and property demand) were stronger than expected for
most of 2016 and into 2017.
Further copper price support came from an announcement by
the Chinese government in July 2017 to ban imports of low
grade copper scrap, which requires dismantling and processing
before it can be used by smelters (i.e. category 7 copper scrap)
from 2019.
In the medium term the copper market is expected to remain
largely in balance while in the long-term, additional demand from
electric vehicles (mainly for batteries and charging infrastructure
development) is expected to be constructive for copper prices.
FINANCIAL PERFORMANCEThe F2017 ARM Copper headline loss reduced from R361 million
in F2016 to R203 million. The reduction was mainly due to improved
realised copper prices, offset by lower sales volumes.
The F2017 average realised copper price of US$5 366 per tonne
was 6% higher than F2016.
The decrease in production and sales volumes was in line with a
decision taken in F2016 to reduce tonnes milled to 80 000 tonnes
a month in order to minimise cash requirements and preserve the
Lubambe Mine’s reserves. Total tonnes milled for the period were
therefore 21% lower at 1 013 377 tonnes (F2016: 1 277 132 tonnes).
C1 unit cash costs increased by 2% during F2017 from US$2.41/lb
in F2016 to US$2.45/lb mainly due to the lower volumes.
ARM and Vale announced on 15 August 2017 that an agreement
for the disposal of their 80% interest in Lubambe Mine to EMR
Capital had been concluded for a purchase consideration of
US$97 million. The interest sold includes the equity holding in
Lubambe Mine as well as loans to Lubambe Mine.
CONTINUOUSLY IMPROVING OPERATIONAL PERFORMANCE
Lubambe MineF2017 was a year of consolidation for Lubambe Mine as the
mine operated at a reduced target production level of 80 000
tonnes ore per month. The mine made good progress in fi nding
sustainable solutions to the technical challenges that previously
prevented the mine from ramping up production to steady state
levels. An underground water infrastructure upgrade programme
was completed, which increased underground pumping capacity
from 6 million litres per day to 20 million litres per day.
This allowed Lubambe Mine to pump all its previously fl ooded
ramps dry and recommence with development of the ramps.
Through a redesign of Ramp 1 and Ramp 2, the mine also
found a sustainable solution to the weak geotechnical formation
located in the footwall of the South Limb in close proximity to the
ore body. Lubambe Mine commenced with development of the
updated ramps’ design, and has successfully demonstrated the
effectiveness of the revised ramp design. This is expected
to allow the mine to develop the South Limb resource, which
accounts for approximately 50% of the total reserves of the
mine in a cost effective manner.
During F2017, Lubambe Mine achieved a total development of
6 251 metres, which progressively increased over the course of
the year from a low of 413 metres in July 2016 to 938 metres
achieved in June 2017. The increased development profi le has
enabled the mine to increase its developed ore reserves over
the duration of the year.
Through continued focus on quality and method improvements in
long hole drilling and stoping, the mine has managed to decrease
stoping dilution from over 30% to 11% over the duration of the
year. This has allowed a gradual increase in head grade milled in
F2017 of 6% compared to F2016.
Various copper concentrator recovery optimisation initiatives
were implemented during the period. These initiatives have
resulted in a 4% improvement in copper recoveries in F2017,
compared to F2016.
During F2017, a labour restructuring programme was successfully
concluded, which aligned the total labour complement with the
revised lower production targets of 80 000 tonnes.
In order to preserve cash fl ow during F2017, capital expenditure
was restricted with the majority of expenditure relating to the life
of mine ramp development and upgrades in underground water
infrastructure.
ENSURING A SAFE, HEALTHY AND SKILLED WORKFORCE
At 30 June 2017, Lubambe Mine’s workforce comprised 1 062
full-time employees and 568 contractors (F2016: 1 225 full-time
employees and 430 contractors). The mine also employed 17
expatriates at its operations in Zambia (F2016: 16).
SafetyLubambe Mine achieved 3.8 million fatality-free shifts, remaining
fatality-free since the project started in 2010. The LTIFR per
200 000 man-hours decreased to 0.14 (F2016: 0.21). A compre-
hensive safety audit was undertaken by the Zambian Mine Safety
Department during 2017, with no major fi ndings or violations.
63OPERATIONAL REVIEWS: ARM COPPER

0.35
0.30
0.25
0.15
0.05
F2013 F2014 F2015 F2016 F2017
0.21
0.14
0.29
0.210.19
LTIFR(Per 200 000 man-hours)
0.20
0.10
— Lubambe Mine
HealthLubambe Mine is located in the Zambian Copper Belt where
malaria is endemic and poses a significant health risk. The
number of malaria cases reported at the mine decreased from
103 in F2016 to 67 in F2017 and the prevalence rate decreased
to 4.2%.
7.0
6.0
5.0
3.0
1.0
F2014 F2015 F2016 F2017
5.8
4.2
4.8
4.3
4.0
2.0
MALARIA PREVALENCE(% of workforce)
— Lubambe Mine
The mine’s malaria prevention programmes and awareness
activities include residual indoor spraying of houses in nearby
villages and buildings on site, treatment of stagnant water
ponds surrounding the mine, regular safety talks and awareness
campaigns regarding malaria prevention.
ENSURING RESPONSIBLE STEWARDSHIP OF NATURAL RESOURCES
EmissionsARM Copper produced an estimated 4 227 equivalent tonnes of
CO2 (tCO2e) Scope 1 and 2 emissions on an attributable basis in
F2017 (F2016: 4 954 tCO2e), which represents less than 1% of
the total ARM carbon footprint. Very low Scope 2 carbon emissions
are due to hydroelectric power generation in Zambia.
8 000
7 000
6 000
4 000
2 000
F2013 F2015 F2016 F2017
7 409
4 227
5 581
4 4355 000
3 000
SCOPE 1 AND 2 CARBON EMISSIONS(tCO2e)
1 000
F2014
4 954
— Lubambe Mine
Energy useThe mine consumed 104 316 MWh (F2016: 103 776 MWh) of
electricity. Zambia is still affected by the lower than average
rainfall over the last few seasons that has limited hydroelectric
power generation. Lubambe Mine had to make up the shortfall
with imported electricity, which is at a higher cost, adding
approximately US$100 000 a month to the cost base.
140 000
120 000
100 000
60 000
20 000
F2013 F2015 F2016 F2017
113 801
104 316
73 510
118 962
80 000
40 000
ELECTRICITY CONSUMPTION(MWh)
F2014
103 776
— Lubambe Mine
Water useWater ingress is a major challenge for the operation, affecting
mining operations directly and also impacting road quality,
resulting in poor production cycles and increasing trackless
vehicle maintenance costs and fuel consumption. Pumping of
water for dewatering purposes, represents a signifi cant proportion
of the electricity consumed by the operation. The mine abstracted
0.32 million m3 of water in F2017 (F2016: 0.85 million m3), while
dewatering abstraction amounted to 10 000 m3 per day, or roughly
3.65 million m3 for F2017.
ARM COPPER continued
64 INTEGRATED ANNUAL REPORT

1.4
1.2
1.0
0.6
F2013 F2014 F2015 F2016 F2017
0.9
1.1
0.9
1.2
0.2
0.4
0.8
0.3
WATER ABSTRACTED(million m3)
— Lubambe Mine
30 000
15 000
5 000
25 000
20 000
10 000
F2017F2016F2013 F2014 F2015 1H F2018e
ARM COPPER PRODUCTION VOLUMES FROM F2013 TO 1H F2018 (100% basis)(tonnes)
SUMMARY ARM COPPER SUSTAINABILITY STATISTICS (100% BASIS)
F2017 F2016 F2015 F2014 F2013
Employee indicators
Average number of employees and contractors* 1 586 1 781 2 169 2 373 2 332
– Permanent employees 1 158 1 353 1 158 1 122 821
– Contractors 411 412 956 1 218 1 477
– Expatriates 17 16 55 33 34
LTIFR per 200 000 man-hours 0.14 0.21 0.21 0.19 0.29
Environmental indicators
Scope 1 and 2 carbon emissions tCO2e 4 227 4 954 7 409 4 435 5 581
Total water withdrawn** million m3 0.3 0.9 1.2 1.1 0.9
Energy usage
– Electricity MWh 104 316 103 776 113 801 118 962 73 510
– Diesel 000 litres 3 628 4 347 6 550 3 749 4 902
Community investment indicator
– CSI R million 2 1 2 95 25
* The number of permanent employees and contractors are reported on an average for the year basis, consistent with the calculation of safety statistics.
** Includes municipal, surface and ground water.
MAINTAINING OUR SOCIAL LICENCE TO OPERATE
Lubambe Mine is committed to cultivating and maintaining a
harmonious relationship with its host communities. Initiatives include:
> The mine constructed the Konkola Health Post, which serves
as a clinic for the mine and more than 10 083 patients
from the Konkola community. A total of 320 children received
vaccinations from this clinic.
> Lubambe Mine donated materials to construct a 200-metre
stretch of storm water drainage at Chimfunshi Stream on
Chimfusi Road.
> Lubambe Mine donated farm inputs to 50 vulnerable but
committed farmers and two schools in the area, in order to
promote food security in the communities around the mine.
> Through the District Commissioner’s offi ce, Lubambe Mine
donated towards the hosting of the International Literacy Day.
The mine also donated K30 000 towards the purchase of a
utility vehicle that will be used by the community to transport
patients to hospital.
> Lubambe Mine supports girl child education by distributing
sanitary towels to girls attending three schools in communities
close to the mine – Konkola, Miyanda and Kasapa. Since the
programme started, school attendance by girls at the three
schools has improved.
In total, the Copper Division spent R2.4 million on CSI in F2017
(F2016: R1.3 million).
65OPERATIONAL REVIEWS: ARM COPPER

ARM COPPER continued
SUMMARY OPERATIONAL AND FINANCIAL INDICATORS (100% BASIS)
LUBAMBE MINE
Ownership: ARM and Vale S.A. each own 40% of Lubambe. ZCCM IH owns the remaining 20%. ARM and Vale have concluded an agreement for the disposal of their 80% interest in Lubambe Mine. Completion of the agreement is awaiting the fulfi llment of conditions precedent.
Management:
The mine is managed by the shareholders, via a Board of Directors.
F2017 F2016 F2015 F2014 F2013
OPERATIONAL
Waste development metres 2 717 2 691 4 590 9 415 11 434
Ore development m 3 567 4 636 4 401 9 365 9 396
Ore development t 227 072 249 361 229 319 484 280 596 783
Ore stoping t 777 733 971 957 1 369 881 954 999 403 178
Ore tonnes mined 000t 1 005 1 221 1 599 1 439 1 000
Tonnes milled 000t 1 013 1 277 1 650 1 558 1 047
Mill head grade % 2.13 2.01 1.93 1.95 1.92
Concentrator recovery % 84.6 81.5 81.1 77.6 71.4
Volumes
Copper concentrate produced t 44 680 51 391 61 902 57 009 40 331
Copper concentrate sold t 44 514 51 315 62 182 82 458 27 502
Contained copper produced t 18 299 20 973 25 839 23 791 14 871
Contained copper sold t 18 244 20 936 25 974 33 323 9 943
Price
Average realised copper price US$/lb 2.43 2.29 2.88 3.19 N/R
Unit costs
C1 cash cost per pound of
copper produced US$/lb 2.45 2.41 2.80 3.26 N/R
N/R refers to numbers not reported.
Refer to Note 2 of the Annual Financial Statements for the ARM Copper segmental information.AFS
66 INTEGRATED ANNUAL REPORT

GOLD: HARMONY
OVERVIEWF2017 F2016
Gold produced kg 33 836 33 655
000oz 1 088 1 082
Cash operating costs R/kg 436 917 392 026
US$/oz 1 000 841
Financial performance
Revenue R million 19 264 18 334
Cost of sales R million (19 639) (15 786)
Gross (loss)/profit R million (375) 2 548
Net profit for the year R million 362 949
Total headline earnings per share
cents per share 298 221
Total capital expenditure R million 3 963 2 434
Market performance
Average gold price
received R/kg 570 164 544 984
US$oz 1 304 1 169
Market capitalisation R billion 9.5 22.9
HARMONY GOLD MINING COMPANY LIMITED (HARMONY)Harmony operates and develops world-class gold assets in South
Africa and Papua New Guinea (PNG). It has nine underground
mines, one open pit operation and several surface sources in
South Africa. In PNG, Harmony has the 100% owned Hidden
Valley open-pit gold and silver mine and surrounding tenements.
Harmony has a 50% joint venture with Newcrest Mining Limited
in the Walf-Golpu exploration project. Harmony’s own (100%)
exploration portfolio focuses principally on highly prospective
areas in PNG. Harmony also has additional, 100%-owned, PNG
exploration areas. Harmony currently employs approximately
33 201 people (including contractors).
Harmony reported a net profi t of R362 million in F2017 compared
to a net profi t of R949 million in F2016. Headline earnings
amounted to 298 cents per share (F2016: 221 cents per share).
After declaring an interim dividend of 50 cents per share, a fi nal
dividend of 35 cents per share was declared by Harmony in
respect of the year ended 30 June 2017 – a 70% increase in the
total dividends declared year-on-year.
Harmony’s revenue increased by 5% to R19.3 billion mainly as
a result of year-on-year production remaining stable and the
inclusion of the realised gains on the Rand gold hedges of
R728 million as part of revenue. This inclusion resulted in the
average gold price received being R570 164/kg (US$1 304/oz),
compared with R544 984/kg (US$1 169/oz) in F2016, despite
the rand gold spot price being fl at year on year.
The hedging programmes realised gains of R1 747 million for
F2017. Harmony’s management continues to top up these
programmes as and when opportunities arise to lock in
attractive margins for the business.
Harmony’s total gold production increased by 181 kilograms
(0.5%) to 33 836 kilograms, compared to 33 655 kilograms in
F2016.
Cash operating cost increased by 11% or R1 430 million mainly
due to increases in labour costs, infl ationary increases in con-
sumables and contractors for the South African operations, as
well as the inclusion of 100% of Hidden Valley’s costs from
November 2016.
Overall, all-in sustaining costs increased by 10% to R516 687/kg
(US$1 182/oz), compared to R467 611/kg (US$1 003/oz) in
F2016*. Preventative maintenance was conducted at many of the
South African operations in order to improve asset management
and performance, which has resulted in a 36% reduction in
engineering stoppages during F2017 and will benefi t production
performance in the future.
* F2016 all-in sustaining cost restated to include capitalised stripping.
Harmony’s results for the year ended 30 June 2017 can be viewed on Harmony’s website at www.harmony.co.za.
67OPERATIONAL REVIEWS: GOLD: HARMONY


