Arteriolar Reactivity to Pressure Stimuli in Hamsters with Renal Hypertension D. LOWELL STACY, WILLIAM L. JOYNER, AND JOSEPH P. GILMORE SUMMARY The responses to alterations in extravascular pressure were studied in five orders of arterioles in the cheek pouch of normotensive and renal hypertensive hamsters. Renal hypertension was induced by bilateral compression of both kidneys using figure-of-eight ligatures. Ten to 16 days later, hamsters were anesthetized with pentobarbital (6.0 mg/100 g body weight) and a Plexiglas chamber was positioned in the cheek pouch. Chamber pressure, or extravascular pressure, was increased and decreased by ± 10, 20, and 40 mm Hg, and arteriolar diameters were monitored continuously. The responses at - 20 mm Hg and the slope of the linear portion of the chamber pressure-diameter curve (arteriolar gains) were compared between groups for each branching order of arteriole. Arteriolar responses at one chamber pressure and the arteriolar gains were enhanced in third and fourth order arterioles of the renal hypertensive group compared with the normotensive group, and the responses of these small arterioles were greater than those of larger arterioles in both groups. Control diameters of second and third order arterioles were significantly smaller in the renal hypertensive group, while the diameters after adenosine were not different. These results suggest that the enhanced responses of small arterioles in the renal hypertensive group were hot related to structural alterations but may be related to an increased reactivity of smooth muscles in these small arterioles to volume expansion, thus a pressure stimulus. (Hypertension 10: 82-92, 1987) KEY WORDS • renal hypertension • microcirculation • arteriolar diameter autoregulation • arteriolar tone • medial area • transmural pressure S TRUCTURAL and functional alterations of blood vessels are associated with human essen- tial,' renal, 2 and genetic 3 hypertension. The rel- ative contribution of arteriolar vasoconstriction, medi- al hypertrophy, and rarefaction to altered peripheral resistance associated with microvessels in spontaneous and renal hypertension varies according to the vascular bed studied and the progression of the hypertension. 2 3 Small arterioles contribute markedly to the local con- trol of blood flow/resistance in individual tissues be- cause of their intrinsic tone, enhanced reactivity to vasoactive agents, and reactivity to nerve stimula- tion. 4 " 8 The relative contribution of small arterioles to peripheral resistance in vascular beds has been demon- From the Department of Physiology and Biophysics, University of Nebraska College of Medicine, Omaha, Nebraska. Supported by National Heart, Lung, and Blood Institute Grants HL-25327 and HL-17902. Address for reprints: Dr. William L. Joyner, Department of Physiology and Biophysics, University of Nebraska Medical Cen- ter, 42nd Street and Dewey Avenue, Omaha, NE 68105-1065. Received December 8, 1986; accepted January 21, 1987. strated by the large pressure gradient across the micro- circulation, 8 especially with renal hypertension. 9 ' 10 In various animals with renal hypertension, an increased reactivity of small arterioles has been observed rou- tinely"" 14 ; also, in renal hypertension in the rat, sympa- thetic nerve activity was elevated. 1516 Thus, most studies have concentrated on the neural or humoral control of vascular tone without considering the role that autoregulation may play in elevating peripheral resistance in hypertension. Recently, Meininger et al., 17 using the cremaster muscle in the rat, demon- strated that autoregulation of small arterioles may con- tribute to the elevated resistance in the rat after acute renal artery stenosis. However, Alson et al. 18 found that autoregulation did not contribute to the elevated resistance of the perfused hindlimb in the spontaneous- ly hypertensive rat, as determined by the slope of the perfusion pressure-flow curves or the lumen diameters of small arterioles in the cremaster muscle, or both. Studies of autoregulation in microvessels have been conducted by lowering arteriolar pressure, 19 - 20 raising venous pressure, 2122 and altering extravascular pres- sure. 23 " 25 Altering extravascular pressure has the rela- 82 by guest on June 14, 2018 http://hyper.ahajournals.org/ Downloaded from
Transcript
Arteriolar Reactivity to Pressure Stimuli inHamsters with Renal Hypertension
D. LOWELL STACY, WILLIAM L. JOYNER, AND JOSEPH P. GILMORE
SUMMARY The responses to alterations in extravascular pressure were studied in five orders ofarterioles in the cheek pouch of normotensive and renal hypertensive hamsters. Renal hypertensionwas induced by bilateral compression of both kidneys using figure-of-eight ligatures. Ten to 16 dayslater, hamsters were anesthetized with pentobarbital (6.0 mg/100 g body weight) and a Plexiglaschamber was positioned in the cheek pouch. Chamber pressure, or extravascular pressure, wasincreased and decreased by ± 10, 20, and 40 mm Hg, and arteriolar diameters were monitoredcontinuously. The responses at - 20 mm Hg and the slope of the linear portion of the chamberpressure-diameter curve (arteriolar gains) were compared between groups for each branching orderof arteriole. Arteriolar responses at one chamber pressure and the arteriolar gains were enhanced inthird and fourth order arterioles of the renal hypertensive group compared with the normotensivegroup, and the responses of these small arterioles were greater than those of larger arterioles in bothgroups. Control diameters of second and third order arterioles were significantly smaller in the renalhypertensive group, while the diameters after adenosine were not different. These results suggest thatthe enhanced responses of small arterioles in the renal hypertensive group were hot related tostructural alterations but may be related to an increased reactivity of smooth muscles in these smallarterioles to volume expansion, thus a pressure stimulus. (Hypertension 10: 82-92, 1987)
KEY WORDS • renal hypertension • microcirculation • arteriolar diameterautoregulation • arteriolar tone • medial area • transmural pressure
STRUCTURAL and functional alterations ofblood vessels are associated with human essen-tial,' renal,2 and genetic3 hypertension. The rel-
ative contribution of arteriolar vasoconstriction, medi-al hypertrophy, and rarefaction to altered peripheralresistance associated with microvessels in spontaneousand renal hypertension varies according to the vascularbed studied and the progression of the hypertension.2 3
Small arterioles contribute markedly to the local con-trol of blood flow/resistance in individual tissues be-cause of their intrinsic tone, enhanced reactivity tovasoactive agents, and reactivity to nerve stimula-tion.4"8 The relative contribution of small arterioles toperipheral resistance in vascular beds has been demon-
From the Department of Physiology and Biophysics, Universityof Nebraska College of Medicine, Omaha, Nebraska.
Supported by National Heart, Lung, and Blood Institute GrantsHL-25327 and HL-17902.
Address for reprints: Dr. William L. Joyner, Department ofPhysiology and Biophysics, University of Nebraska Medical Cen-ter, 42nd Street and Dewey Avenue, Omaha, NE 68105-1065.
Received December 8, 1986; accepted January 21, 1987.
strated by the large pressure gradient across the micro-circulation,8 especially with renal hypertension.9'10 Invarious animals with renal hypertension, an increasedreactivity of small arterioles has been observed rou-tinely""14; also, in renal hypertension in the rat, sympa-thetic nerve activity was elevated.1516 Thus, moststudies have concentrated on the neural or humoralcontrol of vascular tone without considering the rolethat autoregulation may play in elevating peripheralresistance in hypertension. Recently, Meininger etal.,17 using the cremaster muscle in the rat, demon-strated that autoregulation of small arterioles may con-tribute to the elevated resistance in the rat after acuterenal artery stenosis. However, Alson et al.18 foundthat autoregulation did not contribute to the elevatedresistance of the perfused hindlimb in the spontaneous-ly hypertensive rat, as determined by the slope of theperfusion pressure-flow curves or the lumen diametersof small arterioles in the cremaster muscle, or both.
Studies of autoregulation in microvessels have beenconducted by lowering arteriolar pressure,19-20 raisingvenous pressure,2122 and altering extravascular pres-sure.23"25 Altering extravascular pressure has the rela-
82
by guest on June 14, 2018http://hyper.ahajournals.org/
ARTERIOLAR REACTIVITY AND RENAL HYPERTENSION/Sfacy et al. 83
tive advantage of selectively altering transmural pres-sure without markedly altering perfusion pressure.With the use of this technique, arterioles in the hamstercheek pouch,23 rat cerebral cortex,24 and bat wing23
demonstrated active arteriolar responses (i.e., the di-ameters of the vessels were altered in a manner appro-priate for regulation of blood flow with changes inextravascular pressure or transmural pressure). Thesearterioles constricted when transmural pressure wasincreased and dilated when it was decreased.
Recently, myogenic responses of isolated arteriolesand small arteries have been studied to determine theirvascular smooth muscle sensitivity.26'27 These isolatedvessels responded very weakly to changes in trans-mural pressure, possibly because of their relativelylarge size26 or poor vascular tone. The vascular tone ofarterioles has been shown to be dependent on bothdynamic and static transmural pressure28 and on flowin isolated vessels.29 In addition, the interstitial matrixsurrounding small vessels can influence smooth mus-cle mechanics.30 For these reasons, arteriolar re-sponses to pressure stimuli were studied in vivo withnormal flow, pulsatile pressure, vasoactive sub-stances, nutrients, and interstitial matrix. The aims ofthis study were to describe and compare the arteriolarreactivity of small blood vessels to alterations in trans-mural pressure and to compare vascular geometry andtone in relation to branching sequence in renal hyper-tensive (RHT) and normotensive (NT) hamsters.
Materials and MethodsInduction of Renal Hypertension
To induce renal hypertension (two-kidney, two fig-ure-8), female hamsters (SASCO, Omaha, NE, USA)weighing 140 to 180 g were anesthetized with pento-barbital (6.0 mg/100 g body weight intraperitoneally).Each kidney was exposed separately through a dorsalflank incision, and bilateral figure-of-eight ligatures(No. 2 silk) were applied to each kidney." Care wastaken to avoid damaging the renal pelvis and adrenalglands while maintaining compression of the renal pa-renchyma. The sham-operated group consisting ofweight-matched hamsters were handled in a similarmanner except the ligatures were not tied.
All hamsters were allowed to recover on a heatingpad and were then returned to hanging cages and givenaccess to food and water ad libitum. No renal surgeryor any other type of manipulation was performed onthe NT group. Systolic blood pressure was measured inhindlimbs by the plethysmographic method using apneumatic pulse transducer and sphygmomanometer.''On the day of the experiment, three systolic pressuremeasurements in each hindlimb were averaged and, ifthe mean value was at least 150 mm Hg, the hamsterwas considered a possible candidate for renal hyper-tension. Only when the mean arterial pressure aver-aged at least 120 mm Hg for the entire microvascularexperiment, as measured directly by cannulation of thefemoral artery, was the hamster classified as hyperten-sive and thus included in the analysis of the data.
Microvascular PreparationTo observe the vessels in the cheek pouch, a Plexi-
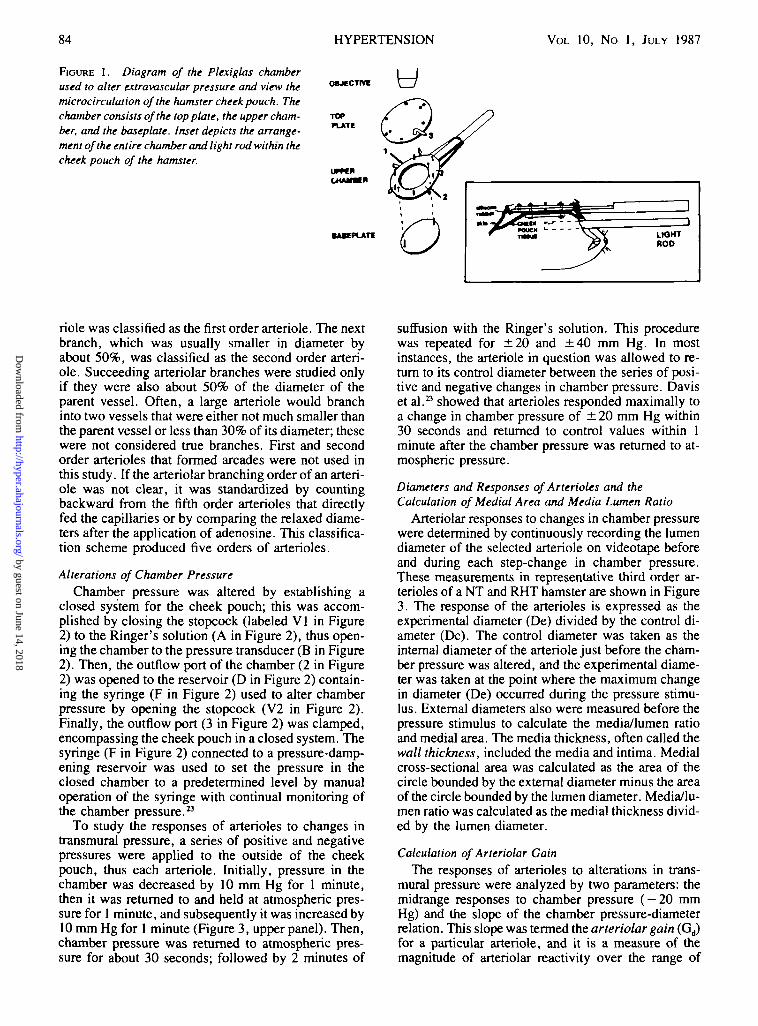
glas chamber was placed in the cheek pouch (Figure1). This was accomplished by positioning a baseplatethat was supported by a holder into the cheek pouch;then an incision was made in the skin over the base-plate, and the skin was retracted back around the base-plate, uncovering the cheek pouch membrane. Twosmall holes of about 1 mm in diameter were cut in thecheek pouch tissue to allow the screws of the baseplateto pass through the tissue. This procedure was donewith a dissecting microscope to minimize damage tothe microvessels, and the incisions were made farenough apart to avoid stretching the cheek pouch tis-sue. The upper chamber was placed on top of thebaseplate, and hex nuts were used to attach the screwsand baseplate to the upper chamber. To remove anyfurther tension on the cheek pouch, the skin from theincision made to expose the cheek pouch was support-ed by five bent 18-gauge hypodermic needles attachedto the upper chamber.
Once the cheek pouch tissue was exposed, it waskept moist continuously with Ringer's bicarbonate so-lution. The hamster then was moved to a heated micro-scope stage where the avascular layer of the cheekpouch was dissected carefully away while the Ringer'sbicarbonate solution bathed the cheek pouch. Thecomposition of the Ringer's bicarbonate solution(37°C, pH 7.4), which was gassed with 95% N2, 5%CO2, was (inM) NaCl2, 132; KC1, 4.7; CaCl2, 1.5;MgSO4, 1.2; and NaHCO3, 25. The top plate of theentire chamber was sealed to the upper chamber by sixhex nuts, and the degree of seal around the cheekpouch was varied by turning the two hex nuts thatbrought the baseplate into apposition with the cheekpouch and the silicon rubber layer of the upper cham-ber (see Figure 1, inset). When the velocity of redblood cells in the venules appeared to be reducedslightly, the screws were loosened until blood velocityin the venules resumed, thus sealing the chamber with-out any apparent effects on microvascular hemody-namics or vascular tone.
The preparation was transilluminated by a Zeiss100-W mercury lamp (Collins Microscope, OverlandPark, KS, USA) attached to a fiberoptic light rod thatwas placed into the cheek pouch under the baseplate(see Figure 1, inset). The optical system consisted of aZeiss microscope with a Leitz 10 x or 6.3 x objective(Rockleigh, NJ, USA) connected by a Zeiss Optivar(1.0-2.0 x ) magnifier and a Zeiss image rotator to aclosed-circuit television system containing a videotaperecorder (Collins Microscope), image shearing moni-tor (Instruments for Physiology and Medicine, SanDiego, CA, USA), and a video camera (Cohu, SanDiego, CA, USA).
Microvascular Observations and CalculationsClassification of Branching Orders for Arterioles
The chamber was positioned in the right cheekpouch so that the largest arteriole entered the area ofthe chamber at about the 11-o'clock position; this arte-
by guest on June 14, 2018http://hyper.ahajournals.org/
FIGURE 1. Diagram of the Plexiglas chamberused to alter extravascular pressure and view themicrocirculalion of the hamster cheek pouch. Thechamber consists of the top plate, the upper cham-ber, and the baseplate. Inset depicts the arrange-ment of the entire chamber and light rod within thecheek pouch of the hamster.
HYPERTENSION
y
VOL 10, No 1, JULY 1987
OBjeCTIW
TOPPLATE
CHMMH
•MEPLATI
riole was classified as the first order arteriole. The nextbranch, which was usually smaller in diameter byabout 50%, was classified as the second order arteri-ole. Succeeding arteriolar branches were studied onlyif they were also about 50% of the diameter of theparent vessel. Often, a large arteriole would branchinto two vessels that were either not much smaller thanthe parent vessel or less than 30% of its diameter; thesewere not considered true branches. First and secondorder arterioles that formed arcades were not used inthis study. If the arteriolar branching order of an arteri-ole was not clear, it was standardized by countingbackward from the fifth order arterioles that directlyfed the capillaries or by comparing the relaxed diame-ters after the application of adenosine. This classifica-tion scheme produced five orders of arterioles.
Alterations of Chamber PressureChamber pressure was altered by establishing a
closed system for the cheek pouch; this was accom-plished by closing the stopcock (labeled V1 in Figure2) to the Ringer's solution (A in Figure 2), thus open-ing the chamber to the pressure transducer (B in Figure2). Then, the outflow port of the chamber (2 in Figure2) was opened to the reservoir (D in Figure 2) contain-ing the syringe (F in Figure 2) used to alter chamberpressure by opening the stopcock (V2 in Figure 2).Finally, the outflow port (3 in Figure 2) was clamped,encompassing the cheek pouch in a closed system. Thesyringe (F in Figure 2) connected to a pressure-damp-ening reservoir was used to set the pressure in theclosed chamber to a predetermined level by manualoperation of the syringe with continual monitoring ofthe chamber pressure.23
To study the responses of arterioles to changes intransmural pressure, a series of positive and negativepressures were applied to the outside of the cheekpouch, thus each arteriole. Initially, pressure in thechamber was decreased by 10 mm Hg for 1 minute,then it was returned to and held at atmospheric pres-sure for 1 minute, and subsequently it was increased by10 mm Hg for 1 minute (Figure 3, upper panel). Then,chamber pressure was returned to atmospheric pres-sure for about 30 seconds; followed by 2 minutes of
suffusion with the Ringer's solution. This procedurewas repeated for ±20 and ± 4 0 mm Hg. In mostinstances, the arteriole in question was allowed to re-turn to its control diameter between the series of posi-tive and negative changes in chamber pressure. Daviset al.23 showed that arterioles responded maximally toa change in chamber pressure of ± 20 mm Hg within30 seconds and returned to control values within 1minute after the chamber pressure was returned to at-mospheric pressure.
Diameters and Responses of Arterioles and theCalculation of Medial Area and Media Lumen Ratio
Arteriolar responses to changes in chamber pressurewere determined by continuously recording the lumendiameter of the selected arteriole on videotape beforeand during each step-change in chamber pressure.These measurements in representative third order ar-terioles of a NT and RHT hamster are shown in Figure3. The response of the arterioles is expressed as theexperimental diameter (De) divided by the control di-ameter (Dc). The control diameter was taken as theinternal diameter of the arteriole just before the cham-ber pressure was altered, and the experimental diame-ter was taken at the point where the maximum changein diameter (De) occurred during the pressure stimu-lus. External diameters also were measured before thepressure stimulus to calculate the media/lumen ratioand medial area. The media thickness, often called thewall thickness, included the media and intima. Medialcross-sectional area was calculated as the area of thecircle bounded by the external diameter minus the areaof the circle bounded by the lumen diameter. Media/lu-men ratio was calculated as the medial thickness divid-ed by the lumen diameter.
Calculation of Arteriolar GainThe responses of arterioles to alterations in trans-
mural pressure were analyzed by two parameters: themidrange responses to chamber pressure ( — 20 mmHg) and the slope of the chamber pressure-diameterrelation. This slope was termed the arteriolar gain (Gd)for a particular arteriole, and it is a measure of themagnitude of arteriolar reactivity over the range of
by guest on June 14, 2018http://hyper.ahajournals.org/
ARTERIOLAR REACTIVITY AND RENAL HYPERTENSION/Sracy et al. 85
FIGURE 2. Schematic of the system used to alterchamber pressure and provide the cheek pouch ofthe hamster with the suffusion solution: Reservoirof Ringer's bicarbonate (A); pressure transducerused to measure chamber pressure (B); Plexiglaschamber and holder (C); reservoir filled withRinger's bicarbonate and some air to dampen thechanges in extravascular pressure (D); beakerused to collect the suffusion solution outflow (E);glass syringe used to alter chamber pressure (F);valve used to stop the suffusion solution flow (VI);valve used to open the chamber to the reservoirand glass syringe (V2); inflow port (1); port usedto alter chamber pressure (2); outflow port (3).
FIGURE 3. Representative record illustrating the measure-ment of the diameter (D) in a third order arteriole from anormotensive (NT) and a renal hypertensive (RHT) hamsterduring alterations in chamber pressure (Pc). The black barrepresents the time that the suffusion solution was open tothe chamber. Mean arterial pressure (MAP) was recordedcontinuously.
alterations in transmural pressure, where the subscriptd denotes that gain refers to the control of lumendiameter.
To illustrate how arteriolar gain was calculated, theresponse of the same third order arteriole in a NT andRHT hamster shown in Figure 3 is shown in Figure 4.The chamber pressure-diameter curves were linear, orthe responses reached a plateau, thus the curves weresigmoid-shaped. For those curves that were sigmoid-shaped, second order polynomial regression analysisof each half of the curve provided the best fit of thedata points from a chamber pressure of 0 to +40 mmHg or from 0 to —40 mm Hg. This analysis was usedto find the chamber pressure where the maximum re-sponse occurred. To determine the point on the curvewhere the slope is zero, the first derivative of the
vDe "»
•» 0 -*0 -40
CHAMMB PM88URE •—n,,
FIOURE 4. Calculation of arteriolar gain (Gj)from the linearportion of the relative diameter (DelDc)-chamber pressure re-lation in the same third order arteriole from the normotensive(NT) and renal hypertensive (RHT) group. DelDc = experimen-tal diameter!control diameter.
polynomial equation was found and set equal to zero.The data points within these maximum responses de-scribed the linear portion of the curve, and the experi-ment points encompassed by these maxima were usedfor linear regression analysis. For example, in the thirdorder arteriole of the NT group (see Figure 4), a secondorder polynomial regression of the responses from 0 to+ 40 mm Hg chamber pressure produced no maximumresponse, whereas the responses from 0 to - 4 0 mmHg produced a minimum response at - 3 3 mm Hg.Therefore, the responses at +40, +20 , + 10, - 10,— 20 mm Hg, and the control value were used for the
by guest on June 14, 2018http://hyper.ahajournals.org/
linear regression; the resulting slope was 0.0086.Then, this slope was multiplied by 100 to depict thegain (0.86). The units for this arteriolar gain (Gd) arethe percentage of change in diameter per millimeter ofmercury and are the same units as those gains calculat-ed from studies of isolated vessels,26 except the sign isthe opposite. For the third order arteriole in the RHThamster, a maximum point was found at 34 mm Hgand a minimum at —48 mm Hg (see Figure 4). Thus,all the data points except the one at 40 mm Hg wereused for the linear regression. This resultant slope (Gd)was 1.6. Therefore, the larger the value for the arterio-lar gain, the larger the response. Also, if chamberpressure is decreased (increasing transmural pressure)and the arteriole constricts, or if the chamber pressureis increased (decreasing transmural pressure) and thearteriole dilates, the value is positive.
Maximal Dilation of Arterioles in Response to AdenosineTo test vascular tone and to compare the vasodilated
diameters between NT and RHT groups for a givenarteriolar order, several drops of adenosine (10~3 M)were applied topically to cheek pouch arterioles. Sincethe volume of the chamber was about 1.0 ml, the finalconcentration of adenosine was 10"4 M. Maximal dila-tion of arterioles in the cheek pouch was produced withthis dose of adenosine with no effect on blood pressuremeasured in the femoral artery. Vessels with good toneshowed their greatest dilation after about 30 seconds:large arterioles dilated 20 to 30%, and small arteriolesdilated 60 to 80%. Those hamsters with poor arteriolartone, as indicated by a maximum dilation of less than10% for large arterioles (first and second orders) orless than 20% for small arterioles (third, fourth, andfifth orders), were not used in the analysis of theresults.
Experimental ProtocolOn the day of the microvascular experiment, 10 to
16 days after operation, hamsters in each group, NT,sham-operated, and RHT, were anesthetized with pen-tobarbital (6.0 mg/100 g i.p.). Supplemental doses(1.0 mg/100 g i.p.) were given as needed. Systolicblood pressure was measured using the indirect tech-nique," a catheter (PE-205) was placed in the tracheafor ventilation, and a second catheter (PE-10) wasplaced in the femoral artery for direct measurement ofarterial blood pressure. The signal from the transducerconnected to the arterial catheter was averaged elec-tronically on a Grass 79B polygraph (Quincy, MA,USA), while the blood pressure waveform was ob-served on an oscilloscope to ensure a high fidelityrecording.
Arterioles often were dilated after operation; thus,30 minutes was required before beginning the micro-vascular experiments. One criterion for continuing theexperiment was that small arterioles (third and fourthorders) regained their vascular tone, as indicated byconstricting to about 50% of their dilated state. Fur-thermore, preparations showing poor red blood cellvelocity in any of the microvessels, venous stasis, pe-techiae, or a fall in blood pressure were not used.
Once these criteria were satisfied, an arteriole to bestudied was selected randomly and the internal andexternal diameters were measured. A series of alter-ations in chamber pressure were applied, as previouslydescribed. Usually, only one arteriole from eachbranching order in a given hamster was studied; how-ever, not all of the five orders were used in everypreparation because the optical resolution of the inter-nal diameter was not adequate. In some hamsters,more than one arteriole of a particular order was stud-ied, and in these instances the measurements wereaveraged. At the end of the experiment, adenosine wasapplied topically to the cheek pouch to measure thevasodilated diameters and to test the vascular tone de-fined as the percentage of increase in diameter.
Mean arterial blood pressure was sampled every 15to 20 minutes during the entire experiment and wasaveraged to give the mean blood pressure for that ham-ster. The length of the experiment, including the prep-aration of the hamster and microvascular observations,was usually 2 to 3 hours.
Plasma Volume, Blood Volume, and HematocritIn another series of hamsters, plasma volumes were
measured by an indicator dilution method usingfluorescein isothiocyanate dextran (FITC dextran 150)with a mean molecular weight of 150,000. The fem-oral artery and vein were cannulated with PE-10 tub-ing, and the trachea was cannulated with PE-205 tub-ing. Then, 90 fi\ of a 5% solution of FITC dextran wasinjected into the femoral vein with a Hamilton syringe,and blood samples were taken 2 to 3 minutes and 8 to12 minutes later from the arterial catheter. After 4 to 5drops of blood were cleared from the arterial catheter,two microhematocrit tubes were filled with arterialblood. The blood samples were centrifuged for 3 min-utes, and the hematocrit was measured. The tube wasscored and broken at the red blood cell/plasma inter-phase, then various dilutions of the plasma were made(1/1000, 1/10,000, and 1/100,000). Fluorescein inten-sity was determined in an Aminco Bowman spectro-photofluorometer (American Instrument, SilverSprings, MD, USA); with an excitation wavelength of490 nm and emission wavelength of 510 nm. Serialdilutions of 5% FITC 150 dextran solutions were usedas standards, and linear regressions were performed onthe concentration of the standard solutions versus thepercentage of transmission. These regressions werelinear over the range of 5 to 400 ng/ml of FTTC dextran150, and the plasma samples were diluted to fall withinthis range.
Plasma volume was calculated based on the quantityof FITC dextran 150 injected divided by its final plas-ma concentration. This procedure assumes the FTTCdextran was uniformly distributed throughout theblood and remained in the intravascular space. Pre-vious studies have shown that the FITC dextran mole-cule is stable and that 90% of FITC dextran 70 remainsin the circulation 30 minutes after intravenous infusioninto rabbits.31 Blank samples also were measured todetermine the background level of transmission, and itwas subtracted from the 5% FITC dextran transmission
by guest on June 14, 2018http://hyper.ahajournals.org/
ARTERIOLAR REACTIVITY AND RENAL HYPERTENSION/Sfacy et al. 87
to derive the standard curves. Blood volume was cal-culated as the plasma volume x 100/(100-hemato-crit).
Statistical AnalysisComparisons of arteriolar responses at - 20 mm Hg
and the arteriolar gains were made between the NT andRHT groups by unpaired t tests. The arteriolar gains ofthe five branching orders were compared within theNT and RHT hamsters by analysis of variance and theNewman-Keuls multiple-range test, t tests also wereused to compare vascular dimensions and plasma andblood volumes between the NT and RHT groups. Alltests were considered significant at the 0.05 level.
ResultsBody Weight and Arterial Blood Pressure
In the eight RHT hamsters, arterial blood pressuremeasured either directly or indirectly was elevated sig-nificantly as compared with the 15 NT hamsters (Table1). These measurements were completed 10 to 16 daysafter the induction of renal hypertension. Since thearterial blood pressures were not significantly differentbetween the hamsters in the sham-operated group(n = 2) and the NT group (n = 13), all of the data werepooled. Hamsters in the RHT group lost weight (seeTable 1) during the interval of this study, while thesham-operated hamsters maintained their weight.
Arteriolar ResponsesThe responses of a representative arteriole, third
order, in a NT and a RHT hamster to a stimulus of±10, ±20, and ±40 mm Hg change in chamberpressure are shown in Figure 3. When the chamberpressure or extravascular pressure was reduced, trans-mural pressure (intravascular - extravascular pres-sure) was increased, and when chamber pressure wasincreased, transmural pressure was decreased. In boththe NT and RHT hamsters, when chamber pressurewas reduced, the diameter of these arterioles decreasedrapidly and the maximum responses were reachedwithin 30 seconds. The arterioles remained constrictedduring the duration of the stimulus (60 seconds). Whenchamber pressure was returned to atmospheric pres-sure, the diameter of the vessels returned to the controlvalues. The opposite response was observed whenchamber pressure was increased (i.e., the arteriolesdilated). As the magnitude of the change in chamberpressure was increased, the magnitude of the vascularresponse increased. The change in the diameter of the
arteriole in the RHT hamsters to each step-change inchamber pressure also appeared to be greater than thatobserved in the arteriole from the NT hamster. Theresponse (De/Dc) of these same arterioles (third order)in the NT and RHT hamsters in relation to each changein chamber pressure is shown in Figure 4. With the useof the analysis described previously for these two arte-rioles, a gain of 0.8 and 1.6 was determined for the NTand RHT hamsters, respectively.
In some experiments, nitroprusside (10~4 M) wasadded to the suffusion solution and the response of thearterioles to changes in chamber pressure was testedagain. The response was reversed completely in allarterioles tested: all arterioles dilated in response to adecrease in chamber pressure, and a decrease in diame-ter was observed with an increase in chamber pressure.Thus, they responded passively.
The arteriolar responses (De/Dc) at each chamberpressure are shown for the five orders of arterioles inthe NT and RHT groups in Figure 5. All responses aredepicted as means with their standard error. The re-sponses were graded with respect to chamber pressure,and they were essentially equal for positive and nega-tive chamber pressures. Because the responses reacheda plateau in third, fourth, and fifth order arterioles atabout ±40 mm Hg chamber pressure, comparisons ofthe responses at one point (— 20 mm Hg) were used aswell as the calculation of the regulatory gain (G^) tounmask the relation of arteriolar reactivity in the NTand RHT hamsters.
In comparing the arteriolar responses at a constantchamber pressure ( - 20 mm Hg) for the NT versus theRHT hamsters, the responses of third and fourth orderarterioles were significantly elevated in the RHT ham-sters (Table 2). These same observations were con-firmed when the data for each arteriole was expressedand compared as arteriolar gains (Figure 6). The arte-riolar gains of the third and fourth order arterioles weresignificantly greater in the RHT hamsters as comparedwith the NT hamsters. The arteriolar gains within theNT hamsters were greater for the fifth order arterioles,whereas in the RHT hamsters, the third, fourth, andfifth order arterioles were more reactive than either thefirst or the second order arterioles.
Vascular Dimensions and ToneMorphometric characterization and vascular tone
for all orders of arterioles in each group of hamsters areshown in Table 3. The control lumen diameters (Dc) ofsecond and third order arterioles in the RHT hamsterswere reduced significantly as compared with the NT
TABLE 1. Arterial Blood Pressure and Body Weighl in Normotensive and Renal Hypertensive Hamsters
Group
Normotensive (n
Hypertensive (n= 15)
= 8)
Indirect bloodpressure (mm Hg)
101 ±3
160 + 3*
Direct
S
120±8
165 + 5*
blood pressure
D
80±8
120±4*
(mm Hg)
M
94 + 5
135±4*
Body weight
156+10
13O±3*
(8)
Values are means ± SEM. Indirect measurement of systolic blood pressure was done using the plethysmographictechnique. S = systolic; D = diastolic; M = mean.
*p<0.05, compared with values in normotensive hamsters.
by guest on June 14, 2018http://hyper.ahajournals.org/
FIGURE 5. Arteriolar responses (experimentaldiameter divided by control diameter; De/Dc) ateach chamber pressure for five orders of arte-rioles in the normotensive (NT) and renal hyper-tensive (RHT) groups. Values are means ±SEM.
hamsters. However, the vasodilated (10~4 M adeno-sine) diameters (Dv) were the same in both groups.The vascular tone, as shown by their dilation after theapplication of adenosine of first, second, and thirdorder arterioles, was elevated significantly in the RHTgroup. The media/lumen ratios were significantlygreater in second and fourth order arterioles of theRHT as compared with the NT group, while there wereno differences in the medial areas of any arteriolesbetween the NT and RHT groups.
Plasma Volume, Blood Volume, and HematocritNo difference was found in the calculated plasma
volumes taken at an average of 3.4 minutes (6.2 ml)and 9.5 minutes (6.0 ml) after injection in the normo-tensive hamsters. Thus, these values were average foreach hamster. Plasma volume and blood volumes werehigher in the RHT than in the NT hamsters (Table 4).The increase in plasma volume found in the RHT
group resulted in a hematocrit of 43%, and the mea-sured value was 42%; therefore, the significant de-crease in hematocrit was due to an increase in plasmavolume and not to a decline in packed cell volume.
DiscussionArteriolar Reactivity
These studies demonstrated that in the cheek pouchof the hamster small arterioles are more responsive tochanges in transmural pressure than large arterioles,and this responsiveness is enhanced with renal hyper-tension. It has been shown that small arterioles of therat cremaster muscle are more responsive to reductionsin arterial pressure" and that the initial vasoconstric-tion in the rat cremaster with acute renal hypertensionis due partially to autoregulation.17 Until now, howev-er, the responsiveness of arterioles in renal hyperten-sion to graded pressure stimuli has not, to our knowl-
TABLE 2. Responses ofArterioles in Normotensive and Renal Hypertensive Hamsters at a Constant Chamber Pressure(-20 mmHg)
Group
Nonnotensive
Hypertensive
0
0
1A
.92 ±0(10)
.96±0(6)
.01
.01
2A
0.92 + 0(9)
0.93±0(7)
Response
.02 0
.01 0
of arterioles
3A
.82±O.O2(11)
.75 ±0.01*(8)
(De/Dc)
4A
0.88 ±0.04(10)
0.72 ±0.04*(6)
5A
0.75 ±0.03(7)
0.66±0.05(4)
Values are means ± SEM. The number of arterioles is shown in parentheses. De/Dc = experimental diameter/controldiameter. 1A-5A = first through fifth order arterioles.
*p<0.05, compared with values in normotensive hamsters.
by guest on June 14, 2018http://hyper.ahajournals.org/
ARTERIOLAR REACTIVITY AND RENAL HYPERTENSION/Stacy et al. 89
FIGURE 6. Arteriolar gain (Gj) for five orders of arterioles inthe normotensive (NT) and renal hypertensive (RHT) groups.All values are means ± SEM. Asterisk indicates significantdifference (p<0.05) compared with values for the NT group.
edge, been studied in vivo. Thus, arteriolar reactivityto changes in transmural pressure is augmented insmall arterioles in renovascular hypertension.
Myogenic responses may be elicited by changes inwall tension or stress as a result of changes in trans-mural pressure, and in experiments where perfusionpressure is altered, metabolic mechanisms also con-tribute to the autoregulatory response.20 Thus, the tech-nique employed in the present study was designed tominimize the metabolic component of the autoregula-tory response (i.e., the use of the chamber to alterextravascular pressure). However, even though bloodflow was not measured in this study, it is related direct-ly to diameter to the fourth power of the radius inindividual arterioles and to the third power in a vascu-lar network32; therefore, any significantly different re-sponses of the diameters of the arterioles to changes intransmural pressure should result in greater changes inarteriolar flow. In addition, a given change in extravas-cular pressure stimulus is relatively less for an arteriolein the hypertensive as compared with the NT hamstersince intravascular pressures have been reported to behigher in hamsters with two-kidney, two figure-8 hy-pertension.9 Thus, the greater reactivity of these smallarterioles in renal hypertension could be magnified
TABLE 3. Vascular Dimensions and Tone of Arterioles in Normotensive and Renal Hypertensive Hamsters
Group
Normotensive1A
2A
3A
4A
5A
Hypertensive1A
2A
3A
4A
5A
Dc(Mm)
89 ±6(10)
49±5(9)
23 ±2(11)
11±1(10)
7±1(7)
82±3(6)
38 ±2*(7)
19±1*(8)
11±1(7)
7±1(4)
Dv(A"n)
108±7(7)
58±6(6)
31 ±2(8)
16±1(7)
11±1(5)
106 + 3(6)
60+1(7)
29±2(8)
17±2(7)
13 + 2(4)
AD(%)
19±3(7)
28±5(6)
41 ±11(8)
53 ±10(7)
56 ±14(5)
28 ±3*(6)
62 ±9*(7)
60±6*(8)
55 ±7(7)
79 ±25(4)
M/L
0.01 ±0.01(7)
O.13±O.O3(8)
0.22 + 0.03(10)
0.30 + 0.02(9)
0.36±0.06(7)
0.12 + 0.01(6)
0.19 ±0.03*(7)
0.27 ±0.04(8)
0.38 ±0.03*(7)
0.39 + 0.02(4)
MA(jim)
2863 ± 233(7)
1093 ±190(8)
398 ±47(10)
157 ±22(9)
79±16(7)
2661 ±240(6)
993±141(7)
340±15(8)
203 ±22(7)
90±14(4)
Values are means ± SEM. The number of arterioles is shown in parentheses.Dc = control diameter, Dv = relaxed diameter after adenosine (10~4 M); AD = increase
application of 10~4 M adenosine; M/L = media/lumen ratio; MA = medial area; 1A-5A =arterioles.
*p<0.05, compared with values in normotensive hamsters.
in diameter after topicalfirst through fifth order
by guest on June 14, 2018http://hyper.ahajournals.org/
TABLE 4. Plasma Volume, Blood Volume, and Hematocrit inNormotensive and Renal Hypertensive Hamsters
Variable
Body weight (g)
Plasma volume (ml/100 g)
Blood volume (ml/100 g)
Hematocrit (%)
Normotensive(n = 5)
122±8
4.4±0.2
8.3±0.4
46.6±0.8
Hypertensived = 4)
112±5
6.3±0.6*
10.8±0.8*
42.0±1.6*
Values are means ± SEM.*p<0.05, compared with values in normotensive hamsters.
further if the data were analyzed in terms of transmuralpressure and flow in the small arterioles. Therefore, inrenal hypertension, myogenic autoregulation of smallarterioles may contribute to the development of theelevated blood pressure.
An increase in the reactivity of these small arteriolesmay be due to changes in the sensitivity of these arteri-oles to vasoactive stimulus, or there may be a mechani-cal explanation. Various studies""14 have shown thatthe sensitivity of small arterioles to vasoconstrictoragents (e.g., norepinephrine and angiotensin) is aug-mented in renal hypertension, but there is no evidencethat alterations in arteriolar reactivity are related toarteriolar mechanics (radius-stress relation) in hyper-tension. However, arterioles have been shown to havean optimal wall stress in response to norepinephrine,and small arterioles operate at that point in normoten-sive states, whereas large arteries operate past thispoint.6 This finding may explain, in part, the differen-tial reactivity to vasoactive stimuli in segmental arteri-oles in normotensive as well as in hypertensive states.For example, in the RHT group, the third and fourthorder arterioles may be operating closer to this point ofoptimum wall stress than are those same arterioles inthe NT group; thus, upon activation, the result is anenhanced reactivity. With hypertension, the increasein arteriolar pressure, if not occurring with an equiv-alent decrease in radius/wall thickness, will increasewall stress and reactivity; thus causing a shift towardthe point of optimal stress. This sequence assumes thatthe arteriole of a NT hamster operates on the ascendinglimb of the length-stress curve and that with hyperten-sion the optimum point of wall stress is not exceeded.In addition, the arterioles of both the NT and hyperten-sive groups must exhibit good vascular tone, sincemaximal vasodilation with adenosine in the cheekpouch has been shown to nearly double wall tension inthird and fourth order arterioles, with little change intension of first and second order arterioles.33 In thepresent experiment, the resting diameters of the largerarterioles was decreased in the RHT hamsters while thevasodilator tone was increased. Thus, the optimumpoint of stress may not have been altered in thesearterioles; therefore, the altered reactivity of the thirdorder arteriole may be due to a change in the sensitivityof the vascular smooth muscle to vasoactive stimuli.However, this scenario is not consistent for the resultsobtained in the small arteriole (fourth order), that is, no
change in either the resting diameter or vasodilatortone, but an increased arteriolar gain to changes intransmural pressure. Therefore, there may be a shift ofthe optimal stress for the arterioles toward the smallervessels and thus, an increased mechanical advantage.
In most micro vascular studies of renal hypertension,either some or most of the arteriolar orders are con-stricted.2' *-"••M Autoregulatory responses may contrib-ute to the vasoconstriction of arterioles seen in animalswith renal hypertension, since these responses are en-hanced with developing renal hypertension and existafter acute renal artery stenosis." Third order arteriolesof the RHT group were constricted and demonstratedgreater responses to chamber pressure than did those ofthe NT group. However, fourth order arterioles of theRHT group were not constricted, although they exhib-ited enhanced responses to pressure. Constriction ofsecond and third order arterioles may have normalizedmicrovascular pressure or wall stress, or both, infourth order arterioles, thus removing the stimulus forautoregulation.
Metabolic or flow-dependent mechanisms couldalso contribute to changes in vascular tone and controldiameters in renal hypertension. Increasing chamberpressure may have also increased arteriolar pressureand thus decreased perfusion pressure. Davis et al.23
found that increases in chamber pressure result in lessof a decrease in transmural pressure and diminishedresponses compared with equivalent decreases inchamber pressure. This response may be due to venouscollapse and an increase in intravascular pressure. Inthis study, the responses to positive and negativechamber pressure were equal. This finding could beexplained by a larger contribution of flow-dependentmechanisms and less of a contribution of pressure-dependent mechanisms when chamber pressure wasincreased.
Autoregulation in HypertensionRenal dysfunction that leads to fluid retention can
increase plasma volume, venous return, and cardiacoutput; this sequence could lead to overperfusion of thevarious tissues and constriction of the small arteriolesor "whole body" autoregulation.35 Plasma volume doesnot necessarily have to be elevated to increase cardiacfilling and output.3* For example, an increased venoustone or decreased venous compliance could enhancevenous return, which could lead to an early increase incardiac output and thus be an important factor in thegenesis of renal hypertension.
In general, one-kidney, one clip hypertension in therat is thought to be a low renin, volume-dependent typeof renal hypertension.37 Plasma renin may be high ini-tially but usually returns to normal levels. Plasma andblood volumes have been found to be high in rats withmoderate, but not severe, hypertension. With two-kidney, two clip renal hypertension in rats, plasma orblood volumes have been reported to rise transientlybut, in general, do not change with either moderate orsevere hypertension.37 In the present study, these two-kidney, two figure-8 hypertensive hamsters, like the
by guest on June 14, 2018http://hyper.ahajournals.org/
ARTERIOLAR REACTIVITY AND RENAL HYPERTENSION/Stary et al. 91
one-kidney rat, had mild hypertension and were vol-ume-expanded 10 to 16 days after renal compression.The relation between volume expansion and arteriolarreactivity has not been established; however, theremay be a link between the elevated blood volume andthe release of a natriuretic compound that could altervascular tone or mechanics, or both, and thus, alterreactivity to pressure.38 Therefore, the increased bloodvolume in renal hypertension may have resulted inarteriolar autoregulation and vasoconstriction througha change in the mechanical properties or the sensitivityof the vascular smooth muscle to vasoactive stimuli.
Furthermore, generalized autoregulation could con-tribute to renal hypertension as the result of a nonuni-form increase in peripheral resistance during acuterenal hypertension.17 Meininger et al.17 point out thatautoregulation of arterioles contributes to the rise inperipheral resistance in acute renal hypertension with-out the necessity of volume expansion, which presum-ably does not occur immediately after unilateral renalartery constriction. However, it still remains to beshown that these acute autoregulatory responses can bemaintained or that they contribute to the developmentof renal hypertension. This point is accentuated furtherby the studies of Alson et al.,18 in which they conclud-ed that the autoregulatory response mechanisms werenot affected by the developing or hypertensive state inspontaneously hypertensive rats; this conclusion isconsistent with a structural basis for the maintenanceof an elevated peripheral resistance. However, thepresent study suggests that enhanced autoregulatoryresponses still may contribute to the elevated peripher-al resistance after the initiation of renal hypertension.
Geometric and Structural AlterationsHypertrophy of vascular smooth muscle will cause
an increase in the media/lumen ratio that will give thevessel a mechanical advantage and an increase in reac-tivity to various stimuli.39 In the present study, thisratio was elevated in the second and fourth order arte-rioles of the RHT hamster, but the medial area was notchanged. Thus, the greater reactivity of third orderarterioles cannot be explained by an increased media/lumen ratio, whereas this increased ratio could explainthe increased reactivity of the fourth order arterioles.However, the media/lumen ratio also was greater insecond order arterioles of the RHT group, and thereactivity of these arterioles was identical. Thus, nei-ther the media/lumen ratio nor the medial cross-sec-tional area appeared to be related to the altered reactiv-ity of arterioles at this stage of renal hypertension. Thisconclusion does not rule out the possibility thatchanges in the media/lumen ratio or vascular hyper-trophy could affect arteriolar reactivity with chronicrenal hypertension or that the decreased diameters ofthe larger arterioles may initiate vascular hypertrophy,which would maintain the elevated blood pressures.
In conclusion, small arterioles of the NT and RHTgroups were more reactive to pressure stimuli and thisreactivity was greater in hamsters with renal hyperten-sion. This enhanced reactivity could contribute to the
maintenance of elevated peripheral resistance in thisearly stage of renal hypertension. This increased reac-tivity of small arterioles was not related to structuralalterations, either to the media/lumen ratio or to themedial cross-sectional area; however, this increasedreactivity occurred at a time when plasma volume waselevated.
AcknowledgmentsThe authors express their appreciation to Glenda Sharpe, Tim
Grinbergs, and Denise Raemsch for technical assistance; to Ruth D.Cozette for preparation of the manuscript; and to Cindy Norton foradministrative assistance. Dr. Russell L. Prewitt, Jr., providedpertinent suggestions.
References1. Short DS, Thomson AD. The arteries of the small intestine in
in the one-kidney, one-clip renal hypertensive rat. Am J Phys-iol 1984;246:H728-H732
3. HutchinsPM, Darnell AE. Observation of a decreased numberof small arterioles in spontaneously hypertensive rats. Circ Res1974;34, 35(suppl 1): 161-165
4. Duling BR, Beme RM. Microiontophoretic application of va-soactive agents to the microcirculation of the hamster cheekpouch. Microvasc Res 1968; 1:158—173
5. Altura BM. Evaluation of neurohumoral substances in localregulation of blood flow. Am J Physiol 1967;212:1447-1454
6. Gore RW. Wall stress: a determinant of regional differences inresponse of frog microvessels to norepinephrine. Am J Physiol1972;222:82-91
7. Marshall JM. The influence of the sympathetic nervous systemon individual vessels of the microcirculation of skeletal muscleof the rat. J Physiol (Lond) 1982;332:169-186
8. Renkin EM. Control of microcirculation and blood-tissue ex-change. In: Renkin EM, Michel CC, eds. The cardiovascularsystem: microcirculation. Bethesda, MD: American Physio-logical Society, 1984:627-687 (Handbook of physiology; vol4)
9. Joyner WL, Davis MJ, Gilmore JP. Intravascular pressuredistribution and dimensional analysis of microvessels in ham-sters with renovascular hypertension. Microvasc Res 1981 ;22:190-198
10. Meininger GA, Harris PD, Joshua IG. Distributions of micro-vascular pressure in skeletal muscle in one-kidney, one clip,two-kidney, one clip, and deoxycorticosterone-salt hyperten-sive rats. Hypertension 1984;6:27-34
11. Click RL, Gilmore JP, Joyner WL. Direct demonstration ofalterations in the microcirculation of the hamster during andfollowing renal hypertension. Circ Res 1977;41:461-467
12. Wiegman DL, Joshua IG, Morff RJ, Harris PD, Miller FN.Microvascular responses to norepinephrine in renovascular hy-pertension. Am J Physiol 1979^236: H545-H548
13. Joshua IG, Wiegman DL, Harris PD, Miller FN. Progressivemicrovascular alterations with the development of renovascu-lar hypertension. Hypertension 1984;6:61-67
14. Click RL, Gilmore JP, Joyner WL. Differential response ofhamster cheek pouch microvessels to vasoactive stimuli duringthe early development of hypertension. Circ Res 1979;44:512-517
15. Haywood JR, Williams SFD, Ball N A. Contribution of sodiumto the mechanism of one-kidney, renal-wrap hypertension. AmJ Physiol 1984;247:H797-H8O3
16. Katholi RE, Whitlow PL, Winternitz SR, Oparil S. Importanceof the renal nerves in established two-kidney, one-clip Gold-blatt hypertension. Hypertension 1982;4(suppl 10:11-166-D-174
17. Meininger GA, Lubrano VM, Granger HJ. Hemodynamic andmicrovascular responses in the hindquarters during the devel-
by guest on June 14, 2018http://hyper.ahajournals.org/
opment of renal hypertension in rats: evidence for the involve-ment of autoregulatory component. Circ Res 1984;55:609-622
18. Alson RL, Dusseau JW, Hutchins PM. Arteriolar and systemicautoregulatory responses during the development of hyperten-sion in the spontaneously hypertensive rat. Proc Soc Exp BiolMed 1985;180:62-71
19. Morff RJ, Granger HJ. Autoregulation of blood flow withinindividual arterioles in the rat cremaster muscle. Circ Res1982;51:43-55
20. Johnson PC, Intaglietta M. Contributions of pressure and flowsensitivity to autoregulation in mesenteric arterioles. Am JPhysiol 1976:231:1686-1698
21. Wei EP, Kontos HA. Responses of cerebral arterioles to in-creased venous pressure. Am J Physiol 1979;243:H442-H447
22. Burrows ME, Johnson PC. Arteriolar responses to elevation ofvenous and arterial pressures in cat mesentery. Am J Physiol1979;245:H796-H807
23. Davis MJ, Gilmore JP, Joyner WL. Responses of pulmonaryallograft and cheek pouch arterioles in the hamster to alter-ations in extravascular pressure in different oxygen environ-ments. Circ Res 1981 ;49:133-140
24. Bohlen HG, Harper SL. Evidence of myogenic vascular con-trol in the rat cerebral cortex. Circ Res 1984;55:554-559
25. Bouskela E, Wiederhielm CA. Microvascular myogenic reac-tion in the wing of the intact unanesthetized bat. Am J Physiol1979;237:H59-H65
26. Halpem W, Mongeon SA, Root DT. Stress, tension, and myo-genic aspects of small isolated extraparenchymal rat arteries.In: Stephens NL, ed. Smooth muscle contraction. New York:Marcel Dekker, 1984:427-456
27. Gore RW, Davis MJ. Mechanics of smooth muscle in isolatedsingle microvessels. Ann Biomed Eng 1984;12:511—520
28. Grande P-O, Borgstrom P, Mellander S. On the nature of basalvascular tone in cat skeletal muscle and its dependence on
29. Tesfamariam B, Halpern W, Osol G. Effects of perfusion andendothelium on the reactivity of isolated resistance arteries.Blood Vessels 1985;22:301-305
30. Fung Y-CB. Mechanical properties of blood vessels. In: John-son P, ed. Peripheral circulation. New York: John Wiley &Sons, 1979:45-80
31. Schroder U, Arfors KE, Tangen O. Stability of fluoresceinlabeled dextrans in vitro. Microvasc Res 1976:11:33-39
32. Mayrovitz HN, Roy J. Microvascular blood flow: evidenceindicating a cubic dependence on arteriolar diameters. Am JPhysiol 1983;245:H1031-H1038
33. Davis MJ, Ferrer PN, Gore RW. Vascular anatomy and hydro-static pressure profile in the hamster cheek pouch. Am J Phys-iol 1986;25O:H291-H3O3
34. Meininger GA, Fehr KL, Yates MB, Borders JL, Granger HJ.Hemodynamic characteristics of the intestinal microcirculationin renal hypertension. Hypertension 1986;8:66-75
35. Granger HJ, Guyton AC. Autoregulation of the total systemiccirculation following destruction of the central nervous systemin the dog. Circ Res 1969:25:379-388
36. Yamamoto J, Trippodo NC, MacPhee AA, Frohlich ED. De-creased total venous capacity in Goldblatt hypertensive rats.Am J Physiol 1981;240:H487-H492
37. Leenen FHH, Myers MG. Pressor mechanisms in renovascularhypertensive rats. In: de Jong W, ed. Experimental and genetichypertension. New York: Elsevier, 1984:24-53 (BirkenhagerWH, Reid JL, eds. Handbook of hypertension; vol 4)
38. Plunkett WC, Hutchins PM, Gruber KA, Buckalew VM Jr.Evidence for a vascular sensitizing factor in plasma of saline-loaded dogs. Hypertension 1982;4:581-589
39. Folkow B, Hallback M, Lundgren Y, Weiss L. Structuralincreases of flow resistance in spontaneously hypertensive rats.Acta Physiol Scand 1970:79:373-378
by guest on June 14, 2018http://hyper.ahajournals.org/
is published by the American Heart Association, 7272 Greenville Avenue, Dallas, TX 75231Hypertension doi: 10.1161/01.HYP.10.1.82
1987;10:82-92Hypertension.
http://hyper.ahajournals.org/content/10/1/82the World Wide Web at:
The online version of this article, along with updated information and services, is located on
http://hyper.ahajournals.org//subscriptions/
is online at: Hypertension Information about subscribing to Subscriptions:
http://www.lww.com/reprints Information about reprints can be found online at: Reprints:
document.
Permissions and Rights Question and Answer Further information about this process is available in therequested is located, click Request Permissions in the middle column of the Web page under Services.not the Editorial Office. Once the online version of the published article for which permission is being
can be obtained via RightsLink, a service of the Copyright Clearance Center,Hypertensionpublished in Requests for permissions to reproduce figures, tables, or portions of articles originallyPermissions:
by guest on June 14, 2018http://hyper.ahajournals.org/