ECB Monthly Bulletin January 2013 59 Intra-euro area trade linkages and external adjustment ARTICLES INTRA-EURO AREA TRADE LINKAGES AND EXTERNAL ADJUSTMENT This article examines trends in intra-euro area trade over the last decade. Intra-euro area trade accounts for almost half of total euro area trade. Moreover, trade integration within the euro area has increased continuously, establishing a significant channel for the transmission of shocks. In the years leading up to the global financial crisis, euro area countries with large current account deficits typically also recorded large trade deficits vis-à-vis the rest of the euro area. Since the onset of the crisis there has been considerable progress in the correction of euro area current account imbalances, which has also been reflected in more balanced intra-euro area trade. Notwithstanding this, determined policy action is needed in several euro area countries to complete the rebalancing process and ensure its sustainability, particularly through further improvements in price and non- price competitiveness. In addition, structural reforms aimed at greater flexibility in labour and product markets are essential to facilitate external rebalancing within the euro area, now and in the future. 1 INTRODUCTION The countries forming the euro area are not only irreversibly linked by a common currency; they are also bound together by tight trade linkages. In fact, euro area countries trade almost as much with each other as they do with the rest of the world. Including trade with non-euro area EU Member States, intra-regional trade makes up almost 70% of total exports – a level of regional trade integration without equal among the major country blocks in the global economy (see Chart 1). Accounting for around 10% of total world trade, intra-euro area trade also matters from a global perspective. It is important to have a clear picture of intra-euro area trade for a number of reasons. First, the free movement of goods and services is one of the cornerstones of prosperity in the euro area, fostering an efficient allocation of resources, product variety, competition and economic growth. Second, intra-euro area trade contributes to the synchronisation of national business cycles, acting as a channel for the transmission of macroeconomic shocks across borders. Third, intra-euro area trade has been affected by the large and persistent current account imbalances that built up in the euro area in the years leading up to the global financial crisis. Against this backdrop, Section 2 outlines the importance of intra-euro area trade for the euro area as a whole and for the individual euro area countries. Section 3 describes in greater detail the patterns of intra-euro area trade and the interdependencies created by these trade linkages. Section 4 looks at the role of intra- euro area trade in the build-up and subsequent unwinding of current account imbalances in the euro area. Chart 1 Share of intra-regional exports in total exports for selected world regions in 2011 (percentages) 10 20 30 40 50 60 70 0 0 10 20 30 40 50 60 70 EU Euro area NAFTA Asia Latin America Sources: Eurostat, IMF and ECB calculations. Note: “Latin America” excludes Mexico.
Transcript
ECBMonthly Bulletin
January 2013 59
Intra-euro area trade linkages and external
adjustment
artiCleS
intra-euro area trade linKaGeS and eXternal adjuStment
This article examines trends in intra-euro area trade over the last decade. Intra-euro area trade accounts for almost half of total euro area trade. Moreover, trade integration within the euro area has increased continuously, establishing a signifi cant channel for the transmission of shocks. In the years leading up to the global fi nancial crisis, euro area countries with large current account defi cits typically also recorded large trade defi cits vis-à-vis the rest of the euro area. Since the onset of the crisis there has been considerable progress in the correction of euro area current account imbalances, which has also been refl ected in more balanced intra-euro area trade. Notwithstanding this, determined policy action is needed in several euro area countries to complete the rebalancing process and ensure its sustainability, particularly through further improvements in price and non-price competitiveness. In addition, structural reforms aimed at greater fl exibility in labour and product markets are essential to facilitate external rebalancing within the euro area, now and in the future.
1 introduCtion
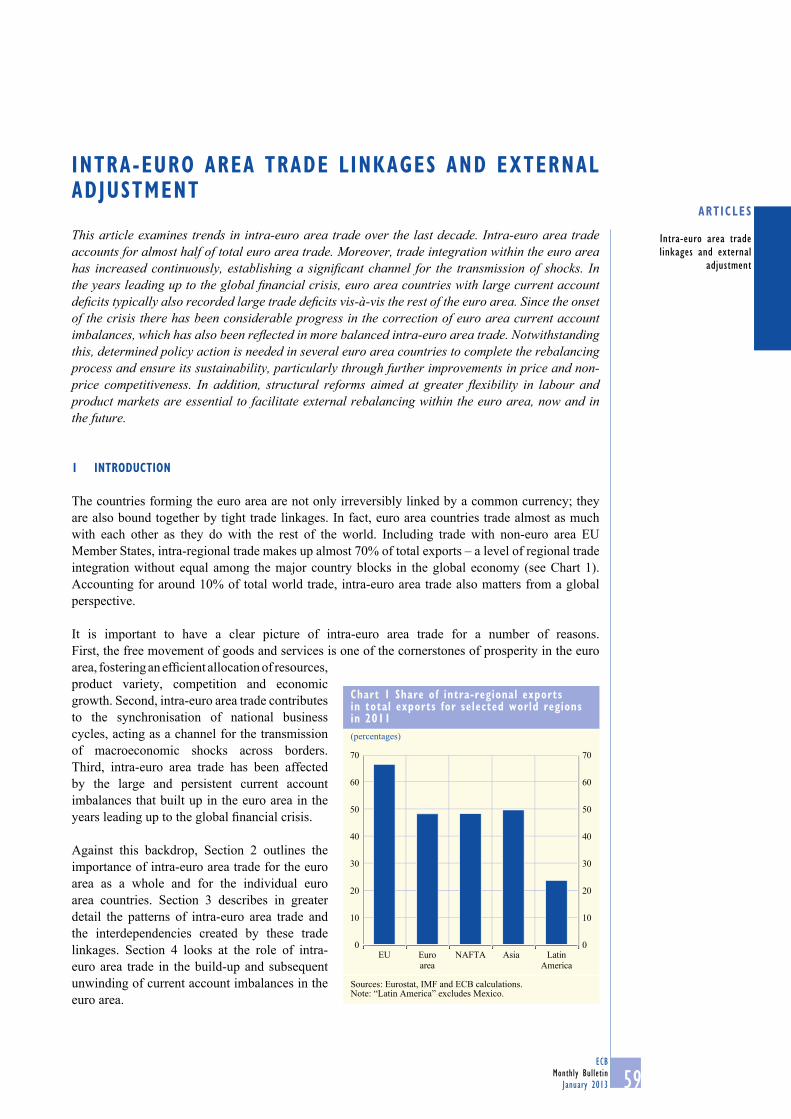
The countries forming the euro area are not only irreversibly linked by a common currency; they are also bound together by tight trade linkages. In fact, euro area countries trade almost as much with each other as they do with the rest of the world. Including trade with non-euro area EU Member States, intra-regional trade makes up almost 70% of total exports – a level of regional trade integration without equal among the major country blocks in the global economy (see Chart 1). Accounting for around 10% of total world trade, intra-euro area trade also matters from a global perspective.
It is important to have a clear picture of intra-euro area trade for a number of reasons. First, the free movement of goods and services is one of the cornerstones of prosperity in the euro area, fostering an effi cient allocation of resources, product variety, competition and economic growth. Second, intra-euro area trade contributes to the synchronisation of national business cycles, acting as a channel for the transmission of macroeconomic shocks across borders. Third, intra-euro area trade has been affected by the large and persistent current account imbalances that built up in the euro area in the years leading up to the global fi nancial crisis.
Against this backdrop, Section 2 outlines the importance of intra-euro area trade for the euro area as a whole and for the individual euro area countries. Section 3 describes in greater detail the patterns of intra-euro area trade and the interdependencies created by these trade linkages. Section 4 looks at the role of intra-euro area trade in the build-up and subsequent unwinding of current account imbalances in the euro area.
Chart 1 Share of intra-regional exports in total exports for selected world regions in 2011(percentages)
10
20
30
40
50
60
70
00
10
20
30
40
50
60
70
EU Euroarea
NAFTA Asia LatinAmerica
Sources: Eurostat, IMF and ECB calculations.Note: “Latin America” excludes Mexico.
ECBMonthly BulletinJanuary 201360
2 the imPortanCe oF intra-euro area trade
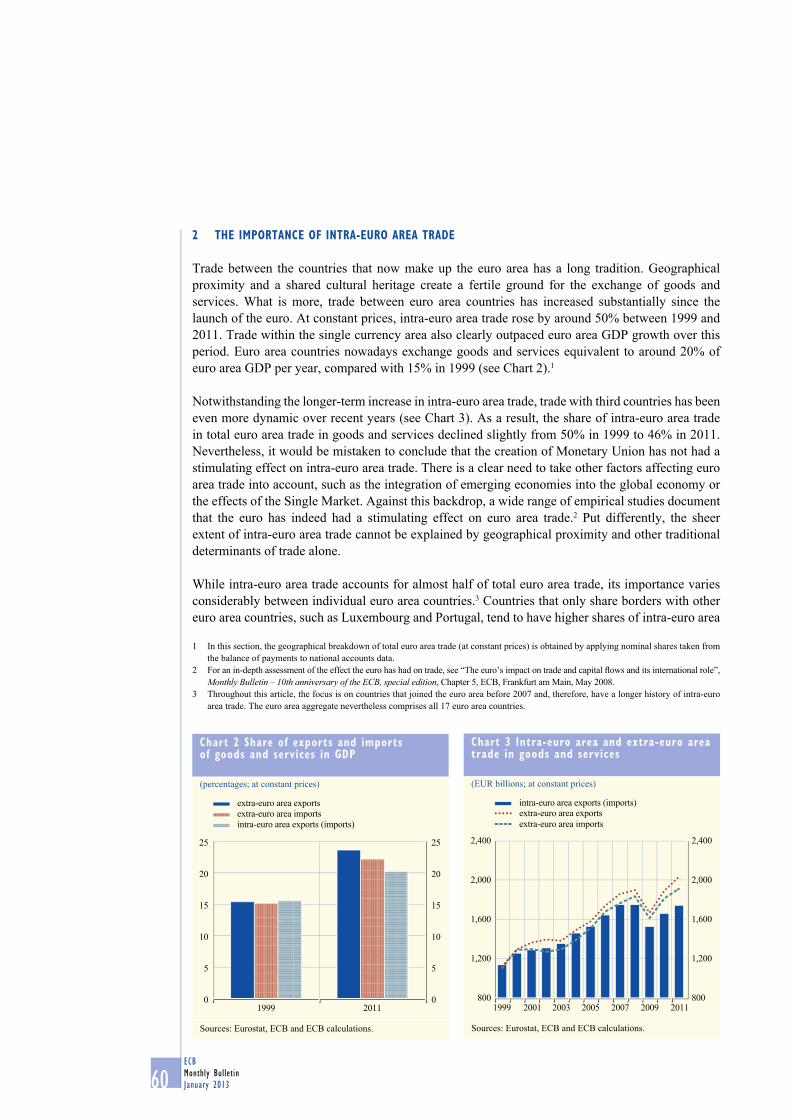
Trade between the countries that now make up the euro area has a long tradition. Geographical proximity and a shared cultural heritage create a fertile ground for the exchange of goods and services. What is more, trade between euro area countries has increased substantially since the launch of the euro. At constant prices, intra-euro area trade rose by around 50% between 1999 and 2011. Trade within the single currency area also clearly outpaced euro area GDP growth over this period. Euro area countries nowadays exchange goods and services equivalent to around 20% of euro area GDP per year, compared with 15% in 1999 (see Chart 2).1
Notwithstanding the longer-term increase in intra-euro area trade, trade with third countries has been even more dynamic over recent years (see Chart 3). As a result, the share of intra-euro area trade in total euro area trade in goods and services declined slightly from 50% in 1999 to 46% in 2011. Nevertheless, it would be mistaken to conclude that the creation of Monetary Union has not had a stimulating effect on intra-euro area trade. There is a clear need to take other factors affecting euro area trade into account, such as the integration of emerging economies into the global economy or the effects of the Single Market. Against this backdrop, a wide range of empirical studies document that the euro has indeed had a stimulating effect on euro area trade.2 Put differently, the sheer extent of intra-euro area trade cannot be explained by geographical proximity and other traditional determinants of trade alone.
While intra-euro area trade accounts for almost half of total euro area trade, its importance varies considerably between individual euro area countries.3 Countries that only share borders with other euro area countries, such as Luxembourg and Portugal, tend to have higher shares of intra-euro area
In this section, the geographical breakdown of total euro area trade (at constant prices) is obtained by applying nominal shares taken from 1 the balance of payments to national accounts data.
2 For an in-depth assessment of the effect the euro has had on trade, see “The euro’s impact on trade and capital fl ows and its international role”, Monthly Bulletin – 10th anniversary of the ECB, special edition, Chapter 5, ECB, Frankfurt am Main, May 2008.
3 Throughout this article, the focus is on countries that joined the euro area before 2007 and, therefore, have a longer history of intra-euro area trade. The euro area aggregate nevertheless comprises all 17 euro area countries.
Chart 2 Share of exports and imports of goods and services in GdP
(percentages; at constant prices)
0
5
10
15
20
25
0
5
10
15
20
25
1999 2011
extra-euro area exportsextra-euro area importsintra-euro area exports (imports)
Sources: Eurostat, ECB and ECB calculations.
Chart 3 intra-euro area and extra-euro area trade in goods and services
(EUR billions; at constant prices)
800
1,200
1,600
2,000
2,400
800
1,200
1,600
2,000
2,400
1999 2001 2003 2005 2007 2009 2011
intra-euro area exports (imports)extra-euro area exportsextra-euro area imports
Sources: Eurostat, ECB and ECB calculations.
ECBMonthly Bulletin
January 2013 61
Intra-euro area trade linkages and external
adjustment
artiCleS
trade compared with countries that also share borders with non-euro area countries, such as Finland, Greece and Ireland (see Chart 4). Of the largest euro area countries, Germany has the lowest share of intra-euro area trade. This partially refl ects Germany’s intensive trade with neighbouring eastern European countries and emerging markets in Asia. There is also signifi cant cross-country heterogeneity when looking at the share of intra-euro area trade in GDP, owing to differences in the size of the export sector in the various countries (see Chart 5). As a caveat, it should be noted that the geographical breakdown of trade, particularly in Belgium and the Netherlands, can be distorted by what is known as the “Rotterdam effect”.4
3 trade PatternS and interdePendenCieS
the GeoGraPhy oF intra-euro area tradeThis section takes a closer look at the patterns characterising intra-euro area trade – both from a geographical and a sectoral perspective – and the interdependencies resulting from these trade linkages. Starting with the geographical patterns, it is noteworthy that every euro area country trades directly with all the other euro area countries. The largest economies are, not surprisingly, the main export markets for almost all euro area economies (see Charts 6 and 7). Nevertheless, the smaller economies have seen their share in intra-euro area trade in goods rise over time. Moreover, their share in intra-euro area trade is larger for services than for goods, partially refl ecting the role of some of these countries, for example Luxembourg and Ireland, in business services trade, such as fi nancial and computer and information services. Overall, the detailed geographical breakdown makes it clear that intra-euro area trade constitutes a fi ne-meshed grid through which macroeconomic shocks can easily be transmitted across borders. Against this backdrop, Box 1 sheds some light on intra-euro area spillovers and the role of the trade channel.
4 The “Rotterdam effect” arises if trade fl ows are recorded according to what is known as the “community concept”. This means that goods from non-euro area countries are recorded at the port of arrival (e.g. Rotterdam or Antwerp) as extra-euro area imports, even if they are subsequently re-exported to another euro area country (which is then separately recorded as intra-euro area trade). As a consequence, the Rotterdam effect infl ates the extra-euro area trade defi cits and intra-euro area trade surpluses of important transit countries, particularly Belgium and the Netherlands. This also leads to an underestimation of the intra-euro area trade surplus of other euro area countries.
Chart 5 exports plus imports of goods and services as a percentage of reporting country’s GdP(percentages; 1999-2011 average; at constant prices)
0
50
100
150
200
250
300
0
50
100
150
200
250
300
LU BE IE NL AT DE FI GR PT ES IT FR
extra-euro areaintra-euro area
Sources: Eurostat and ECB.Note: Data start in 2000 for Greece and 2002 for Belgium and Luxembourg.
Chart 4 intra-euro area exports as a percentage of total exports
(percentages; 1999-2011 average; at constant prices)
0
10
20
30
40
50
60
70
80
0
10
20
30
40
50
60
70
80
EA LU PT NL BE ES AT FR IT DE IE GR FI
goodsservices
Sources: Eurostat and ECB.Notes: Data start in 2000 for Greece and 2002 for Belgium and Luxembourg. EA stands for euro area.
ECBMonthly BulletinJanuary 201362
Chart 6 Geographical breakdown of intra-euro area exports of goods in 2011
(percentages)
0
10
20
30
40
50
60
70
80
90
100
0
10
20
30
40
50
60
70
80
90
100
AT NL FR LU FI IT GR PT ES IEDE
NetherlandsFranceItaly
Belgium
BE
Spain
Germany
other euro area countries
x-axis: reporting country
Sources: IMF and ECB calculations.
Chart 7 Geographical breakdown of intra-euro area exports of services in 2010
(percentages)
0
10
20
30
40
50
60
70
80
90
100
0
10
20
30
40
50
60
70
80
90
100
GermanyFranceItalySpain
NetherlandsBelgiumother euro area countries
DE AT NL FR LU FI IT BE GR IE PT ES
x-axis: reporting country
Sources: Eurostat and ECB calculations.
box 1
quantiFyinG intra-euro area SPilloVer eFFeCtS uSinG the Global Var model
There are various channels through which a shock in a given euro area country could affect other euro area economies. The most direct channel is created by trade linkages; however, that is insuffi cient to account for all the spillover effects. Financial linkages appear to have gained in signifi cance within the euro area, not only as a result of the integration of euro area fi nancial markets, but also through cross-border exposure among euro area fi nancial institutions. Lastly, other channels – such as confi dence effects – may also play a signifi cant role in the cross-country transmission of shocks within the euro area. Against this background, this box presents an analysis which aims to account for the diversity of linkages across the euro area countries based on the global vector autoregressive (GVAR) model developed by Dées et al. (2007)1.
A brief overview of the GVAR model
The comprehensive GVAR modelling approach considers the responses to various types of global and country shocks through a number of transmission channels. These channels include trade fl ows and fi nancial linkages in particular, through debt, equity and currency markets. A real
1 Dées, S., di Mauro, F., Pesaran, M.H. and Smith, L.V., “Exploring the international linkages of the euro area: a global VAR analysis”, Journal of Applied Econometrics, Vol. 22, No 1, 2007, pp. 1-38. The version used for the paper included Germany, France, Italy, Spain, the Netherlands, Belgium, Austria and Finland. The version used for the box also includes Greece, Portugal and Ireland. The countries included represent 98% of the euro area as a whole in terms of GDP (in PPP terms, averaged over the period 2006-09). Cyprus, Estonia, Luxembourg, Malta, Slovakia and Slovenia are not included.
ECBMonthly Bulletin
January 2013 63
Intra-euro area trade linkages and external
adjustment
artiCleS
shock that directly affects trade fl ows is propagated by changes in various asset prices, in turn generating spillover effects on real variables. The GVAR model used in this exercise comprises 36 countries, of which 11 are euro area countries, linked through area-specifi c vector error-correcting models which allow simultaneous inter-relationships between domestic and foreign variables to be determined. The model includes six variables: real GDP, infl ation, real exchange rates, short-term and long-term interest rates and real equity prices.
Breaking intra-euro area spillover effects down into various components
Chart A shows the effects of a positive GDP shock in each euro area country on the euro area real GDP. The total effects are broken down into four different components: effects stemming from the size of the country in the area, direct trade effects, indirect trade effects and effects generated via other channels.
Overall, while the size of the country matters, the total effect derived from the GVAR model is around twice as much as the weight of the country in the euro area aggregate. For instance, as the weight of Germany in the aggregate is around 27% 2, an increase in real GDP by 1% would imply, all other things being equal, a 0.27% increase in the aggregate real GDP. Once all other effects are taken into account, the GVAR model simulations would suggest a total impact equal to 0.5% (i.e. 0.23% coming from intra-euro area spillovers). In all the other countries considered, the total effect on the euro area is also much greater than the size of the country would imply. Chart A also provides a decomposition of the spillover effects into trade-related effects and other effects. First, direct trade effects – which are channelled solely by bilateral trade relationships between the country where the shock originates and its trading partners – are computed. Indirect trade effects, which involve second-round and third-market effects across trading partners, are then computed.3 According to this approach, a 1% increase in real GDP in Germany would give rise to direct trade effects amounting to 0.07% of euro area output. Including indirect trade effects, the impact would increase to 0.16%.
The remaining effects are those that depend on other transmission channels (fi nancial or confi dence linkages). In the case of Germany, the additional spillover effects related to these other channels would amount to the
2 The weights reported here refer to the share of each country in the GDP aggregate of the euro area countries included in the model (i.e. 11 countries out of 17).
3 The methodology is detailed in Dées, S. and Vansteenkiste, I., “The transmission of US cyclical developments to the rest of the world”, Working Paper Series, No 798, ECB, Frankfurt am Main, August 2007.
Chart a impact of a 1% increase in real GdP in individual countries on euro area real GdP(percentages)
Sources: Eurostat and ECB calculations.Notes: The bars indicate the impact of a 1% increase in real GDP in a given country on euro area real GDP. The impact is broken down by the weight of each country in the euro area, direct trade effects, indirect trade effects and additional spillover effects derived from the total GVAR impacts minus the sum of the previous components.
ECBMonthly BulletinJanuary 201364
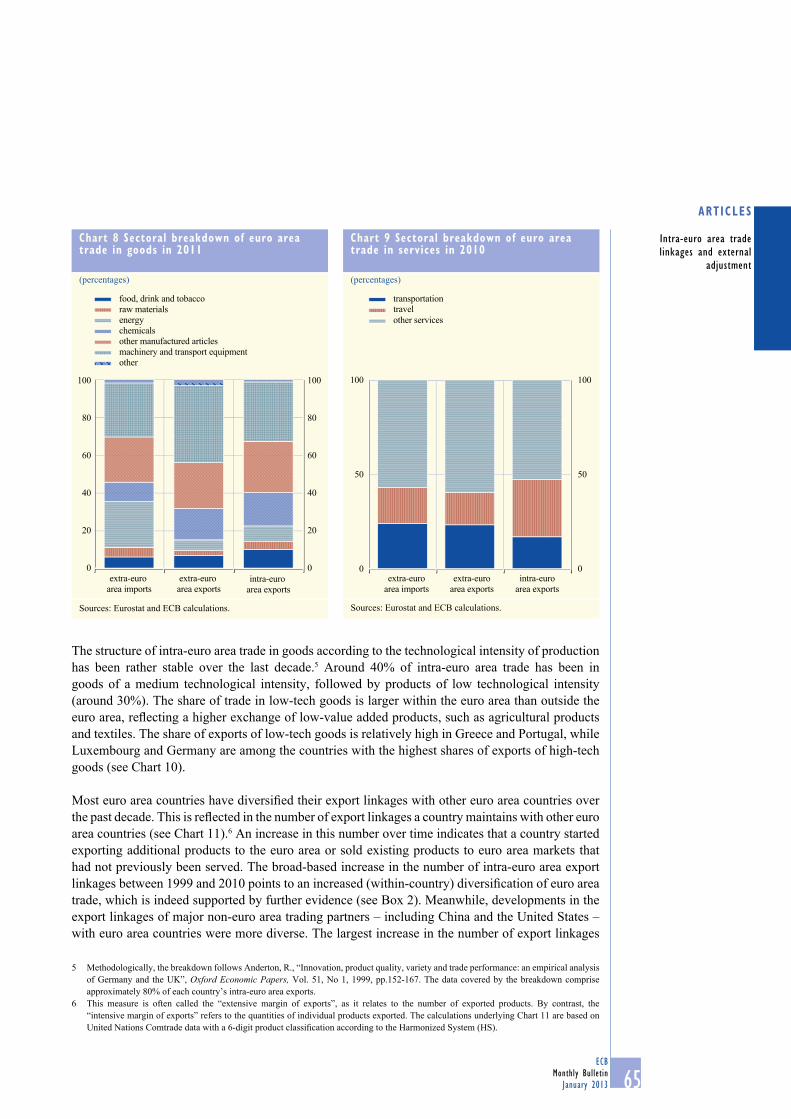
the SeCtoral PerSPeCtiVeWhile the previous section looked at the geography of trade within Monetary Union, this section explores its sectoral structure. The sectoral breakdown of intra-euro area exports of goods resembles that of extra-euro area exports. Around two-thirds of all exports are manufactured products, particularly machinery and transport equipment and chemicals (see Chart 8). Nevertheless, there are some notable differences. For instance, the share of trade in machinery and transport equipment is somewhat lower within the euro area than the share of such trade with extra-euro area countries. To some extent, this refl ects the strong demand from emerging economies for these goods and the fact that extra-euro area trade includes trade with some Eastern European EU Member States that are tightly integrated into European supply chains, for instance in the auto sector. As regards trade in services, approximately 20% of intra-euro area exports were in transportation and 30% in travel, while the remaining 50% were exports of other services (such as fi nancial, IT and communication services) (see Chart 9). Travel is slightly more important within the euro area than vis-à-vis the rest of the world.
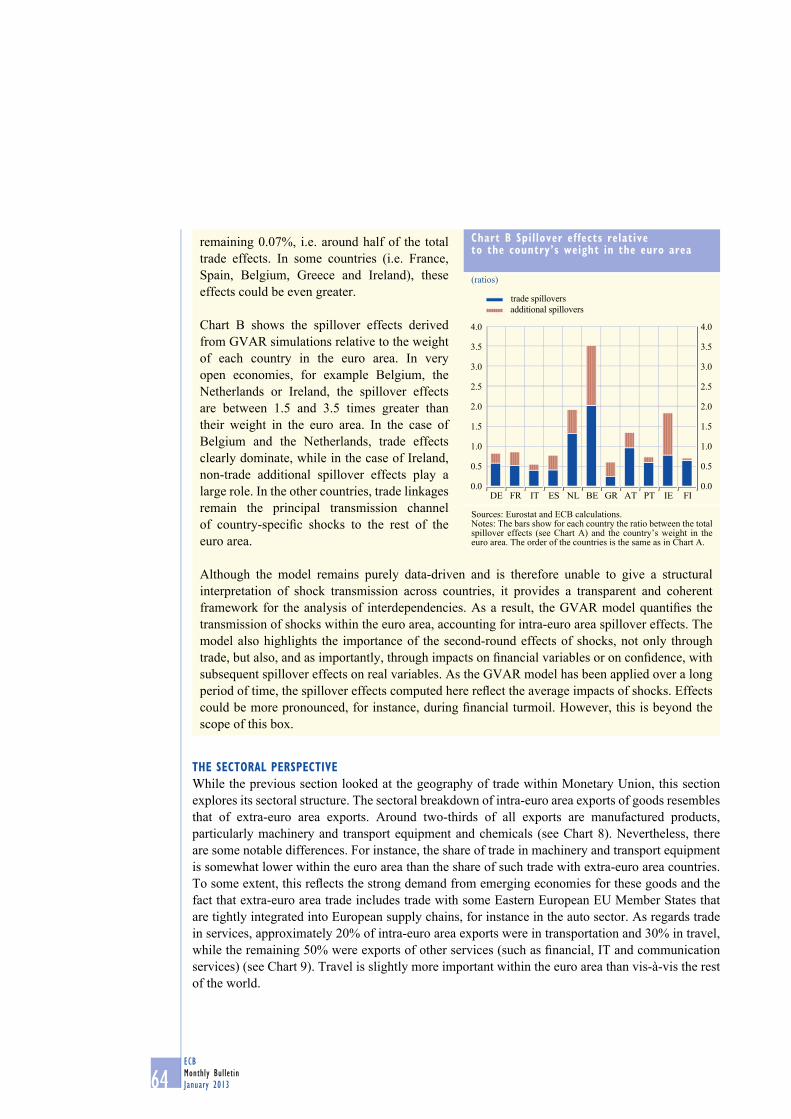
remaining 0.07%, i.e. around half of the total trade effects. In some countries (i.e. France, Spain, Belgium, Greece and Ireland), these effects could be even greater.
Chart B shows the spillover effects derived from GVAR simulations relative to the weight of each country in the euro area. In very open economies, for example Belgium, the Netherlands or Ireland, the spillover effects are between 1.5 and 3.5 times greater than their weight in the euro area. In the case of Belgium and the Netherlands, trade effects clearly dominate, while in the case of Ireland, non-trade additional spillover effects play a large role. In the other countries, trade linkages remain the principal transmission channel of country-specifi c shocks to the rest of the euro area.
Although the model remains purely data-driven and is therefore unable to give a structural interpretation of shock transmission across countries, it provides a transparent and coherent framework for the analysis of interdependencies. As a result, the GVAR model quantifi es the transmission of shocks within the euro area, accounting for intra-euro area spillover effects. The model also highlights the importance of the second-round effects of shocks, not only through trade, but also, and as importantly, through impacts on fi nancial variables or on confi dence, with subsequent spillover effects on real variables. As the GVAR model has been applied over a long period of time, the spillover effects computed here refl ect the average impacts of shocks. Effects could be more pronounced, for instance, during fi nancial turmoil. However, this is beyond the scope of this box.
Chart b Spillover effects relative to the country’s weight in the euro area
(ratios)
0.0
0.5
1.0
1.5
2.0
2.5
3.0
3.5
4.0
0.0
0.5
1.0
1.5
2.0
2.5
3.0
3.5
4.0
DE FR IT ES NL BE GR AT PT IE FI
trade spilloversadditional spillovers
Sources: Eurostat and ECB calculations.Notes: The bars show for each country the ratio between the total spillover effects (see Chart A) and the country’s weight in the euro area. The order of the countries is the same as in Chart A.
ECBMonthly Bulletin
January 2013 65
Intra-euro area trade linkages and external
adjustment
artiCleS
The structure of intra-euro area trade in goods according to the technological intensity of production has been rather stable over the last decade.5 Around 40% of intra-euro area trade has been in goods of a medium technological intensity, followed by products of low technological intensity (around 30%). The share of trade in low-tech goods is larger within the euro area than outside the euro area, refl ecting a higher exchange of low-value added products, such as agricultural products and textiles. The share of exports of low-tech goods is relatively high in Greece and Portugal, while Luxembourg and Germany are among the countries with the highest shares of exports of high-tech goods (see Chart 10).
Most euro area countries have diversifi ed their export linkages with other euro area countries over the past decade. This is refl ected in the number of export linkages a country maintains with other euro area countries (see Chart 11).6 An increase in this number over time indicates that a country started exporting additional products to the euro area or sold existing products to euro area markets that had not previously been served. The broad-based increase in the number of intra-euro area export linkages between 1999 and 2010 points to an increased (within-country) diversifi cation of euro area trade, which is indeed supported by further evidence (see Box 2). Meanwhile, developments in the export linkages of major non-euro area trading partners – including China and the United States – with euro area countries were more diverse. The largest increase in the number of export linkages
5 Methodologically, the breakdown follows Anderton, R., “Innovation, product quality, variety and trade performance: an empirical analysis of Germany and the UK”, Oxford Economic Papers, Vol. 51, No 1, 1999, pp.152-167. The data covered by the breakdown comprise approximately 80% of each country’s intra-euro area exports.
6 This measure is often called the “extensive margin of exports”, as it relates to the number of exported products. By contrast, the “intensive margin of exports” refers to the quantities of individual products exported. The calculations underlying Chart 11 are based on United Nations Comtrade data with a 6-digit product classifi cation according to the Harmonized System (HS).
Chart 8 Sectoral breakdown of euro area trade in goods in 2011
(percentages)
0
20
40
60
80
100
0
20
40
60
80
100
extra-euro area imports
extra-euro area exports
intra-euro area exports
food, drink and tobaccoraw materialsenergy
other manufactured articleschemicals
machinery and transport equipmentother
Sources: Eurostat and ECB calculations.
Chart 9 Sectoral breakdown of euro area trade in services in 2010
(percentages)
extra-euroarea imports
extra-euroarea exports
intra-euroarea exports
0
50
100
0
50
100
transportationtravelother services
Sources: Eurostat and ECB calculations.
ECBMonthly BulletinJanuary 201366
with euro area countries was recorded by China, although the United Kingdom still maintains the highest number of export links with the euro area, partially owing to its geographical proximity and EU membership.
box 2
the Similarity oF eXPort PatternS within the euro area
The sectoral structure of exports is of particular interest for countries forming a monetary union, such as the euro area. In fact, it is widely held that it is conducive to the smooth functioning of a currency union if the structure of exports (and production) is: (i) similar for all its members; and (ii) widely diversifi ed across sectors within each country. The rationale behind this, which is known as the “Kenen criterion”, is that, in the fi rst place, countries exporting similar products are less likely to be hit by industry-specifi c asymmetric shocks.1 If a country is nevertheless hit by such a shock, the aggregate consequences will be contained if the export portfolio is well
1 See Kenen, P., “The theory of optimum currency areas: an eclectic view”, in Mundell, R. and Swoboda, A. (eds.), Monetary problems of the international economy, Chicago University Press, 1969. For an overview of the related optimal currency area literature, see Mongelli, F.P., “‘New’ views on the optimum currency area theory: what is EMU telling us?”, Working Paper Series, No 138, ECB, Frankfurt am Main, April 2002.
Chart 10 breakdown of intra-euro area exports according to technological intensity in 2011(percentages)
0
10
20
30
40
50
60
70
80
90
100
0
10
20
30
40
50
60
70
80
90
100
resource-basedlowmediumhigh
intra-EA
GR FI PT LU IT ES AT BE NL FR DE IE
Sources: Eurostat and ECB calculations.Note: EA stands for euro area.
Chart 11 number of export linkages with euro area countries
2010 (euro area countries)2010 (non-euro area countries)1999 (all countries)
Sources: United Nations and ECB calculations.Notes: The chart shows the total number of export linkages with euro area countries. It covers goods only.
ECBMonthly Bulletin
January 2013 67
Intra-euro area trade linkages and external
adjustment
artiCleS
diversifi ed. Under such conditions, national business cycles will be highly synchronised and the countries forming a currency union will fi nd it less costly to give up the nominal exchange rate as a tool for the correction of external imbalances. Against this backdrop, this box takes a closer look at the sectoral structure of euro area exports and its evolution since the launch of the euro.
Cross-country similarity in export patterns
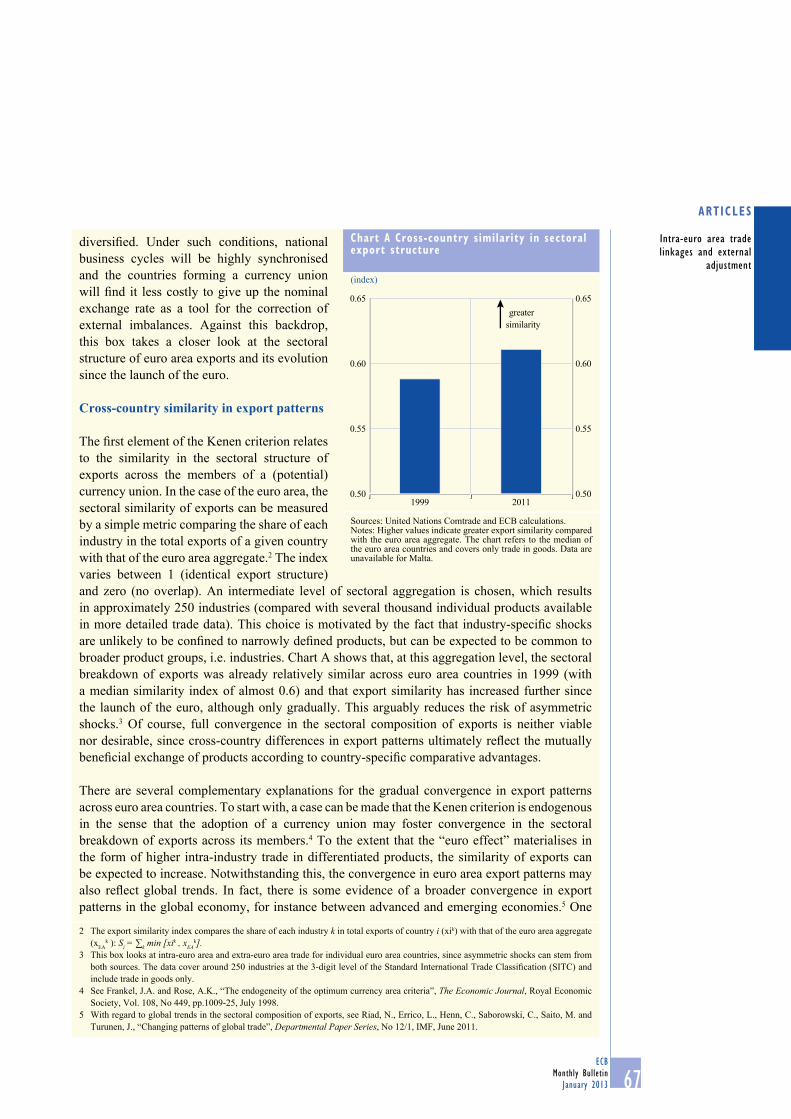
The fi rst element of the Kenen criterion relates to the similarity in the sectoral structure of exports across the members of a (potential) currency union. In the case of the euro area, the sectoral similarity of exports can be measured by a simple metric comparing the share of each industry in the total exports of a given country with that of the euro area aggregate.2 The index varies between 1 (identical export structure) and zero (no overlap). An intermediate level of sectoral aggregation is chosen, which results in approximately 250 industries (compared with several thousand individual products available in more detailed trade data). This choice is motivated by the fact that industry-specifi c shocks are unlikely to be confi ned to narrowly defi ned products, but can be expected to be common to broader product groups, i.e. industries. Chart A shows that, at this aggregation level, the sectoral breakdown of exports was already relatively similar across euro area countries in 1999 (with a median similarity index of almost 0.6) and that export similarity has increased further since the launch of the euro, although only gradually. This arguably reduces the risk of asymmetric shocks.3 Of course, full convergence in the sectoral composition of exports is neither viable nor desirable, since cross-country differences in export patterns ultimately refl ect the mutually benefi cial exchange of products according to country-specifi c comparative advantages.
There are several complementary explanations for the gradual convergence in export patterns across euro area countries. To start with, a case can be made that the Kenen criterion is endogenous in the sense that the adoption of a currency union may foster convergence in the sectoral breakdown of exports across its members.4 To the extent that the “euro effect” materialises in the form of higher intra-industry trade in differentiated products, the similarity of exports can be expected to increase. Notwithstanding this, the convergence in euro area export patterns may also refl ect global trends. In fact, there is some evidence of a broader convergence in export patterns in the global economy, for instance between advanced and emerging economies.5 One
2 The export similarity index compares the share of each industry k in total exports of country i (xik) with that of the euro area aggregate (xEA
k ): Si = ∑k min [xik , xEAk].
3 This box looks at intra-euro area and extra-euro area trade for individual euro area countries, since asymmetric shocks can stem from both sources. The data cover around 250 industries at the 3-digit level of the Standard International Trade Classifi cation (SITC) and include trade in goods only.
4 See Frankel, J.A. and Rose, A.K., “The endogeneity of the optimum currency area criteria”, The Economic Journal, Royal Economic Society, Vol. 108, No 449, pp.1009-25, July 1998.
5 With regard to global trends in the sectoral composition of exports, see Riad, N., Errico, L., Henn, C., Saborowski, C., Saito, M. and Turunen, J., “Changing patterns of global trade”, Departmental Paper Series, No 12/1, IMF, June 2011.
Chart a Cross-country similarity in sectoral export structure
(index)
0.50
0.55
0.60
0.65
0.50
0.55
0.60
0.65
1999 2011
greater similarity
Sources: United Nations Comtrade and ECB calculations.Notes: Higher values indicate greater export similarity compared with the euro area aggregate. The chart refers to the median of the euro area countries and covers only trade in goods. Data are unavailable for Malta.
ECBMonthly BulletinJanuary 201368
of the factors driving this convergence appears to have been the expansion of international supply chains over recent decades, which has often been associated with imports and (re-)exports of parts and components within the same industry.
Within-country export diversifi cation
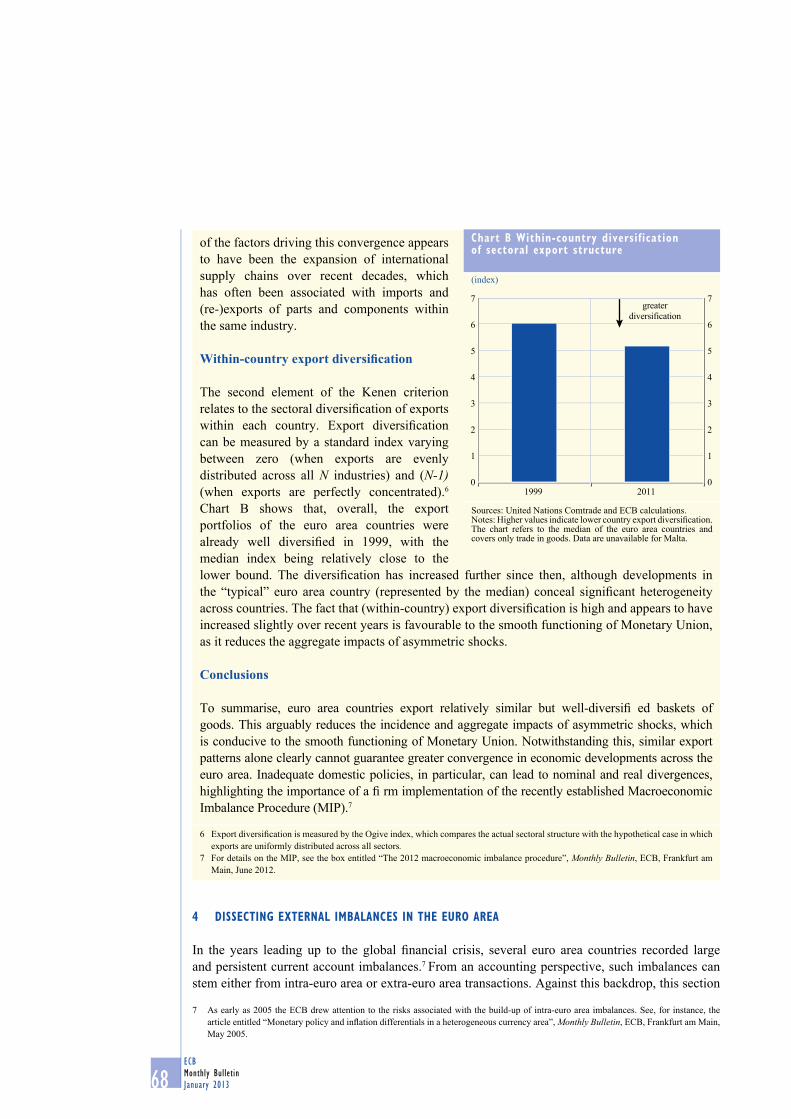
The second element of the Kenen criterion relates to the sectoral diversifi cation of exports within each country. Export diversifi cation can be measured by a standard index varying between zero (when exports are evenly distributed across all N industries) and (N-1) (when exports are perfectly concentrated).6 Chart B shows that, overall, the export portfolios of the euro area countries were already well diversifi ed in 1999, with the median index being relatively close to the lower bound. The diversifi cation has increased further since then, although developments in the “typical” euro area country (represented by the median) conceal signifi cant heterogeneity across countries. The fact that (within-country) export diversifi cation is high and appears to have increased slightly over recent years is favourable to the smooth functioning of Monetary Union, as it reduces the aggregate impacts of asymmetric shocks.
Conclusions
To summarise, euro area countries export relatively similar but well-diversifi ed baskets of goods. This arguably reduces the incidence and aggregate impacts of asymmetric shocks, which is conducive to the smooth functioning of Monetary Union. Notwithstanding this, similar export patterns alone clearly cannot guarantee greater convergence in economic developments across the euro area. Inadequate domestic policies, in particular, can lead to nominal and real divergences,
highlighting the importance of a fi rm implementation of the recently established Macroeconomic Imbalance Procedure (MIP).7
6 Export diversifi cation is measured by the Ogive index, which compares the actual sectoral structure with the hypothetical case in which exports are uniformly distributed across all sectors.
7 For details on the MIP, see the box entitled “The 2012 macroeconomic imbalance procedure”, Monthly Bulletin, ECB, Frankfurt am Main, June 2012.
Chart b within-country diversification of sectoral export structure
(index)
0
1
2
3
4
5
6
7
0
1
2
3
4
5
6
7
1999 2011
greaterdiversification
Sources: United Nations Comtrade and ECB calculations.Notes: Higher values indicate lower country export diversifi cation. The chart refers to the median of the euro area countries and covers only trade in goods. Data are unavailable for Malta.
4 diSSeCtinG eXternal imbalanCeS in the euro area
In the years leading up to the global fi nancial crisis, several euro area countries recorded large and persistent current account imbalances.7 From an accounting perspective, such imbalances can stem either from intra-euro area or extra-euro area transactions. Against this backdrop, this section
7 As early as 2005 the ECB drew attention to the risks associated with the build-up of intra-euro area imbalances. See, for instance, the article entitled “Monetary policy and infl ation differentials in a heterogeneous currency area”, Monthly Bulletin, ECB, Frankfurt am Main, May 2005.
ECBMonthly Bulletin
January 2013 69
Intra-euro area trade linkages and external
adjustment
artiCleS
dissects the current account balances of individual euro area countries into intra-euro area and extra-euro area components. In doing so, it sheds some light on the role of intra-euro area trade in the build-up of current account imbalances prior to the global financial crisis and in the abrupt correction of these imbalances in the wake of the crisis.
Some caveats should be kept in mind. First, intra-euro area current account balances should always be studied in combination with extra-euro area balances. In fact, an intra-euro area deficit can be offset by a surplus vis-à-vis the rest of the world. What ultimately matters for a country’s net external borrowing or lending is the overall current account balance. Second, the overall current account balance is determined by saving and investment decisions in the private and public sectors. Therefore, unbalanced intra-euro area trade should not be seen as having caused current account imbalances. Third, even large current account deficits and surpluses can, in principle, be the result of efficient market allocation, reflecting mutually beneficial resource exchanges between countries over time. For instance, a current account deficit may arise when a catching-up economy borrows today to finance investments that will pay off tomorrow.
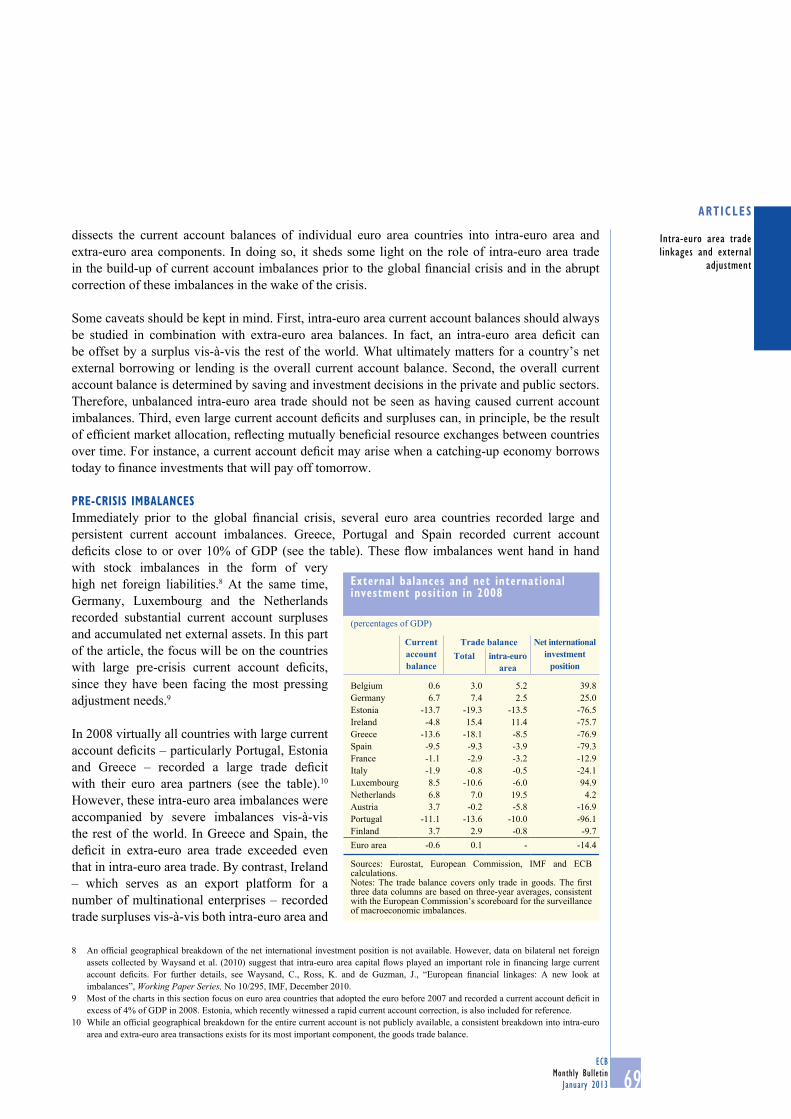
Pre-CriSiS imbalanCeSImmediately prior to the global financial crisis, several euro area countries recorded large and persistent current account imbalances. Greece, Portugal and Spain recorded current account deficits close to or over 10% of GDP (see the table). These flow imbalances went hand in hand with stock imbalances in the form of very high net foreign liabilities.8 At the same time, Germany, Luxembourg and the Netherlands recorded substantial current account surpluses and accumulated net external assets. In this part of the article, the focus will be on the countries with large pre-crisis current account deficits, since they have been facing the most pressing adjustment needs.9
In 2008 virtually all countries with large current account deficits – particularly Portugal, Estonia and Greece – recorded a large trade deficit with their euro area partners (see the table).10 However, these intra-euro area imbalances were accompanied by severe imbalances vis-à-vis the rest of the world. In Greece and Spain, the deficit in extra-euro area trade exceeded even that in intra-euro area trade. By contrast, Ireland – which serves as an export platform for a number of multinational enterprises – recorded trade surpluses vis-à-vis both intra-euro area and
8 An official geographical breakdown of the net international investment position is not available. However, data on bilateral net foreign assets collected by Waysand et al. (2010) suggest that intra-euro area capital flows played an important role in financing large current account deficits. For further details, see Waysand, C., Ross, K. and de Guzman, J., “European financial linkages: A new look at imbalances”, Working Paper Series, No 10/295, IMF, December 2010.
9 Most of the charts in this section focus on euro area countries that adopted the euro before 2007 and recorded a current account deficit in excess of 4% of GDP in 2008. Estonia, which recently witnessed a rapid current account correction, is also included for reference.
10 While an official geographical breakdown for the entire current account is not publicly available, a consistent breakdown into intra-euro area and extra-euro area transactions exists for its most important component, the goods trade balance.
external balances and net international investment position in 2008
Sources: Eurostat, European Commission, IMF and ECB calculations.Notes: The trade balance covers only trade in goods. The fi rst three data columns are based on three-year averages, consistent with the European Commission’s scoreboard for the surveillance of macroeconomic imbalances.
ECBMonthly BulletinJanuary 201370
extra-euro area partners (the pre-crisis current account defi cit in Ireland mainly refl ected a defi cit in the income account). Irrespective of their geographical breakdown, large pre-crisis current account defi cits ultimately refl ected more fundamental imbalances, such as large government defi cits, excessive net borrowing of the private sector amid debt-fuelled construction booms and broad-based losses in price competitiveness.
Interestingly, Germany’s large pre-crisis current account surplus was due predominantly to trade surpluses with non-euro area countries. Notwithstanding this, owing to the sheer size of the German economy, it was an important counterpart for the defi cits of some of the smaller euro area economies, together with the Netherlands.11
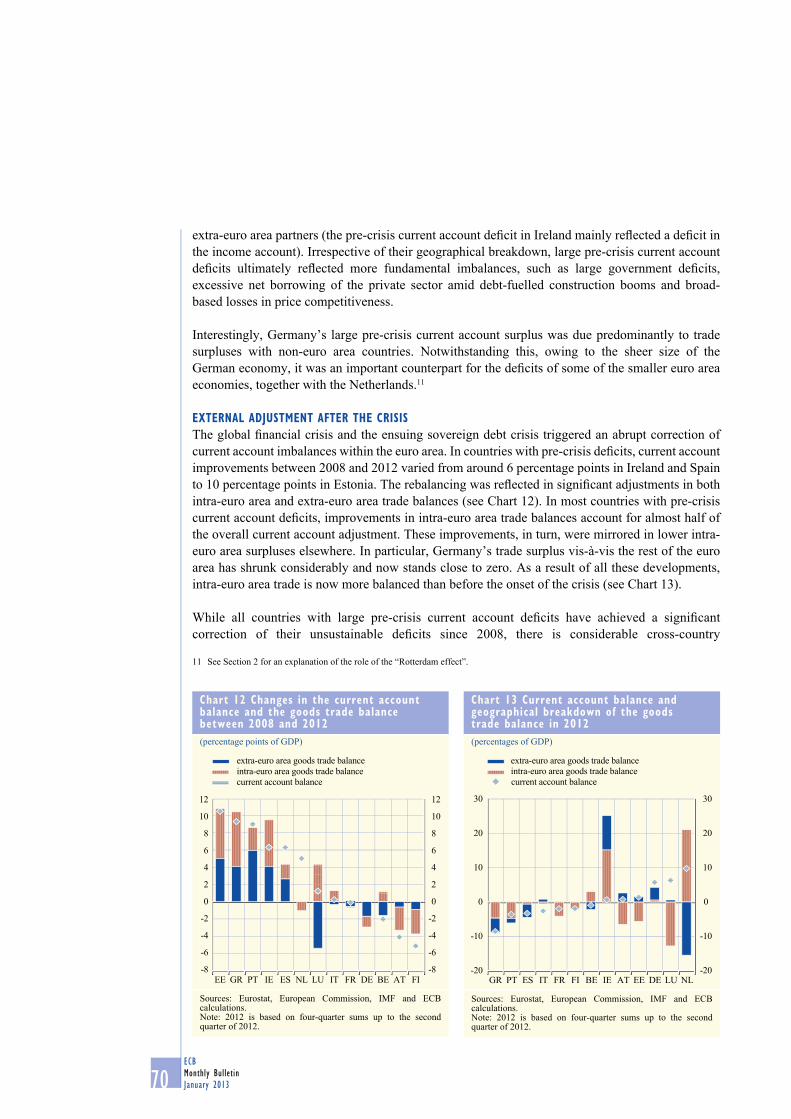
eXternal adjuStment aFter the CriSiSThe global fi nancial crisis and the ensuing sovereign debt crisis triggered an abrupt correction of current account imbalances within the euro area. In countries with pre-crisis defi cits, current account improvements between 2008 and 2012 varied from around 6 percentage points in Ireland and Spain to 10 percentage points in Estonia. The rebalancing was refl ected in signifi cant adjustments in both intra-euro area and extra-euro area trade balances (see Chart 12). In most countries with pre-crisis current account defi cits, improvements in intra-euro area trade balances account for almost half of the overall current account adjustment. These improvements, in turn, were mirrored in lower intra-euro area surpluses elsewhere. In particular, Germany’s trade surplus vis-à-vis the rest of the euro area has shrunk considerably and now stands close to zero. As a result of all these developments, intra-euro area trade is now more balanced than before the onset of the crisis (see Chart 13).
While all countries with large pre-crisis current account defi cits have achieved a signifi cant correction of their unsustainable defi cits since 2008, there is considerable cross-country
11 See Section 2 for an explanation of the role of the “Rotterdam effect”.
Chart 12 Changes in the current account balance and the goods trade balance between 2008 and 2012(percentage points of GDP)
-8
-6
-4
-2
0
2
4
6
8
10
12
-8
-6
-4
-2
0
2
4
6
8
10
12
EE GR PT IE ES NL LU IT FR DE BE AT FI
extra-euro area goods trade balanceintra-euro area goods trade balancecurrent account balance
Sources: Eurostat, European Commission, IMF and ECB calculations.Note: 2012 is based on four-quarter sums up to the second quarter of 2012.
Chart 13 Current account balance and geographical breakdown of the goods trade balance in 2012(percentages of GDP)
-20
-10
0
10
20
30
-20
-10
0
10
20
30
GR PT ES IT FR FI BE IE AT EE DE LU NL
extra-euro area goods trade balanceintra-euro area goods trade balancecurrent account balance
Sources: Eurostat, European Commission, IMF and ECB calculations.Note: 2012 is based on four-quarter sums up to the second quarter of 2012.
ECBMonthly Bulletin
January 2013 71
Intra-euro area trade linkages and external
adjustment
artiCleS
heterogeneity with regard to the driving forces and timing of the adjustment. To start with, the degree to which the rebalancing was due to a slump in imports rather than an increase in exports varies considerably. In Portugal and Greece, the contraction in import values was clearly the main factor behind the shrink in trade defi cits between 2008 and 2012 (see Chart 14), although both countries experienced improvements in export performance towards the end of this period. By comparison, the expansion in exports had a more signifi cant impact on the current account balances of Ireland and Spain. In all countries with large pre-crisis current account defi cits, exports to the euro area were less dynamic than exports to the rest of the world, refl ecting the weak underlying growth momentum in the euro area. This is particularly relevant for countries with a high share of intra-euro area trade (see Section 2). As regards the timing of the external adjustment, some countries, particularly Estonia, experienced a very forceful correction early on in the crisis, but saw a slowdown in the pace of the current account adjustment thereafter (see Chart 15). In Portugal the adjustment started sluggishly, but gained momentum signifi cantly in 2011-12. The adjustment in the remaining countries with large pre-crisis current account defi cits was somewhere between that in Estonia and Portugal. The following subsection looks at some of the factors explaining the heterogeneity in the adjustments paths.
what iS driVinG the CorreCtion oF the imbalanCeS?Standard macroeconomic models suggest that external imbalances can be corrected in two ways: through expenditure switching or expenditure shifting. Expenditure switching refers to instruments affecting the attractiveness of domestic products over foreign products, such as changes in the nominal exchange rate, moderation in domestic prices and wages or improvements in non-price competitiveness. By contrast, expenditure shifting relates to changes in the level of aggregate demand in the domestic economy (rather than its composition) relative to that abroad. Of course, the two adjustment mechanisms can reinforce each other.
Chart 14 breakdown of the change in the trade balance between 2008 and 2012
(percentage points of GDP)
-5
0
5
10
15
-5
0
5
10
15
ESPTIEGREE
intra-euro area exportsextra-euro area exportsintra-euro area imports (inverted)extra-euro area imports (inverted)
Sources: Eurostat, European Commission, IMF and ECB calculations.Notes: The chart covers trade in goods only. 2012 is based on four-quarter sums up to the latest available quarter.
Chart 15 timing of the current account adjustment
(change in percentage points of GDP)
-5
0
5
10
15
-5
0
5
10
15
PTESGRIEEE
2009-20102011-20121)
Sources: Eurostat, European Commission and ECB calculations.1) 2012 is based on four-quarter sums up to the latest available quarter.
ECBMonthly BulletinJanuary 201372
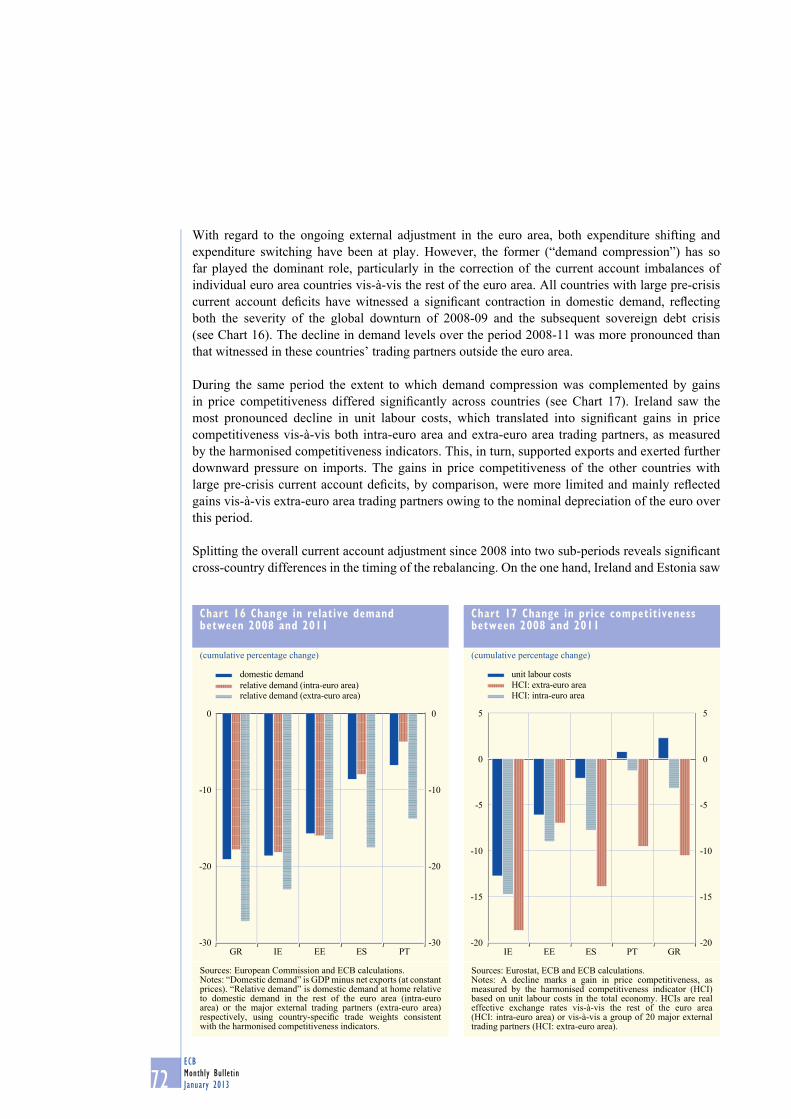
With regard to the ongoing external adjustment in the euro area, both expenditure shifting and expenditure switching have been at play. However, the former (“demand compression”) has so far played the dominant role, particularly in the correction of the current account imbalances of individual euro area countries vis-à-vis the rest of the euro area. All countries with large pre-crisis current account defi cits have witnessed a signifi cant contraction in domestic demand, refl ecting both the severity of the global downturn of 2008-09 and the subsequent sovereign debt crisis (see Chart 16). The decline in demand levels over the period 2008-11 was more pronounced than that witnessed in these countries’ trading partners outside the euro area.
During the same period the extent to which demand compression was complemented by gains in price competitiveness differed signifi cantly across countries (see Chart 17). Ireland saw the most pronounced decline in unit labour costs, which translated into signifi cant gains in price competitiveness vis-à-vis both intra-euro area and extra-euro area trading partners, as measured by the harmonised competitiveness indicators. This, in turn, supported exports and exerted further downward pressure on imports. The gains in price competitiveness of the other countries with large pre-crisis current account defi cits, by comparison, were more limited and mainly refl ected gains vis-à-vis extra-euro area trading partners owing to the nominal depreciation of the euro over this period.
Splitting the overall current account adjustment since 2008 into two sub-periods reveals signifi cant cross-country differences in the timing of the rebalancing. On the one hand, Ireland and Estonia saw
Chart 16 Change in relative demand between 2008 and 2011
Sources: European Commission and ECB calculations.Notes: “Domestic demand” is GDP minus net exports (at constant prices). “Relative demand” is domestic demand at home relative to domestic demand in the rest of the euro area (intra-euro area) or the major external trading partners (extra-euro area) respectively, using country-specifi c trade weights consistent with the harmonised competitiveness indicators.
Chart 17 Change in price competitiveness between 2008 and 2011
(cumulative percentage change)
-20
-10
0
5
-20
-10
-15 -15
0
-5 -5
5
GRPTESEEIE
unit labour costs
HCI: intra-euro areaHCI: extra-euro area
Sources: Eurostat, ECB and ECB calculations.Notes: A decline marks a gain in price competitiveness, as measured by the harmonised competitiveness indicator (HCI) based on unit labour costs in the total economy. HCIs are real effective exchange rates vis-à-vis the rest of the euro area (HCI: intra-euro area) or vis-à-vis a group of 20 major external trading partners (HCI: extra-euro area).
ECBMonthly Bulletin
January 2013 73
Intra-euro area trade linkages and external
adjustment
artiCleS
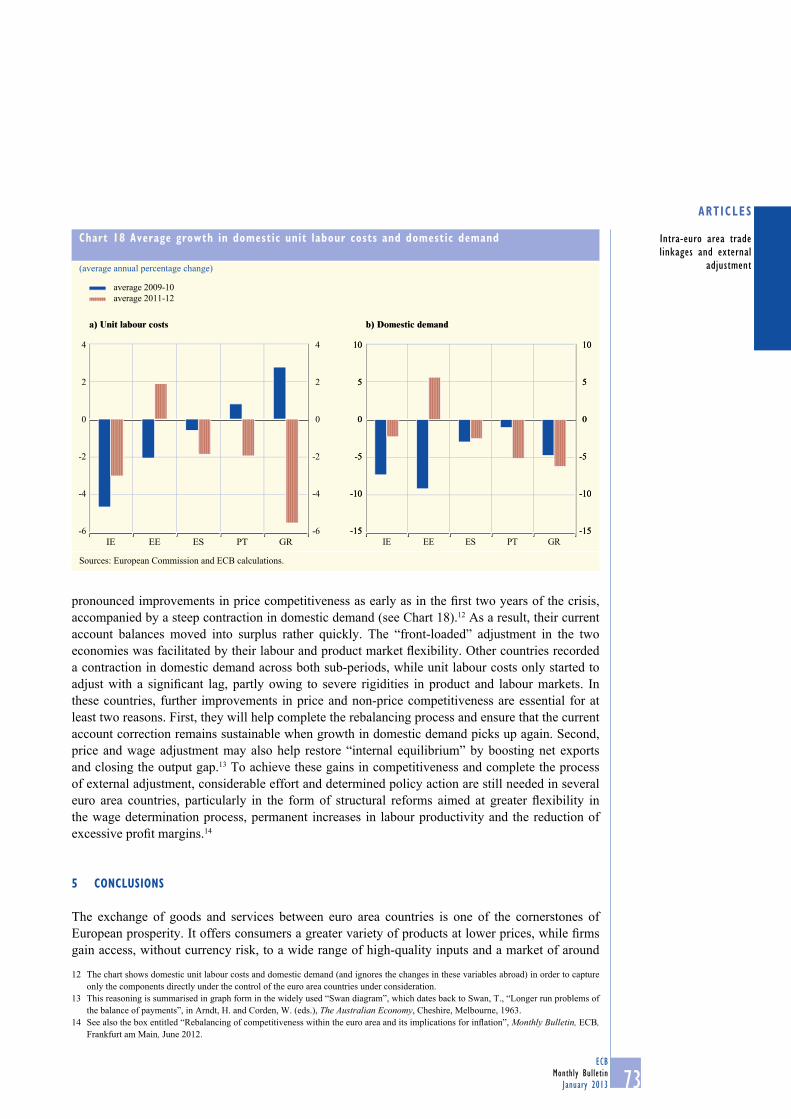
pronounced improvements in price competitiveness as early as in the fi rst two years of the crisis, accompanied by a steep contraction in domestic demand (see Chart 18).12 As a result, their current account balances moved into surplus rather quickly. The “front-loaded” adjustment in the two economies was facilitated by their labour and product market fl exibility. Other countries recorded a contraction in domestic demand across both sub-periods, while unit labour costs only started to adjust with a signifi cant lag, partly owing to severe rigidities in product and labour markets. In these countries, further improvements in price and non-price competitiveness are essential for at least two reasons. First, they will help complete the rebalancing process and ensure that the current account correction remains sustainable when growth in domestic demand picks up again. Second, price and wage adjustment may also help restore “internal equilibrium” by boosting net exports and closing the output gap.13 To achieve these gains in competitiveness and complete the process of external adjustment, considerable effort and determined policy action are still needed in several euro area countries, particularly in the form of structural reforms aimed at greater fl exibility in the wage determination process, permanent increases in labour productivity and the reduction of excessive profi t margins.14
5 ConCluSionS
The exchange of goods and services between euro area countries is one of the cornerstones of European prosperity. It offers consumers a greater variety of products at lower prices, while fi rms gain access, without currency risk, to a wide range of high-quality inputs and a market of around
12 The chart shows domestic unit labour costs and domestic demand (and ignores the changes in these variables abroad) in order to capture only the components directly under the control of the euro area countries under consideration.
13 This reasoning is summarised in graph form in the widely used “Swan diagram”, which dates back to Swan, T., “Longer run problems of the balance of payments”, in Arndt, H. and Corden, W. (eds.), The Australian Economy, Cheshire, Melbourne, 1963.
14 See also the box entitled “Rebalancing of competitiveness within the euro area and its implications for infl ation”, Monthly Bulletin, ECB, Frankfurt am Main, June 2012.
Chart 18 average growth in domestic unit labour costs and domestic demand
(average annual percentage change)
-6
-2
-4
4
2
0
-6
-2
-4
4
2
0
GRPTESEEIE
average 2009-10average 2011-12
a) Unit labour costs b) Domestic demand
-6
-2
-4
4
2
0
-6
-2
-4
4
2
0
GRPTESEEIE
average 2009-10average 2011-12
-15-15
-10-10
-5-5
55
1010
00
-15-15
-10-10
-5-5
55
1010
00
IE EE ES PT GR
Sources: European Commission and ECB calculations.
ECBMonthly BulletinJanuary 201374
332 million people. Since the launch of the euro, trade within the single currency area has increased tremendously, also relative to euro area GDP. While euro area trade with the rest of the world has been even more dynamic over this period, around half of all euro area trade takes place among euro area partners. Moreover, there is robust empirical evidence that the euro has a positive effect on euro area trade once confounding factors, such as the increasing economic weight of emerging economies, are taken into account.
The large and persistent current account imbalances recorded in some euro area countries in the years leading up to the global financial crisis generally reflected deficits vis-à-vis both intra-euro area and extra-euro area partners and were driven by divergences in price competitiveness and demand developments. There has been significant progress in the correction of the pre-crisis current account deficits over the past few years and this has been reflected in shrinking deficits vis-à-vis both intra-euro area and extra-euro area trading partners. However, greater efforts and determined policy action are still needed in several euro area countries to complete the rebalancing process and ensure its sustainability, particularly through further improvements in price and non-price competitiveness. In addition, structural reforms aimed at greater flexibility in labour and product markets are essential in many euro area countries to facilitate external rebalancing within the euro area, now and in the future.