322

Published by National University of Educational Planning and Administration, New Delhi on behalf of Department of School Education andLiteracy, Ministry of Human Resource Development, Government of India.
2007
PROJECT TEAMThis publication is the outcome of the collaborative activities of the Department of School Education and Literacy, MHRD, National Universityof Educational Planning and Administration (NUEPA), MIS Unit at the Technical Support Group and State and District level MIS Units. The keyofficials involved in the collection and implementation of the DISE activities are as under:
State EMIS Unit In-charges
State/Union Territory MIS In-charge E-mailArunachal Pradesh Mr. R. N. Shah -Andaman & Nicobar Islands Mr. C. Nachippel -Andhra Pradesh Mr. N. Narayana Reddy [email protected] Mr. Rajarshee Saikia [email protected] Mr. Deepak Tiwary [email protected] Chandigarh Mr. Ashwani Baghel [email protected] Mr. Deepak Dubey [email protected] & Nagar Haveli State Project Director -Daman and Diu State Project Director -Delhi Mr. Ashok Kumar [email protected] Mr. Deepak Chauhan [email protected] Mr. N. G. Honnekeri [email protected] Mr. Randeep Singh [email protected] Pradesh Mr. Satish Kaushal [email protected] & Kashmir Ms. Sunita Fotedar [email protected] Mr. Sachin Kumar [email protected] Mr. Hassan -Karnataka Mr. N. Prabhakar [email protected] Mr. Franklin Jose [email protected] Pradesh Mr. Deepak Verma [email protected] Mr. Unmesh Girgaonkar [email protected] State Project Director -Meghalaya Mr. S. R. Jyrwa [email protected] Mr. Lalzarzova Khiangte mz.ssa.nic.inNagaland Mr. I Akum Aier [email protected] Orissa Mr.Prabhat Mishra [email protected] Mr. Tamil Mani -Punjab Mr. Rajvir [email protected] Mr. Sunil Giri [email protected] Mr Ajay Gupta [email protected] Nadu Mr. N. Murugesan [email protected] Mr. Subir Roy Chaudhury [email protected] Pradesh Mr. Rajiv Mehra [email protected] Mr Mukesh Dhyani [email protected] Bengal Mr Anirban De [email protected]
Ministry of Human Resource Development (MHRD), New Delhi
Ms. Vrinda Sarup, Joint Secretary, Department of Elementary Education & Literacy, MHRD, New DelhiMs. Neelam Rao, Director, Department of Elementary Education & Literacy, MHRD, New Delhi
Technical Support Group (Educational Consultants India Limited), New Delhi
Shri M.K. Talukdar, Chief Consultant, MIS
NUEPA, New DelhiDr. Arun C. Mehta, Professor, Department of Educational Management Information System (EMIS)Shri Naveen Bhatia, Computer ProgrammerShri Shalender Sharma, Project Associate FellowShri S. A. Siddiqui, Project AssistantMs. Alka Mishra, Project Assistant
Contact information: [email protected]: http://www.dpepmis.org
http://www.schoolreportcards.inhttp://www.nuepa.org
Software Development Supported by UNICEF, Delhi
Design, Layout and PrintingBrijbasi Art Press Limited, B-15, Sector – 5, NOIDA – 201301 (Uttar Pradesh)Phone: 0120-3090582, Fax: 011-2420556, E-mail: [email protected]
FOREWORD
Development of a sound information system is critical for successful monitoring and implementationof any programme, particularly in social sectors. The designing of a school information system was,therefore, accorded priority from the very beginning of the District Primary Education Programme(DPEP) in 1994, as a result of which the District Information System for Education (DISE) was developedby the National University of Educational Planning and Administration (NUEPA).
Importance of an Educational Management Information System (EMIS) was reiterated when SarvaShiksha Abhiyan (SSA) was launched in 2001. SSA guidelines envisage development of a community-owned and transparent EMIS, and preparatory activities of the programme included substantialstrengthening of MIS infrastructure in the States and UTs of the country.
I am happy to note that all the States & UTs of the country have now adopted DISE. The presentvolumes present the District Report Cards (Volume I & II) on more than four hundred variables for theyear 2005-06. Most of the indicators are presented according to school category. I am confident that inaddition to School Report Cards launched recently, information presented in these volumes would bevaluable for implementing educational programmes like SSA in the decentralized context. I am surethat this set of data will be used in planning for good quality elementary education at different levels,and that data users, researchers and development planners interested in the Indian education system willfind these volumes useful.
I must take this opportunity to thank UNICEF, Delhi, for consistently supporting EMIS activities since1994, as well as NUEPA, especially Prof. Arun C. Mehta and his team, for bringing out the presentpublication.
(Champak Chatterji)
paid pVthZlfpo
CHAMPAK CHATTERJISECRETARY
Hkkjr ljdkjekuo lalk/ku fodkl ea=ky;Ldwy f’k{kk vkSj lk{kjrk foHkkx
ubZ fnYyh & 110 001Government of India
Ministry of Human Resource DevelopmentDepartment of School Education & Literacy
124 ‘C’ Wing, Shastri Bhavan, New Delhi-110 001Tel.: 23382587, 23381104, Fax: 23387859
E-mail: [email protected]
From the Vice-Chancellor’s Desk
In view of the limitations in the Educational Management Information System in the country, at the time of thelaunch of the District Primary Education Programme (DPEP) in 1994-95, it was realised that there is a need todevelop a computerised information system with school as the basic unit of data collection and district, the unitof data dissemination. The responsibility to develop such an information system was assigned to NUEPA. I amhappy to note that the process that was initiated in 42 districts across 7 DPEP phase-one states in 1994-95 hasnow been expanded to the entire country. I am told that as many as 1.12 million schools/sections impartingprimary and upper primary level of education across 604 districts spread over all the 35 States and UnionTerritories of the country have now been covered under DISE. Comprehensive information on all aspects ofuniversalisation of elementary education is being collected every year which is made available at school, cluster,block, district, state and national level.
The National University firmly believes that without utilisation of statistics, it is not possible to improve thequality and reliability of the data. Besides strong dissemination policy that NUEPA has adapted, mandatoryrandom checking of data by independent agencies (made effective from 2006 onwards) would also play asignificant role in this direction. NUEPA would continue to make concerted efforts to further improve the qualityof data.
Besides launching of one million plus School Report Cards, we have been bringing out significant publicationsdisseminating data on elementary education in the form of District and State Report Cards, as well as, Progresstowards UEE: Analytical Reports and Elementary Education in the Rural and Urban India. We have recentlybrought out a new annual publication namely, DISE Flash Statistics: 2005-06, Elementary Education in Indiawhich also presents an Educational Development Index (EDI). I am confident that ranking of states based onEDI will be helpful in directing future course of investment on elementary education in the country.
In continuation of our series of publications based on the DISE data, it pleases me to present the ElementaryEducation in India: Where Do We Stand: District Report Cards (Volume I & II), which is based upon the DISE2005-06 data. These volumes contain a large number of indicators encompassing different aspects ofuniversalisation of primary and elementary education which are very rich in contents. In addition, we are alsogoing to release shortly the State Report Cards as well as Analytical Report for the year 2005-06.
I hope that the researchers, policy makers, administrators, planners and other data-users will find the publicationuseful. I thank the DISE team led by Prof. Arun C. Mehta for bringing out this publication which is of greatsignificance.
(Ved Prakash)New DelhiApril, 2007
jk"Vªh; 'kSf{kd ;kstuk ,oa iz'kklu fo'ofo|ky;¼Hkkjr ljdkj }kjk fo'ofo|ky; vuqnku vk;ksx ds vf/kfu;e 1956 dh Ìkjk 3 ds varxZr ?kksfÔr½
17&ch] Jh vjfoan ekxZ] ubZ fnYyh & 110016
National University of Educational Planning and Administration(Declared by the Govt. of India under Section 3 of the UGC Act, 1956)
17-B, Sri Aurobindo Marg, New Delhi-110016Tel.: Off.: 26515472, 26853038
Fax : 91-011-26861882 E-mail : [email protected] Website www.nuepa.orgProf. Ved Prakash
Vice-Chancellor

For the last several years, NUEPA has been actively involved in strengthening of the Educational ManagementInformation System (EMIS) in the country. The year 2005-06 District Elementary Education Report Cardsare based on the data received from all the districts of the country. The study of this magnitude cannot becompleted without the active involvement and participation of the EMIS professionals at the national andsub-national levels. The state level MIS Coordinators, district level Programmers & Data Entry Operators,and BRC & CRC Coordinators worked for long hours to make sure that the data becomes available at theright time.
Shri Champak Chatterji, Secretary in the Department of School Education and Literacy, MHRD and histeam has always been a source of great inspiration. In particular, I am thankful to Ms Vrinda Sarup, JointSecretary and Ms. Neelam Rao, Director for playing crucial role in facilitating the implementation of DISEin various states.
I take this opportunity to thank UNICEF, Delhi, in particular Mr. Samphe Lhalungpa, Chief (EducationSection) for consistently supporting EMIS activities ever since the inception of DISE.
I am thankful to Prof Ved Prakash, Vice-Chancellor, NUEPA, for his encouragement and support. I am alsothankful to my faculty colleagues for their consistent support.
I am also thankful to Shri M. K. Talukdar, Chief Consultant (MIS), Technical Support Group, for providingprofessional support to states.
Special thanks are due to Shri Shalender Sharma, Project Associate Fellow, for facilitating the preparationand design of District Report Cards. The contribution of Shri Naveen Bhatia, Computer Programmer, indatabase management & software development is gratefully acknowledged.
I am also thankful to Shri S. A. Siddiqui and Ms Alka Mishra for their efficient assistance and colleagues inthe publication unit, especially Shri Pramod Rawat, Deputy Publication Officer, for timely bringing out thepublication.
More comprehensive data on elementary education will be available soon through our forthcomingpublications based on the DISE 2005-06 data.
Suggestions for improvement are most welcome.
Arun C. [email protected]
Avg : AverageBRC : Block Resource CenterCDR : Compact Disk ROMCR : Completion RateCRC : Cluster Resource CenterDISE : District Information System for EducationDOR : Drop out RateDPEP : District Primary Education ProgrammeDRC : District Report CardsEMIS : Educational Management Information SystemGER : Gross Enrolment RatioGovt. : GovernmentGPI : Gender Parity IndexM. Phil : Master of PhilosophyNER : Net Enrolment RatioNo. : NumberNo Res : No Response
OBC : Other Backward Classes P + Sec./Hs. : Primary with Upper Primary & Secondary/Higher SecondaryP + UP : Primary with Upper PrimaryP. only : Primary onlyPop. : PopulationPR : Promotion RatePr./Prim. : PrimaryPTR : Pupil Teacher RatioPvt. : PrivateRR : Repetition RateRecd : ReceivedSC : Scheduled CastesSCR : Student Classroom RatioSDG : School Development GrantSec. : SecondarySRC : State Report CardsSSA : Sarva Shiksha AbhiyanST : Scheduled TribesU. Prim./U.P : Upper PrimaryU.P. Only : Upper Primary onlyUP + Sec : Upper Primary with Secondary/Higher SecondaryTch : TeachersTLM Grant : Teaching Learning Material GrantTR : Transition Rate
ix
Contents
Foreword iii
From the Vice-Chancellor's Desk v
Acknowledgements vii
Abbreviations ix
Report Cards: An Overview xvii
Volume I: District Report Cards
ANDAMAN & NICOBAR ISLANDS
Andamans 1
Nicobars 2
ANDHRA PRADESH
Adilabad 3
Anantapur 4
Chittoor 5
Cuddapah 6
East Godavari 7
Guntur 8
Hyderabad 9
Karimnagar 10
Khammam 11
Krishna 12
Kurnool 13
Mahbubnagar 14
Medak 15
Nalgonda 16
Nellore 17
Nizamabad 18
Prakasam 19
Rangareddi 20
Srikakulam 21
Visakhapatnam 22
Vizianagaram 23
Warangal 24
West Godavari 25
ARUNACHAL PRADESH
Changlang 26
Dibang Valley 27
East Kameng 28
East Siang 29
Kurung Kumey 30
Lohit 31
Lower Dibang Valley 32
Lower Subansiri 33
Papum Pare 34
Tawang 35
Tirap 36
Upper Siang 37
Upper Subansiri 38
West Kameng 39
West Siang 40
ASSAM
Barpeta 41
Bongaigaon 42
Cachar 43
Darrang 44
Dhemaji 45
Dhubri 46
Dibrugarh 47
Goalpara 48
Golaghat 49
Hailakandi 50
Jorhat 51
Kamrup 52
Karbi Anglong 53
Karimganj 54
Kokrajhar 55
Lakhimpur 56
Marigaon 57
Nagaon 58
Nalbari 59
North Cachar Hills 60
Sibsagar 61
Sonitpur 62
Tinsukia 63
BIHAR
Araria 64
Aurangabad 65
Banka 66
Begusarai 67
Bhagalpur 68
Bhojpur 69
Buxar 70
Darbhanga 71
Gaya 72
Gopalganj 73
Jamui 74
Jehanabad 75
Kaimur (Bhabua) 76
Katihar 77
Khagaria 78

Kishanganj 79
Lakhisarai 80
Madhepura 81
Madhubani 82
Munger 83
Muzaffarpur 84
Nalanda 85
Nawada 86
Pashchim Champaran 87
Patna 88
Purba Champaran 89
Purnia 90
Rohtas 91
Saharsa 92
Samastipur 93
Saran 94
Sheikhpura 95
Sheohar 96
Sitamarhi 97
Siwan 98
Supaul 99
Vaishali 100
CHANDIGARH
Chandigarh (U.T.) 101
CHHATTISGARH
Baster 102
Bilaspur 103
Dantewada 104
Dhamtari 105
Durg 106
Janjgir - Champa 107
Jashpur 108
Kanker 109
Kawardha 110
Korba 111
Koriya 112
Mahasamund 113
Raigarh 114
Raipur 115
Rajnandgaon 116
Surguja 117
DADRA & NAGAR HAVELI
Silvassa 118
DAMAN & DIU
Daman 119
Diu 120
DELHI
Central Delhi 121
East Delhi 122
New Delhi 123
North Delhi 124
North East Delhi 125
North West Delhi 126
South Delhi 127
South West Delhi 128
West Delhi 129
GOA
North Goa 130
South Goa 131
GUJARAT
Ahmadabad 132
Amreli 133
Anand 134
Banas Kantha 135
Bharuch 136
Bhavnagar 137
Dohad 138
Gandhinagar 139
Jamnagar 140
Junagadh 141
Kachchh 142
Kheda 143
Mahesana 144
Narmada 145
Navsari 146
Panch Mahals 147
Patan 148
Porbandar 149
Rajkot 150
Sabar Kantha 151
Surat 152
Surendranagar 153
The Dangs 154
Vadodara 155
Valsad 156
HARYANA
Ambala 157
Bhiwani 158
Faridabad 159
Fatehabad 160
Gurgaon 161
Contents

Hisar 162
Jhajjar 163
Jind 164
Kaithal 165
Karnal 166
Kurukshetra 167
Mahendragarh 168
Panchkula 169
Panipat 170
Rewari 171
Rohtak 172
Sirsa 173
Sonipat 174
Yamunanagar 175
HIMACHAL PRADESH
Bilaspur 176
Chamba 177
Hamirpur 178
Kangra 179
Kinnaur 180
Kullu 181
Lahul & Spiti 182
Mandi 183
Shimla 184
Sirmaur 185
Solan 186
Una 187
JAMMU & KASHMIR
Anantnag 188
Badgam 189
Baramula 190
Doda 191
Jammu 192
Kargil 193
Kathua 194
Kupwara 195
Leh (Ladakh) 196
Pulwama 197
Punch 198
Rajauri 199
Srinagar 200
Udhampur 201
JHARKHAND
Bokaro 202
Chatra 203
Deoghar 204
Dhanbad 205
Dumka 206
Garhwa 207
Giridih 208
Godda 209
Gumla 210
Hazaribag 211
Jamtara 212
Kodarma 213
Latehar 214
Lohardaga 215
Pakaur 216
Palamu 217
Pashchimi Singhbhum 218
Purbi Singhbhum 219
Ranchi 220
Sahibganj 221
Saraikela-kharsawan 222
Simdega 223
KARNATAKA
Bagalkot 224
Bangalore 225
Bangalore Rural 226
Belgaum 227
Bellary 228
Bidar 229
Bijapur 230
Chamrajnagar 231
Chikmagalur 232
Chitradurga 233
Dakshina Kannada 234
Davangere 235
Dharwad 236
Gadag 237
Gulbarga 238
Hassan 239
Haveri 240
Kodagu 241
Kolar 242
Koppal 243
Mandya 244
Mysore 245
Raichur 246
Shimoga 247
Tumkur 248
Udupi 249
Uttara Kannada 250
KERALA
Alappuzha 251
Contents
Ernakulam 252
Idukki 253
Kannur 254
Kasaragod 255
Kollam 256
Kottayam 257
Kozhikode 258
Malappuram 259
Palakkad 260
Pathanamthitta 261
Thiruvananthapuram 262
Thrissur 263
Wayanad 264
LAKSHADWEEP
Lakshadweep 265
MADHYA PRADESH
Anup Pur 266
Ashok Nagar 267
Balaghat 268
Barwani 269
Betul 270
Bhind 271
Bhopal 272
Burhanpur 273
Chhatarpur 274
Chhindwara 275
Damoh 276
Datia 277
Dewas 278
Dhar 279
Dindori 280
Guna 281
Gwalior 282
Harda 283
Hoshangabad 284
Indore 285
Jabalpur 286
Jhabua 287
Katni 288
Khandwa 289
Khargone 290
Mandla 291
Mandsaur 292
Morena 293
Narsinghpur 294
Neemuch 295
Panna 296
Raisen 297
Rajgarh 298
Ratlam 299
Rewa 300
Sagar 301
Satna 302
Sehore 303
Seoni 304
Shahdol 305
Shajapur 306
Sheopur 307
Shivpuri 308
Sidhi 309
Tikamgarh 310
Ujjain 311
Umaria 312
Vidisha 313
Volume II: District Report Cards
MAHARASHTRA
Ahmadnagar 315
Akola 316
Amravati 317
Aurangabad 318
Bhandara 319
Bid 320
Buldana 321
Chandrapur 322
Dhule 323
Gadchiroli 324
Gondiya 325
Hingoli 326
Jalgaon 327
Jalna 328
Kolhapur 329
Latur 330
Mumbai 331
Mumbai (Suburban) 332
Nagpur 333
Nanded 334
Nandurbar 335
Nashik 336
Osmanabad 337
Parbhani 338
Pune 339
Raigarh 340
Ratnagiri 341
Sangli 342
Satara 343
Sindhudurg 344
Solapur 345
Contents
Thane 346
Wardha 347
Washim 348
Yavatmal 349
MANIPUR
Bishnupur 350
Chandel 351
Churachandpur 352
Imphal East 353
Imphal West 354
Senapati 355
Tamenglong 356
Thoubal 357
Ukhrul 358
MEGHALAYA
East Garo Hills 359
East Khasi Hills 360
Jaintia Hills 361
Ri Bhoi 362
South Garo Hills 363
West Garo Hills 364
West Khasi Hills 365
MIZORAM
Aizawl 366
Champhai 367
Kolasib 368
Lawngtlai 369
Lunglei 370
Mamit 371
Saiha 372
Serchhip 373
NAGALAND
Dimapur 374
Kohima 375
Mokokchung 376
Mon 377
Phek 378
Tuensang 379
Wokha 380
Zunheboto 381
ORISSA
Angul 382
Balasore 383
Bargarh 384
Bhadrak 385
Bolangir 386
Boudh 387
Cuttack 388
Deogarh 389
Dhenkanal 390
Gajapati 391
Ganjam 392
Jagatsinghpur 393
Jajpur 394
Jharsuguda 395
Kalahandi 396
Kandhamal 397
Kendrapara 398
Keonjhar 399
Khordha 400
Koraput 401
Malkangiri 402
Mayurbhanj 403
Nawarangapur 404
Nayagarh 405
Nuapada 406
Puri 407
Rayagada 408
Sambalpur 409
Sonepur 410
Sundargarh 411
PUDUCHERRY
Karaikal 412
Mahe 413
Puducherry (District) 414
Yanam 415
PUNJAB
Amritsar 416
Bathinda 417
Faridkot 418
Fatehgarh Sahib 419
Ferozepur 420
Gurdaspur 421
Hoshiarpur 422
Jalandhar 423
Kapurthala 424
Ludhiana 425
Mansa 426
Moga 427
Muktsar 428
Contents
Nawanshahr 429
Patiala 430
Ropar 431
Sangrur 432
RAJASTHAN
Ajmer 433
Alwar 434
Banswara 435
Baran 436
Barmer 437
Bharatpur 438
Bhilwara 439
Bikaner 440
Bundi 441
Chittaurgarh 442
Churu 443
Dausa 444
Dhaulpur 445
Dungarpur 446
Ganganagar 447
Hanumangarh 448
Jaipur 449
Jaisalmer 450
Jalor 451
Jhalawar 452
Jhunjhunun 453
Jodhpur 454
Karauli 455
Kota 456
Nagaur 457
Pali 458
Rajsamand 459
Sawai Madhopur 460
Sikar 461
Sirohi 462
Tonk 463
Udaipur 464
SIKKIM
East Sikkim 465
North Sikkim 466
South Sikkim 467
West Sikkim 468
TAMIL NADU
Chennai 469
Coimbatore 470
Cuddalore 471
Dharmapuri 472
Dindigul 473
Erode 474
Kancheepuram 475
Kanniyakumari 476
Karur 477
Krishanagiri 478
Madurai 479
Nagapattinam 480
Namakkal 481
Perambalur 482
Pudukkottai 483
Ramanathapuram 484
Salem 485
Sivaganga 486
Thanjavur 487
The Nilgiris 488
Theni 489
Thiruvallur 490
Thiruvarur 491
Thoothukkudi 492
Tiruchirappalli 493
Tirunelveli 494
Tiruvannamalai 495
Vellore 496
Viluppuram 497
Virudhunagar 498
TRIPURA
Dhalai 499
North 500
South 501
West 502
UTTAR PRADESH
Agra 503
Aligarh 504
Allahabad 505
Ambedkar Nagar 506
Auraiya 507
Azamgarh 508
Baghpat 509
Bahraich 510
Ballia 511
Balrampur 512
Banda 513
Barabanki 514
Bareilly 515
Basti 516
Bhadohi 517
Contents
Bijnor 518
Budaun 519
Bulandshahr 520
Chandauli 521
Chitrakoot 522
Deoria 523
Etah 524
Etawah 525
Faizabad 526
Farrukhabad 527
Fatehpur 528
Firozabad 529
Gautam Buddha Nagar 530
Ghaziabad 531
Ghazipur 532
Gonda 533
Gorakhpur 534
Hamirpur 535
Hardoi 536
Hathras 537
Jalaun 538
Jaunpur 539
Jhansi 540
Jyotiba Phule Nagar 541
Kannauj 542
Kanpur Dehat 543
Kanpur Nagar 544
Kaushambi 545
Kheri 546
Kushinagar 547
Lalitpur 548
Lucknow 549
Maharajganj 550
Mahoba 551
Mainpuri 552
Mathura 553
Mau 554
Meerut 555
Mirzapur 556
Moradabad 557
Muzaffarnagar 558
Pilibhit 559
Pratapgarh 560
Rae Bareli 561
Rampur 562
Saharanpur 563
Sant Kabir Nagar 564
Shahjahanpur 565
Shrawasti 566
Siddharthnagar 567
Sitapur 568
Sonbhadra 569
Sultanpur 570
Unnao 571
Varanasi 572
UTTARAKHAND
Almora 573
Bageshwar 574
Chamoli 575
Champawat 576
Dehradun 577
Garhwal 578
Hardwar 579
Nainital 580
Pithoragarh 581
Rudraprayag 582
Tehri Garhwal 583
Udham Singh Nagar 584
Uttarkashi 585
WEST BENGAL
Bankura 586
Barddhaman 587
Birbhum 588
Dakshin Dinajpur 589
Darjiling 590
Haora 591
Hugli 592
Jalpaiguri 593
Koch Bihar 594
Kolkata 595
Maldah 596
Murshidabad 597
North Twenty Four Pargana 598
Paschim Medinipur 599
Purba Medinipur 600
Puruliya 601
Siliguri 602
South Twenty Four Pargan 603
Uttar Dinajpur 604
Contents

1. Introduction
Ever since its inception, the Sarva Shiksha Abhiyan (SSA) programme has emphasised decentralised planningof education with a focus on district planning. It envisages achieving goal of universal primary education by2007 and elementary education by 2010. All the States and Union Territories of the country are covered underSSA. In order to operationalise this premise into reality, considerable amount of educational and allied data isrequired for each district. It was in this context that the District Information System for Education (DISE) wasdesigned to provide district and sub-district level school data for planning, monitoring and review of variousproject interventions. The DISE data received from schools are computerised at the district level and disseminatedup to the school level in various ways. The data capture formats; definitions and concepts used for data collectionare available at http://www.dpepmis.org which is being followed uniformly across the states. The School ReportCards are available at http://www.schoolreportcards.in.
2. District Report Cards
Since 1999, efforts are being made to share the district level data with the educational planners, administratorsand the data users in the form of District Report Cards. In addition to print material, a variety of disseminationstrategies, including CDR and web publishing, were adopted to improve availability of district level data to thedata users. From the year 2001-02, the scope of DISE has been extended to cover new data elements as well asto expand the scope to the whole of the elementary education sector. The present volumes present the DistrictReport Cards (Volume I & II); and contain a comprehensive district-specific database on elementary educationin India. The District Report Cards incorporate information on the following important areas of elementaryeducation:
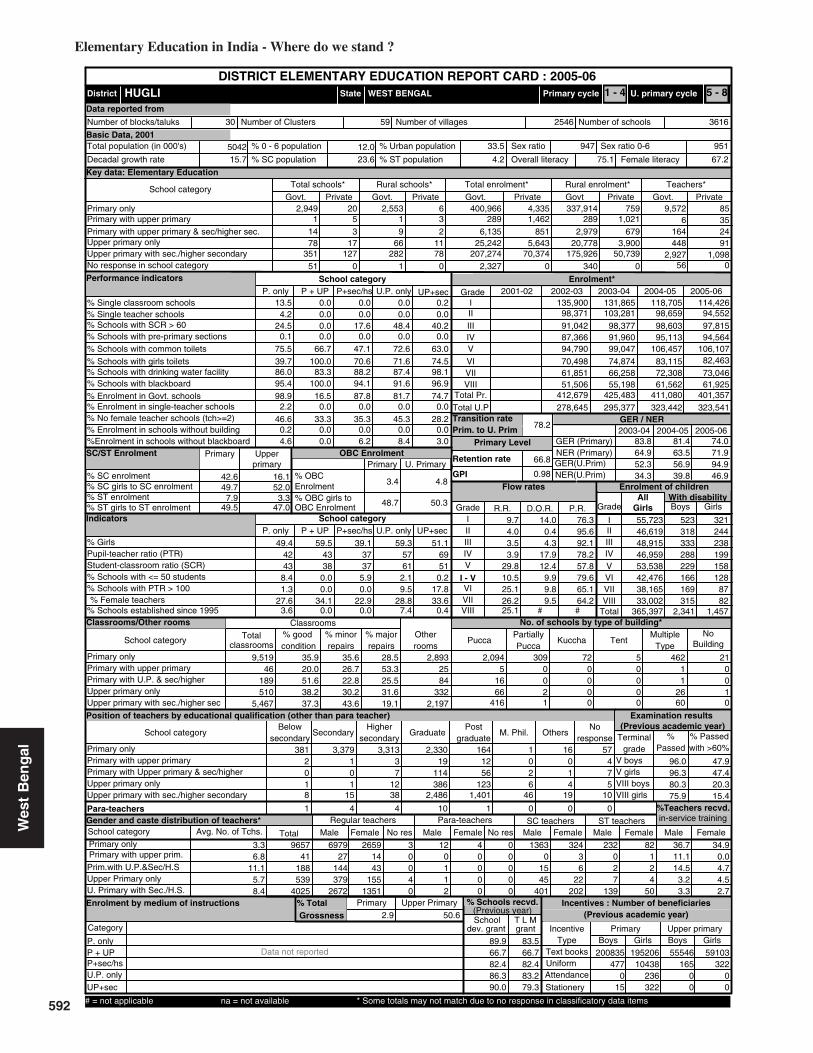
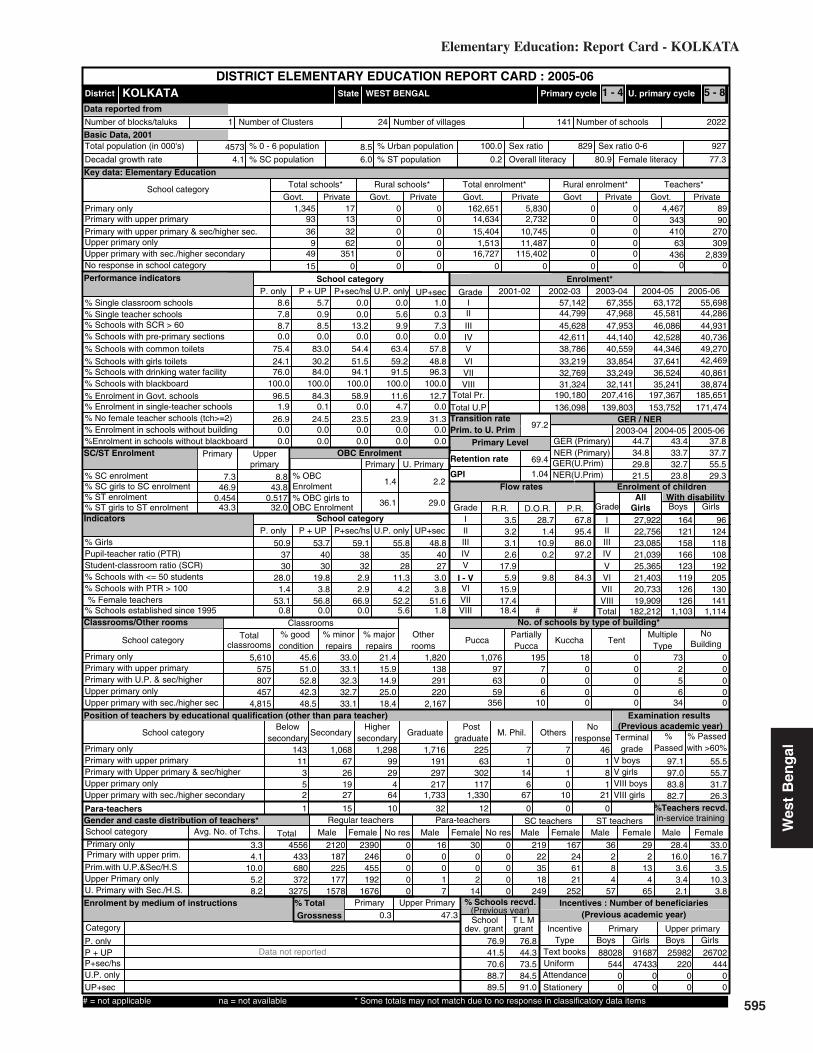
a) Basic data on population, literacy, sex ratio, number of blocks, villages, clusters and schools from whichdata is reported (presented for all districts except for those created after 2001 Census).
b) Key data on elementary education in terms of number of schools, enrolment, and teachers classified byschool-category and school management (Government & Private). Details of schools and enrolment inrural areas are also made available category-wise and management-wise.
c) Grade-wise and level-wise enrolment along with percentage of over-age and under-age children at primaryand upper primary levels of education in each district.
d) Examination results for the previous academic session for the terminal class at primary and upper primarylevels of education.
e) Classrooms categorized into good condition, requiring minor and major repairs by school category.
f) Number of schools by category and by type of building.
g) Distribution of regular and para-teachers by educational and professional qualifications and by schoolcategory.
h) Sex-wise enrolment of children with disabilities in primary and upper primary classes.
i) Gender and caste distribution of regular and para-teachers and proportion of teachers undergoing in-service teacher training by school category.
j) Enrolment by mediums of instruction and by school category.
k) Number of students benefited by various incentive schemes at primary and upper primary levels.
xvii
l) Grade-specific promotion, repetition and drop-out rates at primary and upper primary levels of education.This has been presented for the districts having at least 2 years’ DISE data.
m) Transition from primary to upper primary level and retention rate at the primary level. Transition rate ispresented in case of districts having at least 2 years’ data and completion in case of districts having 4/5years DISE data.
n) Performance indicators in terms of school category, enrolment distribution: total, Scheduled Castes,Scheduled Tribes, Other Backward Classes (OBC), percentage of girl’s enrolment, Gender Parity Index,number of classrooms, single-teacher schools, schools with attached pre-primary classes etc.
o) Quality indicators according to category of schools, teacher-pupil ratio, average number of teachers,availability of female teachers, school buildings, students-classroom ratio, common toilets, girl’s toilet,schools without building and blackboard etc.
p) Number of schools received school development and teaching learning material grant by school category.
3. Methodology and Sources of Data
The Report Cards are based on the school level data provided by the State Project/Mission Directors to theDepartment of School Education and Literacy of the MHRD. The data are first cross-checked and validated atthe district and then at the state level. After the state is satisfied with the quality and reporting of the data, it issubmitted to the national level for analysis, dissemination and reporting to various project management agencies.At the national level thorough scrutiny of state-specific data is undertaken and limitations, if any, are reported tothe concerned states.
In addition to the DISE, the District Report Cards also present selected data from the 2001Census. The definitionsand concepts followed in the preparation of District Report Cards are the same as used in the DISE data captureformats. The MIS Unit at TSG also undertakes processing of data and shares the major findings with the statesin the form of tables derived from the state/district level DISE data.
Over a period of time, no-responses have considerably gone down. Despite the best efforts, some schools havenot responded to all the variables, like management, year of establishment, rural/urban classification, schoolcategory, building status, academic and professional qualifications of teachers, caste and sex code for teachersetc. Wherever possible, efforts have been made to analyse the data by excluding the no response values. In sometables, no-responses are also shown separately. However, in some cases, no-responses are explicit from thetables and hence the totals may not match across various tables due to different number of no- responses. Incross tabulation analysis, the no-responses are excluded.
3.1 Indicators and their formulation
The report cards contain absolute data on selected variables and also present trends and analysis of indicatorsderived from the school and the district level data. For the purpose of presentation and ease of understanding andinterpretation, certain variables are regrouped. The following paragraphs provide information on the variableswhere regrouping has been done for the purpose of presentation in the Report Cards:
a) School management: The District Report Cards present the data on management in terms of Governmentand Private category. The Government category includes all schools under the management of theGovernment (Central/State), Tribal and Social Welfare Departments, Local Bodies, and KendriyaVidyalyas, Army Schools, Navodaya Vidyalayas, Sainik Schools, Tibetan Schools, Navy Schools, ProjectSchools etc. The private category includes schools classified as Private Aided and Private Unaided. Itmay be noted that DISE covers only the recognized schools falling under the above categories.Unrecognized schools are not included in the DISE information collection system.
b) School building: The classification of schools is also presented in terms of the number of school buildingsand their type. Schools having more than one type of building structures are counted under the categoryof ‘Multiple Type Building’.
xviii

c) Teachers in position: The analysis of teachers’ data is in terms of the teachers shown as ‘in position’.The distribution of teachers in terms of educational qualifications has been presented separately forteachers and para-teachers. Teachers include TGTs, Head Teachers, Center Head Teachers, regularand temporary primary/elementary teachers, subject teachers such as: Art & Craft Teachers, OrientalTeachers, Language Teachers, Drawing Teachers, Music Teachers, Computer Instructors, and PhysicalEducation Teachers. Community teachers, voluntary teachers, Guruji, are included amongst para-teachers. The analysis of teachers’ data for in-service training is presented for the regular teachers.Para-teachers have been excluded from this analysis in the Report Cards.
d) Mediums of instruction: The District Report Cards present the number of children studying throughvarious mediums of instruction by category of schools. The data for four major mediums of instructionare presented in the Report Cards and if a district has more than four mediums of instruction, thesehave been presented under the category, ‘Others’.
e) Schools, villages, blocks and clusters: The number of blocks, villages and schools is based on theinitialized entities in the DISE software. The list of blocks, villages and schools is created at the time ofDISE implementation and is updated annually. The number of clusters refers to the mapped entitieswith the blocks. Some states have often reorganized clusters. Towns and municipalities have beenclassified as separate blocks.
The main indicators presented in the Report Cards have been derived by using the following illustrative formulae.The derivations are given for schools in primary category only. The same method is applied for other categoriesand classificatory groups.
Primary schools having single classroom1. % Single-classroom schools = x 100
Total primary schools
Primary schools with single teacher in position2. % Single-teacher schools = x 100
Total primary schools
Primary schools having student classroom ratio > 603. % Schools with SCR > 60 = x 100
Total primary schools
Primary schools having pre-primary sections 4. % Schools with pre-primary = x 100
sections Total primary schools
Primary schools having common toilet5. % Schools with common = x 100
toilet Total primary schools
Primary schools having girls toilet6. % Schools with girl’s toilet = x 100
Total primary schools
Enrolment in primary schools havingEducation Department, Local Body, Tribal Welfare
Department & Others as school management7. % Enrolment in Government = x 100
Schools Total enrolment in primary schoolsxix

Enrolment in primary schools havingPrivate Aided and Private Unaided as school management
8. % Enrolment in Private = x 100Schools Total enrolment in primary schools
Enrolment in primary schools having single teacher9. % Enrolment in single-teacher = x 100
schools Enrolment in total number of schoolshaving primary category
Primary schools having teacher > 2but no female teacher
10. % No female teacher schools = x 100(teacher > 2) Total primary schools
Enrolment in primary schools having no building11. % Students in schools = x 100
without building Enrolment in primary schools
Enrolment in primary schools having no blackboard12. % Students in schools = x 100
without blackboard Enrolment in primary schools
Enrolment in Grades I-V below ‘6’ & above ‘11’ years13. % Under-age & over-age children = x 100
Total enrolment in Grades I-V
Enrolment of SC in primary classes14. % SC enrolment = x 100
Total enrolment in primary classes
Enrolment of SC girls in primary classes15. % SC girls to SC enrolment = x 100
SC enrolment in primary classes
Enrolment of ST in primary classes16. % ST enrolment = x 100
Total enrolment in primary classes
Enrolment of ST girls in primary classes17. % ST girls to ST enrolment = x 100
ST enrolment in primary classes
Total enrolment in schools of primary category18. Pupil-Teacher Ratio = x 100
(PTR) Total teachers in primary schools category
(Para-teachers have been included while calculating PTR)
xx

Total enrolment in primary schools19. Student-Classroom Ratio = x 100
(SCR) Total classrooms in primary schools
Number of primary schools havingenrolment > 50 in Grades I – IV/V
20. % Schools with > 50 = x 100students in Grades I – IV/V Total primary schools
Total primary schools having PTR > 10021. % Schools with PTR > 100 = x 100
Total primary schools
Total female teachers in primary schools22. % Female Teachers = x 100
Total teachers in primary schools
(Para-teachers have been included while calculating this indicator)
Total primary schools established since 199423. % of Primary schools established = x 100
since 1994 Total primary schools
(The denominator excludes the schools for which year of establishment is not given)
24. Flow Rates
(a) Promotion RateP
g+1 t+1
Promotion Rate (ptg) = x 100
Eg
t
where
Pg+1
t+1 = Number of students promoted to grade ‘g+1’ in year ‘t+1’ and
Etg
= Total number of students in grade ‘g’ in year ‘t’
(b) Repetition RateR
g t+1
(rtg) = x 100
Eg
t
where R
g t+1 = Number of repeaters in grade ‘g’ in year ‘t+1’
(c) Drop-out RateD
gt
( dtg ) = x 100
Eg
t
where
dtg
= Number of student’s dropping out from grade ‘g’ in year ‘t’
xxi

(d) Transition Rate (TR)E
g+1 t +1
TR = x 100E
g t
where
E g+1
t +1 = New entrants into Grade V/VI in year ‘t+1’ and
E g t = Enrolment in Grade IV/V in year ‘t’
(e) Retention Rate (RR)
Enrolment in Grade IV/V in year ‘t’–Repeaters in Grade IV/V in year ‘t’
RR = x 100Enrolment in Grade I in year ‘t – 3’/’t-4’
25. Average Promotion, Repetition and Drop-out rates present average of these rates in primary classeswhich is calculated by using the standard methods.
Girl’s enrolment in Primary Grades in year ‘t’26. Gender Parity Index (GPI) = x 100
Boy’s enrolment in Primary Grades in year ‘t’
27. Ratio of Primary to Upper Primary Schools/Sections
Total number of Primary Schools/Sections in year ‘t’= Total number of Upper Primary Schools/Sections in year ‘t’
Total enrolment in Grades I-V28. Gross Enrolment Ratio (GER) = x 100
Population of age 6-11 years
Enrolment, I-V/6-11 age group29. Net Enrolment Ratio (NER) = x 100
Population of age 6-11 years
30. In-service Training, School & TLM Grants received, Incentives in terms of number of beneficiaries,Examination Results etc. are presented for the previous academic year.
4. Coverage: Some Facts
� Record date : 30th September 2005� Grades covered : 1 to 7 or 8 (depending upon the duration of
elementary education cycle)� Total States & UTs : 35� Total districts : 604 (including bifurcated districts)� Total schools : 11,24,033� Total students : 168.29 million� Total teachers : 4.69 million (including para-teachers)� Total para-teachers : 4,98,944� Number of repeaters : 9.99 million� Number of students with disabilities : 1.62 million
xxii

5. Limitations of the Data
The data and indicators presented in the Report Cards are based on the information received from theState Project Offices and the District Project Offices. Procedures for the data validation and verificationof sample data capture formats at the district level have been prescribed, and the districts reported thesteps taken by them to ensure quality and reliability of data collection. The DISE software also checksfor many internal inconsistencies in the data and generates reports for verification by the District ProjectOffice. The State Project Office while transferring the data from the district to the state database ensuresthat the data received from the district is complete and free from any inconsistency. They are alsosupposed to engage an independent agency for sample checking of data. At the national level, data fromthe State Project Office is received to ensure compliance with various quality control measures. Despitethese efforts, some inconsistencies and missing data are observed at the national level. In some casesdata on key elements is found missing. In view of these problems, data presented in the Report Cardsmay not exactly match. In some cases, the discrepancies could not be resolved at the national level. Forthese reasons, data on such variables is not reported in case of a few districts.
Over a period of time, the total number of schools covered under DISE has increased many-fold. Despiteall our efforts, it is possible that the field agencies might have not covered all Navodaya Vidyalayas,Sainik Schools, Military Schools, Kendriya Vidyalayas, Tibetan Schools etc. under DISE. All theseschools are recognized schools and are supposed to be covered under DISE but their coverage variesfrom district to district. A few districts have collected data from these schools while others might nothave covered all such schools. Despite significant increase in number of private schools covered underDISE, field level functionaries reported that data from a few private recognised schools couldn’t beobtained for the one or the other reason. We are trying to reach all such schools and are hopeful thatthese efforts will be reflected in the following year.
An attempt has also been made to present flow rates (promotion, repetition and drop-out rates) in caseof districts having DISE data for more than two years. While analysing flow rates, it is noticed that in afew districts the same is found to be incorrect, largely because of the inconsistency in the enrolmentdata. Flow rates in case of such districts have not been reported. This is also true for retention andtransition rates presented in the Report Cards. Districts are advised to run consistency module of theDISE software to identify and remove inconsistencies in the data. In addition, the CRC Coordinatorshave been made accountable to ensure complete coverage as well as also to ensure that data is consistentand there are no missing values in the filled-in formats of the schools falling under his/her jurisdiction.
One of the other important limitations of the data is incomplete reporting of the school-age population,which is very crucial in assessing the progress towards universal elementary education. In the absenceof school-age population in the current year, it is not possible to reliably construct crucial indicatorssuch as GER and NER both at the primary and upper primary levels of education. The state–specificsingle-age population projected by the Office of the Registrar General of India is used to obtain 6-11and 11-14 year child population at the district level. The GER and NER presented in the presentvolume should, therefore, be analysed in the light of these limitations. The districts should feel free torevise enrolment ratio in the light of more recent estimates of child population, if available through thehousehold survey.
xxiii

DISE 2005-06: Coverage
Sl. School Structure Number of DistrictsNo. State & UT Primary Upper 2001 Reported DISE Data
Primary Census2003-04 2004-05 2005-06
1 Andaman & Nicobar Islands I-V VI-VIII 2 - - 2
2 Andhra Pradesh I-V VI-VIII 23 23 23 23
3 Arunachal Pradesh I-V VI-VIII 13 - 15* 15*
4 Assam I-IV V-VII 23 23 23 23
5 Bihar I-V VI-VIII 37 37 37 37
6 Chandigarh I-V VI-VIII 1 1 1 1
7 Chhattisgarh I-V VI-VIII 16 16 16 16
8 Dadra & Nagar Haveli I-IV V-VII 1 - - 1
9 Daman & Diu I-IV V-VII 2 - - 2
10 Delhi I-V VI-VIII 9 - 9 9
11 Goa I-IV V-VII 2 - - 2
12 Gujarat I-IV V-VII 25 25 25 25
13 Haryana I-V VI-VIII 19 17 19 19
14 Himachal Pradesh I-V VI-VIII 12 12 12 12
15 Jammu & Kashmir I-V VI-VIII 14 - 12+ 14
16 Jharkhand I-V VI-VIII 18 22* 22* 22*
17 Karnataka I-IV V-VII 27 27 27 27
18 Kerala I-IV V-VII 14 14 14 14
19 Lakshadweep I-IV V-VII 1 - - 1
20 Madhya Pradesh I-V VI-VIII 45 45 45 48*
21 Maharashtra I-IV V-VII 35 35 35 35
22 Manipur I-V VI-VIII 9 - - 9
23 Meghalaya I-IV V-VII 7 7 7 7
24 Mizoram I-IV V-VII 8 8 8 8
25 Nagaland I-V VI-VIII 8 8 8 8
26 Orissa I-V VI-VII 30 30 30 30
27 Puducherry I-V VI-VIII 4 - 4 4
28 Punjab I-V VI-VIII 17 17 17 17
29 Rajasthan I-V VI-VIII 32 32 32 32
30 Sikkim I-V VI-VIII 4 4 4 4
31 Tamil Nadu I-V VI-VIII 30 29 29 30
32 Tripura I-V VI-VIII 4 4 4 4
33 Uttar Pradesh I-V VI-VIII 70 70 70 70
34 Uttarakhand I-V VI-VIII 13 13 13 13
35 West Bengal I-IV V-VIII 18 20* 20* 20*
Total Districts - - 593 539* 581* 604*
Note: * : Including bifurcated districts. + : Data for all districts not reported.
xxiv

Indicators constructed and data presented in this volume are based on the data as has been receivedfrom the States & UTs as on September 30, 2005


315
17.4 12.6
Key data: Elementary Education
4041
AHMADNAGAR
(Previous academic year)
(Previous year)
Gender and caste distribution of teachers*
No. of schools by type of building*
BoysWith disability
Flow rates
Primary Level
Enrolment*
Number of schools
Grade
GER / NER
School category
Primary Upper primaryBoys Boys GirlsGirls
IncentiveType
School categoryMultiple
TypeKuccha
PartiallyPucca
PuccaTotal % good condition
Otherrooms
TentNo
Building
Classrooms
Belowsecondary
Highersecondary
Postgraduate
M. Phil.GraduateSecondarySchool category OthersNo
response
ST teachers
Total Male Female No res Male Female No res Male Female Male FemaleSC teachers
Text booksUniformAttendanceStationery
% Passed
Avg. No. of Tchs.
%
Female literacyOverall literacy
dev. grant grantSchool T L M
Male Female
IVV
IIIIII
Grade R.R. D.O.R. P.R.
VIIVI
I - V
Enrolment by medium of instructions
Examination results
Retention rate
GPI
Primary cycle U. primary cycleState
DISTRICT ELEMENTARY EDUCATION REPORT CARD : 2005-06
GirlsGrade
IIIIIIIVVVI
VIII
AllGirls
Total
VII
% TotalGrossness
School category
63319
016
109 5779 190
5780
1214 248 12
2,417 11444 146,229
8 6,0740 0
490 5,703204 878
2,316 49 190,208 10,17941,867 127,355 13,520
3,058 6,074 2,9720 0 0
11,809 742 8,787227,550 4,594 173,650
204,424 37,427 7,1194,752
8371,033
P + UP P+sec/hs U.P. only UP+sec
School categoryP. only
9.1 0.9 0.0 0.0 1.38.5
Number of Clusters 41571577
% Schools with SCR > 600.7 0.0 0.0 1.3
1.6 6.6 10.7 0.0 6.1% Schools with pre-primary sections 34.9 35.7 25.0 0.0 4.2% Schools with common toilets 57.4 73.6 78.6 0.0 73.6
% Schools with girls toilets 44.4 60.0 96.4 0.0 82.3% Schools with drinking water facility 65.5 80.3 100.0 0.0 96.6
% Enrolment in Govt. schools 84.5 77.7 66.5 0.0 2.499.9 99.9 100.0 0.0 100.0
% No female teacher schools (tch>=2) 38.7 17.3 28.6 0.0 21.92.7 0.3 0.0 0.0 0.6
0.4 0.3 0.0 0.0 0.3%Enrolment in schools without blackboard 0.0 0.0 0.0 0.0 0.0
2001-02 2002-03 2003-04 2004-05 2005-06IIIIIIIVV
VIVII
Total U.P
99,81589,39490,20282,10685,87681,377
78,028
46,12344,36741,01640,38938,641
37,13535,953
96,07385,86586,78781,61278,645
75,29274,353
90,33485,61486,48182,66481,114
81,90182,681
93.6
49.7
45.0
23.8
84.5
94.4
47.1
3.67.1
46,34641,59242,34438,66240,04337,95536,510
1,1741,1171,125
915713620578
821735729638404382332
7,869
classrooms
5,378270
06,589
82.581.784.3
0.091.0
11.911.4
5.6
15.40.07.2
6.90.40.01.8
976166
02,306
2,018 2,251 121 12 10 100 34656 20 2 0 56 6
20 4 0 0 4 00 0 0 0 0 0
494 36 6 2 50 4
183 3,568 1,589 1,876 572 3 11151 2,209 1,326 1,520 465 5 12 77
24 68 28 77 30 1 1 100 0 0 0 0 0 0 0
197 1,273 611 3,043 749 3 23 613
2 18 14 41 12 0 0 0
44893357
1580
4404
233171
01494
3312 138 9 8 0 569 422 340 1267710
0614
1410
21
600
12
0000
44516
0626
24570
230
38039
0224
9330
53
Terminalgrade Passed
VII boysV girlsV boys
VII girls
137 with >60%
18.379565785
2400
6545
20.915.1
0.06.6
17.517.2
9.90.07.2
232223Marathi English Urdu Others Hindi
1689476254
0226738
419310301
23070
3790
33577450
00
1353
1673739
00
17
197603571
00
% Schools recvd.
95.392.664.3
0.077.9
94.790.357.1
0.077.6
11888312458
167818518
1063593274
4804397
146138145723273019606
1117693176
9444028
3.17.88.60.0
11.0
31.321.621.712.7
18.615.9
22.022.1
2005-062004-052003-04
MAHARASHTRA
29.6
Upper PrimaryPrimary
Sex ratio Sex ratio 0-6
15 265
VIII10.7
Enrolment of children
VIIITotal Pr.
0 0174 6,371
69 1,084
162 78
%Teachers recvd.in-service training
Total schools* Rural schools* Total enrolment* Rural enrolment* Teachers*
4.6 28.2
80.6
67.8
70.7 34.7
40.0 24.9% SC enrolment% SC girls to SC enrolment% ST enrolment
47.9 46.113.047.3 44.0
33.3
46.5
24.4
44.8
Position of teachers by educational qualification (other than para teacher)
(Previous academic year)Incentives : Number of beneficiaries
% ST girls to ST enrolment
% Girls
Number of villages
% 0 - 6 population
% SC population % ST population
% Urban population
% Schools with blackboard
% Enrolment in single-teacher schools
% Enrolment in schools without building
Primary Upperprimary
OBC EnrolmentPrimary U. Primary
% OBCEnrolment% OBC girls toOBC Enrolment
Pupil-teacher ratio (PTR)Student-classroom ratio (SCR)% Schools with <= 50 students% Schools with PTR > 100% Female teachers
% Schools established since 1995
Regular teachers Para-teachers
% minorrepairs
% majorrepairs
# = not applicable na = not available * Some totals may not match due to no response in classificatory data items
3438
46.73031
47.10.1
41.715.4
47.23335
1.30.8
40.46.3
0.000
0.00.00.00.0
45.93635
3.42.7
23.017.3
21.2 12.0 7.5 75.3 64.3
88494019.914.6
Category
PrivateGovt.PrivateGovtPrivateGovt.PrivateGovt.PrivateGovt.
Total population (in 000's)
Number of blocks/taluks
District
Decadal growth rate
Primary onlyPrimary with upper primaryPrimary with upper primary & sec/higher sec.Upper primary onlyUpper primary with sec./higher secondary
% Single classroom schools% Single teacher schools
P + UP P+sec/hs U.P. only UP+secP. only
No response in school category
Primary with upper primaryPrimary with U.P. & sec/higherUpper primary onlyUpper primary with sec./higher sec
Primary only
Primary onlyPrimary with upper primaryPrimary with Upper primary & sec/higherUpper primary only
Para-teachers
School category
Upper primary with sec./higher secondary
Primary onlyPrimary with upper prim.
P. onlyP + UPP+sec/hsU.P. onlyUP+sec
NER(U.Prim)GER(U.Prim)NER (Primary)GER (Primary)
Transition ratePrim. to U. Prim
7.1
Performance indicators
SC/ST Enrolment
Indicators
Classrooms/Other rooms
Prim.with U.P.&Sec/H.SUpper Primary onlyU. Primary with Sec./H.S.
Basic Data, 2001
Data reported from
245,696 228,290 111,729 245,281
35,326 78,221
458 28935,369
100.0
85.2
0.88
# ## #
# 283,452 6,242 4,041Total
1 - 4 5 - 7
345,093 350,337 171,895 361,517
94.9 64.195.5 66.187.9 27.988.4 30.5
Elementary Education: Report Card - AHMADNAGAR
Mah
aras
htr
a

316
29.6 25.4
Key data: Elementary Education
1630
AKOLA
(Previous academic year)
(Previous year)
Gender and caste distribution of teachers*
No. of schools by type of building*
BoysWith disability
Flow rates
Primary Level
Enrolment*
Number of schools
Grade
GER / NER
School category
Primary Upper primaryBoys Boys GirlsGirls
IncentiveType
School categoryMultiple
TypeKuccha
PartiallyPucca
PuccaTotal % good condition
Otherrooms
TentNo
Building
Classrooms
Belowsecondary
Highersecondary
Postgraduate
M. Phil.GraduateSecondarySchool category OthersNo
response
ST teachers
Total Male Female No res Male Female No res Male Female Male FemaleSC teachers
Text booksUniformAttendanceStationery
% Passed
Avg. No. of Tchs.
%
Female literacyOverall literacy
dev. grant grantSchool T L M
Male Female
IVV
IIIIII
Grade R.R. D.O.R. P.R.
VIIVI
I - V
Enrolment by medium of instructions
Examination results
Retention rate
GPI
Primary cycle U. primary cycleState
DISTRICT ELEMENTARY EDUCATION REPORT CARD : 2005-06
GirlsGrade
IIIIIIIVVVI
VIII
AllGirls
Total
VII
% TotalGrossness
School category
36922
14
69 34127 2
1247
26
7 62 1
625 9022 86,06316 563
1 319178 4,965
41 267
522 29 38,355 4,02125,597 75,767 6,210
8,677 563 2,56355 319 55
2,886 37 1,93673,033 2,827 40,775
63,976 15,894 1,8542,628
427610
P + UP P+sec/hs U.P. only UP+sec
School categoryP. only
11.5 0.5 0.0 0.0 0.410.5
Number of Clusters 1515842
% Schools with SCR > 600.0 0.0 0.0 0.0
8.0 9.8 13.8 0.0 10.0% Schools with pre-primary sections 31.7 35.4 24.1 33.3 5.0% Schools with common toilets 44.3 61.6 89.7 100.0 81.2
% Schools with girls toilets 32.4 55.3 89.7 66.7 92.0% Schools with drinking water facility 71.3 86.3 96.6 66.7 98.1
% Enrolment in Govt. schools 80.1 77.1 6.1 85.3 6.4100.0 100.0 100.0 100.0 100.0
% No female teacher schools (tch>=2) 37.6 20.1 20.7 66.7 25.72.3 0.0 0.0 0.0 0.0
1.8 0.0 0.0 0.0 0.0%Enrolment in schools without blackboard 0.0 0.0 0.0 0.0 0.0
2001-02 2002-03 2003-04 2004-05 2005-06IIIIIIIVV
VIVII
Total U.P
41,56938,19538,90136,44132,38232,137
31,245
34,82834,99133,56429,32126,787
26,24326,446
40,57437,51333,93333,17831,879
32,99632,590
35,17629,58931,08229,25032,708
34,13332,659
95.9
54.0
84.7
42.5
89.9
91.3
45.3
17.23.4
19,62618,16618,78417,66215,62515,68115,272
1,1131,1181,1651,158
817723747
814901
1,043916681659605
2,181
classrooms
2,887209
122,221
72.776.082.091.783.5
19.817.0
7.5
12.28.3
11.0
6.95.90.05.4
640103
41,126
701 630 31 10 0 31 13366 21 6 0 43 1
24 1 1 0 3 03 0 0 0 0 0
207 10 7 0 36 1
47 822 809 492 86 0 040 1,119 1,013 845 184 5 0 0
0 63 35 109 21 0 0 00 3 1 3 0 0 0 0
43 558 342 1,153 183 1 3 0
0 11 54 16 7 0 0 0
12581842
1396
1598
136489
1685
998 0 22 3 0 139 113 96 600000
2400
18
8024
0000
23614
0251
14271
114
9811
193
6431
56
Terminalgrade Passed
VII boysV girlsV boys
VII girls
0 with >60%
24.822813238
2289
2305
22.89.4
66.710.3
13.516.5
9.0100.0
6.8
54144Marathi Urdu English Hindi Others
799274195
17563348
1691022047
266199
9207
513181284798
02831
3245788
00
2567
152267
00
200
% Schools recvd.
88.490.258.6
100.083.5
89.090.058.6
100.082.4
525813229
3965092
48882476
88843
589793347
326465096
50377551147
1155
3.27.47.93.08.8
10.27.87.24.5
5.23.7
5.47.2
2005-062004-052003-04
MAHARASHTRA
39.0
Upper PrimaryPrimary
Sex ratio Sex ratio 0-6
8 121
VIII20.7
Enrolment of children
VIIITotal Pr.
7 2143 2,162
28 274
15 213
%Teachers recvd.in-service training
Total schools* Rural schools* Total enrolment* Rural enrolment* Teachers*
26.4
90.3
67.2
79.7 70.2
44.4 44.4% SC enrolment% SC girls to SC enrolment% ST enrolment
48.1 47.99.4
48.7 47.0
50.3
47.5
44.0
47.7
Position of teachers by educational qualification (other than para teacher)
(Previous academic year)Incentives : Number of beneficiaries
% ST girls to ST enrolment
% Girls
Number of villages
% 0 - 6 population
% SC population % ST population
% Urban population
% Schools with blackboard
% Enrolment in single-teacher schools
% Enrolment in schools without building
Primary Upperprimary
OBC EnrolmentPrimary U. Primary
% OBCEnrolment% OBC girls toOBC Enrolment
Pupil-teacher ratio (PTR)Student-classroom ratio (SCR)% Schools with <= 50 students% Schools with PTR > 100% Female teachers
% Schools established since 1995
Regular teachers Para-teachers
% minorrepairs
% majorrepairs
# = not applicable na = not available * Some totals may not match due to no response in classificatory data items
4441
48.63537
43.60.1
43.913.1
48.33439
0.70.2
42.48.0
50.34231
0.00.0
33.30.0
47.73435
11.50.8
29.913.8
20.5 10.3 6.1 81.4 73.4
93393838.514.5
Category
PrivateGovt.PrivateGovtPrivateGovt.PrivateGovt.PrivateGovt.
Total population (in 000's)
Number of blocks/taluks
District
Decadal growth rate
Primary onlyPrimary with upper primaryPrimary with upper primary & sec/higher sec.Upper primary onlyUpper primary with sec./higher secondary
% Single classroom schools% Single teacher schools
P + UP P+sec/hs U.P. only UP+secP. only
No response in school category
Primary with upper primaryPrimary with U.P. & sec/higherUpper primary onlyUpper primary with sec./higher sec
Primary only
Primary onlyPrimary with upper primaryPrimary with Upper primary & sec/higherUpper primary only
Para-teachers
School category
Upper primary with sec./higher secondary
Primary onlyPrimary with upper prim.
P. onlyP + UPP+sec/hsU.P. onlyUP+sec
NER(U.Prim)GER(U.Prim)NER (Primary)GER (Primary)
Transition ratePrim. to U. Prim
7.1
Performance indicators
SC/ST Enrolment
Indicators
Classrooms/Other rooms
Prim.with U.P.&Sec/H.SUpper Primary onlyU. Primary with Sec./H.S.
Basic Data, 2001
Data reported from
99,500 97,465 79,476 95,764
7,169 23,499 31,425
515 30614,938
100.0
99.9
0.92
# ## #
# 120,816 6,841 5,619Total
1 - 4 5 - 7
125,097 145,198 132,704 155,106
97.7 63.698.1 67.993.4 30.495.4 34.0
Elementary Education in India - Where do we stand ?
Mah
aras
htr
a

317
22.5 19.3
Key data: Elementary Education
2607
AMRAVATI
(Previous academic year)
(Previous year)
Gender and caste distribution of teachers*
No. of schools by type of building*
BoysWith disability
Flow rates
Primary Level
Enrolment*
Number of schools
Grade
GER / NER
School category
Primary Upper primaryBoys Boys GirlsGirls
IncentiveType
School categoryMultiple
TypeKuccha
PartiallyPucca
PuccaTotal % good condition
Otherrooms
TentNo
Building
Classrooms
Belowsecondary
Highersecondary
Postgraduate
M. Phil.GraduateSecondarySchool category OthersNo
response
ST teachers
Total Male Female No res Male Female No res Male Female Male FemaleSC teachers
Text booksUniformAttendanceStationery
% Passed
Avg. No. of Tchs.
%
Female literacyOverall literacy
dev. grant grantSchool T L M
Male Female
IVV
IIIIII
Grade R.R. D.O.R. P.R.
VIIVI
I - V
Enrolment by medium of instructions
Examination results
Retention rate
GPI
Primary cycle U. primary cycleState
DISTRICT ELEMENTARY EDUCATION REPORT CARD : 2005-06
GirlsGrade
IIIIIIIVVVI
VIII
AllGirls
Total
VII
% TotalGrossness
School category
68214
027
81 63112 13
1329
010
6 131 2
993 11836 148,522
3 4,3051 0
222 11,351123 382
890 33 63,395 5,23129,854 129,464 9,028
4,027 4,116 68156 0 56
6,302 141 5,940108,498 3,171 57,024
85,356 32,618 2,7384,659
660700
P + UP P+sec/hs U.P. only UP+sec
School categoryP. only
9.0 0.4 0.0 0.0 0.013.1
Number of Clusters 23941419
% Schools with SCR > 600.5 0.0 0.0 0.0
6.3 7.9 15.4 0.0 10.7% Schools with pre-primary sections 17.2 11.1 53.8 0.0 3.1% Schools with common toilets 57.1 69.9 80.8 100.0 82.3
% Schools with girls toilets 38.2 51.5 92.3 100.0 93.8% Schools with drinking water facility 82.1 90.3 92.3 100.0 98.9
% Enrolment in Govt. schools 72.4 83.3 51.7 0.0 9.5100.0 100.0 100.0 100.0 100.0
% No female teacher schools (tch>=2) 36.7 18.2 3.8 0.0 10.12.9 0.1 0.0 0.0 0.0
0.2 0.0 0.0 0.0 0.0%Enrolment in schools without blackboard 0.0 0.0 0.0 0.0 0.0
2001-02 2002-03 2003-04 2004-05 2005-06IIIIIIIVV
VIVII
Total U.P
63,74558,14358,06754,08751,73050,873
49,151
61,53659,47957,07150,83353,427
52,40751,149
64,33859,08454,89353,17955,684
54,73953,573
64,61755,63058,01053,67158,126
58,23255,876
97.7
56.0
94.3
52.6
84.8
90.5
44.6
0.00.0
30,38227,94128,01126,20325,01124,68624,194
720689703679506482453
555576581508425417385
3,379
classrooms
4,924229
33,215
78.278.276.4
0.082.2
16.415.8
5.3
23.1100.0
14.0
6.10.40.03.7
1,11677
21,401
1,044 965 85 5 0 41 15662 42 2 0 56 0
20 2 0 0 3 10 1 0 0 0 0
296 22 5 0 32 1
56 1,326 1,105 721 129 5 155 1,707 1,729 1,496 298 2 3 40
3 70 43 84 17 0 0 650 0 0 2 3 0 0 0
56 936 526 1,448 307 4 2 2,109
0 13 35 20 5 0 0 0
18202905
1024
2062
2399115
11223
1536 26 7 9 0 255 220 142 942665
02103
1810
17
11008
0000
35819
1302
31018
0190
20911
0130
11730
75
Terminalgrade Passed
VII boysV girlsV boys
VII girls
39 with >60%
65.233985359
2835
5413
64.247.6
0.031.6
52.657.719.1
0.030.1
97519Marathi Urdu English Hindi Others
1415295837
56100816
1336527976
5770
12889
508860501825
02384
20022821
00
2455
00
930
1305
% Schools recvd.
93.697.057.7
100.094.4
93.996.961.5
100.094.1
9673113099
89115010
758563047
653320
98711135112164115042
893203010
8533266
3.17.0
10.95.0
15.2
13.110.0
8.74.5
7.05.0
7.99.0
2005-062004-052003-04
MAHARASHTRA
40.6
Upper PrimaryPrimary
Sex ratio Sex ratio 0-6
15 207
VIII19.2
Enrolment of children
VIIITotal Pr.
0 5470 4,943
32 642
148 135
%Teachers recvd.in-service training
Total schools* Rural schools* Total enrolment* Rural enrolment* Teachers*
2.6 31.1
82.6
62.4
77.5 75.1
44.5 54.0% SC enrolment% SC girls to SC enrolment% ST enrolment
47.9 49.226.148.8 45.9
51.2
47.8
43.3
48.9
Position of teachers by educational qualification (other than para teacher)
(Previous academic year)Incentives : Number of beneficiaries
% ST girls to ST enrolment
% Girls
Number of villages
% 0 - 6 population
% SC population % ST population
% Urban population
% Schools with blackboard
% Enrolment in single-teacher schools
% Enrolment in schools without building
Primary Upperprimary
OBC EnrolmentPrimary U. Primary
% OBCEnrolment% OBC girls toOBC Enrolment
Pupil-teacher ratio (PTR)Student-classroom ratio (SCR)% Schools with <= 50 students% Schools with PTR > 100% Female teachers
% Schools established since 1995
Regular teachers Para-teachers
% minorrepairs
% majorrepairs
# = not applicable na = not available * Some totals may not match due to no response in classificatory data items
2.1 84.80.7 89.30.5 90.82.0 93.53.8 88.31.8 89.24.1 88.9
3629
48.63535
47.50.2
45.59.3
48.03336
0.70.0
45.04.1
48.21119
0.00.0
20.00.0
48.82237
0.80.0
22.75.3
18.5 17.1 13.7 82.5 75.7
94193834.513.7
Category
PrivateGovt.PrivateGovtPrivateGovt.PrivateGovt.PrivateGovt.
Total population (in 000's)
Number of blocks/taluks
District
Decadal growth rate
Primary onlyPrimary with upper primaryPrimary with upper primary & sec/higher sec.Upper primary onlyUpper primary with sec./higher secondary
% Single classroom schools% Single teacher schools
P + UP P+sec/hs U.P. only UP+secP. only
No response in school category
Primary with upper primaryPrimary with U.P. & sec/higherUpper primary onlyUpper primary with sec./higher sec
Primary only
Primary onlyPrimary with upper primaryPrimary with Upper primary & sec/higherUpper primary only
Para-teachers
School category
Upper primary with sec./higher secondary
Primary onlyPrimary with upper prim.
P. onlyP + UPP+sec/hsU.P. onlyUP+sec
NER(U.Prim)GER(U.Prim)NER (Primary)GER (Primary)
Transition ratePrim. to U. Prim
14.1
Performance indicators
SC/ST Enrolment
Indicators
Classrooms/Other rooms
Prim.with U.P.&Sec/H.SUpper Primary onlyU. Primary with Sec./H.S.
Basic Data, 2001
Data reported from
172,234 163,996 156,983 151,754
77 49,501 45,475
318 22822,117
93.5
80.2
0.93
# ## #
# 186,428 4,232 3,447Total
1 - 4 5 - 7
231,928 231,494 228,919 234,042
95.9 64.097.9 69.691.9 32.293.6 36.6
Elementary Education: Report Card - AMRAVATI
Mah
aras
htr
a

318
20.4 12.6
Key data: Elementary Education
2897
AURANGABAD (MAHARASHTRA)
(Previous academic year)
(Previous year)
Gender and caste distribution of teachers*
No. of schools by type of building*
BoysWith disability
Flow rates
Primary Level
Enrolment*
Number of schools
Grade
GER / NER
School category
Primary Upper primaryBoys Boys GirlsGirls
IncentiveType
School categoryMultiple
TypeKuccha
PartiallyPucca
PuccaTotal % good condition
Otherrooms
TentNo
Building
Classrooms
Belowsecondary
Highersecondary
Postgraduate
M. Phil.GraduateSecondarySchool category OthersNo
response
ST teachers
Total Male Female No res Male Female No res Male Female Male FemaleSC teachers
Text booksUniformAttendanceStationery
% Passed
Avg. No. of Tchs.
%
Female literacyOverall literacy
dev. grant grantSchool T L M
Male Female
IVV
IIIIII
Grade R.R. D.O.R. P.R.
VIIVI
I - V
Enrolment by medium of instructions
Examination results
Retention rate
GPI
Primary cycle U. primary cycleState
DISTRICT ELEMENTARY EDUCATION REPORT CARD : 2005-06
GirlsGrade
IIIIIIIVVVI
VIII
AllGirls
Total
VII
% TotalGrossness
School category
74117
444
142 66438 14
1156
437
47 1 3
828 13326 165,408
9 4,2951 390
101 14,8740 1,628
737 16 51,888 3,61157,454 146,927 9,311
6,099 3,747 1,68251 390 51
348 0 031,402 12,248 23,900
59,586 39,769 2,4955,806
1,3151,534
P + UP P+sec/hs U.P. only UP+sec
School categoryP. only
7.9 1.2 1.8 0.0 0.513.9
Number of Clusters 21521369
% Schools with SCR > 600.6 0.0 0.0 0.5
4.9 10.8 7.3 0.0 7.0% Schools with pre-primary sections 40.0 27.1 21.8 20.0 5.0% Schools with common toilets 68.0 81.7 80.0 40.0 79.0
% Schools with girls toilets 39.8 52.8 83.6 40.0 85.5% Schools with drinking water facility 70.9 75.8 94.5 80.0 96.5
% Enrolment in Govt. schools 60.0 74.2 41.3 88.4 32.187.4 90.0 58.2 80.0 70.5
% No female teacher schools (tch>=2) 42.4 27.6 32.7 80.0 36.03.4 0.1 0.0 0.0 0.1
0.1 0.2 0.0 0.0 0.5%Enrolment in schools without blackboard 0.2 1.3 0.6 0.0 0.6
2001-02 2002-03 2003-04 2004-05 2005-06IIIIIIIVV
VIVII
Total U.P
64,30855,47254,67554,72846,75842,514
40,421
52,52447,78947,66046,90840,777
40,95037,443
67,04862,15261,18160,34549,266
48,59946,965
73,94668,02066,15263,25556,863
54,61949,273
89.4
43.3
68.1
34.4
74.7
69.6
45.3
49.11.8
29,94625,91725,70626,62222,19820,13118,945
946934959892676608506
705669725640497465412
2,990
classrooms
5,358314
181,152
82.380.478.785.788.1
14.014.2
3.7
14.614.310.6
5.46.70.01.3
1,203110
7478
891 676 44 3 1 110 126628 23 1 1 139 91
28 3 0 0 2 224 0 0 0 0 1
123 9 0 0 8 59
137 1,007 908 661 156 0 7165 1,997 1,622 1,809 403 7 3 1,304
10 100 41 133 40 1 3 2540 4 6 16 1 0 0 10
60 303 168 637 165 1 5 1,099
4 10 24 12 5 0 0 0
16353311
16626
928
2784149
2436
1308 853 10 4 0 249 156 122 521215
2679
1074
14108
16002
0000
42719
1102
34412
041
26012
132
12160
11
Terminalgrade Passed
VII boysV girlsV boys
VII girls
920 with >60%
41.538107340
58337
2448
47.821.046.221.2
23.626.4
4.00.0
16.0
84382Marathi Urdu Others English Hindi
1932946604
56842439
1309728179
00
2204
109342541409
0595
207927862149
00
270667
000
% Schools recvd.
81.885.730.980.060.5
81.483.932.7
100.059.5
8250466162972
11408
517952463
2643541
928816805
1140611351
564652334
5323337
4.08.3
10.67.4
12.2
8.85.85.23.4
4.94.7
5.85.9
2005-062004-052003-04
MAHARASHTRA
25.6
Upper PrimaryPrimary
Sex ratio Sex ratio 0-6
10 149
VIII23.6
Enrolment of children
VIIITotal Pr.
32 5655 1,793
93 13
158 425
%Teachers recvd.in-service training
Total schools* Rural schools* Total enrolment* Rural enrolment* Teachers*
35.2
78.0
45.1
74.1 57.9
35.4 29.6% SC enrolment% SC girls to SC enrolment% ST enrolment
47.7 46.16.9
46.6 43.0
32.1
46.2
22.2
45.7
Position of teachers by educational qualification (other than para teacher)
(Previous academic year)Incentives : Number of beneficiaries
% ST girls to ST enrolment
% Girls
Number of villages
% 0 - 6 population
% SC population % ST population
% Urban population
% Schools with blackboard
% Enrolment in single-teacher schools
% Enrolment in schools without building
Primary Upperprimary
OBC EnrolmentPrimary U. Primary
% OBCEnrolment% OBC girls toOBC Enrolment
Pupil-teacher ratio (PTR)Student-classroom ratio (SCR)% Schools with <= 50 students% Schools with PTR > 100% Female teachers
% Schools established since 1995
Regular teachers Para-teachers
% minorrepairs
% majorrepairs
# = not applicable na = not available * Some totals may not match due to no response in classificatory data items
2.0 94.6
0.7 94.4
3318
47.62633
53.20.6
34.48.0
47.53042
13.51.2
38.14.3
48.31225
40.00.05.40.0
45.01940
32.01.0
17.910.0
31.9 13.0 3.5 72.9 60.1
89092437.516.2
Category
PrivateGovt.PrivateGovtPrivateGovt.PrivateGovt.PrivateGovt.
Total population (in 000's)
Number of blocks/taluks
District
Decadal growth rate
Primary onlyPrimary with upper primaryPrimary with upper primary & sec/higher sec.Upper primary onlyUpper primary with sec./higher secondary
% Single classroom schools% Single teacher schools
P + UP P+sec/hs U.P. only UP+secP. only
No response in school category
Primary with upper primaryPrimary with U.P. & sec/higherUpper primary onlyUpper primary with sec./higher sec
Primary only
Primary onlyPrimary with upper primaryPrimary with Upper primary & sec/higherUpper primary only
Para-teachers
School category
Upper primary with sec./higher secondary
Primary onlyPrimary with upper prim.
P. onlyP + UPP+sec/hsU.P. onlyUP+sec
NER(U.Prim)GER(U.Prim)NER (Primary)GER (Primary)
Transition ratePrim. to U. Prim
3.6
Performance indicators
SC/ST Enrolment
Indicators
Classrooms/Other rooms
Prim.with U.P.&Sec/H.SUpper Primary onlyU. Primary with Sec./H.S.
Basic Data, 2001
Data reported from
160,755 144,830 119,170 129,693
5,068 22,428
210 14010,535
94.6
71.9
0.89
# ## #
# 169,465 5,521 4,113Total
1 - 4 5 - 7
271,373 250,726 194,881 229,183
97.3 59.391.3 60.295.5 32.889.9 37.2
Elementary Education in India - Where do we stand ?
Mah
aras
htr
a

319
21.0 16.9
Key data: Elementary Education
1136
BHANDARA
(Previous academic year)
(Previous year)
Gender and caste distribution of teachers*
No. of schools by type of building*
BoysWith disability
Flow rates
Primary Level
Enrolment*
Number of schools
Grade
GER / NER
School category
Primary Upper primaryBoys Boys GirlsGirls
IncentiveType
School categoryMultiple
TypeKuccha
PartiallyPucca
PuccaTotal % good condition
Otherrooms
TentNo
Building
Classrooms
Belowsecondary
Highersecondary
Postgraduate
M. Phil.GraduateSecondarySchool category OthersNo
response
ST teachers
Total Male Female No res Male Female No res Male Female Male FemaleSC teachers
Text booksUniformAttendanceStationery
% Passed
Avg. No. of Tchs.
%
Female literacyOverall literacy
dev. grant grantSchool T L M
Male Female
IVV
IIIIII
Grade R.R. D.O.R. P.R.
VIIVI
I - V
Enrolment by medium of instructions
Examination results
Retention rate
GPI
Primary cycle U. primary cycleState
DISTRICT ELEMENTARY EDUCATION REPORT CARD : 2005-06
GirlsGrade
IIIIIIIVVVI
VIII
AllGirls
Total
VII
% TotalGrossness
School category
27270
39
50 25911 6
0174
031
7 33 7
505 9041 59,069
8 1,8660 0
153 9,15129 1,918
479 65 33,877 9,61213,761 57,160 10,684
2,053 1,665 1,4460 0 0
3,815 1,918 3,35943,690 7,083 35,915
36,585 13,249 1,2171,789
384399
P + UP P+sec/hs U.P. only UP+sec
School categoryP. only
12.9 1.6 0.0 0.0 1.413.3
Number of Clusters 1188711
% Schools with SCR > 601.6 0.0 0.0 0.0
2.5 6.2 0.0 0.0 3.3% Schools with pre-primary sections 5.2 6.8 27.8 0.0 1.9% Schools with common toilets 59.2 80.4 88.9 0.0 92.0
% Schools with girls toilets 32.3 63.4 83.3 0.0 92.5% Schools with drinking water facility 65.9 76.7 83.3 0.0 95.3
% Enrolment in Govt. schools 73.4 81.1 47.6 0.0 17.3100.0 100.0 100.0 0.0 100.0
% No female teacher schools (tch>=2) 34.8 16.5 16.7 0.0 20.73.2 0.1 0.0 0.0 0.0
0.2 0.4 0.0 0.0 0.0%Enrolment in schools without blackboard 0.0 0.0 0.0 0.0 0.0
2001-02 2002-03 2003-04 2004-05 2005-06IIIIIIIVV
VIVII
Total U.P
24,20423,24423,59623,03923,95023,385
22,651
24,17224,04523,61223,53523,029
23,43622,187
24,52123,19323,35423,15319,990
19,32618,882
24,44524,11423,89023,33622,683
22,97524,618
90.4
46.0
92.7
54.3
78.2
95.8
43.3
11.10.0
11,75011,19011,35111,28311,33111,39711,171
330384424413257260235
228294296270217227202
1,652
classrooms
1,986136
01,803
80.480.097.6
0.090.8
9.89.9
9.8
2.40.07.1
10.00.00.02.1
50554
0825
542 449 37 3 0 72 33226 10 0 0 67 19
13 2 0 0 0 30 0 0 0 0 0
142 22 0 0 28 21
25 700 564 248 59 1 026 867 588 553 149 1 0 0
1 23 18 69 35 1 0 00 0 0 0 0 0 0 0
44 437 240 959 255 0 0 0
0 0 4 16 1 0 0 0
9211238
760
1457
94671
0478
676 0 4 0 0 188 152 53 550000
1007
3001
0000
21322
0315
18013
086
6620
86
4730
27
Terminalgrade Passed
VII boysV girlsV boys
VII girls
0 with >60%
40.416012188
1470
1943
46.731.6
0.023.4
39.945.712.7
0.021.3
47719Marathi English Hindi Urdu Nepali
694781632
051382
136818292183
0534
980864
800
687
251247
00
326
0184
00
358
% Schools recvd.
92.989.844.4
0.069.5
92.689.144.4
0.065.7
341121231
1351190
30390736
0810
40174123176431172
33032706664828
2.76.88.20.09.1
6.94.84.02.7
2.72.2
3.14.3
2005-062004-052003-04
MAHARASHTRA
48.3
Upper PrimaryPrimary
Sex ratio Sex ratio 0-6
7 62
VIII11.1
Enrolment of children
VIIITotal Pr.
0 0310 1,633
45 204
68 79
%Teachers recvd.in-service training
Total schools* Rural schools* Total enrolment* Rural enrolment* Teachers*
27.3
80.6
69.6
74.0 75.8
38.8 55.5% SC enrolment% SC girls to SC enrolment% ST enrolment
48.8 47.910.548.5 48.9
88.6
48.0
66.5
48.8
Position of teachers by educational qualification (other than para teacher)
(Previous academic year)Incentives : Number of beneficiaries
% ST girls to ST enrolment
% Girls
Number of villages
% 0 - 6 population
% SC population % ST population
% Urban population
% Schools with blackboard
% Enrolment in single-teacher schools
% Enrolment in schools without building
Primary Upperprimary
OBC EnrolmentPrimary U. Primary
% OBCEnrolment% OBC girls toOBC Enrolment
Pupil-teacher ratio (PTR)Student-classroom ratio (SCR)% Schools with <= 50 students% Schools with PTR > 100% Female teachers
% Schools established since 1995
Regular teachers Para-teachers
% minorrepairs
% majorrepairs
# = not applicable na = not available * Some totals may not match due to no response in classificatory data items
1.8 91.40.9 94.21.1 94.9
0.1 95.62.7 94.6
2927
48.63130
38.50.0
42.25.9
48.43337
4.00.3
43.48.1
0.000
0.00.00.00.0
48.42729
14.10.5
24.711.7
11.2 17.8 8.6 78.5 67.8
95698115.513.6
Category
PrivateGovt.PrivateGovtPrivateGovt.PrivateGovt.PrivateGovt.
Total population (in 000's)
Number of blocks/taluks
District
Decadal growth rate
Primary onlyPrimary with upper primaryPrimary with upper primary & sec/higher sec.Upper primary onlyUpper primary with sec./higher secondary
% Single classroom schools% Single teacher schools
P + UP P+sec/hs U.P. only UP+secP. only
No response in school category
Primary with upper primaryPrimary with U.P. & sec/higherUpper primary onlyUpper primary with sec./higher sec
Primary only
Primary onlyPrimary with upper primaryPrimary with Upper primary & sec/higherUpper primary only
Para-teachers
School category
Upper primary with sec./higher secondary
Primary onlyPrimary with upper prim.
P. onlyP + UPP+sec/hsU.P. onlyUP+sec
NER(U.Prim)GER(U.Prim)NER (Primary)GER (Primary)
Transition ratePrim. to U. Prim
7.8
Performance indicators
SC/ST Enrolment
Indicators
Classrooms/Other rooms
Prim.with U.P.&Sec/H.SUpper Primary onlyU. Primary with Sec./H.S.
Basic Data, 2001
Data reported from
70,276 58,198 68,652 69,986
19,940 21,088
121 7410,047
98.7
91.7
0.94
# ## #
# 79,473 2,303 1,734Total
1 - 4 5 - 7
95,785 94,221 95,364 94,083
98.3 72.298.4 73.295.8 29.896.5 30.2
Elementary Education: Report Card - BHANDARA
Mah
aras
htr
a
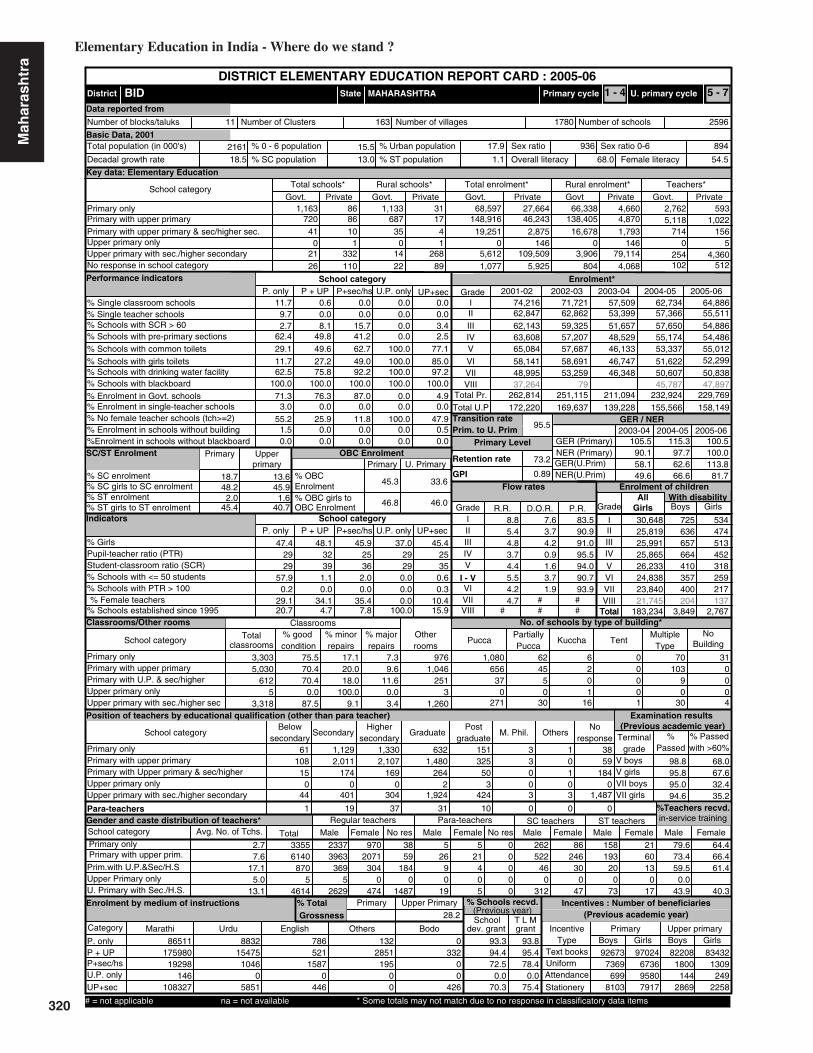
320
18.7 13.6
Key data: Elementary Education
2161
BID
(Previous academic year)
(Previous year)
Gender and caste distribution of teachers*
No. of schools by type of building*
BoysWith disability
Flow rates
Primary Level
Enrolment*
Number of schools
Grade
GER / NER
School category
Primary Upper primaryBoys Boys GirlsGirls
IncentiveType
School categoryMultiple
TypeKuccha
PartiallyPucca
PuccaTotal % good condition
Otherrooms
TentNo
Building
Classrooms
Belowsecondary
Highersecondary
Postgraduate
M. Phil.GraduateSecondarySchool category OthersNo
response
ST teachers
Total Male Female No res Male Female No res Male Female Male FemaleSC teachers
Text booksUniformAttendanceStationery
% Passed
Avg. No. of Tchs.
%
Female literacyOverall literacy
dev. grant grantSchool T L M
Male Female
IVV
IIIIII
Grade R.R. D.O.R. P.R.
VIIVI
I - V
Enrolment by medium of instructions
Examination results
Retention rate
GPI
Primary cycle U. primary cycleState
DISTRICT ELEMENTARY EDUCATION REPORT CARD : 2005-06
GirlsGrade
IIIIIIIVVVI
VIII
AllGirls
Total
VII
% TotalGrossness
School category
72041
021
86 68710 35
1332
014
26 110 22
1,163 8617 148,916
4 19,2511 0
268 5,61289 1,077
1,133 31 66,338 4,66046,243 138,405 4,870
2,875 16,678 1,793146 0 146
5,925 804 4,068109,509 3,906 79,114
68,597 27,664 2,7625,118
5931,022
P + UP P+sec/hs U.P. only UP+sec
School categoryP. only
11.7 0.6 0.0 0.0 0.09.7
Number of Clusters 25961780
% Schools with SCR > 600.0 0.0 0.0 0.0
2.7 8.1 15.7 0.0 3.4% Schools with pre-primary sections 62.4 49.8 41.2 0.0 2.5% Schools with common toilets 29.1 49.6 62.7 100.0 77.1
% Schools with girls toilets 11.7 27.2 49.0 100.0 85.0% Schools with drinking water facility 62.5 75.8 92.2 100.0 97.2
% Enrolment in Govt. schools 71.3 76.3 87.0 0.0 4.9100.0 100.0 100.0 100.0 100.0
% No female teacher schools (tch>=2) 55.2 25.9 11.8 100.0 47.93.0 0.0 0.0 0.0 0.0
1.5 0.0 0.0 0.0 0.5%Enrolment in schools without blackboard 0.0 0.0 0.0 0.0 0.0
2001-02 2002-03 2003-04 2004-05 2005-06IIIIIIIVV
VIVII
Total U.P
64,88655,51154,88654,48655,01252,299
50,838
62,73457,36657,65055,17453,337
51,62250,607
57,50953,39951,65748,52946,133
46,74746,348
71,72162,86259,32557,20757,687
58,69153,259
74,21662,84762,14363,60865,084
58,14148,995
105.5
58.1
115.3
62.6
100.5
113.8
45.9
2.00.0
30,64825,81925,99125,86526,23324,83823,840
725636657664410357400
534474513452318259217
3,303
classrooms
5,030612
53,318
75.570.470.4
0.087.5
17.120.0
7.3
18.0100.0
9.1
9.611.6
0.03.4
1,046251
31,260
976 1,080 62 6 0 70 31656 45 2 0 103 0
37 5 0 0 9 00 0 1 0 0 0
271 30 16 1 30 4
61 1,129 1,330 632 151 3 1108 2,011 2,107 1,480 325 3 0 59
15 174 169 264 50 0 1 1840 0 0 2 3 0 0 0
44 401 304 1,924 424 3 3 1,487
1 19 37 31 10 0 0 0
23373963
3695
2629
2071304
0474
970 38 5 5 0 262 86 158 2159
1840
1487
2690
19
21405
0000
52246
0312
24630
047
19320
073
6013
017
Terminalgrade Passed
VII boysV girlsV boys
VII girls
38 with >60%
79.633556140
8705
4614
73.459.5
0.043.9
64.466.461.4
40.3
86511Marathi Urdu English Others Bodo
17598019298
146108327
883215475
10460
5851
786521
15870
446
1322851
19500
0332
00
426
% Schools recvd.
93.394.472.5
0.070.3
93.895.478.4
0.075.4
926737369
6998103
822081800
1442869
97024673695807917
834321309
2492258
2.77.6
17.15.0
13.1
8.85.44.83.7
4.24.7
4.45.5
2005-062004-052003-04
MAHARASHTRA
35.4
Upper PrimaryPrimary
Sex ratio Sex ratio 0-6
11 163
VIII7.8
Enrolment of children
VIIITotal Pr.
0 5254 4,360102 512
714 156
%Teachers recvd.in-service training
Total schools* Rural schools* Total enrolment* Rural enrolment* Teachers*
28.2
100.0
81.7
90.1 97.7
49.6 66.6% SC enrolment% SC girls to SC enrolment% ST enrolment
48.2 45.92.0
45.4 40.7
45.3
46.8
33.6
46.0
Position of teachers by educational qualification (other than para teacher)
(Previous academic year)Incentives : Number of beneficiaries
% ST girls to ST enrolment
% Girls
Number of villages
% 0 - 6 population
% SC population % ST population
% Urban population
% Schools with blackboard
% Enrolment in single-teacher schools
% Enrolment in schools without building
Primary Upperprimary
OBC EnrolmentPrimary U. Primary
% OBCEnrolment% OBC girls toOBC Enrolment
Pupil-teacher ratio (PTR)Student-classroom ratio (SCR)% Schools with <= 50 students% Schools with PTR > 100% Female teachers
% Schools established since 1995
Regular teachers Para-teachers
% minorrepairs
% majorrepairs
# = not applicable na = not available * Some totals may not match due to no response in classificatory data items
7.6 83.53.7 90.94.2 91.00.9 95.51.6 94.03.7 90.71.9 93.9
3625
47.42929
57.90.2
29.120.7
48.13239
1.10.0
34.14.7
37.02929
0.00.00.0
100.0
45.42535
0.60.3
10.415.9
18.5 13.0 1.1 68.0 54.5
89493617.915.5
Category
PrivateGovt.PrivateGovtPrivateGovt.PrivateGovt.PrivateGovt.
Total population (in 000's)
Number of blocks/taluks
District
Decadal growth rate
Primary onlyPrimary with upper primaryPrimary with upper primary & sec/higher sec.Upper primary onlyUpper primary with sec./higher secondary
% Single classroom schools% Single teacher schools
P + UP P+sec/hs U.P. only UP+secP. only
No response in school category
Primary with upper primaryPrimary with U.P. & sec/higherUpper primary onlyUpper primary with sec./higher sec
Primary only
Primary onlyPrimary with upper primaryPrimary with Upper primary & sec/higherUpper primary only
Para-teachers
School category
Upper primary with sec./higher secondary
Primary onlyPrimary with upper prim.
P. onlyP + UPP+sec/hsU.P. onlyUP+sec
NER(U.Prim)GER(U.Prim)NER (Primary)GER (Primary)
Transition ratePrim. to U. Prim
1.6
Performance indicators
SC/ST Enrolment
Indicators
Classrooms/Other rooms
Prim.with U.P.&Sec/H.SUpper Primary onlyU. Primary with Sec./H.S.
Basic Data, 2001
Data reported from
172,220 169,637 139,228 155,566 158,149
37,264 79 45,787 47,897
204 13721,745
95.5
73.2
0.89
# ## #
# 183,234 3,849 2,767Total
1 - 4 5 - 7
262,814 251,115 211,094 232,924 229,769
98.8 68.095.8 67.695.0 32.494.6 35.2
Elementary Education in India - Where do we stand ?
Mah
aras
htr
a
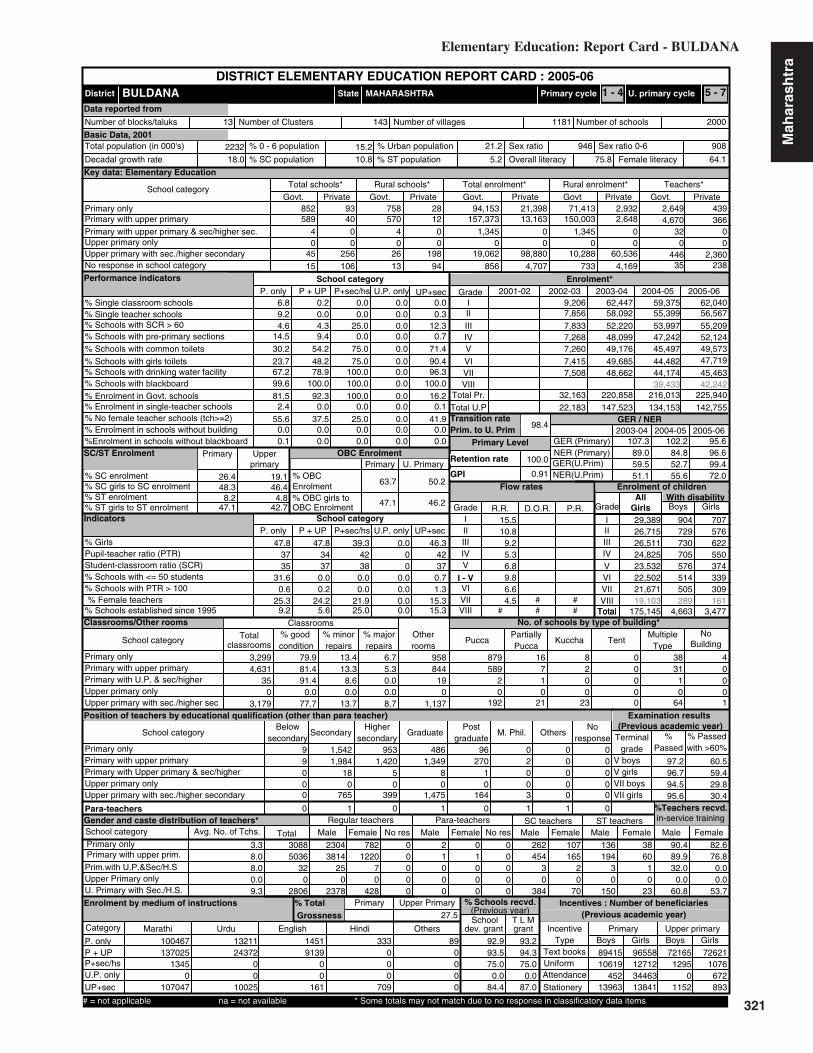
321
26.4 19.1
Key data: Elementary Education
2232
BULDANA
(Previous academic year)
(Previous year)
Gender and caste distribution of teachers*
No. of schools by type of building*
BoysWith disability
Flow rates
Primary Level
Enrolment*
Number of schools
Grade
GER / NER
School category
Primary Upper primaryBoys Boys GirlsGirls
IncentiveType
School categoryMultiple
TypeKuccha
PartiallyPucca
PuccaTotal % good condition
Otherrooms
TentNo
Building
Classrooms
Belowsecondary
Highersecondary
Postgraduate
M. Phil.GraduateSecondarySchool category OthersNo
response
ST teachers
Total Male Female No res Male Female No res Male Female Male FemaleSC teachers
Text booksUniformAttendanceStationery
% Passed
Avg. No. of Tchs.
%
Female literacyOverall literacy
dev. grant grantSchool T L M
Male Female
IVV
IIIIII
Grade R.R. D.O.R. P.R.
VIIVI
I - V
Enrolment by medium of instructions
Examination results
Retention rate
GPI
Primary cycle U. primary cycleState
DISTRICT ELEMENTARY EDUCATION REPORT CARD : 2005-06
GirlsGrade
IIIIIIIVVVI
VIII
AllGirls
Total
VII
% TotalGrossness
School category
58940
45
40 5700 40
2560
2615 106 13
852 9312 157,373
0 1,3450 0
198 19,06294 856
758 28 71,413 2,93213,163 150,003 2,648
0 1,345 00 0 0
4,707 733 4,16998,880 10,288 60,536
94,153 21,398 2,6494,670
439366
P + UP P+sec/hs U.P. only UP+sec
School categoryP. only
6.8 0.2 0.0 0.0 0.09.2
Number of Clusters 20001181
% Schools with SCR > 600.0 0.0 0.0 0.3
4.6 4.3 25.0 0.0 12.3% Schools with pre-primary sections 14.5 9.4 0.0 0.0 0.7% Schools with common toilets 30.2 54.2 75.0 0.0 71.4
% Schools with girls toilets 23.7 48.2 75.0 0.0 90.4% Schools with drinking water facility 67.2 78.9 100.0 0.0 96.3
% Enrolment in Govt. schools 81.5 92.3 100.0 0.0 16.299.6 100.0 100.0 0.0 100.0
% No female teacher schools (tch>=2) 55.6 37.5 25.0 0.0 41.92.4 0.0 0.0 0.0 0.1
0.0 0.0 0.0 0.0 0.0%Enrolment in schools without blackboard 0.1 0.0 0.0 0.0 0.0
2001-02 2002-03 2003-04 2004-05 2005-06IIIIIIIVV
VIVII
Total U.P
62,04056,56755,20952,12449,57347,719
45,463
59,37555,39953,99747,24245,497
44,48244,174
62,44758,09252,22048,09949,176
49,68548,662
9,2067,8567,8337,2687,260
7,4157,508
107.3
59.5
102.2
52.7
95.6
99.4
39.3
0.00.0
29,38926,71526,51124,82523,53222,50221,671
904729730705576514505
707576622550374339309
3,299
classrooms
4,63135
03,179
79.981.491.4
0.077.7
13.413.3
6.7
8.60.0
13.7
5.30.00.08.7
84419
01,137
958 879 16 8 0 38 4589 7 2 0 31 0
2 1 0 0 1 00 0 0 0 0 0
192 21 23 0 64 1
9 1,542 953 486 96 0 09 1,984 1,420 1,349 270 2 0 00 18 5 8 1 0 0 00 0 0 0 0 0 0 00 765 399 1,475 164 3 0 0
0 1 0 1 0 1 1 0
23043814
250
2378
122070
428
782 0 2 0 0 262 107 136 380000
1000
1000
0000
45430
384
16520
70
19430
150
6010
23
Terminalgrade Passed
VII boysV girlsV boys
VII girls
0 with >60%
90.430885036
320
2806
89.932.0
0.060.8
82.676.8
0.00.0
53.7
100467Marathi Urdu English Hindi Others
1370251345
0107047
1321124372
00
10025
14519139
00
161
333000
709
890000
% Schools recvd.
92.993.575.0
0.084.4
93.294.375.0
0.087.0
8941510619
45213963
721651295
01152
96558127123446313841
726211076
672893
3.38.08.00.09.3
15.510.8
9.25.3
6.64.5
6.89.8
2005-062004-052003-04
MAHARASHTRA
21.9
Upper PrimaryPrimary
Sex ratio Sex ratio 0-6
13 143
VIII25.0
Enrolment of children
VIIITotal Pr.
0 0446 2,360
35 238
32 0
%Teachers recvd.in-service training
Total schools* Rural schools* Total enrolment* Rural enrolment* Teachers*
27.5
96.6
72.0
89.0 84.8
51.1 55.6% SC enrolment% SC girls to SC enrolment% ST enrolment
48.3 46.48.2
47.1 42.7
63.7
47.1
50.2
46.2
Position of teachers by educational qualification (other than para teacher)
(Previous academic year)Incentives : Number of beneficiaries
% ST girls to ST enrolment
% Girls
Number of villages
% 0 - 6 population
% SC population % ST population
% Urban population
% Schools with blackboard
% Enrolment in single-teacher schools
% Enrolment in schools without building
Primary Upperprimary
OBC EnrolmentPrimary U. Primary
% OBCEnrolment% OBC girls toOBC Enrolment
Pupil-teacher ratio (PTR)Student-classroom ratio (SCR)% Schools with <= 50 students% Schools with PTR > 100% Female teachers
% Schools established since 1995
Regular teachers Para-teachers
% minorrepairs
% majorrepairs
# = not applicable na = not available * Some totals may not match due to no response in classificatory data items
3842
47.83735
31.60.6
25.39.2
47.83437
0.00.2
24.25.6
0.000
0.00.00.00.0
46.34237
0.71.3
15.315.3
18.0 10.8 5.2 75.8 64.1
90894621.215.2
Category
PrivateGovt.PrivateGovtPrivateGovt.PrivateGovt.PrivateGovt.
Total population (in 000's)
Number of blocks/taluks
District
Decadal growth rate
Primary onlyPrimary with upper primaryPrimary with upper primary & sec/higher sec.Upper primary onlyUpper primary with sec./higher secondary
% Single classroom schools% Single teacher schools
P + UP P+sec/hs U.P. only UP+secP. only
No response in school category
Primary with upper primaryPrimary with U.P. & sec/higherUpper primary onlyUpper primary with sec./higher sec
Primary only
Primary onlyPrimary with upper primaryPrimary with Upper primary & sec/higherUpper primary only
Para-teachers
School category
Upper primary with sec./higher secondary
Primary onlyPrimary with upper prim.
P. onlyP + UPP+sec/hsU.P. onlyUP+sec
NER(U.Prim)GER(U.Prim)NER (Primary)GER (Primary)
Transition ratePrim. to U. Prim
4.8
Performance indicators
SC/ST Enrolment
Indicators
Classrooms/Other rooms
Prim.with U.P.&Sec/H.SUpper Primary onlyU. Primary with Sec./H.S.
Basic Data, 2001
Data reported from
22,183 147,523 134,153 142,755
39,433 42,242
289 16119,103
98.4
100.0
0.91
# ## #
# 175,145 4,663 3,477Total
1 - 4 5 - 7
32,163 220,858 216,013 225,940
97.2 60.596.7 59.494.5 29.895.6 30.4
Elementary Education: Report Card - BULDANA
Mah
aras
htr
a

322
21.6 18.2
Key data: Elementary Education
2071
CHANDRAPUR
(Previous academic year)
(Previous year)
Gender and caste distribution of teachers*
No. of schools by type of building*
BoysWith disability
Flow rates
Primary Level
Enrolment*
Number of schools
Grade
GER / NER
School category
Primary Upper primaryBoys Boys GirlsGirls
IncentiveType
School categoryMultiple
TypeKuccha
PartiallyPucca
PuccaTotal % good condition
Otherrooms
TentNo
Building
Classrooms
Belowsecondary
Highersecondary
Postgraduate
M. Phil.GraduateSecondarySchool category OthersNo
response
ST teachers
Total Male Female No res Male Female No res Male Female Male FemaleSC teachers
Text booksUniformAttendanceStationery
% Passed
Avg. No. of Tchs.
%
Female literacyOverall literacy
dev. grant grantSchool T L M
Male Female
IVV
IIIIII
Grade R.R. D.O.R. P.R.
VIIVI
I - V
Enrolment by medium of instructions
Examination results
Retention rate
GPI
Primary cycle U. primary cycleState
DISTRICT ELEMENTARY EDUCATION REPORT CARD : 2005-06
GirlsGrade
IIIIIIIVVVI
VIII
AllGirls
Total
VII
% TotalGrossness
School category
57421
019
99 54554 18
0198
013
9 134 4
1,015 10755 110,97135 6,629
0 0146 5,317122 559
902 43 45,923 7,13027,099 102,874 13,58821,533 4,722 9,269
0 0 0
7,675 244 6,66775,979 2,860 45,629
63,060 18,896 2,4273,872
530833
P + UP P+sec/hs U.P. only UP+sec
School categoryP. only
16.8 0.7 1.3 0.0 0.017.7
Number of Clusters 22301469
% Schools with SCR > 600.3 0.0 0.0 0.5
2.3 3.9 4.0 0.0 8.3% Schools with pre-primary sections 10.1 8.2 41.3 0.0 1.8% Schools with common toilets 69.3 82.5 84.0 0.0 86.6
% Schools with girls toilets 43.6 66.4 94.7 0.0 90.3% Schools with drinking water facility 68.4 83.2 98.7 0.0 97.2
% Enrolment in Govt. schools 76.9 80.4 23.5 0.0 6.599.5 99.4 100.0 0.0 99.5
% No female teacher schools (tch>=2) 40.2 20.2 29.3 0.0 20.74.5 0.1 0.0 0.0 0.2
0.4 0.0 0.0 0.0 0.0%Enrolment in schools without blackboard 0.0 0.0 0.0 0.0 0.0
2001-02 2002-03 2003-04 2004-05 2005-06IIIIIIIVV
VIVII
Total U.P
43,74241,13142,44244,50941,86941,569
40,897
41,78841,35844,84139,84240,368
40,89039,912
43,57346,18942,47140,62242,170
42,46141,942
25,03422,51921,13620,44219,413
19,81120,251
92.3
55.1
87.8
51.8
78.4
93.3
43.8
13.30.0
20,85319,53120,46621,56920,04519,89519,828
582737751762583481531
483536639651412414431
2,947
classrooms
4,197794
02,096
83.484.292.2
0.089.6
12.511.7
4.1
6.20.08.7
4.11.60.01.7
990424
01,034
839 971 17 1 1 108 24558 8 0 0 93 14
64 2 1 0 4 40 0 0 0 0 0
179 5 1 0 21 11
58 981 1,201 558 127 0 325 1,197 1,645 1,409 379 2 0 013 103 85 409 143 1 2 0
0 0 0 0 0 0 0 049 394 388 1,522 268 3 1 0
1 5 58 60 17 0 0 0
17552953
3870
1928
1704369
0697
1173 0 20 9 0 365 213 323 1070000
2680
30
2240
13
0000
66373
0360
38662
0118
42460
0251
14317
0100
Terminalgrade Passed
VII boysV girlsV boys
VII girls
0 with >60%
56.629574705
7680
2668
58.126.6
0.023.7
53.747.310.5
0.024.1
73255Marathi English Hindi Urdu Telugu
11934412904
074152
19909273
142020
814
37212638
980
4022
1619352
00
1006
1072207
00
246
% Schools recvd.
92.390.845.3
0.082.9
90.890.632.0
0.073.7
6244911813
10006428
629373286
3783667
696431184214689
6187
716602743
6832941
2.67.0
10.20.0
12.3
10.36.04.83.2
7.06.8
6.96.2
2005-062004-052003-04
MAHARASHTRA
48.6
Upper PrimaryPrimary
Sex ratio Sex ratio 0-6
14 150
VIII21.3
Enrolment of children
VIIITotal Pr.
0 0167 2,501
50 666
189 579
%Teachers recvd.in-service training
Total schools* Rural schools* Total enrolment* Rural enrolment* Teachers*
0.9 29.7
77.7
65.6
74.8 71.8
44.4 52.4% SC enrolment% SC girls to SC enrolment% ST enrolment
48.2 48.624.648.2 47.4
66.8
48.1
52.9
48.1
Position of teachers by educational qualification (other than para teacher)
(Previous academic year)Incentives : Number of beneficiaries
% ST girls to ST enrolment
% Girls
Number of villages
% 0 - 6 population
% SC population % ST population
% Urban population
% Schools with blackboard
% Enrolment in single-teacher schools
% Enrolment in schools without building
Primary Upperprimary
OBC EnrolmentPrimary U. Primary
% OBCEnrolment% OBC girls toOBC Enrolment
Pupil-teacher ratio (PTR)Student-classroom ratio (SCR)% Schools with <= 50 students% Schools with PTR > 100% Female teachers
% Schools established since 1995
Regular teachers Para-teachers
% minorrepairs
% majorrepairs
# = not applicable na = not available * Some totals may not match due to no response in classificatory data items
3537
48.52828
61.70.0
40.012.7
48.42933
3.00.3
36.77.1
0.000
0.00.00.00.0
48.03039
8.30.5
26.67.4
17.3 14.3 18.1 73.2 62.9
93994832.113.5
Category
PrivateGovt.PrivateGovtPrivateGovt.PrivateGovt.PrivateGovt.
Total population (in 000's)
Number of blocks/taluks
District
Decadal growth rate
Primary onlyPrimary with upper primaryPrimary with upper primary & sec/higher sec.Upper primary onlyUpper primary with sec./higher secondary
% Single classroom schools% Single teacher schools
P + UP P+sec/hs U.P. only UP+secP. only
No response in school category
Primary with upper primaryPrimary with U.P. & sec/higherUpper primary onlyUpper primary with sec./higher sec
Primary only
Primary onlyPrimary with upper primaryPrimary with Upper primary & sec/higherUpper primary only
Para-teachers
School category
Upper primary with sec./higher secondary
Primary onlyPrimary with upper prim.
P. onlyP + UPP+sec/hsU.P. onlyUP+sec
NER(U.Prim)GER(U.Prim)NER (Primary)GER (Primary)
Transition ratePrim. to U. Prim
18.6
Performance indicators
SC/ST Enrolment
Indicators
Classrooms/Other rooms
Prim.with U.P.&Sec/H.SUpper Primary onlyU. Primary with Sec./H.S.
Basic Data, 2001
Data reported from
59,475 126,573 121,170 124,335
92 38,067 41,559
238 16819,824
98.1
100.0
0.92
# ## #
# 142,187 4,427 3,566Total
1 - 4 5 - 7
89,131 172,855 167,829 171,824
98.4 63.198.5 65.691.9 26.491.0 25.7
Elementary Education in India - Where do we stand ?
Mah
aras
htr
a

323
9.1 7.4
Key data: Elementary Education
1708
DHULE
(Previous academic year)
(Previous year)
Gender and caste distribution of teachers*
No. of schools by type of building*
BoysWith disability
Flow rates
Primary Level
Enrolment*
Number of schools
Grade
GER / NER
School category
Primary Upper primaryBoys Boys GirlsGirls
IncentiveType
School categoryMultiple
TypeKuccha
PartiallyPucca
PuccaTotal % good condition
Otherrooms
TentNo
Building
Classrooms
Belowsecondary
Highersecondary
Postgraduate
M. Phil.GraduateSecondarySchool category OthersNo
response
ST teachers
Total Male Female No res Male Female No res Male Female Male FemaleSC teachers
Text booksUniformAttendanceStationery
% Passed
Avg. No. of Tchs.
%
Female literacyOverall literacy
dev. grant grantSchool T L M
Male Female
IVV
IIIIII
Grade R.R. D.O.R. P.R.
VIIVI
I - V
Enrolment by medium of instructions
Examination results
Retention rate
GPI
Primary cycle U. primary cycleState
DISTRICT ELEMENTARY EDUCATION REPORT CARD : 2005-06
GirlsGrade
IIIIIIIVVVI
VIII
AllGirls
Total
VII
% TotalGrossness
School category
16827
110
64 1277 260
32314
13 20 9
910 10015 34,363
3 11,0910 102
263 2,89810 536
876 46 86,973 7,74126,410 26,721 3,799
2,288 10,521 1,0950 102 0
1,162 340 374108,968 359 75,714
91,331 32,555 2,9351,015
677596
P + UP P+sec/hs U.P. only UP+sec
School categoryP. only
10.5 2.2 0.0 0.0 0.09.7
Number of Clusters 1643900
% Schools with SCR > 603.0 0.0 0.0 0.0
4.7 13.4 0.0 0.0 4.8% Schools with pre-primary sections 65.6 69.0 20.6 0.0 3.3% Schools with common toilets 53.8 78.9 79.4 100.0 82.0
% Schools with girls toilets 30.3 66.4 91.2 100.0 86.5% Schools with drinking water facility 96.5 95.7 100.0 100.0 99.4
% Enrolment in Govt. schools 73.7 56.5 82.9 100.0 2.6100.0 99.1 100.0 100.0 100.0
% No female teacher schools (tch>=2) 32.3 11.6 8.8 0.0 28.22.6 0.7 0.0 0.0 0.0
0.1 0.0 0.0 0.0 0.1%Enrolment in schools without blackboard 0.0 0.2 0.0 0.0 0.0
2001-02 2002-03 2003-04 2004-05 2005-06IIIIIIIVV
VIVII
Total U.P
48,08443,78340,97838,86837,75735,987
34,370
48,54043,33641,46438,37536,000
35,16233,089
47,75144,02541,25038,30236,335
34,29532,872
50,13044,48142,52539,65536,033
34,66034,810
84,82776,26472,92567,08359,215
58,08050,709
108.3
53.3
106.6
53.3
95.0
98.4
39.7
0.00.0
22,27820,41719,31118,36217,62116,95216,191
692784775742424344339
408583561547244258233
3,472
classrooms
1,505362
63,199
89.488.996.4
100.093.2
8.39.0
2.3
3.30.05.3
2.10.30.01.4
524134
61,274
1,070 868 60 1 0 74 7197 19 0 0 16 0
26 2 0 0 6 01 0 0 0 0 0
254 35 4 0 38 2
63 2,133 530 655 103 0 835 745 360 353 74 2 4 37
8 104 54 155 33 0 0 90 0 1 6 3 0 0 0
52 771 300 1,862 315 1 10 632
0 3 4 10 1 0 0 0
1966882243
92597
691111
1714
1525 119 0 2 0 149 160 292 15737
90
632
000
13
1002
0000
6812
0213
6760
89
8052
0222
4915
058
Terminalgrade Passed
VII boysV girlsV boys
VII girls
118 with >60%
43.836121611
36310
3958
27.422.6
0.016.4
34.820.8
9.90.08.8
116587Marathi Urdu English Hindi Sindhi
473569623
0104219
449912794
00
5242
2224567
3385106
1629
17312
00
190
1022
000
% Schools recvd.
93.786.650.0
0.085.3
95.089.250.0
0.085.9
6497417575
105217738
523145676
1166052
71342167171815516845
539263441
2553945
3.66.9
10.710.011.9
10.88.07.35.5
6.96.5
7.37.9
2005-062004-052003-04
MAHARASHTRA
30.6
Upper PrimaryPrimary
Sex ratio Sex ratio 0-6
5 89
VIII20.6
Enrolment of children
VIIITotal Pr.
10 094 3,86447 93
283 80
%Teachers recvd.in-service training
Total schools* Rural schools* Total enrolment* Rural enrolment* Teachers*
29.8
97.5
69.1
89.2 88.5
43.4 54.2% SC enrolment% SC girls to SC enrolment% ST enrolment
47.0 47.639.846.7 42.2
48.1
46.4
40.6
48.0
Position of teachers by educational qualification (other than para teacher)
(Previous academic year)Incentives : Number of beneficiaries
% ST girls to ST enrolment
% Girls
Number of villages
% 0 - 6 population
% SC population % ST population
% Urban population
% Schools with blackboard
% Enrolment in single-teacher schools
% Enrolment in schools without building
Primary Upperprimary
OBC EnrolmentPrimary U. Primary
% OBCEnrolment% OBC girls toOBC Enrolment
Pupil-teacher ratio (PTR)Student-classroom ratio (SCR)% Schools with <= 50 students% Schools with PTR > 100% Female teachers
% Schools established since 1995
Regular teachers Para-teachers
% minorrepairs
% majorrepairs
# = not applicable na = not available * Some totals may not match due to no response in classificatory data items
6.1 83.14.5 87.64.1 88.62.9 91.5
3.6 88.41.5 91.6
3737
47.53436
35.40.2
42.310.2
45.13840
4.70.4
43.022.8
17.61017
0.00.0
10.0100.0
48.12835
2.10.0
18.115.6
16.0 6.4 26.0 71.6 61.4
90794426.114.9
Category
PrivateGovt.PrivateGovtPrivateGovt.PrivateGovt.PrivateGovt.
Total population (in 000's)
Number of blocks/taluks
District
Decadal growth rate
Primary onlyPrimary with upper primaryPrimary with upper primary & sec/higher sec.Upper primary onlyUpper primary with sec./higher secondary
% Single classroom schools% Single teacher schools
P + UP P+sec/hs U.P. only UP+secP. only
No response in school category
Primary with upper primaryPrimary with U.P. & sec/higherUpper primary onlyUpper primary with sec./higher sec
Primary only
Primary onlyPrimary with upper primaryPrimary with Upper primary & sec/higherUpper primary only
Para-teachers
School category
Upper primary with sec./higher secondary
Primary onlyPrimary with upper prim.
P. onlyP + UPP+sec/hsU.P. onlyUP+sec
NER(U.Prim)GER(U.Prim)NER (Primary)GER (Primary)
Transition ratePrim. to U. Prim
21.8
Performance indicators
SC/ST Enrolment
Indicators
Classrooms/Other rooms
Prim.with U.P.&Sec/H.SUpper Primary onlyU. Primary with Sec./H.S.
Basic Data, 2001
Data reported from
168,004 105,503 103,502 104,251 108,114
42,603 31,933 31,877
274 18715,059
91.5
73.3
0.88
# ## #
# 131,132 4,100 2,834Total
1 - 4 5 - 7
301,099 176,791 171,328 171,715 171,713
98.3 66.798.2 66.092.8 27.789.3 28.5
Elementary Education: Report Card - DHULE
Mah
aras
htr
a
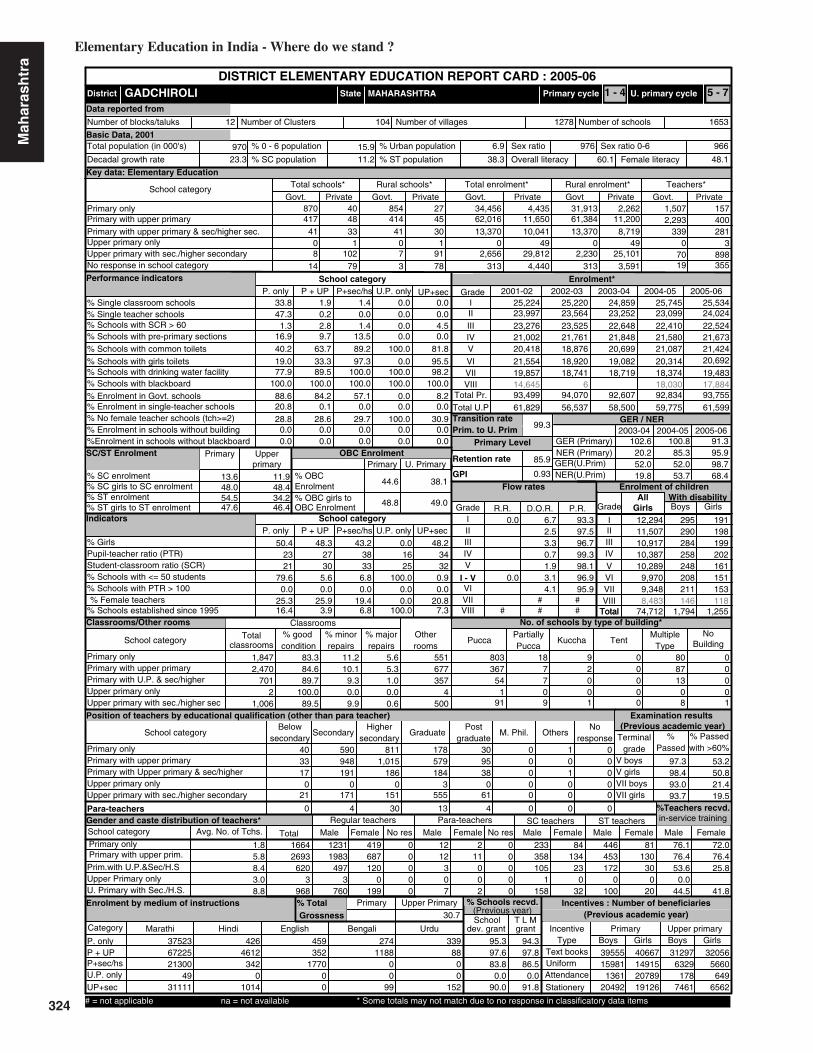
324
13.6 11.9
Key data: Elementary Education
970
GADCHIROLI
(Previous academic year)
(Previous year)
Gender and caste distribution of teachers*
No. of schools by type of building*
BoysWith disability
Flow rates
Primary Level
Enrolment*
Number of schools
Grade
GER / NER
School category
Primary Upper primaryBoys Boys GirlsGirls
IncentiveType
School categoryMultiple
TypeKuccha
PartiallyPucca
PuccaTotal % good condition
Otherrooms
TentNo
Building
Classrooms
Belowsecondary
Highersecondary
Postgraduate
M. Phil.GraduateSecondarySchool category OthersNo
response
ST teachers
Total Male Female No res Male Female No res Male Female Male FemaleSC teachers
Text booksUniformAttendanceStationery
% Passed
Avg. No. of Tchs.
%
Female literacyOverall literacy
dev. grant grantSchool T L M
Male Female
IVV
IIIIII
Grade R.R. D.O.R. P.R.
VIIVI
I - V
Enrolment by medium of instructions
Examination results
Retention rate
GPI
Primary cycle U. primary cycleState
DISTRICT ELEMENTARY EDUCATION REPORT CARD : 2005-06
GirlsGrade
IIIIIIIVVVI
VIII
AllGirls
Total
VII
% TotalGrossness
School category
41741
08
48 41433 41
1102
07
14 79 3
870 4045 62,01630 13,370
1 091 2,65678 313
854 27 31,913 2,26211,650 61,384 11,20010,041 13,370 8,719
49 0 49
4,440 313 3,59129,812 2,230 25,101
34,456 4,435 1,5072,293
157400
P + UP P+sec/hs U.P. only UP+sec
School categoryP. only
33.8 1.9 1.4 0.0 0.047.3
Number of Clusters 16531278
% Schools with SCR > 600.2 0.0 0.0 0.0
1.3 2.8 1.4 0.0 4.5% Schools with pre-primary sections 16.9 9.7 13.5 0.0 0.0% Schools with common toilets 40.2 63.7 89.2 100.0 81.8
% Schools with girls toilets 19.0 33.3 97.3 0.0 95.5% Schools with drinking water facility 77.9 89.5 100.0 100.0 98.2
% Enrolment in Govt. schools 88.6 84.2 57.1 0.0 8.2100.0 100.0 100.0 100.0 100.0
% No female teacher schools (tch>=2) 28.8 28.6 29.7 100.0 30.920.8 0.1 0.0 0.0 0.0
0.0 0.0 0.0 0.0 0.0%Enrolment in schools without blackboard 0.0 0.0 0.0 0.0 0.0
2001-02 2002-03 2003-04 2004-05 2005-06IIIIIIIVV
VIVII
Total U.P
25,53424,02422,52421,67321,42420,692
19,483
25,74523,09922,41021,58021,087
20,31418,374
24,85923,25222,64821,84820,699
19,08218,719
25,22023,56423,52521,76118,876
18,92018,741
25,22423,99723,27621,00220,418
21,55419,857
102.6
52.0
100.8
52.0
91.3
98.7
43.2
6.80.0
12,29411,50710,91710,38710,289
9,9709,348
295290284258248208211
191198199202161151153
1,847
classrooms
2,470701
21,006
83.384.689.7
100.089.5
11.210.1
5.6
9.30.09.9
5.31.00.00.6
677357
4500
551 803 18 9 0 80 0367 7 2 0 87 0
54 7 0 0 13 01 0 0 0 0 0
91 9 1 0 8 1
40 590 811 178 30 0 133 948 1,015 579 95 0 0 017 191 186 184 38 0 1 0
0 0 0 3 0 0 0 021 171 151 555 61 0 0 0
0 4 30 13 4 0 0 0
12311983
4973
760
687120
0199
419 0 12 2 0 233 84 446 810000
12307
11002
0000
358105
1158
13423
032
453172
0100
13030
020
Terminalgrade Passed
VII boysV girlsV boys
VII girls
0 with >60%
76.116642693
6203
968
76.453.6
0.044.5
72.076.425.8
41.8
37523Marathi Hindi English Bengali Urdu
6722521300
4931111
4264612
3420
1014
459352
177000
2741188
00
99
33988
00
152
% Schools recvd.
95.397.683.8
0.090.0
94.397.886.5
0.091.8
3955515981
136120492
312976329
1787461
40667149152078919126
320565660
6496562
1.85.88.43.08.8
0.0
0.0
2005-062004-052003-04
MAHARASHTRA
19.4
Upper PrimaryPrimary
Sex ratio Sex ratio 0-6
12 104
VIII6.8
Enrolment of children
VIIITotal Pr.
0 370 89819 355
339 281
%Teachers recvd.in-service training
Total schools* Rural schools* Total enrolment* Rural enrolment* Teachers*
30.7
95.9
68.4
20.2 85.3
19.8 53.7% SC enrolment% SC girls to SC enrolment% ST enrolment
48.0 48.454.547.6 46.4
44.6
48.8
38.1
49.0
Position of teachers by educational qualification (other than para teacher)
(Previous academic year)Incentives : Number of beneficiaries
% ST girls to ST enrolment
% Girls
Number of villages
% 0 - 6 population
% SC population % ST population
% Urban population
% Schools with blackboard
% Enrolment in single-teacher schools
% Enrolment in schools without building
Primary Upperprimary
OBC EnrolmentPrimary U. Primary
% OBCEnrolment% OBC girls toOBC Enrolment
Pupil-teacher ratio (PTR)Student-classroom ratio (SCR)% Schools with <= 50 students% Schools with PTR > 100% Female teachers
% Schools established since 1995
Regular teachers Para-teachers
% minorrepairs
% majorrepairs
# = not applicable na = not available * Some totals may not match due to no response in classificatory data items
6.7 93.32.5 97.53.3 96.70.7 99.31.9 98.13.1 96.94.1 95.9
3338
50.42321
79.60.0
25.316.4
48.32730
5.60.0
25.93.9
0.01625
100.00.00.0
100.0
48.23432
0.90.0
20.87.3
23.3 11.2 38.3 60.1 48.1
9669766.915.9
Category
PrivateGovt.PrivateGovtPrivateGovt.PrivateGovt.PrivateGovt.
Total population (in 000's)
Number of blocks/taluks
District
Decadal growth rate
Primary onlyPrimary with upper primaryPrimary with upper primary & sec/higher sec.Upper primary onlyUpper primary with sec./higher secondary
% Single classroom schools% Single teacher schools
P + UP P+sec/hs U.P. only UP+secP. only
No response in school category
Primary with upper primaryPrimary with U.P. & sec/higherUpper primary onlyUpper primary with sec./higher sec
Primary only
Primary onlyPrimary with upper primaryPrimary with Upper primary & sec/higherUpper primary only
Para-teachers
School category
Upper primary with sec./higher secondary
Primary onlyPrimary with upper prim.
P. onlyP + UPP+sec/hsU.P. onlyUP+sec
NER(U.Prim)GER(U.Prim)NER (Primary)GER (Primary)
Transition ratePrim. to U. Prim
34.2
Performance indicators
SC/ST Enrolment
Indicators
Classrooms/Other rooms
Prim.with U.P.&Sec/H.SUpper Primary onlyU. Primary with Sec./H.S.
Basic Data, 2001
Data reported from
61,829 56,537 58,500 59,775 61,599
14,645 6 18,030 17,884
146 1188,483
99.3
85.9
0.93
# ## #
# 74,712 1,794 1,255Total
1 - 4 5 - 7
93,499 94,070 92,607 92,834 93,755
97.3 53.298.4 50.893.0 21.493.7 19.5
Elementary Education in India - Where do we stand ?
Mah
aras
htr
a

325
17.5 13.1
Key data: Elementary Education
1201
GONDIYA
(Previous academic year)
(Previous year)
Gender and caste distribution of teachers*
No. of schools by type of building*
BoysWith disability
Flow rates
Primary Level
Enrolment*
Number of schools
Grade
GER / NER
School category
Primary Upper primaryBoys Boys GirlsGirls
IncentiveType
School categoryMultiple
TypeKuccha
PartiallyPucca
PuccaTotal % good condition
Otherrooms
TentNo
Building
Classrooms
Belowsecondary
Highersecondary
Postgraduate
M. Phil.GraduateSecondarySchool category OthersNo
response
ST teachers
Total Male Female No res Male Female No res Male Female Male FemaleSC teachers
Text booksUniformAttendanceStationery
% Passed
Avg. No. of Tchs.
%
Female literacyOverall literacy
dev. grant grantSchool T L M
Male Female
IVV
IIIIII
Grade R.R. D.O.R. P.R.
VIIVI
I - V
Enrolment by medium of instructions
Examination results
Retention rate
GPI
Primary cycle U. primary cycleState
DISTRICT ELEMENTARY EDUCATION REPORT CARD : 2005-06
GirlsGrade
IIIIIIIVVVI
VIII
AllGirls
Total
VII
% TotalGrossness
School category
37818
030
71 37221 17
0115
023
1 72 1
472 6349 83,30116 6,100
0 0100 7,340
69 501
441 45 30,095 5,19019,389 82,042 12,203
6,226 5,777 4,6660 0 0
4,727 501 4,46932,988 4,772 26,980
33,607 8,388 1,2362,720
316546
P + UP P+sec/hs U.P. only UP+sec
School categoryP. only
11.0 1.1 5.1 0.0 2.86.9
Number of Clusters 1241813
% Schools with SCR > 600.9 0.0 0.0 1.4
3.2 7.6 7.7 0.0 5.5% Schools with pre-primary sections 9.9 8.9 20.5 0.0 4.1% Schools with common toilets 41.5 64.1 89.7 0.0 91.7
% Schools with girls toilets 27.5 58.6 94.9 0.0 97.2% Schools with drinking water facility 72.9 86.0 100.0 0.0 97.9
% Enrolment in Govt. schools 80.0 81.1 49.5 0.0 18.2100.0 100.0 100.0 0.0 100.0
% No female teacher schools (tch>=2) 51.0 26.5 15.4 0.0 19.32.0 0.4 0.0 0.0 2.0
0.0 0.0 0.0 0.0 0.0%Enrolment in schools without blackboard 0.0 0.0 0.0 0.0 0.0
2001-02 2002-03 2003-04 2004-05 2005-06IIIIIIIVV
VIVII
Total U.P
26,90125,84825,92225,98826,32125,959
24,662
23,53722,55623,15523,36122,571
21,86221,200
26,17725,49126,56526,41416,475
15,59415,213
24,15923,72825,05723,74717,427
18,06919,499
90.8
35.1
85.5
48.6
82.4
99.6
48.6
2.60.0
13,35612,60812,59812,71613,01312,82812,268
261240255203162136135
198184172159126102
93
1,060
classrooms
2,057285
01,052
74.577.589.2
0.086.8
16.613.3
8.9
8.00.07.9
9.22.80.05.3
694184
0637
432 433 17 6 0 75 4321 9 1 0 113 5
27 7 0 0 4 10 0 0 0 0 0
112 12 2 0 15 4
16 597 501 277 58 0 316 1,024 909 888 211 0 1 018 107 62 117 40 1 0 0
0 0 0 0 0 0 0 030 342 192 565 151 1 0 0
1 51 215 80 21 0 0 0
9982182
2400
979
867105
0302
454 0 59 41 0 185 90 86 410000
14130
34
7600
13
0000
39953
0231
17113
063
16427
068
7760
17
Terminalgrade Passed
VII boysV girlsV boys
VII girls
0 with >60%
43.315523266
3480
1328
50.732.5
0.023.5
32.938.721.9
0.021.6
34537Marathi Hindi English Others Nepali
801799360
032137
625316528
13160
7246
103649751634
0173
188548
00
765
45365266
00
% Schools recvd.
90.792.271.8
0.079.3
90.192.269.2
0.078.6
374857242
37810465
352432750
1533376
431877660
1366211066
386562704
2273469
2.97.38.90.09.2
6.44.35.93.6
4.92.7
3.74.8
2005-062004-052003-04
MAHARASHTRA
30.2
Upper PrimaryPrimary
Sex ratio Sex ratio 0-6
8 93
VIII15.4
Enrolment of children
VIIITotal Pr.
0 0240 1,088
11 386
167 181
%Teachers recvd.in-service training
Total schools* Rural schools* Total enrolment* Rural enrolment* Teachers*
29.4
85.5
70.3
78.6 70.4
29.5 48.7% SC enrolment% SC girls to SC enrolment% ST enrolment
47.9 48.724.649.5 49.2
73.6
49.3
53.4
50.0
Position of teachers by educational qualification (other than para teacher)
(Previous academic year)Incentives : Number of beneficiaries
% ST girls to ST enrolment
% Girls
Number of villages
% 0 - 6 population
% SC population % ST population
% Urban population
% Schools with blackboard
% Enrolment in single-teacher schools
% Enrolment in schools without building
Primary Upperprimary
OBC EnrolmentPrimary U. Primary
% OBCEnrolment% OBC girls toOBC Enrolment
Pupil-teacher ratio (PTR)Student-classroom ratio (SCR)% Schools with <= 50 students% Schools with PTR > 100% Female teachers
% Schools established since 1995
Regular teachers Para-teachers
% minorrepairs
% majorrepairs
# = not applicable na = not available * Some totals may not match due to no response in classificatory data items
4335
50.42740
41.10.2
31.910.1
48.73150
1.60.4
28.96.2
0.000
0.00.00.00.0
49.03038
4.82.1
23.711.0
10.5 14.0 16.4 78.5 67.6
958100511.914.3
Category
PrivateGovt.PrivateGovtPrivateGovt.PrivateGovt.PrivateGovt.
Total population (in 000's)
Number of blocks/taluks
District
Decadal growth rate
Primary onlyPrimary with upper primaryPrimary with upper primary & sec/higher sec.Upper primary onlyUpper primary with sec./higher secondary
% Single classroom schools% Single teacher schools
P + UP P+sec/hs U.P. only UP+secP. only
No response in school category
Primary with upper primaryPrimary with U.P. & sec/higherUpper primary onlyUpper primary with sec./higher sec
Primary only
Primary onlyPrimary with upper primaryPrimary with Upper primary & sec/higherUpper primary only
Para-teachers
School category
Upper primary with sec./higher secondary
Primary onlyPrimary with upper prim.
P. onlyP + UPP+sec/hsU.P. onlyUP+sec
NER(U.Prim)GER(U.Prim)NER (Primary)GER (Primary)
Transition ratePrim. to U. Prim
16.4
Performance indicators
SC/ST Enrolment
Indicators
Classrooms/Other rooms
Prim.with U.P.&Sec/H.SUpper Primary onlyU. Primary with Sec./H.S.
Basic Data, 2001
Data reported from
54,995 47,282 65,633 76,942
18,666 20,966
83 4010,357
100.0
100.0
0.96
# ## #
# 89,387 1,392 1,034Total
1 - 4 5 - 7
96,691 104,647 92,609 104,659
97.4 67.998.1 70.196.2 31.797.0 32.1
Elementary Education: Report Card - GONDIYA
Mah
aras
htr
a

326
24.2 19.0
Key data: Elementary Education
987
HINGOLI
(Previous academic year)
(Previous year)
Gender and caste distribution of teachers*
No. of schools by type of building*
BoysWith disability
Flow rates
Primary Level
Enrolment*
Number of schools
Grade
GER / NER
School category
Primary Upper primaryBoys Boys GirlsGirls
IncentiveType
School categoryMultiple
TypeKuccha
PartiallyPucca
PuccaTotal % good condition
Otherrooms
TentNo
Building
Classrooms
Belowsecondary
Highersecondary
Postgraduate
M. Phil.GraduateSecondarySchool category OthersNo
response
ST teachers
Total Male Female No res Male Female No res Male Female Male FemaleSC teachers
Text booksUniformAttendanceStationery
% Passed
Avg. No. of Tchs.
%
Female literacyOverall literacy
dev. grant grantSchool T L M
Male Female
IVV
IIIIII
Grade R.R. D.O.R. P.R.
VIIVI
I - V
Enrolment by medium of instructions
Examination results
Retention rate
GPI
Primary cycle U. primary cycleState
DISTRICT ELEMENTARY EDUCATION REPORT CARD : 2005-06
GirlsGrade
IIIIIIIVVVI
VIII
AllGirls
Total
VII
% TotalGrossness
School category
37222
526
19 36326 22
353
325
0 0 0
409 374 84,232
20 6,4843 1,083
47 8,0550 0
397 20 33,045 6,04211,410 80,689 1,375
5,135 6,484 3,544756 564 756
0 0 014,535 6,849 11,312
34,577 14,083 9901,785
15197
P + UP P+sec/hs U.P. only UP+sec
School categoryP. only
16.4 2.8 2.1 0.0 1.310.1
Number of Clusters 972736
% Schools with SCR > 600.3 0.0 0.0 1.3
12.6 28.1 35.4 12.5 30.4% Schools with pre-primary sections 0.0 0.0 0.0 0.0 0.0% Schools with common toilets 23.5 50.6 68.8 62.5 69.6
% Schools with girls toilets 15.0 26.1 66.7 75.0 82.3% Schools with drinking water facility 67.7 80.8 100.0 100.0 93.7
% Enrolment in Govt. schools 71.1 88.1 55.8 58.9 35.7100.0 100.0 100.0 100.0 100.0
% No female teacher schools (tch>=2) 67.0 68.5 75.0 62.5 77.23.8 0.0 0.0 0.0 1.0
0.8 0.3 0.0 0.0 1.7%Enrolment in schools without blackboard 0.0 0.0 0.0 0.0 0.0
2001-02 2002-03 2003-04 2004-05 2005-06IIIIIIIVV
VIVII
Total U.P
31,92028,32524,48523,49421,40319,591
18,193
16,36315,02714,29514,18111,998
11,19110,184
31,84628,09627,47027,76425,749
24,53722,346
28,96526,25225,30824,79823,834
22,60218,926
126.2
63.9
63.1
28.6
103.6
93.2
41.4
18.812.5
16,22415,46911,79811,22910,280
9,4588,348
448432417382348210211
398385397329254171139
1,245
classrooms
2,158278
42448
98.597.997.5
100.095.2
1.42.0
0.1
2.50.04.6
0.10.00.00.3
5798916
137
499 438 0 0 2 2 4382 6 0 1 2 0
45 0 0 1 0 28 0 0 0 0 0
76 0 0 2 1 0
4 1,076 33 11 3 0 03 1,816 24 23 7 0 0 21 228 0 4 0 0 0 00 44 0 0 0 0 0 04 393 0 3 1 0 0 0
0 20 0 0 0 0 0 0
9411649
20640
363
22427
438
186 8 4 2 0 152 25 95 122000
6212
1200
0000
27842
558
30602
14210
012
11112
Terminalgrade Passed
VII boysV girlsV boys
VII girls
8 with >60%
0.611411882
23745
403
0.80.50.00.0
0.50.00.00.02.6
44555Marathi Urdu Others English Bodo
8858011846
222022147
24174456
00
747
88568733
0305
00
79600
07225
00
% Schools recvd.
100.0100.0100.0100.0
98.7
0.20.50.00.01.3
42584769
41800
33572129
0734
45943735
631889
31839130
0538
2.64.84.95.65.1
22.315.614.511.6
15.416.8
13.615.8
2005-062004-052003-04
MAHARASHTRA
12.2
Upper PrimaryPrimary
Sex ratio Sex ratio 0-6
5 10
VIII22.9
Enrolment of children
VIIITotal Pr.
31 14159 244
0 0
119 118
%Teachers recvd.in-service training
Total schools* Rural schools* Total enrolment* Rural enrolment* Teachers*
35.9
100.0
59.8
56.7
51.1 29.3% SC enrolment% SC girls to SC enrolment% ST enrolment
49.0 47.111.747.1 42.3
35.3
52.7
21.4
46.0
Position of teachers by educational qualification (other than para teacher)
(Previous academic year)Incentives : Number of beneficiaries
% ST girls to ST enrolment
% Girls
Number of villages
% 0 - 6 population
% SC population % ST population
% Urban population
% Schools with blackboard
% Enrolment in single-teacher schools
% Enrolment in schools without building
Primary Upperprimary
OBC EnrolmentPrimary U. Primary
% OBCEnrolment% OBC girls toOBC Enrolment
Pupil-teacher ratio (PTR)Student-classroom ratio (SCR)% Schools with <= 50 students% Schools with PTR > 100% Female teachers
% Schools established since 1995
Regular teachers Para-teachers
% minorrepairs
% majorrepairs
# = not applicable na = not available * Some totals may not match due to no response in classificatory data items
4249
52.64339
45.53.4
16.511.4
49.15144
2.06.6
12.03.1
55.44144
0.00.08.9
12.5
45.35650
11.417.7
9.432.9
19.8 10.2 8.8 66.3 51.2
92795315.616.9
Category
PrivateGovt.PrivateGovtPrivateGovt.PrivateGovt.PrivateGovt.
Total population (in 000's)
Number of blocks/taluks
District
Decadal growth rate
Primary onlyPrimary with upper primaryPrimary with upper primary & sec/higher sec.Upper primary onlyUpper primary with sec./higher secondary
% Single classroom schools% Single teacher schools
P + UP P+sec/hs U.P. only UP+secP. only
No response in school category
Primary with upper primaryPrimary with U.P. & sec/higherUpper primary onlyUpper primary with sec./higher sec
Primary only
Primary onlyPrimary with upper primaryPrimary with Upper primary & sec/higherUpper primary only
Para-teachers
School category
Upper primary with sec./higher secondary
Primary onlyPrimary with upper prim.
P. onlyP + UPP+sec/hsU.P. onlyUP+sec
NER(U.Prim)GER(U.Prim)NER (Primary)GER (Primary)
Transition ratePrim. to U. Prim
8.0
Performance indicators
SC/ST Enrolment
Indicators
Classrooms/Other rooms
Prim.with U.P.&Sec/H.SUpper Primary onlyU. Primary with Sec./H.S.
Basic Data, 2001
Data reported from
65,362 72,632 33,373 59,187
211 7,204 12,939
100 665,780
100.0
75.4
1.02
# ## #
# 82,806 2,448 2,073Total
1 - 4 5 - 7
105,323 115,176 59,866 108,224
90.6 58.792.2 58.287.1 27.388.3 28.4
Elementary Education in India - Where do we stand ?
Mah
aras
htr
a

327
13.6 9.9
Key data: Elementary Education
3683
JALGAON
(Previous academic year)
(Previous year)
Gender and caste distribution of teachers*
No. of schools by type of building*
BoysWith disability
Flow rates
Primary Level
Enrolment*
Number of schools
Grade
GER / NER
School category
Primary Upper primaryBoys Boys GirlsGirls
IncentiveType
School categoryMultiple
TypeKuccha
PartiallyPucca
PuccaTotal % good condition
Otherrooms
TentNo
Building
Classrooms
Belowsecondary
Highersecondary
Postgraduate
M. Phil.GraduateSecondarySchool category OthersNo
response
ST teachers
Total Male Female No res Male Female No res Male Female Male FemaleSC teachers
Text booksUniformAttendanceStationery
% Passed
Avg. No. of Tchs.
%
Female literacyOverall literacy
dev. grant grantSchool T L M
Male Female
IVV
IIIIII
Grade R.R. D.O.R. P.R.
VIIVI
I - V
Enrolment by medium of instructions
Examination results
Retention rate
GPI
Primary cycle U. primary cycleState
DISTRICT ELEMENTARY EDUCATION REPORT CARD : 2005-06
GirlsGrade
IIIIIIIVVVI
VIII
AllGirls
Total
VII
% TotalGrossness
School category
58424
040
85 4516 221
5570
250 0 0
1,280 16818 160,557
4 7,6730 0
409 10,0110 0
1,205 44 144,736 10,08639,620 121,753 7,328
2,754 7,068 1,640244 0 0
0 0 0197,506 4,941 130,368
157,635 60,081 5,1584,986
1,179934
P + UP P+sec/hs U.P. only UP+sec
School categoryP. only
4.0 0.0 0.0 0.0 0.21.8
Number of Clusters 27451402
% Schools with SCR > 600.0 0.0 0.0 0.0
7.5 13.0 3.3 0.0 13.6% Schools with pre-primary sections 17.6 17.3 33.3 0.0 5.0% Schools with common toilets 35.8 56.2 70.0 100.0 78.2
% Schools with girls toilets 27.6 52.9 93.3 100.0 89.3% Schools with drinking water facility 74.0 81.0 100.0 100.0 98.8
% Enrolment in Govt. schools 72.4 80.2 73.6 0.0 4.8100.0 100.0 100.0 100.0 100.0
% No female teacher schools (tch>=2) 45.2 16.6 16.7 0.0 31.70.4 0.0 0.0 0.0 0.0
0.0 0.0 0.0 0.0 0.0%Enrolment in schools without blackboard 0.0 0.0 0.0 0.0 0.0
2001-02 2002-03 2003-04 2004-05 2005-06IIIIIIIVV
VIVII
Total U.P
96,69386,45585,17181,02377,82873,757
70,748
92,11587,85386,10179,62877,318
75,77172,602
92,47588,70084,26878,54876,003
77,85972,335
101.7
55.3
100.9
53.8
89.6
93.9
37.1
6.70.0
44,33839,77739,65337,64836,42634,27532,924
902678726669506440491
566461540479386288302
5,486
classrooms
4,562229
04,788
88.488.392.6
100.092.1
8.98.4
2.7
4.40.06.3
3.33.00.01.5
981130
42,103
1,668 1,263 64 5 0 112 4569 27 3 0 67 3
22 5 1 0 2 00 1 0 0 0 0
496 41 11 0 41 5
307 2,980 1,376 926 169 1 30256 2,520 1,315 1,335 211 0 19 207
21 98 31 109 30 0 0 1130 2 1 4 0 0 0 6
121 1,291 619 3,117 595 3 28 3,372
5 43 79 72 16 0 0 0
37143469
2094
4547
218780
31228
2074 476 46 27 0 468 227 339 122207113
63371
3280
59
2500
17
0001
40112
0499
25060
170
26622
0263
11890
82
Terminalgrade Passed
VII boysV girlsV boys
VII girls
475 with >60%
47.363375920
41013
9223
43.725.8
0.018.3
39.240.311.3
0.013.4
196156Marathi Urdu Others English Hindi
1559097833
244188738
478711875
00
3331
44706623
00
6649
13102607
9750
193
3892174
00
1262
% Schools recvd.
88.986.446.7
100.065.2
89.989.256.7
100.066.8
11199210274
99011388
998235357
397540
1352547919
379379205
1080832816
9724196
4.48.8
13.713.015.4
13.29.38.96.3
8.57.8
9.59.6
2005-062004-052003-04
MAHARASHTRA
19.5
Upper PrimaryPrimary
Sex ratio Sex ratio 0-6
16 175
VIII13.3
Enrolment of children
VIIITotal Pr.
0 13557 8,666
0 0
314 96
%Teachers recvd.in-service training
Total schools* Rural schools* Total enrolment* Rural enrolment* Teachers*
27.2
92.2
68.3
84.2 82.6
46.0 55.8% SC enrolment% SC girls to SC enrolment% ST enrolment
47.9 46.920.745.7 43.0
60.8
45.6
44.9
45.6
Position of teachers by educational qualification (other than para teacher)
(Previous academic year)Incentives : Number of beneficiaries
% ST girls to ST enrolment
% Girls
Number of villages
% 0 - 6 population
% SC population % ST population
% Urban population
% Schools with blackboard
% Enrolment in single-teacher schools
% Enrolment in schools without building
Primary Upperprimary
OBC EnrolmentPrimary U. Primary
% OBCEnrolment% OBC girls toOBC Enrolment
Pupil-teacher ratio (PTR)Student-classroom ratio (SCR)% Schools with <= 50 students% Schools with PTR > 100% Female teachers
% Schools established since 1995
Regular teachers Para-teachers
% minorrepairs
% majorrepairs
# = not applicable na = not available * Some totals may not match due to no response in classificatory data items
1.8 85.02.5 88.22.8 88.25.2 88.53.4 87.03.1 87.35.6 85.9
4625
46.23440
22.20.6
33.211.5
46.73444
0.30.3
37.411.1
45.119
00.00.0
23.10.0
46.52243
9.50.0
13.521.4
15.4 7.8 11.8 75.4 64.3
88093328.614.3
Category
PrivateGovt.PrivateGovtPrivateGovt.PrivateGovt.PrivateGovt.
Total population (in 000's)
Number of blocks/taluks
District
Decadal growth rate
Primary onlyPrimary with upper primaryPrimary with upper primary & sec/higher sec.Upper primary onlyUpper primary with sec./higher secondary
% Single classroom schools% Single teacher schools
P + UP P+sec/hs U.P. only UP+secP. only
No response in school category
Primary with upper primaryPrimary with U.P. & sec/higherUpper primary onlyUpper primary with sec./higher sec
Primary only
Primary onlyPrimary with upper primaryPrimary with Upper primary & sec/higherUpper primary only
Para-teachers
School category
Upper primary with sec./higher secondary
Primary onlyPrimary with upper prim.
P. onlyP + UPP+sec/hsU.P. onlyUP+sec
NER(U.Prim)GER(U.Prim)NER (Primary)GER (Primary)
Transition ratePrim. to U. Prim
11.5
Performance indicators
SC/ST Enrolment
Indicators
Classrooms/Other rooms
Prim.with U.P.&Sec/H.SUpper Primary onlyU. Primary with Sec./H.S.
Basic Data, 2001
Data reported from
226,197 225,691 222,333
65,048 64,406
369 29329,419
88.5
0.86
# ## #
# 265,041 4,412 3,022Total
1 - 4 5 - 7
343,991 345,697 349,342
95.5 61.695.7 61.790.0 25.891.2 29.7
Elementary Education: Report Card - JALGAON
Mah
aras
htr
a

328
20.3 13.6
Key data: Elementary Education
1613
JALNA
(Previous academic year)
(Previous year)
Gender and caste distribution of teachers*
No. of schools by type of building*
BoysWith disability
Flow rates
Primary Level
Enrolment*
Number of schools
Grade
GER / NER
School category
Primary Upper primaryBoys Boys GirlsGirls
IncentiveType
School categoryMultiple
TypeKuccha
PartiallyPucca
PuccaTotal % good condition
Otherrooms
TentNo
Building
Classrooms
Belowsecondary
Highersecondary
Postgraduate
M. Phil.GraduateSecondarySchool category OthersNo
response
ST teachers
Total Male Female No res Male Female No res Male Female Male FemaleSC teachers
Text booksUniformAttendanceStationery
% Passed
Avg. No. of Tchs.
%
Female literacyOverall literacy
dev. grant grantSchool T L M
Male Female
IVV
IIIIII
Grade R.R. D.O.R. P.R.
VIIVI
I - V
Enrolment by medium of instructions
Examination results
Retention rate
GPI
Primary cycle U. primary cycleState
DISTRICT ELEMENTARY EDUCATION REPORT CARD : 2005-06
GirlsGrade
IIIIIIIVVVI
VIII
AllGirls
Total
VII
% TotalGrossness
School category
71100
43
53 6942 00
2090
370 2 0
492 7119 136,655
0 00 0
167 13,8362 0
469 18 31,022 2,93422,421 130,692 4,931
899 0 00 0 0
87 0 8764,960 12,031 41,190
33,895 20,781 1,2414,197
449430
P + UP P+sec/hs U.P. only UP+sec
School categoryP. only
10.8 0.3 0.0 0.0 2.016.5
Number of Clusters 15831135
% Schools with SCR > 600.9 0.0 0.0 0.4
7.3 6.3 0.0 0.0 9.5% Schools with pre-primary sections 41.7 32.9 100.0 0.0 2.4% Schools with common toilets 45.6 68.8 50.0 0.0 75.8
% Schools with girls toilets 38.0 61.4 100.0 0.0 87.7% Schools with drinking water facility 63.9 71.9 100.0 0.0 96.8
% Enrolment in Govt. schools 62.0 85.9 0.0 0.0 17.699.8 100.0 100.0 0.0 100.0
% No female teacher schools (tch>=2) 48.3 44.0 0.0 0.0 52.05.0 0.2 0.0 0.0 0.0
1.0 0.9 0.0 0.0 0.3%Enrolment in schools without blackboard 0.1 0.0 0.0 0.0 0.0
2001-02 2002-03 2003-04 2004-05 2005-06IIIIIIIVV
VIVII
Total U.P
46,42238,71437,83534,65436,50936,103
34,071
43,03437,79635,97535,10137,554
35,54034,055
44,76739,39938,99439,10739,594
38,37836,384
46,27340,26941,02239,66040,975
40,07034,679
45,30942,51443,25743,73445,592
40,30030,189
111.0
62.5
102.3
57.2
92.3
102.8
36.6
0.00.0
22,03918,24818,11216,24817,10616,51215,962
615539542476380318335
455393425363274240224
1,644
classrooms
4,34542
01,942
86.383.7
100.00.0
87.1
10.111.0
3.6
0.00.07.5
5.30.00.05.4
77023
0647
507 516 15 4 0 16 12676 12 1 0 64 11
2 0 0 0 0 00 0 0 0 0 0
203 16 8 1 18 4
39 463 668 325 73 1 095 1,269 1,635 973 201 0 1 392
0 2 3 12 10 0 0 00 0 0 0 0 0 0 0
71 327 250 1,081 278 11 0 293
1 4 53 37 7 0 0 0
10533087
120
1610
109215
0407
518 103 10 6 0 154 59 74 19387
00
294
3920
14
22207
0000
42200
192
14500
48
18500
54
4100
13
Terminalgrade Passed
VII boysV girlsV boys
VII girls
105 with >60%
68.716904627
310
2332
73.40.00.0
11.4
61.675.0
0.00.0
12.3
45364Marathi Urdu Hindi English Gujarati
14502600
68472
467612309
00
3958
2432609
00
2662
1850485899
01487
430734
000
% Schools recvd.
92.297.3
0.00.0
62.3
91.397.1
0.00.0
61.9
6195010860
6889907
615222729
23281
6529210267
71579049
560781681
1621954
3.06.1
15.50.09.3
11.87.56.84.5
5.94.8
6.77.6
2005-062004-052003-04
MAHARASHTRA
54.8
Upper PrimaryPrimary
Sex ratio Sex ratio 0-6
8 106
VIII50.0
Enrolment of children
VIIITotal Pr.
0 0407 1,925
0 4
0 31
%Teachers recvd.in-service training
Total schools* Rural schools* Total enrolment* Rural enrolment* Teachers*
34.0
95.8
67.8
92.5 86.6
51.9 57.4% SC enrolment% SC girls to SC enrolment% ST enrolment
47.2 43.33.4
46.1 42.3
41.3
46.8
31.9
45.4
Position of teachers by educational qualification (other than para teacher)
(Previous academic year)Incentives : Number of beneficiaries
% ST girls to ST enrolment
% Girls
Number of villages
% 0 - 6 population
% SC population % ST population
% Urban population
% Schools with blackboard
% Enrolment in single-teacher schools
% Enrolment in schools without building
Primary Upperprimary
OBC EnrolmentPrimary U. Primary
% OBCEnrolment% OBC girls toOBC Enrolment
Pupil-teacher ratio (PTR)Student-classroom ratio (SCR)% Schools with <= 50 students% Schools with PTR > 100% Female teachers
% Schools established since 1995
Regular teachers Para-teachers
% minorrepairs
% majorrepairs
# = not applicable na = not available * Some totals may not match due to no response in classificatory data items
4.8 83.4
1.3 91.9
2.7 90.61.4 91.02.9 91.2
2129
46.23233
52.80.4
31.016.2
48.33437
5.00.3
24.15.4
0.000
0.00.00.00.0
43.33441
15.90.8
17.833.3
18.2 11.2 2.0 64.4 49.0
90395119.116.2
Category
PrivateGovt.PrivateGovtPrivateGovt.PrivateGovt.PrivateGovt.
Total population (in 000's)
Number of blocks/taluks
District
Decadal growth rate
Primary onlyPrimary with upper primaryPrimary with upper primary & sec/higher sec.Upper primary onlyUpper primary with sec./higher secondary
% Single classroom schools% Single teacher schools
P + UP P+sec/hs U.P. only UP+secP. only
No response in school category
Primary with upper primaryPrimary with U.P. & sec/higherUpper primary onlyUpper primary with sec./higher sec
Primary only
Primary onlyPrimary with upper primaryPrimary with Upper primary & sec/higherUpper primary only
Para-teachers
School category
Upper primary with sec./higher secondary
Primary onlyPrimary with upper prim.
P. onlyP + UPP+sec/hsU.P. onlyUP+sec
NER(U.Prim)GER(U.Prim)NER (Primary)GER (Primary)
Transition ratePrim. to U. Prim
2.2
Performance indicators
SC/ST Enrolment
Indicators
Classrooms/Other rooms
Prim.with U.P.&Sec/H.SUpper Primary onlyU. Primary with Sec./H.S.
Basic Data, 2001
Data reported from
116,081 115,724 114,356 107,149 106,683
18,692 561 27,524 29,226
139 7612,331
96.9
71.5
0.90
# ## #
# 124,227 3,205 2,374Total
1 - 4 5 - 7
174,814 167,224 162,267 151,906 157,625
98.5 67.598.2 65.495.0 33.196.0 35.5
Elementary Education in India - Where do we stand ?
Mah
aras
htr
a

329
0.3880.886
16.9 10.4
Key data: Elementary Education
3523
KOLHAPUR
(Previous academic year)
(Previous year)
Gender and caste distribution of teachers*
No. of schools by type of building*
BoysWith disability
Flow rates
Primary Level
Enrolment*
Number of schools
Grade
GER / NER
School category
Primary Upper primaryBoys Boys GirlsGirls
IncentiveType
School categoryMultiple
TypeKuccha
PartiallyPucca
PuccaTotal % good condition
Otherrooms
TentNo
Building
Classrooms
Belowsecondary
Highersecondary
Postgraduate
M. Phil.GraduateSecondarySchool category OthersNo
response
ST teachers
Total Male Female No res Male Female No res Male Female Male FemaleSC teachers
Text booksUniformAttendanceStationery
% Passed
Avg. No. of Tchs.
%
Female literacyOverall literacy
dev. grant grantSchool T L M
Male Female
IVV
IIIIII
Grade R.R. D.O.R. P.R.
VIIVI
I - V
Enrolment by medium of instructions
Examination results
Retention rate
GPI
Primary cycle U. primary cycleState
DISTRICT ELEMENTARY EDUCATION REPORT CARD : 2005-06
GirlsGrade
IIIIIIIVVVI
VIII
AllGirls
Total
VII
% TotalGrossness
School category
93011
010
79 78270 10
3397
05
12 207 10
1,006 17424 215,47648 1,321
3 0296 3,294188 1,328
947 54 73,965 9,36028,762 175,157 6,216
9,509 1,195 5,215496 0 496
17,952 1,202 15,562102,870 1,155 70,187
83,348 43,135 2,6256,839
907734
P + UP P+sec/hs U.P. only UP+sec
School categoryP. only
15.1 1.0 0.0 0.0 0.529.0
Number of Clusters 28991288
% Schools with SCR > 600.3 0.0 0.0 0.7
4.4 5.4 1.2 0.0 2.9% Schools with pre-primary sections 8.8 7.7 12.3 0.0 1.5% Schools with common toilets 40.5 67.1 69.1 100.0 79.6
% Schools with girls toilets 24.2 40.9 81.5 100.0 85.3% Schools with drinking water facility 87.1 94.5 97.5 100.0 99.5
% Enrolment in Govt. schools 65.9 88.2 12.2 0.0 3.1100.0 100.0 100.0 100.0 100.0
% No female teacher schools (tch>=2) 26.8 23.8 37.0 0.0 20.19.3 0.1 0.0 0.0 0.6
0.3 0.1 0.0 0.0 0.1%Enrolment in schools without blackboard 0.0 0.0 0.0 0.0 0.0
2001-02 2002-03 2003-04 2004-05 2005-06IIIIIIIVV
VIVII
Total U.P
69,29468,33169,78967,17461,43159,328
58,208
70,82468,88769,86767,84867,277
67,89465,269
71,01670,55669,98768,45070,245
68,75066,464
64,65763,09663,14363,14736,053
33,64232,286
88.3
51.8
85.4
50.2
73.6
79.0
46.5
45.73.7
31,59630,92633,25731,30128,18727,59527,105
623513640590340281259
361348386372244204179
3,919
classrooms
7,17297
357
83.481.592.2
100.095.6
11.512.6
5.1
6.00.04.0
6.01.80.00.4
1,04175
1800
657 1,030 49 11 2 28 60893 20 0 0 47 48
25 1 0 0 0 552 0 0 0 0 1
185 7 1 0 23 191
81 1,623 598 956 271 2 1112 3,286 920 2,233 1,014 4 4 0
3 49 19 212 60 3 2 00 0 3 4 0 0 0 0
57 608 167 1,297 438 2 8 0
0 0 1 5 0 0 0 0
20284892
2471
1889
2681101
6688
1504 0 0 0 0 269 187 80 420000
0102
0002
0000
60932
0285
37660
104
17512
050
6720
21
Terminalgrade Passed
VII boysV girlsV boys
VII girls
0 with >60%
1.035327573
3497
2581
0.10.00.01.4
1.10.10.00.01.7
115708Marathi English Urdu Others Kannada
2307963619
11083256
433948021994
2901750
15265407
00
106
481151
00
579
325317
000
% Schools recvd.
88.494.111.1
0.017.4
46.890.9
8.60.0
14.0
1065314445
19010319
451201548
1114060
1155445840
1386010461
526721789
953797
3.07.54.32.36.3
6.75.45.74.5
2.41.8
3.15.1
2005-062004-052003-04
MAHARASHTRA
28.9
Upper PrimaryPrimary
Sex ratio Sex ratio 0-6
13 209
VIII19.8
Enrolment of children
VIIITotal Pr.
0 788 2,49351 793
60 289
%Teachers recvd.in-service training
Total schools* Rural schools* Total enrolment* Rural enrolment* Teachers*
29.6
75.6
55.6
69.9 72.9
41.7 43.0% SC enrolment% SC girls to SC enrolment% ST enrolment
47.9 48.4
48.7 49.4
24.6
46.4
13.2
47.2
Position of teachers by educational qualification (other than para teacher)
(Previous academic year)Incentives : Number of beneficiaries
% ST girls to ST enrolment
% Girls
Number of villages
% 0 - 6 population
% SC population % ST population
% Urban population
% Schools with blackboard
% Enrolment in single-teacher schools
% Enrolment in schools without building
Primary Upperprimary
OBC EnrolmentPrimary U. Primary
% OBCEnrolment% OBC girls toOBC Enrolment
Pupil-teacher ratio (PTR)Student-classroom ratio (SCR)% Schools with <= 50 students% Schools with PTR > 100% Female teachers
% Schools established since 1995
Regular teachers Para-teachers
% minorrepairs
% majorrepairs
# = not applicable na = not available * Some totals may not match due to no response in classificatory data items
2.1 91.2
2.6 91.88.0 87.4
11.1 85.84.5 90.4
13.6 84.0
11231
46.13632
49.71.3
42.611.9
47.23234
4.30.4
35.42.6
19.071
16533.3
0.085.766.7
44.341
186313.5
0.526.711.8
17.6 12.8 0.6 76.9 66.0
83994929.812.8
Category
PrivateGovt.PrivateGovtPrivateGovt.PrivateGovt.PrivateGovt.
Total population (in 000's)
Number of blocks/taluks
District
Decadal growth rate
Primary onlyPrimary with upper primaryPrimary with upper primary & sec/higher sec.Upper primary onlyUpper primary with sec./higher secondary
% Single classroom schools% Single teacher schools
P + UP P+sec/hs U.P. only UP+secP. only
No response in school category
Primary with upper primaryPrimary with U.P. & sec/higherUpper primary onlyUpper primary with sec./higher sec
Primary only
Primary onlyPrimary with upper primaryPrimary with Upper primary & sec/higherUpper primary only
Para-teachers
School category
Upper primary with sec./higher secondary
Primary onlyPrimary with upper prim.
P. onlyP + UPP+sec/hsU.P. onlyUP+sec
NER(U.Prim)GER(U.Prim)NER (Primary)GER (Primary)
Transition ratePrim. to U. Prim
Performance indicators
SC/ST Enrolment
Indicators
Classrooms/Other rooms
Prim.with U.P.&Sec/H.SUpper Primary onlyU. Primary with Sec./H.S.
Basic Data, 2001
Data reported from
101,981 205,459 200,440 178,967
94 53,936
51 1924,576
87.4
99.1
0.86
# ## #
# 209,967 3,246 2,094Total
1 - 4 5 - 7
254,043 280,009 277,426 274,588
95.9 65.193.2 67.895.5 48.695.8 51.9
Elementary Education: Report Card - KOLHAPUR
Mah
aras
htr
a

330
25.8 19.3
Key data: Elementary Education
2080
LATUR
(Previous academic year)
(Previous year)
Gender and caste distribution of teachers*
No. of schools by type of building*
BoysWith disability
Flow rates
Primary Level
Enrolment*
Number of schools
Grade
GER / NER
School category
Primary Upper primaryBoys Boys GirlsGirls
IncentiveType
School categoryMultiple
TypeKuccha
PartiallyPucca
PuccaTotal % good condition
Otherrooms
TentNo
Building
Classrooms
Belowsecondary
Highersecondary
Postgraduate
M. Phil.GraduateSecondarySchool category OthersNo
response
ST teachers
Total Male Female No res Male Female No res Male Female Male FemaleSC teachers
Text booksUniformAttendanceStationery
% Passed
Avg. No. of Tchs.
%
Female literacyOverall literacy
dev. grant grantSchool T L M
Male Female
IVV
IIIIII
Grade R.R. D.O.R. P.R.
VIIVI
I - V
Enrolment by medium of instructions
Examination results
Retention rate
GPI
Primary cycle U. primary cycleState
DISTRICT ELEMENTARY EDUCATION REPORT CARD : 2005-06
GirlsGrade
IIIIIIIVVVI
VIII
AllGirls
Total
VII
% TotalGrossness
School category
58530
57
175 5658 10
3400
488 135 6
686 14840 131,257
2 6190 0
261 12,243110 505
640 44 48,318 11,31676,799 127,210 14,759
2,917 425 6660 0 0
6,614 405 5,047108,073 10,617 64,923
51,756 50,411 1,9574,432
1,0721,778
P + UP P+sec/hs U.P. only UP+sec
School categoryP. only
1.7 0.0 0.0 0.0 0.06.4
Number of Clusters 21451123
% Schools with SCR > 600.0 0.0 0.0 0.0
4.0 5.9 9.1 0.0 3.5% Schools with pre-primary sections 25.4 17.6 45.5 0.0 1.8% Schools with common toilets 53.4 67.2 72.7 0.0 75.6
% Schools with girls toilets 27.8 56.1 90.9 0.0 83.4% Schools with drinking water facility 67.4 79.3 100.0 0.0 96.5
% Enrolment in Govt. schools 50.7 63.1 17.5 0.0 10.299.2 99.9 100.0 0.0 99.5
% No female teacher schools (tch>=2) 42.4 21.8 0.0 0.0 35.31.5 0.0 0.0 0.0 0.0
0.0 0.0 0.0 0.0 0.0%Enrolment in schools without blackboard 0.0 0.0 0.0 0.0 0.0
2001-02 2002-03 2003-04 2004-05 2005-06IIIIIIIVV
VIVII
Total U.P
64,03255,99156,35756,38555,77653,835
52,153
61,77358,01257,79255,70454,721
53,60351,832
64,55660,54257,89455,93555,819
56,14654,265
65,96058,83656,20354,27452,368
53,21249,150
63,10258,70558,12656,80658,044
58,36849,988
124.3
70.8
118.6
66.0
105.7
120.9
41.9
0.00.0
30,43726,32126,82826,96526,18625,51124,508
792757719728603479523
555537574551476443398
3,245
classrooms
5,776161
04,110
74.872.293.8
0.081.9
18.419.1
6.9
0.00.0
12.5
8.76.20.05.6
1,37652
01,651
1,116 658 43 24 2 100 6550 41 28 1 137 0
9 1 0 0 1 00 0 0 0 0 0
242 50 38 0 60 2
153 1,586 612 519 115 3 7176 3,096 1,301 1,349 233 2 2 48
1 25 19 57 18 1 1 870 0 0 0 0 0 0 0
178 937 381 1,469 398 1 10 2,216
0 1 1 3 0 0 0 0
19564366
710
2706
179351
0667
1039 34 0 0 0 235 126 79 414887
02217
2002
1000
0000
52413
0390
19900
76
17600
106
7500
30
Terminalgrade Passed
VII boysV girlsV boys
VII girls
34 with >60%
65.730296210
2090
5592
66.80.00.0
23.8
59.963.4
0.00.0
23.1
96151Marathi Urdu English Hindi
184424862
0116295
514022915
5450
3935
1079718
212900
0000
86
% Schools recvd.
84.491.2
9.10.0
78.8
85.991.4
9.10.0
80.1
850095485
64410692
762923249
1024700
978575616
1167910588
806392232
8673868
3.68.2
19.00.0
14.1
4.33.02.72.5
3.33.6
3.13.1
2005-062004-052003-04
MAHARASHTRA
24.4
Upper PrimaryPrimary
Sex ratio Sex ratio 0-6
10 107
VIII18.2
Enrolment of children
VIIITotal Pr.
0 0633 4,959
38 694
79 130
%Teachers recvd.in-service training
Total schools* Rural schools* Total enrolment* Rural enrolment* Teachers*
25.6
100.0
89.961.5 72.8% SC enrolment% SC girls to SC enrolment% ST enrolment
47.8 47.43.6
46.9 45.2
35.1
46.6
26.9
44.9
Position of teachers by educational qualification (other than para teacher)
(Previous academic year)Incentives : Number of beneficiaries
% ST girls to ST enrolment
% Girls
Number of villages
% 0 - 6 population
% SC population % ST population
% Urban population
% Schools with blackboard
% Enrolment in single-teacher schools
% Enrolment in schools without building
Primary Upperprimary
OBC EnrolmentPrimary U. Primary
% OBCEnrolment% OBC girls toOBC Enrolment
Pupil-teacher ratio (PTR)Student-classroom ratio (SCR)% Schools with <= 50 students% Schools with PTR > 100% Female teachers
% Schools established since 1995
Regular teachers Para-teachers
% minorrepairs
% majorrepairs
# = not applicable na = not available * Some totals may not match due to no response in classificatory data items
7.9 87.82.5 94.52.2 95.10.3 97.11.8 95.23.0 93.82.9 93.8
2217
45.43431
44.60.1
34.316.9
49.83436
2.00.0
28.98.8
0.000
0.00.00.00.0
44.12229
0.80.0
11.910.1
24.0 19.4 2.3 71.5 59.4
91893523.615.7
Category
PrivateGovt.PrivateGovtPrivateGovt.PrivateGovt.PrivateGovt.
Total population (in 000's)
Number of blocks/taluks
District
Decadal growth rate
Primary onlyPrimary with upper primaryPrimary with upper primary & sec/higher sec.Upper primary onlyUpper primary with sec./higher secondary
% Single classroom schools% Single teacher schools
P + UP P+sec/hs U.P. only UP+secP. only
No response in school category
Primary with upper primaryPrimary with U.P. & sec/higherUpper primary onlyUpper primary with sec./higher sec
Primary only
Primary onlyPrimary with upper primaryPrimary with Upper primary & sec/higherUpper primary only
Para-teachers
School category
Upper primary with sec./higher secondary
Primary onlyPrimary with upper prim.
P. onlyP + UPP+sec/hsU.P. onlyUP+sec
NER(U.Prim)GER(U.Prim)NER (Primary)GER (Primary)
Transition ratePrim. to U. Prim
2.8
Performance indicators
SC/ST Enrolment
Indicators
Classrooms/Other rooms
Prim.with U.P.&Sec/H.SUpper Primary onlyU. Primary with Sec./H.S.
Basic Data, 2001
Data reported from
166,400 154,730 166,230 160,156 161,764
42,159 45,302 46,665
287 22021,317
97.1
83.3
0.90
# ## #
# 186,756 4,601 3,534Total
1 - 4 5 - 7
236,739 235,273 238,927 233,281 232,765
98.8 70.798.8 71.896.0 33.095.7 37.2
Elementary Education in India - Where do we stand ?
Mah
aras
htr
a

331
7.7 9.0
Key data: Elementary Education
3338
MUMBAI
(Previous academic year)
(Previous year)
Gender and caste distribution of teachers*
No. of schools by type of building*
BoysWith disability
Flow rates
Primary Level
Enrolment*
Number of schools
Grade
GER / NER
School category
Primary Upper primaryBoys Boys GirlsGirls
IncentiveType
School categoryMultiple
TypeKuccha
PartiallyPucca
PuccaTotal % good condition
Otherrooms
TentNo
Building
Classrooms
Belowsecondary
Highersecondary
Postgraduate
M. Phil.GraduateSecondarySchool category OthersNo
response
ST teachers
Total Male Female No res Male Female No res Male Female Male FemaleSC teachers
Text booksUniformAttendanceStationery
% Passed
Avg. No. of Tchs.
%
Female literacyOverall literacy
dev. grant grantSchool T L M
Male Female
IVV
IIIIII
Grade R.R. D.O.R. P.R.
VIIVI
I - V
Enrolment by medium of instructions
Examination results
Retention rate
GPI
Primary cycle U. primary cycleState
DISTRICT ELEMENTARY EDUCATION REPORT CARD : 2005-06
GirlsGrade
IIIIIIIVVVI
VIII
AllGirls
Total
VII
% TotalGrossness
School category
288000
2 00 000
00
6 0 0
104 3970 130,0970 00 00 00 177
0 1 0 1,025520 0 0
0 0 00 0 0
0 0 00 0 0
26,236 204,474 6103,655
4,02712
P + UP P+sec/hs U.P. only UP+sec
School categoryP. only
2.6 1.4 0.0 0.0 0.03.4
Number of Clusters 79789
% Schools with SCR > 601.7 0.0 0.0 0.0
40.1 47.2 0.0 0.0 0.0% Schools with pre-primary sections 24.6 5.2 0.0 0.0 0.0% Schools with common toilets 78.0 69.3 0.0 0.0 0.0
% Schools with girls toilets 86.8 85.9 0.0 0.0 0.0% Schools with drinking water facility 98.6 98.6 0.0 0.0 0.0
% Enrolment in Govt. schools 11.4 99.6 0.0 0.0 0.099.6 97.9 0.0 0.0 0.0
% No female teacher schools (tch>=2) 1.6 2.8 0.0 0.0 0.00.4 0.2 0.0 0.0 0.0
0.2 0.0 0.0 0.0 0.0%Enrolment in schools without blackboard 0.1 2.2 0.0 0.0 0.0
2001-02 2002-03 2003-04 2004-05 2005-06IIIIIIIVV
VIVII
Total U.P
79,38074,60275,93775,39719,87518,991
17,322
140,550133,606131,393128,572
45,788
42,18339,219
195,783185,959181,667178,181
58,549
54,53050,554
218.3
43.6
86.4
26.2
0.0
0.00.0
37,90535,88436,23235,970
9,9389,6258,949
132147158139104
8865
100108114127
597762
0
classrooms
0000
94.868.8
0.00.00.0
3.417.5
1.8
0.00.00.0
13.70.00.00.0
1,093000
1,536 469 28 0 1 2 1251 32 0 0 7 0
0 0 0 0 0 00 0 0 0 0 00 0 0 0 0 0
83 1,456 1,007 1,654 383 4 328 1,302 480 1,262 554 11 8 3
0 0 0 0 0 0 0 00 0 0 0 0 0 0 00 0 0 0 0 0 0 0
0 13 27 19 4 0 0 0
5221278
000
2366000
4060 11 20 23 1 19 146 9 304000
5000
14000
0000
34000
173000
20000
42000
Terminalgrade Passed
VII boysV girlsV boys
VII girls
3 with >60%
13.746373667
000
26.00.00.00.0
10.838.1
0.00.00.0
120929English Marathi Hindi Urdu Gujarati
5227000
5386141530
000
2489743635
000
1486124916
000
145006088
000
% Schools recvd.
38.594.8
0.00.00.0
38.595.5
0.00.00.0
73357754
384204
36507486
02803
87163926120
5944
415111046
02761
9.312.6
0.00.00.0
3.23.33.73.6
4.52.8
4.63.5
2005-062004-052003-04
MAHARASHTRA
0.0
Upper PrimaryPrimary
Sex ratio Sex ratio 0-6
1 89
VIII0.0
Enrolment of children
VIIITotal Pr.
0 00 0
25 0
0 0
%Teachers recvd.in-service training
Total schools* Rural schools* Total enrolment* Rural enrolment* Teachers*
12.6 51.1
75.5
12.833.1% SC enrolment% SC girls to SC enrolment% ST enrolment
48.1 50.62.1
48.5 46.5
8.8
48.5
8.1
50.5
Position of teachers by educational qualification (other than para teacher)
(Previous academic year)Incentives : Number of beneficiaries
% ST girls to ST enrolment
% Girls
Number of villages
% 0 - 6 population
% SC population % ST population
% Urban population
% Schools with blackboard
% Enrolment in single-teacher schools
% Enrolment in schools without building
Primary Upperprimary
OBC EnrolmentPrimary U. Primary
% OBCEnrolment% OBC girls toOBC Enrolment
Pupil-teacher ratio (PTR)Student-classroom ratio (SCR)% Schools with <= 50 students% Schools with PTR > 100% Female teachers
% Schools established since 1995
Regular teachers Para-teachers
% minorrepairs
% majorrepairs
# = not applicable na = not available * Some totals may not match due to no response in classificatory data items
46.9 50.043.5 53.242.4 53.982.6 13.858.1 37.353.9 42.657.0 38.5
00
46.850
04.01.6
88.112.0
50.936
02.81.0
64.99.7
0.000
0.00.00.00.0
0.000
0.00.00.00.0
4.8 5.5 0.6 86.4 81.4
922777100.010.2
Category
PrivateGovt.PrivateGovtPrivateGovt.PrivateGovt.PrivateGovt.
Total population (in 000's)
Number of blocks/taluks
District
Decadal growth rate
Primary onlyPrimary with upper primaryPrimary with upper primary & sec/higher sec.Upper primary onlyUpper primary with sec./higher secondary
% Single classroom schools% Single teacher schools
P + UP P+sec/hs U.P. only UP+secP. only
No response in school category
Primary with upper primaryPrimary with U.P. & sec/higherUpper primary onlyUpper primary with sec./higher sec
Primary only
Primary onlyPrimary with upper primaryPrimary with Upper primary & sec/higherUpper primary only
Para-teachers
School category
Upper primary with sec./higher secondary
Primary onlyPrimary with upper prim.
P. onlyP + UPP+sec/hsU.P. onlyUP+sec
NER(U.Prim)GER(U.Prim)NER (Primary)GER (Primary)
Transition ratePrim. to U. Prim
2.6
Performance indicators
SC/ST Enrolment
Indicators
Classrooms/Other rooms
Prim.with U.P.&Sec/H.SUpper Primary onlyU. Primary with Sec./H.S.
Basic Data, 2001
Data reported from
163,633 127,190 56,188
2,926 0
0 00
13.8
0.92
# ## #
# 174,503 833 647Total
1 - 4 5 - 7
741,590 534,121 305,316
93.3 56.295.3 58.996.5 46.097.4 51.7
Elementary Education: Report Card - MUMBAI
Mah
aras
htr
a
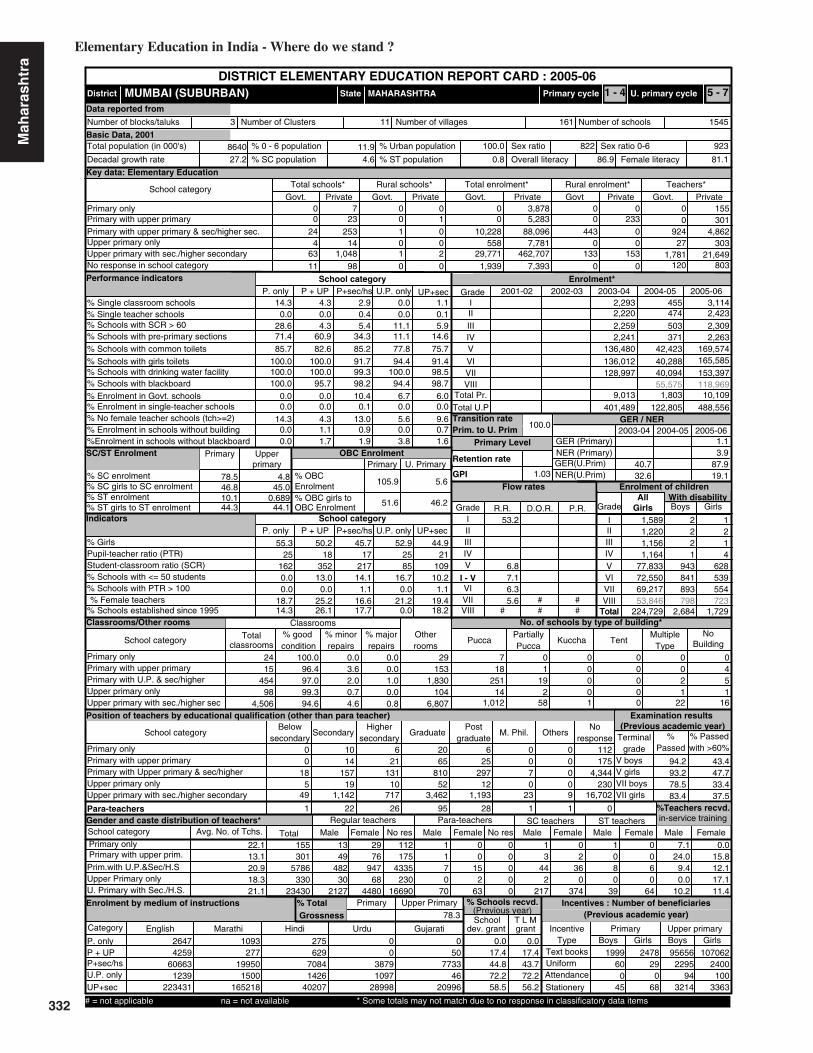
332
0.689
78.5 4.8
Key data: Elementary Education
8640
MUMBAI (SUBURBAN)
(Previous academic year)
(Previous year)
Gender and caste distribution of teachers*
No. of schools by type of building*
BoysWith disability
Flow rates
Primary Level
Enrolment*
Number of schools
Grade
GER / NER
School category
Primary Upper primaryBoys Boys GirlsGirls
IncentiveType
School categoryMultiple
TypeKuccha
PartiallyPucca
PuccaTotal % good condition
Otherrooms
TentNo
Building
Classrooms
Belowsecondary
Highersecondary
Postgraduate
M. Phil.GraduateSecondarySchool category OthersNo
response
ST teachers
Total Male Female No res Male Female No res Male Female Male FemaleSC teachers
Text booksUniformAttendanceStationery
% Passed
Avg. No. of Tchs.
%
Female literacyOverall literacy
dev. grant grantSchool T L M
Male Female
IVV
IIIIII
Grade R.R. D.O.R. P.R.
VIIVI
I - V
Enrolment by medium of instructions
Examination results
Retention rate
GPI
Primary cycle U. primary cycleState
DISTRICT ELEMENTARY EDUCATION REPORT CARD : 2005-06
GirlsGrade
IIIIIIIVVVI
VIII
AllGirls
Total
VII
% TotalGrossness
School category
024
463
23 0253 1
141,048
01
11 98 0
0 71 00 10,2280 5582 29,7710 1,939
0 0 0 05,283 0 233
88,096 443 07,781 0 0
7,393 0 0462,707 133 153
0 3,878 00
155301
P + UP P+sec/hs U.P. only UP+sec
School categoryP. only
14.3 4.3 2.9 0.0 1.10.0
Number of Clusters 1545161
% Schools with SCR > 600.0 0.4 0.0 0.1
28.6 4.3 5.4 11.1 5.9% Schools with pre-primary sections 71.4 60.9 34.3 11.1 14.6% Schools with common toilets 85.7 82.6 85.2 77.8 75.7
% Schools with girls toilets 100.0 100.0 91.7 94.4 91.4% Schools with drinking water facility 100.0 100.0 99.3 100.0 98.5
% Enrolment in Govt. schools 0.0 0.0 10.4 6.7 6.0100.0 95.7 98.2 94.4 98.7
% No female teacher schools (tch>=2) 14.3 4.3 13.0 5.6 9.60.0 0.0 0.1 0.0 0.0
0.0 1.1 0.9 0.0 0.7%Enrolment in schools without blackboard 0.0 1.7 1.9 3.8 1.6
2001-02 2002-03 2003-04 2004-05 2005-06IIIIIIIVV
VIVII
Total U.P
3,1142,4232,3092,263
169,574165,585
153,397
455474503371
42,423
40,28840,094
2,2932,2202,2592,241
136,480
136,012128,997
40.7
1.1
87.9
45.7
14.11.1
1,5891,2201,1561,164
77,83372,55069,217
2221
943841893
1214
628539554
24
classrooms
15454
984,506
100.096.497.099.394.6
0.03.6
0.0
2.00.74.6
0.01.00.00.8
1531,830
1046,807
29 7 0 0 0 0 018 1 0 0 0 4
251 19 0 0 2 514 2 0 0 1 1
1,012 58 1 0 22 16
0 10 6 20 6 0 00 14 21 65 25 0 0 175
18 157 131 810 297 7 0 4,3445 19 10 52 12 0 0 230
49 1,142 717 3,462 1,193 23 9 16,702
1 22 26 95 28 1 1 0
1349
48230
2127
76947
684480
29 112 1 0 0 1 0 1 0175
4335230
16690
170
70
015
263
0000
344
2217
236
0374
080
39
060
64
Terminalgrade Passed
VII boysV girlsV boys
VII girls
112 with >60%
7.1155301
5786330
23430
24.09.40.0
10.2
0.015.812.117.111.4
2647English Marathi Hindi Urdu Gujarati
425960663
1239223431
1093277
199501500
165218
275629
70841426
40207
00
38791097
28998
050
773346
20996
% Schools recvd.
0.017.444.872.258.5
0.017.443.772.256.2
199960
045
956562295
943214
247829
068
1070622400
1003363
22.113.120.918.321.1
53.2
6.35.6
6.87.1
2005-062004-052003-04
MAHARASHTRA
16.6
Upper PrimaryPrimary
Sex ratio Sex ratio 0-6
3 11
VIII17.7
Enrolment of children
VIIITotal Pr.
27 3031,781 21,649
120 803
924 4,862
%Teachers recvd.in-service training
Total schools* Rural schools* Total enrolment* Rural enrolment* Teachers*
78.3
3.9
19.132.6% SC enrolment% SC girls to SC enrolment% ST enrolment
46.8 45.010.144.3 44.1
105.9
51.6
5.6
46.2
Position of teachers by educational qualification (other than para teacher)
(Previous academic year)Incentives : Number of beneficiaries
% ST girls to ST enrolment
% Girls
Number of villages
% 0 - 6 population
% SC population % ST population
% Urban population
% Schools with blackboard
% Enrolment in single-teacher schools
% Enrolment in schools without building
Primary Upperprimary
OBC EnrolmentPrimary U. Primary
% OBCEnrolment% OBC girls toOBC Enrolment
Pupil-teacher ratio (PTR)Student-classroom ratio (SCR)% Schools with <= 50 students% Schools with PTR > 100% Female teachers
% Schools established since 1995
Regular teachers Para-teachers
% minorrepairs
% majorrepairs
# = not applicable na = not available * Some totals may not match due to no response in classificatory data items
21717
55.325
1620.00.0
18.714.3
50.218
35213.0
0.025.226.1
52.92585
16.70.0
21.20.0
44.921
10910.2
1.119.418.2
27.2 4.6 0.8 86.9 81.1
923822100.011.9
Category
PrivateGovt.PrivateGovtPrivateGovt.PrivateGovt.PrivateGovt.
Total population (in 000's)
Number of blocks/taluks
District
Decadal growth rate
Primary onlyPrimary with upper primaryPrimary with upper primary & sec/higher sec.Upper primary onlyUpper primary with sec./higher secondary
% Single classroom schools% Single teacher schools
P + UP P+sec/hs U.P. only UP+secP. only
No response in school category
Primary with upper primaryPrimary with U.P. & sec/higherUpper primary onlyUpper primary with sec./higher sec
Primary only
Primary onlyPrimary with upper primaryPrimary with Upper primary & sec/higherUpper primary only
Para-teachers
School category
Upper primary with sec./higher secondary
Primary onlyPrimary with upper prim.
P. onlyP + UPP+sec/hsU.P. onlyUP+sec
NER(U.Prim)GER(U.Prim)NER (Primary)GER (Primary)
Transition ratePrim. to U. Prim
Performance indicators
SC/ST Enrolment
Indicators
Classrooms/Other rooms
Prim.with U.P.&Sec/H.SUpper Primary onlyU. Primary with Sec./H.S.
Basic Data, 2001
Data reported from
401,489 122,805 488,556
55,575 118,969
798 72353,846
100.0
1.03
# ## #
# 224,729 2,684 1,729Total
1 - 4 5 - 7
9,013 1,803 10,109
94.2 43.493.2 47.778.5 33.483.4 37.5
Elementary Education in India - Where do we stand ?
Mah
aras
htr
a

333
25.5 21.1
Key data: Elementary Education
4068
NAGPUR
(Previous academic year)
(Previous year)
Gender and caste distribution of teachers*
No. of schools by type of building*
BoysWith disability
Flow rates
Primary Level
Enrolment*
Number of schools
Grade
GER / NER
School category
Primary Upper primaryBoys Boys GirlsGirls
IncentiveType
School categoryMultiple
TypeKuccha
PartiallyPucca
PuccaTotal % good condition
Otherrooms
TentNo
Building
Classrooms
Belowsecondary
Highersecondary
Postgraduate
M. Phil.GraduateSecondarySchool category OthersNo
response
ST teachers
Total Male Female No res Male Female No res Male Female Male FemaleSC teachers
Text booksUniformAttendanceStationery
% Passed
Avg. No. of Tchs.
%
Female literacyOverall literacy
dev. grant grantSchool T L M
Male Female
IVV
IIIIII
Grade R.R. D.O.R. P.R.
VIIVI
I - V
Enrolment by medium of instructions
Examination results
Retention rate
GPI
Primary cycle U. primary cycleState
DISTRICT ELEMENTARY EDUCATION REPORT CARD : 2005-06
GirlsGrade
IIIIIIIVVVI
VIII
AllGirls
Total
VII
% TotalGrossness
School category
60115
145
290 51421 11
0522
116
13 173 4
1,196 38552 117,022
9 6,5780 225
239 20,30179 1,281
952 78 52,214 14,535113,141 89,890 14,315
15,327 4,076 4,1000 225 0
9,757 213 3,743206,256 7,025 72,549
90,031 96,209 3,4184,259
2,1792,834
P + UP P+sec/hs U.P. only UP+sec
School categoryP. only
10.2 0.9 0.0 0.0 0.48.0
Number of Clusters 32621545
% Schools with SCR > 600.4 0.0 0.0 0.0
6.6 11.7 0.0 0.0 7.8% Schools with pre-primary sections 45.2 39.6 30.6 100.0 6.3% Schools with common toilets 67.3 86.5 91.7 100.0 90.3
% Schools with girls toilets 43.1 75.8 91.7 100.0 93.7% Schools with drinking water facility 90.3 95.5 97.2 100.0 99.5
% Enrolment in Govt. schools 48.3 50.8 30.0 100.0 9.0100.0 100.0 100.0 100.0 100.0
% No female teacher schools (tch>=2) 20.5 7.3 8.3 0.0 6.01.5 0.1 0.0 0.0 0.0
0.0 0.0 0.0 0.0 0.0%Enrolment in schools without blackboard 0.0 0.0 0.0 0.0 0.0
2001-02 2002-03 2003-04 2004-05 2005-06IIIIIIIVV
VIVII
Total U.P
90,72883,41183,20282,94984,41284,222
82,794
80,06878,30876,50574,06872,527
77,81473,098
86,34983,59782,39280,97983,122
84,79082,225
87,95885,15483,54579,88586,295
85,09584,867
89.9
54.8
80.5
48.4
79.0
96.1
42.5
0.00.0
43,85540,59940,11339,77340,50140,10339,760
911957991949722609604
656688718688597532504
5,614
classrooms
5,952467
75,950
86.185.797.371.489.9
8.99.2
5.0
2.428.6
8.1
5.20.30.02.0
1,558241
32,802
1,660 1,257 98 13 0 211 2619 40 2 0 230 0
31 2 0 0 3 01 0 0 0 0 0
461 40 3 0 63 0
115 2,649 1,474 1,000 234 6 2100 3,074 1,629 1,591 538 12 3 57
7 70 49 267 196 2 0 3071 4 0 2 0 0 0 0
116 1,597 947 2,778 941 10 5 4,371
2 45 116 116 45 0 0 0
18082273
1476
3225
4674444
13169
3672 77 16 24 0 314 624 141 25757
3070
4371
4260
100
4710
60
0000
33526
0586
80131
0411
14613
1218
26790
238
Terminalgrade Passed
VII boysV girlsV boys
VII girls
77 with >60%
64.355977093
9057
10925
60.526.850.031.2
41.843.9
6.70.0
22.3
127197Marathi Hindi English Urdu Others
1546915083
225156720
2623332657
00
35381
210523207416750
021751
110449478
00
10819
941472
00
591
% Schools recvd.
87.183.444.4
100.081.7
86.883.247.2
100.081.5
10406410901
118111408
1052423897
2264125
122607107311117312000
1161592671
5143413
3.58.0
25.17.0
19.3
9.06.66.95.9
9.09.1
9.87.6
2005-062004-052003-04
MAHARASHTRA
49.2
Upper PrimaryPrimary
Sex ratio Sex ratio 0-6
14 148
VIII22.2
Enrolment of children
VIIITotal Pr.
7 0873 10,052
84 1,009
303 602
%Teachers recvd.in-service training
Total schools* Rural schools* Total enrolment* Rural enrolment* Teachers*
26.1
79.1
71.0
72.3 63.6
43.0 47.3% SC enrolment% SC girls to SC enrolment% ST enrolment
48.6 48.515.948.5 47.7
62.9
48.1
48.3
48.2
Position of teachers by educational qualification (other than para teacher)
(Previous academic year)Incentives : Number of beneficiaries
% ST girls to ST enrolment
% Girls
Number of villages
% 0 - 6 population
% SC population % ST population
% Urban population
% Schools with blackboard
% Enrolment in single-teacher schools
% Enrolment in schools without building
Primary Upperprimary
OBC EnrolmentPrimary U. Primary
% OBCEnrolment% OBC girls toOBC Enrolment
Pupil-teacher ratio (PTR)Student-classroom ratio (SCR)% Schools with <= 50 students% Schools with PTR > 100% Female teachers
% Schools established since 1995
Regular teachers Para-teachers
% minorrepairs
% majorrepairs
# = not applicable na = not available * Some totals may not match due to no response in classificatory data items
4724
49.53333
45.60.2
66.011.6
47.03239
1.70.3
66.610.5
44.43232
0.00.0
14.30.0
49.12138
1.80.0
29.65.5
23.3 17.1 10.9 84.0 77.4
94293264.312.9
Category
PrivateGovt.PrivateGovtPrivateGovt.PrivateGovt.PrivateGovt.
Total population (in 000's)
Number of blocks/taluks
District
Decadal growth rate
Primary onlyPrimary with upper primaryPrimary with upper primary & sec/higher sec.Upper primary onlyUpper primary with sec./higher secondary
% Single classroom schools% Single teacher schools
P + UP P+sec/hs U.P. only UP+secP. only
No response in school category
Primary with upper primaryPrimary with U.P. & sec/higherUpper primary onlyUpper primary with sec./higher sec
Primary only
Primary onlyPrimary with upper primaryPrimary with Upper primary & sec/higherUpper primary only
Para-teachers
School category
Upper primary with sec./higher secondary
Primary onlyPrimary with upper prim.
P. onlyP + UPP+sec/hsU.P. onlyUP+sec
NER(U.Prim)GER(U.Prim)NER (Primary)GER (Primary)
Transition ratePrim. to U. Prim
11.3
Performance indicators
SC/ST Enrolment
Indicators
Classrooms/Other rooms
Prim.with U.P.&Sec/H.SUpper Primary onlyU. Primary with Sec./H.S.
Basic Data, 2001
Data reported from
256,257 250,137 223,439 251,428
64,276 84,410
466 42441,339
100.0
89.3
0.93
# ## #
# 284,704 5,743 4,383Total
1 - 4 5 - 7
336,542 333,317 308,949 340,290
95.1 61.696.1 64.585.1 31.188.7 32.1
Elementary Education: Report Card - NAGPUR
Mah
aras
htr
a

334
27.8 21.1
Key data: Elementary Education
2876
NANDED
(Previous academic year)
(Previous year)
Gender and caste distribution of teachers*
No. of schools by type of building*
BoysWith disability
Flow rates
Primary Level
Enrolment*
Number of schools
Grade
GER / NER
School category
Primary Upper primaryBoys Boys GirlsGirls
IncentiveType
School categoryMultiple
TypeKuccha
PartiallyPucca
PuccaTotal % good condition
Otherrooms
TentNo
Building
Classrooms
Belowsecondary
Highersecondary
Postgraduate
M. Phil.GraduateSecondarySchool category OthersNo
response
ST teachers
Total Male Female No res Male Female No res Male Female Male FemaleSC teachers
Text booksUniformAttendanceStationery
% Passed
Avg. No. of Tchs.
%
Female literacyOverall literacy
dev. grant grantSchool T L M
Male Female
IVV
IIIIII
Grade R.R. D.O.R. P.R.
VIIVI
I - V
Enrolment by medium of instructions
Examination results
Retention rate
GPI
Primary cycle U. primary cycleState
DISTRICT ELEMENTARY EDUCATION REPORT CARD : 2005-06
GirlsGrade
IIIIIIIVVVI
VIII
AllGirls
Total
VII
% TotalGrossness
School category
1,005107
030
189 94434 96
0248
019
7 82 6
962 15569 195,77318 32,326
0 0177 7,932
59 442
922 51 49,736 7,98491,068 179,997 23,63116,589 28,584 4,840
0 0 0
4,865 401 3,15179,203 5,734 43,347
54,056 36,785 2,4016,274
8462,003
P + UP P+sec/hs U.P. only UP+sec
School categoryP. only
12.9 1.4 0.0 0.0 1.46.0
Number of Clusters 28191718
% Schools with SCR > 600.4 1.4 0.0 0.0
3.8 10.4 9.2 0.0 5.0% Schools with pre-primary sections 38.3 19.2 24.1 0.0 8.3% Schools with common toilets 31.5 50.5 55.3 0.0 78.8
% Schools with girls toilets 22.2 39.4 56.7 0.0 87.8% Schools with drinking water facility 41.3 57.5 74.5 0.0 98.2
% Enrolment in Govt. schools 59.5 68.3 66.1 0.0 9.1100.0 100.0 100.0 0.0 100.0
% No female teacher schools (tch>=2) 59.4 35.2 31.9 0.0 37.82.5 0.1 0.4 0.0 0.0
0.0 0.0 0.5 0.0 0.2%Enrolment in schools without blackboard 0.0 0.0 0.0 0.0 0.0
2001-02 2002-03 2003-04 2004-05 2005-06IIIIIIIVV
VIVII
Total U.P
86,31971,90471,82671,52163,56357,625
55,101
81,64274,36281,42066,95357,681
56,55251,573
90,36383,37977,20273,50168,140
60,51854,635
97,28484,38181,54779,61869,208
61,34952,342
89,16478,17780,69477,68871,025
57,95152,665
119.9
53.5
108.1
49.1
99.1
95.3
44.4
3.53.5
41,32034,08234,45634,68331,35527,61526,068
672544584589497390281
448397490476409289270
2,868
classrooms
6,0931,092
02,237
77.474.877.6
0.083.5
15.818.4
6.8
16.20.0
11.9
6.86.30.04.6
2,183450
01,120
1,000 781 74 25 1 231 5718 52 9 1 399 15
96 7 2 2 33 10 0 0 0 0 0
171 47 17 1 39 3
127 1,353 922 595 72 0 9356 3,291 2,189 1,888 233 1 3 287
90 517 216 447 105 1 6 1470 0 0 0 0 0 0 0
123 625 268 1,202 185 1 5 481
5 8 22 12 5 0 0 0
22885503
9390
1888
2459443
0521
789 165 2 3 0 362 107 188 39286147
0481
18208
11202
0100
831171
0259
31740
057
43765
0118
12423
032
Terminalgrade Passed
VII boysV girlsV boys
VII girls
164 with >60%
4.2324782771534
02900
6.67.10.05.1
2.94.55.40.04.4
84533Marathi Urdu English Hindi Others
24311141025
078795
360235688
41530
5359
76614253519
01039
4121111
00
903
368161377
00
% Schools recvd.
85.084.471.6
0.043.2
82.285.271.6
0.034.9
101883561413968223
693873054
1394221
1113255845
888868166
707532316
992920
2.96.9
10.90.0
10.4
11.28.47.28.5
6.96.0
7.98.7
2005-062004-052003-04
MAHARASHTRA
29.0
Upper PrimaryPrimary
Sex ratio Sex ratio 0-6
17 176
VIII2.1
Enrolment of children
VIIITotal Pr.
0 0334 2,566
51 404
1,115 419
%Teachers recvd.in-service training
Total schools* Rural schools* Total enrolment* Rural enrolment* Teachers*
32.2
100.0
64.6
92.6
45.7 48.9% SC enrolment% SC girls to SC enrolment% ST enrolment
48.5 47.810.448.0 46.2
38.3
47.5
25.9
45.6
Position of teachers by educational qualification (other than para teacher)
(Previous academic year)Incentives : Number of beneficiaries
% ST girls to ST enrolment
% Girls
Number of villages
% 0 - 6 population
% SC population % ST population
% Urban population
% Schools with blackboard
% Enrolment in single-teacher schools
% Enrolment in schools without building
Primary Upperprimary
OBC EnrolmentPrimary U. Primary
% OBCEnrolment% OBC girls toOBC Enrolment
Pupil-teacher ratio (PTR)Student-classroom ratio (SCR)% Schools with <= 50 students% Schools with PTR > 100% Female teachers
% Schools established since 1995
Regular teachers Para-teachers
% minorrepairs
% majorrepairs
# = not applicable na = not available * Some totals may not match due to no response in classificatory data items
8.3 80.52.9 88.7
11.9 80.93.3 88.2
5.6 85.71.1 92.0
4532
47.22832
55.30.4
24.46.5
49.03547
5.80.6
29.83.2
0.000
0.00.00.00.0
47.13039
1.41.1
18.016.9
23.1 17.3 8.8 67.8 54.3
92994224.016.6
Category
PrivateGovt.PrivateGovtPrivateGovt.PrivateGovt.PrivateGovt.
Total population (in 000's)
Number of blocks/taluks
District
Decadal growth rate
Primary onlyPrimary with upper primaryPrimary with upper primary & sec/higher sec.Upper primary onlyUpper primary with sec./higher secondary
% Single classroom schools% Single teacher schools
P + UP P+sec/hs U.P. only UP+secP. only
No response in school category
Primary with upper primaryPrimary with U.P. & sec/higherUpper primary onlyUpper primary with sec./higher sec
Primary only
Primary onlyPrimary with upper primaryPrimary with Upper primary & sec/higherUpper primary only
Para-teachers
School category
Upper primary with sec./higher secondary
Primary onlyPrimary with upper prim.
P. onlyP + UPP+sec/hsU.P. onlyUP+sec
NER(U.Prim)GER(U.Prim)NER (Primary)GER (Primary)
Transition ratePrim. to U. Prim
6.6
Performance indicators
SC/ST Enrolment
Indicators
Classrooms/Other rooms
Prim.with U.P.&Sec/H.SUpper Primary onlyU. Primary with Sec./H.S.
Basic Data, 2001
Data reported from
181,641 182,899 183,293 165,806 176,289
38,117 35,208 41,180
87 12218,947
88.2
67.7
0.92
# ## #
# 229,579 3,557 2,779Total
1 - 4 5 - 7
325,723 342,830 324,445 304,377 301,570
96.9 63.096.8 62.094.1 26.094.8 26.9
Elementary Education in India - Where do we stand ?
Mah
aras
htr
a

335
5.0 4.6
Key data: Elementary Education
1312
NANDURBAR
(Previous academic year)
(Previous year)
Gender and caste distribution of teachers*
No. of schools by type of building*
BoysWith disability
Flow rates
Primary Level
Enrolment*
Number of schools
Grade
GER / NER
School category
Primary Upper primaryBoys Boys GirlsGirls
IncentiveType
School categoryMultiple
TypeKuccha
PartiallyPucca
PuccaTotal % good condition
Otherrooms
TentNo
Building
Classrooms
Belowsecondary
Highersecondary
Postgraduate
M. Phil.GraduateSecondarySchool category OthersNo
response
ST teachers
Total Male Female No res Male Female No res Male Female Male FemaleSC teachers
Text booksUniformAttendanceStationery
% Passed
Avg. No. of Tchs.
%
Female literacyOverall literacy
dev. grant grantSchool T L M
Male Female
IVV
IIIIII
Grade R.R. D.O.R. P.R.
VIIVI
I - V
Enrolment by medium of instructions
Examination results
Retention rate
GPI
Primary cycle U. primary cycleState
DISTRICT ELEMENTARY EDUCATION REPORT CARD : 2005-06
GirlsGrade
IIIIIIIVVVI
VIII
AllGirls
Total
VII
% TotalGrossness
School category
14162
05
36 12884 61
2103
03
0 36 0
1,069 6925 28,11975 20,710
2 078 1,38335 0
1,023 38 70,271 4,36211,024 25,616 7,03428,613 20,367 23,397
442 0 442
1,052 0 1,02939,571 470 25,190
77,799 13,261 2,864817
308272
P + UP P+sec/hs U.P. only UP+sec
School categoryP. only
16.7 4.5 0.7 0.0 0.09.0
Number of Clusters 16071162
% Schools with SCR > 601.7 2.1 0.0 0.0
4.3 9.6 6.8 0.0 7.4% Schools with pre-primary sections 19.0 16.4 12.3 0.0 3.7% Schools with common toilets 41.0 60.5 75.3 100.0 79.6
% Schools with girls toilets 15.1 33.3 82.9 100.0 88.0% Schools with drinking water facility 88.9 89.8 99.3 100.0 100.0
% Enrolment in Govt. schools 85.4 71.8 42.0 0.0 3.4100.0 100.0 100.0 100.0 100.0
% No female teacher schools (tch>=2) 52.0 32.8 21.2 50.0 25.03.9 0.5 0.6 0.0 0.0
0.9 0.0 0.0 0.0 0.2%Enrolment in schools without blackboard 0.0 0.0 0.0 0.0 0.0
2001-02 2002-03 2003-04 2004-05 2005-06IIIIIIIVV
VIVII
Total U.P
39,31434,19630,92129,37025,76922,726
21,134
35,18231,12529,72027,99122,818
21,47619,537
34,28632,01030,57826,05912,327
10,1569,059
36,52232,64630,15928,16222,316
19,79518,957
90.6
19.6
96.1
40.8
96.4
82.5
44.5
2.12.1
18,79816,19814,79713,87511,86710,431
9,573
248158164165
684038
144101125101
364038
2,777
classrooms
9761,198
121,105
90.491.491.283.395.2
7.56.4
2.0
8.416.7
4.4
2.30.40.00.4
241572
5383
820 653 330 18 2 92 43102 27 2 0 44 2
88 27 11 0 16 31 0 0 0 1 0
78 15 4 0 7 4
143 1,305 706 693 86 3 941 491 232 262 35 0 0 24
110 325 173 546 62 0 1 40 0 0 6 3 0 1 0
36 209 151 590 90 4 2 14
1 8 20 23 0 0 0 0
2128757950
8827
304267
2255
817 209 10 8 0 282 93 697 15324
40
14
4916
0207
0000
8997
182
3333
028
234264
1105
79105
067
Terminalgrade Passed
VII boysV girlsV boys
VII girls
209 with >60%
10.9317210891232
111109
6.65.5
33.31.6
8.55.93.0
100.00.8
84886Marathi Urdu English Gujarati Others
3585446902
44234995
40291986
9120
2721
1181974998
01306
792218
00
1932
1720
23600
% Schools recvd.
92.892.774.050.068.5
93.893.275.350.069.4
5640722252
100227128
413848606
68510182
57179239563799226557
36213660015047819
2.86.28.45.5
10.3
9.86.45.64.6
5.24.3
7.76.9
2005-062004-052003-04
MAHARASHTRA
21.8
Upper PrimaryPrimary
Sex ratio Sex ratio 0-6
6 103
VIII16.4
Enrolment of children
VIIITotal Pr.
0 1132 1,077
0 146
546 686
%Teachers recvd.in-service training
Total schools* Rural schools* Total enrolment* Rural enrolment* Teachers*
33.7
98.4
54.7
78.6 83.3
12.7 43.3% SC enrolment% SC girls to SC enrolment% ST enrolment
47.2 45.983.547.6 43.3
17.0
46.6
14.9
50.8
Position of teachers by educational qualification (other than para teacher)
(Previous academic year)Incentives : Number of beneficiaries
% ST girls to ST enrolment
% Girls
Number of villages
% 0 - 6 population
% SC population % ST population
% Urban population
% Schools with blackboard
% Enrolment in single-teacher schools
% Enrolment in schools without building
Primary Upperprimary
OBC EnrolmentPrimary U. Primary
% OBCEnrolment% OBC girls toOBC Enrolment
Pupil-teacher ratio (PTR)Student-classroom ratio (SCR)% Schools with <= 50 students% Schools with PTR > 100% Female teachers
% Schools established since 1995
Regular teachers Para-teachers
% minorrepairs
% majorrepairs
# = not applicable na = not available * Some totals may not match due to no response in classificatory data items
9.6 85.8
1.0 92.10.3 94.5
4140
48.72933
49.10.4
26.016.4
44.93640
3.41.1
27.912.4
46.84037
0.00.0
18.250.0
47.33737
1.90.0
23.627.8
23.2 3.2 65.5 55.8 45.2
96197715.417.6
Category
PrivateGovt.PrivateGovtPrivateGovt.PrivateGovt.PrivateGovt.
Total population (in 000's)
Number of blocks/taluks
District
Decadal growth rate
Primary onlyPrimary with upper primaryPrimary with upper primary & sec/higher sec.Upper primary onlyUpper primary with sec./higher secondary
% Single classroom schools% Single teacher schools
P + UP P+sec/hs U.P. only UP+secP. only
No response in school category
Primary with upper primaryPrimary with U.P. & sec/higherUpper primary onlyUpper primary with sec./higher sec
Primary only
Primary onlyPrimary with upper primaryPrimary with Upper primary & sec/higherUpper primary only
Para-teachers
School category
Upper primary with sec./higher secondary
Primary onlyPrimary with upper prim.
P. onlyP + UPP+sec/hsU.P. onlyUP+sec
NER(U.Prim)GER(U.Prim)NER (Primary)GER (Primary)
Transition ratePrim. to U. Prim
53.1
Performance indicators
SC/ST Enrolment
Indicators
Classrooms/Other rooms
Prim.with U.P.&Sec/H.SUpper Primary onlyU. Primary with Sec./H.S.
Basic Data, 2001
Data reported from
61,068 31,542 63,831 69,629
17,549 18,544
44 298,315
85.8
76.9
0.91
# ## #
# 95,539 881 585Total
1 - 4 5 - 7
127,489 122,933 124,018 133,801
99.0 63.398.5 60.890.8 28.991.1 30.1
Elementary Education: Report Card - NANDURBAR
Mah
aras
htr
a
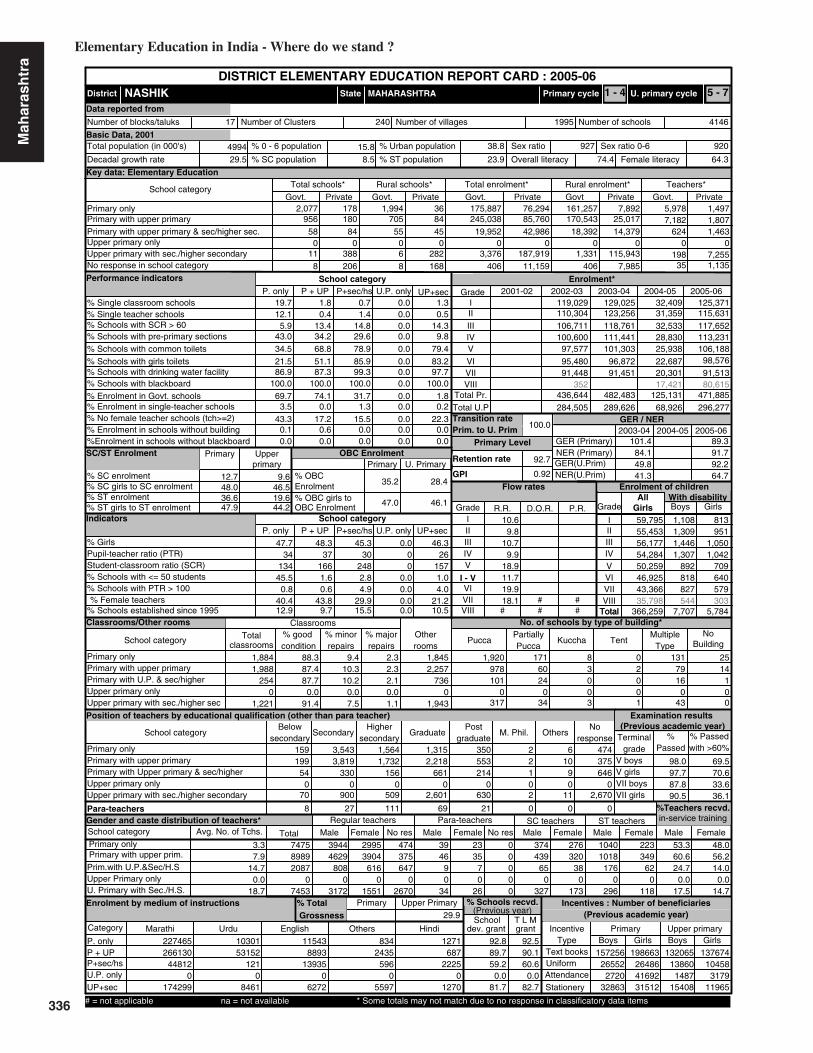
336
12.7 9.6
Key data: Elementary Education
4994
NASHIK
(Previous academic year)
(Previous year)
Gender and caste distribution of teachers*
No. of schools by type of building*
BoysWith disability
Flow rates
Primary Level
Enrolment*
Number of schools
Grade
GER / NER
School category
Primary Upper primaryBoys Boys GirlsGirls
IncentiveType
School categoryMultiple
TypeKuccha
PartiallyPucca
PuccaTotal % good condition
Otherrooms
TentNo
Building
Classrooms
Belowsecondary
Highersecondary
Postgraduate
M. Phil.GraduateSecondarySchool category OthersNo
response
ST teachers
Total Male Female No res Male Female No res Male Female Male FemaleSC teachers
Text booksUniformAttendanceStationery
% Passed
Avg. No. of Tchs.
%
Female literacyOverall literacy
dev. grant grantSchool T L M
Male Female
IVV
IIIIII
Grade R.R. D.O.R. P.R.
VIIVI
I - V
Enrolment by medium of instructions
Examination results
Retention rate
GPI
Primary cycle U. primary cycleState
DISTRICT ELEMENTARY EDUCATION REPORT CARD : 2005-06
GirlsGrade
IIIIIIIVVVI
VIII
AllGirls
Total
VII
% TotalGrossness
School category
95658
011
180 70584 55
0388
06
8 206 8
2,077 17884 245,03845 19,952
0 0282 3,376168 406
1,994 36 161,257 7,89285,760 170,543 25,01742,986 18,392 14,379
0 0 0
11,159 406 7,985187,919 1,331 115,943
175,887 76,294 5,9787,182
1,4971,807
P + UP P+sec/hs U.P. only UP+sec
School categoryP. only
19.7 1.8 0.7 0.0 1.312.1
Number of Clusters 41461995
% Schools with SCR > 600.4 1.4 0.0 0.5
5.9 13.4 14.8 0.0 14.3% Schools with pre-primary sections 43.0 34.2 29.6 0.0 9.8% Schools with common toilets 34.5 68.8 78.9 0.0 79.4
% Schools with girls toilets 21.5 51.1 85.9 0.0 83.2% Schools with drinking water facility 86.9 87.3 99.3 0.0 97.7
% Enrolment in Govt. schools 69.7 74.1 31.7 0.0 1.8100.0 100.0 100.0 0.0 100.0
% No female teacher schools (tch>=2) 43.3 17.2 15.5 0.0 22.33.5 0.0 1.3 0.0 0.2
0.1 0.6 0.0 0.0 0.0%Enrolment in schools without blackboard 0.0 0.0 0.0 0.0 0.0
2001-02 2002-03 2003-04 2004-05 2005-06IIIIIIIVV
VIVII
Total U.P
125,371115,631117,652113,231106,188
98,576
91,513
32,40931,35932,53328,83025,938
22,68720,301
129,025123,256118,761111,441101,303
96,87291,451
119,029110,304106,711100,600
97,577
95,48091,448
101.4
49.8
89.3
92.2
45.3
2.84.9
59,79555,45356,17754,28450,25946,92543,366
1,1081,3091,4461,307
892818827
813951
1,0501,042
709640579
1,884
classrooms
1,988254
01,221
88.387.487.7
0.091.4
9.410.3
2.3
10.20.07.5
2.32.10.01.1
2,257736
01,943
1,845 1,920 171 8 0 131 25978 60 3 2 79 14101 24 0 0 16 1
0 0 0 0 0 0317 34 3 1 43 0
159 3,543 1,564 1,315 350 2 6199 3,819 1,732 2,218 553 2 10 375
54 330 156 661 214 1 9 6460 0 0 0 0 0 0 0
70 900 509 2,601 630 2 11 2,670
8 27 111 69 21 0 0 0
39444629
8080
3172
3904616
01551
2995 474 39 23 0 374 276 1040 223375647
02670
4690
34
3570
26
0000
43965
0327
32038
0173
1018176
0296
34962
0118
Terminalgrade Passed
VII boysV girlsV boys
VII girls
474 with >60%
53.3747589892087
07453
60.624.7
0.017.5
48.056.214.0
0.014.7
227465Marathi Urdu English Others Hindi
26613044812
0174299
1030153152
1210
8461
115438893
139350
6272
8342435
5960
5597
1271687
22250
1270
% Schools recvd.
92.889.759.2
0.081.7
92.590.160.6
0.082.7
15725626552
272032863
13206513860
148715408
198663264864169231512
13767410458
317911965
3.37.9
14.70.0
18.7
10.69.8
10.79.9
19.918.1
18.911.7
2005-062004-052003-04
MAHARASHTRA
29.9
Upper PrimaryPrimary
Sex ratio Sex ratio 0-6
17 240
VIII15.5
Enrolment of children
VIIITotal Pr.
0 0198 7,255
35 1,135
624 1,463
%Teachers recvd.in-service training
Total schools* Rural schools* Total enrolment* Rural enrolment* Teachers*
29.9
91.7
64.7
84.1
41.3% SC enrolment% SC girls to SC enrolment% ST enrolment
48.0 46.536.647.9 44.2
35.2
47.0
28.4
46.1
Position of teachers by educational qualification (other than para teacher)
(Previous academic year)Incentives : Number of beneficiaries
% ST girls to ST enrolment
% Girls
Number of villages
% 0 - 6 population
% SC population % ST population
% Urban population
% Schools with blackboard
% Enrolment in single-teacher schools
% Enrolment in schools without building
Primary Upperprimary
OBC EnrolmentPrimary U. Primary
% OBCEnrolment% OBC girls toOBC Enrolment
Pupil-teacher ratio (PTR)Student-classroom ratio (SCR)% Schools with <= 50 students% Schools with PTR > 100% Female teachers
% Schools established since 1995
Regular teachers Para-teachers
% minorrepairs
% majorrepairs
# = not applicable na = not available * Some totals may not match due to no response in classificatory data items
24830
47.734
13445.5
0.840.412.9
48.337
1661.60.6
43.89.7
0.000
0.00.00.00.0
46.326
1571.04.0
21.210.5
29.5 8.5 23.9 74.4 64.3
92092738.815.8
Category
PrivateGovt.PrivateGovtPrivateGovt.PrivateGovt.PrivateGovt.
Total population (in 000's)
Number of blocks/taluks
District
Decadal growth rate
Primary onlyPrimary with upper primaryPrimary with upper primary & sec/higher sec.Upper primary onlyUpper primary with sec./higher secondary
% Single classroom schools% Single teacher schools
P + UP P+sec/hs U.P. only UP+secP. only
No response in school category
Primary with upper primaryPrimary with U.P. & sec/higherUpper primary onlyUpper primary with sec./higher sec
Primary only
Primary onlyPrimary with upper primaryPrimary with Upper primary & sec/higherUpper primary only
Para-teachers
School category
Upper primary with sec./higher secondary
Primary onlyPrimary with upper prim.
P. onlyP + UPP+sec/hsU.P. onlyUP+sec
NER(U.Prim)GER(U.Prim)NER (Primary)GER (Primary)
Transition ratePrim. to U. Prim
19.6
Performance indicators
SC/ST Enrolment
Indicators
Classrooms/Other rooms
Prim.with U.P.&Sec/H.SUpper Primary onlyU. Primary with Sec./H.S.
Basic Data, 2001
Data reported from
284,505 289,626 68,926 296,277
352 17,421 80,615
544 30335,798
100.0
92.7
0.92
# ## #
# 366,259 7,707 5,784Total
1 - 4 5 - 7
436,644 482,483 125,131 471,885
98.0 69.597.7 70.687.8 33.690.5 36.1
Elementary Education in India - Where do we stand ?
Mah
aras
htr
a

337
21.8 16.5
Key data: Elementary Education
1487
OSMANABAD
(Previous academic year)
(Previous year)
Gender and caste distribution of teachers*
No. of schools by type of building*
BoysWith disability
Flow rates
Primary Level
Enrolment*
Number of schools
Grade
GER / NER
School category
Primary Upper primaryBoys Boys GirlsGirls
IncentiveType
School categoryMultiple
TypeKuccha
PartiallyPucca
PuccaTotal % good condition
Otherrooms
TentNo
Building
Classrooms
Belowsecondary
Highersecondary
Postgraduate
M. Phil.GraduateSecondarySchool category OthersNo
response
ST teachers
Total Male Female No res Male Female No res Male Female Male FemaleSC teachers
Text booksUniformAttendanceStationery
% Passed
Avg. No. of Tchs.
%
Female literacyOverall literacy
dev. grant grantSchool T L M
Male Female
IVV
IIIIII
Grade R.R. D.O.R. P.R.
VIIVI
I - V
Enrolment by medium of instructions
Examination results
Retention rate
GPI
Primary cycle U. primary cycleState
DISTRICT ELEMENTARY EDUCATION REPORT CARD : 2005-06
GirlsGrade
IIIIIIIVVVI
VIII
AllGirls
Total
VII
% TotalGrossness
School category
73416
194
134 67643 10
6327
074
11 77 10
526 14037 141,79413 3,646
4 128237 21,125
68 480
476 35 33,075 7,42856,626 126,635 10,40912,735 2,024 2,271
1,095 0 805
3,851 480 3,34992,808 17,373 53,380
40,666 43,504 2,1705,646
1,0231,403
P + UP P+sec/hs U.P. only UP+sec
School categoryP. only
7.2 0.7 1.7 0.0 1.25.4
Number of Clusters 2109965
% Schools with SCR > 600.3 1.7 0.0 0.5
4.8 7.6 1.7 14.3 3.1% Schools with pre-primary sections 31.5 19.4 23.7 0.0 2.9% Schools with common toilets 65.3 74.0 78.0 85.7 78.6
% Schools with girls toilets 34.2 57.3 86.4 71.4 86.7% Schools with drinking water facility 72.1 80.8 93.2 100.0 96.2
% Enrolment in Govt. schools 48.3 71.5 22.3 10.5 18.5100.0 100.0 100.0 100.0 100.0
% No female teacher schools (tch>=2) 46.2 32.6 39.0 42.9 46.30.7 0.0 0.2 0.0 0.2
0.0 0.7 0.0 0.0 0.2%Enrolment in schools without blackboard 0.0 0.0 0.0 0.0 0.0
2001-02 2002-03 2003-04 2004-05 2005-06IIIIIIIVV
VIVII
Total U.P
60,23451,20651,31251,55952,89251,970
50,618
34,01532,30232,16031,39332,025
31,68331,309
37,26934,50133,68032,68033,485
34,08733,608
39,10334,82433,83734,27934,838
35,54033,518
38,46033,96434,54135,22438,083
36,45033,950
103.0
61.8
95.7
56.6
136.2
162.6
42.9
13.60.0
28,40023,95024,11224,28724,69424,72723,553
701578642610582493474
495428465453406366301
2,587
classrooms
5,776544
393,929
84.376.388.584.682.4
12.017.3
3.7
9.82.6
13.9
6.41.7
12.83.7
1,803268
411,918
1,046 537 34 11 0 68 11682 40 9 1 122 10
53 0 2 0 1 25 2 0 0 0 0
304 36 18 1 56 5
64 979 844 528 104 0 2114 2,138 1,754 1,529 275 1 23 1,176
25 48 45 179 56 0 0 2731 5 2 28 10 1 0 9
86 494 303 1,726 435 6 9 1,991
0 10 34 28 6 0 0 0
17274142
25338
2533
1693100
9526
795 654 12 5 0 217 84 145 271175
2739
1991
20209
19011
0000
53632
3387
20290
64
25710
1119
8230
28
Terminalgrade Passed
VII boysV girlsV boys
VII girls
655 with >60%
50.931937049
62857
5060
62.425.534.224.8
46.555.725.0
0.024.9
74696Marathi Urdu English Others Nepali
17162810409
1020105338
584522466
3695181
3597
36211782354
00
9951075
13922
780
1408383
000
% Schools recvd.
85.691.557.657.176.7
85.491.761.057.172.7
837599117
52313375
799243394
553586
871158236
1806612549
785782292
5762222
4.88.1
10.68.1
12.0
14.69.98.48.3
11.111.1
11.910.7
2005-062004-052003-04
MAHARASHTRA
15.9
Upper PrimaryPrimary
Sex ratio Sex ratio 0-6
9 101
VIII33.9
Enrolment of children
VIIITotal Pr.
9 481,018 4,042
49 425
141 487
%Teachers recvd.in-service training
Total schools* Rural schools* Total enrolment* Rural enrolment* Teachers*
26.9
100.0
100.0
85.1 79.3
52.3 61.8% SC enrolment% SC girls to SC enrolment% ST enrolment
47.5 46.74.4
45.2 43.2
34.5
46.5
26.4
45.4
Position of teachers by educational qualification (other than para teacher)
(Previous academic year)Incentives : Number of beneficiaries
% ST girls to ST enrolment
% Girls
Number of villages
% 0 - 6 population
% SC population % ST population
% Urban population
% Schools with blackboard
% Enrolment in single-teacher schools
% Enrolment in schools without building
Primary Upperprimary
OBC EnrolmentPrimary U. Primary
% OBCEnrolment% OBC girls toOBC Enrolment
Pupil-teacher ratio (PTR)Student-classroom ratio (SCR)% Schools with <= 50 students% Schools with PTR > 100% Female teachers
% Schools established since 1995
Regular teachers Para-teachers
% minorrepairs
% majorrepairs
# = not applicable na = not available * Some totals may not match due to no response in classificatory data items
3026
45.52633
50.50.0
25.116.5
48.92834
5.40.2
24.39.1
45.72131
28.60.0
17.542.9
44.92329
11.20.5
10.418.5
15.4 16.5 1.9 69.0 56.9
89493215.715.0
Category
PrivateGovt.PrivateGovtPrivateGovt.PrivateGovt.PrivateGovt.
Total population (in 000's)
Number of blocks/taluks
District
Decadal growth rate
Primary onlyPrimary with upper primaryPrimary with upper primary & sec/higher sec.Upper primary onlyUpper primary with sec./higher secondary
% Single classroom schools% Single teacher schools
P + UP P+sec/hs U.P. only UP+secP. only
No response in school category
Primary with upper primaryPrimary with U.P. & sec/higherUpper primary onlyUpper primary with sec./higher sec
Primary only
Primary onlyPrimary with upper primaryPrimary with Upper primary & sec/higherUpper primary only
Para-teachers
School category
Upper primary with sec./higher secondary
Primary onlyPrimary with upper prim.
P. onlyP + UPP+sec/hsU.P. onlyUP+sec
NER(U.Prim)GER(U.Prim)NER (Primary)GER (Primary)
Transition ratePrim. to U. Prim
3.0
Performance indicators
SC/ST Enrolment
Indicators
Classrooms/Other rooms
Prim.with U.P.&Sec/H.SUpper Primary onlyU. Primary with Sec./H.S.
Basic Data, 2001
Data reported from
108,483 103,896 101,180 95,017 155,480
28,387 38 28,502 48,667
283 14322,451
100.0
100.0
0.89
# ## #
# 173,723 4,080 2,914Total
1 - 4 5 - 7
142,189 142,043 138,130 129,870 214,311
97.4 68.997.6 69.292.5 27.095.2 37.7
Elementary Education: Report Card - OSMANABAD
Mah
aras
htr
a

338
21.1 14.7
Key data: Elementary Education
1528
PARBHANI
(Previous academic year)
(Previous year)
Gender and caste distribution of teachers*
No. of schools by type of building*
BoysWith disability
Flow rates
Primary Level
Enrolment*
Number of schools
Grade
GER / NER
School category
Primary Upper primaryBoys Boys GirlsGirls
IncentiveType
School categoryMultiple
TypeKuccha
PartiallyPucca
PuccaTotal % good condition
Otherrooms
TentNo
Building
Classrooms
Belowsecondary
Highersecondary
Postgraduate
M. Phil.GraduateSecondarySchool category OthersNo
response
ST teachers
Total Male Female No res Male Female No res Male Female Male FemaleSC teachers
Text booksUniformAttendanceStationery
% Passed
Avg. No. of Tchs.
%
Female literacyOverall literacy
dev. grant grantSchool T L M
Male Female
IVV
IIIIII
Grade R.R. D.O.R. P.R.
VIIVI
I - V
Enrolment by medium of instructions
Examination results
Retention rate
GPI
Primary cycle U. primary cycleState
DISTRICT ELEMENTARY EDUCATION REPORT CARD : 2005-06
GirlsGrade
IIIIIIIVVVI
VIII
AllGirls
Total
VII
% TotalGrossness
School category
55311
341
82 52041 6
5147
234
0 0 0
428 8720 123,21514 2,612
3 61390 8,931
0 0
403 14 24,467 2,19138,430 113,627 6,04112,737 1,273 2,694
1,073 485 783
0 0 044,299 7,862 19,115
29,858 27,986 1,1633,858
660910
P + UP P+sec/hs U.P. only UP+sec
School categoryP. only
10.9 1.1 1.9 0.0 0.06.4
Number of Clusters 1398866
% Schools with SCR > 600.0 0.0 0.0 0.0
5.0 10.4 1.9 12.5 3.2% Schools with pre-primary sections 37.9 29.6 23.1 0.0 3.2% Schools with common toilets 69.5 69.6 75.0 87.5 83.5
% Schools with girls toilets 32.4 38.6 84.6 50.0 88.8% Schools with drinking water facility 59.4 69.0 92.3 100.0 94.7
% Enrolment in Govt. schools 51.6 76.2 17.0 36.4 16.8100.0 100.0 100.0 100.0 100.0
% No female teacher schools (tch>=2) 67.2 48.7 48.1 37.5 59.01.3 0.0 0.0 0.0 0.0
1.0 0.6 0.0 0.0 0.0%Enrolment in schools without blackboard 0.0 0.0 0.0 0.0 0.0
2001-02 2002-03 2003-04 2004-05 2005-06IIIIIIIVV
VIVII
Total U.P
46,61739,86538,97539,45735,53433,778
32,106
43,62638,93737,92435,30533,283
31,60828,767
46,76943,02039,52737,80139,669
37,03732,735
49,21140,60639,12638,71938,864
34,98029,998
120.7
62.0
108.7
52.8
102.0
103.2
43.2
13.50.0
22,06719,07518,45918,82216,80516,09214,830
697536617541491391349
460418482431364276247
1,691
classrooms
3,985478
541,711
81.773.390.666.786.3
14.618.3
3.7
6.924.110.2
8.42.59.33.5
935219
64714
591 409 37 4 0 53 12480 32 6 0 111 6
46 1 2 0 0 35 2 0 0 1 0
146 17 9 0 13 3
45 434 496 259 44 0 3101 1,219 1,298 880 140 0 22 1,086
19 45 33 141 51 0 0 2881 5 7 29 14 1 0 16
35 160 127 620 183 5 5 1,164
0 4 23 10 3 0 0 0
9662796
21546
950
8647411
185
315 527 10 5 0 113 31 84 121086
28816
1164
12200
10010
0000
34724
4137
9271
16
20011
339
36507
Terminalgrade Passed
VII boysV girlsV boys
VII girls
527 with >60%
50.318234768
57974
2299
49.323.541.325.3
41.941.828.425.024.9
49685Marathi Urdu Others English Nepali
13910410379
150548721
434520002
3382181
2779
1950739
00
312
362613
158800
14180000
% Schools recvd.
86.688.365.475.060.6
84.787.665.475.061.2
644488968
32916099
433241784
02094
6687685963794
15811
445911274
01609
3.57.5
11.19.3
12.2
12.39.58.18.2
9.210.2
10.19.7
2005-062004-052003-04
MAHARASHTRA
12.8
Upper PrimaryPrimary
Sex ratio Sex ratio 0-6
9 88
VIII32.7
Enrolment of children
VIIITotal Pr.
31 43436 1,863
0 0
102 477
%Teachers recvd.in-service training
Total schools* Rural schools* Total enrolment* Rural enrolment* Teachers*
32.0
100.0
70.2
93.9
53.2 54.3% SC enrolment% SC girls to SC enrolment% ST enrolment
47.3 45.94.2
50.8 43.9
37.1
46.9
26.7
44.4
Position of teachers by educational qualification (other than para teacher)
(Previous academic year)Incentives : Number of beneficiaries
% ST girls to ST enrolment
% Girls
Number of villages
% 0 - 6 population
% SC population % ST population
% Urban population
% Schools with blackboard
% Enrolment in single-teacher schools
% Enrolment in schools without building
Primary Upperprimary
OBC EnrolmentPrimary U. Primary
% OBCEnrolment% OBC girls toOBC Enrolment
Pupil-teacher ratio (PTR)Student-classroom ratio (SCR)% Schools with <= 50 students% Schools with PTR > 100% Female teachers
% Schools established since 1995
Regular teachers Para-teachers
% minorrepairs
% majorrepairs
# = not applicable na = not available * Some totals may not match due to no response in classificatory data items
4.8 82.9
0.6 91.13227
45.83234
53.40.2
17.614.4
49.33441
2.70.3
18.36.6
45.02331
12.50.0
16.225.0
43.02331
14.90.58.0
31.4
15.3 10.0 2.3 66.1 52.0
92395831.816.5
Category
PrivateGovt.PrivateGovtPrivateGovt.PrivateGovt.PrivateGovt.
Total population (in 000's)
Number of blocks/taluks
District
Decadal growth rate
Primary onlyPrimary with upper primaryPrimary with upper primary & sec/higher sec.Upper primary onlyUpper primary with sec./higher secondary
% Single classroom schools% Single teacher schools
P + UP P+sec/hs U.P. only UP+secP. only
No response in school category
Primary with upper primaryPrimary with U.P. & sec/higherUpper primary onlyUpper primary with sec./higher sec
Primary only
Primary onlyPrimary with upper primaryPrimary with Upper primary & sec/higherUpper primary only
Para-teachers
School category
Upper primary with sec./higher secondary
Primary onlyPrimary with upper prim.
P. onlyP + UPP+sec/hsU.P. onlyUP+sec
NER(U.Prim)GER(U.Prim)NER (Primary)GER (Primary)
Transition ratePrim. to U. Prim
2.9
Performance indicators
SC/ST Enrolment
Indicators
Classrooms/Other rooms
Prim.with U.P.&Sec/H.SUpper Primary onlyU. Primary with Sec./H.S.
Basic Data, 2001
Data reported from
103,842 109,441 93,658 101,418
19,281 23,422
149 8710,360
91.1
74.3
0.91
# ## #
# 126,150 3,622 2,678Total
1 - 4 5 - 7
167,662 167,117 155,792 164,914
95.8 51.996.2 50.692.1 26.893.5 31.5
Elementary Education in India - Where do we stand ?
Mah
aras
htr
a

339
20.8 15.1
Key data: Elementary Education
7233
PUNE
(Previous academic year)
(Previous year)
Gender and caste distribution of teachers*
No. of schools by type of building*
BoysWith disability
Flow rates
Primary Level
Enrolment*
Number of schools
Grade
GER / NER
School category
Primary Upper primaryBoys Boys GirlsGirls
IncentiveType
School categoryMultiple
TypeKuccha
PartiallyPucca
PuccaTotal % good condition
Otherrooms
TentNo
Building
Classrooms
Belowsecondary
Highersecondary
Postgraduate
M. Phil.GraduateSecondarySchool category OthersNo
response
ST teachers
Total Male Female No res Male Female No res Male Female Male FemaleSC teachers
Text booksUniformAttendanceStationery
% Passed
Avg. No. of Tchs.
%
Female literacyOverall literacy
dev. grant grantSchool T L M
Male Female
IVV
IIIIII
Grade R.R. D.O.R. P.R.
VIIVI
I - V
Enrolment by medium of instructions
Examination results
Retention rate
GPI
Primary cycle U. primary cycleState
DISTRICT ELEMENTARY EDUCATION REPORT CARD : 2005-06
GirlsGrade
IIIIIIIVVVI
VIII
AllGirls
Total
VII
% TotalGrossness
School category
1,26036
350
297 862162 24
7530
218
26 307 9
2,600 30947 302,29778 10,907
6 567328 17,956190 3,779
2,426 66 141,725 15,878142,649 158,952 11,698
60,540 5,456 22,5863,840 215 3,486
29,795 1,419 13,225209,009 4,782 110,153
177,297 118,115 6,7939,680
2,3953,059
P + UP P+sec/hs U.P. only UP+sec
School categoryP. only
12.4 1.3 2.0 0.0 0.312.5
Number of Clusters 55871995
% Schools with SCR > 600.9 0.0 0.0 0.3
3.8 9.2 7.1 20.0 5.2% Schools with pre-primary sections 60.1 59.7 38.9 0.0 5.7% Schools with common toilets 31.3 63.0 79.3 50.0 77.6
% Schools with girls toilets 21.2 48.4 89.4 50.0 88.6% Schools with drinking water facility 84.3 92.6 99.0 90.0 99.1
% Enrolment in Govt. schools 60.0 67.9 15.3 12.9 7.9100.0 100.0 100.0 100.0 100.0
% No female teacher schools (tch>=2) 29.5 10.3 9.6 10.0 12.22.3 0.3 0.0 0.0 0.0
0.2 0.2 1.0 0.0 0.0%Enrolment in schools without blackboard 0.0 0.0 0.0 0.0 0.0
2001-02 2002-03 2003-04 2004-05 2005-06IIIIIIIVV
VIVII
Total U.P
158,733145,250144,411138,459132,609127,673
121,343
129,549122,598119,630113,404112,508
109,497102,217
138,141125,781124,212120,185108,678
102,12394,295
73.9
35.8
69.4
37.4
76.7
82.0
45.1
8.65.1
73,96667,92667,84165,18662,20459,79757,308
1,5721,6851,8141,6441,4721,2701,143
1,0531,1811,2471,2131,1381,058
932
9,442
classrooms
12,1392,245
1337,084
82.883.895.394.794.5
12.311.5
4.9
4.11.55.0
4.70.63.80.5
3,423918
783,123
2,778 2,560 136 22 0 148 421,379 55 4 0 102 17
172 9 1 0 7 99 0 0 0 0 1
527 20 3 0 21 9
352 3,568 1,944 2,498 748 7 5416 4,070 2,558 4,071 1,428 24 18 0
82 269 270 887 281 8 3 00 14 11 64 13 0 0 0
105 850 619 2,917 996 8 19 0
15 80 65 106 37 0 0 0
39534576
77362
3202
80091027
402312
5169 0 32 34 0 518 588 384 1840000
4191
35
11320
23
0000
60090
6494
84096
5283
46161
6184
29639
1108
Terminalgrade Passed
VII boysV girlsV boys
VII girls
0 with >60%
27.6918812739
1811103
5572
23.76.39.54.5
17.714.8
4.22.53.4
252017Marathi English Urdu Others Hindi
37301041992
3830200657
306144854924411
35420510
396612949
8420
2183
423939561710
1661209
32412799
9820
1479
% Schools recvd.
90.683.940.970.054.0
90.884.335.960.052.6
16366038783
503743992
14132619737
17218966
204029427441366046347
15949619857
60519623
3.28.29.1
10.39.6
13.410.610.8
8.2
10.38.7
11.911.0
2005-062004-052003-04
MAHARASHTRA
56.8
Upper PrimaryPrimary
Sex ratio Sex ratio 0-6
15 478
VIII22.7
Enrolment of children
VIIITotal Pr.
23 80427 5,145153 1,623
283 1,528
%Teachers recvd.in-service training
Total schools* Rural schools* Total enrolment* Rural enrolment* Teachers*
0.2 32.5
76.5
55.4
60.0 55.4
28.7 39.2% SC enrolment% SC girls to SC enrolment% ST enrolment
47.7 45.16.0
47.3 43.9
28.3
47.0
19.6
47.0
Position of teachers by educational qualification (other than para teacher)
(Previous academic year)Incentives : Number of beneficiaries
% ST girls to ST enrolment
% Girls
Number of villages
% 0 - 6 population
% SC population % ST population
% Urban population
% Schools with blackboard
% Enrolment in single-teacher schools
% Enrolment in schools without building
Primary Upperprimary
OBC EnrolmentPrimary U. Primary
% OBCEnrolment% OBC girls toOBC Enrolment
Pupil-teacher ratio (PTR)Student-classroom ratio (SCR)% Schools with <= 50 students% Schools with PTR > 100% Female teachers
% Schools established since 1995
Regular teachers Para-teachers
% minorrepairs
% majorrepairs
# = not applicable na = not available * Some totals may not match due to no response in classificatory data items
3239
46.23231
59.00.8
56.612.8
48.03537
4.51.4
63.810.0
34.34333
0.00.0
38.820.0
46.14132
5.74.8
41.914.1
30.6 10.5 3.6 80.5 71.9
90291958.113.4
Category
PrivateGovt.PrivateGovtPrivateGovt.PrivateGovt.PrivateGovt.
Total population (in 000's)
Number of blocks/taluks
District
Decadal growth rate
Primary onlyPrimary with upper primaryPrimary with upper primary & sec/higher sec.Upper primary onlyUpper primary with sec./higher secondary
% Single classroom schools% Single teacher schools
P + UP P+sec/hs U.P. only UP+secP. only
No response in school category
Primary with upper primaryPrimary with U.P. & sec/higherUpper primary onlyUpper primary with sec./higher sec
Primary only
Primary onlyPrimary with upper primaryPrimary with Upper primary & sec/higherUpper primary only
Para-teachers
School category
Upper primary with sec./higher secondary
Primary onlyPrimary with upper prim.
P. onlyP + UPP+sec/hsU.P. onlyUP+sec
NER(U.Prim)GER(U.Prim)NER (Primary)GER (Primary)
Transition ratePrim. to U. Prim
4.0
Performance indicators
SC/ST Enrolment
Indicators
Classrooms/Other rooms
Prim.with U.P.&Sec/H.SUpper Primary onlyU. Primary with Sec./H.S.
Basic Data, 2001
Data reported from
305,096 324,222 381,625
87,351 108,273
536 36749,626
100.0
0.88
# ## #
# 454,228 10,600 7,822Total
1 - 4 5 - 7
508,319 485,181 586,853
92.9 56.892.6 59.486.0 33.389.2 38.4
Elementary Education: Report Card - PUNE
Mah
aras
htr
a

340
9.0 6.2
Key data: Elementary Education
2208
RAIGARH (MAHARASHTRA)
(Previous academic year)
(Previous year)
Gender and caste distribution of teachers*
No. of schools by type of building*
BoysWith disability
Flow rates
Primary Level
Enrolment*
Number of schools
Grade
GER / NER
School category
Primary Upper primaryBoys Boys GirlsGirls
IncentiveType
School categoryMultiple
TypeKuccha
PartiallyPucca
PuccaTotal % good condition
Otherrooms
TentNo
Building
Classrooms
Belowsecondary
Highersecondary
Postgraduate
M. Phil.GraduateSecondarySchool category OthersNo
response
ST teachers
Total Male Female No res Male Female No res Male Female Male FemaleSC teachers
Text booksUniformAttendanceStationery
% Passed
Avg. No. of Tchs.
%
Female literacyOverall literacy
dev. grant grantSchool T L M
Male Female
IVV
IIIIII
Grade R.R. D.O.R. P.R.
VIIVI
I - V
Enrolment by medium of instructions
Examination results
Retention rate
GPI
Primary cycle U. primary cycleState
DISTRICT ELEMENTARY EDUCATION REPORT CARD : 2005-06
GirlsGrade
IIIIIIIVVVI
VIII
AllGirls
Total
VII
% TotalGrossness
School category
758618
62 68919 6
0245
06
6 121 3
1,855 8744 120,81215 2,011
0 37207 1,949110 275
1,811 56 80,926 9,94718,025 103,026 9,612
5,768 2,011 3,9840 0 0
6,431 180 5,71290,761 1,411 67,333
85,547 26,628 3,5424,193
562510
P + UP P+sec/hs U.P. only UP+sec
School categoryP. only
37.8 3.5 8.0 0.0 2.432.3
Number of Clusters 31681768
% Schools with SCR > 602.3 4.0 100.0 2.4
2.3 4.8 20.0 0.0 5.9% Schools with pre-primary sections 48.6 47.6 56.0 100.0 9.9% Schools with common toilets 66.0 78.9 72.0 0.0 74.3
% Schools with girls toilets 36.7 53.0 92.0 0.0 86.6% Schools with drinking water facility 81.1 86.5 96.0 100.0 98.4
% Enrolment in Govt. schools 76.3 87.0 25.9 100.0 2.1100.0 100.0 100.0 100.0 100.0
% No female teacher schools (tch>=2) 22.6 18.4 0.0 0.0 6.312.3 0.5 1.7 100.0 1.3
0.0 0.0 0.0 0.0 0.0%Enrolment in schools without blackboard 0.0 0.0 0.0 0.0 0.0
2001-02 2002-03 2003-04 2004-05 2005-06IIIIIIIVV
VIVII
Total U.P
57,28047,94547,88146,35445,74843,229
40,975
53,49148,41547,52944,16843,592
42,16939,794
57,64650,05749,64444,47942,670
41,66640,073
49,85042,30842,60139,45837,023
38,05035,278
97.7
49.7
92.8
48.8
85.4
91.5
44.3
0.04.0
27,78323,07723,28222,31722,04420,66619,515
865695646557326302243
593501472420259201157
3,987
classrooms
4,367201
22,994
77.178.490.0
100.084.9
19.316.4
3.6
8.00.0
11.1
5.22.00.04.0
958115
31,352
1,022 1,854 36 1 0 37 12776 11 0 0 29 4
25 0 0 0 0 01 0 0 0 0 0
220 15 1 0 17 0
129 1,556 1,160 1,003 173 1 396 1,813 1,069 1,425 222 4 2 32
8 25 27 134 13 1 0 00 0 1 0 0 0 0 0
115 652 300 1,273 253 2 9 63
0 16 35 42 6 0 2 0
21202171
690
1532
2460139
11072
1905 47 20 12 0 259 202 223 7832
00
63
2210
10
1800
15
0000
27970
195
25450
93
20330
93
10420
36
Terminalgrade Passed
VII boysV girlsV boys
VII girls
47 with >60%
61.841044703
2091
2692
68.422.9
0.013.9
57.556.6
7.20.0
13.2
100253Marathi English Urdu Hindi Manipuri
1191373366
3779182
544511235
44130
8559
51837280
00
4319
1000317
00
149
0000
501
% Schools recvd.
94.990.212.0
100.060.1
94.291.1
4.0100.0
60.5
577342420
1052482
459741899
1621991
82694217188992189
53921125811961412
2.15.78.41.0
10.6
22.813.011.1
7.9
9.45.5
11.713.7
2005-062004-052003-04
MAHARASHTRA
66.5
Upper PrimaryPrimary
Sex ratio Sex ratio 0-6
15 235
VIII8.0
Enrolment of children
VIIITotal Pr.
1 092 2,60023 455
40 169
%Teachers recvd.in-service training
Total schools* Rural schools* Total enrolment* Rural enrolment* Teachers*
3.2 31.3
82.7
62.9
77.1 73.3
37.7 36.6% SC enrolment% SC girls to SC enrolment% ST enrolment
48.5 47.917.947.8 44.5
58.0
49.0
45.2
49.8
Position of teachers by educational qualification (other than para teacher)
(Previous academic year)Incentives : Number of beneficiaries
% ST girls to ST enrolment
% Girls
Number of villages
% 0 - 6 population
% SC population % ST population
% Urban population
% Schools with blackboard
% Enrolment in single-teacher schools
% Enrolment in schools without building
Primary Upperprimary
OBC EnrolmentPrimary U. Primary
% OBCEnrolment% OBC girls toOBC Enrolment
Pupil-teacher ratio (PTR)Student-classroom ratio (SCR)% Schools with <= 50 students% Schools with PTR > 100% Female teachers
% Schools established since 1995
Regular teachers Para-teachers
% minorrepairs
% majorrepairs
# = not applicable na = not available * Some totals may not match due to no response in classificatory data items
0.1 92.03937
48.82728
69.70.3
46.711.9
48.83032
9.90.4
52.75.4
40.53719
100.00.0
100.00.0
47.63431
0.43.2
40.46.7
20.9 2.4 12.2 77.0 67.8
93997624.214.3
Category
PrivateGovt.PrivateGovtPrivateGovt.PrivateGovt.PrivateGovt.
Total population (in 000's)
Number of blocks/taluks
District
Decadal growth rate
Primary onlyPrimary with upper primaryPrimary with upper primary & sec/higher sec.Upper primary onlyUpper primary with sec./higher secondary
% Single classroom schools% Single teacher schools
P + UP P+sec/hs U.P. only UP+secP. only
No response in school category
Primary with upper primaryPrimary with U.P. & sec/higherUpper primary onlyUpper primary with sec./higher sec
Primary only
Primary onlyPrimary with upper primaryPrimary with Upper primary & sec/higherUpper primary only
Para-teachers
School category
Upper primary with sec./higher secondary
Primary onlyPrimary with upper prim.
P. onlyP + UPP+sec/hsU.P. onlyUP+sec
NER(U.Prim)GER(U.Prim)NER (Primary)GER (Primary)
Transition ratePrim. to U. Prim
6.1
Performance indicators
SC/ST Enrolment
Indicators
Classrooms/Other rooms
Prim.with U.P.&Sec/H.SUpper Primary onlyU. Primary with Sec./H.S.
Basic Data, 2001
Data reported from
110,351 124,409 125,555 129,952
28,832
0 014,965
92.0
86.0
0.94
# ## #
# 158,684 3,634 2,603Total
1 - 4 5 - 7
174,217 201,826 193,603 199,460
93.5 52.493.9 54.186.7 29.388.4 33.6
Elementary Education in India - Where do we stand ?
Mah
aras
htr
a

341
10.3 8.2
Key data: Elementary Education
1697
RATNAGIRI
(Previous academic year)
(Previous year)
Gender and caste distribution of teachers*
No. of schools by type of building*
BoysWith disability
Flow rates
Primary Level
Enrolment*
Number of schools
Grade
GER / NER
School category
Primary Upper primaryBoys Boys GirlsGirls
IncentiveType
School categoryMultiple
TypeKuccha
PartiallyPucca
PuccaTotal % good condition
Otherrooms
TentNo
Building
Classrooms
Belowsecondary
Highersecondary
Postgraduate
M. Phil.GraduateSecondarySchool category OthersNo
response
ST teachers
Total Male Female No res Male Female No res Male Female Male FemaleSC teachers
Text booksUniformAttendanceStationery
% Passed
Avg. No. of Tchs.
%
Female literacyOverall literacy
dev. grant grantSchool T L M
Male Female
IVV
IIIIII
Grade R.R. D.O.R. P.R.
VIIVI
I - V
Enrolment by medium of instructions
Examination results
Retention rate
GPI
Primary cycle U. primary cycleState
DISTRICT ELEMENTARY EDUCATION REPORT CARD : 2005-06
GirlsGrade
IIIIIIIVVVI
VIII
AllGirls
Total
VII
% TotalGrossness
School category
1,108002
23 1,0620 00
19602
4 166 4
1,592 4014 134,669
0 00 0
170 477154 252
1,564 22 56,405 2,4707,349 125,802 2,711
0 0 00 0 0
11,538 252 10,96858,655 477 45,733
58,095 8,310 3,0435,838
188221
P + UP P+sec/hs U.P. only UP+sec
School categoryP. only
27.2 1.9 0.0 0.0 1.019.2
Number of Clusters 31311460
% Schools with SCR > 600.6 0.0 0.0 0.0
0.7 2.3 0.0 0.0 2.0% Schools with pre-primary sections 51.3 37.5 0.0 0.0 5.1% Schools with common toilets 71.8 80.6 0.0 0.0 80.8
% Schools with girls toilets 24.7 50.3 0.0 0.0 92.9% Schools with drinking water facility 80.9 88.1 0.0 0.0 98.0
% Enrolment in Govt. schools 87.5 94.8 0.0 0.0 0.8100.0 100.0 0.0 0.0 100.0
% No female teacher schools (tch>=2) 31.1 19.4 0.0 0.0 20.76.7 0.1 0.0 0.0 0.0
0.7 0.0 0.0 0.0 0.0%Enrolment in schools without blackboard 0.0 0.0 0.0 0.0 0.0
2001-02 2002-03 2003-04 2004-05 2005-06IIIIIIIVV
VIVII
Total U.P
33,65433,75635,71239,95735,66033,916
32,420
33,59034,72136,84833,49135,321
34,38732,748
35,34136,89834,70033,49235,944
35,25833,105
37,49233,92533,95434,13632,094
30,91529,667
93.7
55.3
91.5
53.7
79.7
93.4
0.0
0.00.0
16,57116,40917,60121,59917,32516,54415,497
336215188172197124109
210167142124116
8879
3,258
classrooms
5,50600
2,145
76.175.6
0.00.0
82.6
13.813.6
10.2
0.00.0
11.4
10.70.00.06.0
66200
969
489 1,528 21 20 0 45 181,062 9 3 0 56 0
0 0 0 0 0 00 0 0 0 0 0
169 6 3 0 20 0
37 1,503 963 551 92 1 527 2,879 1,246 1,350 333 0 1 181
0 0 0 0 0 0 0 00 0 0 0 0 0 0 0
22 293 162 547 143 0 6 1,803
0 10 36 36 5 0 0 0
18183283
00
799
255300
374
1334 62 9 8 0 296 147 111 31181
00
1803
2500
12
1700
12
0000
50700
136
25400
39
15100
26
5800
14
Terminalgrade Passed
VII boysV girlsV boys
VII girls
62 with >60%
79.032316059
00
3000
77.30.00.0
28.2
74.075.0
0.00.0
27.7
57468Marathi Urdu English Others Assamese
12710700
52060
24939405
00
3570
25746274
00
2589
5618
00
151
2147
000
% Schools recvd.
97.498.1
0.00.0
82.3
97.498.0
0.00.0
84.8
525451229
612982
44934950107
1422
60923129725473012
521811018
1851292
2.05.40.00.0
15.2
6.25.66.64.8
8.64.7
10.06.7
2005-062004-052003-04
MAHARASHTRA
0.0
Upper PrimaryPrimary
Sex ratio Sex ratio 0-6
9 350
VIII0.0
Enrolment of children
VIIITotal Pr.
0 023 2,97717 856
0 0
%Teachers recvd.in-service training
Total schools* Rural schools* Total enrolment* Rural enrolment* Teachers*
27.6
84.4
67.7
81.0 79.3
46.8 57.6% SC enrolment% SC girls to SC enrolment% ST enrolment
48.8 47.82.2
47.6 45.4
79.6
50.8
62.3
44.2
Position of teachers by educational qualification (other than para teacher)
(Previous academic year)Incentives : Number of beneficiaries
% ST girls to ST enrolment
% Girls
Number of villages
% 0 - 6 population
% SC population % ST population
% Urban population
% Schools with blackboard
% Enrolment in single-teacher schools
% Enrolment in schools without building
Primary Upperprimary
OBC EnrolmentPrimary U. Primary
% OBCEnrolment% OBC girls toOBC Enrolment
Pupil-teacher ratio (PTR)Student-classroom ratio (SCR)% Schools with <= 50 students% Schools with PTR > 100% Female teachers
% Schools established since 1995
Regular teachers Para-teachers
% minorrepairs
% majorrepairs
# = not applicable na = not available * Some totals may not match due to no response in classificatory data items
2.4 87.7
1.6 89.8
00
52.22120
82.20.1
41.57.7
49.22326
13.50.0
42.41.8
0.000
0.00.00.00.0
45.42028
5.60.0
12.97.1
9.9 1.4 1.2 75.0 65.8
952113611.313.9
Category
PrivateGovt.PrivateGovtPrivateGovt.PrivateGovt.PrivateGovt.
Total population (in 000's)
Number of blocks/taluks
District
Decadal growth rate
Primary onlyPrimary with upper primaryPrimary with upper primary & sec/higher sec.Upper primary onlyUpper primary with sec./higher secondary
% Single classroom schools% Single teacher schools
P + UP P+sec/hs U.P. only UP+secP. only
No response in school category
Primary with upper primaryPrimary with U.P. & sec/higherUpper primary onlyUpper primary with sec./higher sec
Primary only
Primary onlyPrimary with upper primaryPrimary with Upper primary & sec/higherUpper primary only
Para-teachers
School category
Upper primary with sec./higher secondary
Primary onlyPrimary with upper prim.
P. onlyP + UPP+sec/hsU.P. onlyUP+sec
NER(U.Prim)GER(U.Prim)NER (Primary)GER (Primary)
Transition ratePrim. to U. Prim
1.1
Performance indicators
SC/ST Enrolment
Indicators
Classrooms/Other rooms
Prim.with U.P.&Sec/H.SUpper Primary onlyU. Primary with Sec./H.S.
Basic Data, 2001
Data reported from
92,676 104,307 102,456 101,996
28,572 34,270
51 3913,649
96.0
100.0
1.02
# ## #
# 121,546 1,341 926Total
1 - 4 5 - 7
139,507 140,431 138,650 143,079
95.5 58.395.9 58.490.2 23.891.6 25.4
Elementary Education: Report Card - RATNAGIRI
Mah
aras
htr
a

342
0.4340.649
16.8 9.4
Key data: Elementary Education
2584
SANGLI
(Previous academic year)
(Previous year)
Gender and caste distribution of teachers*
No. of schools by type of building*
BoysWith disability
Flow rates
Primary Level
Enrolment*
Number of schools
Grade
GER / NER
School category
Primary Upper primaryBoys Boys GirlsGirls
IncentiveType
School categoryMultiple
TypeKuccha
PartiallyPucca
PuccaTotal % good condition
Otherrooms
TentNo
Building
Classrooms
Belowsecondary
Highersecondary
Postgraduate
M. Phil.GraduateSecondarySchool category OthersNo
response
ST teachers
Total Male Female No res Male Female No res Male Female Male FemaleSC teachers
Text booksUniformAttendanceStationery
% Passed
Avg. No. of Tchs.
%
Female literacyOverall literacy
dev. grant grantSchool T L M
Male Female
IVV
IIIIII
Grade R.R. D.O.R. P.R.
VIIVI
I - V
Enrolment by medium of instructions
Examination results
Retention rate
GPI
Primary cycle U. primary cycleState
DISTRICT ELEMENTARY EDUCATION REPORT CARD : 2005-06
GirlsGrade
IIIIIIIVVVI
VIII
AllGirls
Total
VII
% TotalGrossness
School category
587218
85 49744 2
6459
17
1 55 1
1,056 11235 132,55937 705
4 305372 1,715
48 17
1,004 45 75,916 8,12831,561 110,122 11,325
8,161 705 6,7861,634 305 747
1,520 17 1,34396,197 715 67,697
81,243 27,913 3,0954,864
593733
P + UP P+sec/hs U.P. only UP+sec
School categoryP. only
14.6 3.1 2.2 14.3 8.80.6
Number of Clusters 2416763
% Schools with SCR > 600.0 2.2 0.0 0.4
5.7 12.5 2.2 14.3 10.1% Schools with pre-primary sections 11.0 13.1 6.5 42.9 1.7% Schools with common toilets 53.4 72.3 84.8 100.0 80.3
% Schools with girls toilets 31.7 54.6 87.0 100.0 88.2% Schools with drinking water facility 77.7 87.5 95.7 100.0 98.5
% Enrolment in Govt. schools 74.4 80.8 8.0 15.7 1.8100.0 100.0 100.0 100.0 100.0
% No female teacher schools (tch>=2) 45.0 9.8 13.0 14.3 19.50.3 0.0 0.3 0.0 0.2
0.1 0.0 0.0 0.0 0.0%Enrolment in schools without blackboard 0.0 0.0 0.0 0.0 0.0
2001-02 2002-03 2003-04 2004-05 2005-06IIIIIIIVV
VIVII
Total U.P
55,25851,20152,36651,58351,84551,226
49,841
56,82355,32455,97552,66449,147
49,17247,993
57,87755,22854,77051,53350,368
52,01551,100
38,60435,95336,38634,40535,205
37,19837,914
92.9
54.0
91.4
50.0
77.0
92.0
47.6
15.20.0
25,24923,54324,17224,05524,59424,38523,216
783586694613557544503
489445466401376342315
3,127
classrooms
4,527388
883,704
81.980.990.683.192.3
14.913.2
3.2
5.416.9
6.8
5.84.00.01.0
1,026207
551,762
912 1,034 32 9 2 58 33583 16 4 0 60 9
41 2 0 0 2 16 0 0 0 1 0
422 18 3 0 14 10
106 1,743 676 838 276 1 4167 2,404 858 1,605 485 1 7 0
19 91 21 152 58 0 2 00 27 2 26 5 0 0 0
64 725 280 1,689 486 3 13 0
5 91 23 116 38 0 1 0
21512898
23527
2276
2629108
33984
1493 0 34 10 0 338 184 101 270000
4516
088
2520
23
0000
38936
3348
29813
4152
7351
61
5050
36
Terminalgrade Passed
VII boysV girlsV boys
VII girls
0 with >60%
0.236885597
36160
3371
0.10.00.00.0
0.00.00.00.00.0
98437Marathi Kannada English Urdu Others
14489985141791
89212
39267884
00
2894
34433252
3290
1265
9435710
41119865
6281466
00
719
% Schools recvd.
82.182.687.0
100.065.3
82.484.482.671.459.5
592736868
17812126
613181219
691920
7594568143679
12534
67986835124
1668
3.28.37.88.67.2
2005-062004-052003-04
MAHARASHTRA
30.5
Upper PrimaryPrimary
Sex ratio Sex ratio 0-6
11 167
VIII10.9
Enrolment of children
VIIITotal Pr.
4 5668 3,303
4 240
21 340
%Teachers recvd.in-service training
Total schools* Rural schools* Total enrolment* Rural enrolment* Teachers*
37.0
78.4
58.0
76.5 76.2
43.0 53.0% SC enrolment% SC girls to SC enrolment% ST enrolment
47.6 46.9
44.5 43.0
38.6
46.6
22.2
46.1
Position of teachers by educational qualification (other than para teacher)
(Previous academic year)Incentives : Number of beneficiaries
% ST girls to ST enrolment
% Girls
Number of villages
% 0 - 6 population
% SC population % ST population
% Urban population
% Schools with blackboard
% Enrolment in single-teacher schools
% Enrolment in schools without building
Primary Upperprimary
OBC EnrolmentPrimary U. Primary
% OBCEnrolment% OBC girls toOBC Enrolment
Pupil-teacher ratio (PTR)Student-classroom ratio (SCR)% Schools with <= 50 students% Schools with PTR > 100% Female teachers
% Schools established since 1995
Regular teachers Para-teachers
% minorrepairs
% majorrepairs
# = not applicable na = not available * Some totals may not match due to no response in classificatory data items
9.9 90.15.3 94.77.8 92.21.6 98.4
4.3 95.72325
47.53035
48.80.5
40.816.7
45.92936
1.80.3
47.47.3
32.23222
0.014.355.0
0.0
47.02926
11.32.1
29.919.7
16.9 12.1 0.7 76.6 66.7
85195724.513.2
Category
PrivateGovt.PrivateGovtPrivateGovt.PrivateGovt.PrivateGovt.
Total population (in 000's)
Number of blocks/taluks
District
Decadal growth rate
Primary onlyPrimary with upper primaryPrimary with upper primary & sec/higher sec.Upper primary onlyUpper primary with sec./higher secondary
% Single classroom schools% Single teacher schools
P + UP P+sec/hs U.P. only UP+secP. only
No response in school category
Primary with upper primaryPrimary with U.P. & sec/higherUpper primary onlyUpper primary with sec./higher sec
Primary only
Primary onlyPrimary with upper primaryPrimary with Upper primary & sec/higherUpper primary only
Para-teachers
School category
Upper primary with sec./higher secondary
Primary onlyPrimary with upper prim.
P. onlyP + UPP+sec/hsU.P. onlyUP+sec
NER(U.Prim)GER(U.Prim)NER (Primary)GER (Primary)
Transition ratePrim. to U. Prim
Performance indicators
SC/ST Enrolment
Indicators
Classrooms/Other rooms
Prim.with U.P.&Sec/H.SUpper Primary onlyU. Primary with Sec./H.S.
Basic Data, 2001
Data reported from
110,317 153,483 146,312 152,912
40,514 20,210
83 829,514
98.4
100.0
0.86
# ## #
# 169,214 4,280 2,834Total
1 - 4 5 - 7
145,348 219,408 220,786 210,408
93.3 50.993.5 52.887.8 27.389.5 32.2
Elementary Education in India - Where do we stand ?
Mah
aras
htr
a

343
16.2 12.5
Key data: Elementary Education
2809
SATARA
(Previous academic year)
(Previous year)
Gender and caste distribution of teachers*
No. of schools by type of building*
BoysWith disability
Flow rates
Primary Level
Enrolment*
Number of schools
Grade
GER / NER
School category
Primary Upper primaryBoys Boys GirlsGirls
IncentiveType
School categoryMultiple
TypeKuccha
PartiallyPucca
PuccaTotal % good condition
Otherrooms
TentNo
Building
Classrooms
Belowsecondary
Highersecondary
Postgraduate
M. Phil.GraduateSecondarySchool category OthersNo
response
ST teachers
Total Male Female No res Male Female No res Male Female Male FemaleSC teachers
Text booksUniformAttendanceStationery
% Passed
Avg. No. of Tchs.
%
Female literacyOverall literacy
dev. grant grantSchool T L M
Male Female
IVV
IIIIII
Grade R.R. D.O.R. P.R.
VIIVI
I - V
Enrolment by medium of instructions
Examination results
Retention rate
GPI
Primary cycle U. primary cycleState
DISTRICT ELEMENTARY EDUCATION REPORT CARD : 2005-06
GirlsGrade
IIIIIIIVVVI
VIII
AllGirls
Total
VII
% TotalGrossness
School category
87081
16
62 82573 7
1332
012
12 186 12
1,687 9436 146,19742 734
1 138283 5,190173 752
1,625 45 89,113 6,64815,490 136,919 7,08018,713 691 12,183
151 0 151
8,714 752 8,095117,673 4,197 87,366
97,237 21,590 4,1115,753
478488
P + UP P+sec/hs U.P. only UP+sec
School categoryP. only
13.0 2.0 2.5 0.0 0.017.8
Number of Clusters 33422050
% Schools with SCR > 600.4 0.0 0.0 0.3
1.6 2.6 3.7 0.0 1.4% Schools with pre-primary sections 33.2 21.1 24.7 50.0 3.4% Schools with common toilets 30.5 50.0 76.5 50.0 83.9
% Schools with girls toilets 22.9 51.1 85.2 100.0 93.1% Schools with drinking water facility 84.2 91.8 96.3 100.0 98.0
% Enrolment in Govt. schools 81.8 90.4 3.8 47.8 4.2100.0 100.0 100.0 100.0 100.0
% No female teacher schools (tch>=2) 29.4 21.6 14.8 0.0 10.95.0 0.1 0.0 0.0 0.1
0.6 0.1 0.0 0.0 0.1%Enrolment in schools without blackboard 0.0 0.0 0.0 0.0 0.0
2001-02 2002-03 2003-04 2004-05 2005-06IIIIIIIVV
VIVII
Total U.P
57,74954,18755,26953,51553,97053,409
52,131
55,97854,56853,44352,19851,506
51,73050,472
57,65053,87954,29852,69752,537
52,06151,467
56,45952,86753,97752,52150,141
53,87053,198
86.3
50.1
84.0
48.8
74.2
88.3
40.7
18.51.2
26,91625,21125,93724,89825,31424,92424,533
742580551522452425410
447386441365334317278
4,850
classrooms
5,855837
144,404
74.669.895.050.086.5
19.120.8
6.4
4.350.010.7
9.40.70.02.8
1,353443
81,898
1,594 1,564 83 3 0 97 34793 31 4 0 100 3
72 3 0 0 5 10 1 0 0 1 0
300 10 2 0 33 3
144 2,083 1,035 923 247 3 298 2,573 1,080 1,700 528 6 3 200
4 86 105 345 134 0 1 2490 3 0 7 2 0 0 6
74 753 301 1,699 496 4 12 1,637
4 14 71 71 17 0 0 0
23243363
3606
2295
2625321
61044
2115 119 15 16 0 350 277 226 79200243
61637
3190
39
2260
25
0000
41952
0351
31490
165
23012
073
10730
32
Terminalgrade Passed
VII boysV girlsV boys
VII girls
121 with >60%
81.845896241
93918
5040
82.232.816.739.7
79.079.317.150.041.3
113844Marathi English Assamese Urdu Others
15573310462
289120271
165429748728
0367
18591692
00
1160
654715257
0261
372000
53
% Schools recvd.
95.895.848.1
100.092.5
95.895.849.4
100.093.4
756902447
2543908
77124673
01132
92212264856964044
86323568325
1154
2.66.7
11.69.0
14.5
9.46.96.95.1
8.47.1
8.47.3
2005-062004-052003-04
MAHARASHTRA
34.8
Upper PrimaryPrimary
Sex ratio Sex ratio 0-6
11 246
VIII23.5
Enrolment of children
VIIITotal Pr.
5 13176 4,864
53 907
38 901
%Teachers recvd.in-service training
Total schools* Rural schools* Total enrolment* Rural enrolment* Teachers*
25.4
78.1
65.8
71.7 70.3
39.5 54.3% SC enrolment% SC girls to SC enrolment% ST enrolment
47.2 46.52.0
47.4 43.8
36.6
47.2
26.2
46.6
Position of teachers by educational qualification (other than para teacher)
(Previous academic year)Incentives : Number of beneficiaries
% ST girls to ST enrolment
% Girls
Number of villages
% 0 - 6 population
% SC population % ST population
% Urban population
% Schools with blackboard
% Enrolment in single-teacher schools
% Enrolment in schools without building
Primary Upperprimary
OBC EnrolmentPrimary U. Primary
% OBCEnrolment% OBC girls toOBC Enrolment
Pupil-teacher ratio (PTR)Student-classroom ratio (SCR)% Schools with <= 50 students% Schools with PTR > 100% Female teachers
% Schools established since 1995
Regular teachers Para-teachers
% minorrepairs
% majorrepairs
# = not applicable na = not available * Some totals may not match due to no response in classificatory data items
0.5 90.1
2321
46.82625
68.60.2
46.415.6
47.62628
8.00.1
42.44.1
42.61621
0.00.0
33.30.0
46.02428
1.11.1
21.27.5
14.1 8.8 0.8 78.2 68.4
87899514.213.1
Category
PrivateGovt.PrivateGovtPrivateGovt.PrivateGovt.PrivateGovt.
Total population (in 000's)
Number of blocks/taluks
District
Decadal growth rate
Primary onlyPrimary with upper primaryPrimary with upper primary & sec/higher sec.Upper primary onlyUpper primary with sec./higher secondary
% Single classroom schools% Single teacher schools
P + UP P+sec/hs U.P. only UP+secP. only
No response in school category
Primary with upper primaryPrimary with U.P. & sec/higherUpper primary onlyUpper primary with sec./higher sec
Primary only
Primary onlyPrimary with upper primaryPrimary with Upper primary & sec/higherUpper primary only
Para-teachers
School category
Upper primary with sec./higher secondary
Primary onlyPrimary with upper prim.
P. onlyP + UPP+sec/hsU.P. onlyUP+sec
NER(U.Prim)GER(U.Prim)NER (Primary)GER (Primary)
Transition ratePrim. to U. Prim
1.3
Performance indicators
SC/ST Enrolment
Indicators
Classrooms/Other rooms
Prim.with U.P.&Sec/H.SUpper Primary onlyU. Primary with Sec./H.S.
Basic Data, 2001
Data reported from
157,209 156,065 153,708 159,510
541 50,800 52,349
298 22723,849
95.1
90.1
0.87
# ## #
# 177,733 3,682 2,568Total
1 - 4 5 - 7
215,824 218,524 216,187 220,720
95.3 62.695.4 64.789.8 29.791.1 33.5
Elementary Education: Report Card - SATARA
Mah
aras
htr
a

344
0.3680.950
8.2 4.6
Key data: Elementary Education
869
SINDHUDURG
(Previous academic year)
(Previous year)
Gender and caste distribution of teachers*
No. of schools by type of building*
BoysWith disability
Flow rates
Primary Level
Enrolment*
Number of schools
Grade
GER / NER
School category
Primary Upper primaryBoys Boys GirlsGirls
IncentiveType
School categoryMultiple
TypeKuccha
PartiallyPucca
PuccaTotal % good condition
Otherrooms
TentNo
Building
Classrooms
Belowsecondary
Highersecondary
Postgraduate
M. Phil.GraduateSecondarySchool category OthersNo
response
ST teachers
Total Male Female No res Male Female No res Male Female Male FemaleSC teachers
Text booksUniformAttendanceStationery
% Passed
Avg. No. of Tchs.
%
Female literacyOverall literacy
dev. grant grantSchool T L M
Male Female
IVV
IIIIII
Grade R.R. D.O.R. P.R.
VIIVI
I - V
Enrolment by medium of instructions
Examination results
Retention rate
GPI
Primary cycle U. primary cycleState
DISTRICT ELEMENTARY EDUCATION REPORT CARD : 2005-06
GirlsGrade
IIIIIIIVVVI
VIII
AllGirls
Total
VII
% TotalGrossness
School category
513111
6 49826 1
0128
11
2 40 2
946 271 55,233
25 290 177
119 10539 73
934 19 30,290 909583 52,725 53
4,871 29 4,7760 177 0
2,007 73 1,99220,884 105 18,907
30,890 2,330 1,8552,798
8639
P + UP P+sec/hs U.P. only UP+sec
School categoryP. only
28.5 4.8 22.2 0.0 16.322.8
Number of Clusters 1691685
% Schools with SCR > 600.4 0.0 0.0 0.0
1.4 3.7 25.9 0.0 10.9% Schools with pre-primary sections 38.5 34.3 25.9 0.0 2.3% Schools with common toilets 51.2 69.0 66.7 100.0 73.6
% Schools with girls toilets 29.2 52.4 85.2 100.0 94.6% Schools with drinking water facility 68.4 81.3 96.3 0.0 97.7
% Enrolment in Govt. schools 93.0 99.0 0.6 100.0 0.5100.0 100.0 100.0 100.0 100.0
% No female teacher schools (tch>=2) 19.9 15.4 22.2 0.0 14.78.3 0.1 0.0 0.0 0.0
0.5 0.1 0.0 0.0 0.0%Enrolment in schools without blackboard 0.0 0.0 0.0 0.0 0.0
2001-02 2002-03 2003-04 2004-05 2005-06IIIIIIIVV
VIVII
Total U.P
15,82815,77616,60317,38915,38014,801
14,706
14,80014,83016,11214,53215,638
15,36915,069
15,39316,06115,08115,07416,013
15,49214,709
17,17115,27016,06315,63314,396
13,54013,122
81.6
48.3
79.5
48.5
71.3
80.3
44.6
11.10.0
7,6157,4738,0418,3817,4357,1607,282
308242232205181154149
234168197149125107101
1,927
classrooms
2,548209
7965
77.678.992.442.983.6
13.110.3
9.4
3.50.0
12.7
10.84.1
57.13.7
47775
1467
428 837 36 32 0 47 20419 12 5 0 79 4
25 1 0 0 1 00 0 0 0 1 0
113 3 1 0 10 1
50 872 420 381 68 1 131 1,232 414 694 216 0 3 246
3 31 39 78 13 0 0 610 5 0 2 0 0 0 0
13 237 82 426 91 1 4 710
0 1 0 0 0 0 0 0
8431284
932
589
130671
5265
950 148 0 0 0 140 89 64 15246
610
710
0000
1000
0000
17080
105
11581
47
9920
20
14008
Terminalgrade Passed
VII boysV girlsV boys
VII girls
148 with >60%
0.619412837
2257
1564
0.30.00.00.2
0.60.80.00.00.0
31913Marathi English Urdu Others Assamese
540752823
17721162
131283
184300
714638164
00
276624
00
310
100157
000
% Schools recvd.
93.794.651.9
100.072.1
92.894.848.1
100.072.1
231001296
302283
17891157
0297
26507132516572217
20101213
21314
2.05.58.37.0
12.1
0.50.40.40.4
0.20.2
0.20.4
2005-062004-052003-04
MAHARASHTRA
31.6
Upper PrimaryPrimary
Sex ratio Sex ratio 0-6
8 150
VIII22.2
Enrolment of children
VIIITotal Pr.
7 04 1,5607 200
2 223
%Teachers recvd.in-service training
Total schools* Rural schools* Total enrolment* Rural enrolment* Teachers*
35.2
75.2
52.0
74.0 69.7
41.8 53.1% SC enrolment% SC girls to SC enrolment% ST enrolment
48.9 47.7
46.4 55.2
40.2
48.0
23.4
49.7
Position of teachers by educational qualification (other than para teacher)
(Previous academic year)Incentives : Number of beneficiaries
% ST girls to ST enrolment
% Girls
Number of villages
% 0 - 6 population
% SC population % ST population
% Urban population
% Schools with blackboard
% Enrolment in single-teacher schools
% Enrolment in schools without building
Primary Upperprimary
OBC EnrolmentPrimary U. Primary
% OBCEnrolment% OBC girls toOBC Enrolment
Pupil-teacher ratio (PTR)Student-classroom ratio (SCR)% Schools with <= 50 students% Schools with PTR > 100% Female teachers
% Schools established since 1995
Regular teachers Para-teachers
% minorrepairs
% majorrepairs
# = not applicable na = not available * Some totals may not match due to no response in classificatory data items
5.4 94.4
4.2 95.5
2322
47.81717
84.30.4
48.92.9
49.62022
14.10.0
46.10.6
50.32525
0.00.0
71.40.0
46.21322
6.20.0
16.92.3
3.5 4.4 0.6 80.3 71.2
94410799.512.1
Category
PrivateGovt.PrivateGovtPrivateGovt.PrivateGovt.PrivateGovt.
Total population (in 000's)
Number of blocks/taluks
District
Decadal growth rate
Primary onlyPrimary with upper primaryPrimary with upper primary & sec/higher sec.Upper primary onlyUpper primary with sec./higher secondary
% Single classroom schools% Single teacher schools
P + UP P+sec/hs U.P. only UP+secP. only
No response in school category
Primary with upper primaryPrimary with U.P. & sec/higherUpper primary onlyUpper primary with sec./higher sec
Primary only
Primary onlyPrimary with upper primaryPrimary with Upper primary & sec/higherUpper primary only
Para-teachers
School category
Upper primary with sec./higher secondary
Primary onlyPrimary with upper prim.
P. onlyP + UPP+sec/hsU.P. onlyUP+sec
NER(U.Prim)GER(U.Prim)NER (Primary)GER (Primary)
Transition ratePrim. to U. Prim
Performance indicators
SC/ST Enrolment
Indicators
Classrooms/Other rooms
Prim.with U.P.&Sec/H.SUpper Primary onlyU. Primary with Sec./H.S.
Basic Data, 2001
Data reported from
41,058 46,214 46,076 44,887
13,682 6,699
53 323,122
100.0
100.0
0.92
# ## #
# 53,387 1,471 1,081Total
1 - 4 5 - 7
64,137 61,609 60,274 65,596
96.3 53.996.7 54.893.3 42.495.8 33.1
Elementary Education in India - Where do we stand ?
Mah
aras
htr
a
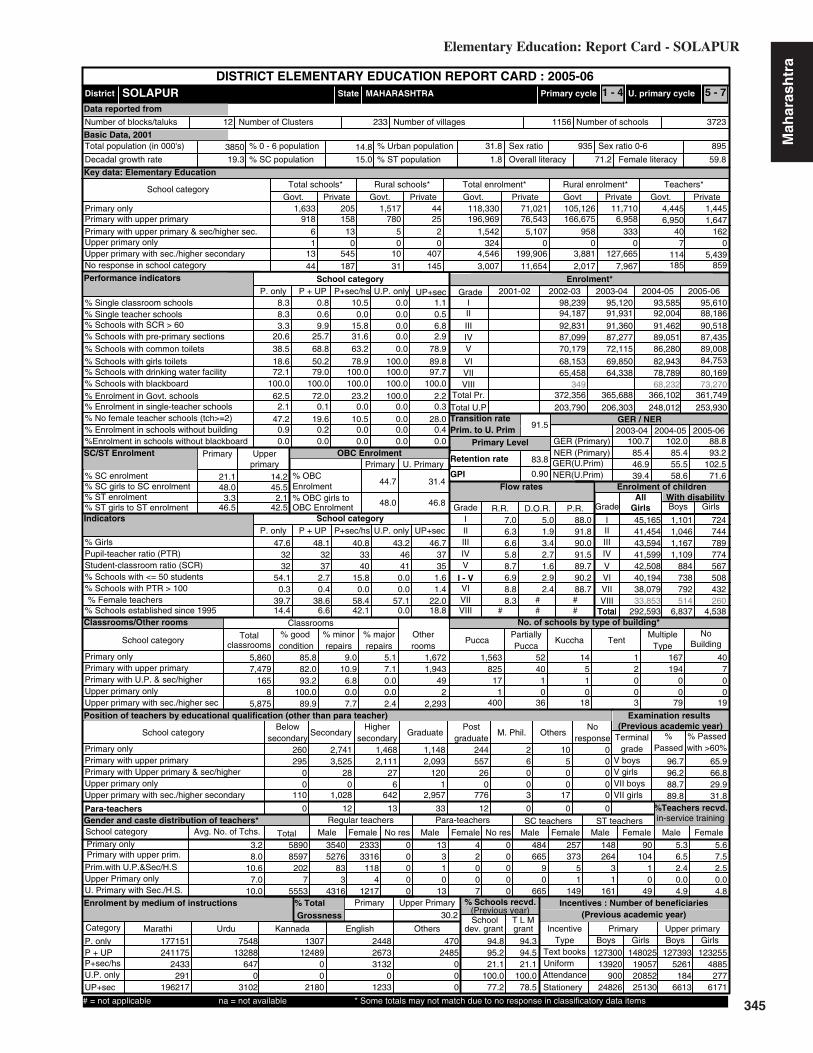
345
21.1 14.2
Key data: Elementary Education
3850
SOLAPUR
(Previous academic year)
(Previous year)
Gender and caste distribution of teachers*
No. of schools by type of building*
BoysWith disability
Flow rates
Primary Level
Enrolment*
Number of schools
Grade
GER / NER
School category
Primary Upper primaryBoys Boys GirlsGirls
IncentiveType
School categoryMultiple
TypeKuccha
PartiallyPucca
PuccaTotal % good condition
Otherrooms
TentNo
Building
Classrooms
Belowsecondary
Highersecondary
Postgraduate
M. Phil.GraduateSecondarySchool category OthersNo
response
ST teachers
Total Male Female No res Male Female No res Male Female Male FemaleSC teachers
Text booksUniformAttendanceStationery
% Passed
Avg. No. of Tchs.
%
Female literacyOverall literacy
dev. grant grantSchool T L M
Male Female
IVV
IIIIII
Grade R.R. D.O.R. P.R.
VIIVI
I - V
Enrolment by medium of instructions
Examination results
Retention rate
GPI
Primary cycle U. primary cycleState
DISTRICT ELEMENTARY EDUCATION REPORT CARD : 2005-06
GirlsGrade
IIIIIIIVVVI
VIII
AllGirls
Total
VII
% TotalGrossness
School category
91861
13
158 78013 5
0545
010
44 187 31
1,633 20525 196,969
2 1,5420 324
407 4,546145 3,007
1,517 44 105,126 11,71076,543 166,675 6,958
5,107 958 3330 0 0
11,654 2,017 7,967199,906 3,881 127,665
118,330 71,021 4,4456,950
1,4451,647
P + UP P+sec/hs U.P. only UP+sec
School categoryP. only
8.3 0.8 10.5 0.0 1.18.3
Number of Clusters 37231156
% Schools with SCR > 600.6 0.0 0.0 0.5
3.3 9.9 15.8 0.0 6.8% Schools with pre-primary sections 20.6 25.7 31.6 0.0 2.9% Schools with common toilets 38.5 68.8 63.2 0.0 78.9
% Schools with girls toilets 18.6 50.2 78.9 100.0 89.8% Schools with drinking water facility 72.1 79.0 100.0 100.0 97.7
% Enrolment in Govt. schools 62.5 72.0 23.2 100.0 2.2100.0 100.0 100.0 100.0 100.0
% No female teacher schools (tch>=2) 47.2 19.6 10.5 0.0 28.02.1 0.1 0.0 0.0 0.3
0.9 0.2 0.0 0.0 0.4%Enrolment in schools without blackboard 0.0 0.0 0.0 0.0 0.0
2001-02 2002-03 2003-04 2004-05 2005-06IIIIIIIVV
VIVII
Total U.P
95,61088,18690,51887,43589,00884,753
80,169
93,58592,00491,46289,05186,280
82,94378,789
95,12091,93191,36087,27772,115
69,85064,338
98,23994,18792,83187,09970,179
68,15365,458
100.7
46.9
102.0
55.5
88.8
102.5
40.8
15.80.0
45,16541,45443,59441,59942,50840,19438,079
1,1011,0461,1671,109
884738792
724744789774567508432
5,860
classrooms
7,479165
85,875
85.882.093.2
100.089.9
9.010.9
5.1
6.80.07.7
7.10.00.02.4
1,94349
22,293
1,672 1,563 52 14 1 167 40825 40 5 2 194 7
17 1 1 0 0 01 0 0 0 0 0
400 36 18 3 79 19
260 2,741 1,468 1,148 244 2 10295 3,525 2,111 2,093 557 6 5 0
0 28 27 120 26 0 0 00 0 6 1 0 0 0 0
110 1,028 642 2,957 776 3 17 0
0 12 13 33 12 0 0 0
35405276
833
4316
3316118
41217
2333 0 13 4 0 484 257 148 900000
310
13
2007
0000
66590
665
37351
149
26431
161
10410
49
Terminalgrade Passed
VII boysV girlsV boys
VII girls
0 with >60%
5.358908597
2027
5553
6.52.40.04.9
5.67.52.50.04.8
177151Marathi Urdu Kannada English Others
2411752433
291196217
754813288
6470
3102
130712489
00
2180
244826733132
01233
4702485
000
% Schools recvd.
94.895.221.1
100.077.2
94.394.521.1
100.078.5
12730013920
90024826
1273935261
1846613
148025190572085225130
1232554885
2776171
3.28.0
10.67.0
10.0
7.06.36.65.8
8.88.3
8.76.9
2005-062004-052003-04
MAHARASHTRA
58.4
Upper PrimaryPrimary
Sex ratio Sex ratio 0-6
12 233
VIII42.1
Enrolment of children
VIIITotal Pr.
7 0114 5,439185 859
40 162
%Teachers recvd.in-service training
Total schools* Rural schools* Total enrolment* Rural enrolment* Teachers*
30.2
93.2
71.6
85.4 85.4
39.4 58.6% SC enrolment% SC girls to SC enrolment% ST enrolment
48.0 45.53.3
46.5 42.5
44.7
48.0
31.4
46.8
Position of teachers by educational qualification (other than para teacher)
(Previous academic year)Incentives : Number of beneficiaries
% ST girls to ST enrolment
% Girls
Number of villages
% 0 - 6 population
% SC population % ST population
% Urban population
% Schools with blackboard
% Enrolment in single-teacher schools
% Enrolment in schools without building
Primary Upperprimary
OBC EnrolmentPrimary U. Primary
% OBCEnrolment% OBC girls toOBC Enrolment
Pupil-teacher ratio (PTR)Student-classroom ratio (SCR)% Schools with <= 50 students% Schools with PTR > 100% Female teachers
% Schools established since 1995
Regular teachers Para-teachers
% minorrepairs
% majorrepairs
# = not applicable na = not available * Some totals may not match due to no response in classificatory data items
5.0 88.01.9 91.83.4 90.02.7 91.51.6 89.72.9 90.22.4 88.7
4033
47.63232
54.10.3
39.714.4
48.13237
2.70.4
38.66.6
43.24641
0.00.0
57.10.0
46.73735
1.61.4
22.018.8
19.3 15.0 1.8 71.2 59.8
89593531.814.8
Category
PrivateGovt.PrivateGovtPrivateGovt.PrivateGovt.PrivateGovt.
Total population (in 000's)
Number of blocks/taluks
District
Decadal growth rate
Primary onlyPrimary with upper primaryPrimary with upper primary & sec/higher sec.Upper primary onlyUpper primary with sec./higher secondary
% Single classroom schools% Single teacher schools
P + UP P+sec/hs U.P. only UP+secP. only
No response in school category
Primary with upper primaryPrimary with U.P. & sec/higherUpper primary onlyUpper primary with sec./higher sec
Primary only
Primary onlyPrimary with upper primaryPrimary with Upper primary & sec/higherUpper primary only
Para-teachers
School category
Upper primary with sec./higher secondary
Primary onlyPrimary with upper prim.
P. onlyP + UPP+sec/hsU.P. onlyUP+sec
NER(U.Prim)GER(U.Prim)NER (Primary)GER (Primary)
Transition ratePrim. to U. Prim
2.1
Performance indicators
SC/ST Enrolment
Indicators
Classrooms/Other rooms
Prim.with U.P.&Sec/H.SUpper Primary onlyU. Primary with Sec./H.S.
Basic Data, 2001
Data reported from
203,790 206,303 248,012 253,930
349 68,232 73,270
514 26033,853
91.5
83.8
0.90
# ## #
# 292,593 6,837 4,538Total
1 - 4 5 - 7
372,356 365,688 366,102 361,749
96.7 65.996.2 66.888.7 29.989.8 31.8
Elementary Education: Report Card - SOLAPUR
Mah
aras
htr
a
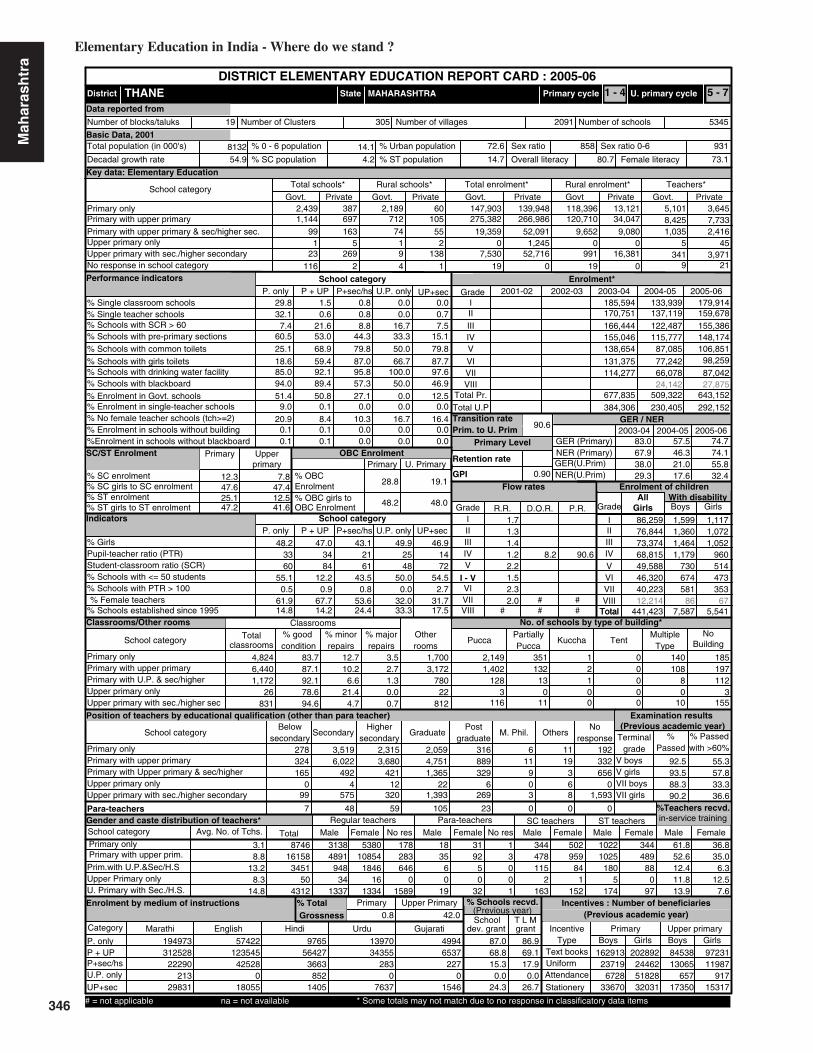
346
12.3 7.8
Key data: Elementary Education
8132
THANE
(Previous academic year)
(Previous year)
Gender and caste distribution of teachers*
No. of schools by type of building*
BoysWith disability
Flow rates
Primary Level
Enrolment*
Number of schools
Grade
GER / NER
School category
Primary Upper primaryBoys Boys GirlsGirls
IncentiveType
School categoryMultiple
TypeKuccha
PartiallyPucca
PuccaTotal % good condition
Otherrooms
TentNo
Building
Classrooms
Belowsecondary
Highersecondary
Postgraduate
M. Phil.GraduateSecondarySchool category OthersNo
response
ST teachers
Total Male Female No res Male Female No res Male Female Male FemaleSC teachers
Text booksUniformAttendanceStationery
% Passed
Avg. No. of Tchs.
%
Female literacyOverall literacy
dev. grant grantSchool T L M
Male Female
IVV
IIIIII
Grade R.R. D.O.R. P.R.
VIIVI
I - V
Enrolment by medium of instructions
Examination results
Retention rate
GPI
Primary cycle U. primary cycleState
DISTRICT ELEMENTARY EDUCATION REPORT CARD : 2005-06
GirlsGrade
IIIIIIIVVVI
VIII
AllGirls
Total
VII
% TotalGrossness
School category
1,14499
123
697 712163 74
5269
19
116 2 4
2,439 387105 275,382
55 19,3592 0
138 7,5301 19
2,189 60 118,396 13,121266,986 120,710 34,047
52,091 9,652 9,0801,245 0 0
0 19 052,716 991 16,381
147,903 139,948 5,1018,425
3,6457,733
P + UP P+sec/hs U.P. only UP+sec
School categoryP. only
29.8 1.5 0.8 0.0 0.032.1
Number of Clusters 53452091
% Schools with SCR > 600.6 0.8 0.0 0.7
7.4 21.6 8.8 16.7 7.5% Schools with pre-primary sections 60.5 53.0 44.3 33.3 15.1% Schools with common toilets 25.1 68.9 79.8 50.0 79.8
% Schools with girls toilets 18.6 59.4 87.0 66.7 87.7% Schools with drinking water facility 85.0 92.1 95.8 100.0 97.6
% Enrolment in Govt. schools 51.4 50.8 27.1 0.0 12.594.0 89.4 57.3 50.0 46.9
% No female teacher schools (tch>=2) 20.9 8.4 10.3 16.7 16.49.0 0.1 0.0 0.0 0.0
0.1 0.1 0.0 0.0 0.0%Enrolment in schools without blackboard 0.1 0.1 0.0 0.0 0.0
2001-02 2002-03 2003-04 2004-05 2005-06IIIIIIIVV
VIVII
Total U.P
179,914159,678155,386148,174106,851
98,259
87,042
133,939137,119122,487115,777
87,085
77,24266,078
185,594170,751166,444155,046138,654
131,375114,277
83.0
38.0
57.5
21.0
74.7
55.8
43.1
43.50.8
86,25976,84473,37468,81549,58846,32040,223
1,5991,3601,4641,179
730674581
1,1171,0721,052
960514473353
4,824
classrooms
6,4401,172
26831
83.787.192.178.694.6
12.710.2
3.5
6.621.4
4.7
2.71.30.00.7
3,172780
22812
1,700 2,149 351 1 0 140 1851,402 132 2 0 108 197
128 13 1 0 8 1123 0 0 0 0 3
116 11 0 0 10 155
278 3,519 2,315 2,059 316 6 11324 6,022 3,680 4,751 889 11 19 332165 492 421 1,365 329 9 3 656
0 4 12 22 6 0 6 099 575 320 1,393 269 3 8 1,593
7 48 59 105 23 0 0 0
31384891
94834
1337
108541846
161334
5380 178 18 31 1 344 502 1022 344283646
01589
3560
19
9250
32
3001
478115
2163
95984
1152
1025180
5174
48988
097
Terminalgrade Passed
VII boysV girlsV boys
VII girls
192 with >60%
61.8874616158
345150
4312
52.612.411.813.9
36.835.0
6.312.5
7.6
194973Marathi English Hindi Urdu Gujarati
31252822290
21329831
57422123545
425280
18055
976556427
3663852
1405
1397034355
2830
7637
49946537
2270
1546
% Schools recvd.
87.068.815.3
0.024.3
86.969.117.9
0.026.7
16291323719
672833670
8453813065
65717350
202892244625182832031
9723111987
91715317
3.18.8
13.28.3
14.8
1.71.31.41.2
2.32.0
2.21.5
2005-062004-052003-04
MAHARASHTRA
53.6
Upper PrimaryPrimary
Sex ratio Sex ratio 0-6
19 305
VIII24.4
Enrolment of children
VIIITotal Pr.
5 45341 3,971
9 21
1,035 2,416
%Teachers recvd.in-service training
Total schools* Rural schools* Total enrolment* Rural enrolment* Teachers*
0.8 42.0
74.1
32.4
67.9 46.3
29.3 17.6% SC enrolment% SC girls to SC enrolment% ST enrolment
47.6 47.425.147.2 41.6
28.8
48.2
19.1
48.0
Position of teachers by educational qualification (other than para teacher)
(Previous academic year)Incentives : Number of beneficiaries
% ST girls to ST enrolment
% Girls
Number of villages
% 0 - 6 population
% SC population % ST population
% Urban population
% Schools with blackboard
% Enrolment in single-teacher schools
% Enrolment in schools without building
Primary Upperprimary
OBC EnrolmentPrimary U. Primary
% OBCEnrolment% OBC girls toOBC Enrolment
Pupil-teacher ratio (PTR)Student-classroom ratio (SCR)% Schools with <= 50 students% Schools with PTR > 100% Female teachers
% Schools established since 1995
Regular teachers Para-teachers
% minorrepairs
% majorrepairs
# = not applicable na = not available * Some totals may not match due to no response in classificatory data items
8.2 90.66121
48.23360
55.10.5
61.914.8
47.03484
12.20.9
67.714.2
49.92548
50.00.0
32.033.3
46.91472
54.52.7
31.717.5
54.9 4.2 14.7 80.7 73.1
93185872.614.1
Category
PrivateGovt.PrivateGovtPrivateGovt.PrivateGovt.PrivateGovt.
Total population (in 000's)
Number of blocks/taluks
District
Decadal growth rate
Primary onlyPrimary with upper primaryPrimary with upper primary & sec/higher sec.Upper primary onlyUpper primary with sec./higher secondary
% Single classroom schools% Single teacher schools
P + UP P+sec/hs U.P. only UP+secP. only
No response in school category
Primary with upper primaryPrimary with U.P. & sec/higherUpper primary onlyUpper primary with sec./higher sec
Primary only
Primary onlyPrimary with upper primaryPrimary with Upper primary & sec/higherUpper primary only
Para-teachers
School category
Upper primary with sec./higher secondary
Primary onlyPrimary with upper prim.
P. onlyP + UPP+sec/hsU.P. onlyUP+sec
NER(U.Prim)GER(U.Prim)NER (Primary)GER (Primary)
Transition ratePrim. to U. Prim
12.5
Performance indicators
SC/ST Enrolment
Indicators
Classrooms/Other rooms
Prim.with U.P.&Sec/H.SUpper Primary onlyU. Primary with Sec./H.S.
Basic Data, 2001
Data reported from
384,306 230,405 292,152
24,142 27,875
86 6712,214
90.6
0.90
# ## #
# 441,423 7,587 5,541Total
1 - 4 5 - 7
677,835 509,322 643,152
92.5 55.393.5 57.888.3 33.390.2 36.6
Elementary Education in India - Where do we stand ?
Mah
aras
htr
a

347
20.8 17.6
Key data: Elementary Education
1237
WARDHA
(Previous academic year)
(Previous year)
Gender and caste distribution of teachers*
No. of schools by type of building*
BoysWith disability
Flow rates
Primary Level
Enrolment*
Number of schools
Grade
GER / NER
School category
Primary Upper primaryBoys Boys GirlsGirls
IncentiveType
School categoryMultiple
TypeKuccha
PartiallyPucca
PuccaTotal % good condition
Otherrooms
TentNo
Building
Classrooms
Belowsecondary
Highersecondary
Postgraduate
M. Phil.GraduateSecondarySchool category OthersNo
response
ST teachers
Total Male Female No res Male Female No res Male Female Male FemaleSC teachers
Text booksUniformAttendanceStationery
% Passed
Avg. No. of Tchs.
%
Female literacyOverall literacy
dev. grant grantSchool T L M
Male Female
IVV
IIIIII
Grade R.R. D.O.R. P.R.
VIIVI
I - V
Enrolment by medium of instructions
Examination results
Retention rate
GPI
Primary cycle U. primary cycleState
DISTRICT ELEMENTARY EDUCATION REPORT CARD : 2005-06
GirlsGrade
IIIIIIIVVVI
VIII
AllGirls
Total
VII
% TotalGrossness
School category
27710
115
40 27133 9
0155
14
1 36 0
691 6512 43,61022 4,409
0 31123 6,902
32 0
619 24 37,325 3,5909,016 42,203 1,850
11,448 3,290 6,3510 31 0
1,778 0 1,49953,106 1,109 36,066
45,377 11,842 1,8781,805
334346
P + UP P+sec/hs U.P. only UP+sec
School categoryP. only
25.8 4.4 2.3 0.0 1.812.8
Number of Clusters 1324853
% Schools with SCR > 600.0 0.0 0.0 0.0
7.1 9.8 4.7 0.0 12.9% Schools with pre-primary sections 52.1 43.2 25.6 100.0 1.8% Schools with common toilets 32.9 55.5 86.0 100.0 88.2
% Schools with girls toilets 21.2 39.4 95.3 0.0 93.5% Schools with drinking water facility 77.0 82.0 100.0 100.0 98.2
% Enrolment in Govt. schools 79.3 82.9 27.8 100.0 11.5100.0 100.0 100.0 100.0 100.0
% No female teacher schools (tch>=2) 34.4 18.0 14.0 0.0 9.42.6 0.0 0.0 0.0 0.0
0.4 0.0 0.0 0.0 0.0%Enrolment in schools without blackboard 0.0 0.0 0.0 0.0 0.0
2001-02 2002-03 2003-04 2004-05 2005-06IIIIIIIVV
VIVII
Total U.P
24,47923,02423,67922,78723,40823,005
23,322
22,90322,45722,44721,31219,386
19,85819,676
25,22424,11123,41622,28723,352
23,88124,061
25,99523,95523,78823,39221,784
22,20122,096
85.4
52.6
77.1
42.7
71.8
87.7
44.8
2.30.0
11,68610,89611,39610,94111,39311,11511,407
411298354331215167188
425264294225171135180
804
classrooms
706129
4668
79.680.091.175.084.7
13.813.5
6.6
7.125.012.9
6.51.70.02.3
538242
4820
745 612 44 2 0 95 3230 9 2 0 76 0
40 0 0 0 2 00 0 0 0 1 0
133 15 0 0 22 0
37 850 713 456 87 0 030 656 667 626 147 2 1 1611 84 58 217 74 1 2 81
0 1 3 4 0 0 0 054 478 355 834 160 1 0 756
0 5 13 12 8 0 0 0
11301241
2176
1223
888230
2659
1013 53 11 5 0 181 140 99 791681
0756
2304
4702
0000
18745
1182
12726
0102
8218
073
6718
055
Terminalgrade Passed
VII boysV girlsV boys
VII girls
53 with >60%
51.422122151
5388
2644
51.913.6
0.022.3
50.645.1
6.80.0
22.4
53633Marathi English Urdu Hindi Others
484087731
3154576
114724057305
01187
1578935
00
1102
1263504
00
1786
57116462
0808
% Schools recvd.
95.493.460.5
100.097.1
95.192.458.1
100.096.5
323464489
1466008
35059900104
1258
39505407781075882
39249700662
1103
2.96.8
12.58.0
15.6
5.93.52.91.8
3.23.1
3.93.6
2005-062004-052003-04
MAHARASHTRA
44.1
Upper PrimaryPrimary
Sex ratio Sex ratio 0-6
8 93
VIII23.3
Enrolment of children
VIIITotal Pr.
8 0288 2,356
0 226
125 413
%Teachers recvd.in-service training
Total schools* Rural schools* Total enrolment* Rural enrolment* Teachers*
26.3
75.2
64.6
71.2 64.2
42.8 42.8% SC enrolment% SC girls to SC enrolment% ST enrolment
48.2 48.919.348.5 49.9
73.4
48.1
57.9
49.2
Position of teachers by educational qualification (other than para teacher)
(Previous academic year)Incentives : Number of beneficiaries
% ST girls to ST enrolment
% Girls
Number of villages
% 0 - 6 population
% SC population % ST population
% Urban population
% Schools with blackboard
% Enrolment in single-teacher schools
% Enrolment in schools without building
Primary Upperprimary
OBC EnrolmentPrimary U. Primary
% OBCEnrolment% OBC girls toOBC Enrolment
Pupil-teacher ratio (PTR)Student-classroom ratio (SCR)% Schools with <= 50 students% Schools with PTR > 100% Female teachers
% Schools established since 1995
Regular teachers Para-teachers
% minorrepairs
% majorrepairs
# = not applicable na = not available * Some totals may not match due to no response in classificatory data items
12329
49.12671
57.10.1
46.05.2
47.32475
2.80.0
41.56.0
48.448
100.00.0
25.00.0
49.52390
2.40.0
25.01.2
15.3 12.8 12.5 80.1 72.4
92893526.312.6
Category
PrivateGovt.PrivateGovtPrivateGovt.PrivateGovt.PrivateGovt.
Total population (in 000's)
Number of blocks/taluks
District
Decadal growth rate
Primary onlyPrimary with upper primaryPrimary with upper primary & sec/higher sec.Upper primary onlyUpper primary with sec./higher secondary
% Single classroom schools% Single teacher schools
P + UP P+sec/hs U.P. only UP+secP. only
No response in school category
Primary with upper primaryPrimary with U.P. & sec/higherUpper primary onlyUpper primary with sec./higher sec
Primary only
Primary onlyPrimary with upper primaryPrimary with Upper primary & sec/higherUpper primary only
Para-teachers
School category
Upper primary with sec./higher secondary
Primary onlyPrimary with upper prim.
P. onlyP + UPP+sec/hsU.P. onlyUP+sec
NER(U.Prim)GER(U.Prim)NER (Primary)GER (Primary)
Transition ratePrim. to U. Prim
13.6
Performance indicators
SC/ST Enrolment
Indicators
Classrooms/Other rooms
Prim.with U.P.&Sec/H.SUpper Primary onlyU. Primary with Sec./H.S.
Basic Data, 2001
Data reported from
66,081 71,294 58,920 69,735
17,104 23,815
134 11011,800
100.0
86.1
0.92
# ## #
# 78,834 1,964 1,694Total
1 - 4 5 - 7
97,130 95,038 89,119 93,969
98.4 68.299.0 71.492.4 30.192.3 34.7
Elementary Education: Report Card - WARDHA
Mah
aras
htr
a

348
25.7 19.3
Key data: Elementary Education
1020
WASHIM
(Previous academic year)
(Previous year)
Gender and caste distribution of teachers*
No. of schools by type of building*
BoysWith disability
Flow rates
Primary Level
Enrolment*
Number of schools
Grade
GER / NER
School category
Primary Upper primaryBoys Boys GirlsGirls
IncentiveType
School categoryMultiple
TypeKuccha
PartiallyPucca
PuccaTotal % good condition
Otherrooms
TentNo
Building
Classrooms
Belowsecondary
Highersecondary
Postgraduate
M. Phil.GraduateSecondarySchool category OthersNo
response
ST teachers
Total Male Female No res Male Female No res Male Female Male FemaleSC teachers
Text booksUniformAttendanceStationery
% Passed
Avg. No. of Tchs.
%
Female literacyOverall literacy
dev. grant grantSchool T L M
Male Female
IVV
IIIIII
Grade R.R. D.O.R. P.R.
VIIVI
I - V
Enrolment by medium of instructions
Examination results
Retention rate
GPI
Primary cycle U. primary cycleState
DISTRICT ELEMENTARY EDUCATION REPORT CARD : 2005-06
GirlsGrade
IIIIIIIVVVI
VIII
AllGirls
Total
VII
% TotalGrossness
School category
29850
15
19 29213 5
2159
07
2 51 2
502 596 67,0959 1,3051 0
128 8,99149 83
469 26 39,301 3,0787,466 65,338 1,7433,591 1,305 2,743
371 0 196
2,352 83 2,27645,390 3,347 32,512
48,784 8,833 1,3111,836
250151
P + UP P+sec/hs U.P. only UP+sec
School categoryP. only
13.0 0.3 0.0 0.0 1.718.0
Number of Clusters 1125682
% Schools with SCR > 600.3 0.0 0.0 0.0
7.1 8.8 5.6 50.0 10.9% Schools with pre-primary sections 10.0 9.8 27.8 0.0 1.7% Schools with common toilets 23.0 45.4 72.2 100.0 78.2
% Schools with girls toilets 16.9 36.0 83.3 50.0 84.5% Schools with drinking water facility 58.3 69.4 94.4 100.0 97.1
% Enrolment in Govt. schools 84.7 90.0 26.7 0.0 16.5100.0 100.0 100.0 100.0 100.0
% No female teacher schools (tch>=2) 44.0 37.5 5.6 50.0 40.25.5 0.2 0.0 0.0 0.0
1.7 0.4 0.0 0.0 0.0%Enrolment in schools without blackboard 0.0 0.0 0.0 0.0 0.0
2001-02 2002-03 2003-04 2004-05 2005-06IIIIIIIVV
VIVII
Total U.P
31,40327,92026,15923,02922,75722,180
21,056
28,80425,97923,76521,01821,529
20,66620,054
30,04325,60423,96921,58919,862
19,43319,569
25,89622,59021,26518,96917,498
17,92816,668
105.2
51.6
103.4
52.9
100.5
100.6
42.5
5.60.0
14,90013,52712,66111,03510,64610,323
9,623
600588517485365342290
490519472453279230223
1,576
classrooms
1,773120
71,448
75.376.193.3
100.079.8
17.617.7
7.2
5.00.0
13.1
6.21.70.07.0
43244
5598
512 460 29 5 0 45 22261 10 0 1 42 3
14 0 0 0 1 32 0 0 0 0 0
134 15 5 0 18 2
40 634 556 276 48 0 026 720 657 464 92 2 2 010 32 16 60 14 0 0 0
0 2 1 12 0 0 0 042 321 240 803 126 0 4 0
2 11 25 16 2 0 0 0
10881488
9514
1254
47537
1282
466 0 4 3 0 127 64 88 450000
1610
18
8105
0000
19616
1219
7871
31
11181
80
3140
21
Terminalgrade Passed
VII boysV girlsV boys
VII girls
0 with >60%
15.115611987
13415
1559
17.02.10.06.7
11.712.8
0.00.03.1
48732Marathi Urdu English Hindi Nepali
676843919
19649085
60126484
00
4560
1572405626175
0
530000
733
1030000
% Schools recvd.
87.795.650.0
0.076.4
87.395.350.0
0.077.0
39290305534642211
30959317
0461
425063186
125502317
29127490
79598
2.86.37.47.59.0
0.10.10.10.1
0.10.1
0.10.1
2005-062004-052003-04
MAHARASHTRA
28.4
Upper PrimaryPrimary
Sex ratio Sex ratio 0-6
6 73
VIII22.2
Enrolment of children
VIIITotal Pr.
0 15216 1,343
10 204
35 99
%Teachers recvd.in-service training
Total schools* Rural schools* Total enrolment* Rural enrolment* Teachers*
1.0 33.2
99.5
67.2
86.5 83.3
41.2 47.9% SC enrolment% SC girls to SC enrolment% ST enrolment
48.3 46.410.648.6 42.6
64.9
47.7
50.6
45.8
Position of teachers by educational qualification (other than para teacher)
(Previous academic year)Incentives : Number of beneficiaries
% ST girls to ST enrolment
% Girls
Number of villages
% 0 - 6 population
% SC population % ST population
% Urban population
% Schools with blackboard
% Enrolment in single-teacher schools
% Enrolment in schools without building
Primary Upperprimary
OBC EnrolmentPrimary U. Primary
% OBCEnrolment% OBC girls toOBC Enrolment
Pupil-teacher ratio (PTR)Student-classroom ratio (SCR)% Schools with <= 50 students% Schools with PTR > 100% Female teachers
% Schools established since 1995
Regular teachers Para-teachers
% minorrepairs
% majorrepairs
# = not applicable na = not available * Some totals may not match due to no response in classificatory data items
3.1 96.8
3.1 96.8
4137
48.23737
36.20.4
30.013.7
48.23842
0.60.3
24.33.8
23.72553
0.00.06.7
50.0
45.13538
1.70.0
18.416.7
18.3 15.9 7.0 73.4 60.6
91893917.515.7
Category
PrivateGovt.PrivateGovtPrivateGovt.PrivateGovt.PrivateGovt.
Total population (in 000's)
Number of blocks/taluks
District
Decadal growth rate
Primary onlyPrimary with upper primaryPrimary with upper primary & sec/higher sec.Upper primary onlyUpper primary with sec./higher secondary
% Single classroom schools% Single teacher schools
P + UP P+sec/hs U.P. only UP+secP. only
No response in school category
Primary with upper primaryPrimary with U.P. & sec/higherUpper primary onlyUpper primary with sec./higher sec
Primary only
Primary onlyPrimary with upper primaryPrimary with Upper primary & sec/higherUpper primary only
Para-teachers
School category
Upper primary with sec./higher secondary
Primary onlyPrimary with upper prim.
P. onlyP + UPP+sec/hsU.P. onlyUP+sec
NER(U.Prim)GER(U.Prim)NER (Primary)GER (Primary)
Transition ratePrim. to U. Prim
6.9
Performance indicators
SC/ST Enrolment
Indicators
Classrooms/Other rooms
Prim.with U.P.&Sec/H.SUpper Primary onlyU. Primary with Sec./H.S.
Basic Data, 2001
Data reported from
52,094 58,864 62,249 65,993
19,092 19,757
245 1318,766
100.0
88.9
0.92
# ## #
# 82,715 3,187 2,666Total
1 - 4 5 - 7
88,720 101,205 99,566 108,511
96.1 60.197.0 57.794.3 32.895.7 36.4
Elementary Education in India - Where do we stand ?
Mah
aras
htr
a

349
15.4 12.9
Key data: Elementary Education
2458
YAVATMAL
(Previous academic year)
(Previous year)
Gender and caste distribution of teachers*
No. of schools by type of building*
BoysWith disability
Flow rates
Primary Level
Enrolment*
Number of schools
Grade
GER / NER
School category
Primary Upper primaryBoys Boys GirlsGirls
IncentiveType
School categoryMultiple
TypeKuccha
PartiallyPucca
PuccaTotal % good condition
Otherrooms
TentNo
Building
Classrooms
Belowsecondary
Highersecondary
Postgraduate
M. Phil.GraduateSecondarySchool category OthersNo
response
ST teachers
Total Male Female No res Male Female No res Male Female Male FemaleSC teachers
Text booksUniformAttendanceStationery
% Passed
Avg. No. of Tchs.
%
Female literacyOverall literacy
dev. grant grantSchool T L M
Male Female
IVV
IIIIII
Grade R.R. D.O.R. P.R.
VIIVI
I - V
Enrolment by medium of instructions
Examination results
Retention rate
GPI
Primary cycle U. primary cycleState
DISTRICT ELEMENTARY EDUCATION REPORT CARD : 2005-06
GirlsGrade
IIIIIIIVVVI
VIII
AllGirls
Total
VII
% TotalGrossness
School category
77633
259
70 71915 33
1375
241
0 0 0
1,226 8149 179,13011 8,882
1 101308 12,878
0 0
1,156 36 85,427 5,30124,287 160,335 14,641
5,328 8,882 3,55862 101 62
0 0 081,024 7,497 50,050
99,221 17,292 3,0245,365
395603
P + UP P+sec/hs U.P. only UP+sec
School categoryP. only
14.8 0.8 0.0 33.3 1.412.6
Number of Clusters 26381731
% Schools with SCR > 600.0 0.0 0.0 0.2
7.2 10.6 4.2 33.3 7.8% Schools with pre-primary sections 17.9 11.0 39.6 0.0 2.3% Schools with common toilets 39.4 68.7 81.3 66.7 86.4
% Schools with girls toilets 23.0 44.3 89.6 66.7 92.4% Schools with drinking water facility 63.5 81.1 95.8 66.7 99.1
% Enrolment in Govt. schools 85.2 88.1 62.5 62.0 13.7100.0 100.0 100.0 100.0 100.0
% No female teacher schools (tch>=2) 49.9 24.5 16.7 66.7 35.53.6 0.0 0.0 0.0 0.0
0.0 0.0 0.0 0.0 0.0%Enrolment in schools without blackboard 0.0 0.0 0.0 0.0 0.0
2001-02 2002-03 2003-04 2004-05 2005-06IIIIIIIVV
VIVII
Total U.P
74,52860,90157,98352,87150,17147,408
44,313
63,40456,76253,39947,49644,030
41,88739,223
70,55361,14855,34352,32251,541
48,95245,088
70,60558,08957,17853,72353,059
50,14247,281
104.9
51.6
93.9
43.7
94.7
89.7
44.0
4.22.1
37,30129,03228,01025,19423,92222,24021,035
1,6421,4711,4641,360
793723667
1,2441,2841,226
997687587546
3,344
classrooms
5,075426
92,794
79.777.877.942.981.3
14.415.8
5.9
21.60.0
13.6
6.40.5
57.15.1
1,484186
31,476
1,043 1,081 62 14 0 142 8642 21 3 0 174 6
34 4 1 0 8 13 0 0 0 0 0
286 41 32 2 63 10
71 1,187 1,196 697 117 3 080 1,980 1,897 1,450 300 2 0 17733 117 58 109 30 1 0 92
0 4 4 3 1 0 0 052 438 367 1,751 298 4 3 1,493
3 20 97 73 7 0 0 0
22403554
26411
2244
216397
1671
1050 86 30 13 0 340 162 300 118169
790
1491
5580
56
2730
16
0000
47645
1346
34514
0102
43454
1212
24715
0103
Terminalgrade Passed
VII boysV girlsV boys
VII girls
105 with >60%
57.434195968
45112
4478
58.044.1
9.120.3
48.256.338.0
0.021.3
102248Marathi Urdu English Hindi Others
18733412491
11487154
649110999
00
4123
300155401806
0767
15101171
00
1347
28400
44797
% Schools recvd.
90.093.958.333.368.2
91.294.958.333.364.3
9184922748
113937280
698076657
4017581
98927239883144337271
72950520714006305
2.67.19.44.0
10.3
0.90.60.60.4
0.80.9
0.80.7
2005-062004-052003-04
MAHARASHTRA
22.2
Upper PrimaryPrimary
Sex ratio Sex ratio 0-6
16 192
VIII14.6
Enrolment of children
VIIITotal Pr.
7 5624 3,854
0 0
314 137
%Teachers recvd.in-service training
Total schools* Rural schools* Total enrolment* Rural enrolment* Teachers*
3.2 32.7
91.7
60.4
85.0 76.0
41.5 41.8% SC enrolment% SC girls to SC enrolment% ST enrolment
48.4 47.426.447.9 47.4
62.4
48.8
47.4
45.7
Position of teachers by educational qualification (other than para teacher)
(Previous academic year)Incentives : Number of beneficiaries
% ST girls to ST enrolment
% Girls
Number of villages
% 0 - 6 population
% SC population % ST population
% Urban population
% Schools with blackboard
% Enrolment in single-teacher schools
% Enrolment in schools without building
Primary Upperprimary
OBC EnrolmentPrimary U. Primary
% OBCEnrolment% OBC girls toOBC Enrolment
Pupil-teacher ratio (PTR)Student-classroom ratio (SCR)% Schools with <= 50 students% Schools with PTR > 100% Female teachers
% Schools established since 1995
Regular teachers Para-teachers
% minorrepairs
% majorrepairs
# = not applicable na = not available * Some totals may not match due to no response in classificatory data items
3.6 95.5
0.7 98.7
3332
49.33435
47.40.1
31.18.0
48.23440
1.20.0
36.74.4
46.01418
33.30.08.3
33.3
46.22134
27.00.0
15.324.9
18.5 10.3 19.3 73.6 62.5
93394218.615.0
Category
PrivateGovt.PrivateGovtPrivateGovt.PrivateGovt.PrivateGovt.
Total population (in 000's)
Number of blocks/taluks
District
Decadal growth rate
Primary onlyPrimary with upper primaryPrimary with upper primary & sec/higher sec.Upper primary onlyUpper primary with sec./higher secondary
% Single classroom schools% Single teacher schools
P + UP P+sec/hs U.P. only UP+secP. only
No response in school category
Primary with upper primaryPrimary with U.P. & sec/higherUpper primary onlyUpper primary with sec./higher sec
Primary only
Primary onlyPrimary with upper primaryPrimary with Upper primary & sec/higherUpper primary only
Para-teachers
School category
Upper primary with sec./higher secondary
Primary onlyPrimary with upper prim.
P. onlyP + UPP+sec/hsU.P. onlyUP+sec
NER(U.Prim)GER(U.Prim)NER (Primary)GER (Primary)
Transition ratePrim. to U. Prim
17.9
Performance indicators
SC/ST Enrolment
Indicators
Classrooms/Other rooms
Prim.with U.P.&Sec/H.SUpper Primary onlyU. Primary with Sec./H.S.
Basic Data, 2001
Data reported from
150,482 145,581 125,140 141,892
100 28,405 40,030
314 24218,440
100.0
74.6
0.94
# ## #
# 186,734 8,120 6,571Total
1 - 4 5 - 7
239,595 239,366 221,061 246,283
95.1 55.194.8 56.091.0 29.693.5 32.9
Elementary Education: Report Card - YAVATMAL
Mah
aras
htr
a

350
1.1 2.0
Key data: Elementary Education
208
BISHNUPUR
(Previous academic year)
(Previous year)
Gender and caste distribution of teachers*
No. of schools by type of building*
BoysWith disability
Flow rates
Primary Level
Enrolment*
Number of schools
Grade
GER / NER
School category
Primary Upper primaryBoys Boys GirlsGirls
IncentiveType
School categoryMultiple
TypeKuccha
PartiallyPucca
PuccaTotal % good condition
Otherrooms
TentNo
Building
Classrooms
Belowsecondary
Highersecondary
Postgraduate
M. Phil.GraduateSecondarySchool category OthersNo
response
ST teachers
Total Male Female No res Male Female No res Male Female Male FemaleSC teachers
Text booksUniformAttendanceStationery
% Passed
Avg. No. of Tchs.
%
Female literacyOverall literacy
dev. grant grantSchool T L M
Male Female
IVV
IIIIII
Grade R.R. D.O.R. P.R.
VIIVI
# #
I - V
Enrolment by medium of instructions
Examination results
Retention rate
GPI
Primary cycle U. primary cycleState
DISTRICT ELEMENTARY EDUCATION REPORT CARD : 2005-06
GirlsGrade
IIIIIIIVVVI
VIII
AllGirls
Total
VII
% TotalGrossness
School category
2321
37
37 1337 11
44
32
0 0 0
173 5028 3,39814 3,725
4 3101 6690 0
119 36 6,740 2,8127,801 1,588 5,524
12,277 1,859 2,671205 310 205
0 0 0357 306 48
9,374 3,571 517241
199367
P + UP P+sec/hs U.P. only UP+sec
School categoryP. only
4.0 0.0 0.0 0.0 0.010.8
Number of Clusters 35957
% Schools with SCR > 600.0 0.0 0.0 0.0
0.9 3.3 1.7 0.0 0.0% Schools with pre-primary sections 85.2 63.3 70.7 0.0 0.0% Schools with common toilets 26.9 86.7 91.4 85.7 54.5
% Schools with girls toilets 4.0 26.7 58.6 14.3 36.4% Schools with drinking water facility 70.0 75.0 84.5 100.0 72.7
% Enrolment in Govt. schools 72.4 30.3 23.3 60.2 65.290.1 93.3 96.6 100.0 81.8
% No female teacher schools (tch>=2) 17.0 3.3 1.7 14.3 9.16.5 0.0 0.0 0.0 0.0
3.1 0.0 0.0 0.0 0.0%Enrolment in schools without blackboard 5.5 0.8 0.0 0.0 0.0
2001-02 2002-03 2003-04 2004-05 2005-06IIIIIIIVV
VIVII
Total U.P
9,1266,2205,3805,0344,8963,937
3,606
11,031
129.9
74.1
47.9
5.20.0
4,7893,2092,6732,4772,4051,9051,7711,684
20,913
141010
74717
60
188617421
47
668
classrooms
464645
2757
15.932.354.922.221.1
33.228.7
50.9
27.848.147.4
39.017.429.631.6
137257
832
141 9 106 68 1 20 192 21 22 2 10 36 14 11 0 25 20 2 4 0 1 02 1 3 0 3 2
20 134 188 353 9 0 010 28 91 443 30 0 0 3
2 33 71 567 115 5 0 00 0 3 43 11 0 0 00 2 1 67 8 0 0 2
0 1 2 6 1 0 0 0
414375503
4255
230290
1525
300 0 1 1 0 1 0 8 170000
1300
2200
0000
0100
0200
1122
00
1629
00
Terminalgrade Passed
VIII boysV girlsV boys
VIII girls
10 with >60%
14.7716608798
5780
3.72.00.00.0
10.63.41.70.00.0
1718English Manipuri
610112714
125583
1122750983288
390443
% Schools recvd.
87.950.039.771.454.5
82.548.337.971.445.5
167000
35000
8779000
2636000
3.210.113.8
8.17.3
1.03
2005-062004-052003-04
MANIPUR
36.6
Upper PrimaryPrimary
Sex ratio Sex ratio 0-6
2 6
VIII22.4
Enrolment of children
VIII 3,488Total Pr. 30,656
1 - 5 6 - 8
28 2951 29
0 0
240 558
%Teachers recvd.in-service training
Total schools* Rural schools* Total enrolment* Rural enrolment* Teachers*
16.2 15.4
100.0
62.6% SC enrolment% SC girls to SC enrolment% ST enrolment
49.1 57.63.8
47.6 48.4
1.1
54.1
2.1
72.8
Position of teachers by educational qualification (other than para teacher)
(Previous academic year)Incentives : Number of beneficiaries
% ST girls to ST enrolment
% Girls
Number of villages
% 0 - 6 population
% SC population % ST population
% Urban population
% Schools with blackboard
% Enrolment in single-teacher schools
% Enrolment in schools without building
Primary Upperprimary
OBC EnrolmentPrimary U. Primary
% OBCEnrolment% OBC girls toOBC Enrolment
Pupil-teacher ratio (PTR)Student-classroom ratio (SCR)% Schools with <= 50 students% Schools with PTR > 100% Female teachers
% Schools established since 1995
Regular teachers Para-teachers
% minorrepairs
% majorrepairs
# = not applicable na = not available * Some totals may not match due to no response in classificatory data items
2520
54.31819
53.80.0
42.09.9
48.31824
6.70.0
38.221.7
48.29
1942.9
0.026.314.3
54.51318
36.40.0
31.30.0
13.9 0.8 2.9 67.6 55.7
95299335.915.0
Category
PrivateGovt.PrivateGovtPrivateGovt.PrivateGovt.PrivateGovt.
Total population (in 000's)
Number of blocks/taluks
District
Decadal growth rate
Primary onlyPrimary with upper primaryPrimary with upper primary & sec/higher sec.Upper primary onlyUpper primary with sec./higher secondary
% Single classroom schools% Single teacher schools
P + UP P+sec/hs U.P. only UP+secP. only
No response in school category
Primary with upper primaryPrimary with U.P. & sec/higherUpper primary onlyUpper primary with sec./higher sec
Primary only
Primary onlyPrimary with upper primaryPrimary with Upper primary & sec/higherUpper primary only
Para-teachers
School category
Upper primary with sec./higher secondary
Primary onlyPrimary with upper prim.
P. onlyP + UPP+sec/hsU.P. onlyUP+sec
NER(U.Prim)GER(U.Prim)NER (Primary)GER (Primary)
Transition ratePrim. to U. Prim
4.7
SC/ST Enrolment
Indicators
Classrooms/Other rooms
Prim.with U.P.&Sec/H.SUpper Primary onlyU. Primary with Sec./H.S.
Basic Data, 2001
Data reported from
Performance indicators
93.6 17.894.6 18.796.1 24.996.2 20.9
Elementary Education in India - Where do we stand ?
Man
ipu
r

351
0.8562.60.831
Key data: Elementary Education
118
CHANDEL
(Previous academic year)
(Previous year)
Gender and caste distribution of teachers*
No. of schools by type of building*
BoysWith disability
Flow rates
Primary Level
Enrolment*
Number of schools
Grade
GER / NER
School category
Primary Upper primaryBoys Boys GirlsGirls
IncentiveType
School categoryMultiple
TypeKuccha
PartiallyPucca
PuccaTotal % good condition
Otherrooms
TentNo
Building
Classrooms
Belowsecondary
Highersecondary
Postgraduate
M. Phil.GraduateSecondarySchool category OthersNo
response
ST teachers
Total Male Female No res Male Female No res Male Female Male FemaleSC teachers
Text booksUniformAttendanceStationery
% Passed
Avg. No. of Tchs.
%
Female literacyOverall literacy
dev. grant grantSchool T L M
Male Female
IVV
IIIIII
Grade R.R. D.O.R. P.R.
VIIVI
# #
I - V
Enrolment by medium of instructions
Examination results
Retention rate
GPI
Primary cycle U. primary cycleState
DISTRICT ELEMENTARY EDUCATION REPORT CARD : 2005-06
GirlsGrade
IIIIIIIVVVI
VIII
AllGirls
Total
VII
% TotalGrossness
School category
20711
3 201 710
11
0 0 0
162 293 2,1291 7301 400 1290 0
162 29 7,504 1,664275 2,129 275544 730 544
57 40 57
0 0 00 129 0
7,504 1,664 435159
6816
P + UP P+sec/hs U.P. only UP+sec
School categoryP. only
0.0 0.0 0.0 0.0 0.018.3
Number of Clusters 225221
% Schools with SCR > 600.0 12.5 0.0 0.0
0.0 0.0 12.5 0.0 0.0% Schools with pre-primary sections 24.1 39.1 37.5 0.0 0.0% Schools with common toilets 10.5 60.9 87.5 50.0 100.0
% Schools with girls toilets 0.5 4.3 37.5 0.0 100.0% Schools with drinking water facility 96.3 95.7 87.5 100.0 100.0
% Enrolment in Govt. schools 81.8 88.6 57.3 41.2 100.096.3 100.0 100.0 100.0 100.0
% No female teacher schools (tch>=2) 28.8 26.1 12.5 100.0 0.016.0 0.0 2.4 0.0 0.0
3.7 9.1 2.4 0.0 0.0%Enrolment in schools without blackboard 3.1 0.0 0.0 0.0 0.0
2001-02 2002-03 2003-04 2004-05 2005-06IIIIIIIVV
VIVII
Total U.P
4,5403,6161,8681,101
790459
402
1,157
83.5
14.0
45.9
25.00.0
2,1561,715
908534393212188136
6,242
193718
35324
91
710
581110
33
561
classrooms
13156
610
9.125.237.5
0.00.0
42.848.1
48.1
48.20.0
100.0
26.714.3
100.00.0
9802
24 6 74 98 0 4 90 8 9 0 5 12 3 0 0 2 10 0 2 0 0 00 1 0 0 0 0
1 51 344 80 0 0 04 18 60 82 3 0 0 80 2 21 55 3 0 0 00 0 2 4 0 0 0 03 1 0 9 0 0 0 0
0 0 0 0 0 0 0 0
288121
6169
4620
04
187 28 0 0 0 2 2 254 1768000
0000
0000
0000
7900
1300
8529
15
3216
04
Terminalgrade Passed
VIII boysV girlsV boys
VIII girls
27 with >60%
97.9503175
816
13
87.657.4
100.00.0
100.087.055.0
0.0
5354Manipuri English Others
1773558
400
3459631685
57129
2130
3100
% Schools recvd.
99.591.387.550.0
0.0
99.091.387.5
100.00.0
6001311
15311
558404
5436279
14279
477505
2.67.6
10.13.0
13.0
0.92
2005-062004-052003-04
MANIPUR
24.7
Upper PrimaryPrimary
Sex ratio Sex ratio 0-6
4 8
VIII0.0
Enrolment of children
VIII 296Total Pr. 11,915
1 - 5 6 - 8
2 413 0
0 0
66 15
%Teachers recvd.in-service training
Total schools* Rural schools* Total enrolment* Rural enrolment* Teachers*
5.3 13.2
79.1
12.1% SC enrolment% SC girls to SC enrolment% ST enrolment
49.5 43.397.647.9 46.6 44.1
2.2
40.0
Position of teachers by educational qualification (other than para teacher)
(Previous academic year)Incentives : Number of beneficiaries
% ST girls to ST enrolment
% Girls
Number of villages
% 0 - 6 population
% SC population % ST population
% Urban population
% Schools with blackboard
% Enrolment in single-teacher schools
% Enrolment in schools without building
Primary Upperprimary
OBC EnrolmentPrimary U. Primary
% OBCEnrolment% OBC girls toOBC Enrolment
Pupil-teacher ratio (PTR)Student-classroom ratio (SCR)% Schools with <= 50 students% Schools with PTR > 100% Female teachers
% Schools established since 1995
Regular teachers Para-teachers
% minorrepairs
% majorrepairs
# = not applicable na = not available * Some totals may not match due to no response in classificatory data items
2316
47.51816
68.60.0
37.20.5
49.61418
13.00.0
26.30.0
46.41616
50.00.00.00.0
51.21013
0.00.0
30.80.0
72.8 0.2 91.9 56.2 48.0
96298112.613.6
Category
PrivateGovt.PrivateGovtPrivateGovt.PrivateGovt.PrivateGovt.
Total population (in 000's)
Number of blocks/taluks
District
Decadal growth rate
Primary onlyPrimary with upper primaryPrimary with upper primary & sec/higher sec.Upper primary onlyUpper primary with sec./higher secondary
% Single classroom schools% Single teacher schools
P + UP P+sec/hs U.P. only UP+secP. only
No response in school category
Primary with upper primaryPrimary with U.P. & sec/higherUpper primary onlyUpper primary with sec./higher sec
Primary only
Primary onlyPrimary with upper primaryPrimary with Upper primary & sec/higherUpper primary only
Para-teachers
School category
Upper primary with sec./higher secondary
Primary onlyPrimary with upper prim.
P. onlyP + UPP+sec/hsU.P. onlyUP+sec
NER(U.Prim)GER(U.Prim)NER (Primary)GER (Primary)
Transition ratePrim. to U. Prim
94.1
SC/ST Enrolment
Indicators
Classrooms/Other rooms
Prim.with U.P.&Sec/H.SUpper Primary onlyU. Primary with Sec./H.S.
Basic Data, 2001
Data reported from
Performance indicators
93.8 9.090.2 8.779.4 8.276.1 11.0
Elementary Education: Report Card - CHANDEL
Man
ipu
r

352
0.5721.00.817
Key data: Elementary Education
228
CHURACHANDPUR
(Previous academic year)
(Previous year)
Gender and caste distribution of teachers*
No. of schools by type of building*
BoysWith disability
Flow rates
Primary Level
Enrolment*
Number of schools
Grade
GER / NER
School category
Primary Upper primaryBoys Boys GirlsGirls
IncentiveType
School categoryMultiple
TypeKuccha
PartiallyPucca
PuccaTotal % good condition
Otherrooms
TentNo
Building
Classrooms
Belowsecondary
Highersecondary
Postgraduate
M. Phil.GraduateSecondarySchool category OthersNo
response
ST teachers
Total Male Female No res Male Female No res Male Female Male FemaleSC teachers
Text booksUniformAttendanceStationery
% Passed
Avg. No. of Tchs.
%
Female literacyOverall literacy
dev. grant grantSchool T L M
Male Female
IVV
IIIIII
Grade R.R. D.O.R. P.R.
VIIVI
# #
I - V
Enrolment by medium of instructions
Examination results
Retention rate
GPI
Primary cycle U. primary cycleState
DISTRICT ELEMENTARY EDUCATION REPORT CARD : 2005-06
GirlsGrade
IIIIIIIVVVI
VIII
AllGirls
Total
VII
% TotalGrossness
School category
8521
01
36 8530 21
00
01
0 0 0
285 4236 7,50930 2,179
0 00 2350 0
283 42 8,827 1,8693,760 7,509 3,760
14,080 2,179 14,0800 0 0
0 0 00 235 0
8,938 1,869 603716
117216
P + UP P+sec/hs U.P. only UP+sec
School categoryP. only
11.9 0.8 0.0 0.0 0.037.6
Number of Clusters 500500
% Schools with SCR > 601.7 0.0 0.0 0.0
0.3 0.0 2.0 0.0 0.0% Schools with pre-primary sections 59.9 62.8 72.5 0.0 0.0% Schools with common toilets 1.8 17.4 54.9 0.0 100.0
% Schools with girls toilets 0.0 3.3 41.2 0.0 100.0% Schools with drinking water facility 62.1 54.5 62.7 0.0 0.0
% Enrolment in Govt. schools 82.7 66.6 13.4 0.0 100.099.1 99.2 100.0 0.0 100.0
% No female teacher schools (tch>=2) 28.1 14.9 13.7 0.0 0.029.0 0.6 0.0 0.0 0.0
3.4 0.5 0.0 0.0 0.0%Enrolment in schools without blackboard 0.7 0.7 0.0 0.0 0.0
2001-02 2002-03 2003-04 2004-05 2005-06IIIIIIIVV
VIVII
Total U.P
7,4096,8385,8275,1734,4883,144
2,864
8,835
102.5
51.2
47.2
13.75.9
3,6283,2772,8352,4242,1421,5161,3121,319
18,453
54250300
19
24300401
14
774
classrooms
806696
013
4.010.543.5
0.076.9
29.129.7
66.9
34.20.0
15.4
59.822.3
0.07.7
128173
04
144 9 28 259 5 0 268 26 80 0 5 2
17 8 9 0 17 00 0 0 0 0 00 0 0 0 1 0
21 201 354 137 6 0 014 196 334 362 14 0 0 12
9 71 137 226 14 1 0 110 0 0 0 0 0 0 00 0 1 12 0 2 0 0
0 1 1 1 0 0 0 0
502615271
011
316198
04
217 0 0 1 0 4 4 459 2021000
0100
0100
0000
2415
03
15500
482216
01
258184
00
Terminalgrade Passed
VIII boysV girlsV boys
VIII girls
0 with >60%
31.5720932471
015
31.422.8
0.09.1
23.425.311.1
0.00.0
10229Others English Manipuri
94644489
00
4661576
113780
235
112229392
00
% Schools recvd.
0.00.00.00.00.0
0.02.50.00.00.0
53100
528
164164
0164
56700
566
9191
091
2.27.79.20.0
15.0
0.93
2005-062004-052003-04
MANIPUR
42.3
Upper PrimaryPrimary
Sex ratio Sex ratio 0-6
6 13
VIII9.8
Enrolment of children
VIII 2,827Total Pr. 29,735
1 - 5 6 - 8
0 015 0
0 0
223 248
%Teachers recvd.in-service training
Total schools* Rural schools* Total enrolment* Rural enrolment* Teachers*
25.7 36.6
76.1
32.5% SC enrolment% SC girls to SC enrolment% ST enrolment
45.7 51.195.648.3 47.1 40.6
1.2
49.1
Position of teachers by educational qualification (other than para teacher)
(Previous academic year)Incentives : Number of beneficiaries
% ST girls to ST enrolment
% Girls
Number of villages
% 0 - 6 population
% SC population % ST population
% Urban population
% Schools with blackboard
% Enrolment in single-teacher schools
% Enrolment in schools without building
Primary Upperprimary
OBC EnrolmentPrimary U. Primary
% OBCEnrolment% OBC girls toOBC Enrolment
Pupil-teacher ratio (PTR)Student-classroom ratio (SCR)% Schools with <= 50 students% Schools with PTR > 100% Female teachers
% Schools established since 1995
Regular teachers Para-teachers
% minorrepairs
% majorrepairs
# = not applicable na = not available * Some totals may not match due to no response in classificatory data items
2335
48.91514
86.20.0
30.317.7
48.11214
28.10.8
33.911.6
0.000
0.00.00.00.0
38.71618
0.00.0
26.70.0
29.8 0.1 93.2 70.6 63.1
968944na13.5
Category
PrivateGovt.PrivateGovtPrivateGovt.PrivateGovt.PrivateGovt.
Total population (in 000's)
Number of blocks/taluks
District
Decadal growth rate
Primary onlyPrimary with upper primaryPrimary with upper primary & sec/higher sec.Upper primary onlyUpper primary with sec./higher secondary
% Single classroom schools% Single teacher schools
P + UP P+sec/hs U.P. only UP+secP. only
No response in school category
Primary with upper primaryPrimary with U.P. & sec/higherUpper primary onlyUpper primary with sec./higher sec
Primary only
Primary onlyPrimary with upper primaryPrimary with Upper primary & sec/higherUpper primary only
Para-teachers
School category
Upper primary with sec./higher secondary
Primary onlyPrimary with upper prim.
P. onlyP + UPP+sec/hsU.P. onlyUP+sec
NER(U.Prim)GER(U.Prim)NER (Primary)GER (Primary)
Transition ratePrim. to U. Prim
93.2
SC/ST Enrolment
Indicators
Classrooms/Other rooms
Prim.with U.P.&Sec/H.SUpper Primary onlyU. Primary with Sec./H.S.
Basic Data, 2001
Data reported from
Performance indicators
95.4 46.795.8 48.691.2 48.289.6 49.9
Elementary Education in India - Where do we stand ?
Man
ipu
r

353
5.4 3.4
Key data: Elementary Education
395
IMPHAL EAST
(Previous academic year)
(Previous year)
Gender and caste distribution of teachers*
No. of schools by type of building*
BoysWith disability
Flow rates
Primary Level
Enrolment*
Number of schools
Grade
GER / NER
School category
Primary Upper primaryBoys Boys GirlsGirls
IncentiveType
School categoryMultiple
TypeKuccha
PartiallyPucca
PuccaTotal % good condition
Otherrooms
TentNo
Building
Classrooms
Belowsecondary
Highersecondary
Postgraduate
M. Phil.GraduateSecondarySchool category OthersNo
response
ST teachers
Total Male Female No res Male Female No res Male Female Male FemaleSC teachers
Text booksUniformAttendanceStationery
% Passed
Avg. No. of Tchs.
%
Female literacyOverall literacy
dev. grant grantSchool T L M
Male Female
IVV
IIIIII
Grade R.R. D.O.R. P.R.
VIIVI
# #
I - V
Enrolment by medium of instructions
Examination results
Retention rate
GPI
Primary cycle U. primary cycleState
DISTRICT ELEMENTARY EDUCATION REPORT CARD : 2005-06
GirlsGrade
IIIIIIIVVVI
VIII
AllGirls
Total
VII
% TotalGrossness
School category
4443
728
32 3654 30
411
720
2 0 1
293 4520 7,19734 14,222
3 4539 2,7230 57
264 31 21,216 2,7296,622 5,963 3,617
18,265 9,858 11,008181 453 131
0 0 01,125 2,048 1,031
23,149 3,839 1,100559
169367
P + UP P+sec/hs U.P. only UP+sec
School categoryP. only
4.4 0.0 1.0 0.0 0.011.8
Number of Clusters 563192
% Schools with SCR > 600.0 0.0 0.0 0.0
4.7 0.0 2.1 0.0 0.0% Schools with pre-primary sections 5.0 35.5 62.9 0.0 0.0% Schools with common toilets 29.6 81.6 80.4 54.5 84.6
% Schools with girls toilets 5.9 42.1 74.2 18.2 43.6% Schools with drinking water facility 76.3 82.9 91.8 36.4 74.4
% Enrolment in Govt. schools 85.8 52.1 43.8 71.5 70.893.2 93.4 95.9 100.0 97.4
% No female teacher schools (tch>=2) 23.4 7.9 2.1 9.1 10.39.1 0.0 0.0 0.0 0.0
1.8 0.0 0.0 0.0 0.0%Enrolment in schools without blackboard 7.9 2.7 1.2 0.0 2.3
2001-02 2002-03 2003-04 2004-05 2005-06IIIIIIIVV
VIVII
Total U.P
20,72510,473
8,6518,1758,1047,503
7,149
21,705
125.2
73.4
48.2
6.21.0
10,6215,3244,4234,1424,0493,7263,6563,504
39,445
1312
996869
72
153595576
55
1,068
classrooms
6731,305
39245
21.032.761.620.536.3
52.645.5
26.4
30.946.243.7
21.87.5
33.320.0
190360
14132
210 24 197 71 0 35 104 34 19 0 18 1
20 24 18 0 33 21 4 6 0 0 03 14 1 0 21 0
69 284 339 501 22 1 05 58 127 577 94 4 1 325 42 153 809 288 3 5 901 5 8 59 4 0 0 00 3 24 348 36 1 0 7
5 12 18 53 11 0 1 0
615424581
39201
454718
38212
599 43 6 6 0 31 13 12 232096
06
1627
29
1217
16
0100
1712
02
1114
03
3846
11
4796
01
Terminalgrade Passed
VIII boysV girlsV boys
VIII girls
41 with >60%
18.51269926
144080
434
7.70.84.91.0
17.94.71.52.60.0
985English Manipuri Bengali Others Hindi
818528600
551801
2317252603698
5312001
2375179189
046
29600
480
121195
000
% Schools recvd.
94.450.012.4
100.084.6
95.347.411.3
100.089.7
11882931
165
2035146
119
159609
26153
43282752
102
3.812.214.8
7.311.1
1.04
2005-062004-052003-04
MANIPUR
51.0
Upper PrimaryPrimary
Sex ratio Sex ratio 0-6
3 23
VIII12.4
Enrolment of children
VIII 7,053Total Pr. 56,128
1 - 5 6 - 8
60 20338 96
0 0
644 796
%Teachers recvd.in-service training
Total schools* Rural schools* Total enrolment* Rural enrolment* Teachers*
20.4 17.2
99.7
60.8% SC enrolment% SC girls to SC enrolment% ST enrolment
50.1 48.55.6
48.3 42.7
2.9
56.0
5.8
67.5
Position of teachers by educational qualification (other than para teacher)
(Previous academic year)Incentives : Number of beneficiaries
% ST girls to ST enrolment
% Girls
Number of villages
% 0 - 6 population
% SC population % ST population
% Urban population
% Schools with blackboard
% Enrolment in single-teacher schools
% Enrolment in schools without building
Primary Upperprimary
OBC EnrolmentPrimary U. Primary
% OBCEnrolment% OBC girls toOBC Enrolment
Pupil-teacher ratio (PTR)Student-classroom ratio (SCR)% Schools with <= 50 students% Schools with PTR > 100% Female teachers
% Schools established since 1995
Regular teachers Para-teachers
% minorrepairs
% majorrepairs
# = not applicable na = not available * Some totals may not match due to no response in classificatory data items
2523
53.52125
33.41.5
47.71.5
51.11521
5.30.0
50.323.7
58.48
1645.5
0.048.8
0.0
49.59
1633.3
0.050.2
0.0
19.2 2.6 6.3 75.4 65.3
96399127.414.1
Category
PrivateGovt.PrivateGovtPrivateGovt.PrivateGovt.PrivateGovt.
Total population (in 000's)
Number of blocks/taluks
District
Decadal growth rate
Primary onlyPrimary with upper primaryPrimary with upper primary & sec/higher sec.Upper primary onlyUpper primary with sec./higher secondary
% Single classroom schools% Single teacher schools
P + UP P+sec/hs U.P. only UP+secP. only
No response in school category
Primary with upper primaryPrimary with U.P. & sec/higherUpper primary onlyUpper primary with sec./higher sec
Primary only
Primary onlyPrimary with upper primaryPrimary with Upper primary & sec/higherUpper primary only
Para-teachers
School category
Upper primary with sec./higher secondary
Primary onlyPrimary with upper prim.
P. onlyP + UPP+sec/hsU.P. onlyUP+sec
NER(U.Prim)GER(U.Prim)NER (Primary)GER (Primary)
Transition ratePrim. to U. Prim
8.1
SC/ST Enrolment
Indicators
Classrooms/Other rooms
Prim.with U.P.&Sec/H.SUpper Primary onlyU. Primary with Sec./H.S.
Basic Data, 2001
Data reported from
Performance indicators
96.7 25.097.4 24.796.0 23.796.9 24.8
Elementary Education: Report Card - IMPHAL EAST
Man
ipu
r
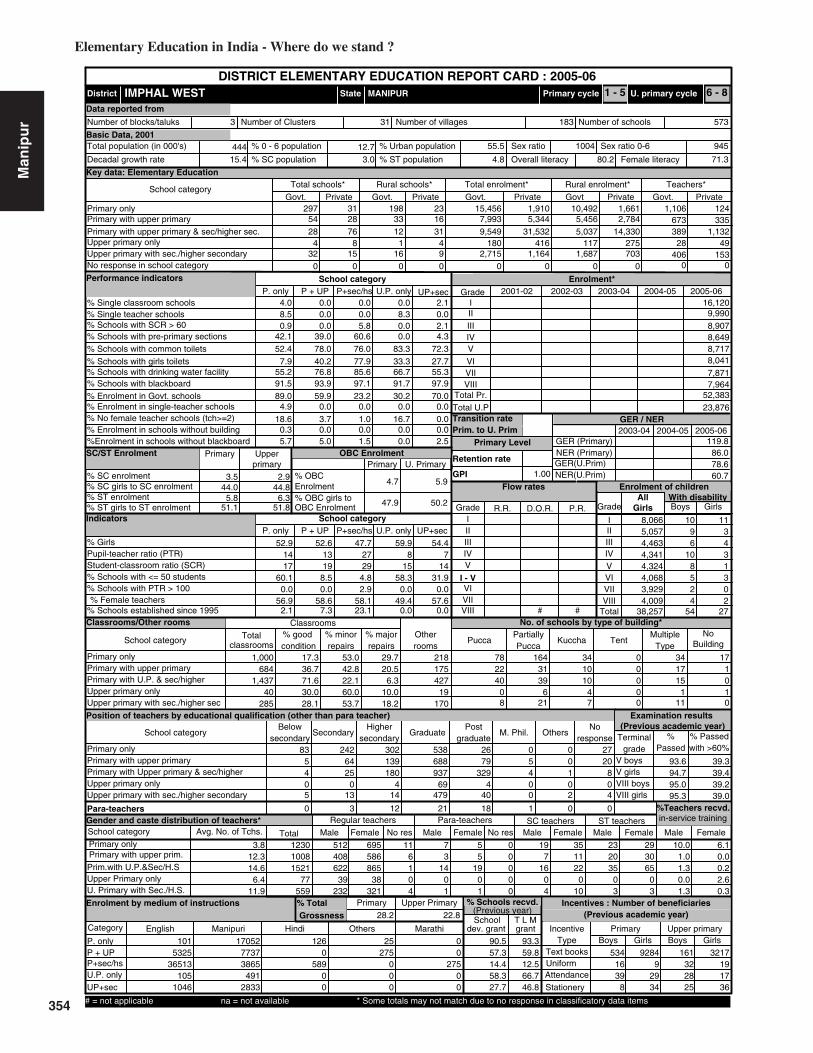
354
3.5 2.9
Key data: Elementary Education
444
IMPHAL WEST
(Previous academic year)
(Previous year)
Gender and caste distribution of teachers*
No. of schools by type of building*
BoysWith disability
Flow rates
Primary Level
Enrolment*
Number of schools
Grade
GER / NER
School category
Primary Upper primaryBoys Boys GirlsGirls
IncentiveType
School categoryMultiple
TypeKuccha
PartiallyPucca
PuccaTotal % good condition
Otherrooms
TentNo
Building
Classrooms
Belowsecondary
Highersecondary
Postgraduate
M. Phil.GraduateSecondarySchool category OthersNo
response
ST teachers
Total Male Female No res Male Female No res Male Female Male FemaleSC teachers
Text booksUniformAttendanceStationery
% Passed
Avg. No. of Tchs.
%
Female literacyOverall literacy
dev. grant grantSchool T L M
Male Female
IVV
IIIIII
Grade R.R. D.O.R. P.R.
VIIVI
# #
I - V
Enrolment by medium of instructions
Examination results
Retention rate
GPI
Primary cycle U. primary cycleState
DISTRICT ELEMENTARY EDUCATION REPORT CARD : 2005-06
GirlsGrade
IIIIIIIVVVI
VIII
AllGirls
Total
VII
% TotalGrossness
School category
5428
432
28 3376 12
815
116
0 0 0
297 3116 7,99331 9,549
4 1809 2,7150 0
198 23 10,492 1,6615,344 5,456 2,784
31,532 5,037 14,330416 117 275
0 0 01,164 1,687 703
15,456 1,910 1,106673
124335
P + UP P+sec/hs U.P. only UP+sec
School categoryP. only
4.0 0.0 0.0 0.0 2.18.5
Number of Clusters 573183
% Schools with SCR > 600.0 0.0 8.3 0.0
0.9 0.0 5.8 0.0 2.1% Schools with pre-primary sections 42.1 39.0 60.6 0.0 4.3% Schools with common toilets 52.4 78.0 76.0 83.3 72.3
% Schools with girls toilets 7.9 40.2 77.9 33.3 27.7% Schools with drinking water facility 55.2 76.8 85.6 66.7 55.3
% Enrolment in Govt. schools 89.0 59.9 23.2 30.2 70.091.5 93.9 97.1 91.7 97.9
% No female teacher schools (tch>=2) 18.6 3.7 1.0 16.7 0.04.9 0.0 0.0 0.0 0.0
0.3 0.0 0.0 0.0 0.0%Enrolment in schools without blackboard 5.7 5.0 1.5 0.0 2.5
2001-02 2002-03 2003-04 2004-05 2005-06IIIIIIIVV
VIVII
Total U.P
16,1209,9908,9078,6498,7178,041
7,871
23,876
119.8
78.6
47.7
4.82.9
8,0665,0574,4634,3414,3244,0683,9294,009
38,257
1096
108524
54
113431302
27
1,000
classrooms
6841,437
40285
17.336.771.630.028.1
53.042.8
29.7
22.160.053.7
20.56.3
10.018.2
175427
19170
218 78 164 34 0 34 1722 31 10 0 17 140 39 10 0 15 0
0 6 4 0 1 18 21 7 0 11 0
83 242 302 538 26 0 05 64 139 688 79 5 0 204 25 180 937 329 4 1 80 0 4 69 4 0 0 05 13 14 479 40 0 2 4
0 3 12 21 18 1 0 0
512408622
39232
586865
38321
695 11 7 5 0 19 35 23 296104
314
01
519
01
0000
716
04
1122
010
2035
03
3065
03
Terminalgrade Passed
VIII boysV girlsV boys
VIII girls
27 with >60%
10.0123010081521
77559
1.01.30.01.3
6.10.00.22.60.3
101English Manipuri Hindi Others Marathi
532536513
1051046
1705277373865
4912833
1260
58900
25275
000
00
27500
% Schools recvd.
90.557.314.458.327.7
93.359.812.566.746.8
5341639
8
161322825
92849
2934
3217191736
3.812.314.6
6.411.9
1.00
2005-062004-052003-04
MANIPUR
58.1
Upper PrimaryPrimary
Sex ratio Sex ratio 0-6
3 31
VIII23.1
Enrolment of children
VIII 7,964Total Pr. 52,383
1 - 5 6 - 8
28 49406 153
0 0
389 1,132
%Teachers recvd.in-service training
Total schools* Rural schools* Total enrolment* Rural enrolment* Teachers*
28.2 22.8
86.0
60.7% SC enrolment% SC girls to SC enrolment% ST enrolment
44.0 44.85.8
51.1 51.8
4.7
47.9
5.9
50.2
Position of teachers by educational qualification (other than para teacher)
(Previous academic year)Incentives : Number of beneficiaries
% ST girls to ST enrolment
% Girls
Number of villages
% 0 - 6 population
% SC population % ST population
% Urban population
% Schools with blackboard
% Enrolment in single-teacher schools
% Enrolment in schools without building
Primary Upperprimary
OBC EnrolmentPrimary U. Primary
% OBCEnrolment% OBC girls toOBC Enrolment
Pupil-teacher ratio (PTR)Student-classroom ratio (SCR)% Schools with <= 50 students% Schools with PTR > 100% Female teachers
% Schools established since 1995
Regular teachers Para-teachers
% minorrepairs
% majorrepairs
# = not applicable na = not available * Some totals may not match due to no response in classificatory data items
2927
52.91417
60.10.0
56.92.1
52.61319
8.50.0
58.67.3
59.98
1558.3
0.049.4
0.0
54.47
1431.9
0.057.6
0.0
15.4 3.0 4.8 80.2 71.3
945100455.512.7
Category
PrivateGovt.PrivateGovtPrivateGovt.PrivateGovt.PrivateGovt.
Total population (in 000's)
Number of blocks/taluks
District
Decadal growth rate
Primary onlyPrimary with upper primaryPrimary with upper primary & sec/higher sec.Upper primary onlyUpper primary with sec./higher secondary
% Single classroom schools% Single teacher schools
P + UP P+sec/hs U.P. only UP+secP. only
No response in school category
Primary with upper primaryPrimary with U.P. & sec/higherUpper primary onlyUpper primary with sec./higher sec
Primary only
Primary onlyPrimary with upper primaryPrimary with Upper primary & sec/higherUpper primary only
Para-teachers
School category
Upper primary with sec./higher secondary
Primary onlyPrimary with upper prim.
P. onlyP + UPP+sec/hsU.P. onlyUP+sec
NER(U.Prim)GER(U.Prim)NER (Primary)GER (Primary)
Transition ratePrim. to U. Prim
6.3
SC/ST Enrolment
Indicators
Classrooms/Other rooms
Prim.with U.P.&Sec/H.SUpper Primary onlyU. Primary with Sec./H.S.
Basic Data, 2001
Data reported from
Performance indicators
93.6 39.394.7 39.495.0 39.295.3 39.0
Elementary Education in India - Where do we stand ?
Man
ipu
r

355
0.7870.3491.80.934
Key data: Elementary Education
157
SENAPATI
(Previous academic year)
(Previous year)
Gender and caste distribution of teachers*
No. of schools by type of building*
BoysWith disability
Flow rates
Primary Level
Enrolment*
Number of schools
Grade
GER / NER
School category
Primary Upper primaryBoys Boys GirlsGirls
IncentiveType
School categoryMultiple
TypeKuccha
PartiallyPucca
PuccaTotal % good condition
Otherrooms
TentNo
Building
Classrooms
Belowsecondary
Highersecondary
Postgraduate
M. Phil.GraduateSecondarySchool category OthersNo
response
ST teachers
Total Male Female No res Male Female No res Male Female Male FemaleSC teachers
Text booksUniformAttendanceStationery
% Passed
Avg. No. of Tchs.
%
Female literacyOverall literacy
dev. grant grantSchool T L M
Male Female
IVV
IIIIII
Grade R.R. D.O.R. P.R.
VIIVI
# #
I - V
Enrolment by medium of instructions
Examination results
Retention rate
GPI
Primary cycle U. primary cycleState
DISTRICT ELEMENTARY EDUCATION REPORT CARD : 2005-06
GirlsGrade
IIIIIIIVVVI
VIII
AllGirls
Total
VII
% TotalGrossness
School category
6917
31
27 6927 17
20
31
0 0 0
427 1727 11,14227 4,922
2 1740 650 0
427 17 27,342 1,4865,251 11,142 5,2519,559 4,922 9,559
169 174 169
0 0 00 65 0
27,342 1,486 1,089648
54291
P + UP P+sec/hs U.P. only UP+sec
School categoryP. only
0.7 0.0 0.0 0.0 0.031.1
Number of Clusters 590518
% Schools with SCR > 601.0 0.0 0.0 0.0
1.4 0.0 2.3 0.0 0.0% Schools with pre-primary sections 44.4 59.4 56.8 0.0 0.0% Schools with common toilets 31.5 62.5 77.3 60.0 100.0
% Schools with girls toilets 4.3 25.0 63.6 0.0 0.0% Schools with drinking water facility 89.9 94.8 93.2 100.0 100.0
% Enrolment in Govt. schools 94.8 68.0 34.0 50.7 100.098.9 99.0 100.0 100.0 100.0
% No female teacher schools (tch>=2) 27.5 13.5 2.3 20.0 0.020.2 0.8 0.0 0.0 0.0
8.5 0.0 0.0 0.0 0.0%Enrolment in schools without blackboard 1.2 1.3 0.0 0.0 0.0
2001-02 2002-03 2003-04 2004-05 2005-06IIIIIIIVV
VIVII
Total U.P
18,84111,704
7,7876,3925,7303,482
3,221
9,656
249.2
77.6
45.8
2.30.0
9,1535,6753,7923,0772,7571,5791,5171,381
28,931
2937261821
675
149
21241511
5512
84
1,370
classrooms
811557
228
9.113.846.9
0.00.0
47.443.3
43.5
40.068.237.5
42.913.131.862.5
165133
52
204 31 106 216 1 14 762 33 36 0 24 1
14 13 2 0 15 00 2 3 0 0 00 0 0 0 1 0
133 288 317 311 9 0 067 167 216 411 37 1 1 3016 43 104 299 66 0 1 48
2 4 3 21 0 0 0 01 1 0 7 0 0 0 0
2 24 33 21 3 0 0 0
689623339
266
305223
43
383 5 45 21 0 11 6 578 3552
1500
7600
2200
0000
23100
10400
382188
105
211164
33
Terminalgrade Passed
VIII boysV girlsV boys
VIII girls
19 with >60%
4.61143939585
309
2.12.30.00.0
5.21.01.80.00.0
23984English Others Hindi Nepali Manipuri
1475814015
32165
305175
28900
811711177
220
595360
000
145261
000
% Schools recvd.
28.421.9
2.30.00.0
0.21.00.00.00.0
620500
1687
46700
235
640100
1845
49100
279
2.69.8
13.36.09.0
0.94
2005-062004-052003-04
MANIPUR
38.5
Upper PrimaryPrimary
Sex ratio Sex ratio 0-6
6 24
VIII13.6
Enrolment of children
VIII 2,953Total Pr. 50,454
1 - 5 6 - 8
20 109 00 0
205 380
%Teachers recvd.in-service training
Total schools* Rural schools* Total enrolment* Rural enrolment* Teachers*
21.4 26.9
100.0
56.7% SC enrolment% SC girls to SC enrolment% ST enrolment
48.4 44.984.648.8 46.7 47.2 42.1
Position of teachers by educational qualification (other than para teacher)
(Previous academic year)Incentives : Number of beneficiaries
% ST girls to ST enrolment
% Girls
Number of villages
% 0 - 6 population
% SC population % ST population
% Urban population
% Schools with blackboard
% Enrolment in single-teacher schools
% Enrolment in schools without building
Primary Upperprimary
OBC EnrolmentPrimary U. Primary
% OBCEnrolment% OBC girls toOBC Enrolment
Pupil-teacher ratio (PTR)Student-classroom ratio (SCR)% Schools with <= 50 students% Schools with PTR > 100% Female teachers
% Schools established since 1995
Regular teachers Para-teachers
% minorrepairs
% majorrepairs
# = not applicable na = not available * Some totals may not match due to no response in classificatory data items
2625
49.12521
48.20.5
35.325.7
48.61720
1.01.0
32.714.6
41.41116
20.00.0
13.30.0
50.878
0.00.0
33.30.0
82.0 0.2 78.5 59.8 51.2
962951na14.0
Category
PrivateGovt.PrivateGovtPrivateGovt.PrivateGovt.PrivateGovt.
Total population (in 000's)
Number of blocks/taluks
District
Decadal growth rate
Primary onlyPrimary with upper primaryPrimary with upper primary & sec/higher sec.Upper primary onlyUpper primary with sec./higher secondary
% Single classroom schools% Single teacher schools
P + UP P+sec/hs U.P. only UP+secP. only
No response in school category
Primary with upper primaryPrimary with U.P. & sec/higherUpper primary onlyUpper primary with sec./higher sec
Primary only
Primary onlyPrimary with upper primaryPrimary with Upper primary & sec/higherUpper primary only
Para-teachers
School category
Upper primary with sec./higher secondary
Primary onlyPrimary with upper prim.
P. onlyP + UPP+sec/hsU.P. onlyUP+sec
NER(U.Prim)GER(U.Prim)NER (Primary)GER (Primary)
Transition ratePrim. to U. Prim
75.6
SC/ST Enrolment
Indicators
Classrooms/Other rooms
Prim.with U.P.&Sec/H.SUpper Primary onlyU. Primary with Sec./H.S.
Basic Data, 2001
Data reported from
Performance indicators
90.9 22.690.6 23.090.7 31.988.9 33.1
Elementary Education: Report Card - SENAPATI
Man
ipu
r

356
0.1640.0640.1640.053
Key data: Elementary Education
111
TAMENGLONG
(Previous academic year)
(Previous year)
Gender and caste distribution of teachers*
No. of schools by type of building*
BoysWith disability
Flow rates
Primary Level
Enrolment*
Number of schools
Grade
GER / NER
School category
Primary Upper primaryBoys Boys GirlsGirls
IncentiveType
School categoryMultiple
TypeKuccha
PartiallyPucca
PuccaTotal % good condition
Otherrooms
TentNo
Building
Classrooms
Belowsecondary
Highersecondary
Postgraduate
M. Phil.GraduateSecondarySchool category OthersNo
response
ST teachers
Total Male Female No res Male Female No res Male Female Male FemaleSC teachers
Text booksUniformAttendanceStationery
% Passed
Avg. No. of Tchs.
%
Female literacyOverall literacy
dev. grant grantSchool T L M
Male Female
IVV
IIIIII
Grade R.R. D.O.R. P.R.
VIIVI
# #
I - V
Enrolment by medium of instructions
Examination results
Retention rate
GPI
Primary cycle U. primary cycleState
DISTRICT ELEMENTARY EDUCATION REPORT CARD : 2005-06
GirlsGrade
IIIIIIIVVVI
VIII
AllGirls
Total
VII
% TotalGrossness
School category
3611
01
7 368 1100
01
0 0 0
205 07 4,8438 3,6200 00 1000 0
205 0 16,541 02,508 4,843 2,5083,084 3,620 3,084
0 0 0
0 0 00 100 0
16,541 0 649245
075
P + UP P+sec/hs U.P. only UP+sec
School categoryP. only
0.5 0.0 0.0 0.0 0.024.9
Number of Clusters 268194
% Schools with SCR > 602.3 0.0 0.0 0.0
2.0 2.3 0.0 0.0 0.0% Schools with pre-primary sections 80.5 58.1 94.7 0.0 0.0% Schools with common toilets 1.5 27.9 63.2 0.0 100.0
% Schools with girls toilets 0.0 7.0 47.4 0.0 100.0% Schools with drinking water facility 63.4 53.5 89.5 0.0 100.0
% Enrolment in Govt. schools 100.0 65.9 54.0 0.0 100.095.1 95.3 100.0 0.0 100.0
% No female teacher schools (tch>=2) 22.9 34.9 10.5 0.0 0.018.8 0.9 0.0 0.0 0.0
7.6 0.0 0.0 0.0 0.0%Enrolment in schools without blackboard 2.1 0.0 0.0 0.0 0.0
2001-02 2002-03 2003-04 2004-05 2005-06IIIIIIIVV
VIVII
Total U.P
8,6106,7804,3503,6303,0481,653
1,333
4,278
179.4
53.0
46.5
0.00.0
4,1583,2642,0521,7371,414
843675655
14,798
10565322323
184
261
8344252011
455
197
716
classrooms
335340
044
11.322.454.7
0.0100.0
15.918.5
72.8
26.20.00.0
59.119.1
0.00.0
7273
03
85 1 33 134 0 1 362 18 18 0 2 33 6 3 0 7 00 0 0 0 0 01 0 0 0 0 0
37 226 252 112 6 0 017 84 74 119 7 0 0 1918 16 56 126 12 0 0 5
0 0 0 0 0 0 0 00 0 4 8 0 0 0 0
0 0 0 0 0 0 0 0
428239157
08
6776
04
211 10 0 0 0 7 1 399 20714
000
0000
0000
0000
5600
0100
199122
05
6374
03
Terminalgrade Passed
VIII boysV girlsV boys
VIII girls
16 with >60%
25.2649320233
012
15.52.50.00.0
27.010.4
1.30.00.0
16271Others English Manipuri
71356704
0100
218216
000
520000
% Schools recvd.
98.565.131.6
0.00.0
100.079.131.6
0.00.0
0000
0000
0000
0000
3.27.4
12.30.0
12.0
0.92
2005-062004-052003-04
MANIPUR
32.6
Upper PrimaryPrimary
Sex ratio Sex ratio 0-6
4 32
VIII21.1
Enrolment of children
VIII 1,292Total Pr. 26,418
1 - 5 6 - 8
0 012 0
0 0
112 121
%Teachers recvd.in-service training
Total schools* Rural schools* Total enrolment* Rural enrolment* Teachers*
21.4 33.7
100.0
35.1% SC enrolment% SC girls to SC enrolment% ST enrolment
57.1 28.699.547.8 50.8 11.8 42.9
Position of teachers by educational qualification (other than para teacher)
(Previous academic year)Incentives : Number of beneficiaries
% ST girls to ST enrolment
% Girls
Number of villages
% 0 - 6 population
% SC population % ST population
% Urban population
% Schools with blackboard
% Enrolment in single-teacher schools
% Enrolment in schools without building
Primary Upperprimary
OBC EnrolmentPrimary U. Primary
% OBCEnrolment% OBC girls toOBC Enrolment
Pupil-teacher ratio (PTR)Student-classroom ratio (SCR)% Schools with <= 50 students% Schools with PTR > 100% Female teachers
% Schools established since 1995
Regular teachers Para-teachers
% minorrepairs
% majorrepairs
# = not applicable na = not available * Some totals may not match due to no response in classificatory data items
2029
48.22523
26.32.4
32.59.8
49.82322
7.02.3
20.914.0
0.000
0.00.00.00.0
48.082
0.00.0
33.30.0
29.2 na 95.4 59.2 49.0
936922na14.0
Category
PrivateGovt.PrivateGovtPrivateGovt.PrivateGovt.PrivateGovt.
Total population (in 000's)
Number of blocks/taluks
District
Decadal growth rate
Primary onlyPrimary with upper primaryPrimary with upper primary & sec/higher sec.Upper primary onlyUpper primary with sec./higher secondary
% Single classroom schools% Single teacher schools
P + UP P+sec/hs U.P. only UP+secP. only
No response in school category
Primary with upper primaryPrimary with U.P. & sec/higherUpper primary onlyUpper primary with sec./higher sec
Primary only
Primary onlyPrimary with upper primaryPrimary with Upper primary & sec/higherUpper primary only
Para-teachers
School category
Upper primary with sec./higher secondary
Primary onlyPrimary with upper prim.
P. onlyP + UPP+sec/hsU.P. onlyUP+sec
NER(U.Prim)GER(U.Prim)NER (Primary)GER (Primary)
Transition ratePrim. to U. Prim
98.7
SC/ST Enrolment
Indicators
Classrooms/Other rooms
Prim.with U.P.&Sec/H.SUpper Primary onlyU. Primary with Sec./H.S.
Basic Data, 2001
Data reported from
Performance indicators
90.1 29.391.1 30.987.1 33.490.9 34.6
Elementary Education in India - Where do we stand ?
Man
ipu
r
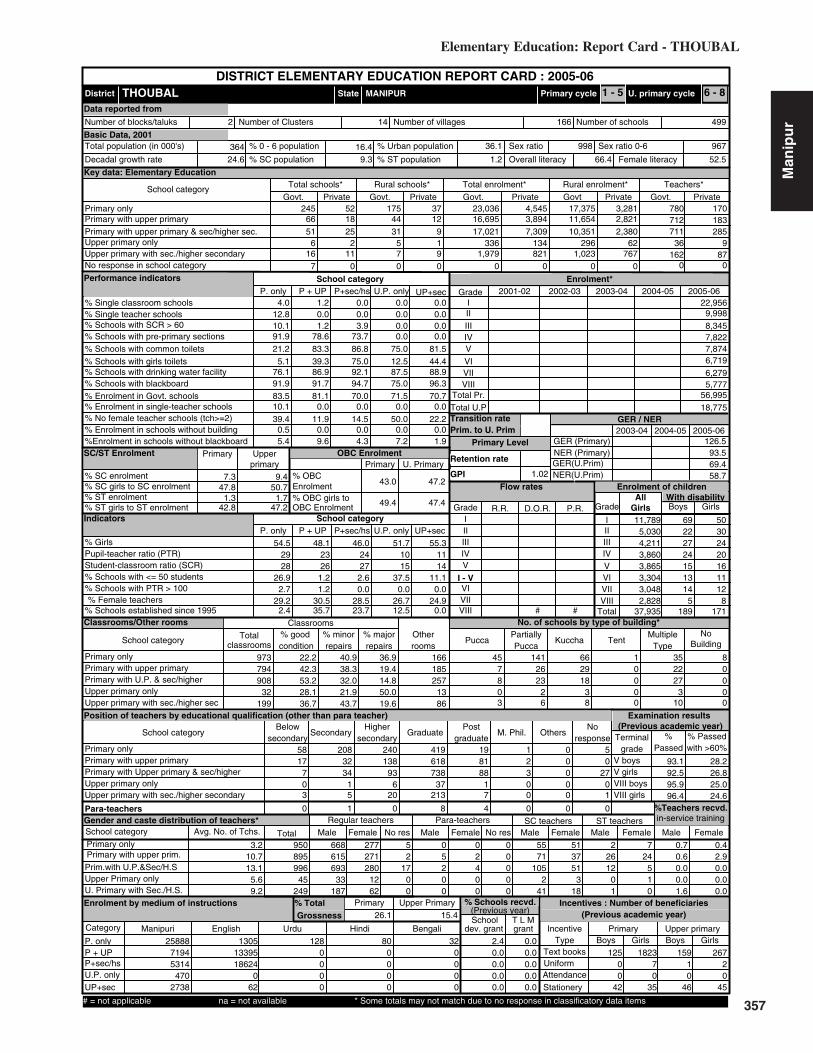
357
7.3 9.4
Key data: Elementary Education
364
THOUBAL
(Previous academic year)
(Previous year)
Gender and caste distribution of teachers*
No. of schools by type of building*
BoysWith disability
Flow rates
Primary Level
Enrolment*
Number of schools
Grade
GER / NER
School category
Primary Upper primaryBoys Boys GirlsGirls
IncentiveType
School categoryMultiple
TypeKuccha
PartiallyPucca
PuccaTotal % good condition
Otherrooms
TentNo
Building
Classrooms
Belowsecondary
Highersecondary
Postgraduate
M. Phil.GraduateSecondarySchool category OthersNo
response
ST teachers
Total Male Female No res Male Female No res Male Female Male FemaleSC teachers
Text booksUniformAttendanceStationery
% Passed
Avg. No. of Tchs.
%
Female literacyOverall literacy
dev. grant grantSchool T L M
Male Female
IVV
IIIIII
Grade R.R. D.O.R. P.R.
VIIVI
# #
I - V
Enrolment by medium of instructions
Examination results
Retention rate
GPI
Primary cycle U. primary cycleState
DISTRICT ELEMENTARY EDUCATION REPORT CARD : 2005-06
GirlsGrade
IIIIIIIVVVI
VIII
AllGirls
Total
VII
% TotalGrossness
School category
6651
616
18 4425 31
211
57
7 0 0
245 5212 16,695
9 17,0211 3369 1,9790 0
175 37 17,375 3,2813,894 11,654 2,8217,309 10,351 2,380
134 296 62
0 0 0821 1,023 767
23,036 4,545 780712
170183
P + UP P+sec/hs U.P. only UP+sec
School categoryP. only
4.0 1.2 0.0 0.0 0.012.8
Number of Clusters 499166
% Schools with SCR > 600.0 0.0 0.0 0.0
10.1 1.2 3.9 0.0 0.0% Schools with pre-primary sections 91.9 78.6 73.7 0.0 0.0% Schools with common toilets 21.2 83.3 86.8 75.0 81.5
% Schools with girls toilets 5.1 39.3 75.0 12.5 44.4% Schools with drinking water facility 76.1 86.9 92.1 87.5 88.9
% Enrolment in Govt. schools 83.5 81.1 70.0 71.5 70.791.9 91.7 94.7 75.0 96.3
% No female teacher schools (tch>=2) 39.4 11.9 14.5 50.0 22.210.1 0.0 0.0 0.0 0.0
0.5 0.0 0.0 0.0 0.0%Enrolment in schools without blackboard 5.4 9.6 4.3 7.2 1.9
2001-02 2002-03 2003-04 2004-05 2005-06IIIIIIIVV
VIVII
Total U.P
22,9569,9988,3457,8227,8746,719
6,279
18,775
126.5
69.4
46.0
2.60.0
11,7895,0304,2113,8603,8653,3043,0482,828
37,935
69222724151314
5189
50302420161112
8171
973
classrooms
794908
32199
22.242.353.228.136.7
40.938.3
36.9
32.021.943.7
19.414.850.019.6
185257
1386
166 45 141 66 1 35 87 26 29 0 22 08 23 18 0 27 00 2 3 0 3 03 6 8 0 10 0
58 208 240 419 19 1 017 32 138 618 81 2 0 0
7 34 93 738 88 3 0 270 1 6 37 1 0 0 03 5 20 213 7 0 0 1
0 1 0 8 4 0 0 0
668615693
33187
271280
1262
277 5 0 0 0 55 51 2 72
1700
5200
2400
0000
71105
241
3751
318
2612
01
24510
Terminalgrade Passed
VIII boysV girlsV boys
VIII girls
5 with >60%
0.7950895996
45249
0.60.00.01.6
0.42.90.00.00.0
25888Manipuri English Urdu Hindi Bengali
71945314
4702738
13051339518624
062
1280000
800000
320000
% Schools recvd.
2.40.00.00.00.0
0.00.00.00.00.0
12500
42
15910
46
182370
35
26720
45
3.210.713.1
5.69.2
1.02
2005-062004-052003-04
MANIPUR
28.5
Upper PrimaryPrimary
Sex ratio Sex ratio 0-6
2 14
VIII23.7
Enrolment of children
VIII 5,777Total Pr. 56,995
1 - 5 6 - 8
36 9162 87
0 0
711 285
%Teachers recvd.in-service training
Total schools* Rural schools* Total enrolment* Rural enrolment* Teachers*
26.1 15.4
93.5
58.7% SC enrolment% SC girls to SC enrolment% ST enrolment
47.8 50.71.3
42.8 47.2
43.0
49.4
47.2
47.4
Position of teachers by educational qualification (other than para teacher)
(Previous academic year)Incentives : Number of beneficiaries
% ST girls to ST enrolment
% Girls
Number of villages
% 0 - 6 population
% SC population % ST population
% Urban population
% Schools with blackboard
% Enrolment in single-teacher schools
% Enrolment in schools without building
Primary Upperprimary
OBC EnrolmentPrimary U. Primary
% OBCEnrolment% OBC girls toOBC Enrolment
Pupil-teacher ratio (PTR)Student-classroom ratio (SCR)% Schools with <= 50 students% Schools with PTR > 100% Female teachers
% Schools established since 1995
Regular teachers Para-teachers
% minorrepairs
% majorrepairs
# = not applicable na = not available * Some totals may not match due to no response in classificatory data items
2724
54.52928
26.92.7
29.22.4
48.12326
1.21.2
30.535.7
51.71015
37.50.0
26.712.5
55.31114
11.10.0
24.90.0
24.6 9.3 1.2 66.4 52.5
96799836.116.4
Category
PrivateGovt.PrivateGovtPrivateGovt.PrivateGovt.PrivateGovt.
Total population (in 000's)
Number of blocks/taluks
District
Decadal growth rate
Primary onlyPrimary with upper primaryPrimary with upper primary & sec/higher sec.Upper primary onlyUpper primary with sec./higher secondary
% Single classroom schools% Single teacher schools
P + UP P+sec/hs U.P. only UP+secP. only
No response in school category
Primary with upper primaryPrimary with U.P. & sec/higherUpper primary onlyUpper primary with sec./higher sec
Primary only
Primary onlyPrimary with upper primaryPrimary with Upper primary & sec/higherUpper primary only
Para-teachers
School category
Upper primary with sec./higher secondary
Primary onlyPrimary with upper prim.
P. onlyP + UPP+sec/hsU.P. onlyUP+sec
NER(U.Prim)GER(U.Prim)NER (Primary)GER (Primary)
Transition ratePrim. to U. Prim
1.7
SC/ST Enrolment
Indicators
Classrooms/Other rooms
Prim.with U.P.&Sec/H.SUpper Primary onlyU. Primary with Sec./H.S.
Basic Data, 2001
Data reported from
Performance indicators
93.1 28.292.5 26.895.9 25.096.4 24.6
Elementary Education: Report Card - THOUBAL
Man
ipu
r

358
0.3250.4760.0320.714
Key data: Elementary Education
141
UKHRUL
(Previous academic year)
(Previous year)
Gender and caste distribution of teachers*
No. of schools by type of building*
BoysWith disability
Flow rates
Primary Level
Enrolment*
Number of schools
Grade
GER / NER
School category
Primary Upper primaryBoys Boys GirlsGirls
IncentiveType
School categoryMultiple
TypeKuccha
PartiallyPucca
PuccaTotal % good condition
Otherrooms
TentNo
Building
Classrooms
Belowsecondary
Highersecondary
Postgraduate
M. Phil.GraduateSecondarySchool category OthersNo
response
ST teachers
Total Male Female No res Male Female No res Male Female Male FemaleSC teachers
Text booksUniformAttendanceStationery
% Passed
Avg. No. of Tchs.
%
Female literacyOverall literacy
dev. grant grantSchool T L M
Male Female
IVV
IIIIII
Grade R.R. D.O.R. P.R.
VIIVI
# #
I - V
Enrolment by medium of instructions
Examination results
Retention rate
GPI
Primary cycle U. primary cycleState
DISTRICT ELEMENTARY EDUCATION REPORT CARD : 2005-06
GirlsGrade
IIIIIIIVVVI
VIII
AllGirls
Total
VII
% TotalGrossness
School category
3325
20
1 330 2500
20
0 0 0
209 21 5,1680 4,6870 1690 00 0
208 2 13,624 127244 5,168 244
0 4,687 00 169 0
0 0 00 0 0
13,683 127 590267
414
P + UP P+sec/hs U.P. only UP+sec
School categoryP. only
0.9 0.0 0.0 0.0 0.018.0
Number of Clusters 272195
% Schools with SCR > 600.0 0.0 0.0 0.0
0.9 2.9 4.0 0.0 0.0% Schools with pre-primary sections 55.9 70.6 64.0 0.0 0.0% Schools with common toilets 3.8 14.7 12.0 50.0 0.0
% Schools with girls toilets 0.0 2.9 0.0 50.0 0.0% Schools with drinking water facility 50.2 50.0 48.0 50.0 0.0
% Enrolment in Govt. schools 99.1 95.5 100.0 100.0 0.067.8 79.4 72.0 100.0 0.0
% No female teacher schools (tch>=2) 33.6 23.5 12.0 50.0 0.013.9 0.0 0.0 0.0 0.0
2.1 2.2 0.0 0.0 0.0%Enrolment in schools without blackboard 29.1 21.2 25.7 0.0 0.0
2001-02 2002-03 2003-04 2004-05 2005-06IIIIIIIVV
VIVII
Total U.P
7,5835,2163,2342,7332,2331,127
1,038
3,079
112.8
29.0
52.3
0.00.0
3,7812,5471,6061,3761,154
579541478
12,062
169102
97383610
87
467
15594522714
313
349
713
classrooms
244243
90
4.91.2
12.80.00.0
19.516.4
75.6
22.60.00.0
82.464.6
100.00.0
6171
30
145 7 47 132 0 1 231 9 20 0 3 12 13 4 0 6 00 0 2 0 0 00 0 0 0 0 0
58 179 171 95 2 0 08 77 63 74 10 0 0 25
11 78 69 56 2 0 1 330 0 4 14 0 0 0 10 0 0 0 0 0 0 0
2 22 14 7 1 0 0 0
345180153
170
5373
20
183 44 12 10 0 9 1 341 1882424
00
12200
11000
1000
7010
1000
155133
120
5669
20
Terminalgrade Passed
VIII boysV girlsV boys
VIII girls
67 with >60%
9.0594281252
190
8.910.3
0.00.0
7.86.35.50.00.0
7697Others English Manipuri Hindi Mizo
29362020
970
462221902435
470
2339867
125625
0
942544605
00
640000
% Schools recvd.
4.30.08.00.00.0
22.335.328.050.0
0.0
1070900
55
707000
1086000
59
707000
2.88.3
10.19.50.0
0.99
2005-062004-052003-04
MANIPUR
29.0
Upper PrimaryPrimary
Sex ratio Sex ratio 0-6
5 20
VIII0.0
Enrolment of children
VIII 914Total Pr. 20,999
1 - 5 6 - 8
19 00 00 0
252 0
%Teachers recvd.in-service training
Total schools* Rural schools* Total enrolment* Rural enrolment* Teachers*
24.0 26.6
85.7
21.3% SC enrolment% SC girls to SC enrolment% ST enrolment
50.0 0.098.549.9 52.1 45.0 30.0
Position of teachers by educational qualification (other than para teacher)
(Previous academic year)Incentives : Number of beneficiaries
% ST girls to ST enrolment
% Girls
Number of villages
% 0 - 6 population
% SC population % ST population
% Urban population
% Schools with blackboard
% Enrolment in single-teacher schools
% Enrolment in schools without building
Primary Upperprimary
OBC EnrolmentPrimary U. Primary
% OBCEnrolment% OBC girls toOBC Enrolment
Pupil-teacher ratio (PTR)Student-classroom ratio (SCR)% Schools with <= 50 students% Schools with PTR > 100% Female teachers
% Schools established since 1995
Regular teachers Para-teachers
% minorrepairs
% majorrepairs
# = not applicable na = not available * Some totals may not match due to no response in classificatory data items
1919
49.82319
39.31.4
32.57.6
48.91922
0.00.0
22.82.9
45.69
190.00.0
10.50.0
0.000
0.00.00.00.0
29.0 na 95.5 73.1 65.4
946916na14.9
Category
PrivateGovt.PrivateGovtPrivateGovt.PrivateGovt.PrivateGovt.
Total population (in 000's)
Number of blocks/taluks
District
Decadal growth rate
Primary onlyPrimary with upper primaryPrimary with upper primary & sec/higher sec.Upper primary onlyUpper primary with sec./higher secondary
% Single classroom schools% Single teacher schools
P + UP P+sec/hs U.P. only UP+secP. only
No response in school category
Primary with upper primaryPrimary with U.P. & sec/higherUpper primary onlyUpper primary with sec./higher sec
Primary only
Primary onlyPrimary with upper primaryPrimary with Upper primary & sec/higherUpper primary only
Para-teachers
School category
Upper primary with sec./higher secondary
Primary onlyPrimary with upper prim.
P. onlyP + UPP+sec/hsU.P. onlyUP+sec
NER(U.Prim)GER(U.Prim)NER (Primary)GER (Primary)
Transition ratePrim. to U. Prim
99.0
SC/ST Enrolment
Indicators
Classrooms/Other rooms
Prim.with U.P.&Sec/H.SUpper Primary onlyU. Primary with Sec./H.S.
Basic Data, 2001
Data reported from
Performance indicators
87.9 19.288.5 21.387.7 14.780.3 14.3
Elementary Education in India - Where do we stand ?
Man
ipu
r

359
0.3360.4220.2450.432
Key data: Elementary Education
251
EAST GARO HILLS
(Previous academic year)
(Previous year)
Gender and caste distribution of teachers*
No. of schools by type of building*
BoysWith disability
Flow rates
Primary Level
Enrolment*
Number of schools
Grade
GER / NER
School category
Primary Upper primaryBoys Boys GirlsGirls
IncentiveType
School categoryMultiple
TypeKuccha
PartiallyPucca
PuccaTotal % good condition
Otherrooms
TentNo
Building
Classrooms
Belowsecondary
Highersecondary
Postgraduate
M. Phil.GraduateSecondarySchool category OthersNo
response
ST teachers
Total Male Female No res Male Female No res Male Female Male FemaleSC teachers
Text booksUniformAttendanceStationery
% Passed
Avg. No. of Tchs.
%
Female literacyOverall literacy
dev. grant grantSchool T L M
Male Female
IVV
IIIIII
Grade R.R. D.O.R. P.R.
VIIVI
I - V
Enrolment by medium of instructions
Examination results
Retention rate
GPI
Primary cycle U. primary cycleState
DISTRICT ELEMENTARY EDUCATION REPORT CARD : 2005-06
GirlsGrade
IIIIIIIVVVI
VIII
AllGirls
Total
VII
% TotalGrossness
School category
155
1125
12 125 4
514
1074
0 0 0
763 1299 1,0611 1,078
45 8,4783 9290 0
717 124 29,367 4,8162,666 860 1,9011,475 859 5073,289 7,926 2,579
0 0 0627 845 550
32,783 5,039 1,69196
257119
P + UP P+sec/hs U.P. only UP+sec
School categoryP. only
28.4 0.0 0.0 1.8 0.013.3
Number of Clusters 1101871
% Schools with SCR > 600.0 0.0 0.6 0.0
5.4 0.0 0.0 1.8 11.1% Schools with pre-primary sections 88.9 74.1 80.0 10.4 0.0% Schools with common toilets 12.6 48.1 60.0 28.8 100.0
% Schools with girls toilets 2.7 37.0 60.0 12.9 77.8% Schools with drinking water facility 34.6 37.0 50.0 38.0 66.7
% Enrolment in Govt. schools 86.7 28.5 42.2 72.0 59.792.6 85.2 80.0 91.4 100.0
% No female teacher schools (tch>=2) 35.8 11.1 0.0 39.9 22.210.1 0.0 0.0 0.0 0.0
0.0 0.0 0.0 0.0 0.0%Enrolment in schools without blackboard 4.0 4.3 13.9 4.4 0.0
2001-02 2002-03 2003-04 2004-05 2005-06IIIIIIIVV
VIVII
Total U.P
17,7169,8227,9876,4045,9935,145
4,358
21,85812,67410,673
8,8067,875
6,4925,653
20,98810,384
8,6186,5846,298
5,0264,157
136.7
41.3
155.2
53.0
131.3
88.9
49.9
20.00.0
8,8624,8364,0203,2133,0402,5892,223
8450101
3301112
1,814
classrooms
16381
54556
15.223.343.214.525.0
45.748.5
39.1
48.140.742.9
28.28.6
44.832.1
4120
18717
291 193 428 217 0 12 4210 10 3 0 1 3
7 0 0 0 2 138 83 34 0 2 6
3 6 0 0 0 0
201 1,202 469 64 5 0 02 36 124 49 4 0 0 01 19 37 35 2 0 0 05 190 390 164 7 0 0 100 18 23 23 1 0 0 0
0 3 1 0 0 0 0 0
1273109
39599
49
10655
15716
667 5 1 2 0 2 0 1261 66400
100
0000
0010
0000
122
391
6010
8928
50236
8753
14615
Terminalgrade Passed
VII boysV girlsV boys
VII girls
4 with >60%
1.21948215
94767
65
0.00.00.20.0
1.00.00.00.00.0
34453Garo English Assamese
241574612
60
148834041979
111071496
188100
480
% Schools recvd.
77.451.950.081.022.2
53.922.220.051.511.1
1594304
512031
1589206
548021
2.28.09.44.77.2
6.35.44.74.0
4.94.4
5.85.4
2005-062004-052003-04
MEGHALAYA
58.5
Upper PrimaryPrimary
Sex ratio Sex ratio 0-6
5 42
VIII0.0
Enrolment of children
VIIITotal Pr.
531 23643 22
0 0
38 56
%Teachers recvd.in-service training
Total schools* Rural schools* Total enrolment* Rural enrolment* Teachers*
20.3 68.8
100.0
27.8
91.8
28.0 33.2% SC enrolment% SC girls to SC enrolment% ST enrolment
47.5 39.5113.1
50.1 50.7 46.9 50.0
Position of teachers by educational qualification (other than para teacher)
(Previous academic year)Incentives : Number of beneficiaries
% ST girls to ST enrolment
% Girls
Number of villages
% 0 - 6 population
% SC population % ST population
% Urban population
% Schools with blackboard
% Enrolment in single-teacher schools
% Enrolment in schools without building
Primary Upperprimary
OBC EnrolmentPrimary U. Primary
% OBCEnrolment% OBC girls toOBC Enrolment
Pupil-teacher ratio (PTR)Student-classroom ratio (SCR)% Schools with <= 50 students% Schools with PTR > 100% Female teachers
% Schools established since 1995
Regular teachers Para-teachers
% minorrepairs
% majorrepairs
# = not applicable na = not available * Some totals may not match due to no response in classificatory data items
51.9 41.835.6 59.038.5 56.733.2 62.932.9 61.341.2 53.431.7 63.3
3227
49.81921
72.40.1
34.335.7
51.31723
29.60.0
49.340.7
50.51522
46.00.0
20.647.9
52.12428
0.00.0
24.60.0
31.1 0.1 96.5 60.6 54.9
97196614.320.4
Category
PrivateGovt.PrivateGovtPrivateGovt.PrivateGovt.PrivateGovt.
Total population (in 000's)
Number of blocks/taluks
District
Decadal growth rate
Primary onlyPrimary with upper primaryPrimary with upper primary & sec/higher sec.Upper primary onlyUpper primary with sec./higher secondary
% Single classroom schools% Single teacher schools
P + UP P+sec/hs U.P. only UP+secP. only
No response in school category
Primary with upper primaryPrimary with U.P. & sec/higherUpper primary onlyUpper primary with sec./higher sec
Primary only
Primary onlyPrimary with upper primaryPrimary with Upper primary & sec/higherUpper primary only
Para-teachers
School category
Upper primary with sec./higher secondary
Primary onlyPrimary with upper prim.
P. onlyP + UPP+sec/hsU.P. onlyUP+sec
NER(U.Prim)GER(U.Prim)NER (Primary)GER (Primary)
Transition ratePrim. to U. Prim
60.4
Performance indicators
SC/ST Enrolment
Indicators
Classrooms/Other rooms
Prim.with U.P.&Sec/H.SUpper Primary onlyU. Primary with Sec./H.S.
Basic Data, 2001
Data reported from
15,481 20,020 15,496
0
0 00
62.9
1.00
# ## #
# 28,783 19 11Total
1 - 4 5 - 7
46,574 54,011 41,929
90.8 12.590.3 12.387.9 10.385.8 8.7
Elementary Education: Report Card - EAST GARO HILLS
Meg
hal
aya
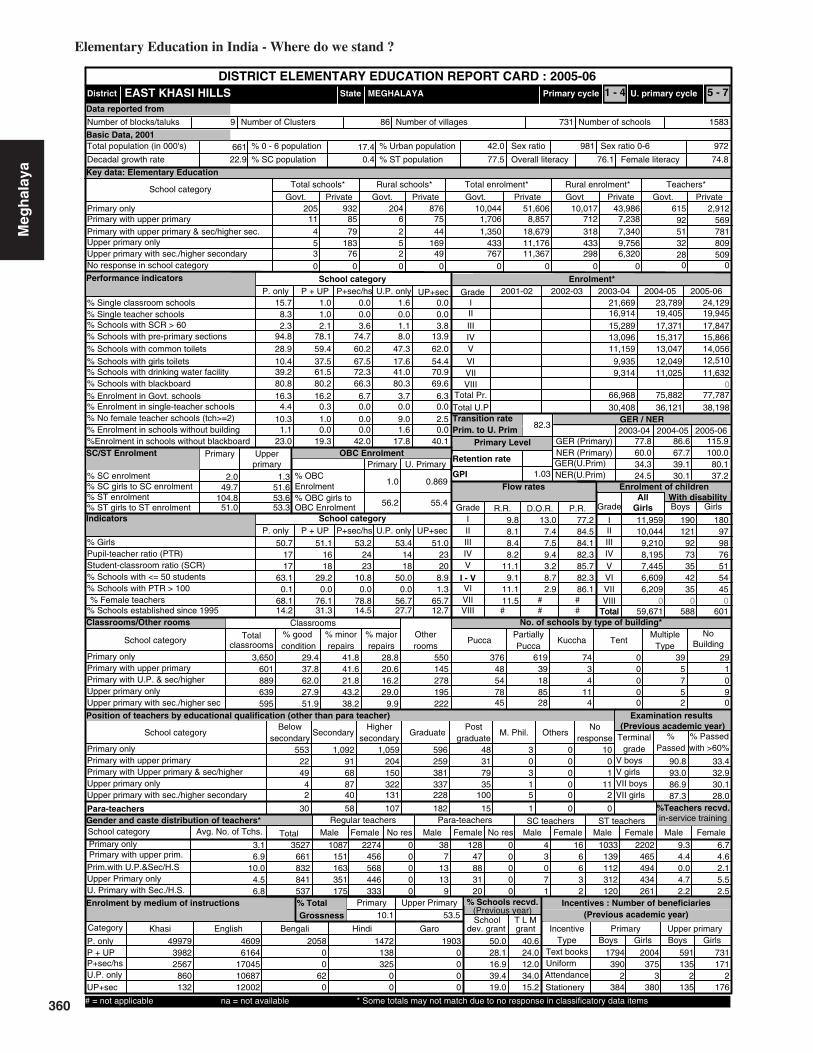
360
0.8692.0 1.3
Key data: Elementary Education
661
EAST KHASI HILLS
(Previous academic year)
(Previous year)
Gender and caste distribution of teachers*
No. of schools by type of building*
BoysWith disability
Flow rates
Primary Level
Enrolment*
Number of schools
Grade
GER / NER
School category
Primary Upper primaryBoys Boys GirlsGirls
IncentiveType
School categoryMultiple
TypeKuccha
PartiallyPucca
PuccaTotal % good condition
Otherrooms
TentNo
Building
Classrooms
Belowsecondary
Highersecondary
Postgraduate
M. Phil.GraduateSecondarySchool category OthersNo
response
ST teachers
Total Male Female No res Male Female No res Male Female Male FemaleSC teachers
Text booksUniformAttendanceStationery
% Passed
Avg. No. of Tchs.
%
Female literacyOverall literacy
dev. grant grantSchool T L M
Male Female
IVV
IIIIII
Grade R.R. D.O.R. P.R.
VIIVI
I - V
Enrolment by medium of instructions
Examination results
Retention rate
GPI
Primary cycle U. primary cycleState
DISTRICT ELEMENTARY EDUCATION REPORT CARD : 2005-06
GirlsGrade
IIIIIIIVVVI
VIII
AllGirls
Total
VII
% TotalGrossness
School category
11453
85 679 2
18376
52
0 0 0
205 93275 1,70644 1,350
169 43349 767
0 0
204 876 10,017 43,9868,857 712 7,238
18,679 318 7,34011,176 433 9,756
0 0 011,367 298 6,320
10,044 51,606 61592
2,912569
P + UP P+sec/hs U.P. only UP+sec
School categoryP. only
15.7 1.0 0.0 1.6 0.08.3
Number of Clusters 1583731
% Schools with SCR > 601.0 0.0 0.0 0.0
2.3 2.1 3.6 1.1 3.8% Schools with pre-primary sections 94.8 78.1 74.7 8.0 13.9% Schools with common toilets 28.9 59.4 60.2 47.3 62.0
% Schools with girls toilets 10.4 37.5 67.5 17.6 54.4% Schools with drinking water facility 39.2 61.5 72.3 41.0 70.9
% Enrolment in Govt. schools 16.3 16.2 6.7 3.7 6.380.8 80.2 66.3 80.3 69.6
% No female teacher schools (tch>=2) 10.3 1.0 0.0 9.0 2.54.4 0.3 0.0 0.0 0.0
1.1 0.0 0.0 1.6 0.0%Enrolment in schools without blackboard 23.0 19.3 42.0 17.8 40.1
2001-02 2002-03 2003-04 2004-05 2005-06IIIIIIIVV
VIVII
Total U.P
24,12919,94517,84715,86614,05612,510
11,632
23,78919,40517,37115,31713,047
12,04911,025
21,66916,91415,28913,09611,159
9,9359,314
77.8
34.3
86.6
39.1
115.9
80.1
53.2
10.80.0
11,95910,044
9,2108,1957,4456,6096,209
190121
9273354235
180979876515445
3,650
classrooms
601889639595
29.437.862.027.951.9
41.841.6
28.8
21.843.238.2
20.616.229.0
9.9
145278195222
550 376 619 74 0 39 2948 39 3 0 5 154 18 4 0 7 078 85 11 0 5 945 28 4 0 2 0
553 1,092 1,059 596 48 3 022 91 204 259 31 0 0 049 68 150 381 79 3 0 1
4 87 322 337 35 1 0 112 40 131 228 100 5 0 2
30 58 107 182 15 1 0 0
1087151163351175
456568446333
2274 0 38 128 0 4 16 1033 22020000
71313
9
47883120
0000
3071
6632
139112312120
465494434261
Terminalgrade Passed
VII boysV girlsV boys
VII girls
10 with >60%
9.33527661832841537
4.40.04.72.2
6.74.62.15.52.5
49979Khasi English Bengali Hindi Garo
39822567
860132
46096164
170451068712002
205800
620
1472138325
00
19030000
% Schools recvd.
50.028.116.939.419.0
40.624.012.034.015.2
1794390
2384
591135
2135
2004375
3380
731171
2176
3.16.9
10.04.56.8
9.88.18.48.2
11.111.5
11.19.1
2005-062004-052003-04
MEGHALAYA
78.8
Upper PrimaryPrimary
Sex ratio Sex ratio 0-6
9 86
VIII14.5
Enrolment of children
VIIITotal Pr.
32 80928 509
0 0
51 781
%Teachers recvd.in-service training
Total schools* Rural schools* Total enrolment* Rural enrolment* Teachers*
10.1 53.5
100.0
37.2
60.0 67.7
24.5 30.1% SC enrolment% SC girls to SC enrolment% ST enrolment
49.7 51.6104.8
51.0 53.3
1.0
56.2 55.4
Position of teachers by educational qualification (other than para teacher)
(Previous academic year)Incentives : Number of beneficiaries
% ST girls to ST enrolment
% Girls
Number of villages
% 0 - 6 population
% SC population % ST population
% Urban population
% Schools with blackboard
% Enrolment in single-teacher schools
% Enrolment in schools without building
Primary Upperprimary
OBC EnrolmentPrimary U. Primary
% OBCEnrolment% OBC girls toOBC Enrolment
Pupil-teacher ratio (PTR)Student-classroom ratio (SCR)% Schools with <= 50 students% Schools with PTR > 100% Female teachers
% Schools established since 1995
Regular teachers Para-teachers
% minorrepairs
% majorrepairs
# = not applicable na = not available * Some totals may not match due to no response in classificatory data items
13.0 77.27.4 84.57.5 84.19.4 82.33.2 85.78.7 82.32.9 86.1
2324
50.71717
63.10.1
68.114.2
51.11618
29.20.0
76.131.3
53.41418
50.00.0
56.727.7
51.02320
8.91.3
65.712.7
22.9 0.4 77.5 76.1 74.8
97298142.017.4
Category
PrivateGovt.PrivateGovtPrivateGovt.PrivateGovt.PrivateGovt.
Total population (in 000's)
Number of blocks/taluks
District
Decadal growth rate
Primary onlyPrimary with upper primaryPrimary with upper primary & sec/higher sec.Upper primary onlyUpper primary with sec./higher secondary
% Single classroom schools% Single teacher schools
P + UP P+sec/hs U.P. only UP+secP. only
No response in school category
Primary with upper primaryPrimary with U.P. & sec/higherUpper primary onlyUpper primary with sec./higher sec
Primary only
Primary onlyPrimary with upper primaryPrimary with Upper primary & sec/higherUpper primary only
Para-teachers
School category
Upper primary with sec./higher secondary
Primary onlyPrimary with upper prim.
P. onlyP + UPP+sec/hsU.P. onlyUP+sec
NER(U.Prim)GER(U.Prim)NER (Primary)GER (Primary)
Transition ratePrim. to U. Prim
53.6
Performance indicators
SC/ST Enrolment
Indicators
Classrooms/Other rooms
Prim.with U.P.&Sec/H.SUpper Primary onlyU. Primary with Sec./H.S.
Basic Data, 2001
Data reported from
30,408 36,121 38,198
0
0 00
82.3
1.03
# ## #
# 59,671 588 601Total
1 - 4 5 - 7
66,968 75,882 77,787
90.8 33.493.0 32.986.9 30.187.3 28.0
Elementary Education in India - Where do we stand ?
Meg
hal
aya
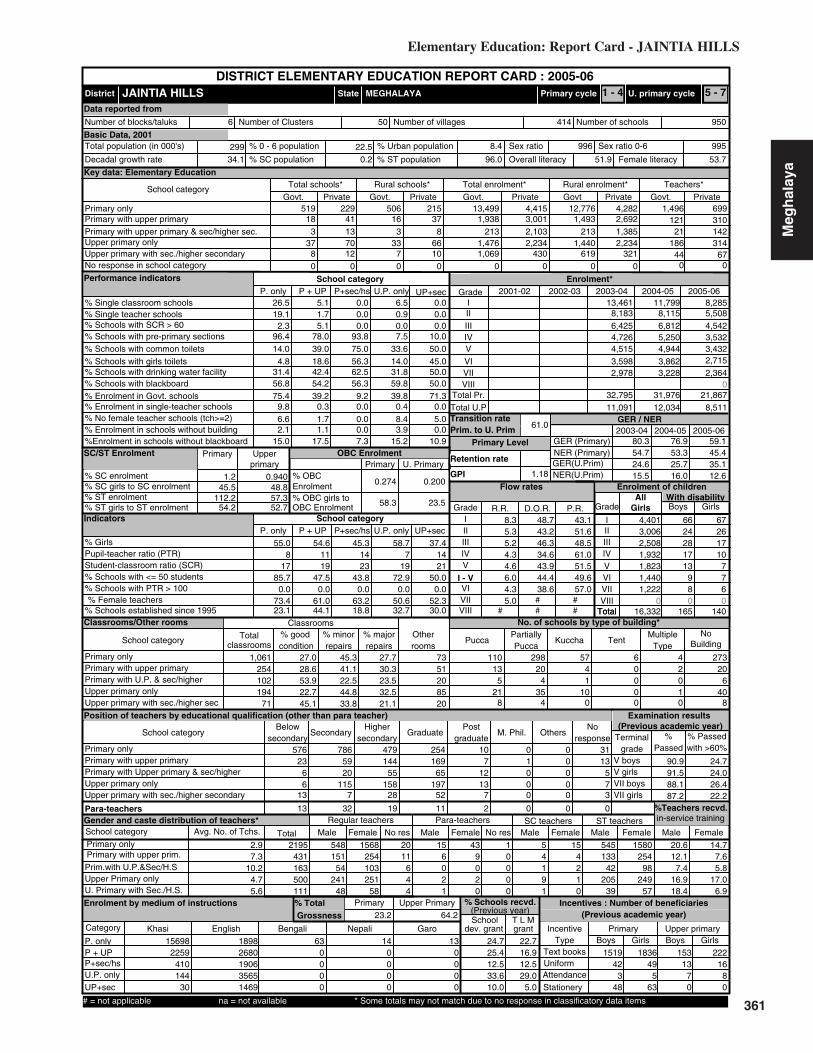
361
0.2000.2741.2 0.940
Key data: Elementary Education
299
JAINTIA HILLS
(Previous academic year)
(Previous year)
Gender and caste distribution of teachers*
No. of schools by type of building*
BoysWith disability
Flow rates
Primary Level
Enrolment*
Number of schools
Grade
GER / NER
School category
Primary Upper primaryBoys Boys GirlsGirls
IncentiveType
School categoryMultiple
TypeKuccha
PartiallyPucca
PuccaTotal % good condition
Otherrooms
TentNo
Building
Classrooms
Belowsecondary
Highersecondary
Postgraduate
M. Phil.GraduateSecondarySchool category OthersNo
response
ST teachers
Total Male Female No res Male Female No res Male Female Male FemaleSC teachers
Text booksUniformAttendanceStationery
% Passed
Avg. No. of Tchs.
%
Female literacyOverall literacy
dev. grant grantSchool T L M
Male Female
IVV
IIIIII
Grade R.R. D.O.R. P.R.
VIIVI
I - V
Enrolment by medium of instructions
Examination results
Retention rate
GPI
Primary cycle U. primary cycleState
DISTRICT ELEMENTARY EDUCATION REPORT CARD : 2005-06
GirlsGrade
IIIIIIIVVVI
VIII
AllGirls
Total
VII
% TotalGrossness
School category
183
378
41 1613 37012
337
0 0 0
519 22937 1,938
8 21366 1,47610 1,069
0 0
506 215 12,776 4,2823,001 1,493 2,6922,103 213 1,3852,234 1,440 2,234
0 0 0430 619 321
13,499 4,415 1,496121
699310
P + UP P+sec/hs U.P. only UP+sec
School categoryP. only
26.5 5.1 0.0 6.5 0.019.1
Number of Clusters 950414
% Schools with SCR > 601.7 0.0 0.9 0.0
2.3 5.1 0.0 0.0 0.0% Schools with pre-primary sections 96.4 78.0 93.8 7.5 10.0% Schools with common toilets 14.0 39.0 75.0 33.6 50.0
% Schools with girls toilets 4.8 18.6 56.3 14.0 45.0% Schools with drinking water facility 31.4 42.4 62.5 31.8 50.0
% Enrolment in Govt. schools 75.4 39.2 9.2 39.8 71.356.8 54.2 56.3 59.8 50.0
% No female teacher schools (tch>=2) 6.6 1.7 0.0 8.4 5.09.8 0.3 0.0 0.4 0.0
2.1 1.1 0.0 3.9 0.0%Enrolment in schools without blackboard 15.0 17.5 7.3 15.2 10.9
2001-02 2002-03 2003-04 2004-05 2005-06IIIIIIIVV
VIVII
Total U.P
8,2855,5084,5423,5323,4322,715
2,364
11,7998,1156,8125,2504,944
3,8623,228
13,4618,1836,4254,7264,515
3,5982,978
80.3
24.6
76.9
25.7
59.1
35.1
45.3
43.80.0
4,4013,0062,5081,9321,8231,4401,222
6624281713
98
67261710
776
1,061
classrooms
254102194
71
27.028.653.922.745.1
45.341.1
27.7
22.544.833.8
30.323.532.521.1
51208520
73 110 298 57 6 4 27313 20 4 0 2 20
5 4 1 0 0 621 35 10 0 1 40
8 4 0 0 0 8
576 786 479 254 10 0 023 59 144 169 7 1 0 13
6 20 55 65 12 0 0 56 115 158 197 13 0 0 7
13 7 28 52 7 0 0 3
13 32 19 11 2 0 0 0
548151
54241
48
254103251
58
1568 20 15 43 1 5 15 545 158011
644
6021
9020
0000
4191
4210
13342
20539
25498
24957
Terminalgrade Passed
VII boysV girlsV boys
VII girls
31 with >60%
20.62195431163500111
12.17.4
16.918.4
14.77.65.8
17.06.9
15698Khasi English Bengali Nepali Garo
2259410144
30
18982680190635651469
630000
140000
130000
% Schools recvd.
24.725.412.533.610.0
22.716.912.529.0
5.0
151942
348
15313
70
183649
563
22216
80
2.97.3
10.24.75.6
8.35.35.24.3
4.35.0
4.66.0
2005-062004-052003-04
MEGHALAYA
63.2
Upper PrimaryPrimary
Sex ratio Sex ratio 0-6
6 50
VIII18.8
Enrolment of children
VIIITotal Pr.
186 31444 67
0 0
21 142
%Teachers recvd.in-service training
Total schools* Rural schools* Total enrolment* Rural enrolment* Teachers*
23.2 64.2
45.4
12.6
54.7 53.3
15.5 16.0% SC enrolment% SC girls to SC enrolment% ST enrolment
45.5 48.8112.2
54.2 52.7 58.3 23.5
Position of teachers by educational qualification (other than para teacher)
(Previous academic year)Incentives : Number of beneficiaries
% ST girls to ST enrolment
% Girls
Number of villages
% 0 - 6 population
% SC population % ST population
% Urban population
% Schools with blackboard
% Enrolment in single-teacher schools
% Enrolment in schools without building
Primary Upperprimary
OBC EnrolmentPrimary U. Primary
% OBCEnrolment% OBC girls toOBC Enrolment
Pupil-teacher ratio (PTR)Student-classroom ratio (SCR)% Schools with <= 50 students% Schools with PTR > 100% Female teachers
% Schools established since 1995
Regular teachers Para-teachers
% minorrepairs
% majorrepairs
# = not applicable na = not available * Some totals may not match due to no response in classificatory data items
48.7 43.143.2 51.646.3 48.534.6 61.043.9 51.544.4 49.638.6 57.0
2314
55.08
1785.7
0.073.423.1
54.61119
47.50.0
61.044.1
58.77
1972.9
0.050.632.7
37.41421
50.00.0
52.330.0
34.1 0.2 96.0 51.9 53.7
9959968.422.5
Category
PrivateGovt.PrivateGovtPrivateGovt.PrivateGovt.PrivateGovt.
Total population (in 000's)
Number of blocks/taluks
District
Decadal growth rate
Primary onlyPrimary with upper primaryPrimary with upper primary & sec/higher sec.Upper primary onlyUpper primary with sec./higher secondary
% Single classroom schools% Single teacher schools
P + UP P+sec/hs U.P. only UP+secP. only
No response in school category
Primary with upper primaryPrimary with U.P. & sec/higherUpper primary onlyUpper primary with sec./higher sec
Primary only
Primary onlyPrimary with upper primaryPrimary with Upper primary & sec/higherUpper primary only
Para-teachers
School category
Upper primary with sec./higher secondary
Primary onlyPrimary with upper prim.
P. onlyP + UPP+sec/hsU.P. onlyUP+sec
NER(U.Prim)GER(U.Prim)NER (Primary)GER (Primary)
Transition ratePrim. to U. Prim
57.3
Performance indicators
SC/ST Enrolment
Indicators
Classrooms/Other rooms
Prim.with U.P.&Sec/H.SUpper Primary onlyU. Primary with Sec./H.S.
Basic Data, 2001
Data reported from
11,091 12,034 8,511
0
0 00
61.0
1.18
# ## #
# 16,332 165 140Total
1 - 4 5 - 7
32,795 31,976 21,867
90.9 24.791.5 24.088.1 26.487.2 22.2
Elementary Education: Report Card - JAINTIA HILLS
Meg
hal
aya

362
1.2 0.808
Key data: Elementary Education
193
RI BHOI
(Previous academic year)
(Previous year)
Gender and caste distribution of teachers*
No. of schools by type of building*
BoysWith disability
Flow rates
Primary Level
Enrolment*
Number of schools
Grade
GER / NER
School category
Primary Upper primaryBoys Boys GirlsGirls
IncentiveType
School categoryMultiple
TypeKuccha
PartiallyPucca
PuccaTotal % good condition
Otherrooms
TentNo
Building
Classrooms
Belowsecondary
Highersecondary
Postgraduate
M. Phil.GraduateSecondarySchool category OthersNo
response
ST teachers
Total Male Female No res Male Female No res Male Female Male FemaleSC teachers
Text booksUniformAttendanceStationery
% Passed
Avg. No. of Tchs.
%
Female literacyOverall literacy
dev. grant grantSchool T L M
Male Female
IVV
IIIIII
Grade R.R. D.O.R. P.R.
VIIVI
I - V
Enrolment by medium of instructions
Examination results
Retention rate
GPI
Primary cycle U. primary cycleState
DISTRICT ELEMENTARY EDUCATION REPORT CARD : 2005-06
GirlsGrade
IIIIIIIVVVI
VIII
AllGirls
Total
VII
% TotalGrossness
School category
104
132
54 721 458
813
20 0 0
197 29452 39520 16657 391
7 1700 0
188 287 7,588 10,2604,863 336 4,5143,332 166 3,3323,394 391 3,121
0 0 01,826 170 1,475
7,989 10,463 45160
719321
P + UP P+sec/hs U.P. only UP+sec
School categoryP. only
13.0 4.7 0.0 4.2 10.014.1
Number of Clusters 661470
% Schools with SCR > 600.0 0.0 0.0 0.0
1.4 1.6 0.0 1.4 20.0% Schools with pre-primary sections 87.0 82.8 84.0 14.1 60.0% Schools with common toilets 17.3 35.9 68.0 36.6 100.0
% Schools with girls toilets 4.3 10.9 32.0 15.5 60.0% Schools with drinking water facility 31.0 50.0 60.0 35.2 80.0
% Enrolment in Govt. schools 43.3 7.5 4.7 10.3 8.571.9 79.7 68.0 81.7 80.0
% No female teacher schools (tch>=2) 23.2 6.3 4.0 18.3 10.04.5 0.0 0.0 0.0 0.0
0.2 0.0 0.0 2.9 0.0%Enrolment in schools without blackboard 8.0 4.3 11.5 26.1 0.0
2001-02 2002-03 2003-04 2004-05 2005-06IIIIIIIVV
VIVII
Total U.P
8,6786,1435,0584,3203,6352,801
2,354
8,4585,7915,1134,0363,419
2,6532,162
9,4026,3885,3814,1083,551
2,7532,225
93.2
28.0
82.4
25.8
103.5
61.0
50.5
24.00.0
4,2973,0512,5442,2531,8951,4861,236
112633226221317
82433018121011
1,088
classrooms
277181198
45
19.918.426.529.855.6
48.155.6
32.0
44.232.326.7
26.029.337.917.8
74337517
141 104 222 34 1 13 11717 28 3 0 4 12
6 8 1 0 4 619 26 14 0 2 10
4 3 0 0 1 2
254 300 300 97 7 0 229 82 126 66 6 0 0 10
9 33 62 61 0 2 0 510 34 111 72 7 0 0 9
0 7 16 25 4 0 1 28
51 59 113 80 8 0 1 0
511159
80143
29
15489
10029
492 4 55 107 1 13 11 526 580630
23
251221
3
373328
3
0010
2066
2131
14466
13323
177114121
30
Terminalgrade Passed
VII boysV girlsV boys
VII girls
47 with >60%
3.21170381217293
87
1.10.00.60.0
1.32.10.03.10.0
13658Khasi English Garo Assamese Nepali
1901753583204
34232765247930321792
819161
089
0
4000
5720
0
152257
000
% Schools recvd.
51.746.940.054.910.0
44.451.640.052.130.0
144464051
750
12
171847583
9507
2.46.08.74.18.7
19.416.813.712.5
15.715.8
17.916.5
2005-062004-052003-04
MEGHALAYA
56.2
Upper PrimaryPrimary
Sex ratio Sex ratio 0-6
3 31
VIII36.0
Enrolment of children
VIIITotal Pr.
57 23617 70
0 0
24 193
%Teachers recvd.in-service training
Total schools* Rural schools* Total enrolment* Rural enrolment* Teachers*
24.8 68.1
77.8
19.4
60.3 52.2
17.6 14.1% SC enrolment% SC girls to SC enrolment% ST enrolment
45.0 46.5109.8
50.7 53.4
1.0
49.6
1.5
51.5
Position of teachers by educational qualification (other than para teacher)
(Previous academic year)Incentives : Number of beneficiaries
% ST girls to ST enrolment
% Girls
Number of villages
% 0 - 6 population
% SC population % ST population
% Urban population
% Schools with blackboard
% Enrolment in single-teacher schools
% Enrolment in schools without building
Primary Upperprimary
OBC EnrolmentPrimary U. Primary
% OBCEnrolment% OBC girls toOBC Enrolment
Pupil-teacher ratio (PTR)Student-classroom ratio (SCR)% Schools with <= 50 students% Schools with PTR > 100% Female teachers
% Schools established since 1995
Regular teachers Para-teachers
% minorrepairs
% majorrepairs
# = not applicable na = not available * Some totals may not match due to no response in classificatory data items
19.4 61.28.0 75.2
11.6 74.612.6 74.912.3 69.713.5 69.9
8.4 75.9
1916
50.61617
73.10.0
51.220.2
49.71419
40.60.0
50.123.4
52.81319
67.61.4
43.749.3
52.92344
20.00.0
36.80.0
51.4 0.2 87.0 65.7 62.4
9729416.822.1
Category
PrivateGovt.PrivateGovtPrivateGovt.PrivateGovt.PrivateGovt.
Total population (in 000's)
Number of blocks/taluks
District
Decadal growth rate
Primary onlyPrimary with upper primaryPrimary with upper primary & sec/higher sec.Upper primary onlyUpper primary with sec./higher secondary
% Single classroom schools% Single teacher schools
P + UP P+sec/hs U.P. only UP+secP. only
No response in school category
Primary with upper primaryPrimary with U.P. & sec/higherUpper primary onlyUpper primary with sec./higher sec
Primary only
Primary onlyPrimary with upper primaryPrimary with Upper primary & sec/higherUpper primary only
Para-teachers
School category
Upper primary with sec./higher secondary
Primary onlyPrimary with upper prim.
P. onlyP + UPP+sec/hsU.P. onlyUP+sec
NER(U.Prim)GER(U.Prim)NER (Primary)GER (Primary)
Transition ratePrim. to U. Prim
54.4
Performance indicators
SC/ST Enrolment
Indicators
Classrooms/Other rooms
Prim.with U.P.&Sec/H.SUpper Primary onlyU. Primary with Sec./H.S.
Basic Data, 2001
Data reported from
8,529 8,234 8,790
0
0 00
74.9
1.01
# ## #
# 16,762 285 206Total
1 - 4 5 - 7
25,279 23,398 24,199
82.6 41.585.8 39.383.8 34.481.3 38.5
Elementary Education in India - Where do we stand ?
Meg
hal
aya
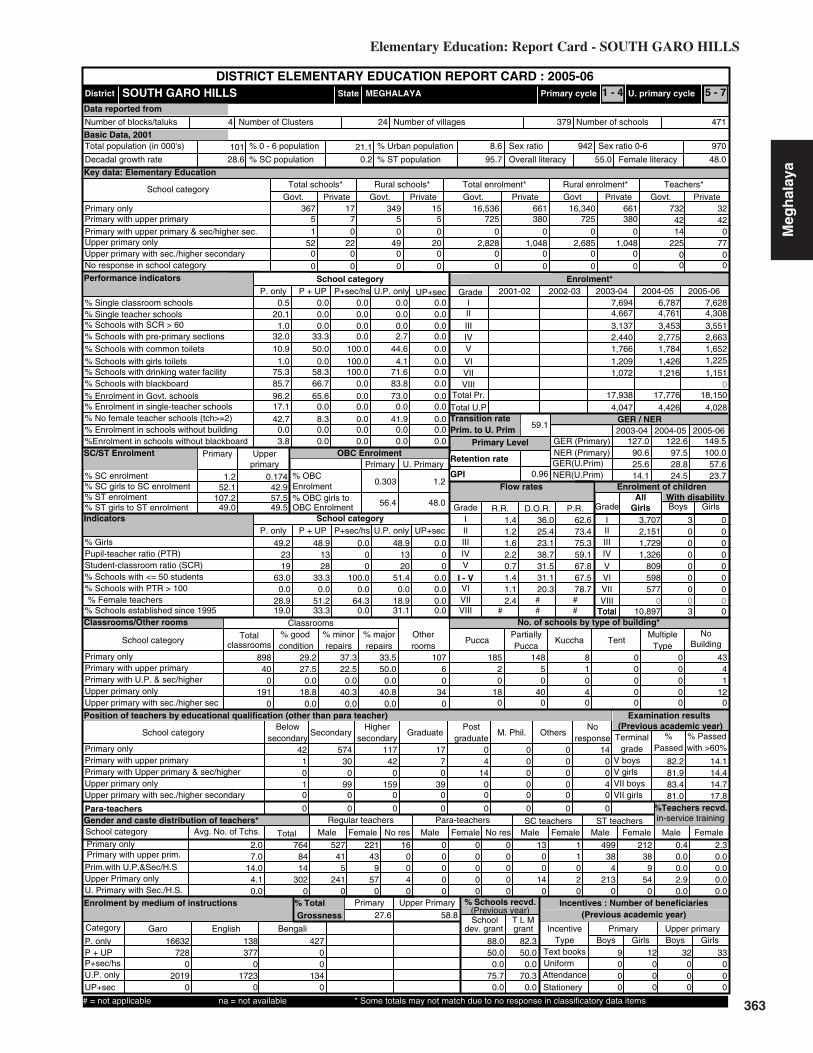
363
0.3031.2 0.174
Key data: Elementary Education
101
SOUTH GARO HILLS
(Previous academic year)
(Previous year)
Gender and caste distribution of teachers*
No. of schools by type of building*
BoysWith disability
Flow rates
Primary Level
Enrolment*
Number of schools
Grade
GER / NER
School category
Primary Upper primaryBoys Boys GirlsGirls
IncentiveType
School categoryMultiple
TypeKuccha
PartiallyPucca
PuccaTotal % good condition
Otherrooms
TentNo
Building
Classrooms
Belowsecondary
Highersecondary
Postgraduate
M. Phil.GraduateSecondarySchool category OthersNo
response
ST teachers
Total Male Female No res Male Female No res Male Female Male FemaleSC teachers
Text booksUniformAttendanceStationery
% Passed
Avg. No. of Tchs.
%
Female literacyOverall literacy
dev. grant grantSchool T L M
Male Female
IVV
IIIIII
Grade R.R. D.O.R. P.R.
VIIVI
I - V
Enrolment by medium of instructions
Examination results
Retention rate
GPI
Primary cycle U. primary cycleState
DISTRICT ELEMENTARY EDUCATION REPORT CARD : 2005-06
GirlsGrade
IIIIIIIVVVI
VIII
AllGirls
Total
VII
% TotalGrossness
School category
51
520
7 50 0
220
490
0 0 0
367 175 7250 0
20 2,8280 00 0
349 15 16,340 661380 725 380
0 0 01,048 2,685 1,048
0 0 00 0 0
16,536 661 73242
3242
P + UP P+sec/hs U.P. only UP+sec
School categoryP. only
0.5 0.0 0.0 0.0 0.020.1
Number of Clusters 471379
% Schools with SCR > 600.0 0.0 0.0 0.0
1.0 0.0 0.0 0.0 0.0% Schools with pre-primary sections 32.0 33.3 0.0 2.7 0.0% Schools with common toilets 10.9 50.0 100.0 44.6 0.0
% Schools with girls toilets 1.0 0.0 100.0 4.1 0.0% Schools with drinking water facility 75.3 58.3 100.0 71.6 0.0
% Enrolment in Govt. schools 96.2 65.6 0.0 73.0 0.085.7 66.7 0.0 83.8 0.0
% No female teacher schools (tch>=2) 42.7 8.3 0.0 41.9 0.017.1 0.0 0.0 0.0 0.0
0.0 0.0 0.0 0.0 0.0%Enrolment in schools without blackboard 3.8 0.0 0.0 0.0 0.0
2001-02 2002-03 2003-04 2004-05 2005-06IIIIIIIVV
VIVII
Total U.P
7,6284,3083,5512,6631,6521,225
1,151
6,7874,7613,4532,7751,784
1,4261,216
7,6944,6673,1372,4401,766
1,2091,072
127.0
25.6
122.6
28.8
149.5
57.6
0.0
100.00.0
3,7072,1511,7291,326
809598577
3000000
0000000
898
classrooms
400
1910
29.227.5
0.018.8
0.0
37.322.5
33.5
0.040.3
0.0
50.00.0
40.80.0
60
340
107 185 148 8 0 0 432 5 1 0 0 40 0 0 0 0 1
18 40 4 0 0 120 0 0 0 0 0
42 574 117 17 0 0 01 30 42 7 4 0 0 00 0 0 0 14 0 0 01 99 159 39 0 0 0 40 0 0 0 0 0 0 0
0 0 0 0 0 0 0 0
52741
5241
0
439
570
221 16 0 0 0 13 1 499 2120040
0000
0000
0000
00
140
1020
384
2130
389
540
Terminalgrade Passed
VII boysV girlsV boys
VII girls
14 with >60%
0.47648414
3020
0.00.02.90.0
2.30.00.00.00.0
16632Garo English Bengali
7280
20190
138377
01723
0
42700
1340
% Schools recvd.
88.050.0
0.075.7
0.0
82.350.0
0.070.3
0.0
9000
32000
12000
33000
2.07.0
14.04.10.0
1.41.21.62.2
1.12.4
0.71.4
2005-062004-052003-04
MEGHALAYA
64.3
Upper PrimaryPrimary
Sex ratio Sex ratio 0-6
4 24
VIII0.0
Enrolment of children
VIIITotal Pr.
225 770 00 0
14 0
%Teachers recvd.in-service training
Total schools* Rural schools* Total enrolment* Rural enrolment* Teachers*
27.6 58.8
100.0
23.7
90.6 97.5
14.1 24.5% SC enrolment% SC girls to SC enrolment% ST enrolment
52.1 42.9107.2
49.0 49.5 56.4
1.2
48.0
Position of teachers by educational qualification (other than para teacher)
(Previous academic year)Incentives : Number of beneficiaries
% ST girls to ST enrolment
% Girls
Number of villages
% 0 - 6 population
% SC population % ST population
% Urban population
% Schools with blackboard
% Enrolment in single-teacher schools
% Enrolment in schools without building
Primary Upperprimary
OBC EnrolmentPrimary U. Primary
% OBCEnrolment% OBC girls toOBC Enrolment
Pupil-teacher ratio (PTR)Student-classroom ratio (SCR)% Schools with <= 50 students% Schools with PTR > 100% Female teachers
% Schools established since 1995
Regular teachers Para-teachers
% minorrepairs
% majorrepairs
# = not applicable na = not available * Some totals may not match due to no response in classificatory data items
36.0 62.625.4 73.423.1 75.338.7 59.131.5 67.831.1 67.520.3 78.7
00
49.22319
63.00.0
28.919.0
48.91328
33.30.0
51.233.3
48.91320
51.40.0
18.931.1
0.000
0.00.00.00.0
28.6 0.2 95.7 55.0 48.0
9709428.621.1
Category
PrivateGovt.PrivateGovtPrivateGovt.PrivateGovt.PrivateGovt.
Total population (in 000's)
Number of blocks/taluks
District
Decadal growth rate
Primary onlyPrimary with upper primaryPrimary with upper primary & sec/higher sec.Upper primary onlyUpper primary with sec./higher secondary
% Single classroom schools% Single teacher schools
P + UP P+sec/hs U.P. only UP+secP. only
No response in school category
Primary with upper primaryPrimary with U.P. & sec/higherUpper primary onlyUpper primary with sec./higher sec
Primary only
Primary onlyPrimary with upper primaryPrimary with Upper primary & sec/higherUpper primary only
Para-teachers
School category
Upper primary with sec./higher secondary
Primary onlyPrimary with upper prim.
P. onlyP + UPP+sec/hsU.P. onlyUP+sec
NER(U.Prim)GER(U.Prim)NER (Primary)GER (Primary)
Transition ratePrim. to U. Prim
57.5
Performance indicators
SC/ST Enrolment
Indicators
Classrooms/Other rooms
Prim.with U.P.&Sec/H.SUpper Primary onlyU. Primary with Sec./H.S.
Basic Data, 2001
Data reported from
4,047 4,426 4,028
0
0 00
59.1
0.96
# ## #
# 10,897 3 0Total
1 - 4 5 - 7
17,938 17,776 18,150
82.2 14.181.9 14.483.4 14.781.0 17.8
Elementary Education: Report Card - SOUTH GARO HILLS
Meg
hal
aya
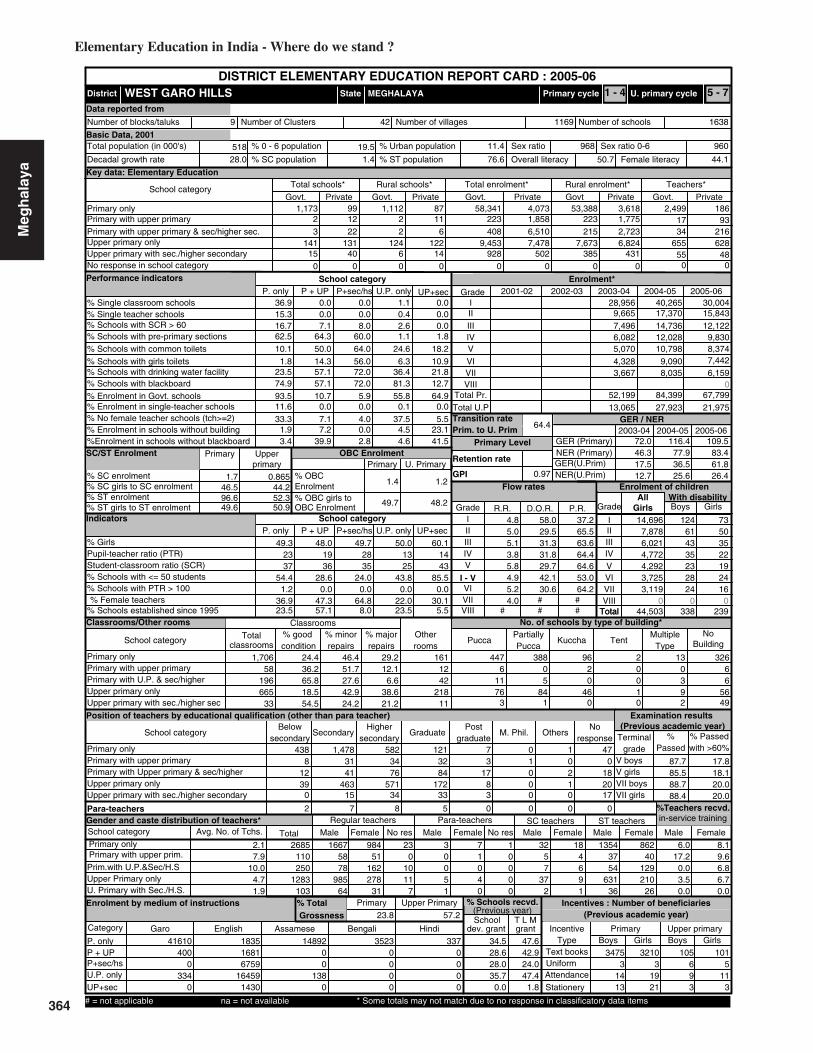
364
1.7 0.865
Key data: Elementary Education
518
WEST GARO HILLS
(Previous academic year)
(Previous year)
Gender and caste distribution of teachers*
No. of schools by type of building*
BoysWith disability
Flow rates
Primary Level
Enrolment*
Number of schools
Grade
GER / NER
School category
Primary Upper primaryBoys Boys GirlsGirls
IncentiveType
School categoryMultiple
TypeKuccha
PartiallyPucca
PuccaTotal % good condition
Otherrooms
TentNo
Building
Classrooms
Belowsecondary
Highersecondary
Postgraduate
M. Phil.GraduateSecondarySchool category OthersNo
response
ST teachers
Total Male Female No res Male Female No res Male Female Male FemaleSC teachers
Text booksUniformAttendanceStationery
% Passed
Avg. No. of Tchs.
%
Female literacyOverall literacy
dev. grant grantSchool T L M
Male Female
IVV
IIIIII
Grade R.R. D.O.R. P.R.
VIIVI
I - V
Enrolment by medium of instructions
Examination results
Retention rate
GPI
Primary cycle U. primary cycleState
DISTRICT ELEMENTARY EDUCATION REPORT CARD : 2005-06
GirlsGrade
IIIIIIIVVVI
VIII
AllGirls
Total
VII
% TotalGrossness
School category
23
14115
12 222 2
13140
1246
0 0 0
1,173 9911 223
6 408122 9,453
14 9280 0
1,112 87 53,388 3,6181,858 223 1,7756,510 215 2,7237,478 7,673 6,824
0 0 0502 385 431
58,341 4,073 2,49917
18693
P + UP P+sec/hs U.P. only UP+sec
School categoryP. only
36.9 0.0 0.0 1.1 0.015.3
Number of Clusters 16381169
% Schools with SCR > 600.0 0.0 0.4 0.0
16.7 7.1 8.0 2.6 0.0% Schools with pre-primary sections 62.5 64.3 60.0 1.1 1.8% Schools with common toilets 10.1 50.0 64.0 24.6 18.2
% Schools with girls toilets 1.8 14.3 56.0 6.3 10.9% Schools with drinking water facility 23.5 57.1 72.0 36.4 21.8
% Enrolment in Govt. schools 93.5 10.7 5.9 55.8 64.974.9 57.1 72.0 81.3 12.7
% No female teacher schools (tch>=2) 33.3 7.1 4.0 37.5 5.511.6 0.0 0.0 0.1 0.0
1.9 7.2 0.0 4.5 23.1%Enrolment in schools without blackboard 3.4 39.9 2.8 4.6 41.5
2001-02 2002-03 2003-04 2004-05 2005-06IIIIIIIVV
VIVII
Total U.P
30,00415,84312,122
9,8308,3747,442
6,159
40,26517,37014,73612,02810,798
9,0908,035
28,9569,6657,4966,0825,070
4,3283,667
72.0
17.5
116.4
36.5
109.5
61.8
49.7
24.00.0
14,6967,8786,0214,7724,2923,7253,119
124614335232824
73503522192416
1,706
classrooms
58196665
33
24.436.265.818.554.5
46.451.7
29.2
27.642.924.2
12.16.6
38.621.2
1242
21811
161 447 388 96 2 13 3266 0 2 0 0 6
11 5 0 0 3 676 84 46 1 9 56
3 1 0 0 2 49
438 1,478 582 121 7 0 18 31 34 32 3 1 0 0
12 41 76 84 17 0 2 1839 463 571 172 8 0 1 20
0 15 34 33 3 0 0 17
2 7 8 5 0 0 0 0
16675878
98564
51162278
31
984 23 3 7 1 32 18 1354 8620
1011
7
0051
1040
0000
57
372
4691
3754
63136
40129210
26
Terminalgrade Passed
VII boysV girlsV boys
VII girls
47 with >60%
6.02685110250
1283103
17.20.03.50.0
8.19.66.86.70.0
41610Garo English Assamese Bengali Hindi
4000
3340
183516816759
164591430
1489200
1380
35230000
3370000
% Schools recvd.
34.528.628.035.7
0.0
47.642.924.047.4
1.8
34753
1413
105693
32103
1921
1015
113
2.17.9
10.04.71.9
4.85.05.13.8
5.24.0
5.84.9
2005-062004-052003-04
MEGHALAYA
64.8
Upper PrimaryPrimary
Sex ratio Sex ratio 0-6
9 42
VIII8.0
Enrolment of children
VIIITotal Pr.
655 62855 48
0 0
34 216
%Teachers recvd.in-service training
Total schools* Rural schools* Total enrolment* Rural enrolment* Teachers*
23.8 57.2
83.4
26.4
46.3 77.9
12.7 25.6% SC enrolment% SC girls to SC enrolment% ST enrolment
46.5 44.296.649.6 50.9
1.4
49.7
1.2
48.2
Position of teachers by educational qualification (other than para teacher)
(Previous academic year)Incentives : Number of beneficiaries
% ST girls to ST enrolment
% Girls
Number of villages
% 0 - 6 population
% SC population % ST population
% Urban population
% Schools with blackboard
% Enrolment in single-teacher schools
% Enrolment in schools without building
Primary Upperprimary
OBC EnrolmentPrimary U. Primary
% OBCEnrolment% OBC girls toOBC Enrolment
Pupil-teacher ratio (PTR)Student-classroom ratio (SCR)% Schools with <= 50 students% Schools with PTR > 100% Female teachers
% Schools established since 1995
Regular teachers Para-teachers
% minorrepairs
% majorrepairs
# = not applicable na = not available * Some totals may not match due to no response in classificatory data items
58.0 37.229.5 65.531.3 63.631.8 64.429.7 64.642.1 53.030.6 64.2
3528
49.32337
54.41.2
36.923.5
48.01936
28.60.0
47.357.1
50.01325
43.80.0
22.023.5
60.11443
85.50.0
30.15.5
28.0 1.4 76.6 50.7 44.1
96096811.419.5
Category
PrivateGovt.PrivateGovtPrivateGovt.PrivateGovt.PrivateGovt.
Total population (in 000's)
Number of blocks/taluks
District
Decadal growth rate
Primary onlyPrimary with upper primaryPrimary with upper primary & sec/higher sec.Upper primary onlyUpper primary with sec./higher secondary
% Single classroom schools% Single teacher schools
P + UP P+sec/hs U.P. only UP+secP. only
No response in school category
Primary with upper primaryPrimary with U.P. & sec/higherUpper primary onlyUpper primary with sec./higher sec
Primary only
Primary onlyPrimary with upper primaryPrimary with Upper primary & sec/higherUpper primary only
Para-teachers
School category
Upper primary with sec./higher secondary
Primary onlyPrimary with upper prim.
P. onlyP + UPP+sec/hsU.P. onlyUP+sec
NER(U.Prim)GER(U.Prim)NER (Primary)GER (Primary)
Transition ratePrim. to U. Prim
52.3
Performance indicators
SC/ST Enrolment
Indicators
Classrooms/Other rooms
Prim.with U.P.&Sec/H.SUpper Primary onlyU. Primary with Sec./H.S.
Basic Data, 2001
Data reported from
13,065 27,923 21,975
0
0 00
64.4
0.97
# ## #
# 44,503 338 239Total
1 - 4 5 - 7
52,199 84,399 67,799
87.7 17.885.5 18.188.7 20.088.4 20.0
Elementary Education in India - Where do we stand ?
Meg
hal
aya

365
0.2150.0330.0000.075
Key data: Elementary Education
296
WEST KHASI HILLS
(Previous academic year)
(Previous year)
Gender and caste distribution of teachers*
No. of schools by type of building*
BoysWith disability
Flow rates
Primary Level
Enrolment*
Number of schools
Grade
GER / NER
School category
Primary Upper primaryBoys Boys GirlsGirls
IncentiveType
School categoryMultiple
TypeKuccha
PartiallyPucca
PuccaTotal % good condition
Otherrooms
TentNo
Building
Classrooms
Belowsecondary
Highersecondary
Postgraduate
M. Phil.GraduateSecondarySchool category OthersNo
response
ST teachers
Total Male Female No res Male Female No res Male Female Male FemaleSC teachers
Text booksUniformAttendanceStationery
% Passed
Avg. No. of Tchs.
%
Female literacyOverall literacy
dev. grant grantSchool T L M
Male Female
IVV
IIIIII
Grade R.R. D.O.R. P.R.
VIIVI
I - V
Enrolment by medium of instructions
Examination results
Retention rate
GPI
Primary cycle U. primary cycleState
DISTRICT ELEMENTARY EDUCATION REPORT CARD : 2005-06
GirlsGrade
IIIIIIIVVVI
VIII
AllGirls
Total
VII
% TotalGrossness
School category
20
134
29 212 0
24829
132
0 0 0
280 1,10725 436
8 0231 1,134
26 8820 0
265 1,065 14,621 41,6972,936 436 2,4853,007 0 1,074
13,515 1,134 12,067
0 0 02,362 370 2,130
15,765 44,758 81915
2,414189
P + UP P+sec/hs U.P. only UP+sec
School categoryP. only
21.8 3.2 0.0 3.1 0.014.9
Number of Clusters 1724891
% Schools with SCR > 600.0 0.0 0.0 0.0
2.5 3.2 0.0 1.5 6.1% Schools with pre-primary sections 86.1 77.4 50.0 1.1 3.0% Schools with common toilets 18.6 25.8 83.3 28.7 63.6
% Schools with girls toilets 2.0 9.7 58.3 7.7 30.3% Schools with drinking water facility 26.7 32.3 50.0 31.8 45.5
% Enrolment in Govt. schools 26.0 12.9 0.0 7.7 27.290.8 87.1 100.0 95.8 87.9
% No female teacher schools (tch>=2) 26.0 6.5 8.3 18.8 18.210.7 0.0 0.0 0.0 0.0
0.8 0.0 0.0 3.1 0.0%Enrolment in schools without blackboard 1.0 0.4 0.0 1.4 10.0
2001-02 2002-03 2003-04 2004-05 2005-06IIIIIIIVV
VIVII
Total U.P
23,95216,51813,447
9,9958,4196,861
5,603
24,44417,18113,90010,430
7,815
6,2635,123
18,75012,419
9,9017,5435,950
4,5883,520
118.8
30.7
155.4
41.8
166.1
89.4
51.3
8.30.0
11,8238,2126,7815,0914,3683,6222,972
242968055312217
171746039252326
3,431
classrooms
167105781167
17.813.837.112.931.1
49.650.9
32.6
52.451.944.3
35.310.535.224.6
2628
24559
362 198 784 241 20 8 1368 13 6 0 1 36 6 0 0 0 0
56 129 49 4 2 2115 13 2 0 0 3
603 1,188 919 381 16 0 09 35 103 51 5 0 0 13 18 38 33 1 0 0 0
18 191 443 377 21 0 0 130 13 66 83 13 0 0 6
10 30 39 19 1 0 0 0
17638142
625107
12251
40264
1331 80 35 23 1 9 11 1773 134110
3610
00
260
00
150
0000
10
122
0150
7941
60890
12250
40657
Terminalgrade Passed
VII boysV girlsV boys
VII girls
67 with >60%
8.73233204
931104
181
4.92.46.82.8
5.25.70.04.17.8
52440Khasi English Garo Bengali Hindi
1603289533
0
90417622718
141163124
68270000
2400000
0000
120
% Schools recvd.
56.548.450.062.148.5
47.245.241.752.145.5
33620
012
12059
122
27121
010
10750
117
2.36.67.84.25.5
11.49.38.49.0
9.59.8
11.810.1
2005-062004-052003-04
MEGHALAYA
54.8
Upper PrimaryPrimary
Sex ratio Sex ratio 0-6
8 37
VIII0.0
Enrolment of children
VIIITotal Pr.
71 1,03339 142
0 0
0 93
%Teachers recvd.in-service training
Total schools* Rural schools* Total enrolment* Rural enrolment* Teachers*
17.9 63.0
100.0
33.0
75.0
18.0 30.7% SC enrolment% SC girls to SC enrolment% ST enrolment
37.5 0.0112.8
50.2 52.9 38.1 53.3
Position of teachers by educational qualification (other than para teacher)
(Previous academic year)Incentives : Number of beneficiaries
% ST girls to ST enrolment
% Girls
Number of villages
% 0 - 6 population
% SC population % ST population
% Urban population
% Schools with blackboard
% Enrolment in single-teacher schools
% Enrolment in schools without building
Primary Upperprimary
OBC EnrolmentPrimary U. Primary
% OBCEnrolment% OBC girls toOBC Enrolment
Pupil-teacher ratio (PTR)Student-classroom ratio (SCR)% Schools with <= 50 students% Schools with PTR > 100% Female teachers
% Schools established since 1995
Regular teachers Para-teachers
% minorrepairs
% majorrepairs
# = not applicable na = not available * Some totals may not match due to no response in classificatory data items
27.5 61.119.3 71.426.4 65.119.1 71.9
8.0 80.122.1 67.8
9.0 81.4
2932
49.91918
66.30.4
41.924.9
51.61720
25.80.0
59.864.5
52.51319
52.10.0
37.841.8
53.21819
18.20.0
35.412.1
33.6 na 98.0 65.1 63.7
97596811.723.4
Category
PrivateGovt.PrivateGovtPrivateGovt.PrivateGovt.PrivateGovt.
Total population (in 000's)
Number of blocks/taluks
District
Decadal growth rate
Primary onlyPrimary with upper primaryPrimary with upper primary & sec/higher sec.Upper primary onlyUpper primary with sec./higher secondary
% Single classroom schools% Single teacher schools
P + UP P+sec/hs U.P. only UP+secP. only
No response in school category
Primary with upper primaryPrimary with U.P. & sec/higherUpper primary onlyUpper primary with sec./higher sec
Primary only
Primary onlyPrimary with upper primaryPrimary with Upper primary & sec/higherUpper primary only
Para-teachers
School category
Upper primary with sec./higher secondary
Primary onlyPrimary with upper prim.
P. onlyP + UPP+sec/hsU.P. onlyUP+sec
NER(U.Prim)GER(U.Prim)NER (Primary)GER (Primary)
Transition ratePrim. to U. Prim
59.5
Performance indicators
SC/ST Enrolment
Indicators
Classrooms/Other rooms
Prim.with U.P.&Sec/H.SUpper Primary onlyU. Primary with Sec./H.S.
Basic Data, 2001
Data reported from
14,058 19,201 20,883
0
0 00
71.9
1.00
# ## #
# 42,869 543 418Total
1 - 4 5 - 7
48,613 65,955 63,912
86.5 14.488.4 16.189.1 15.088.8 14.9
Elementary Education: Report Card - WEST KHASI HILLS
Meg
hal
aya

366
0.7181.7 0.637
Key data: Elementary Education
326
AIZAWL
(Previous academic year)
(Previous year)
Gender and caste distribution of teachers*
No. of schools by type of building*
BoysWith disability
Flow rates
Primary Level
Enrolment*
Number of schools
Grade
GER / NER
School category
Primary Upper primaryBoys Boys GirlsGirls
IncentiveType
School categoryMultiple
TypeKuccha
PartiallyPucca
PuccaTotal % good condition
Otherrooms
TentNo
Building
Classrooms
Belowsecondary
Highersecondary
Postgraduate
M. Phil.GraduateSecondarySchool category OthersNo
response
ST teachers
Total Male Female No res Male Female No res Male Female Male FemaleSC teachers
Text booksUniformAttendanceStationery
% Passed
Avg. No. of Tchs.
%
Female literacyOverall literacy
dev. grant grantSchool T L M
Male Female
IVV
IIIIII
Grade R.R. D.O.R. P.R.
VIIVI
I - V
Enrolment by medium of instructions
Examination results
Retention rate
GPI
Primary cycle U. primary cycleState
DISTRICT ELEMENTARY EDUCATION REPORT CARD : 2005-06
GirlsGrade
IIIIIIIVVVI
VIII
AllGirls
Total
VII
% TotalGrossness
School category
347
1861
96 1729 117
8104
00 0 0
298 2024 6,012
3 1,8839 19,8702 580 0
163 7 8,988 20719,880 1,770 2,815
6,072 86 5321,652 9,503 686
0 0 0499 0 131
17,749 851 1,336329
891,011
P + UP P+sec/hs U.P. only UP+sec
School categoryP. only
1.3 0.0 0.0 1.0 0.00.6
Number of Clusters 696177
% Schools with SCR > 600.0 0.0 1.5 0.0
0.0 3.1 2.8 3.4 0.0% Schools with pre-primary sections 20.8 81.5 80.6 0.0 0.0% Schools with common toilets 81.8 81.5 80.6 86.7 100.0
% Schools with girls toilets 20.1 33.1 50.0 32.5 66.7% Schools with drinking water facility 85.2 83.8 83.3 89.7 100.0
% Enrolment in Govt. schools 95.4 23.2 23.7 92.3 10.493.1 89.2 94.4 88.7 88.9
% No female teacher schools (tch>=2) 5.7 1.5 0.0 17.2 0.00.3 0.0 0.0 0.7 0.0
0.0 0.0 0.0 0.0 0.0%Enrolment in schools without blackboard 7.5 12.6 0.4 11.6 7.0
2001-02 2002-03 2003-04 2004-05 2005-06IIIIIIIVV
VIVII
Total U.P
11,7858,4458,4757,958
13,07612,894
11,893
12,9109,3519,1858,6098,843
8,4457,771
12,2118,5798,4707,8947,975
7,7886,990
108.0
56.7
112.6
59.9
107.2
168.2
48.8
8.30.0
5,7994,0814,0993,9296,3996,3265,870
132127
96105
706860
119817166576254
1,321
classrooms
1,126375664
51
47.074.062.145.270.6
37.817.9
15.2
16.837.029.4
8.221.117.8
0.0
253124325
36
375 58 206 49 0 5 058 42 23 0 6 116 5 9 0 5 138 130 23 0 12 0
8 1 0 0 0 0
488 460 131 138 9 0 010 106 242 474 87 2 2 6
1 24 87 141 47 0 1 0147 200 241 735 51 0 8 2
0 4 5 35 18 0 0 0
27 124 208 385 67 0 1 0
417404137956
35
522164427
27
816 1 71 120 0 4 6 473 9183010
1535247
5
2587235
2
0000
285
101
22530
494164978
38
714223452
29
Terminalgrade Passed
VII boysV girlsV boys
VII girls
8 with >60%
74.014251340
4251466
69
17.119.658.015.0
64.915.611.049.413.8
2080English Mizo Hindi Nepali Bengali
2498775821490
557
16224651
3119731
0
0254342
00
23200
2260
4200
750
% Schools recvd.
81.43.18.3
83.311.1
85.84.62.8
84.70.0
330
26
0600
120
27
0600
4.510.311.8
7.27.7
8.43.24.22.2
4.62.5
4.44.8
2005-062004-052003-04
MIZORAM
55.5
Upper PrimaryPrimary
Sex ratio Sex ratio 0-6
11 52
VIII61.1
Enrolment of children
VIIITotal Pr.
1,343 1238 610 0
84 341
%Teachers recvd.in-service training
Total schools* Rural schools* Total enrolment* Rural enrolment* Teachers*
46.4
100.0
90.2
83.7 86.7
44.9 45.3% SC enrolment% SC girls to SC enrolment% ST enrolment
45.6 43.6131.0
48.9 49.3
1.7
48.2 45.6
Position of teachers by educational qualification (other than para teacher)
(Previous academic year)Incentives : Number of beneficiaries
% ST girls to ST enrolment
% Girls
Number of villages
% 0 - 6 population
% SC population % ST population
% Urban population
% Schools with blackboard
% Enrolment in single-teacher schools
% Enrolment in schools without building
Primary Upperprimary
OBC EnrolmentPrimary U. Primary
% OBCEnrolment% OBC girls toOBC Enrolment
Pupil-teacher ratio (PTR)Student-classroom ratio (SCR)% Schools with <= 50 students% Schools with PTR > 100% Female teachers
% Schools established since 1995
Regular teachers Para-teachers
% minorrepairs
% majorrepairs
# = not applicable na = not available * Some totals may not match due to no response in classificatory data items
28.6 63.110.3 86.511.2 84.6
2119
49.61314
47.20.0
65.717.0
48.21923
4.60.0
58.273.1
49.31532
4.40.0
31.518.7
52.28
1122.2
0.042.077.8
39.2 0.1 93.2 96.5 96.3
97395276.214.2
Category
PrivateGovt.PrivateGovtPrivateGovt.PrivateGovt.PrivateGovt.
Total population (in 000's)
Number of blocks/taluks
District
Decadal growth rate
Primary onlyPrimary with upper primaryPrimary with upper primary & sec/higher sec.Upper primary onlyUpper primary with sec./higher secondary
% Single classroom schools% Single teacher schools
P + UP P+sec/hs U.P. only UP+secP. only
No response in school category
Primary with upper primaryPrimary with U.P. & sec/higherUpper primary onlyUpper primary with sec./higher sec
Primary only
Primary onlyPrimary with upper primaryPrimary with Upper primary & sec/higherUpper primary only
Para-teachers
School category
Upper primary with sec./higher secondary
Primary onlyPrimary with upper prim.
P. onlyP + UPP+sec/hsU.P. onlyUP+sec
NER(U.Prim)GER(U.Prim)NER (Primary)GER (Primary)
Transition ratePrim. to U. Prim
63.7
Performance indicators
SC/ST Enrolment
Indicators
Classrooms/Other rooms
Prim.with U.P.&Sec/H.SUpper Primary onlyU. Primary with Sec./H.S.
Basic Data, 2001
Data reported from
22,753 25,059 37,863
0
0 00
100.0
0.95
# ## #
# 36,503 658 510Total
1 - 4 5 - 7
37,154 40,055 36,663
96.6 40.697.4 45.995.3 30.295.5 33.8
Elementary Education in India - Where do we stand ?
Miz
ora
m

367
0.0250.0540.0000.012
Key data: Elementary Education
108
CHAMPHAI
(Previous academic year)
(Previous year)
Gender and caste distribution of teachers*
No. of schools by type of building*
BoysWith disability
Flow rates
Primary Level
Enrolment*
Number of schools
Grade
GER / NER
School category
Primary Upper primaryBoys Boys GirlsGirls
IncentiveType
School categoryMultiple
TypeKuccha
PartiallyPucca
PuccaTotal % good condition
Otherrooms
TentNo
Building
Classrooms
Belowsecondary
Highersecondary
Postgraduate
M. Phil.GraduateSecondarySchool category OthersNo
response
ST teachers
Total Male Female No res Male Female No res Male Female Male FemaleSC teachers
Text booksUniformAttendanceStationery
% Passed
Avg. No. of Tchs.
%
Female literacyOverall literacy
dev. grant grantSchool T L M
Male Female
IVV
IIIIII
Grade R.R. D.O.R. P.R.
VIIVI
I - V
Enrolment by medium of instructions
Examination results
Retention rate
GPI
Primary cycle U. primary cycleState
DISTRICT ELEMENTARY EDUCATION REPORT CARD : 2005-06
GirlsGrade
IIIIIIIVVVI
VIII
AllGirls
Total
VII
% TotalGrossness
School category
110
1020
28 83 050
780
0 0 0
151 1615 876
1 04 6,4330 00 0
115 8 9,350 2983,160 573 1,077
341 0 116191 4,475 169
0 0 00 0 0
12,766 934 49099
85262
P + UP P+sec/hs U.P. only UP+sec
School categoryP. only
0.0 0.0 0.0 0.0 0.02.4
Number of Clusters 31694
% Schools with SCR > 600.0 0.0 0.0 0.0
0.0 0.0 0.0 0.0 0.0% Schools with pre-primary sections 11.4 97.4 100.0 0.0 0.0% Schools with common toilets 70.1 79.5 100.0 72.0 0.0
% Schools with girls toilets 6.6 12.8 33.3 10.3 0.0% Schools with drinking water facility 73.1 59.0 100.0 78.5 0.0
% Enrolment in Govt. schools 93.2 21.7 0.0 97.1 0.099.4 97.4 100.0 100.0 0.0
% No female teacher schools (tch>=2) 18.6 2.6 0.0 15.0 0.02.5 0.0 0.0 0.0 0.0
0.0 0.0 0.0 0.0 0.0%Enrolment in schools without blackboard 0.9 1.7 0.0 0.0 0.0
2001-02 2002-03 2003-04 2004-05 2005-06IIIIIIIVV
VIVII
Total U.P
5,1704,7453,3473,4112,8912,770
2,367
4,8413,3533,4562,9382,867
2,3871,941
5,0443,3423,4582,9012,687
2,2101,965
127.6
49.0
124.1
49.3
126.2
95.6
46.6
0.00.0
2,5302,2981,6331,6441,4071,3521,125
84735366632838
67354341423236
692
classrooms
31528
3320
42.137.864.345.8
0.0
42.941.6
15.0
0.034.0
0.0
20.635.720.2
0.0
5612
1360
158 10 135 21 0 1 05 21 11 0 2 00 2 1 0 0 06 93 6 0 2 00 0 0 0 0 0
135 183 89 66 4 0 013 42 116 171 18 1 0 0
0 2 13 12 9 0 0 046 74 167 318 10 0 0 2
0 0 0 0 0 0 0 0
10 39 27 68 1 0 0 0
266169
17468
0
19219
1470
212 0 54 43 0 1 1 315 2540020
00
320
00
160
0000
1000
4000
16617
4980
18318
1630
Terminalgrade Passed
VII boysV girlsV boys
VII girls
1 with >60%
40.0575361
36665
0
6.50.0
38.40.0
29.82.10.0
23.30.0
12318Mizo English
00
61990
13974036
341426
0
% Schools recvd.
88.65.10.0
99.10.0
87.45.10.0
98.10.0
178776
02
8253130
9
163861
05
7853130
5
3.49.3
12.06.20.0
17.07.37.62.6
4.42.8
8.19.4
2005-062004-052003-04
MIZORAM
52.8
Upper PrimaryPrimary
Sex ratio Sex ratio 0-6
4 22
VIII100.0
Enrolment of children
VIIITotal Pr.
636 290 00 0
0 36
%Teachers recvd.in-service training
Total schools* Rural schools* Total enrolment* Rural enrolment* Teachers*
6.5 51.0
100.0
46.8
95.8
36.6 35.9% SC enrolment% SC girls to SC enrolment% ST enrolment
100.0 0.0117.2
48.6 48.2 55.6 0.0
Position of teachers by educational qualification (other than para teacher)
(Previous academic year)Incentives : Number of beneficiaries
% ST girls to ST enrolment
% Girls
Number of villages
% 0 - 6 population
% SC population % ST population
% Urban population
% Schools with blackboard
% Enrolment in single-teacher schools
% Enrolment in schools without building
Primary Upperprimary
OBC EnrolmentPrimary U. Primary
% OBCEnrolment% OBC girls toOBC Enrolment
Pupil-teacher ratio (PTR)Student-classroom ratio (SCR)% Schools with <= 50 students% Schools with PTR > 100% Female teachers
% Schools established since 1995
Regular teachers Para-teachers
% minorrepairs
% majorrepairs
# = not applicable na = not available * Some totals may not match due to no response in classificatory data items
0.7 92.0
6.9 90.512
948.9
2420
24.01.2
44.319.2
46.71113
20.50.0
53.284.6
49.01020
47.70.0
24.59.3
0.000
0.00.00.00.0
29.8 na 96.8 91.2 89.1
97294438.817.0
Category
PrivateGovt.PrivateGovtPrivateGovt.PrivateGovt.PrivateGovt.
Total population (in 000's)
Number of blocks/taluks
District
Decadal growth rate
Primary onlyPrimary with upper primaryPrimary with upper primary & sec/higher sec.Upper primary onlyUpper primary with sec./higher secondary
% Single classroom schools% Single teacher schools
P + UP P+sec/hs U.P. only UP+secP. only
No response in school category
Primary with upper primaryPrimary with U.P. & sec/higherUpper primary onlyUpper primary with sec./higher sec
Primary only
Primary onlyPrimary with upper primaryPrimary with Upper primary & sec/higherUpper primary only
Para-teachers
School category
Upper primary with sec./higher secondary
Primary onlyPrimary with upper prim.
P. onlyP + UPP+sec/hsU.P. onlyUP+sec
NER(U.Prim)GER(U.Prim)NER (Primary)GER (Primary)
Transition ratePrim. to U. Prim
64.0
Performance indicators
SC/ST Enrolment
Indicators
Classrooms/Other rooms
Prim.with U.P.&Sec/H.SUpper Primary onlyU. Primary with Sec./H.S.
Basic Data, 2001
Data reported from
6,862 7,195 8,028
0
0 00
90.5
0.95
# ## #
# 11,989 405 296Total
1 - 4 5 - 7
14,745 14,588 16,673
93.1 16.594.1 18.187.1 12.689.8 14.0
Elementary Education: Report Card - CHAMPHAI
Miz
ora
m
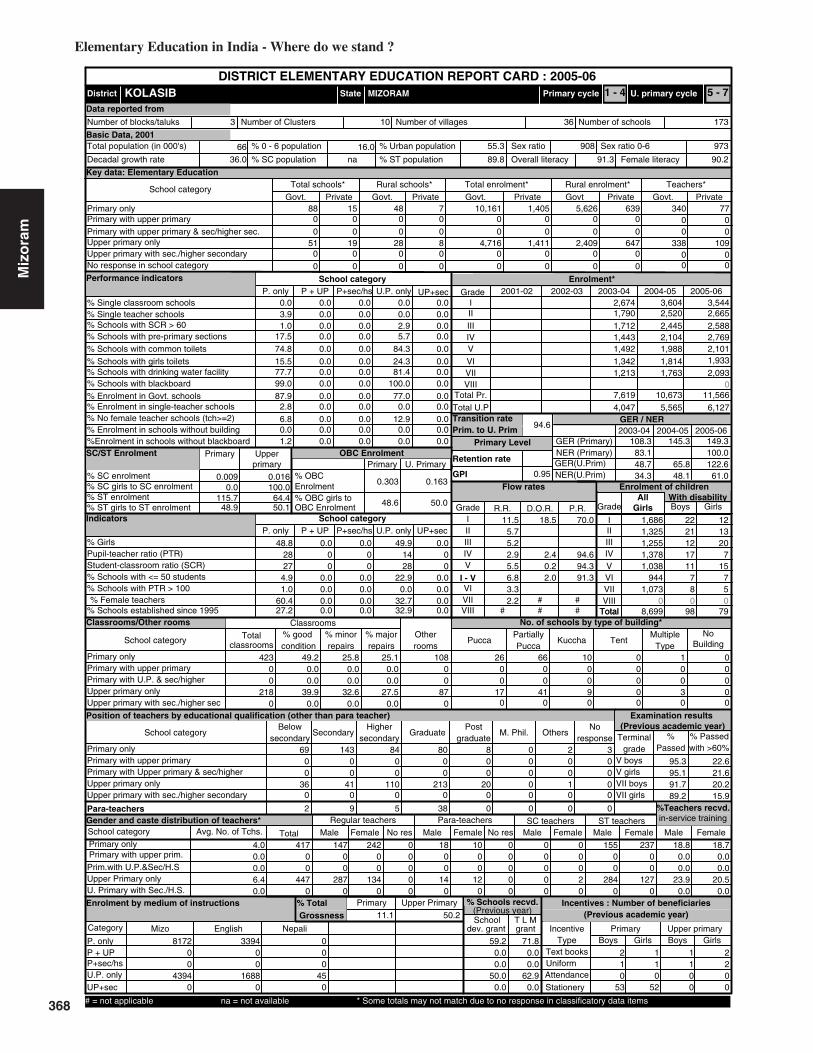
368
0.1630.3030.0160.009
Key data: Elementary Education
66
KOLASIB
(Previous academic year)
(Previous year)
Gender and caste distribution of teachers*
No. of schools by type of building*
BoysWith disability
Flow rates
Primary Level
Enrolment*
Number of schools
Grade
GER / NER
School category
Primary Upper primaryBoys Boys GirlsGirls
IncentiveType
School categoryMultiple
TypeKuccha
PartiallyPucca
PuccaTotal % good condition
Otherrooms
TentNo
Building
Classrooms
Belowsecondary
Highersecondary
Postgraduate
M. Phil.GraduateSecondarySchool category OthersNo
response
ST teachers
Total Male Female No res Male Female No res Male Female Male FemaleSC teachers
Text booksUniformAttendanceStationery
% Passed
Avg. No. of Tchs.
%
Female literacyOverall literacy
dev. grant grantSchool T L M
Male Female
IVV
IIIIII
Grade R.R. D.O.R. P.R.
VIIVI
I - V
Enrolment by medium of instructions
Examination results
Retention rate
GPI
Primary cycle U. primary cycleState
DISTRICT ELEMENTARY EDUCATION REPORT CARD : 2005-06
GirlsGrade
IIIIIIIVVVI
VIII
AllGirls
Total
VII
% TotalGrossness
School category
00
510
0 00 0
190
280
0 0 0
88 150 00 08 4,7160 00 0
48 7 5,626 6390 0 00 0 0
1,411 2,409 647
0 0 00 0 0
10,161 1,405 3400
770
P + UP P+sec/hs U.P. only UP+sec
School categoryP. only
0.0 0.0 0.0 0.0 0.03.9
Number of Clusters 17336
% Schools with SCR > 600.0 0.0 0.0 0.0
1.0 0.0 0.0 2.9 0.0% Schools with pre-primary sections 17.5 0.0 0.0 5.7 0.0% Schools with common toilets 74.8 0.0 0.0 84.3 0.0
% Schools with girls toilets 15.5 0.0 0.0 24.3 0.0% Schools with drinking water facility 77.7 0.0 0.0 81.4 0.0
% Enrolment in Govt. schools 87.9 0.0 0.0 77.0 0.099.0 0.0 0.0 100.0 0.0
% No female teacher schools (tch>=2) 6.8 0.0 0.0 12.9 0.02.8 0.0 0.0 0.0 0.0
0.0 0.0 0.0 0.0 0.0%Enrolment in schools without blackboard 1.2 0.0 0.0 0.0 0.0
2001-02 2002-03 2003-04 2004-05 2005-06IIIIIIIVV
VIVII
Total U.P
3,5442,6652,5882,7692,1011,933
2,093
3,6042,5202,4452,1041,988
1,8141,763
2,6741,7901,7121,4431,492
1,3421,213
108.3
48.7
145.3
65.8
149.3
122.6
0.0
0.00.0
1,6861,3251,2551,3781,038
9441,073
2221121711
78
121320
715
75
423
classrooms
00
2180
49.20.00.0
39.90.0
25.80.0
25.1
0.032.6
0.0
0.00.0
27.50.0
00
870
108 26 66 10 0 1 00 0 0 0 0 00 0 0 0 0 0
17 41 9 0 3 00 0 0 0 0 0
69 143 84 80 8 0 20 0 0 0 0 0 0 00 0 0 0 0 0 0 0
36 41 110 213 20 0 1 00 0 0 0 0 0 0 0
2 9 5 38 0 0 0 0
14700
2870
00
1340
242 0 18 10 0 0 0 155 2370000
00
140
00
120
0000
0000
0020
00
2840
00
1270
Terminalgrade Passed
VII boysV girlsV boys
VII girls
3 with >60%
18.841700
4470
0.00.0
23.90.0
18.70.00.0
20.50.0
8172Mizo English Nepali
00
43940
339400
16880
000
450
% Schools recvd.
59.20.00.0
50.00.0
71.80.00.0
62.90.0
210
53
1100
110
52
2200
4.00.00.06.40.0
11.55.75.22.9
3.32.2
5.56.8
2005-062004-052003-04
MIZORAM
0.0
Upper PrimaryPrimary
Sex ratio Sex ratio 0-6
3 10
VIII0.0
Enrolment of children
VIIITotal Pr.
338 1090 00 0
0 0
%Teachers recvd.in-service training
Total schools* Rural schools* Total enrolment* Rural enrolment* Teachers*
11.1 50.2
100.0
61.0
83.1
34.3 48.1% SC enrolment% SC girls to SC enrolment% ST enrolment
0.0 100.0115.7
48.9 50.1 48.6 50.0
Position of teachers by educational qualification (other than para teacher)
(Previous academic year)Incentives : Number of beneficiaries
% ST girls to ST enrolment
% Girls
Number of villages
% 0 - 6 population
% SC population % ST population
% Urban population
% Schools with blackboard
% Enrolment in single-teacher schools
% Enrolment in schools without building
Primary Upperprimary
OBC EnrolmentPrimary U. Primary
% OBCEnrolment% OBC girls toOBC Enrolment
Pupil-teacher ratio (PTR)Student-classroom ratio (SCR)% Schools with <= 50 students% Schools with PTR > 100% Female teachers
% Schools established since 1995
Regular teachers Para-teachers
% minorrepairs
% majorrepairs
# = not applicable na = not available * Some totals may not match due to no response in classificatory data items
18.5 70.0
2.4 94.60.2 94.32.0 91.3
00
48.82827
4.91.0
60.427.2
0.000
0.00.00.00.0
49.91428
22.90.0
32.732.9
0.000
0.00.00.00.0
36.0 na 89.8 91.3 90.2
97390855.316.0
Category
PrivateGovt.PrivateGovtPrivateGovt.PrivateGovt.PrivateGovt.
Total population (in 000's)
Number of blocks/taluks
District
Decadal growth rate
Primary onlyPrimary with upper primaryPrimary with upper primary & sec/higher sec.Upper primary onlyUpper primary with sec./higher secondary
% Single classroom schools% Single teacher schools
P + UP P+sec/hs U.P. only UP+secP. only
No response in school category
Primary with upper primaryPrimary with U.P. & sec/higherUpper primary onlyUpper primary with sec./higher sec
Primary only
Primary onlyPrimary with upper primaryPrimary with Upper primary & sec/higherUpper primary only
Para-teachers
School category
Upper primary with sec./higher secondary
Primary onlyPrimary with upper prim.
P. onlyP + UPP+sec/hsU.P. onlyUP+sec
NER(U.Prim)GER(U.Prim)NER (Primary)GER (Primary)
Transition ratePrim. to U. Prim
64.4
Performance indicators
SC/ST Enrolment
Indicators
Classrooms/Other rooms
Prim.with U.P.&Sec/H.SUpper Primary onlyU. Primary with Sec./H.S.
Basic Data, 2001
Data reported from
4,047 5,565 6,127
0
0 00
94.6
0.95
# ## #
# 8,699 98 79Total
1 - 4 5 - 7
7,619 10,673 11,566
95.3 22.695.1 21.691.7 20.289.2 15.9
Elementary Education in India - Where do we stand ?
Miz
ora
m

369
0.0000.0000.6620.123
Key data: Elementary Education
74
LAWNGTLAI
(Previous academic year)
(Previous year)
Gender and caste distribution of teachers*
No. of schools by type of building*
BoysWith disability
Flow rates
Primary Level
Enrolment*
Number of schools
Grade
GER / NER
School category
Primary Upper primaryBoys Boys GirlsGirls
IncentiveType
School categoryMultiple
TypeKuccha
PartiallyPucca
PuccaTotal % good condition
Otherrooms
TentNo
Building
Classrooms
Belowsecondary
Highersecondary
Postgraduate
M. Phil.GraduateSecondarySchool category OthersNo
response
ST teachers
Total Male Female No res Male Female No res Male Female Male FemaleSC teachers
Text booksUniformAttendanceStationery
% Passed
Avg. No. of Tchs.
%
Female literacyOverall literacy
dev. grant grantSchool T L M
Male Female
IVV
IIIIII
Grade R.R. D.O.R. P.R.
VIIVI
I - V
Enrolment by medium of instructions
Examination results
Retention rate
GPI
Primary cycle U. primary cycleState
DISTRICT ELEMENTARY EDUCATION REPORT CARD : 2005-06
GirlsGrade
IIIIIIIVVVI
VIII
AllGirls
Total
VII
% TotalGrossness
School category
20
990
10 11 020
920
4 0 0
204 116 3571 02 5,6030 00 0
189 9 13,930 9642,420 54 1,024
337 0 337156 5,021 156
0 0 00 0 0
14,983 1,175 63330
3194
P + UP P+sec/hs U.P. only UP+sec
School categoryP. only
0.9 0.0 0.0 0.0 0.08.4
Number of Clusters 333148
% Schools with SCR > 600.0 0.0 2.0 0.0
0.5 33.3 0.0 0.0 0.0% Schools with pre-primary sections 0.0 8.3 0.0 0.0 0.0% Schools with common toilets 55.3 25.0 100.0 59.4 0.0
% Schools with girls toilets 2.3 33.3 100.0 3.0 0.0% Schools with drinking water facility 11.2 41.7 100.0 10.9 0.0
% Enrolment in Govt. schools 92.7 12.9 0.0 97.3 0.087.0 83.3 100.0 89.1 0.0
% No female teacher schools (tch>=2) 54.0 8.3 0.0 52.5 0.06.5 0.0 0.0 2.4 0.0
0.3 0.0 0.0 0.0 0.0%Enrolment in schools without blackboard 11.9 12.9 0.0 8.8 0.0
2001-02 2002-03 2003-04 2004-05 2005-06IIIIIIIVV
VIVII
Total U.P
5,5125,3884,0173,0122,3732,880
1,849
5,7724,0443,0212,5052,195
1,7861,645
4,8503,2552,6762,2301,577
1,3231,197
155.7
43.4
180.9
56.8
176.2
129.3
49.6
0.00.0
2,6382,5691,8591,4111,1281,437
874
14854010
7604010
790
classrooms
4910
3540
5.922.4
0.09.00.0
77.177.6
17.0
0.087.0
0.0
0.0100.0
4.00.0
142
1090
217 0 201 11 0 1 20 10 0 0 0 20 1 0 0 0 00 98 3 0 0 00 0 0 0 0 0
150 431 48 26 2 0 05 42 14 59 4 0 0 00 1 0 7 0 0 0 0
19 118 88 160 8 0 0 00 0 0 0 0 0 0 0
3 3 3 9 0 0 0 0
47167
5314
0
573
790
186 0 7 0 0 2 1 469 1850000
00
100
0010
0000
1030
1000
644
3130
542
800
Terminalgrade Passed
VII boysV girlsV boys
VII girls
0 with >60%
3.8664124
8404
0
1.50.00.60.0
3.80.00.00.00.0
13847English Mizo Others
2448337
25470
2276329
03183
0
3500
290
% Schools recvd.
40.58.30.0
44.60.0
2.30.00.05.90.0
6933000
1668000
6066000
1537000
3.110.3
8.04.00.0
8.62.72.94.8
0.23.8
3.65.1
2005-062004-052003-04
MIZORAM
37.5
Upper PrimaryPrimary
Sex ratio Sex ratio 0-6
5 20
VIII0.0
Enrolment of children
VIIITotal Pr.
397 70 00 0
0 8
%Teachers recvd.in-service training
Total schools* Rural schools* Total enrolment* Rural enrolment* Teachers*
19.6 62.4
100.0
48.627.8 45.6% SC enrolment% SC girls to SC enrolment% ST enrolment
40.9 53.2113.1
47.3 48.8 0.0 0.0
Position of teachers by educational qualification (other than para teacher)
(Previous academic year)Incentives : Number of beneficiaries
% ST girls to ST enrolment
% Girls
Number of villages
% 0 - 6 population
% SC population % ST population
% Urban population
% Schools with blackboard
% Enrolment in single-teacher schools
% Enrolment in schools without building
Primary Upperprimary
OBC EnrolmentPrimary U. Primary
% OBCEnrolment% OBC girls toOBC Enrolment
Pupil-teacher ratio (PTR)Student-classroom ratio (SCR)% Schools with <= 50 students% Schools with PTR > 100% Female teachers
% Schools established since 1995
Regular teachers Para-teachers
% minorrepairs
% majorrepairs
# = not applicable na = not available * Some totals may not match due to no response in classificatory data items
0.0 91.40.1 97.11.3 95.83.7 91.5
3442
47.22420
27.91.4
28.020.9
47.32257
8.30.0
46.083.3
48.81416
45.51.0
19.839.6
0.000
0.00.00.00.0
34.8 na 95.4 64.7 57.8
938899na19.0
Category
PrivateGovt.PrivateGovtPrivateGovt.PrivateGovt.PrivateGovt.
Total population (in 000's)
Number of blocks/taluks
District
Decadal growth rate
Primary onlyPrimary with upper primaryPrimary with upper primary & sec/higher sec.Upper primary onlyUpper primary with sec./higher secondary
% Single classroom schools% Single teacher schools
P + UP P+sec/hs U.P. only UP+secP. only
No response in school category
Primary with upper primaryPrimary with U.P. & sec/higherUpper primary onlyUpper primary with sec./higher sec
Primary only
Primary onlyPrimary with upper primaryPrimary with Upper primary & sec/higherUpper primary only
Para-teachers
School category
Upper primary with sec./higher secondary
Primary onlyPrimary with upper prim.
P. onlyP + UPP+sec/hsU.P. onlyUP+sec
NER(U.Prim)GER(U.Prim)NER (Primary)GER (Primary)
Transition ratePrim. to U. Prim
65.9
Performance indicators
SC/ST Enrolment
Indicators
Classrooms/Other rooms
Prim.with U.P.&Sec/H.SUpper Primary onlyU. Primary with Sec./H.S.
Basic Data, 2001
Data reported from
4,097 5,626 7,102
0
0 00
91.5
0.90
# ## #
# 11,916 32 18Total
1 - 4 5 - 7
13,011 15,342 17,929
75.2 11.075.6 10.255.3 10.160.4 12.9
Elementary Education: Report Card - LAWNGTLAI
Miz
ora
m

370
0.1170.1880.5160.355
Key data: Elementary Education
137
LUNGLEI
(Previous academic year)
(Previous year)
Gender and caste distribution of teachers*
No. of schools by type of building*
BoysWith disability
Flow rates
Primary Level
Enrolment*
Number of schools
Grade
GER / NER
School category
Primary Upper primaryBoys Boys GirlsGirls
IncentiveType
School categoryMultiple
TypeKuccha
PartiallyPucca
PuccaTotal % good condition
Otherrooms
TentNo
Building
Classrooms
Belowsecondary
Highersecondary
Postgraduate
M. Phil.GraduateSecondarySchool category OthersNo
response
ST teachers
Total Male Female No res Male Female No res Male Female Male FemaleSC teachers
Text booksUniformAttendanceStationery
% Passed
Avg. No. of Tchs.
%
Female literacyOverall literacy
dev. grant grantSchool T L M
Male Female
IVV
IIIIII
Grade R.R. D.O.R. P.R.
VIIVI
I - V
Enrolment by medium of instructions
Examination results
Retention rate
GPI
Primary cycle U. primary cycleState
DISTRICT ELEMENTARY EDUCATION REPORT CARD : 2005-06
GirlsGrade
IIIIIIIVVVI
VIII
AllGirls
Total
VII
% TotalGrossness
School category
51
1130
12 113 024
282
00 0 0
229 325 7992 44
18 6,5360 00 0
179 21 10,492 8081,302 67 5311,159 0 285
695 3,857 424
0 0 021 0 0
14,424 2,112 72358
14097
P + UP P+sec/hs U.P. only UP+sec
School categoryP. only
5.4 0.0 0.0 0.7 0.015.3
Number of Clusters 431137
% Schools with SCR > 600.0 0.0 0.0 0.0
1.1 0.0 0.0 0.0 0.0% Schools with pre-primary sections 9.2 76.5 71.4 1.5 0.0% Schools with common toilets 65.9 58.8 92.9 72.3 100.0
% Schools with girls toilets 5.4 29.4 64.3 8.8 100.0% Schools with drinking water facility 61.3 58.8 78.6 70.1 100.0
% Enrolment in Govt. schools 87.2 38.0 3.7 90.4 0.092.0 94.1 100.0 93.4 100.0
% No female teacher schools (tch>=2) 16.5 0.0 0.0 24.1 50.012.4 0.0 0.0 0.0 0.0
0.2 0.0 0.0 0.0 0.0%Enrolment in schools without blackboard 6.3 3.0 0.0 4.5 0.0
2001-02 2002-03 2003-04 2004-05 2005-06IIIIIIIVV
VIVII
Total U.P
7,0754,1783,9373,3833,1812,856
2,482
6,7684,3834,0273,0653,299
2,9292,484
5,8344,0083,6033,1023,580
3,4083,063
117.9
60.8
123.3
49.7
117.4
87.7
42.8
35.70.0
3,2931,9451,8151,5931,5591,3461,169
159887763645848
86584547716027
1,019
classrooms
142151468
14
32.247.241.133.150.0
28.522.5
39.4
30.531.050.0
30.328.535.9
0.0
3555
20322
272 17 175 68 0 0 11 10 5 0 1 03 8 2 0 1 0
16 102 19 0 0 00 1 0 0 1 0
206 394 81 124 4 0 110 21 35 74 10 1 1 0
4 12 30 59 9 0 1 191 172 163 386 27 0 2 1
0 0 0 7 0 0 0 0
9 17 11 40 4 0 0 0
4488654
6406
6562
2021
366 3 21 25 0 10 18 446 3651000
20
230
1090
0000
45
171
3340
8342
6225
6357
2031
Terminalgrade Passed
VII boysV girlsV boys
VII girls
7 with >60%
21.7863155116874
7
2.30.0
15.40.0
10.73.01.6
10.40.0
12617Mizo English Bengali Others Punjabi
174133
59520
200119271070
88221
162300
3510
25300
460
230000
% Schools recvd.
75.10.00.0
83.90.0
78.20.00.0
89.10.0
180188
063
6199
700
163589
059
6748
980
3.39.18.36.43.5
10.64.95.52.2
3.62.9
4.76.4
2005-062004-052003-04
MIZORAM
53.4
Upper PrimaryPrimary
Sex ratio Sex ratio 0-6
4 16
VIII85.7
Enrolment of children
VIIITotal Pr.
763 1110 70 0
7 109
%Teachers recvd.in-service training
Total schools* Rural schools* Total enrolment* Rural enrolment* Teachers*
7.4 53.6
100.0
40.7
97.9 96.4
46.4 38.7% SC enrolment% SC girls to SC enrolment% ST enrolment
53.0 50.0116.4
46.9 47.2 40.0 30.0
Position of teachers by educational qualification (other than para teacher)
(Previous academic year)Incentives : Number of beneficiaries
% ST girls to ST enrolment
% Girls
Number of villages
% 0 - 6 population
% SC population % ST population
% Urban population
% Schools with blackboard
% Enrolment in single-teacher schools
% Enrolment in schools without building
Primary Upperprimary
OBC EnrolmentPrimary U. Primary
% OBCEnrolment% OBC girls toOBC Enrolment
Pupil-teacher ratio (PTR)Student-classroom ratio (SCR)% Schools with <= 50 students% Schools with PTR > 100% Female teachers
% Schools established since 1995
Regular teachers Para-teachers
% minorrepairs
% majorrepairs
# = not applicable na = not available * Some totals may not match due to no response in classificatory data items
30.8 58.610.4 84.812.2 82.3
11.9 83.415.7 77.914.2 82.3
810
46.61916
44.10.8
45.316.9
45.71415
11.80.0
42.658.8
48.88
1555.5
0.024.114.6
38.132
100.00.0
14.3100.0
23.1 na 95.3 84.2 80.6
96292242.216.8
Category
PrivateGovt.PrivateGovtPrivateGovt.PrivateGovt.PrivateGovt.
Total population (in 000's)
Number of blocks/taluks
District
Decadal growth rate
Primary onlyPrimary with upper primaryPrimary with upper primary & sec/higher sec.Upper primary onlyUpper primary with sec./higher secondary
% Single classroom schools% Single teacher schools
P + UP P+sec/hs U.P. only UP+secP. only
No response in school category
Primary with upper primaryPrimary with U.P. & sec/higherUpper primary onlyUpper primary with sec./higher sec
Primary only
Primary onlyPrimary with upper primaryPrimary with Upper primary & sec/higherUpper primary only
Para-teachers
School category
Upper primary with sec./higher secondary
Primary onlyPrimary with upper prim.
P. onlyP + UPP+sec/hsU.P. onlyUP+sec
NER(U.Prim)GER(U.Prim)NER (Primary)GER (Primary)
Transition ratePrim. to U. Prim
61.8
Performance indicators
SC/ST Enrolment
Indicators
Classrooms/Other rooms
Prim.with U.P.&Sec/H.SUpper Primary onlyU. Primary with Sec./H.S.
Basic Data, 2001
Data reported from
10,051 8,712 8,519
0
0 00
98.7
0.87
# ## #
# 12,720 557 394Total
1 - 4 5 - 7
16,547 18,243 18,573
95.2 25.096.2 29.295.2 17.994.6 18.9
Elementary Education in India - Where do we stand ?
Miz
ora
m

371
0.0000.0000.0000.000
Key data: Elementary Education
63
MAMIT
(Previous academic year)
(Previous year)
Gender and caste distribution of teachers*
No. of schools by type of building*
BoysWith disability
Flow rates
Primary Level
Enrolment*
Number of schools
Grade
GER / NER
School category
Primary Upper primaryBoys Boys GirlsGirls
IncentiveType
School categoryMultiple
TypeKuccha
PartiallyPucca
PuccaTotal % good condition
Otherrooms
TentNo
Building
Classrooms
Belowsecondary
Highersecondary
Postgraduate
M. Phil.GraduateSecondarySchool category OthersNo
response
ST teachers
Total Male Female No res Male Female No res Male Female Male FemaleSC teachers
Text booksUniformAttendanceStationery
% Passed
Avg. No. of Tchs.
%
Female literacyOverall literacy
dev. grant grantSchool T L M
Male Female
IVV
IIIIII
Grade R.R. D.O.R. P.R.
VIIVI
I - V
Enrolment by medium of instructions
Examination results
Retention rate
GPI
Primary cycle U. primary cycleState
DISTRICT ELEMENTARY EDUCATION REPORT CARD : 2005-06
GirlsGrade
IIIIIIIVVVI
VIII
AllGirls
Total
VII
% TotalGrossness
School category
30
590
11 30 0
210
500
0 0 0
125 78 2900 0
14 7,9370 00 0
95 7 10,555 516738 290 540
0 0 02,698 6,478 1,861
0 0 00 0 0
14,050 516 40621
2561
P + UP P+sec/hs U.P. only UP+sec
School categoryP. only
0.0 0.0 0.0 0.0 0.04.5
Number of Clusters 22670
% Schools with SCR > 600.0 0.0 12.5 0.0
0.0 0.0 0.0 23.8 0.0% Schools with pre-primary sections 0.8 0.0 0.0 0.0 0.0% Schools with common toilets 90.2 64.3 0.0 81.3 0.0
% Schools with girls toilets 43.9 7.1 0.0 43.8 0.0% Schools with drinking water facility 97.0 100.0 0.0 96.3 0.0
% Enrolment in Govt. schools 96.5 28.2 0.0 74.6 0.088.6 78.6 0.0 83.8 0.0
% No female teacher schools (tch>=2) 23.5 21.4 0.0 31.3 0.03.3 0.0 0.0 3.0 0.0
1.8 0.0 0.0 0.0 0.0%Enrolment in schools without blackboard 13.5 7.3 0.0 17.8 0.0
2001-02 2002-03 2003-04 2004-05 2005-06IIIIIIIVV
VIVII
Total U.P
4,1503,8393,4843,5793,9223,650
3,605
3,2823,0172,7832,7732,924
2,6072,599
2,9861,7391,5721,7091,449
1,1711,624
127.6
60.5
187.4
230.7
0.0
0.00.0
2,1511,8161,7311,7691,9461,8011,783
116416559183944
24866924544735
493
classrooms
860
2310
33.629.1
0.032.9
0.0
29.330.2
37.1
0.033.8
0.0
40.70.0
33.30.0
130
720
119 30 71 21 0 0 100 2 10 0 0 20 0 0 0 0 0
25 27 20 0 0 80 0 0 0 0 0
200 127 36 44 1 0 013 14 11 37 2 0 0 4
0 0 0 0 0 0 0 024 40 49 229 5 0 2 12
0 0 0 0 0 0 0 0
5 11 3 14 0 0 0 0
25146
0278
0
310
720
160 14 2 4 0 5 3 248 16040
110
10
160
00
100
0000
0090
0010
470
2850
310
810
Terminalgrade Passed
VII boysV girlsV boys
VII girls
17 with >60%
25.743182
0387
0
23.40.0
15.30.0
22.629.0
0.018.3
0.0
13197Mizo English Others
970
96790
1108931
0701
0
26100
2550
% Schools recvd.
75.00.00.0
61.30.0
72.00.00.0
62.50.0
160
20138
0000
140
1895
0000
3.35.90.04.80.0
10.25.03.31.6
1.50.8
2.64.7
2005-062004-052003-04
MIZORAM
0.0
Upper PrimaryPrimary
Sex ratio Sex ratio 0-6
4 10
VIII0.0
Enrolment of children
VIIITotal Pr.
285 1020 00 0
0 0
%Teachers recvd.in-service training
Total schools* Rural schools* Total enrolment* Rural enrolment* Teachers*
9.3 56.7
100.0
99.9
97.4
41.2 78.6% SC enrolment% SC girls to SC enrolment% ST enrolment
0.0 0.0126.1
49.6 49.4 0.0 0.0
Position of teachers by educational qualification (other than para teacher)
(Previous academic year)Incentives : Number of beneficiaries
% ST girls to ST enrolment
% Girls
Number of villages
% 0 - 6 population
% SC population % ST population
% Urban population
% Schools with blackboard
% Enrolment in single-teacher schools
% Enrolment in schools without building
Primary Upperprimary
OBC EnrolmentPrimary U. Primary
% OBCEnrolment% OBC girls toOBC Enrolment
Pupil-teacher ratio (PTR)Student-classroom ratio (SCR)% Schools with <= 50 students% Schools with PTR > 100% Female teachers
% Schools established since 1995
Regular teachers Para-teachers
% minorrepairs
% majorrepairs
# = not applicable na = not available * Some totals may not match due to no response in classificatory data items
00
50.03430
6.11.5
38.116.7
45.11312
35.70.0
37.878.6
49.42746
12.50.0
21.222.5
0.000
0.00.00.00.0
-3.5 na 93.9 79.1 74.8
93789617.017.8
Category
PrivateGovt.PrivateGovtPrivateGovt.PrivateGovt.PrivateGovt.
Total population (in 000's)
Number of blocks/taluks
District
Decadal growth rate
Primary onlyPrimary with upper primaryPrimary with upper primary & sec/higher sec.Upper primary onlyUpper primary with sec./higher secondary
% Single classroom schools% Single teacher schools
P + UP P+sec/hs U.P. only UP+secP. only
No response in school category
Primary with upper primaryPrimary with U.P. & sec/higherUpper primary onlyUpper primary with sec./higher sec
Primary only
Primary onlyPrimary with upper primaryPrimary with Upper primary & sec/higherUpper primary only
Para-teachers
School category
Upper primary with sec./higher secondary
Primary onlyPrimary with upper prim.
P. onlyP + UPP+sec/hsU.P. onlyUP+sec
NER(U.Prim)GER(U.Prim)NER (Primary)GER (Primary)
Transition ratePrim. to U. Prim
64.9
Performance indicators
SC/ST Enrolment
Indicators
Classrooms/Other rooms
Prim.with U.P.&Sec/H.SUpper Primary onlyU. Primary with Sec./H.S.
Basic Data, 2001
Data reported from
4,244 8,130 11,177
0
0 00
100.0
0.98
# ## #
# 12,997 382 339Total
1 - 4 5 - 7
8,006 11,855 15,052
72.0 28.972.3 30.672.6 31.670.4 33.1
Elementary Education: Report Card - MAMIT
Miz
ora
m

372
0.0000.0000.3120.639
Key data: Elementary Education
61
SAIHA
(Previous academic year)
(Previous year)
Gender and caste distribution of teachers*
No. of schools by type of building*
BoysWith disability
Flow rates
Primary Level
Enrolment*
Number of schools
Grade
GER / NER
School category
Primary Upper primaryBoys Boys GirlsGirls
IncentiveType
School categoryMultiple
TypeKuccha
PartiallyPucca
PuccaTotal % good condition
Otherrooms
TentNo
Building
Classrooms
Belowsecondary
Highersecondary
Postgraduate
M. Phil.GraduateSecondarySchool category OthersNo
response
ST teachers
Total Male Female No res Male Female No res Male Female Male FemaleSC teachers
Text booksUniformAttendanceStationery
% Passed
Avg. No. of Tchs.
%
Female literacyOverall literacy
dev. grant grantSchool T L M
Male Female
IVV
IIIIII
Grade R.R. D.O.R. P.R.
VIIVI
I - V
Enrolment by medium of instructions
Examination results
Retention rate
GPI
Primary cycle U. primary cycleState
DISTRICT ELEMENTARY EDUCATION REPORT CARD : 2005-06
GirlsGrade
IIIIIIIVVVI
VIII
AllGirls
Total
VII
% TotalGrossness
School category
20
500
11 14 030
390
2 0 0
79 174 1350 00 3,0450 00 0
68 13 3,064 6051,939 39 288
712 0 0111 1,719 0
0 0 00 0 0
3,828 959 38815
95107
P + UP P+sec/hs U.P. only UP+sec
School categoryP. only
0.0 0.0 0.0 0.0 0.03.1
Number of Clusters 16862
% Schools with SCR > 600.0 0.0 0.0 0.0
0.0 0.0 0.0 0.0 0.0% Schools with pre-primary sections 92.7 100.0 100.0 0.0 0.0% Schools with common toilets 99.0 100.0 100.0 100.0 0.0
% Schools with girls toilets 2.1 7.7 0.0 1.9 0.0% Schools with drinking water facility 87.5 38.5 75.0 96.2 0.0
% Enrolment in Govt. schools 80.0 6.5 0.0 96.5 0.0100.0 100.0 100.0 100.0 0.0
% No female teacher schools (tch>=2) 14.6 0.0 0.0 28.3 0.01.6 0.0 0.0 0.0 0.0
0.0 0.0 0.0 0.0 0.0%Enrolment in schools without blackboard 0.0 0.0 0.0 0.0 0.0
2001-02 2002-03 2003-04 2004-05 2005-06IIIIIIIVV
VIVII
Total U.P
2,7611,6591,264
8841,1651,575
1,421
3,2252,0261,7131,1151,458
1,1671,241
2,4281,3751,0981,3261,185
1,0511,131
95.7
45.2
119.2
48.3
77.7
84.3
51.8
0.00.0
1,352817627429576814693
87422615
819
7
57211813
414
7
496
classrooms
11434
1590
52.6100.0100.0
52.80.0
14.50.0
32.9
0.018.9
0.0
0.00.0
28.30.0
189
610
93 2 30 64 0 0 03 5 5 0 0 02 1 1 0 0 04 19 30 0 0 00 0 0 0 0 0
100 277 27 12 1 0 01 24 27 61 9 0 0 00 1 11 17 5 0 0 0
47 107 45 132 5 0 0 00 0 0 0 0 0 0 0
4 65 4 26 0 0 0 0
2586720
2850
551451
0
160 0 43 22 0 0 0 299 1820000
00
220
00
120
0000
3140
1000
4718
3010
541463
0
Terminalgrade Passed
VII boysV girlsV boys
VII girls
1 with >60%
0.3483122
34370
0
0.00.00.30.0
0.00.00.00.00.0
4787English Mizo
2074712
10020
000
21190
% Schools recvd.
88.50.00.0
94.30.0
85.47.70.0
94.30.0
74000
14000
69000
14000
5.09.48.57.00.0
5.37.82.34.6
3.23.1
1.84.7
2005-062004-052003-04
MIZORAM
41.2
Upper PrimaryPrimary
Sex ratio Sex ratio 0-6
2 12
VIII100.0
Enrolment of children
VIIITotal Pr.
345 250 00 0
0 34
%Teachers recvd.in-service training
Total schools* Rural schools* Total enrolment* Rural enrolment* Teachers*
14.8 43.8
66.1
47.4
68.8 87.8
29.7 32.4% SC enrolment% SC girls to SC enrolment% ST enrolment
47.6 30.8117.1
49.2 50.4 0.0 0.0
Position of teachers by educational qualification (other than para teacher)
(Previous academic year)Incentives : Number of beneficiaries
% ST girls to ST enrolment
% Girls
Number of villages
% 0 - 6 population
% SC population % ST population
% Urban population
% Schools with blackboard
% Enrolment in single-teacher schools
% Enrolment in schools without building
Primary Upperprimary
OBC EnrolmentPrimary U. Primary
% OBCEnrolment% OBC girls toOBC Enrolment
Pupil-teacher ratio (PTR)Student-classroom ratio (SCR)% Schools with <= 50 students% Schools with PTR > 100% Female teachers
% Schools established since 1995
Regular teachers Para-teachers
% minorrepairs
% majorrepairs
# = not applicable na = not available * Some totals may not match due to no response in classificatory data items
48.2 46.531.7 60.549.1 48.6
29.9 65.42121
49.81010
61.50.0
37.722.9
45.91718
23.10.0
45.176.9
50.89
2056.6
0.017.013.2
0.000
0.00.00.00.0
33.2 na 96.2 82.2 78.1
96195432.518.3
Category
PrivateGovt.PrivateGovtPrivateGovt.PrivateGovt.PrivateGovt.
Total population (in 000's)
Number of blocks/taluks
District
Decadal growth rate
Primary onlyPrimary with upper primaryPrimary with upper primary & sec/higher sec.Upper primary onlyUpper primary with sec./higher secondary
% Single classroom schools% Single teacher schools
P + UP P+sec/hs U.P. only UP+secP. only
No response in school category
Primary with upper primaryPrimary with U.P. & sec/higherUpper primary onlyUpper primary with sec./higher sec
Primary only
Primary onlyPrimary with upper primaryPrimary with Upper primary & sec/higherUpper primary only
Para-teachers
School category
Upper primary with sec./higher secondary
Primary onlyPrimary with upper prim.
P. onlyP + UPP+sec/hsU.P. onlyUP+sec
NER(U.Prim)GER(U.Prim)NER (Primary)GER (Primary)
Transition ratePrim. to U. Prim
71.7
Performance indicators
SC/ST Enrolment
Indicators
Classrooms/Other rooms
Prim.with U.P.&Sec/H.SUpper Primary onlyU. Primary with Sec./H.S.
Basic Data, 2001
Data reported from
3,367 3,866 4,161
0
0 00
100.0
0.96
# ## #
# 5,308 204 134Total
1 - 4 5 - 7
6,227 8,079 6,568
82.2 24.682.3 27.189.7 14.391.0 10.1
Elementary Education in India - Where do we stand ?
Miz
ora
m
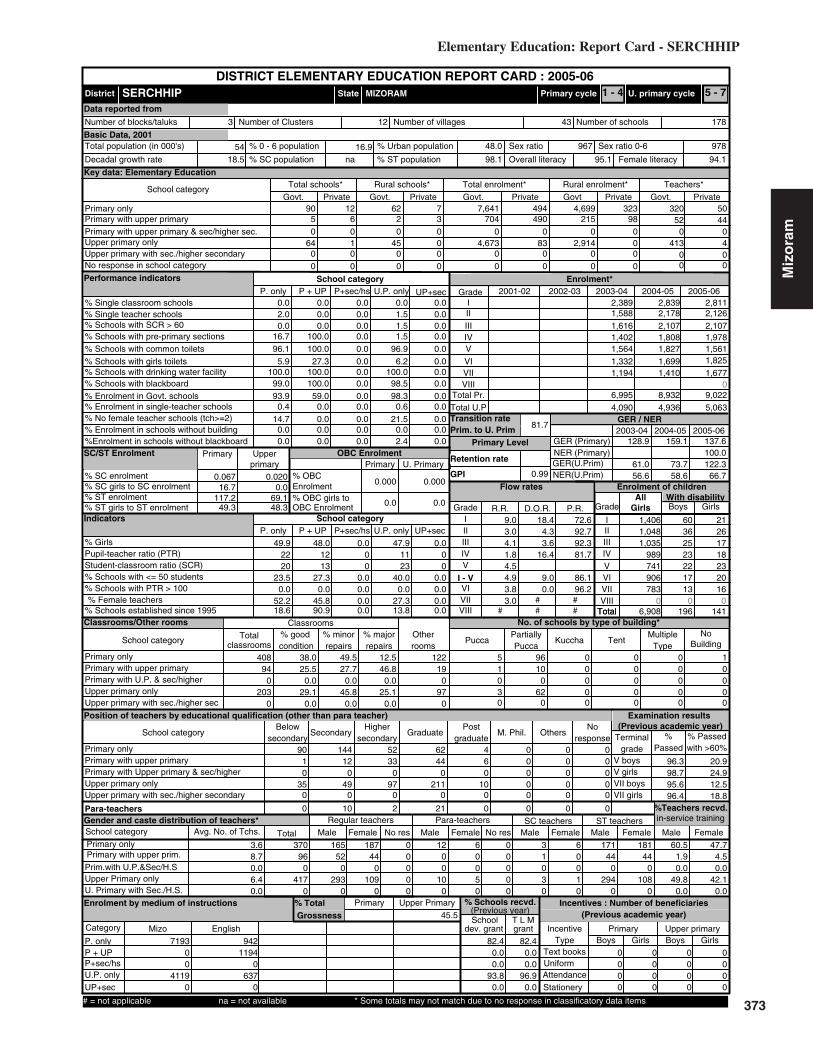
373
0.0000.0000.0200.067
Key data: Elementary Education
54
SERCHHIP
(Previous academic year)
(Previous year)
Gender and caste distribution of teachers*
No. of schools by type of building*
BoysWith disability
Flow rates
Primary Level
Enrolment*
Number of schools
Grade
GER / NER
School category
Primary Upper primaryBoys Boys GirlsGirls
IncentiveType
School categoryMultiple
TypeKuccha
PartiallyPucca
PuccaTotal % good condition
Otherrooms
TentNo
Building
Classrooms
Belowsecondary
Highersecondary
Postgraduate
M. Phil.GraduateSecondarySchool category OthersNo
response
ST teachers
Total Male Female No res Male Female No res Male Female Male FemaleSC teachers
Text booksUniformAttendanceStationery
% Passed
Avg. No. of Tchs.
%
Female literacyOverall literacy
dev. grant grantSchool T L M
Male Female
IVV
IIIIII
Grade R.R. D.O.R. P.R.
VIIVI
I - V
Enrolment by medium of instructions
Examination results
Retention rate
GPI
Primary cycle U. primary cycleState
DISTRICT ELEMENTARY EDUCATION REPORT CARD : 2005-06
GirlsGrade
IIIIIIIVVVI
VIII
AllGirls
Total
VII
% TotalGrossness
School category
50
640
6 20 010
450
0 0 0
90 123 7040 00 4,6730 00 0
62 7 4,699 323490 215 98
0 0 083 2,914 0
0 0 00 0 0
7,641 494 32052
5044
P + UP P+sec/hs U.P. only UP+sec
School categoryP. only
0.0 0.0 0.0 0.0 0.02.0
Number of Clusters 17843
% Schools with SCR > 600.0 0.0 1.5 0.0
0.0 0.0 0.0 1.5 0.0% Schools with pre-primary sections 16.7 100.0 0.0 1.5 0.0% Schools with common toilets 96.1 100.0 0.0 96.9 0.0
% Schools with girls toilets 5.9 27.3 0.0 6.2 0.0% Schools with drinking water facility 100.0 100.0 0.0 100.0 0.0
% Enrolment in Govt. schools 93.9 59.0 0.0 98.3 0.099.0 100.0 0.0 98.5 0.0
% No female teacher schools (tch>=2) 14.7 0.0 0.0 21.5 0.00.4 0.0 0.0 0.6 0.0
0.0 0.0 0.0 0.0 0.0%Enrolment in schools without blackboard 0.0 0.0 0.0 2.4 0.0
2001-02 2002-03 2003-04 2004-05 2005-06IIIIIIIVV
VIVII
Total U.P
2,8112,1262,1071,9781,5611,825
1,677
2,8392,1782,1071,8081,827
1,6991,410
2,3891,5881,6161,4021,564
1,3321,194
128.9
61.0
159.1
73.7
137.6
122.3
0.0
0.00.0
1,4061,0481,035
989741906783
60362523221713
21261718232016
408
classrooms
940
2030
38.025.5
0.029.1
0.0
49.527.7
12.5
0.045.8
0.0
46.80.0
25.10.0
190
970
122 5 96 0 0 0 11 10 0 0 0 00 0 0 0 0 03 62 0 0 0 00 0 0 0 0 0
90 144 52 62 4 0 01 12 33 44 6 0 0 00 0 0 0 0 0 0 0
35 49 97 211 10 0 0 00 0 0 0 0 0 0 0
0 10 2 21 0 0 0 0
16552
0293
0
440
1090
187 0 12 6 0 3 6 171 1810000
00
100
0050
0000
1030
0010
440
2940
440
1080
Terminalgrade Passed
VII boysV girlsV boys
VII girls
0 with >60%
60.537096
0417
0
1.90.0
49.80.0
47.74.50.0
42.10.0
7193Mizo English
00
41190
9421194
0637
0
% Schools recvd.
82.40.00.0
93.80.0
82.40.00.0
96.90.0
0000
0000
0000
0000
3.68.70.06.40.0
9.03.04.11.8
3.83.0
4.54.9
2005-062004-052003-04
MIZORAM
0.0
Upper PrimaryPrimary
Sex ratio Sex ratio 0-6
3 12
VIII0.0
Enrolment of children
VIIITotal Pr.
413 40 00 0
0 0
%Teachers recvd.in-service training
Total schools* Rural schools* Total enrolment* Rural enrolment* Teachers*
45.5
100.0
66.756.6 58.6% SC enrolment% SC girls to SC enrolment% ST enrolment
16.7 0.0117.2
49.3 48.3 0.0 0.0
Position of teachers by educational qualification (other than para teacher)
(Previous academic year)Incentives : Number of beneficiaries
% ST girls to ST enrolment
% Girls
Number of villages
% 0 - 6 population
% SC population % ST population
% Urban population
% Schools with blackboard
% Enrolment in single-teacher schools
% Enrolment in schools without building
Primary Upperprimary
OBC EnrolmentPrimary U. Primary
% OBCEnrolment% OBC girls toOBC Enrolment
Pupil-teacher ratio (PTR)Student-classroom ratio (SCR)% Schools with <= 50 students% Schools with PTR > 100% Female teachers
% Schools established since 1995
Regular teachers Para-teachers
% minorrepairs
% majorrepairs
# = not applicable na = not available * Some totals may not match due to no response in classificatory data items
18.4 72.64.3 92.73.6 92.3
16.4 81.7
9.0 86.10.0 96.2
00
49.92220
23.50.0
52.218.6
48.01213
27.30.0
45.890.9
47.91123
40.00.0
27.313.8
0.000
0.00.00.00.0
18.5 na 98.1 95.1 94.1
97896748.016.9
Category
PrivateGovt.PrivateGovtPrivateGovt.PrivateGovt.PrivateGovt.
Total population (in 000's)
Number of blocks/taluks
District
Decadal growth rate
Primary onlyPrimary with upper primaryPrimary with upper primary & sec/higher sec.Upper primary onlyUpper primary with sec./higher secondary
% Single classroom schools% Single teacher schools
P + UP P+sec/hs U.P. only UP+secP. only
No response in school category
Primary with upper primaryPrimary with U.P. & sec/higherUpper primary onlyUpper primary with sec./higher sec
Primary only
Primary onlyPrimary with upper primaryPrimary with Upper primary & sec/higherUpper primary only
Para-teachers
School category
Upper primary with sec./higher secondary
Primary onlyPrimary with upper prim.
P. onlyP + UPP+sec/hsU.P. onlyUP+sec
NER(U.Prim)GER(U.Prim)NER (Primary)GER (Primary)
Transition ratePrim. to U. Prim
69.1
Performance indicators
SC/ST Enrolment
Indicators
Classrooms/Other rooms
Prim.with U.P.&Sec/H.SUpper Primary onlyU. Primary with Sec./H.S.
Basic Data, 2001
Data reported from
4,090 4,936 5,063
0
0 00
81.7
0.99
# ## #
# 6,908 196 141Total
1 - 4 5 - 7
6,995 8,932 9,022
96.3 20.998.7 24.995.6 12.596.4 18.8
Elementary Education: Report Card - SERCHHIP
Miz
ora
m
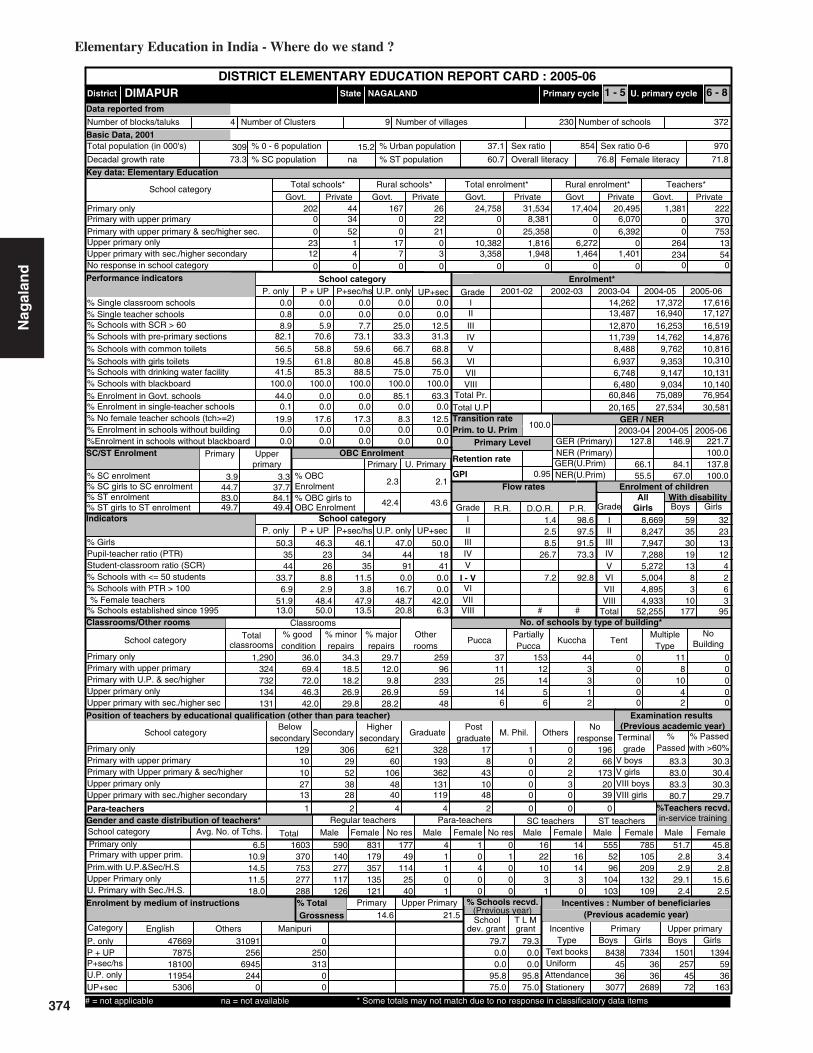
374
3.9 3.3
Key data: Elementary Education
309
DIMAPUR
(Previous academic year)
(Previous year)
Gender and caste distribution of teachers*
No. of schools by type of building*
BoysWith disability
Flow rates
Primary Level
Enrolment*
Number of schools
Grade
GER / NER
School category
Primary Upper primaryBoys Boys GirlsGirls
IncentiveType
School categoryMultiple
TypeKuccha
PartiallyPucca
PuccaTotal % good condition
Otherrooms
TentNo
Building
Classrooms
Belowsecondary
Highersecondary
Postgraduate
M. Phil.GraduateSecondarySchool category OthersNo
response
ST teachers
Total Male Female No res Male Female No res Male Female Male FemaleSC teachers
Text booksUniformAttendanceStationery
% Passed
Avg. No. of Tchs.
%
Female literacyOverall literacy
dev. grant grantSchool T L M
Male Female
IVV
IIIIII
Grade R.R. D.O.R. P.R.
VIIVI
# #
I - V
Enrolment by medium of instructions
Examination results
Retention rate
GPI
Primary cycle U. primary cycleState
DISTRICT ELEMENTARY EDUCATION REPORT CARD : 2005-06
GirlsGrade
IIIIIIIVVVI
VIII
AllGirls
Total
VII
% TotalGrossness
School category
00
2312
34 052 0
14
177
0 0 0
202 4422 021 0
0 10,3823 3,3580 0
167 26 17,404 20,4958,381 0 6,070
25,358 0 6,3921,816 6,272 0
0 0 01,948 1,464 1,401
24,758 31,534 1,3810
222370
P + UP P+sec/hs U.P. only UP+sec
School categoryP. only
0.0 0.0 0.0 0.0 0.00.8
Number of Clusters 372230
% Schools with SCR > 600.0 0.0 0.0 0.0
8.9 5.9 7.7 25.0 12.5% Schools with pre-primary sections 82.1 70.6 73.1 33.3 31.3% Schools with common toilets 56.5 58.8 59.6 66.7 68.8
% Schools with girls toilets 19.5 61.8 80.8 45.8 56.3% Schools with drinking water facility 41.5 85.3 88.5 75.0 75.0
% Enrolment in Govt. schools 44.0 0.0 0.0 85.1 63.3100.0 100.0 100.0 100.0 100.0
% No female teacher schools (tch>=2) 19.9 17.6 17.3 8.3 12.50.1 0.0 0.0 0.0 0.0
0.0 0.0 0.0 0.0 0.0%Enrolment in schools without blackboard 0.0 0.0 0.0 0.0 0.0
2001-02 2002-03 2003-04 2004-05 2005-06IIIIIIIVV
VIVII
Total U.P
17,61617,12716,51914,87610,81610,310
10,131
17,37216,94016,25314,762
9,762
9,3539,147
14,26213,48712,87011,739
8,488
6,9376,748
30,58127,53420,165
127.8
66.1
146.9
84.1
221.7
137.8
46.1
11.53.8
8,6698,2477,9477,2885,2725,0044,8954,933
52,255
5935301913
83
10177
32231312
4263
95
1,290
classrooms
324732134131
36.069.472.046.342.0
34.318.5
29.7
18.226.929.8
12.09.8
26.928.2
96233
5948
259 37 153 44 0 11 011 12 3 0 8 025 14 3 0 10 014 5 1 0 4 0
6 6 2 0 2 0
129 306 621 328 17 1 010 29 60 193 8 0 2 6610 52 106 362 43 0 2 17327 38 48 131 10 0 3 2013 28 40 119 48 0 0 39
1 2 4 4 2 0 0 0
590140277117126
179357135121
831 177 4 1 0 16 14 555 78549
1142540
1101
0400
1000
2210
31
1614
30
5296
104103
105209132109
Terminalgrade Passed
VIII boysV girlsV boys
VIII girls
196 with >60%
51.71603370753277288
2.82.9
29.12.4
45.83.42.8
15.62.5
47669English Others Manipuri
78751810011954
5306
31091256
6945244
0
0250313
00
% Schools recvd.
79.70.00.0
95.875.0
79.30.00.0
95.875.0
84384536
3077
1501257
4572
73343636
2689
13945936
163
6.510.914.511.518.0
100.0
0.95
2005-062004-052003-04
NAGALAND
47.9
Upper PrimaryPrimary
Sex ratio Sex ratio 0-6
4 9
VIII13.5
Enrolment of children
VIII 6,480 9,034 10,140Total Pr. 60,846 75,089 76,954
1 - 5 6 - 8
264 13234 54
0 0
0 753
%Teachers recvd.in-service training
Total schools* Rural schools* Total enrolment* Rural enrolment* Teachers*
14.6 21.5
100.0
100.055.5 67.0% SC enrolment% SC girls to SC enrolment% ST enrolment
44.7 37.783.049.7 49.4
2.3
42.4
2.1
43.6
Position of teachers by educational qualification (other than para teacher)
(Previous academic year)Incentives : Number of beneficiaries
% ST girls to ST enrolment
% Girls
Number of villages
% 0 - 6 population
% SC population % ST population
% Urban population
% Schools with blackboard
% Enrolment in single-teacher schools
% Enrolment in schools without building
Primary Upperprimary
OBC EnrolmentPrimary U. Primary
% OBCEnrolment% OBC girls toOBC Enrolment
Pupil-teacher ratio (PTR)Student-classroom ratio (SCR)% Schools with <= 50 students% Schools with PTR > 100% Female teachers
% Schools established since 1995
Regular teachers Para-teachers
% minorrepairs
% majorrepairs
# = not applicable na = not available * Some totals may not match due to no response in classificatory data items
1.4 98.62.5 97.58.5 91.5
26.7 73.3
7.2 92.83534
50.33544
33.76.9
51.913.0
46.32326
8.82.9
48.450.0
47.04491
0.016.748.720.8
50.01841
0.00.0
42.06.3
73.3 na 60.7 76.8 71.8
97085437.115.2
Category
PrivateGovt.PrivateGovtPrivateGovt.PrivateGovt.PrivateGovt.
Total population (in 000's)
Number of blocks/taluks
District
Decadal growth rate
Primary onlyPrimary with upper primaryPrimary with upper primary & sec/higher sec.Upper primary onlyUpper primary with sec./higher secondary
% Single classroom schools% Single teacher schools
P + UP P+sec/hs U.P. only UP+secP. only
No response in school category
Primary with upper primaryPrimary with U.P. & sec/higherUpper primary onlyUpper primary with sec./higher sec
Primary only
Primary onlyPrimary with upper primaryPrimary with Upper primary & sec/higherUpper primary only
Para-teachers
School category
Upper primary with sec./higher secondary
Primary onlyPrimary with upper prim.
P. onlyP + UPP+sec/hsU.P. onlyUP+sec
NER(U.Prim)GER(U.Prim)NER (Primary)GER (Primary)
Transition ratePrim. to U. Prim
84.1
SC/ST Enrolment
Indicators
Classrooms/Other rooms
Prim.with U.P.&Sec/H.SUpper Primary onlyU. Primary with Sec./H.S.
Basic Data, 2001
Data reported from
Performance indicators
83.3 30.383.0 30.483.3 30.380.7 29.7
Elementary Education in India - Where do we stand ?
Nag
alan
d

375
0.0070.0117.3 6.3
Key data: Elementary Education
310
KOHIMA
(Previous academic year)
(Previous year)
Gender and caste distribution of teachers*
No. of schools by type of building*
BoysWith disability
Flow rates
Primary Level
Enrolment*
Number of schools
Grade
GER / NER
School category
Primary Upper primaryBoys Boys GirlsGirls
IncentiveType
School categoryMultiple
TypeKuccha
PartiallyPucca
PuccaTotal % good condition
Otherrooms
TentNo
Building
Classrooms
Belowsecondary
Highersecondary
Postgraduate
M. Phil.GraduateSecondarySchool category OthersNo
response
ST teachers
Total Male Female No res Male Female No res Male Female Male FemaleSC teachers
Text booksUniformAttendanceStationery
% Passed
Avg. No. of Tchs.
%
Female literacyOverall literacy
dev. grant grantSchool T L M
Male Female
IVV
IIIIII
Grade R.R. D.O.R. P.R.
VIIVI
# #
I - V
Enrolment by medium of instructions
Examination results
Retention rate
GPI
Primary cycle U. primary cycleState
DISTRICT ELEMENTARY EDUCATION REPORT CARD : 2005-06
GirlsGrade
IIIIIIIVVVI
VIII
AllGirls
Total
VII
% TotalGrossness
School category
25
3722
22 163 3
02
3321
0 0 0
219 4618 14533 1,344
0 2,0662 3,5670 0
207 39 10,107 2,7763,088 63 2,317
25,015 909 10,2360 1,620 0
0 0 0904 3,129 904
11,372 3,263 1,04711
275267
P + UP P+sec/hs U.P. only UP+sec
School categoryP. only
1.1 0.0 0.0 0.0 0.011.7
Number of Clusters 418196
% Schools with SCR > 600.0 0.0 0.0 0.0
0.0 0.0 0.0 0.0 4.2% Schools with pre-primary sections 97.7 95.8 98.5 2.7 4.2% Schools with common toilets 23.0 58.3 79.4 51.4 54.2
% Schools with girls toilets 8.3 45.8 83.8 29.7 50.0% Schools with drinking water facility 43.0 66.7 91.2 70.3 66.7
% Enrolment in Govt. schools 77.7 4.5 5.1 100.0 79.8100.0 100.0 100.0 100.0 100.0
% No female teacher schools (tch>=2) 14.0 0.0 0.0 16.2 8.35.9 0.0 0.0 0.0 0.0
0.0 0.0 0.0 0.0 0.0%Enrolment in schools without blackboard 0.0 0.0 0.0 0.0 0.0
2001-02 2002-03 2003-04 2004-05 2005-06IIIIIIIVV
VIVII
Total U.P
8,3007,9117,1216,3795,7365,229
4,910
8,2857,6637,0826,4495,436
5,1054,916
7,7317,3586,6996,0355,278
5,1754,799
15,31714,94114,914
72.4
50.9
72.7
48.6
101.1
68.7
47.9
0.00.0
4,0063,8233,4343,1012,7122,5672,4162,615
24,674
51343317
8889
168
4423171818
628
136
1,302
classrooms
2271,085
182206
50.877.583.266.573.8
2.16.2
47.2
6.22.70.0
16.310.630.826.2
75317132110
355 45 111 106 0 3 010 8 5 0 1 042 14 2 0 9 019 13 5 0 0 011 12 1 0 0 0
175 327 439 321 34 0 310 36 73 126 30 0 2 123 107 298 558 119 0 2 3059 62 49 152 24 0 1 1429 39 38 149 44 0 6 0
0 0 4 1 0 0 0 0
666135475250180
143662102125
641 12 2 1 0 17 14 651 6270090
0100
0100
0000
30174
3529
14124
37
105279210149
129518
99118
Terminalgrade Passed
VIII boysV girlsV boys
VIII girls
20 with >60%
67.81322278
1139361305
9.610.135.611.1
66.79.18.7
28.416.0
14635English
323326359
20664471
% Schools recvd.
82.34.21.5
100.095.8
82.38.30.0
100.091.7
538720
266
255200
56
565830
306
265100
62
5.011.616.8
9.812.7
96.2
0.93
2005-062004-052003-04
NAGALAND
58.2
Upper PrimaryPrimary
Sex ratio Sex ratio 0-6
7 7
VIII4.4
Enrolment of children
VIII 4,940 4,920 5,178Total Pr. 33,101 34,915 35,447
1 - 5 6 - 8
361 0274 31
0 0
56 1,083
%Teachers recvd.in-service training
Total schools* Rural schools* Total enrolment* Rural enrolment* Teachers*
19.1 26.0
81.7
50.8
57.3 62.5
33.1 39.3% SC enrolment% SC girls to SC enrolment% ST enrolment
45.0 42.092.748.4 50.1 100.0 100.0
Position of teachers by educational qualification (other than para teacher)
(Previous academic year)Incentives : Number of beneficiaries
% ST girls to ST enrolment
% Girls
Number of villages
% 0 - 6 population
% SC population % ST population
% Urban population
% Schools with blackboard
% Enrolment in single-teacher schools
% Enrolment in schools without building
Primary Upperprimary
OBC EnrolmentPrimary U. Primary
% OBCEnrolment% OBC girls toOBC Enrolment
Pupil-teacher ratio (PTR)Student-classroom ratio (SCR)% Schools with <= 50 students% Schools with PTR > 100% Female teachers
% Schools established since 1995
Regular teachers Para-teachers
% minorrepairs
% majorrepairs
# = not applicable na = not available * Some totals may not match due to no response in classificatory data items
4.5 95.57.1 92.99.9 90.1
11.1 88.93.8 96.27.3 92.73.8 96.2
2423
49.21111
57.70.0
48.619.6
44.71214
8.30.0
51.433.3
53.06
1159.5
0.028.313.5
51.41522
8.30.0
41.04.2
50.0 na 90.5 74.5 68.2
96791124.815.1
Category
PrivateGovt.PrivateGovtPrivateGovt.PrivateGovt.PrivateGovt.
Total population (in 000's)
Number of blocks/taluks
District
Decadal growth rate
Primary onlyPrimary with upper primaryPrimary with upper primary & sec/higher sec.Upper primary onlyUpper primary with sec./higher secondary
% Single classroom schools% Single teacher schools
P + UP P+sec/hs U.P. only UP+secP. only
No response in school category
Primary with upper primaryPrimary with U.P. & sec/higherUpper primary onlyUpper primary with sec./higher sec
Primary only
Primary onlyPrimary with upper primaryPrimary with Upper primary & sec/higherUpper primary only
Para-teachers
School category
Upper primary with sec./higher secondary
Primary onlyPrimary with upper prim.
P. onlyP + UPP+sec/hsU.P. onlyUP+sec
NER(U.Prim)GER(U.Prim)NER (Primary)GER (Primary)
Transition ratePrim. to U. Prim
93.7
SC/ST Enrolment
Indicators
Classrooms/Other rooms
Prim.with U.P.&Sec/H.SUpper Primary onlyU. Primary with Sec./H.S.
Basic Data, 2001
Data reported from
Performance indicators
85.1 28.585.1 30.682.4 29.284.3 26.4
Elementary Education: Report Card - KOHIMA
Nag
alan
d

376
Elementary Education in India - Where do we stand ?
Nag
alan
d
0.0000.0000.0000.000
Key data: Elementary Education
232
MOKOKCHUNG
(Previous academic year)
(Previous year)
Gender and caste distribution of teachers*
No. of schools by type of building*
BoysWith disability
Flow rates
Primary Level
Enrolment*
Number of schools
Grade
GER / NER
School category
Primary Upper primaryBoys Boys GirlsGirls
IncentiveType
School categoryMultiple
TypeKuccha
PartiallyPucca
PuccaTotal % good condition
Otherrooms
TentNo
Building
Classrooms
Belowsecondary
Highersecondary
Postgraduate
M. Phil.GraduateSecondarySchool category OthersNo
response
ST teachers
Total Male Female No res Male Female No res Male Female Male FemaleSC teachers
Text booksUniformAttendanceStationery
% Passed
Avg. No. of Tchs.
%
Female literacyOverall literacy
dev. grant grantSchool T L M
Male Female
IVV
IIIIII
Grade R.R. D.O.R. P.R.
VIIVI
# #
I - V
Enrolment by medium of instructions
Examination results
Retention rate
GPI
Primary cycle U. primary cycleState
DISTRICT ELEMENTARY EDUCATION REPORT CARD : 2005-06
GirlsGrade
IIIIIIIVVVI
VIII
AllGirls
Total
VII
% TotalGrossness
School category
170
3417
32 727 0
10
3115
0 0 0
163 1128 2,77316 0
1 3,3090 2,7620 0
158 11 8,809 2,58513,199 1,030 12,06115,268 0 8,773
110 2,825 110
0 0 00 2,171 0
9,260 2,585 1,087263
68326
P + UP P+sec/hs U.P. only UP+sec
School categoryP. only
0.0 0.0 0.0 0.0 0.00.6
Number of Clusters 302114
% Schools with SCR > 600.0 0.0 0.0 0.0
1.1 14.3 11.1 0.0 0.0% Schools with pre-primary sections 100.0 100.0 100.0 0.0 0.0% Schools with common toilets 97.7 98.0 70.4 91.4 82.4
% Schools with girls toilets 9.8 34.7 81.5 34.3 35.3% Schools with drinking water facility 92.0 87.8 96.3 91.4 88.2
% Enrolment in Govt. schools 78.2 17.4 0.0 96.8 100.0100.0 100.0 100.0 100.0 100.0
% No female teacher schools (tch>=2) 8.0 0.0 0.0 8.6 17.60.4 0.0 0.0 0.0 0.0
0.0 0.0 0.0 0.0 0.0%Enrolment in schools without blackboard 0.0 0.0 0.0 0.0 0.0
2001-02 2002-03 2003-04 2004-05 2005-06IIIIIIIVV
VIVII
Total U.P
7,9707,4357,0796,0135,7875,442
5,103
7,5937,1516,8245,8145,573
5,1304,931
7,0866,6156,3265,4714,897
4,6374,419
14,98214,38613,069
89.9
60.3
93.4
63.7
155.9
93.4
49.8
0.00.0
3,9673,7053,5742,9952,9592,6912,5262,264
24,681
552720241313
44
160
2516
68
1113
76
92
971
classrooms
421413159154
17.035.453.320.115.6
45.042.0
38.0
29.154.744.8
22.617.725.239.6
115130
91105
248 29 105 37 0 2 015 18 11 0 5 0
8 10 2 0 7 019 15 1 0 0 011 3 2 0 1 0
165 341 362 261 25 0 133 105 152 275 16 0 0 8
9 56 129 187 23 0 0 148 86 52 189 16 0 0 0
8 14 13 83 7 0 0 0
0 0 0 0 0 0 0 0
589252185259
85
337220132
40
566 0 0 0 0 7 4 572 5580000
0000
0000
0000
9535
7310
16391
23470
294182128
40
Terminalgrade Passed
VIII boysV girlsV boys
VIII girls
0 with >60%
95.11155589405391125
34.10.0
98.895.3
92.449.3
0.098.580.0
11772English Others
1597215268
34192762
730000
% Schools recvd.
93.734.7
3.797.1
100.0
93.134.7
0.097.1
100.0
380814
0387
54137
00
352380
466
664180
00
6.612.015.011.2
7.4
97.6
1.01
2005-062004-052003-04
NAGALAND
54.3
Upper PrimaryPrimary
Sex ratio Sex ratio 0-6
6 6
VIII11.1
Enrolment of children
VIII 4,013 4,325 4,437Total Pr. 30,395 32,955 34,284
1 - 5 6 - 8
386 5125 0
0 0
0 405
%Teachers recvd.in-service training
Total schools* Rural schools* Total enrolment* Rural enrolment* Teachers*
16.5 22.0
100.0
72.9
84.0 79.7
59.0 61.1% SC enrolment% SC girls to SC enrolment% ST enrolment
0.0 0.0100.0
50.2 49.9 0.0 0.0
Position of teachers by educational qualification (other than para teacher)
(Previous academic year)Incentives : Number of beneficiaries
% ST girls to ST enrolment
% Girls
Number of villages
% 0 - 6 population
% SC population % ST population
% Urban population
% Schools with blackboard
% Enrolment in single-teacher schools
% Enrolment in schools without building
Primary Upperprimary
OBC EnrolmentPrimary U. Primary
% OBCEnrolment% OBC girls toOBC Enrolment
Pupil-teacher ratio (PTR)Student-classroom ratio (SCR)% Schools with <= 50 students% Schools with PTR > 100% Female teachers
% Schools established since 1995
Regular teachers Para-teachers
% minorrepairs
% majorrepairs
# = not applicable na = not available * Some totals may not match due to no response in classificatory data items
2.1 97.91.0 99.0
11.9 88.10.5 99.52.4 97.63.6 96.40.5 99.5
10.0 90.0
3738
49.91012
40.20.6
49.07.5
50.32738
0.02.0
57.216.3
50.59
228.60.0
33.88.6
50.92218
5.90.0
32.00.0
43.5 na 93.8 83.9 81.6
98991913.410.2
Category
PrivateGovt.PrivateGovtPrivateGovt.PrivateGovt.PrivateGovt.
Total population (in 000's)
Number of blocks/taluks
District
Decadal growth rate
Primary onlyPrimary with upper primaryPrimary with upper primary & sec/higher sec.Upper primary onlyUpper primary with sec./higher secondary
% Single classroom schools% Single teacher schools
P + UP P+sec/hs U.P. only UP+secP. only
No response in school category
Primary with upper primaryPrimary with U.P. & sec/higherUpper primary onlyUpper primary with sec./higher sec
Primary only
Primary onlyPrimary with upper primaryPrimary with Upper primary & sec/higherUpper primary only
Para-teachers
School category
Upper primary with sec./higher secondary
Primary onlyPrimary with upper prim.
P. onlyP + UPP+sec/hsU.P. onlyUP+sec
NER(U.Prim)GER(U.Prim)NER (Primary)GER (Primary)
Transition ratePrim. to U. Prim
100.0
SC/ST Enrolment
Indicators
Classrooms/Other rooms
Prim.with U.P.&Sec/H.SUpper Primary onlyU. Primary with Sec./H.S.
Basic Data, 2001
Data reported from
Performance indicators
85.8 33.286.1 35.884.5 33.584.3 32.5

377
0.0620.0530.2710.167
Key data: Elementary Education
261
MON
(Previous academic year)
(Previous year)
Gender and caste distribution of teachers*
No. of schools by type of building*
BoysWith disability
Flow rates
Primary Level
Enrolment*
Number of schools
Grade
GER / NER
School category
Primary Upper primaryBoys Boys GirlsGirls
IncentiveType
School categoryMultiple
TypeKuccha
PartiallyPucca
PuccaTotal % good condition
Otherrooms
TentNo
Building
Classrooms
Belowsecondary
Highersecondary
Postgraduate
M. Phil.GraduateSecondarySchool category OthersNo
response
ST teachers
Total Male Female No res Male Female No res Male Female Male FemaleSC teachers
Text booksUniformAttendanceStationery
% Passed
Avg. No. of Tchs.
%
Female literacyOverall literacy
dev. grant grantSchool T L M
Male Female
IVV
IIIIII
Grade R.R. D.O.R. P.R.
VIIVI
# #
I - V
Enrolment by medium of instructions
Examination results
Retention rate
GPI
Primary cycle U. primary cycleState
DISTRICT ELEMENTARY EDUCATION REPORT CARD : 2005-06
GirlsGrade
IIIIIIIVVVI
VIII
AllGirls
Total
VII
% TotalGrossness
School category
60
369
27 68 000
337
0 0 0
151 3515 868
2 00 4,3670 1,7650 0
145 26 16,999 4,60711,263 868 5,783
4,394 0 1,0630 3,496 0
0 0 00 1,115 0
18,225 6,478 69649
178289
P + UP P+sec/hs U.P. only UP+sec
School categoryP. only
0.0 0.0 0.0 0.0 0.01.1
Number of Clusters 272108
% Schools with SCR > 600.0 0.0 0.0 0.0
2.2 6.1 0.0 5.6 0.0% Schools with pre-primary sections 100.0 93.9 100.0 2.8 0.0% Schools with common toilets 49.5 69.7 75.0 47.2 33.3
% Schools with girls toilets 7.5 36.4 75.0 5.6 0.0% Schools with drinking water facility 32.3 75.8 87.5 47.2 33.3
% Enrolment in Govt. schools 73.8 7.2 0.0 100.0 100.0100.0 100.0 100.0 100.0 100.0
% No female teacher schools (tch>=2) 37.6 15.2 0.0 44.4 33.30.7 0.0 0.0 0.0 0.0
0.0 0.0 0.0 0.0 0.0%Enrolment in schools without blackboard 0.0 0.0 0.0 0.0 0.0
2001-02 2002-03 2003-04 2004-05 2005-06IIIIIIIVV
VIVII
Total U.P
10,1738,8558,0176,6484,0593,458
3,109
9,4038,2687,2405,3793,439
2,9833,287
8,4337,2946,6285,5853,349
2,5682,282
9,6089,5547,032
77.9
27.3
78.2
34.6
118.3
52.7
42.7
0.00.0
5,0354,3273,9393,3182,0531,7121,4481,444
23,276
142107
49561610
710
397
978659331710
47
313
935
classrooms
292137163
69
39.856.548.941.136.2
23.220.2
37.0
40.139.324.6
23.310.919.639.1
83437443
268 37 98 47 0 4 010 12 9 0 2 0
3 5 0 0 0 021 10 4 0 1 0
5 4 0 0 0 0
310 242 181 116 7 0 039 72 90 123 11 0 0 2
8 13 44 72 8 0 1 651 69 31 121 9 0 0 8
0 12 6 57 6 0 0 6
0 2 9 3 0 0 0 0
648233
86235
69
101604712
208 10 7 1 0 13 3 546 1873676
0020
1120
0000
11154
4311
11228
14732
71424511
Terminalgrade Passed
VIII boysV girlsV boys
VIII girls
10 with >60%
36.6874338153293
87
9.00.0
12.22.9
32.11.00.08.20.0
24703English
12131439443671765
% Schools recvd.
80.627.3
0.0100.0100.0
83.327.3
0.0100.0
88.9
36220
13327
8370
180
404307
414
98624
20
4.710.219.1
8.19.7
26.523.122.621.9
29.523.126.3
30.524.5
75.0
0.98
2005-062004-052003-04
NAGALAND
39.9
Upper PrimaryPrimary
Sex ratio Sex ratio 0-6
5 5
VIII0.0
Enrolment of children
VIII 2,182 3,284 3,041Total Pr. 31,289 33,729 37,752
1 - 5 6 - 8
293 087 0
0 0
0 153
%Teachers recvd.in-service training
Total schools* Rural schools* Total enrolment* Rural enrolment* Teachers*
9.2 9.0
100.0
48.0
69.2 63.5
26.5 20.7% SC enrolment% SC girls to SC enrolment% ST enrolment
46.0 34.699.349.5 48.1 35.0 0.0
Position of teachers by educational qualification (other than para teacher)
(Previous academic year)Incentives : Number of beneficiaries
% ST girls to ST enrolment
% Girls
Number of villages
% 0 - 6 population
% SC population % ST population
% Urban population
% Schools with blackboard
% Enrolment in single-teacher schools
% Enrolment in schools without building
Primary Upperprimary
OBC EnrolmentPrimary U. Primary
% OBCEnrolment% OBC girls toOBC Enrolment
Pupil-teacher ratio (PTR)Student-classroom ratio (SCR)% Schools with <= 50 students% Schools with PTR > 100% Female teachers
% Schools established since 1995
Regular teachers Para-teachers
% minorrepairs
% majorrepairs
# = not applicable na = not available * Some totals may not match due to no response in classificatory data items
1.8 75.622.2 55.9
3.2 72.3
10.7 66.2
3229
50.42826
7.51.1
23.918.3
47.53642
0.06.1
30.257.6
52.81527
11.10.0
16.78.3
50.02026
0.00.0
13.80.0
73.4 na 93.9 41.8 36.3
9738796.415.0
Category
PrivateGovt.PrivateGovtPrivateGovt.PrivateGovt.PrivateGovt.
Total population (in 000's)
Number of blocks/taluks
District
Decadal growth rate
Primary onlyPrimary with upper primaryPrimary with upper primary & sec/higher sec.Upper primary onlyUpper primary with sec./higher secondary
% Single classroom schools% Single teacher schools
P + UP P+sec/hs U.P. only UP+secP. only
No response in school category
Primary with upper primaryPrimary with U.P. & sec/higherUpper primary onlyUpper primary with sec./higher sec
Primary only
Primary onlyPrimary with upper primaryPrimary with Upper primary & sec/higherUpper primary only
Para-teachers
School category
Upper primary with sec./higher secondary
Primary onlyPrimary with upper prim.
P. onlyP + UPP+sec/hsU.P. onlyUP+sec
NER(U.Prim)GER(U.Prim)NER (Primary)GER (Primary)
Transition ratePrim. to U. Prim
99.2
SC/ST Enrolment
Indicators
Classrooms/Other rooms
Prim.with U.P.&Sec/H.SUpper Primary onlyU. Primary with Sec./H.S.
Basic Data, 2001
Data reported from
Performance indicators
77.3 6.577.6 5.674.1 6.970.1 8.6
Elementary Education: Report Card - MON
Nag
alan
d

378
Elementary Education in India - Where do we stand ?
Nag
alan
d
0.0000.0000.0000.000
Key data: Elementary Education
148
PHEK
(Previous academic year)
(Previous year)
Gender and caste distribution of teachers*
No. of schools by type of building*
BoysWith disability
Flow rates
Primary Level
Enrolment*
Number of schools
Grade
GER / NER
School category
Primary Upper primaryBoys Boys GirlsGirls
IncentiveType
School categoryMultiple
TypeKuccha
PartiallyPucca
PuccaTotal % good condition
Otherrooms
TentNo
Building
Classrooms
Belowsecondary
Highersecondary
Postgraduate
M. Phil.GraduateSecondarySchool category OthersNo
response
ST teachers
Total Male Female No res Male Female No res Male Female Male FemaleSC teachers
Text booksUniformAttendanceStationery
% Passed
Avg. No. of Tchs.
%
Female literacyOverall literacy
dev. grant grantSchool T L M
Male Female
IVV
IIIIII
Grade R.R. D.O.R. P.R.
VIIVI
# #
I - V
Enrolment by medium of instructions
Examination results
Retention rate
GPI
Primary cycle U. primary cycleState
DISTRICT ELEMENTARY EDUCATION REPORT CARD : 2005-06
GirlsGrade
IIIIIIIVVVI
VIII
AllGirls
Total
VII
% TotalGrossness
School category
10
3319
31 113 0
11
3218
0 0 0
123 1627 8710 0
1 2,6551 2,5490 0
121 15 8,332 1,1948,029 87 6,8376,422 0 5,130
100 2,508 100
0 0 025 2,429 25
8,635 1,520 5606
103310
P + UP P+sec/hs U.P. only UP+sec
School categoryP. only
0.0 0.0 0.0 0.0 5.05.8
Number of Clusters 238103
% Schools with SCR > 600.0 0.0 0.0 0.0
0.0 6.3 7.7 0.0 5.0% Schools with pre-primary sections 98.6 87.5 92.3 0.0 0.0% Schools with common toilets 14.4 50.0 76.9 58.8 25.0
% Schools with girls toilets 2.2 37.5 69.2 20.6 10.0% Schools with drinking water facility 33.1 59.4 84.6 70.6 55.0
% Enrolment in Govt. schools 85.0 1.1 0.0 96.4 99.0100.0 100.0 100.0 100.0 100.0
% No female teacher schools (tch>=2) 21.6 9.4 0.0 26.5 20.02.4 0.0 0.0 0.0 0.0
0.0 0.0 0.0 0.0 0.0%Enrolment in schools without blackboard 0.0 0.0 0.0 0.0 0.0
2001-02 2002-03 2003-04 2004-05 2005-06IIIIIIIVV
VIVII
Total U.P
5,1554,9584,5933,6373,5063,011
2,784
4,8384,5484,0783,3513,175
2,9862,932
4,4304,0703,7823,4523,112
2,6152,090
8,1738,5056,693
87.1
48.3
88.3
58.7
112.9
77.9
45.9
0.030.8
2,4472,3722,1901,7141,6931,4641,3841,183
14,447
11492805157293126
480
9368494233332636
380
713
classrooms
269186153
99
20.129.070.420.914.1
38.440.5
41.5
18.858.231.3
30.510.820.954.5
92579150
190 10 66 59 0 4 08 12 9 0 3 02 2 2 0 7 06 22 5 0 1 02 14 2 0 2 0
117 199 224 113 9 0 019 51 103 119 16 0 0 8
0 18 47 48 3 0 0 041 58 45 130 17 1 0 0
7 17 21 58 7 0 1 0
0 0 0 2 0 0 0 0
442190
67249
84
118494327
220 0 1 0 0 4 4 433 2158000
0001
0000
0000
13
146
3001
15156
19768
104454226
Terminalgrade Passed
VIII boysV girlsV boys
VIII girls
0 with >60%
79.2663316116292112
3.21.5
57.427.1
65.90.0
10.267.422.2
10155English Others
8116588927552574
00
53300
% Schools recvd.
87.13.10.0
97.195.0
87.13.10.0
97.195.0
353900
411
2295000
333500
374
2516000
4.89.98.98.65.6
11.811.913.111.4
12.611.618.2
13.912.4
83.0
0.91
2005-062004-052003-04
NAGALAND
42.2
Upper PrimaryPrimary
Sex ratio Sex ratio 0-6
5 5
VIII7.7
Enrolment of children
VIII 1,988 2,587 2,378Total Pr. 18,846 19,990 21,849
1 - 5 6 - 8
286 6108 4
0 0
0 116
%Teachers recvd.in-service training
Total schools* Rural schools* Total enrolment* Rural enrolment* Teachers*
17.9 28.8
92.7
55.4
78.5 71.8
39.0 43.1% SC enrolment% SC girls to SC enrolment% ST enrolment
0.0 0.0100.0
47.7 49.3 0.0 0.0
Position of teachers by educational qualification (other than para teacher)
(Previous academic year)Incentives : Number of beneficiaries
% ST girls to ST enrolment
% Girls
Number of villages
% 0 - 6 population
% SC population % ST population
% Urban population
% Schools with blackboard
% Enrolment in single-teacher schools
% Enrolment in schools without building
Primary Upperprimary
OBC EnrolmentPrimary U. Primary
% OBCEnrolment% OBC girls toOBC Enrolment
Pupil-teacher ratio (PTR)Student-classroom ratio (SCR)% Schools with <= 50 students% Schools with PTR > 100% Female teachers
% Schools established since 1995
Regular teachers Para-teachers
% minorrepairs
% majorrepairs
# = not applicable na = not available * Some totals may not match due to no response in classificatory data items
7.1 79.8
3.1 83.00.5 87.25.6 81.8
23.4 65.0
3555
48.61514
33.10.0
33.212.9
46.72630
3.10.0
37.331.3
49.79
1817.6
0.014.714.7
54.42326
10.00.0
24.120.0
45.1 na 96.5 70.6 62.3
9269218.718.3
Category
PrivateGovt.PrivateGovtPrivateGovt.PrivateGovt.PrivateGovt.
Total population (in 000's)
Number of blocks/taluks
District
Decadal growth rate
Primary onlyPrimary with upper primaryPrimary with upper primary & sec/higher sec.Upper primary onlyUpper primary with sec./higher secondary
% Single classroom schools% Single teacher schools
P + UP P+sec/hs U.P. only UP+secP. only
No response in school category
Primary with upper primaryPrimary with U.P. & sec/higherUpper primary onlyUpper primary with sec./higher sec
Primary only
Primary onlyPrimary with upper primaryPrimary with Upper primary & sec/higherUpper primary only
Para-teachers
School category
Upper primary with sec./higher secondary
Primary onlyPrimary with upper prim.
P. onlyP + UPP+sec/hsU.P. onlyUP+sec
NER(U.Prim)GER(U.Prim)NER (Primary)GER (Primary)
Transition ratePrim. to U. Prim
100.0
SC/ST Enrolment
Indicators
Classrooms/Other rooms
Prim.with U.P.&Sec/H.SUpper Primary onlyU. Primary with Sec./H.S.
Basic Data, 2001
Data reported from
Performance indicators
82.3 23.481.4 24.081.2 20.076.0 19.1

379
0.0960.2140.3380.224
Key data: Elementary Education
415
TUENSANG
(Previous academic year)
(Previous year)
Gender and caste distribution of teachers*
No. of schools by type of building*
BoysWith disability
Flow rates
Primary Level
Enrolment*
Number of schools
Grade
GER / NER
School category
Primary Upper primaryBoys Boys GirlsGirls
IncentiveType
School categoryMultiple
TypeKuccha
PartiallyPucca
PuccaTotal % good condition
Otherrooms
TentNo
Building
Classrooms
Belowsecondary
Highersecondary
Postgraduate
M. Phil.GraduateSecondarySchool category OthersNo
response
ST teachers
Total Male Female No res Male Female No res Male Female Male FemaleSC teachers
Text booksUniformAttendanceStationery
% Passed
Avg. No. of Tchs.
%
Female literacyOverall literacy
dev. grant grantSchool T L M
Male Female
IVV
IIIIII
Grade R.R. D.O.R. P.R.
VIIVI
# #
I - V
Enrolment by medium of instructions
Examination results
Retention rate
GPI
Primary cycle U. primary cycleState
DISTRICT ELEMENTARY EDUCATION REPORT CARD : 2005-06
GirlsGrade
IIIIIIIVVVI
VIII
AllGirls
Total
VII
% TotalGrossness
School category
162
5119
38 1422 1
01
4918
0 0 0
286 3431 3,60016 574
0 4,8711 3,1720 0
280 32 23,324 2,67013,070 2,726 9,04613,184 90 8,072
0 4,532 0
0 0 099 2,880 99
24,251 2,871 1,849253
179330
P + UP P+sec/hs U.P. only UP+sec
School categoryP. only
0.0 0.0 0.0 0.0 0.01.9
Number of Clusters 469230
% Schools with SCR > 600.0 0.0 0.0 0.0
0.0 7.4 4.2 0.0 0.0% Schools with pre-primary sections 98.8 100.0 100.0 0.0 0.0% Schools with common toilets 23.4 72.2 83.3 39.2 50.0
% Schools with girls toilets 4.1 55.6 66.7 15.7 20.0% Schools with drinking water facility 28.8 72.2 58.3 47.1 30.0
% Enrolment in Govt. schools 89.4 21.6 4.2 100.0 97.0100.0 100.0 100.0 100.0 100.0
% No female teacher schools (tch>=2) 23.8 11.1 8.3 15.7 5.00.8 0.0 0.0 0.0 0.0
0.0 0.0 0.0 0.0 0.0%Enrolment in schools without blackboard 0.0 0.0 0.0 0.0 0.0
2001-02 2002-03 2003-04 2004-05 2005-06IIIIIIIVV
VIVII
Total U.P
14,39811,042
9,7628,3516,4465,545
5,035
11,16010,134
9,2498,0436,235
5,2634,448
10,0339,0488,1797,4205,261
4,2864,034
15,69313,74011,919
61.9
28.9
64.5
30.8
97.2
48.4
45.1
0.08.3
6,8845,2754,8384,0083,1842,7882,5122,520
32,009
16294936843361624
536
10167624834141619
361
1,690
classrooms
563372248143
10.128.465.917.315.4
43.247.6
46.7
21.243.153.8
24.012.939.530.8
140120121
71
425 33 146 141 0 0 09 28 16 0 1 0
12 10 2 0 0 017 27 7 0 0 0
5 11 4 0 0 0
467 771 605 175 3 0 347 134 151 232 19 0 0 0
8 43 60 201 26 0 0 159 138 89 174 11 0 1 131 43 19 114 36 0 2 1
1 2 0 1 0 0 0 0
1396388209363192
194129110
53
629 1 2 0 0 14 5 1355 6131101
0110
0000
0000
83433116
2614
21
27671
318149
15477
10852
Terminalgrade Passed
VIII boysV girlsV boys
VIII girls
2 with >60%
47.92028583340474246
15.25.7
18.710.4
35.510.8
4.719.1
7.5
26930English Others
1630513758
48713144
192365
00
127
% Schools recvd.
83.825.9
4.290.275.0
77.224.1
4.282.480.0
12744010
3624040
13404050
4120040
6.310.814.2
9.312.3
9.78.58.69.0
9.911.312.8
10.19.1
80.6
0.94
2005-062004-052003-04
NAGALAND
37.9
Upper PrimaryPrimary
Sex ratio Sex ratio 0-6
11 11
VIII12.5
Enrolment of children
VIII 3,599 4,029 5,113Total Pr. 39,941 44,821 49,999
1 - 5 6 - 8
474 0241 5
0 0
24 316
%Teachers recvd.in-service training
Total schools* Rural schools* Total enrolment* Rural enrolment* Teachers*
27.8 30.9
70.2
33.5
51.2 52.6
23.4 24.0% SC enrolment% SC girls to SC enrolment% ST enrolment
41.1 50.999.148.4 49.8 37.4 46.7
Position of teachers by educational qualification (other than para teacher)
(Previous academic year)Incentives : Number of beneficiaries
% ST girls to ST enrolment
% Girls
Number of villages
% 0 - 6 population
% SC population % ST population
% Urban population
% Schools with blackboard
% Enrolment in single-teacher schools
% Enrolment in schools without building
Primary Upperprimary
OBC EnrolmentPrimary U. Primary
% OBCEnrolment% OBC girls toOBC Enrolment
Pupil-teacher ratio (PTR)Student-classroom ratio (SCR)% Schools with <= 50 students% Schools with PTR > 100% Female teachers
% Schools established since 1995
Regular teachers Para-teachers
% minorrepairs
% majorrepairs
# = not applicable na = not available * Some totals may not match due to no response in classificatory data items
3.1 88.58.9 82.5
18.7 72.39.3 80.66.9 83.94.0 86.1
3740
49.91316
29.70.0
31.012.2
47.22930
5.60.0
33.318.5
55.01020
23.50.0
23.215.7
52.71323
10.00.0
21.50.0
78.1 na 96.0 50.6 45.6
9588977.214.2
Category
PrivateGovt.PrivateGovtPrivateGovt.PrivateGovt.PrivateGovt.
Total population (in 000's)
Number of blocks/taluks
District
Decadal growth rate
Primary onlyPrimary with upper primaryPrimary with upper primary & sec/higher sec.Upper primary onlyUpper primary with sec./higher secondary
% Single classroom schools% Single teacher schools
P + UP P+sec/hs U.P. only UP+secP. only
No response in school category
Primary with upper primaryPrimary with U.P. & sec/higherUpper primary onlyUpper primary with sec./higher sec
Primary only
Primary onlyPrimary with upper primaryPrimary with Upper primary & sec/higherUpper primary only
Para-teachers
School category
Upper primary with sec./higher secondary
Primary onlyPrimary with upper prim.
P. onlyP + UPP+sec/hsU.P. onlyUP+sec
NER(U.Prim)GER(U.Prim)NER (Primary)GER (Primary)
Transition ratePrim. to U. Prim
98.9
SC/ST Enrolment
Indicators
Classrooms/Other rooms
Prim.with U.P.&Sec/H.SUpper Primary onlyU. Primary with Sec./H.S.
Basic Data, 2001
Data reported from
Performance indicators
79.1 22.980.7 22.977.3 24.978.6 27.0
Elementary Education: Report Card - TUENSANG
Nag
alan
d

380
Elementary Education in India - Where do we stand ?
Nag
alan
d
0.0700.0260.1880.189
Key data: Elementary Education
161
WOKHA
(Previous academic year)
(Previous year)
Gender and caste distribution of teachers*
No. of schools by type of building*
BoysWith disability
Flow rates
Primary Level
Enrolment*
Number of schools
Grade
GER / NER
School category
Primary Upper primaryBoys Boys GirlsGirls
IncentiveType
School categoryMultiple
TypeKuccha
PartiallyPucca
PuccaTotal % good condition
Otherrooms
TentNo
Building
Classrooms
Belowsecondary
Highersecondary
Postgraduate
M. Phil.GraduateSecondarySchool category OthersNo
response
ST teachers
Total Male Female No res Male Female No res Male Female Male FemaleSC teachers
Text booksUniformAttendanceStationery
% Passed
Avg. No. of Tchs.
%
Female literacyOverall literacy
dev. grant grantSchool T L M
Male Female
IVV
IIIIII
Grade R.R. D.O.R. P.R.
VIIVI
# #
I - V
Enrolment by medium of instructions
Examination results
Retention rate
GPI
Primary cycle U. primary cycleState
DISTRICT ELEMENTARY EDUCATION REPORT CARD : 2005-06
GirlsGrade
IIIIIIIVVVI
VIII
AllGirls
Total
VII
% TotalGrossness
School category
31
158
19 318 1
00
157
0 0 0
104 1817 591
6 4230 2,7020 1,7850 0
101 15 12,183 5,0026,283 591 5,1058,770 423 2,530
0 2,702 0
0 0 00 1,299 0
12,624 5,981 48829
93155
P + UP P+sec/hs U.P. only UP+sec
School categoryP. only
0.8 0.0 0.0 0.0 0.04.9
Number of Clusters 186111
% Schools with SCR > 600.0 0.0 0.0 0.0
5.7 18.2 36.8 26.7 12.5% Schools with pre-primary sections 88.5 59.1 57.9 20.0 0.0% Schools with common toilets 34.4 50.0 42.1 60.0 50.0
% Schools with girls toilets 2.5 13.6 31.6 26.7 25.0% Schools with drinking water facility 41.0 45.5 57.9 53.3 12.5
% Enrolment in Govt. schools 67.9 8.6 4.6 100.0 100.0100.0 100.0 100.0 100.0 100.0
% No female teacher schools (tch>=2) 29.5 22.7 10.5 53.3 25.01.2 0.0 0.0 0.0 0.0
0.0 0.0 0.0 0.0 0.0%Enrolment in schools without blackboard 0.0 0.0 0.0 0.0 0.0
2001-02 2002-03 2003-04 2004-05 2005-06IIIIIIIVV
VIVII
Total U.P
7,2617,2356,4636,3913,2952,878
2,842
6,7066,3075,8255,4633,885
3,3333,137
5,7014,9914,6084,0463,844
3,5543,465
8,5149,65410,486
89.7
63.3
99.6
53.2
159.7
67.1
51.0
0.021.1
3,6743,6413,1863,2191,6891,4581,4301,427
19,724
30152310
9432
96
201214
57541
68
590
classrooms
197196
6559
23.730.510.227.710.2
38.359.4
38.0
78.136.947.5
10.211.735.442.4
39474540
162 13 67 40 0 2 03 12 6 0 1 01 15 3 0 0 04 9 2 0 0 01 7 0 0 0 0
62 174 208 100 5 0 02 52 55 44 4 0 0 265 15 41 93 27 1 1 8
31 29 26 48 3 0 0 36 16 5 51 4 0 0 34
2 1 7 7 1 0 0 0
38795
114120
68
62761630
164 22 4 4 0 10 4 378 16226
14
18
1002
0502
0000
7514
3701
8573
11552
55701629
Terminalgrade Passed
VIII boysV girlsV boys
VIII girls
24 with >60%
73.1581184196140120
4.214.926.7
0.0
63.70.0
18.525.0
0.0
17907English Others
6874919327021785
6980000
% Schools recvd.
84.49.10.0
100.087.5
82.04.50.0
93.387.5
150500
531
67800
50
147600
556
63300
62
4.88.4
10.39.3
15.0
2.82.63.02.1
2.82.94.7
3.22.7
71.7
1.01
2005-062004-052003-04
NAGALAND
41.3
Upper PrimaryPrimary
Sex ratio Sex ratio 0-6
4 41
VIII5.3
Enrolment of children
VIII 3,467 3,184 2,794Total Pr. 23,190 28,186 30,645
1 - 5 6 - 8
140 0120 0
0 0
15 181
%Teachers recvd.in-service training
Total schools* Rural schools* Total enrolment* Rural enrolment* Teachers*
11.1 24.3
100.0
50.8
81.6 81.3
51.3 35.4% SC enrolment% SC girls to SC enrolment% ST enrolment
46.6 50.099.750.3 50.7 12.5 33.3
Position of teachers by educational qualification (other than para teacher)
(Previous academic year)Incentives : Number of beneficiaries
% ST girls to ST enrolment
% Girls
Number of villages
% 0 - 6 population
% SC population % ST population
% Urban population
% Schools with blackboard
% Enrolment in single-teacher schools
% Enrolment in schools without building
Primary Upperprimary
OBC EnrolmentPrimary U. Primary
% OBCEnrolment% OBC girls toOBC Enrolment
Pupil-teacher ratio (PTR)Student-classroom ratio (SCR)% Schools with <= 50 students% Schools with PTR > 100% Female teachers
% Schools established since 1995
Regular teachers Para-teachers
% minorrepairs
% majorrepairs
# = not applicable na = not available * Some totals may not match due to no response in classificatory data items
39.9 58.025.1 71.7
6.5 90.814.6 82.512.8 84.3
4747
50.43232
14.80.8
28.94.9
49.13735
0.00.0
33.722.7
49.51942
0.00.0
11.40.0
52.41530
0.00.0
26.70.0
95.0 na 95.5 80.5 75.3
98592723.313.6
Category
PrivateGovt.PrivateGovtPrivateGovt.PrivateGovt.PrivateGovt.
Total population (in 000's)
Number of blocks/taluks
District
Decadal growth rate
Primary onlyPrimary with upper primaryPrimary with upper primary & sec/higher sec.Upper primary onlyUpper primary with sec./higher secondary
% Single classroom schools% Single teacher schools
P + UP P+sec/hs U.P. only UP+secP. only
No response in school category
Primary with upper primaryPrimary with U.P. & sec/higherUpper primary onlyUpper primary with sec./higher sec
Primary only
Primary onlyPrimary with upper primaryPrimary with Upper primary & sec/higherUpper primary only
Para-teachers
School category
Upper primary with sec./higher secondary
Primary onlyPrimary with upper prim.
P. onlyP + UPP+sec/hsU.P. onlyUP+sec
NER(U.Prim)GER(U.Prim)NER (Primary)GER (Primary)
Transition ratePrim. to U. Prim
99.7
SC/ST Enrolment
Indicators
Classrooms/Other rooms
Prim.with U.P.&Sec/H.SUpper Primary onlyU. Primary with Sec./H.S.
Basic Data, 2001
Data reported from
Performance indicators
89.3 21.487.8 21.781.5 22.078.5 21.8
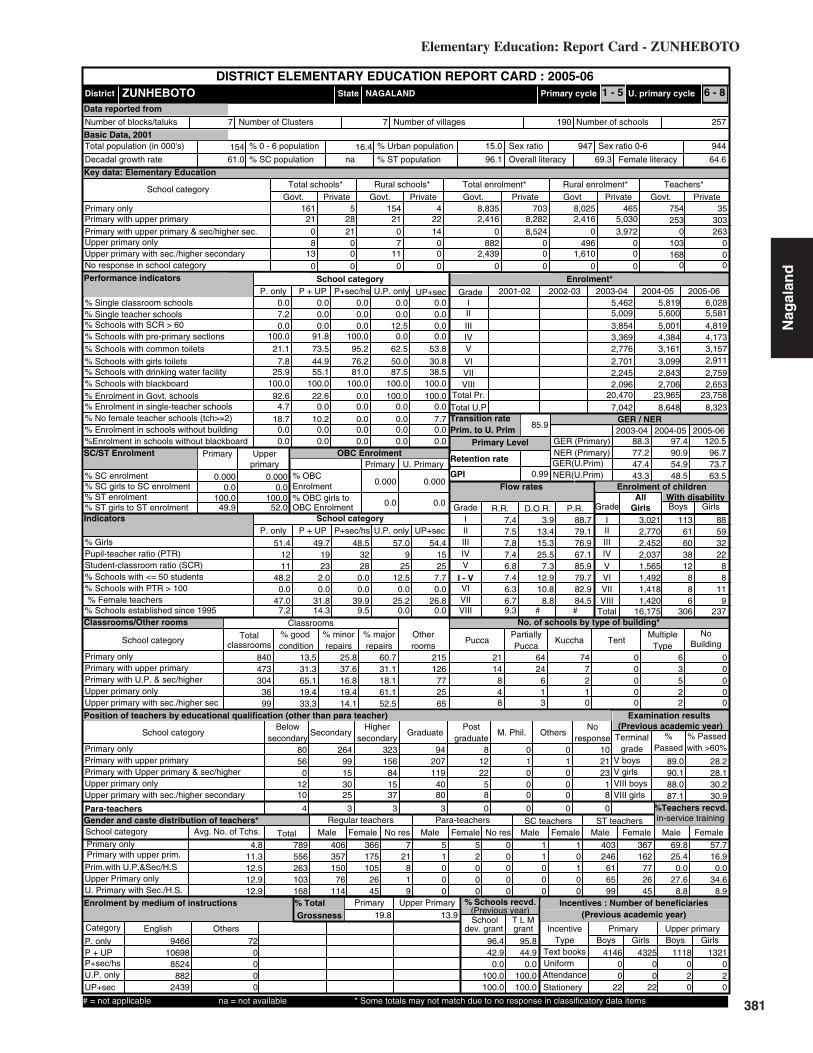
381
0.0000.0000.0000.000
Key data: Elementary Education
154
ZUNHEBOTO
(Previous academic year)
(Previous year)
Gender and caste distribution of teachers*
No. of schools by type of building*
BoysWith disability
Flow rates
Primary Level
Enrolment*
Number of schools
Grade
GER / NER
School category
Primary Upper primaryBoys Boys GirlsGirls
IncentiveType
School categoryMultiple
TypeKuccha
PartiallyPucca
PuccaTotal % good condition
Otherrooms
TentNo
Building
Classrooms
Belowsecondary
Highersecondary
Postgraduate
M. Phil.GraduateSecondarySchool category OthersNo
response
ST teachers
Total Male Female No res Male Female No res Male Female Male FemaleSC teachers
Text booksUniformAttendanceStationery
% Passed
Avg. No. of Tchs.
%
Female literacyOverall literacy
dev. grant grantSchool T L M
Male Female
IVV
IIIIII
Grade R.R. D.O.R. P.R.
VIIVI
# #
I - V
Enrolment by medium of instructions
Examination results
Retention rate
GPI
Primary cycle U. primary cycleState
DISTRICT ELEMENTARY EDUCATION REPORT CARD : 2005-06
GirlsGrade
IIIIIIIVVVI
VIII
AllGirls
Total
VII
% TotalGrossness
School category
2108
13
28 2121 0
00
711
0 0 0
161 522 2,41614 0
0 8820 2,4390 0
154 4 8,025 4658,282 2,416 5,0308,524 0 3,972
0 496 0
0 0 00 1,610 0
8,835 703 754253
35303
P + UP P+sec/hs U.P. only UP+sec
School categoryP. only
0.0 0.0 0.0 0.0 0.07.2
Number of Clusters 257190
% Schools with SCR > 600.0 0.0 0.0 0.0
0.0 0.0 0.0 12.5 0.0% Schools with pre-primary sections 100.0 91.8 100.0 0.0 0.0% Schools with common toilets 21.1 73.5 95.2 62.5 53.8
% Schools with girls toilets 7.8 44.9 76.2 50.0 30.8% Schools with drinking water facility 25.9 55.1 81.0 87.5 38.5
% Enrolment in Govt. schools 92.6 22.6 0.0 100.0 100.0100.0 100.0 100.0 100.0 100.0
% No female teacher schools (tch>=2) 18.7 10.2 0.0 0.0 7.74.7 0.0 0.0 0.0 0.0
0.0 0.0 0.0 0.0 0.0%Enrolment in schools without blackboard 0.0 0.0 0.0 0.0 0.0
2001-02 2002-03 2003-04 2004-05 2005-06IIIIIIIVV
VIVII
Total U.P
6,0285,5814,8194,1733,1572,911
2,759
5,8195,6005,0014,3843,161
3,0992,843
5,4625,0093,8543,3692,776
2,7012,245
8,3238,6487,042
88.3
47.4
97.4
54.9
120.5
73.7
48.5
0.00.0
3,0212,7702,4522,0371,5651,4921,4181,420
16,175
11361603812
886
306
88593222
88
119
237
840
classrooms
473304
3699
13.531.365.119.433.3
25.837.6
60.7
16.819.414.1
31.118.161.152.5
126772565
215 21 64 74 0 6 014 24 7 0 3 0
8 6 2 0 5 04 1 1 0 2 08 3 0 0 2 0
80 264 323 94 8 0 056 99 156 207 12 1 1 21
0 15 84 119 22 0 0 2312 30 15 40 5 0 0 110 25 37 80 8 0 0 8
4 3 3 3 0 0 0 0
406357150
76114
175105
2645
366 7 5 5 0 1 1 403 36721
819
1000
2000
0000
1000
0100
246616599
162772645
Terminalgrade Passed
VIII boysV girlsV boys
VIII girls
10 with >60%
69.8789556263103168
25.40.0
27.68.8
57.716.9
0.034.6
8.9
9466English Others
106988524
8822439
720000
% Schools recvd.
96.442.9
0.0100.0100.0
95.844.9
0.0100.0100.0
414600
22
1118020
432500
22
1321020
4.811.312.512.912.9
7.47.57.87.4
6.36.79.3
6.87.4
85.9
0.99
2005-062004-052003-04
NAGALAND
39.9
Upper PrimaryPrimary
Sex ratio Sex ratio 0-6
7 7
VIII9.5
Enrolment of children
VIII 2,096 2,706 2,653Total Pr. 20,470 23,965 23,758
1 - 5 6 - 8
103 0168 0
0 0
0 263
%Teachers recvd.in-service training
Total schools* Rural schools* Total enrolment* Rural enrolment* Teachers*
19.8 13.9
96.7
63.5
77.2 90.9
43.3 48.5% SC enrolment% SC girls to SC enrolment% ST enrolment
0.0 0.0100.0
49.9 52.0 0.0 0.0
Position of teachers by educational qualification (other than para teacher)
(Previous academic year)Incentives : Number of beneficiaries
% ST girls to ST enrolment
% Girls
Number of villages
% 0 - 6 population
% SC population % ST population
% Urban population
% Schools with blackboard
% Enrolment in single-teacher schools
% Enrolment in schools without building
Primary Upperprimary
OBC EnrolmentPrimary U. Primary
% OBCEnrolment% OBC girls toOBC Enrolment
Pupil-teacher ratio (PTR)Student-classroom ratio (SCR)% Schools with <= 50 students% Schools with PTR > 100% Female teachers
% Schools established since 1995
Regular teachers Para-teachers
% minorrepairs
% majorrepairs
# = not applicable na = not available * Some totals may not match due to no response in classificatory data items
3.9 88.713.4 79.115.3 76.925.5 67.1
7.3 85.912.9 79.710.8 82.9
8.8 84.5
2832
51.41211
48.20.0
47.07.2
49.71923
2.00.0
31.814.3
57.09
2512.5
0.025.2
0.0
54.41525
7.70.0
26.80.0
61.0 na 96.1 69.3 64.6
94494715.016.4
Category
PrivateGovt.PrivateGovtPrivateGovt.PrivateGovt.PrivateGovt.
Total population (in 000's)
Number of blocks/taluks
District
Decadal growth rate
Primary onlyPrimary with upper primaryPrimary with upper primary & sec/higher sec.Upper primary onlyUpper primary with sec./higher secondary
% Single classroom schools% Single teacher schools
P + UP P+sec/hs U.P. only UP+secP. only
No response in school category
Primary with upper primaryPrimary with U.P. & sec/higherUpper primary onlyUpper primary with sec./higher sec
Primary only
Primary onlyPrimary with upper primaryPrimary with Upper primary & sec/higherUpper primary only
Para-teachers
School category
Upper primary with sec./higher secondary
Primary onlyPrimary with upper prim.
P. onlyP + UPP+sec/hsU.P. onlyUP+sec
NER(U.Prim)GER(U.Prim)NER (Primary)GER (Primary)
Transition ratePrim. to U. Prim
100.0
SC/ST Enrolment
Indicators
Classrooms/Other rooms
Prim.with U.P.&Sec/H.SUpper Primary onlyU. Primary with Sec./H.S.
Basic Data, 2001
Data reported from
Performance indicators
89.0 28.290.1 28.188.0 30.287.1 30.9
Elementary Education: Report Card - ZUNHEBOTO
Nag
alan
d

382
Elementary Education in India - Where do we stand ?
Ori
ssa
21.4 16.4
Key data: Elementary Education
1140
ANGUL
(Previous academic year)
(Previous year)
Gender and caste distribution of teachers*
No. of schools by type of building*
BoysWith disability
Flow rates
Primary Level
Enrolment*
Number of schools
Grade
GER / NER
School category
Primary Upper primaryBoys Boys GirlsGirls
IncentiveType
School categoryMultiple
TypeKuccha
PartiallyPucca
PuccaTotal % good condition
Otherrooms
TentNo
Building
Classrooms
Belowsecondary
Highersecondary
Postgraduate
M. Phil.GraduateSecondarySchool category OthersNo
response
ST teachers
Total Male Female No res Male Female No res Male Female Male FemaleSC teachers
Text booksUniformAttendanceStationery
% Passed
Avg. No. of Tchs.
%
Female literacyOverall literacy
dev. grant grantSchool T L M
Male Female
IVV
IIIIII
Grade R.R. D.O.R. P.R.
VIIVI
# #
I - V
Enrolment by medium of instructions
Examination results
Retention rate
GPI
Primary cycle U. primary cycleState
DISTRICT ELEMENTARY EDUCATION REPORT CARD : 2005-06
GirlsGrade
IIIIIIIVVVI
VIII
AllGirls
Total
VII
% TotalGrossness
School category
3362
7723
25 32511 147
27716
0 0 0
952 2622 72,162
9 67446 7,358
2 3,3360 0
923 22 82,656 2,0555,453 67,591 4,6777,510 262 6,1572,682 7,358 2,639
0 0 0169 2,387 169
86,059 2,327 2,3631,722
139285
P + UP P+sec/hs U.P. only UP+sec
School categoryP. only
6.2 0.8 0.0 1.6 0.019.7
Number of Clusters 15011129
% Schools with SCR > 601.1 0.0 7.3 8.0
3.3 8.9 0.0 13.7 16.0% Schools with pre-primary sections 5.8 11.6 76.9 2.4 0.0% Schools with common toilets 18.2 42.1 84.6 23.4 40.0
% Schools with girls toilets 5.4 14.7 92.3 5.6 48.0% Schools with drinking water facility 84.9 89.2 100.0 82.3 96.0
% Enrolment in Govt. schools 97.4 93.0 8.2 73.3 95.296.1 98.9 92.3 95.2 96.0
% No female teacher schools (tch>=2) 36.5 34.6 23.1 65.3 28.011.2 0.7 0.0 4.6 6.5
0.9 0.0 0.0 0.0 0.0%Enrolment in schools without blackboard 3.0 1.7 0.0 1.5 6.4
2001-02 2002-03 2003-04 2004-05 2005-06IIIIIIIVV
VIVII
Total U.P
31,05831,10731,06728,92825,78821,104
18,678
36,10833,62830,10726,85624,362
19,19717,086
39,62731,44527,30924,28821,312
15,78115,172
36,18026,01722,88120,21919,862
13,34611,808
101.4
37.5
104.5
43.1
121.4
51.8
43.5
7.70.0
14,73314,97114,96514,02912,410
9,8298,675
547457486434351270274
472437395358267227226
2,794
classrooms
2,007316255
87
39.844.985.833.226.4
40.835.2
19.3
10.133.236.8
19.94.1
33.636.8
61699
14737
859 306 212 22 0 415 2394 38 2 0 227 011 0 0 0 1 148 40 7 0 24 514 6 1 0 4 0
81 985 550 698 82 1 019 542 386 836 136 1 2 1
0 13 7 97 71 7 0 2150 46 61 162 13 0 0 10 11 9 36 27 0 0 0
0 23 75 89 20 2 0 0
15781216
107251
48
703893135
819 3 73 29 0 287 123 345 1174
21410
56481
28271
0000
1551512
5
83203
1734
131
61131
Terminalgrade Passed
VII boysV girlsV boys
VII girls
3 with >60%
65.325022007
416298
85
57.44.5
49.428.6
57.946.5
2.250.016.7
88215Oriya English
765584218
100403505
17110573966
00
% Schools recvd.
0.10.00.00.00.0
0.00.00.00.00.0
69554227109469
18280169162296
65608500150
4484
1604704
916
2.65.6
32.02.43.4
2005-062004-052003-04
ORISSA
21.9
Upper PrimaryPrimary
Sex ratio Sex ratio 0-6
8 139
VIII38.5
Enrolment of children
VIIITotal Pr.
211 8780 5
0 0
26 390
%Teachers recvd.in-service training
Total schools* Rural schools* Total enrolment* Rural enrolment* Teachers*
17.8 40.7
99.8
30.7
79.8 85.2
24.1 26.6% SC enrolment% SC girls to SC enrolment% ST enrolment
48.9 45.118.047.5 40.8
46.5
48.3
50.4
48.1
Position of teachers by educational qualification (other than para teacher)
(Previous academic year)Incentives : Number of beneficiaries
% ST girls to ST enrolment
% Girls
Number of villages
% 0 - 6 population
% SC population % ST population
% Urban population
% Schools with blackboard
% Enrolment in single-teacher schools
% Enrolment in schools without building
Primary Upperprimary
OBC EnrolmentPrimary U. Primary
% OBCEnrolment% OBC girls toOBC Enrolment
Pupil-teacher ratio (PTR)Student-classroom ratio (SCR)% Schools with <= 50 students% Schools with PTR > 100% Female teachers
% Schools established since 1995
Regular teachers Para-teachers
% minorrepairs
% majorrepairs
# = not applicable na = not available * Some totals may not match due to no response in classificatory data items
13.9 86.17.6 92.43.9 96.14.0 96.0
13.4 86.68.7 91.32.7 97.3
2620
48.43532
30.71.2
33.910.4
47.63939
0.81.4
36.43.9
47.63439
21.80.0
12.88.9
44.74140
0.04.0
42.44.0
18.5 17.2 11.7 68.8 55.4
93794113.914.4
Category
PrivateGovt.PrivateGovtPrivateGovt.PrivateGovt.PrivateGovt.
Total population (in 000's)
Number of blocks/taluks
District
Decadal growth rate
Primary onlyPrimary with upper primaryPrimary with upper primary & sec/higher sec.Upper primary onlyUpper primary with sec./higher secondary
% Single classroom schools% Single teacher schools
P + UP P+sec/hs U.P. only UP+secP. only
No response in school category
Primary with upper primaryPrimary with U.P. & sec/higherUpper primary onlyUpper primary with sec./higher sec
Primary only
Primary onlyPrimary with upper primaryPrimary with Upper primary & sec/higherUpper primary only
Para-teachers
School category
Upper primary with sec./higher secondary
Primary onlyPrimary with upper prim.
P. onlyP + UPP+sec/hsU.P. onlyUP+sec
NER(U.Prim)GER(U.Prim)NER (Primary)GER (Primary)
Transition ratePrim. to U. Prim
10.1
Performance indicators
SC/ST Enrolment
Indicators
Classrooms/Other rooms
Prim.with U.P.&Sec/H.SUpper Primary onlyU. Primary with Sec./H.S.
Basic Data, 2001
Data reported from
125,159 143,981 151,061 147,94839,78236,28330,95325,154
86.6
0.93
## #
89,612 2,819 2,382
0
0 0 0
1 - 5 6 - 7
98.7 23.998.6 20.396.3 16.196.5 15.9

383
25.6 20.8
Key data: Elementary Education
2025
BALASORE
(Previous academic year)
(Previous year)
Gender and caste distribution of teachers*
No. of schools by type of building*
BoysWith disability
Flow rates
Primary Level
Enrolment*
Number of schools
Grade
GER / NER
School category
Primary Upper primaryBoys Boys GirlsGirls
IncentiveType
School categoryMultiple
TypeKuccha
PartiallyPucca
PuccaTotal % good condition
Otherrooms
TentNo
Building
Classrooms
Belowsecondary
Highersecondary
Postgraduate
M. Phil.GraduateSecondarySchool category OthersNo
response
ST teachers
Total Male Female No res Male Female No res Male Female Male FemaleSC teachers
Text booksUniformAttendanceStationery
% Passed
Avg. No. of Tchs.
%
Female literacyOverall literacy
dev. grant grantSchool T L M
Male Female
IVV
IIIIII
Grade R.R. D.O.R. P.R.
VIIVI
# #
I - V
Enrolment by medium of instructions
Examination results
Retention rate
GPI
Primary cycle U. primary cycleState
DISTRICT ELEMENTARY EDUCATION REPORT CARD : 2005-06
GirlsGrade
IIIIIIIVVVI
VIII
AllGirls
Total
VII
% TotalGrossness
School category
54113
28032
39 5055 11
2397
27228
0 0 0
1,278 7030 127,355
2 1,106234 20,501
7 2,6930 0
1,202 63 151,407 4,1004,653 116,888 2,8261,054 1,053 110
13,748 19,844 13,391
0 0 0149 2,137 149
161,349 4,625 3,6002,944
375302
P + UP P+sec/hs U.P. only UP+sec
School categoryP. only
4.7 0.9 0.0 4.0 2.64.2
Number of Clusters 25041691
% Schools with SCR > 600.2 11.1 3.3 17.9
14.8 17.6 5.6 5.0 10.3% Schools with pre-primary sections 2.4 1.6 0.0 0.0 2.6% Schools with common toilets 63.1 71.9 38.9 49.7 64.1
% Schools with girls toilets 17.1 31.9 33.3 16.6 43.6% Schools with drinking water facility 83.5 90.2 94.4 71.1 84.6
% Enrolment in Govt. schools 97.2 96.5 51.2 59.9 94.893.9 94.1 88.9 88.4 94.9
% No female teacher schools (tch>=2) 32.8 20.3 50.0 75.5 46.23.3 0.0 2.5 2.9 14.7
0.4 0.0 0.0 1.1 0.0%Enrolment in schools without blackboard 3.7 2.7 2.1 6.6 0.0
2001-02 2002-03 2003-04 2004-05 2005-06IIIIIIIVV
VIVII
Total U.P
52,90750,39355,48754,00846,80540,447
37,186
54,02259,34156,14449,04543,031
38,11136,291
69,07862,52252,69945,97741,452
35,98834,104
60,29546,87940,82637,49534,230
26,58525,374
107.7
47.7
101.7
49.7
120.0
56.9
41.5
50.00.0
25,23924,33026,82625,93722,22119,00817,545
567550649638584435393
503483535523430367347
4,300
classrooms
3,02585
1,056142
34.131.957.622.126.2
29.326.2
36.6
14.127.720.6
41.828.250.253.2
1,11838
64363
1,709 322 220 70 2 681 4270 48 25 0 417 17
7 5 1 0 4 1111 153 127 3 90 31
15 6 5 0 11 2
72 1,220 770 1,123 181 4 118 758 481 1,225 241 4 0 35
2 7 12 40 17 1 0 233 150 193 631 89 1 0 171 21 13 49 14 0 1 29
4 123 279 503 127 11 4 0
20431806
48974
71
93030
10428
1341 54 271 258 8 409 188 275 1022624
629
2650
372
2130
231
6030
1752
322
113260
1231
327
64150
Terminalgrade Passed
VII boysV girlsV boys
VII girls
67 with >60%
35.939753246
1021147
131
36.810.425.413.7
25.827.6
0.018.110.3
164834Oriya Others Bodo English Bengali
1298442065
335532652
422173
20445
81
3460000
2700
7500
1510000
% Schools recvd.
13.613.8
0.05.80.0
12.212.6
0.05.42.6
126825163
87226
410086844
5722
117992673129211
37385563872
2.95.65.72.23.4
2005-062004-052003-04
ORISSA
29.4
Upper PrimaryPrimary
Sex ratio Sex ratio 0-6
16 208
VIII0.0
Enrolment of children
VIIITotal Pr.
675 472113 18
0 0
46 56
%Teachers recvd.in-service training
Total schools* Rural schools* Total enrolment* Rural enrolment* Teachers*
18.3 41.6
98.0
33.2
85.6 83.2
30.0 30.4% SC enrolment% SC girls to SC enrolment% ST enrolment
48.7 47.012.543.7 37.0
39.3
48.7
45.6
48.3
Position of teachers by educational qualification (other than para teacher)
(Previous academic year)Incentives : Number of beneficiaries
% ST girls to ST enrolment
% Girls
Number of villages
% 0 - 6 population
% SC population % ST population
% Urban population
% Schools with blackboard
% Enrolment in single-teacher schools
% Enrolment in schools without building
Primary Upperprimary
OBC EnrolmentPrimary U. Primary
% OBCEnrolment% OBC girls toOBC Enrolment
Pupil-teacher ratio (PTR)Student-classroom ratio (SCR)% Schools with <= 50 students% Schools with PTR > 100% Female teachers
% Schools established since 1995
Regular teachers Para-teachers
% minorrepairs
% majorrepairs
# = not applicable na = not available * Some totals may not match due to no response in classificatory data items
6.7 93.36.5 93.53.8 96.24.6 95.46.0 94.05.5 94.52.4 97.6
2521
48.14239
9.33.9
40.28.3
47.64144
4.70.7
35.23.4
46.83032
29.11.0
11.17.9
51.82220
46.25.1
22.12.6
19.2 18.8 11.3 70.6 58.9
94495310.914.6
Category
PrivateGovt.PrivateGovtPrivateGovt.PrivateGovt.PrivateGovt.
Total population (in 000's)
Number of blocks/taluks
District
Decadal growth rate
Primary onlyPrimary with upper primaryPrimary with upper primary & sec/higher sec.Upper primary onlyUpper primary with sec./higher secondary
% Single classroom schools% Single teacher schools
P + UP P+sec/hs U.P. only UP+secP. only
No response in school category
Primary with upper primaryPrimary with U.P. & sec/higherUpper primary onlyUpper primary with sec./higher sec
Primary only
Primary onlyPrimary with upper primaryPrimary with Upper primary & sec/higherUpper primary only
Para-teachers
School category
Upper primary with sec./higher secondary
Primary onlyPrimary with upper prim.
P. onlyP + UPP+sec/hsU.P. onlyUP+sec
NER(U.Prim)GER(U.Prim)NER (Primary)GER (Primary)
Transition ratePrim. to U. Prim
7.8
Performance indicators
SC/ST Enrolment
Indicators
Classrooms/Other rooms
Prim.with U.P.&Sec/H.SUpper Primary onlyU. Primary with Sec./H.S.
Basic Data, 2001
Data reported from
219,725 271,728 261,583 259,60077,63374,40270,09251,959
94.0
0.92
## #
161,106 3,816 3,188
0
0 0 0
1 - 5 6 - 7
98.6 30.198.6 28.497.0 23.096.1 23.4
Elementary Education: Report Card - BALASORE
Ori
ssa

384
Elementary Education in India - Where do we stand ?
Ori
ssa
23.0 21.5
Key data: Elementary Education
1346
BARGARH
(Previous academic year)
(Previous year)
Gender and caste distribution of teachers*
No. of schools by type of building*
BoysWith disability
Flow rates
Primary Level
Enrolment*
Number of schools
Grade
GER / NER
School category
Primary Upper primaryBoys Boys GirlsGirls
IncentiveType
School categoryMultiple
TypeKuccha
PartiallyPucca
PuccaTotal % good condition
Otherrooms
TentNo
Building
Classrooms
Belowsecondary
Highersecondary
Postgraduate
M. Phil.GraduateSecondarySchool category OthersNo
response
ST teachers
Total Male Female No res Male Female No res Male Female Male FemaleSC teachers
Text booksUniformAttendanceStationery
% Passed
Avg. No. of Tchs.
%
Female literacyOverall literacy
dev. grant grantSchool T L M
Male Female
IVV
IIIIII
Grade R.R. D.O.R. P.R.
VIIVI
# #
I - V
Enrolment by medium of instructions
Examination results
Retention rate
GPI
Primary cycle U. primary cycleState
DISTRICT ELEMENTARY EDUCATION REPORT CARD : 2005-06
GirlsGrade
IIIIIIIVVVI
VIII
AllGirls
Total
VII
% TotalGrossness
School category
37016
13123
18 3476 16
320
12814
28 0 2
1,160 2310 75,768
3 3,46030 12,960
0 2,8260 220
1,119 18 85,209 1,0102,721 69,198 1,1932,140 3,460 6822,046 12,740 1,915
0 59 00 1,378 0
90,122 1,357 2,9981,901
125178
P + UP P+sec/hs U.P. only UP+sec
School categoryP. only
4.6 0.0 0.0 4.3 0.011.7
Number of Clusters 18071267
% Schools with SCR > 600.0 0.0 9.8 0.0
2.3 4.9 4.5 18.4 13.0% Schools with pre-primary sections 6.7 11.3 13.6 1.2 0.0% Schools with common toilets 26.5 43.3 45.5 33.1 43.5
% Schools with girls toilets 8.3 23.7 40.9 20.9 34.8% Schools with drinking water facility 87.4 91.8 95.5 81.0 100.0
% Enrolment in Govt. schools 98.5 96.5 61.8 86.4 100.087.7 86.9 81.8 87.1 87.0
% No female teacher schools (tch>=2) 50.3 44.3 36.4 64.4 56.55.6 0.0 0.0 6.9 0.0
0.5 1.2 0.0 0.5 5.7%Enrolment in schools without blackboard 9.7 12.4 29.5 11.5 10.2
2001-02 2002-03 2003-04 2004-05 2005-06IIIIIIIVV
VIVII
Total U.P
27,61728,09528,86731,00830,78123,747
23,505
29,10528,73529,27930,21128,737
22,28019,444
32,62331,62231,54730,27728,664
21,18119,346
35,08533,41031,21429,50727,780
20,86019,414
39,02834,49732,62030,13628,868
23,50420,519
93.6
42.1
87.4
42.9
101.7
52.1
43.9
4.54.5
13,16013,63513,97215,30815,20611,32911,369
253221220277246156144
141172184161161122109
3,484
classrooms
2,218172355
90
47.848.248.738.935.6
27.226.6
25.0
23.727.028.9
25.227.634.135.6
58848
21638
919 395 113 23 0 606 4674 19 2 0 279 14
7 1 0 0 13 174 29 22 0 34 411 4 1 0 6 1
93 1,079 642 784 135 3 126 533 356 668 146 2 0 256
2 21 14 37 12 0 0 523 86 55 200 44 1 0 72 11 11 46 15 0 0 18
3 36 38 158 29 0 0 0
20981349
68338
59
397185326
680 187 132 26 0 407 140 498 146241
525
18
74892
18010
0000
2048
168
64341
2169
276
63253
Terminalgrade Passed
VII boysV girlsV boys
VII girls
228 with >60%
36.131232079
146406105
29.421.121.618.0
33.730.816.729.6
3.8
59829Oriya Others Hindi English Bengali
51490292398172184
3053926262
19465082
642
4410
731107
0
350737
000
1940000
% Schools recvd.
0.00.00.00.00.0
0.00.00.00.00.0
72405567
0562
23002117
34129
68388695
0871
21499117
24113
2.65.46.62.54.6
2005-062004-052003-04
ORISSA
12.3
Upper PrimaryPrimary
Sex ratio Sex ratio 0-6
13 200
VIII0.0
Enrolment of children
VIIITotal Pr.
349 57105 0
3 0
83 63
%Teachers recvd.in-service training
Total schools* Rural schools* Total enrolment* Rural enrolment* Teachers*
17.5 41.6
83.9
30.4
76.2 71.4
26.6 24.1% SC enrolment% SC girls to SC enrolment% ST enrolment
48.4 47.622.448.4 46.4
46.3
49.2
48.5
48.5
Position of teachers by educational qualification (other than para teacher)
(Previous academic year)Incentives : Number of beneficiaries
% ST girls to ST enrolment
% Girls
Number of villages
% 0 - 6 population
% SC population % ST population
% Urban population
% Schools with blackboard
% Enrolment in single-teacher schools
% Enrolment in schools without building
Primary Upperprimary
OBC EnrolmentPrimary U. Primary
% OBCEnrolment% OBC girls toOBC Enrolment
Pupil-teacher ratio (PTR)Student-classroom ratio (SCR)% Schools with <= 50 students% Schools with PTR > 100% Female teachers
% Schools established since 1995
Regular teachers Para-teachers
% minorrepairs
% majorrepairs
# = not applicable na = not available * Some totals may not match due to no response in classificatory data items
3.5 96.5
17.4 82.62.4 97.6
3338
48.72926
37.50.3
22.612.7
48.93835
2.80.3
20.05.7
46.43742
16.01.8
13.38.0
55.72731
8.70.0
24.80.0
11.5 19.4 19.4 64.0 50.3
9579767.713.0
Category
PrivateGovt.PrivateGovtPrivateGovt.PrivateGovt.PrivateGovt.
Total population (in 000's)
Number of blocks/taluks
District
Decadal growth rate
Primary onlyPrimary with upper primaryPrimary with upper primary & sec/higher sec.Upper primary onlyUpper primary with sec./higher secondary
% Single classroom schools% Single teacher schools
P + UP P+sec/hs U.P. only UP+secP. only
No response in school category
Primary with upper primaryPrimary with U.P. & sec/higherUpper primary onlyUpper primary with sec./higher sec
Primary only
Primary onlyPrimary with upper primaryPrimary with Upper primary & sec/higherUpper primary only
Para-teachers
School category
Upper primary with sec./higher secondary
Primary onlyPrimary with upper prim.
P. onlyP + UPP+sec/hsU.P. onlyUP+sec
NER(U.Prim)GER(U.Prim)NER (Primary)GER (Primary)
Transition ratePrim. to U. Prim
19.0
Performance indicators
SC/ST Enrolment
Indicators
Classrooms/Other rooms
Prim.with U.P.&Sec/H.SUpper Primary onlyU. Primary with Sec./H.S.
Basic Data, 2001
Data reported from
165,149 156,996 154,733 146,067 146,36847,25241,72440,52740,27444,023
82.6
78.9
0.95
## #
93,979 1,517 1,050
0
0 0 0
1 - 5 6 - 7
78.9
98.3 17.498.4 14.485.3 7.784.0 5.8

385
25.7 20.5
Key data: Elementary Education
1334
BHADRAK
(Previous academic year)
(Previous year)
Gender and caste distribution of teachers*
No. of schools by type of building*
BoysWith disability
Flow rates
Primary Level
Enrolment*
Number of schools
Grade
GER / NER
School category
Primary Upper primaryBoys Boys GirlsGirls
IncentiveType
School categoryMultiple
TypeKuccha
PartiallyPucca
PuccaTotal % good condition
Otherrooms
TentNo
Building
Classrooms
Belowsecondary
Highersecondary
Postgraduate
M. Phil.GraduateSecondarySchool category OthersNo
response
ST teachers
Total Male Female No res Male Female No res Male Female Male FemaleSC teachers
Text booksUniformAttendanceStationery
% Passed
Avg. No. of Tchs.
%
Female literacyOverall literacy
dev. grant grantSchool T L M
Male Female
IVV
IIIIII
Grade R.R. D.O.R. P.R.
VIIVI
# #
I - V
Enrolment by medium of instructions
Examination results
Retention rate
GPI
Primary cycle U. primary cycleState
DISTRICT ELEMENTARY EDUCATION REPORT CARD : 2005-06
GirlsGrade
IIIIIIIVVVI
VIII
AllGirls
Total
VII
% TotalGrossness
School category
3984
11430
14 3775 3
815
11024
0 0 0
905 2510 102,317
2 1,10174 11,030
4 3,8080 0
847 20 103,459 2,4332,585 94,297 1,8281,722 892 4125,404 10,700 4,893
0 0 0200 2,822 177
112,828 3,122 2,3782,039
136153
P + UP P+sec/hs U.P. only UP+sec
School categoryP. only
6.9 1.2 0.0 6.2 8.611.2
Number of Clusters 15811036
% Schools with SCR > 600.2 0.0 3.1 25.7
19.1 29.1 11.1 16.9 34.3% Schools with pre-primary sections 2.0 2.2 22.2 0.0 0.0% Schools with common toilets 44.6 57.8 55.6 25.6 25.7
% Schools with girls toilets 9.7 18.7 33.3 3.6 5.7% Schools with drinking water facility 71.1 84.2 100.0 51.3 77.1
% Enrolment in Govt. schools 97.3 97.5 39.0 67.1 95.097.8 99.0 100.0 97.9 91.4
% No female teacher schools (tch>=2) 32.7 28.6 22.2 74.4 48.67.5 0.0 0.0 2.8 13.0
2.1 0.0 0.0 3.4 1.3%Enrolment in schools without blackboard 1.5 1.2 0.0 1.0 8.0
2001-02 2002-03 2003-04 2004-05 2005-06IIIIIIIVV
VIVII
Total U.P
38,19338,08839,62638,85734,64028,540
26,173
40,43143,33442,30236,82032,994
26,92626,154
45,90644,33638,50834,20131,198
25,17624,143
43,53337,25633,51730,78028,626
21,24519,686
116.5
50.8
115.2
53.6
132.9
60.9
46.4
11.10.0
18,20918,47019,41918,96916,78213,59512,524
484459467506463308327
392367386409350267249
2,771
classrooms
2,156109399
83
43.643.449.536.523.5
26.123.1
30.3
33.022.828.4
33.517.440.648.1
60928
14033
670 371 79 52 0 392 3688 19 4 0 300 0
8 0 0 0 1 064 42 49 0 31 914 11 5 0 3 2
39 985 456 817 132 3 07 643 363 822 213 1 0 00 7 4 43 20 0 4 01 73 87 240 56 1 0 00 6 8 51 12 0 1 0
1 35 58 112 27 0 0 0
15511434
56407
63
615225115
881 0 52 30 0 343 123 82 360000
84061
59010
0000
1911
185
73020
61050
28011
Terminalgrade Passed
VII boysV girlsV boys
VII girls
0 with >60%
58.425142192
78465
79
62.210.750.429.7
61.154.6
4.555.813.3
114115Oriya Urdu English
1043352040
163584008
1845189208
760
0378575
00
% Schools recvd.
0.10.00.00.00.0
0.00.00.00.00.0
91866224210288
32245476595
87416604245254
30213118
5266
2.75.38.72.42.3
2005-062004-052003-04
ORISSA
28.2
Upper PrimaryPrimary
Sex ratio Sex ratio 0-6
9 123
VIII11.1
Enrolment of children
VIIITotal Pr.
302 16368 11
0 0
19 59
%Teachers recvd.in-service training
Total schools* Rural schools* Total enrolment* Rural enrolment* Teachers*
17.8 46.7
100.0
32.4
92.7 94.4
27.8 28.7% SC enrolment% SC girls to SC enrolment% ST enrolment
48.5 46.52.5
40.4 33.0
29.0
48.8
31.3
48.5
Position of teachers by educational qualification (other than para teacher)
(Previous academic year)Incentives : Number of beneficiaries
% ST girls to ST enrolment
% Girls
Number of villages
% 0 - 6 population
% SC population % ST population
% Urban population
% Schools with blackboard
% Enrolment in single-teacher schools
% Enrolment in schools without building
Primary Upperprimary
OBC EnrolmentPrimary U. Primary
% OBCEnrolment% OBC girls toOBC Enrolment
Pupil-teacher ratio (PTR)Student-classroom ratio (SCR)% Schools with <= 50 students% Schools with PTR > 100% Female teachers
% Schools established since 1995
Regular teachers Para-teachers
% minorrepairs
% majorrepairs
# = not applicable na = not available * Some totals may not match due to no response in classificatory data items
5.8 94.28.6 91.48.1 91.95.9 94.1
13.5 86.58.2 91.82.8 97.2
2636
48.54642
7.06.1
36.211.7
48.44849
0.25.1
30.72.9
47.43541
16.91.0
11.29.2
45.65148
25.75.7
19.05.7
20.5 21.5 1.9 73.9 62.8
94397410.614.4
Category
PrivateGovt.PrivateGovtPrivateGovt.PrivateGovt.PrivateGovt.
Total population (in 000's)
Number of blocks/taluks
District
Decadal growth rate
Primary onlyPrimary with upper primaryPrimary with upper primary & sec/higher sec.Upper primary onlyUpper primary with sec./higher secondary
% Single classroom schools% Single teacher schools
P + UP P+sec/hs U.P. only UP+secP. only
No response in school category
Primary with upper primaryPrimary with U.P. & sec/higherUpper primary onlyUpper primary with sec./higher sec
Primary only
Primary onlyPrimary with upper primaryPrimary with Upper primary & sec/higherUpper primary only
Para-teachers
School category
Upper primary with sec./higher secondary
Primary onlyPrimary with upper prim.
P. onlyP + UPP+sec/hsU.P. onlyUP+sec
NER(U.Prim)GER(U.Prim)NER (Primary)GER (Primary)
Transition ratePrim. to U. Prim
1.3
Performance indicators
SC/ST Enrolment
Indicators
Classrooms/Other rooms
Prim.with U.P.&Sec/H.SUpper Primary onlyU. Primary with Sec./H.S.
Basic Data, 2001
Data reported from
173,712 194,149 195,881 189,40454,71353,08049,31940,931
86.5
0.94
## #
117,968 3,014 2,420
0
0 0 0
1 - 5 6 - 7
99.4 23.199.4 21.798.6 15.299.2 16.5
Elementary Education: Report Card - BHADRAK
Ori
ssa

386
Elementary Education in India - Where do we stand ?
Ori
ssa
20.0 19.9
Key data: Elementary Education
1337
BOLANGIR
(Previous academic year)
(Previous year)
Gender and caste distribution of teachers*
No. of schools by type of building*
BoysWith disability
Flow rates
Primary Level
Enrolment*
Number of schools
Grade
GER / NER
School category
Primary Upper primaryBoys Boys GirlsGirls
IncentiveType
School categoryMultiple
TypeKuccha
PartiallyPucca
PuccaTotal % good condition
Otherrooms
TentNo
Building
Classrooms
Belowsecondary
Highersecondary
Postgraduate
M. Phil.GraduateSecondarySchool category OthersNo
response
ST teachers
Total Male Female No res Male Female No res Male Female Male FemaleSC teachers
Text booksUniformAttendanceStationery
% Passed
Avg. No. of Tchs.
%
Female literacyOverall literacy
dev. grant grantSchool T L M
Male Female
IVV
IIIIII
Grade R.R. D.O.R. P.R.
VIIVI
# #
I - V
Enrolment by medium of instructions
Examination results
Retention rate
GPI
Primary cycle U. primary cycleState
DISTRICT ELEMENTARY EDUCATION REPORT CARD : 2005-06
GirlsGrade
IIIIIIIVVVI
VIII
AllGirls
Total
VII
% TotalGrossness
School category
3638
9915
11 3005 5
221
896
57 0 15
1,546 65 70,8830 866
20 10,6681 2,7720 3,216
1,329 4 101,671 1951,892 56,396 4791,831 537 01,073 9,281 1,001
0 1,218 057 966 57
121,615 444 3,6771,768
43125
P + UP P+sec/hs U.P. only UP+sec
School categoryP. only
19.1 3.7 0.0 5.8 12.514.2
Number of Clusters 21331791
% Schools with SCR > 601.3 0.0 5.8 12.5
11.5 23.5 7.7 28.1 37.5% Schools with pre-primary sections 3.9 5.3 38.5 0.8 0.0% Schools with common toilets 33.9 54.5 61.5 49.6 50.0
% Schools with girls toilets 8.8 18.2 53.8 17.4 43.8% Schools with drinking water facility 86.0 89.6 69.2 71.1 93.8
% Enrolment in Govt. schools 99.6 97.4 32.1 90.9 98.088.7 90.4 69.2 81.8 93.8
% No female teacher schools (tch>=2) 50.1 42.0 15.4 58.7 37.59.4 0.9 0.0 5.2 10.5
0.7 0.7 0.0 1.1 4.3%Enrolment in schools without blackboard 6.4 5.3 0.0 11.1 7.2
2001-02 2002-03 2003-04 2004-05 2005-06IIIIIIIVV
VIVII
Total U.P
42,56133,35632,63134,17130,25822,692
19,648
41,61438,79038,30235,75931,981
21,57318,696
45,06440,85437,43534,35230,665
19,08217,976
47,31639,87336,98332,86028,817
18,79518,546
47,34740,52837,49432,05528,136
19,86318,244
115.4
39.0
113.3
42.0
121.1
47.0
40.9
38.50.0
21,70916,35015,97716,61914,397
9,8498,807
282237253244220111122
225166177211195
6975
3,698
classrooms
1,751127218
71
48.046.690.034.820.3
30.330.9
21.7
7.332.845.8
22.52.7
32.333.9
58827
11320
1,104 599 167 5 2 684 9490 22 0 0 242 20
7 1 0 0 1 442 33 4 0 22 20
8 7 0 0 1 0
187 1,680 794 710 97 3 136 704 376 553 103 1 0 70
0 4 6 69 53 0 0 134 121 59 111 22 0 0 70 4 9 25 7 2 0 13
0 51 58 76 16 0 0 0
25851195
86251
20
598466629
911 75 101 48 0 469 138 516 1395013
711
31020
19010
0000
2016
230
59020
1786
132
72291
Terminalgrade Passed
VII boysV girlsV boys
VII girls
99 with >60%
33.937201893
145327
60
27.01.2
13.80.0
36.535.0
0.014.9
0.0
69130Oriya Others English Hindi Dogri
42581626
69792269
4596325523
7904066
562
48518866
00
326145342
560
0143
000
% Schools recvd.
0.10.80.00.00.0
0.00.50.00.00.0
80271196
24697
238670
42502
75295967
604748
205564532
470
2.45.1
11.22.73.8
2005-062004-052003-04
ORISSA
31.7
Upper PrimaryPrimary
Sex ratio Sex ratio 0-6
14 217
VIII0.0
Enrolment of children
VIIITotal Pr.
292 3558 290 0
66 79
%Teachers recvd.in-service training
Total schools* Rural schools* Total enrolment* Rural enrolment* Teachers*
22.4 38.0
93.9
29.1
92.3 91.9
24.4 26.4% SC enrolment% SC girls to SC enrolment% ST enrolment
48.8 44.725.447.8 40.5
47.6
50.1
48.3
44.5
Position of teachers by educational qualification (other than para teacher)
(Previous academic year)Incentives : Number of beneficiaries
% ST girls to ST enrolment
% Girls
Number of villages
% 0 - 6 population
% SC population % ST population
% Urban population
% Schools with blackboard
% Enrolment in single-teacher schools
% Enrolment in schools without building
Primary Upperprimary
OBC EnrolmentPrimary U. Primary
% OBCEnrolment% OBC girls toOBC Enrolment
Pupil-teacher ratio (PTR)Student-classroom ratio (SCR)% Schools with <= 50 students% Schools with PTR > 100% Female teachers
% Schools established since 1995
Regular teachers Para-teachers
% minorrepairs
% majorrepairs
# = not applicable na = not available * Some totals may not match due to no response in classificatory data items
19.8 80.215.9 84.110.8 89.215.4 84.629.0 71.017.9 82.1
8.9 91.1
2119
49.63333
34.91.6
25.85.2
46.43842
7.02.9
32.61.9
46.73654
24.02.5
20.55.0
50.74740
0.025.048.3
0.0
8.5 16.9 20.6 55.7 39.5
96798411.514.3
Category
PrivateGovt.PrivateGovtPrivateGovt.PrivateGovt.PrivateGovt.
Total population (in 000's)
Number of blocks/taluks
District
Decadal growth rate
Primary onlyPrimary with upper primaryPrimary with upper primary & sec/higher sec.Upper primary onlyUpper primary with sec./higher secondary
% Single classroom schools% Single teacher schools
P + UP P+sec/hs U.P. only UP+secP. only
No response in school category
Primary with upper primaryPrimary with U.P. & sec/higherUpper primary onlyUpper primary with sec./higher sec
Primary only
Primary onlyPrimary with upper primaryPrimary with Upper primary & sec/higherUpper primary only
Para-teachers
School category
Upper primary with sec./higher secondary
Primary onlyPrimary with upper prim.
P. onlyP + UPP+sec/hsU.P. onlyUP+sec
NER(U.Prim)GER(U.Prim)NER (Primary)GER (Primary)
Transition ratePrim. to U. Prim
19.8
Performance indicators
SC/ST Enrolment
Indicators
Classrooms/Other rooms
Prim.with U.P.&Sec/H.SUpper Primary onlyU. Primary with Sec./H.S.
Basic Data, 2001
Data reported from
185,560 185,849 188,370 186,446 172,97742,34040,26937,05837,34138,107
71.0
63.9
0.97
## #
103,708 1,469 1,118
0
0 0 0
1 - 5 6 - 7
63.9
97.9 15.597.9 13.788.4 8.488.9 7.6
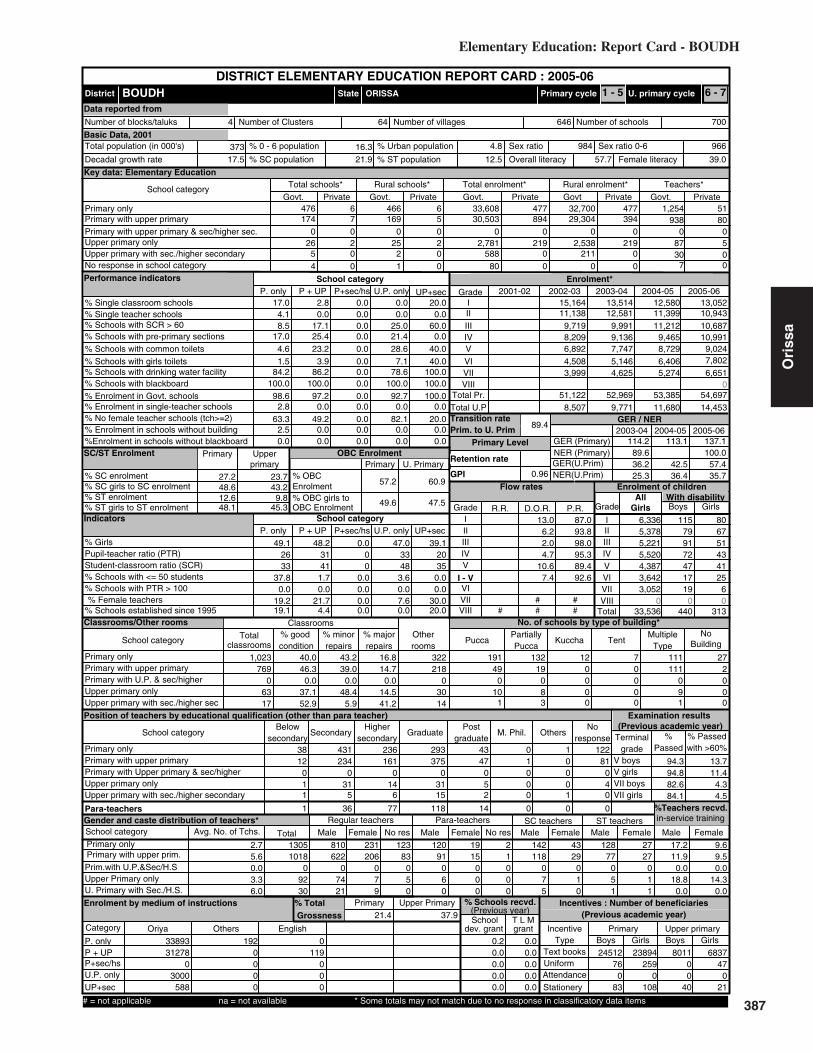
387
27.2 23.7
Key data: Elementary Education
373
BOUDH
(Previous academic year)
(Previous year)
Gender and caste distribution of teachers*
No. of schools by type of building*
BoysWith disability
Flow rates
Primary Level
Enrolment*
Number of schools
Grade
GER / NER
School category
Primary Upper primaryBoys Boys GirlsGirls
IncentiveType
School categoryMultiple
TypeKuccha
PartiallyPucca
PuccaTotal % good condition
Otherrooms
TentNo
Building
Classrooms
Belowsecondary
Highersecondary
Postgraduate
M. Phil.GraduateSecondarySchool category OthersNo
response
ST teachers
Total Male Female No res Male Female No res Male Female Male FemaleSC teachers
Text booksUniformAttendanceStationery
% Passed
Avg. No. of Tchs.
%
Female literacyOverall literacy
dev. grant grantSchool T L M
Male Female
IVV
IIIIII
Grade R.R. D.O.R. P.R.
VIIVI
# #
I - V
Enrolment by medium of instructions
Examination results
Retention rate
GPI
Primary cycle U. primary cycleState
DISTRICT ELEMENTARY EDUCATION REPORT CARD : 2005-06
GirlsGrade
IIIIIIIVVVI
VIII
AllGirls
Total
VII
% TotalGrossness
School category
1740
265
7 1690 020
252
4 0 1
476 65 30,5030 02 2,7810 5880 80
466 6 32,700 477894 29,304 394
0 0 0219 2,538 219
0 0 00 211 0
33,608 477 1,254938
5180
P + UP P+sec/hs U.P. only UP+sec
School categoryP. only
17.0 2.8 0.0 0.0 20.04.1
Number of Clusters 700646
% Schools with SCR > 600.0 0.0 0.0 0.0
8.5 17.1 0.0 25.0 60.0% Schools with pre-primary sections 17.0 25.4 0.0 21.4 0.0% Schools with common toilets 4.6 23.2 0.0 28.6 40.0
% Schools with girls toilets 1.5 3.9 0.0 7.1 40.0% Schools with drinking water facility 84.2 86.2 0.0 78.6 100.0
% Enrolment in Govt. schools 98.6 97.2 0.0 92.7 100.0100.0 100.0 0.0 100.0 100.0
% No female teacher schools (tch>=2) 63.3 49.2 0.0 82.1 20.02.8 0.0 0.0 0.0 0.0
2.5 0.0 0.0 0.0 0.0%Enrolment in schools without blackboard 0.0 0.0 0.0 0.0 0.0
2001-02 2002-03 2003-04 2004-05 2005-06IIIIIIIVV
VIVII
Total U.P
13,05210,94310,68710,991
9,0247,802
6,651
12,58011,39911,212
9,4658,729
6,4065,274
13,51412,581
9,9919,1367,747
5,1464,625
15,16411,138
9,7198,2096,892
4,5083,999
114.2
36.2
113.1
42.5
137.1
57.4
0.0
0.00.0
6,3365,3785,2215,5204,3873,6423,052
115799172471719
806751434125
6
1,023
classrooms
7690
6317
40.046.3
0.037.152.9
43.239.0
16.8
0.048.4
5.9
14.70.0
14.541.2
2180
3014
322 191 132 12 7 111 2749 19 0 0 111 2
0 0 0 0 0 010 8 0 0 9 0
1 3 0 0 1 0
38 431 236 293 43 0 112 234 161 375 47 1 0 81
0 0 0 0 0 0 0 01 31 14 31 5 0 0 41 5 6 15 2 0 1 0
1 36 77 118 14 0 0 0
810622
07421
206079
231 123 120 19 2 142 43 128 2783
050
91060
15000
1000
118075
29010
77051
27011
Terminalgrade Passed
VII boysV girlsV boys
VII girls
122 with >60%
17.213051018
09230
11.90.0
18.80.0
9.69.50.0
14.30.0
33893Oriya Others English
312780
3000588
1920000
0119
000
% Schools recvd.
0.20.00.00.00.0
0.00.00.00.00.0
2451276
083
801100
40
23894259
0108
683747
021
2.75.60.03.36.0
2005-062004-052003-04
ORISSA
0.0
Upper PrimaryPrimary
Sex ratio Sex ratio 0-6
4 64
VIII0.0
Enrolment of children
VIIITotal Pr.
87 530 0
7 0
0 0
%Teachers recvd.in-service training
Total schools* Rural schools* Total enrolment* Rural enrolment* Teachers*
21.4 37.9
100.0
35.7
89.6
25.3 36.4% SC enrolment% SC girls to SC enrolment% ST enrolment
48.6 43.212.648.1 45.3
57.2
49.6
60.9
47.5
Position of teachers by educational qualification (other than para teacher)
(Previous academic year)Incentives : Number of beneficiaries
% ST girls to ST enrolment
% Girls
Number of villages
% 0 - 6 population
% SC population % ST population
% Urban population
% Schools with blackboard
% Enrolment in single-teacher schools
% Enrolment in schools without building
Primary Upperprimary
OBC EnrolmentPrimary U. Primary
% OBCEnrolment% OBC girls toOBC Enrolment
Pupil-teacher ratio (PTR)Student-classroom ratio (SCR)% Schools with <= 50 students% Schools with PTR > 100% Female teachers
% Schools established since 1995
Regular teachers Para-teachers
% minorrepairs
% majorrepairs
# = not applicable na = not available * Some totals may not match due to no response in classificatory data items
13.0 87.06.2 93.82.0 98.04.7 95.3
10.6 89.47.4 92.6
00
49.12633
37.80.0
19.219.1
48.23141
1.70.0
21.74.4
47.03348
3.60.07.60.0
39.12035
0.00.0
30.020.0
17.5 21.9 12.5 57.7 39.0
9669844.816.3
Category
PrivateGovt.PrivateGovtPrivateGovt.PrivateGovt.PrivateGovt.
Total population (in 000's)
Number of blocks/taluks
District
Decadal growth rate
Primary onlyPrimary with upper primaryPrimary with upper primary & sec/higher sec.Upper primary onlyUpper primary with sec./higher secondary
% Single classroom schools% Single teacher schools
P + UP P+sec/hs U.P. only UP+secP. only
No response in school category
Primary with upper primaryPrimary with U.P. & sec/higherUpper primary onlyUpper primary with sec./higher sec
Primary only
Primary onlyPrimary with upper primaryPrimary with Upper primary & sec/higherUpper primary only
Para-teachers
School category
Upper primary with sec./higher secondary
Primary onlyPrimary with upper prim.
P. onlyP + UPP+sec/hsU.P. onlyUP+sec
NER(U.Prim)GER(U.Prim)NER (Primary)GER (Primary)
Transition ratePrim. to U. Prim
9.8
Performance indicators
SC/ST Enrolment
Indicators
Classrooms/Other rooms
Prim.with U.P.&Sec/H.SUpper Primary onlyU. Primary with Sec./H.S.
Basic Data, 2001
Data reported from
51,122 52,969 53,385 54,69714,45311,6809,7718,507
89.4
0.96
## #
33,536 440 313
0
0 0 0
1 - 5 6 - 7
94.3 13.794.8 11.482.6 4.384.1 4.5
Elementary Education: Report Card - BOUDH
Ori
ssa

388
Elementary Education in India - Where do we stand ?
Ori
ssa
24.0 20.1
Key data: Elementary Education
2341
CUTTACK
(Previous academic year)
(Previous year)
Gender and caste distribution of teachers*
No. of schools by type of building*
BoysWith disability
Flow rates
Primary Level
Enrolment*
Number of schools
Grade
GER / NER
School category
Primary Upper primaryBoys Boys GirlsGirls
IncentiveType
School categoryMultiple
TypeKuccha
PartiallyPucca
PuccaTotal % good condition
Otherrooms
TentNo
Building
Classrooms
Belowsecondary
Highersecondary
Postgraduate
M. Phil.GraduateSecondarySchool category OthersNo
response
ST teachers
Total Male Female No res Male Female No res Male Female Male FemaleSC teachers
Text booksUniformAttendanceStationery
% Passed
Avg. No. of Tchs.
%
Female literacyOverall literacy
dev. grant grantSchool T L M
Male Female
IVV
IIIIII
Grade R.R. D.O.R. P.R.
VIIVI
# #
I - V
Enrolment by medium of instructions
Examination results
Retention rate
GPI
Primary cycle U. primary cycleState
DISTRICT ELEMENTARY EDUCATION REPORT CARD : 2005-06
GirlsGrade
IIIIIIIVVVI
VIII
AllGirls
Total
VII
% TotalGrossness
School category
5106
12751
44 46024 293
5112
3740 1 4
1,516 8229 121,658
8 37488 13,106
3 6,3191 6,143
1,364 55 120,296 3,2866,788 106,456 3,7435,308 288 1,9506,575 11,136 6,001
47 511 47457 4,474 184
141,590 5,572 4,1883,076
383407
P + UP P+sec/hs U.P. only UP+sec
School categoryP. only
7.4 1.3 3.3 5.9 1.810.6
Number of Clusters 24991532
% Schools with SCR > 600.2 0.0 4.1 10.7
6.9 12.3 6.7 12.7 10.7% Schools with pre-primary sections 21.4 22.9 36.7 1.8 1.8% Schools with common toilets 23.3 37.9 36.7 28.6 51.8
% Schools with girls toilets 4.1 13.7 36.7 15.0 37.5% Schools with drinking water facility 84.7 92.2 76.7 81.8 89.3
% Enrolment in Govt. schools 96.2 94.7 6.6 66.6 93.390.7 94.0 60.0 89.5 85.7
% No female teacher schools (tch>=2) 29.2 18.8 13.3 63.6 16.14.7 0.1 0.0 2.6 9.5
1.3 0.1 0.0 1.9 0.0%Enrolment in schools without blackboard 6.9 4.2 17.3 7.3 10.5
2001-02 2002-03 2003-04 2004-05 2005-06IIIIIIIVV
VIVII
Total U.P
47,91147,04050,79949,25445,67338,415
34,845
51,07855,04755,25549,82546,661
39,26037,185
54,00652,30149,82245,78741,691
32,61530,350
53,58648,98249,87243,36341,290
32,80430,306
84.3
37.4
88.0
44.8
96.2
46.4
46.4
23.36.7
23,06122,82324,82123,85722,13318,53816,649
432482549503466287226
319309382375359171141
4,616
classrooms
3,066247461263
48.043.261.437.048.4
29.329.8
22.7
20.934.819.3
27.017.728.232.3
1,18389
276145
1,854 526 229 11 0 703 129117 39 0 0 376 22
19 0 0 0 4 778 69 5 0 48 2029 11 0 0 12 4
78 1,817 901 1,378 194 10 032 938 569 1,530 265 10 2 86
1 14 12 103 41 2 0 490 83 103 311 64 0 6 71 18 13 82 39 3 0 21
0 17 22 43 10 0 1 0
24462005
98472
85
1359839576
1967 121 12 25 0 385 179 223 746841
716
25021
26020
0000
1965
221
103262
1370
102
39001
Terminalgrade Passed
VII boysV girlsV boys
VII girls
156 with >60%
40.045713483
222578178
41.04.1
40.911.6
32.534.9
0.035.115.8
141681Oriya Others English Urdu Hindi
1242594120
192636153
35073301
321389201
350506732
00
873119
00
69
0228
000
% Schools recvd.
0.10.00.00.00.0
0.00.00.00.00.0
105844394
61306
384690
288
100041255
521092
35282669071
2.96.37.42.63.2
2005-062004-052003-04
ORISSA
37.4
Upper PrimaryPrimary
Sex ratio Sex ratio 0-6
15 217
VIII6.7
Enrolment of children
VIIITotal Pr.
375 203168 10205 7
19 203
%Teachers recvd.in-service training
Total schools* Rural schools* Total enrolment* Rural enrolment* Teachers*
19.0 43.0
78.0
26.5
67.3 72.2
22.0 26.5% SC enrolment% SC girls to SC enrolment% ST enrolment
49.1 47.16.3
44.8 39.5
40.7
48.4
43.8
48.0
Position of teachers by educational qualification (other than para teacher)
(Previous academic year)Incentives : Number of beneficiaries
% ST girls to ST enrolment
% Girls
Number of villages
% 0 - 6 population
% SC population % ST population
% Urban population
% Schools with blackboard
% Enrolment in single-teacher schools
% Enrolment in schools without building
Primary Upperprimary
OBC EnrolmentPrimary U. Primary
% OBCEnrolment% OBC girls toOBC Enrolment
Pupil-teacher ratio (PTR)Student-classroom ratio (SCR)% Schools with <= 50 students% Schools with PTR > 100% Female teachers
% Schools established since 1995
Regular teachers Para-teachers
% minorrepairs
% majorrepairs
# = not applicable na = not available * Some totals may not match due to no response in classificatory data items
7.9 92.17.7 92.3
10.9 89.18.3 91.7
17.7 82.310.3 89.711.2 88.8
2326
48.83232
29.10.5
43.611.1
47.83742
1.31.6
39.84.0
48.03443
14.10.5
16.88.6
50.83826
14.35.4
42.70.0
14.0 19.1 3.6 76.7 66.9
93993827.412.3
Category
PrivateGovt.PrivateGovtPrivateGovt.PrivateGovt.PrivateGovt.
Total population (in 000's)
Number of blocks/taluks
District
Decadal growth rate
Primary onlyPrimary with upper primaryPrimary with upper primary & sec/higher sec.Upper primary onlyUpper primary with sec./higher secondary
% Single classroom schools% Single teacher schools
P + UP P+sec/hs U.P. only UP+secP. only
No response in school category
Primary with upper primaryPrimary with U.P. & sec/higherUpper primary onlyUpper primary with sec./higher sec
Primary only
Primary onlyPrimary with upper primaryPrimary with Upper primary & sec/higherUpper primary only
Para-teachers
School category
Upper primary with sec./higher secondary
Primary onlyPrimary with upper prim.
P. onlyP + UPP+sec/hsU.P. onlyUP+sec
NER(U.Prim)GER(U.Prim)NER (Primary)GER (Primary)
Transition ratePrim. to U. Prim
3.2
Performance indicators
SC/ST Enrolment
Indicators
Classrooms/Other rooms
Prim.with U.P.&Sec/H.SUpper Primary onlyU. Primary with Sec./H.S.
Basic Data, 2001
Data reported from
237,093 243,607 257,866 240,67773,26076,44562,96563,110
82.3
0.94
## #
151,882 2,945 2,056
0
0 0 0
1 - 5 6 - 7
97.3 23.097.0 22.293.8 12.494.1 12.1
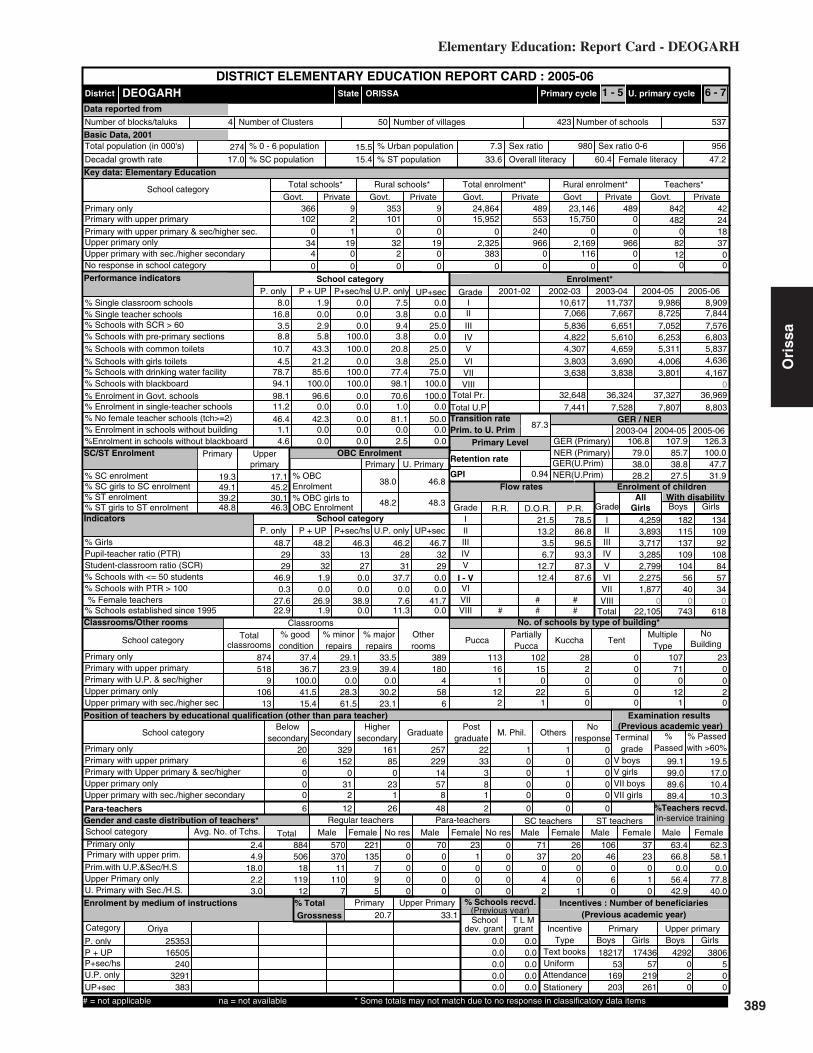
389
19.3 17.1
Key data: Elementary Education
274
DEOGARH
(Previous academic year)
(Previous year)
Gender and caste distribution of teachers*
No. of schools by type of building*
BoysWith disability
Flow rates
Primary Level
Enrolment*
Number of schools
Grade
GER / NER
School category
Primary Upper primaryBoys Boys GirlsGirls
IncentiveType
School categoryMultiple
TypeKuccha
PartiallyPucca
PuccaTotal % good condition
Otherrooms
TentNo
Building
Classrooms
Belowsecondary
Highersecondary
Postgraduate
M. Phil.GraduateSecondarySchool category OthersNo
response
ST teachers
Total Male Female No res Male Female No res Male Female Male FemaleSC teachers
Text booksUniformAttendanceStationery
% Passed
Avg. No. of Tchs.
%
Female literacyOverall literacy
dev. grant grantSchool T L M
Male Female
IVV
IIIIII
Grade R.R. D.O.R. P.R.
VIIVI
# #
I - V
Enrolment by medium of instructions
Examination results
Retention rate
GPI
Primary cycle U. primary cycleState
DISTRICT ELEMENTARY EDUCATION REPORT CARD : 2005-06
GirlsGrade
IIIIIIIVVVI
VIII
AllGirls
Total
VII
% TotalGrossness
School category
1020
344
2 1011 0
190
322
0 0 0
366 90 15,9520 0
19 2,3250 3830 0
353 9 23,146 489553 15,750 0240 0 0966 2,169 966
0 0 00 116 0
24,864 489 842482
4224
P + UP P+sec/hs U.P. only UP+sec
School categoryP. only
8.0 1.9 0.0 7.5 0.016.8
Number of Clusters 537423
% Schools with SCR > 600.0 0.0 3.8 0.0
3.5 2.9 0.0 9.4 25.0% Schools with pre-primary sections 8.8 5.8 100.0 3.8 0.0% Schools with common toilets 10.7 43.3 100.0 20.8 25.0
% Schools with girls toilets 4.5 21.2 0.0 3.8 25.0% Schools with drinking water facility 78.7 85.6 100.0 77.4 75.0
% Enrolment in Govt. schools 98.1 96.6 0.0 70.6 100.094.1 100.0 100.0 98.1 100.0
% No female teacher schools (tch>=2) 46.4 42.3 0.0 81.1 50.011.2 0.0 0.0 1.0 0.0
1.1 0.0 0.0 0.0 0.0%Enrolment in schools without blackboard 4.6 0.0 0.0 2.5 0.0
2001-02 2002-03 2003-04 2004-05 2005-06IIIIIIIVV
VIVII
Total U.P
8,9097,8447,5766,8035,8374,636
4,167
9,9868,7257,0526,2535,311
4,0063,801
11,7377,6676,6515,6104,659
3,6903,838
10,6177,0665,8364,8224,307
3,8033,638
106.8
38.0
107.9
38.8
126.3
47.7
46.3
0.00.0
4,2593,8933,7173,2852,7992,2751,877
182115137109104
5640
134109
92108
845734
874
classrooms
5189
10613
37.436.7
100.041.515.4
29.123.9
33.5
0.028.361.5
39.40.0
30.223.1
1804
586
389 113 102 28 0 107 2316 15 2 0 71 0
1 0 0 0 0 012 22 5 0 12 2
2 1 0 0 1 0
20 329 161 257 22 1 16 152 85 229 33 0 0 00 0 0 14 3 0 1 00 31 23 57 8 0 0 00 2 1 8 1 0 0 0
6 12 26 48 2 0 0 0
570370
11110
7
135795
221 0 70 23 0 71 26 106 370000
0000
1000
0000
37042
20001
46060
23010
Terminalgrade Passed
VII boysV girlsV boys
VII girls
0 with >60%
63.4884506
18119
12
66.80.0
56.442.9
62.358.1
0.077.840.0
25353Oriya
16505240
3291383
% Schools recvd.
0.00.00.00.00.0
0.00.00.00.00.0
1821753
169203
4292020
1743657
219261
3806500
2.44.9
18.02.23.0
2005-062004-052003-04
ORISSA
38.9
Upper PrimaryPrimary
Sex ratio Sex ratio 0-6
4 50
VIII0.0
Enrolment of children
VIIITotal Pr.
82 3712 0
0 0
0 18
%Teachers recvd.in-service training
Total schools* Rural schools* Total enrolment* Rural enrolment* Teachers*
20.7 33.1
100.0
31.9
79.0 85.7
28.2 27.5% SC enrolment% SC girls to SC enrolment% ST enrolment
49.1 45.239.248.8 46.3
38.0
48.2
46.8
48.3
Position of teachers by educational qualification (other than para teacher)
(Previous academic year)Incentives : Number of beneficiaries
% ST girls to ST enrolment
% Girls
Number of villages
% 0 - 6 population
% SC population % ST population
% Urban population
% Schools with blackboard
% Enrolment in single-teacher schools
% Enrolment in schools without building
Primary Upperprimary
OBC EnrolmentPrimary U. Primary
% OBCEnrolment% OBC girls toOBC Enrolment
Pupil-teacher ratio (PTR)Student-classroom ratio (SCR)% Schools with <= 50 students% Schools with PTR > 100% Female teachers
% Schools established since 1995
Regular teachers Para-teachers
% minorrepairs
% majorrepairs
# = not applicable na = not available * Some totals may not match due to no response in classificatory data items
21.5 78.513.2 86.8
3.5 96.56.7 93.3
12.7 87.312.4 87.6
2713
48.72929
46.90.3
27.622.9
48.23332
1.90.0
26.91.9
46.22831
37.70.07.6
11.3
46.73229
0.00.0
41.70.0
17.0 15.4 33.6 60.4 47.2
9569807.315.5
Category
PrivateGovt.PrivateGovtPrivateGovt.PrivateGovt.PrivateGovt.
Total population (in 000's)
Number of blocks/taluks
District
Decadal growth rate
Primary onlyPrimary with upper primaryPrimary with upper primary & sec/higher sec.Upper primary onlyUpper primary with sec./higher secondary
% Single classroom schools% Single teacher schools
P + UP P+sec/hs U.P. only UP+secP. only
No response in school category
Primary with upper primaryPrimary with U.P. & sec/higherUpper primary onlyUpper primary with sec./higher sec
Primary only
Primary onlyPrimary with upper primaryPrimary with Upper primary & sec/higherUpper primary only
Para-teachers
School category
Upper primary with sec./higher secondary
Primary onlyPrimary with upper prim.
P. onlyP + UPP+sec/hsU.P. onlyUP+sec
NER(U.Prim)GER(U.Prim)NER (Primary)GER (Primary)
Transition ratePrim. to U. Prim
30.1
Performance indicators
SC/ST Enrolment
Indicators
Classrooms/Other rooms
Prim.with U.P.&Sec/H.SUpper Primary onlyU. Primary with Sec./H.S.
Basic Data, 2001
Data reported from
32,648 36,324 37,327 36,9698,8037,8077,5287,441
87.3
0.94
## #
22,105 743 618
0
0 0 0
1 - 5 6 - 7
99.1 19.599.0 17.089.6 10.489.4 10.3
Elementary Education: Report Card - DEOGARH
Ori
ssa

390
Elementary Education in India - Where do we stand ?
Ori
ssa
22.9 18.9
Key data: Elementary Education
1067
DHENKANAL
(Previous academic year)
(Previous year)
Gender and caste distribution of teachers*
No. of schools by type of building*
BoysWith disability
Flow rates
Primary Level
Enrolment*
Number of schools
Grade
GER / NER
School category
Primary Upper primaryBoys Boys GirlsGirls
IncentiveType
School categoryMultiple
TypeKuccha
PartiallyPucca
PuccaTotal % good condition
Otherrooms
TentNo
Building
Classrooms
Belowsecondary
Highersecondary
Postgraduate
M. Phil.GraduateSecondarySchool category OthersNo
response
ST teachers
Total Male Female No res Male Female No res Male Female Male FemaleSC teachers
Text booksUniformAttendanceStationery
% Passed
Avg. No. of Tchs.
%
Female literacyOverall literacy
dev. grant grantSchool T L M
Male Female
IVV
IIIIII
Grade R.R. D.O.R. P.R.
VIIVI
# #
I - V
Enrolment by medium of instructions
Examination results
Retention rate
GPI
Primary cycle U. primary cycleState
DISTRICT ELEMENTARY EDUCATION REPORT CARD : 2005-06
GirlsGrade
IIIIIIIVVVI
VIII
AllGirls
Total
VII
% TotalGrossness
School category
3044
8113
27 2894 3
842
798
0 0 0
878 3518 67,812
3 79483 8,254
2 1,7370 0
843 33 72,866 2,1584,450 64,356 2,2121,025 378 3276,196 8,017 6,129
0 0 0117 810 117
76,951 2,307 2,2801,670
183270
P + UP P+sec/hs U.P. only UP+sec
School categoryP. only
3.0 0.0 0.0 1.8 0.010.4
Number of Clusters 1432993
% Schools with SCR > 600.9 0.0 4.2 6.7
3.0 5.4 0.0 12.1 0.0% Schools with pre-primary sections 0.3 1.8 0.0 0.0 0.0% Schools with common toilets 21.1 60.7 75.0 29.1 46.7
% Schools with girls toilets 11.7 41.7 25.0 20.0 53.3% Schools with drinking water facility 88.8 93.4 87.5 83.6 93.3
% Enrolment in Govt. schools 97.1 93.8 43.7 57.1 93.797.5 95.5 87.5 95.8 100.0
% No female teacher schools (tch>=2) 30.8 21.5 25.0 68.5 33.36.1 0.3 0.0 3.2 0.8
0.0 0.0 0.0 0.0 0.0%Enrolment in schools without blackboard 2.3 3.2 6.5 3.6 0.0
2001-02 2002-03 2003-04 2004-05 2005-06IIIIIIIVV
VIVII
Total U.P
25,53423,14325,54326,30426,45822,015
20,646
24,20725,93925,78526,33624,665
18,87818,021
28,94127,37527,48525,47723,848
19,44118,619
30,52229,55826,69424,51122,571
19,20618,397
34,60129,82627,22424,64022,717
19,57818,587
101.4
49.8
95.5
47.7
111.4
59.3
39.9
12.50.0
12,04710,95612,42412,86712,64910,283
9,740
205234230255251162133
137152150185162108
93
2,756
classrooms
1,93263
36190
45.442.052.432.945.6
34.532.9
20.1
44.437.926.7
25.13.2
29.227.8
55830
16846
865 354 156 6 0 393 479 22 3 0 223 4
5 1 1 0 1 068 47 10 0 38 2
7 5 0 0 3 0
127 860 469 715 81 1 037 513 317 875 118 3 1 18
1 5 7 28 7 0 0 252 69 87 190 34 0 0 21 5 12 20 9 0 0 3
3 81 57 106 11 0 0 0
12991139
14325
28
726345819
963 4 123 74 0 237 108 181 731725
13
38040
20010
0000
1030
131
53060
86020
43020
Terminalgrade Passed
VII boysV girlsV boys
VII girls
13 with >60%
17.024631940
73389
50
17.00.0
10.37.1
10.510.6
0.03.40.0
74480Oriya Others English Assamese Bodo
695591403
127341656
45982328
01672
198
00
41600
126159
000
540000
% Schools recvd.
0.10.30.00.00.0
0.00.00.00.00.0
6256700
974
19341003
5828900
1096
1757900
15
2.75.99.12.43.3
8.03.82.91.9
2.23.6
1.63.6
2005-062004-052003-04
ORISSA
46.6
Upper PrimaryPrimary
Sex ratio Sex ratio 0-6
11 139
VIII25.0
Enrolment of children
VIIITotal Pr.
220 16941 9
0 0
38 35
%Teachers recvd.in-service training
Total schools* Rural schools* Total enrolment* Rural enrolment* Teachers*
19.1 40.9
90.1
35.1
82.1 79.1
30.9 28.8% SC enrolment% SC girls to SC enrolment% ST enrolment
49.0 45.517.047.2 42.6
40.9
48.2
45.6
48.4
Position of teachers by educational qualification (other than para teacher)
(Previous academic year)Incentives : Number of beneficiaries
% ST girls to ST enrolment
% Girls
Number of villages
% 0 - 6 population
% SC population % ST population
% Urban population
% Schools with blackboard
% Enrolment in single-teacher schools
% Enrolment in schools without building
Primary Upperprimary
OBC EnrolmentPrimary U. Primary
% OBCEnrolment% OBC girls toOBC Enrolment
Pupil-teacher ratio (PTR)Student-classroom ratio (SCR)% Schools with <= 50 students% Schools with PTR > 100% Female teachers
% Schools established since 1995
Regular teachers Para-teachers
% minorrepairs
% majorrepairs
# = not applicable na = not available * Some totals may not match due to no response in classificatory data items
0.4 91.60.7 95.6
10.8 87.61.5 94.9
2925
48.13229
26.20.9
42.113.8
47.63737
1.80.6
38.55.4
46.93740
9.10.6
15.210.3
50.53721
13.30.0
38.00.0
12.5 18.5 12.8 69.4 57.9
9259618.713.7
Category
PrivateGovt.PrivateGovtPrivateGovt.PrivateGovt.PrivateGovt.
Total population (in 000's)
Number of blocks/taluks
District
Decadal growth rate
Primary onlyPrimary with upper primaryPrimary with upper primary & sec/higher sec.Upper primary onlyUpper primary with sec./higher secondary
% Single classroom schools% Single teacher schools
P + UP P+sec/hs U.P. only UP+secP. only
No response in school category
Primary with upper primaryPrimary with U.P. & sec/higherUpper primary onlyUpper primary with sec./higher sec
Primary only
Primary onlyPrimary with upper primaryPrimary with Upper primary & sec/higherUpper primary only
Para-teachers
School category
Upper primary with sec./higher secondary
Primary onlyPrimary with upper prim.
P. onlyP + UPP+sec/hsU.P. onlyUP+sec
NER(U.Prim)GER(U.Prim)NER (Primary)GER (Primary)
Transition ratePrim. to U. Prim
11.8
Performance indicators
SC/ST Enrolment
Indicators
Classrooms/Other rooms
Prim.with U.P.&Sec/H.SUpper Primary onlyU. Primary with Sec./H.S.
Basic Data, 2001
Data reported from
139,008 133,856 133,126 126,932 126,98242,66136,89938,06037,60338,165
87.6
75.3
0.92
## #
80,966 1,470 987
0
0 0 0
1 - 5 6 - 7
75.3
98.8 26.198.9 24.392.7 15.493.7 15.7

391
10.1 12.9
Key data: Elementary Education
519
GAJAPATI
(Previous academic year)
(Previous year)
Gender and caste distribution of teachers*
No. of schools by type of building*
BoysWith disability
Flow rates
Primary Level
Enrolment*
Number of schools
Grade
GER / NER
School category
Primary Upper primaryBoys Boys GirlsGirls
IncentiveType
School categoryMultiple
TypeKuccha
PartiallyPucca
PuccaTotal % good condition
Otherrooms
TentNo
Building
Classrooms
Belowsecondary
Highersecondary
Postgraduate
M. Phil.GraduateSecondarySchool category OthersNo
response
ST teachers
Total Male Female No res Male Female No res Male Female Male FemaleSC teachers
Text booksUniformAttendanceStationery
% Passed
Avg. No. of Tchs.
%
Female literacyOverall literacy
dev. grant grantSchool T L M
Male Female
IVV
IIIIII
Grade R.R. D.O.R. P.R.
VIIVI
# #
I - V
Enrolment by medium of instructions
Examination results
Retention rate
GPI
Primary cycle U. primary cycleState
DISTRICT ELEMENTARY EDUCATION REPORT CARD : 2005-06
GirlsGrade
IIIIIIIVVVI
VIII
AllGirls
Total
VII
% TotalGrossness
School category
27216
79
6 2560 1321
68
19 0 1
926 73 40,1920 2,5602 9591 1,0670 0
908 4 46,914 1101,672 36,522 714
0 2,155 0320 743 320
0 0 00 851 0
48,304 253 1,8091,267
3352
P + UP P+sec/hs U.P. only UP+sec
School categoryP. only
33.7 3.2 0.0 11.1 0.034.1
Number of Clusters 12651052
% Schools with SCR > 601.8 6.3 0.0 0.0
4.2 10.4 18.8 55.6 20.0% Schools with pre-primary sections 5.5 6.5 0.0 0.0 0.0% Schools with common toilets 9.5 29.1 12.5 11.1 20.0
% Schools with girls toilets 3.8 18.0 37.5 11.1 40.0% Schools with drinking water facility 80.7 91.4 87.5 77.8 70.0
% Enrolment in Govt. schools 99.5 96.0 100.0 75.0 100.095.3 97.1 93.8 100.0 70.0
% No female teacher schools (tch>=2) 36.4 39.6 43.8 44.4 50.025.2 1.1 7.1 0.0 0.0
1.4 0.1 0.0 0.0 0.0%Enrolment in schools without blackboard 3.7 3.1 6.3 0.0 17.2
2001-02 2002-03 2003-04 2004-05 2005-06IIIIIIIVV
VIVII
Total U.P
17,25715,23417,39415,00813,649
8,970
7,815
14,67416,63216,05115,24612,967
7,3106,210
16,85815,18317,10115,15312,020
5,7244,920
15,86417,13117,74714,42710,878
5,9455,131
17,97518,86418,46313,55710,835
5,0214,543
119.2
28.6
116.4
35.8
141.7
48.0
42.5
12.512.5
7,9247,0718,3457,0446,2543,7993,228
131108157135124
7569
10177
116104
963728
1,733
classrooms
1,240101
2649
48.858.443.642.355.1
33.625.5
17.6
44.634.640.8
16.111.923.1
4.1
417401339
660 422 253 8 1 205 4385 25 0 0 164 4
9 2 0 0 5 03 2 0 0 4 07 2 0 0 0 1
149 734 370 401 95 1 048 381 228 462 120 4 0 0
0 12 8 18 7 0 0 00 5 4 18 2 0 0 00 9 5 9 11 0 0 4
5 51 37 64 7 0 0 0
1279836
302129
40615
86
472 4 78 9 0 230 68 505 1431003
63000
13100
0000
122104
47200
256534
85421
Terminalgrade Passed
VII boysV girlsV boys
VII girls
5 with >60%
9.118421319
462938
11.00.04.80.0
8.77.90.00.00.0
46558Oriya Others Telugu English Sindhi
3745424331094
972
9912365
1279595
8811725
090
0
43320
000
280000
% Schools recvd.
0.10.00.00.00.0
0.00.00.00.00.0
378041209
265686
9439297
3492
326931349
193584
6687542048
2.04.72.93.23.8
4.53.78.28.1
6.916.1
7.76.4
2005-062004-052003-04
ORISSA
34.8
Upper PrimaryPrimary
Sex ratio Sex ratio 0-6
7 109
VIII0.0
Enrolment of children
VIIITotal Pr.
25 434 4
0 0
46 0
%Teachers recvd.in-service training
Total schools* Rural schools* Total enrolment* Rural enrolment* Teachers*
22.2 33.8
100.0
31.8
93.6 93.4
19.0 23.0% SC enrolment% SC girls to SC enrolment% ST enrolment
48.6 41.856.145.1 36.1
11.9
50.4
14.1
50.6
Position of teachers by educational qualification (other than para teacher)
(Previous academic year)Incentives : Number of beneficiaries
% ST girls to ST enrolment
% Girls
Number of villages
% 0 - 6 population
% SC population % ST population
% Urban population
% Schools with blackboard
% Enrolment in single-teacher schools
% Enrolment in schools without building
Primary Upperprimary
OBC EnrolmentPrimary U. Primary
% OBCEnrolment% OBC girls toOBC Enrolment
Pupil-teacher ratio (PTR)Student-classroom ratio (SCR)% Schools with <= 50 students% Schools with PTR > 100% Female teachers
% Schools established since 1995
Regular teachers Para-teachers
% minorrepairs
% majorrepairs
# = not applicable na = not available * Some totals may not match due to no response in classificatory data items
6.0 85.88.9 83.0
27.1 65.36.8 86.8
2556
47.92628
68.80.5
26.113.8
44.43234
7.21.4
31.82.5
33.24449
0.00.0
27.60.0
31.22822
30.00.0
15.810.0
14.0 7.5 50.8 41.3 28.4
964103110.217.9
Category
PrivateGovt.PrivateGovtPrivateGovt.PrivateGovt.PrivateGovt.
Total population (in 000's)
Number of blocks/taluks
District
Decadal growth rate
Primary onlyPrimary with upper primaryPrimary with upper primary & sec/higher sec.Upper primary onlyUpper primary with sec./higher secondary
% Single classroom schools% Single teacher schools
P + UP P+sec/hs U.P. only UP+secP. only
No response in school category
Primary with upper primaryPrimary with U.P. & sec/higherUpper primary onlyUpper primary with sec./higher sec
Primary only
Primary onlyPrimary with upper primaryPrimary with Upper primary & sec/higherUpper primary only
Para-teachers
School category
Upper primary with sec./higher secondary
Primary onlyPrimary with upper prim.
P. onlyP + UPP+sec/hsU.P. onlyUP+sec
NER(U.Prim)GER(U.Prim)NER (Primary)GER (Primary)
Transition ratePrim. to U. Prim
45.5
Performance indicators
SC/ST Enrolment
Indicators
Classrooms/Other rooms
Prim.with U.P.&Sec/H.SUpper Primary onlyU. Primary with Sec./H.S.
Basic Data, 2001
Data reported from
79,694 76,047 76,315 75,570 78,54216,78513,52010,64411,0769,564
65.3
70.4
0.87
## #
43,665 799 559
0
0 0 0
1 - 5 6 - 7
70.4
93.3 14.392.4 12.972.8 6.169.9 4.8
Elementary Education: Report Card - GAJAPATI
Ori
ssa

392
Elementary Education in India - Where do we stand ?
Ori
ssa
22.8 15.7
Key data: Elementary Education
3161
GANJAM
(Previous academic year)
(Previous year)
Gender and caste distribution of teachers*
No. of schools by type of building*
BoysWith disability
Flow rates
Primary Level
Enrolment*
Number of schools
Grade
GER / NER
School category
Primary Upper primaryBoys Boys GirlsGirls
IncentiveType
School categoryMultiple
TypeKuccha
PartiallyPucca
PuccaTotal % good condition
Otherrooms
TentNo
Building
Classrooms
Belowsecondary
Highersecondary
Postgraduate
M. Phil.GraduateSecondarySchool category OthersNo
response
ST teachers
Total Male Female No res Male Female No res Male Female Male FemaleSC teachers
Text booksUniformAttendanceStationery
% Passed
Avg. No. of Tchs.
%
Female literacyOverall literacy
dev. grant grantSchool T L M
Male Female
IVV
IIIIII
Grade R.R. D.O.R. P.R.
VIIVI
# #
I - V
Enrolment by medium of instructions
Examination results
Retention rate
GPI
Primary cycle U. primary cycleState
DISTRICT ELEMENTARY EDUCATION REPORT CARD : 2005-06
GirlsGrade
IIIIIIIVVVI
VIII
AllGirls
Total
VII
% TotalGrossness
School category
77914
14977
43 73715 981
4139
336 0 2
2,281 10519 226,196
1 4,85372 17,246
1 12,4470 0
2,086 45 220,362 2,6857,364 210,404 2,4437,002 2,396 2875,717 16,189 4,956
0 0 0188 4,718 43
247,605 8,387 5,8324,160
683471
P + UP P+sec/hs U.P. only UP+sec
School categoryP. only
9.6 0.4 0.0 4.8 1.217.4
Number of Clusters 35542203
% Schools with SCR > 600.9 0.0 7.0 17.3
13.3 29.9 6.9 20.9 25.9% Schools with pre-primary sections 5.3 6.9 48.3 0.0 1.2% Schools with common toilets 49.1 61.6 82.8 38.7 38.3
% Schools with girls toilets 22.1 32.8 72.4 20.4 29.6% Schools with drinking water facility 82.0 91.1 96.6 73.9 86.4
% Enrolment in Govt. schools 96.7 96.8 40.9 75.1 98.595.5 97.8 93.1 91.3 97.5
% No female teacher schools (tch>=2) 45.0 49.5 65.5 67.8 46.98.6 0.5 0.0 4.9 13.3
1.9 0.1 0.0 2.0 0.2%Enrolment in schools without blackboard 1.7 1.2 2.0 1.5 0.3
2001-02 2002-03 2003-04 2004-05 2005-06IIIIIIIVV
VIVII
Total U.P
81,96385,86995,46088,26279,71754,822
50,912
84,79193,67293,36884,15771,139
48,21143,138
94,01191,25989,18974,89865,009
39,21535,658
65,65362,41858,79851,69444,835
25,36423,062
105.8
32.8
107.4
39.5
127.7
49.6
45.0
0.00.0
39,20241,98246,54542,70438,13625,93024,055
641751874759695525522
393485540514463327340
6,747
classrooms
4,738392480349
55.455.189.045.245.3
27.027.7
17.5
5.131.732.7
17.35.9
23.122.1
1,869124294162
2,660 934 363 9 0 926 152241 40 1 0 532 8
19 0 0 0 9 199 51 5 0 51 2437 27 1 0 14 2
118 2,399 1,280 1,654 294 10 241 1,395 732 1,533 427 9 0 430
0 12 15 39 28 1 0 2486 92 68 283 60 1 2 203 21 27 111 53 3 1 20
2 56 51 76 22 0 0 0
40583053
51421142
1173459180
1807 518 96 36 0 873 196 483 180341247
2017
46141
18230
0000
4431
155
103161
2301
122
74132
Terminalgrade Passed
VII boysV girlsV boys
VII girls
626 with >60%
48.165154631
346539240
49.140.435.113.3
48.253.344.744.7
7.5
244635Oriya Others English Telugu Bodo
2261697382
2154112522
69303767
225659113
1318295
4248394
0
26892855
0158
0
368199
0182
0
% Schools recvd.
0.00.00.00.00.0
0.00.00.00.00.0
208007831
76760
493599638
265
1948635599
117869
43499487
50154
2.75.6
11.92.33.0
13.411.413.611.6
5.719.3
11.312.3
2005-062004-052003-04
ORISSA
13.6
Upper PrimaryPrimary
Sex ratio Sex ratio 0-6
40 357
VIII10.3
Enrolment of children
VIIITotal Pr.
387 152231 9
0 0
118 228
%Teachers recvd.in-service training
Total schools* Rural schools* Total enrolment* Rural enrolment* Teachers*
18.7 36.6
100.0
31.5
83.4 87.3
19.8 23.7% SC enrolment% SC girls to SC enrolment% ST enrolment
47.6 41.03.5
44.7 30.2
50.0
49.0
47.8
48.6
Position of teachers by educational qualification (other than para teacher)
(Previous academic year)Incentives : Number of beneficiaries
% ST girls to ST enrolment
% Girls
Number of villages
% 0 - 6 population
% SC population % ST population
% Urban population
% Schools with blackboard
% Enrolment in single-teacher schools
% Enrolment in schools without building
Primary Upperprimary
OBC EnrolmentPrimary U. Primary
% OBCEnrolment% OBC girls toOBC Enrolment
Pupil-teacher ratio (PTR)Student-classroom ratio (SCR)% Schools with <= 50 students% Schools with PTR > 100% Female teachers
% Schools established since 1995
Regular teachers Para-teachers
% minorrepairs
% majorrepairs
# = not applicable na = not available * Some totals may not match due to no response in classificatory data items
0.3 88.32.3 84.13.3 85.2
15.5 73.23.4 84.35.9 88.4
3034
48.63938
26.02.6
28.311.9
47.85049
1.66.8
25.73.5
49.24348
19.13.0
17.413.5
47.45336
11.116.033.3
0.0
16.0 18.6 2.9 60.8 46.4
93999817.615.0
Category
PrivateGovt.PrivateGovtPrivateGovt.PrivateGovt.PrivateGovt.
Total population (in 000's)
Number of blocks/taluks
District
Decadal growth rate
Primary onlyPrimary with upper primaryPrimary with upper primary & sec/higher sec.Upper primary onlyUpper primary with sec./higher secondary
% Single classroom schools% Single teacher schools
P + UP P+sec/hs U.P. only UP+secP. only
No response in school category
Primary with upper primaryPrimary with U.P. & sec/higherUpper primary onlyUpper primary with sec./higher sec
Primary only
Primary onlyPrimary with upper primaryPrimary with Upper primary & sec/higherUpper primary only
Para-teachers
School category
Upper primary with sec./higher secondary
Primary onlyPrimary with upper prim.
P. onlyP + UPP+sec/hsU.P. onlyUP+sec
NER(U.Prim)GER(U.Prim)NER (Primary)GER (Primary)
Transition ratePrim. to U. Prim
1.7
Performance indicators
SC/ST Enrolment
Indicators
Classrooms/Other rooms
Prim.with U.P.&Sec/H.SUpper Primary onlyU. Primary with Sec./H.S.
Basic Data, 2001
Data reported from
283,398 414,366 427,127 431,271105,73491,34974,87348,426
73.2
0.94
## #
258,554 4,767 3,062
0
0 0 0
1 - 5 6 - 7
95.8 17.995.4 15.480.7 9.978.7 9.0
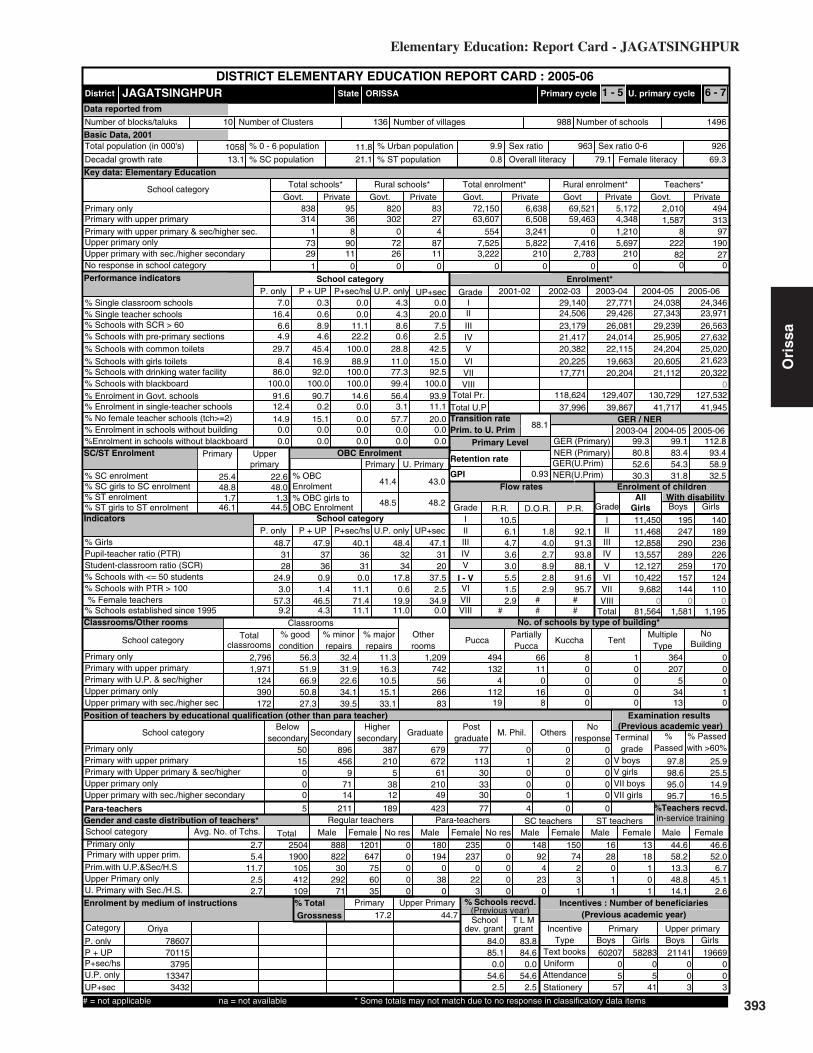
393
25.4 22.6
Key data: Elementary Education
1058
JAGATSINGHPUR
(Previous academic year)
(Previous year)
Gender and caste distribution of teachers*
No. of schools by type of building*
BoysWith disability
Flow rates
Primary Level
Enrolment*
Number of schools
Grade
GER / NER
School category
Primary Upper primaryBoys Boys GirlsGirls
IncentiveType
School categoryMultiple
TypeKuccha
PartiallyPucca
PuccaTotal % good condition
Otherrooms
TentNo
Building
Classrooms
Belowsecondary
Highersecondary
Postgraduate
M. Phil.GraduateSecondarySchool category OthersNo
response
ST teachers
Total Male Female No res Male Female No res Male Female Male FemaleSC teachers
Text booksUniformAttendanceStationery
% Passed
Avg. No. of Tchs.
%
Female literacyOverall literacy
dev. grant grantSchool T L M
Male Female
IVV
IIIIII
Grade R.R. D.O.R. P.R.
VIIVI
# #
I - V
Enrolment by medium of instructions
Examination results
Retention rate
GPI
Primary cycle U. primary cycleState
DISTRICT ELEMENTARY EDUCATION REPORT CARD : 2005-06
GirlsGrade
IIIIIIIVVVI
VIII
AllGirls
Total
VII
% TotalGrossness
School category
3141
7329
36 3028 0
9011
7226
1 0 0
838 9527 63,607
4 55487 7,52511 3,222
0 0
820 83 69,521 5,1726,508 59,463 4,3483,241 0 1,2105,822 7,416 5,697
0 0 0210 2,783 210
72,150 6,638 2,0101,587
494313
P + UP P+sec/hs U.P. only UP+sec
School categoryP. only
7.0 0.3 0.0 4.3 0.016.4
Number of Clusters 1496988
% Schools with SCR > 600.6 0.0 4.3 20.0
6.6 8.9 11.1 8.6 7.5% Schools with pre-primary sections 4.9 4.6 22.2 0.6 2.5% Schools with common toilets 29.7 45.4 100.0 28.8 42.5
% Schools with girls toilets 8.4 16.9 88.9 11.0 15.0% Schools with drinking water facility 86.0 92.0 100.0 77.3 92.5
% Enrolment in Govt. schools 91.6 90.7 14.6 56.4 93.9100.0 100.0 100.0 99.4 100.0
% No female teacher schools (tch>=2) 14.9 15.1 0.0 57.7 20.012.4 0.2 0.0 3.1 11.1
0.0 0.0 0.0 0.0 0.0%Enrolment in schools without blackboard 0.0 0.0 0.0 0.0 0.0
2001-02 2002-03 2003-04 2004-05 2005-06IIIIIIIVV
VIVII
Total U.P
24,34623,97126,56327,63225,02021,623
20,322
24,03827,34329,23925,90524,204
20,60521,112
27,77129,42626,08124,01422,115
19,66320,204
29,14024,50623,17921,41720,382
20,22517,771
99.3
52.6
99.1
54.3
112.8
58.9
40.1
0.011.1
11,45011,46812,85813,55712,12710,422
9,682
195247290289259157144
140189236226170124110
2,796
classrooms
1,971124390172
56.351.966.950.827.3
32.431.9
11.3
22.634.139.5
16.310.515.133.1
74256
26683
1,209 494 66 8 1 364 0132 11 0 0 207 0
4 0 0 0 5 0112 16 0 0 34 1
19 8 0 0 13 0
50 896 387 679 77 0 015 456 210 672 113 1 2 0
0 9 5 61 30 0 0 00 71 38 210 33 0 0 00 14 12 49 30 0 1 0
5 211 189 423 77 4 0 0
888822
30292
71
647756035
1201 0 180 235 0 148 150 16 130000
1940
380
2370
223
0000
924
230
74231
28011
18101
Terminalgrade Passed
VII boysV girlsV boys
VII girls
0 with >60%
44.625041900
105412109
58.213.348.814.1
46.652.0
6.745.1
2.6
78607Oriya
701153795
133473432
% Schools recvd.
84.085.1
0.054.6
2.5
83.884.6
0.054.6
2.5
6020705
57
21141003
5828305
41
19669003
2.75.4
11.72.52.7
10.56.14.73.6
1.52.9
3.05.5
2005-062004-052003-04
ORISSA
71.4
Upper PrimaryPrimary
Sex ratio Sex ratio 0-6
10 136
VIII11.1
Enrolment of children
VIIITotal Pr.
222 19082 27
0 0
8 97
%Teachers recvd.in-service training
Total schools* Rural schools* Total enrolment* Rural enrolment* Teachers*
17.2 44.7
93.4
32.5
80.8 83.4
30.3 31.8% SC enrolment% SC girls to SC enrolment% ST enrolment
48.8 48.01.7
46.1 44.5
41.4
48.5
43.0
48.2
Position of teachers by educational qualification (other than para teacher)
(Previous academic year)Incentives : Number of beneficiaries
% ST girls to ST enrolment
% Girls
Number of villages
% 0 - 6 population
% SC population % ST population
% Urban population
% Schools with blackboard
% Enrolment in single-teacher schools
% Enrolment in schools without building
Primary Upperprimary
OBC EnrolmentPrimary U. Primary
% OBCEnrolment% OBC girls toOBC Enrolment
Pupil-teacher ratio (PTR)Student-classroom ratio (SCR)% Schools with <= 50 students% Schools with PTR > 100% Female teachers
% Schools established since 1995
Regular teachers Para-teachers
% minorrepairs
% majorrepairs
# = not applicable na = not available * Some totals may not match due to no response in classificatory data items
1.8 92.14.0 91.32.7 93.88.9 88.12.8 91.62.9 95.7
3136
48.73128
24.93.0
57.39.2
47.93736
0.91.4
46.54.3
48.43234
17.80.6
19.911.0
47.13120
37.52.5
34.90.0
13.1 21.1 0.8 79.1 69.3
9269639.911.8
Category
PrivateGovt.PrivateGovtPrivateGovt.PrivateGovt.PrivateGovt.
Total population (in 000's)
Number of blocks/taluks
District
Decadal growth rate
Primary onlyPrimary with upper primaryPrimary with upper primary & sec/higher sec.Upper primary onlyUpper primary with sec./higher secondary
% Single classroom schools% Single teacher schools
P + UP P+sec/hs U.P. only UP+secP. only
No response in school category
Primary with upper primaryPrimary with U.P. & sec/higherUpper primary onlyUpper primary with sec./higher sec
Primary only
Primary onlyPrimary with upper primaryPrimary with Upper primary & sec/higherUpper primary only
Para-teachers
School category
Upper primary with sec./higher secondary
Primary onlyPrimary with upper prim.
P. onlyP + UPP+sec/hsU.P. onlyUP+sec
NER(U.Prim)GER(U.Prim)NER (Primary)GER (Primary)
Transition ratePrim. to U. Prim
1.3
Performance indicators
SC/ST Enrolment
Indicators
Classrooms/Other rooms
Prim.with U.P.&Sec/H.SUpper Primary onlyU. Primary with Sec./H.S.
Basic Data, 2001
Data reported from
118,624 129,407 130,729 127,53241,94541,71739,86737,996
88.1
0.93
## #
81,564 1,581 1,195
0
0 0 0
1 - 5 6 - 7
97.8 25.998.6 25.595.0 14.995.7 16.5
Elementary Education: Report Card - JAGATSINGHPUR
Ori
ssa

394
Elementary Education in India - Where do we stand ?
Ori
ssa
29.0 23.1
Key data: Elementary Education
1624
JAJPUR
(Previous academic year)
(Previous year)
Gender and caste distribution of teachers*
No. of schools by type of building*
BoysWith disability
Flow rates
Primary Level
Enrolment*
Number of schools
Grade
GER / NER
School category
Primary Upper primaryBoys Boys GirlsGirls
IncentiveType
School categoryMultiple
TypeKuccha
PartiallyPucca
PuccaTotal % good condition
Otherrooms
TentNo
Building
Classrooms
Belowsecondary
Highersecondary
Postgraduate
M. Phil.GraduateSecondarySchool category OthersNo
response
ST teachers
Total Male Female No res Male Female No res Male Female Male FemaleSC teachers
Text booksUniformAttendanceStationery
% Passed
Avg. No. of Tchs.
%
Female literacyOverall literacy
dev. grant grantSchool T L M
Male Female
IVV
IIIIII
Grade R.R. D.O.R. P.R.
VIIVI
# #
I - V
Enrolment by medium of instructions
Examination results
Retention rate
GPI
Primary cycle U. primary cycleState
DISTRICT ELEMENTARY EDUCATION REPORT CARD : 2005-06
GirlsGrade
IIIIIIIVVVI
VIII
AllGirls
Total
VII
% TotalGrossness
School category
4584
13925
35 4454 3
1613
13821
5 0 0
1,137 8827 119,322
3 404157 12,251
3 3,2560 0
1,099 84 128,832 7,9035,174 115,565 3,2951,313 404 723
10,396 12,083 10,103
0 0 069 2,776 69
133,361 8,434 3,0772,623
495377
P + UP P+sec/hs U.P. only UP+sec
School categoryP. only
8.2 0.6 0.0 6.0 3.610.9
Number of Clusters 20591308
% Schools with SCR > 600.2 0.0 7.3 35.7
17.1 25.2 0.0 11.0 25.0% Schools with pre-primary sections 6.8 9.9 50.0 3.0 7.1% Schools with common toilets 20.8 43.6 75.0 25.7 53.6
% Schools with girls toilets 6.9 17.6 75.0 10.3 46.4% Schools with drinking water facility 80.7 90.3 100.0 76.0 92.9
% Enrolment in Govt. schools 94.1 95.8 23.5 54.1 97.990.7 95.7 75.0 90.0 89.3
% No female teacher schools (tch>=2) 36.2 22.9 12.5 67.7 32.16.8 0.2 0.0 5.8 35.6
2.2 0.0 7.1 2.0 0.0%Enrolment in schools without blackboard 6.6 3.0 7.1 8.8 2.3
2001-02 2002-03 2003-04 2004-05 2005-06IIIIIIIVV
VIVII
Total U.P
45,96947,55148,64847,00140,45233,658
30,701
49,12552,74451,15342,45737,762
31,59830,274
56,54054,94246,54740,37036,271
29,50528,665
50,67642,50538,07733,09430,730
19,89318,466
116.4
49.5
113.7
51.8
132.3
58.8
44.6
12.50.0
21,72722,94423,67722,88719,20015,67814,405
225295324279222155139
199219215167143111
97
3,443
classrooms
2,71267
56198
40.842.249.329.630.7
34.432.9
24.8
40.338.931.7
25.010.431.637.6
85723
24050
1,005 448 246 11 0 427 93122 54 1 0 306 10
3 1 0 0 3 1134 105 2 0 37 22
14 9 0 0 2 3
69 1,353 721 1,161 126 0 723 820 529 1,340 200 4 5 31
1 4 5 39 4 0 1 06 107 112 370 63 1 4 90 7 1 43 6 0 0 0
2 13 22 69 16 0 1 0
22832018
31571
44
913239813
1191 29 39 30 0 340 121 182 6421
030
24020
22031
2000
1631
133
81040
98081
37071
Terminalgrade Passed
VII boysV girlsV boys
VII girls
66 with >60%
62.935723000
54677
58
69.63.2
47.115.9
51.462.5
8.747.5
0.0
140214Oriya English Urdu Others
1236151399
224753302
536441372
00
971181
000
75247
0172
23
% Schools recvd.
0.20.40.00.03.6
0.00.00.00.00.0
107403185
91628
34164445746
100014318153603
30631104113104
2.96.16.82.32.1
12.77.55.44.0
1.91.7
3.36.8
2005-062004-052003-04
ORISSA
42.6
Upper PrimaryPrimary
Sex ratio Sex ratio 0-6
12 173
VIII12.5
Enrolment of children
VIIITotal Pr.
353 32448 10
0 0
13 41
%Teachers recvd.in-service training
Total schools* Rural schools* Total enrolment* Rural enrolment* Teachers*
18.0 45.4
100.0
32.1
92.6 93.3
30.5 31.1% SC enrolment% SC girls to SC enrolment% ST enrolment
49.0 45.49.9
43.7 35.2
30.1
48.6
34.4
48.7
Position of teachers by educational qualification (other than para teacher)
(Previous academic year)Incentives : Number of beneficiaries
% ST girls to ST enrolment
% Girls
Number of villages
% 0 - 6 population
% SC population % ST population
% Urban population
% Schools with blackboard
% Enrolment in single-teacher schools
% Enrolment in schools without building
Primary Upperprimary
OBC EnrolmentPrimary U. Primary
% OBCEnrolment% OBC girls toOBC Enrolment
Pupil-teacher ratio (PTR)Student-classroom ratio (SCR)% Schools with <= 50 students% Schools with PTR > 100% Female teachers
% Schools established since 1995
Regular teachers Para-teachers
% minorrepairs
% majorrepairs
# = not applicable na = not available * Some totals may not match due to no response in classificatory data items
5.5 87.06.1 88.53.6 92.39.2 87.54.4 88.82.5 95.5
2632
48.24041
12.92.8
34.213.1
47.64146
1.41.2
31.23.9
47.13340
17.00.7
14.99.3
45.05734
25.025.024.1
0.0
17.1 23.0 7.8 71.4 60.8
9379724.513.4
Category
PrivateGovt.PrivateGovtPrivateGovt.PrivateGovt.PrivateGovt.
Total population (in 000's)
Number of blocks/taluks
District
Decadal growth rate
Primary onlyPrimary with upper primaryPrimary with upper primary & sec/higher sec.Upper primary onlyUpper primary with sec./higher secondary
% Single classroom schools% Single teacher schools
P + UP P+sec/hs U.P. only UP+secP. only
No response in school category
Primary with upper primaryPrimary with U.P. & sec/higherUpper primary onlyUpper primary with sec./higher sec
Primary only
Primary onlyPrimary with upper primaryPrimary with Upper primary & sec/higherUpper primary only
Para-teachers
School category
Upper primary with sec./higher secondary
Primary onlyPrimary with upper prim.
P. onlyP + UPP+sec/hsU.P. onlyUP+sec
NER(U.Prim)GER(U.Prim)NER (Primary)GER (Primary)
Transition ratePrim. to U. Prim
5.2
Performance indicators
SC/ST Enrolment
Indicators
Classrooms/Other rooms
Prim.with U.P.&Sec/H.SUpper Primary onlyU. Primary with Sec./H.S.
Basic Data, 2001
Data reported from
195,082 234,670 233,241 229,62164,35961,87258,17038,359
87.5
0.93
## #
140,518 1,639 1,151
0
0 0 0
1 - 5 6 - 7
98.6 18.598.4 18.598.3 16.796.8 20.0

395
20.1 19.0
Key data: Elementary Education
510
JHARSUGUDA
(Previous academic year)
(Previous year)
Gender and caste distribution of teachers*
No. of schools by type of building*
BoysWith disability
Flow rates
Primary Level
Enrolment*
Number of schools
Grade
GER / NER
School category
Primary Upper primaryBoys Boys GirlsGirls
IncentiveType
School categoryMultiple
TypeKuccha
PartiallyPucca
PuccaTotal % good condition
Otherrooms
TentNo
Building
Classrooms
Belowsecondary
Highersecondary
Postgraduate
M. Phil.GraduateSecondarySchool category OthersNo
response
ST teachers
Total Male Female No res Male Female No res Male Female Male FemaleSC teachers
Text booksUniformAttendanceStationery
% Passed
Avg. No. of Tchs.
%
Female literacyOverall literacy
dev. grant grantSchool T L M
Male Female
IVV
IIIIII
Grade R.R. D.O.R. P.R.
VIIVI
# #
I - V
Enrolment by medium of instructions
Examination results
Retention rate
GPI
Primary cycle U. primary cycleState
DISTRICT ELEMENTARY EDUCATION REPORT CARD : 2005-06
GirlsGrade
IIIIIIIVVVI
VIII
AllGirls
Total
VII
% TotalGrossness
School category
164205810
4 1380 8
151
384
0 0 0
446 61 29,1250 6,785
12 5,3890 1,2580 0
348 1 22,410 24995 20,890 72
0 1,954 01,189 3,629 979
0 0 0117 342 0
33,415 742 1,145827
3344
P + UP P+sec/hs U.P. only UP+sec
School categoryP. only
12.6 0.6 0.0 4.1 0.017.7
Number of Clusters 724474
% Schools with SCR > 604.2 0.0 11.0 27.3
3.1 4.2 0.0 13.7 9.1% Schools with pre-primary sections 18.1 19.0 65.0 4.1 0.0% Schools with common toilets 26.8 48.2 80.0 38.4 54.5
% Schools with girls toilets 6.6 19.0 70.0 16.4 36.4% Schools with drinking water facility 82.3 88.1 90.0 78.1 81.8
% Enrolment in Govt. schools 97.8 96.7 100.0 81.9 91.592.3 99.4 90.0 90.4 90.9
% No female teacher schools (tch>=2) 27.4 23.2 5.0 49.3 36.410.5 2.2 0.0 7.5 26.8
0.9 0.0 0.0 5.6 0.0%Enrolment in schools without blackboard 5.9 0.2 9.1 5.9 6.0
2001-02 2002-03 2003-04 2004-05 2005-06IIIIIIIVV
VIVII
Total U.P
11,33311,34211,92612,53611,83010,139
9,909
12,06012,32312,36711,97210,509
9,4628,741
13,93412,64312,25510,624
9,847
7,9527,672
15,06612,71311,11910,136
9,509
8,1487,519
94.1
42.6
92.6
48.9
108.3
58.4
41.5
0.00.0
5,4245,6455,7246,0905,6994,8924,587
282311311292260242262
271291295263231216226
1,272
classrooms
989322160
57
49.651.391.952.215.8
25.427.0
25.0
4.725.250.9
21.73.4
22.633.3
316124
9920
460 221 56 24 0 134 1774 4 0 0 90 017 0 0 0 3 039 7 3 0 16 8
7 2 0 0 1 1
29 444 267 356 61 1 013 274 184 298 83 4 3 11
2 18 13 135 87 2 1 413 43 33 89 22 0 0 00 10 5 16 7 2 0 1
1 4 8 7 0 0 0 0
658496132143
19
363126
4721
503 0 5 12 0 115 78 149 801141
01
1020
0000
0000
698
183
44543
1091113
1
68551
Terminalgrade Passed
VII boysV girlsV boys
VII girls
3 with >60%
67.61178871299192
41
68.412.164.131.6
60.461.4
7.961.7
0.0
29808Oriya Hindi English Others Bengali
2627924636101
969
29151976
478267406
44411123590
570
984559254153
0
60000
% Schools recvd.
78.190.530.068.554.5
77.990.530.068.554.5
256135
93201
9229581863
25134327107230
8497572326
2.65.2
15.02.63.7
9.55.23.83.0
2.77.5
2.54.8
2005-062004-052003-04
ORISSA
42.1
Upper PrimaryPrimary
Sex ratio Sex ratio 0-6
5 58
VIII5.0
Enrolment of children
VIIITotal Pr.
156 3637 4
0 0
299 0
%Teachers recvd.in-service training
Total schools* Rural schools* Total enrolment* Rural enrolment* Teachers*
20.2 34.1
86.4
38.5
75.1 75.0
29.5 32.8% SC enrolment% SC girls to SC enrolment% ST enrolment
49.1 46.136.149.3 46.8
27.0
48.6
27.0
49.0
Position of teachers by educational qualification (other than para teacher)
(Previous academic year)Incentives : Number of beneficiaries
% ST girls to ST enrolment
% Girls
Number of villages
% 0 - 6 population
% SC population % ST population
% Urban population
% Schools with blackboard
% Enrolment in single-teacher schools
% Enrolment in schools without building
Primary Upperprimary
OBC EnrolmentPrimary U. Primary
% OBCEnrolment% OBC girls toOBC Enrolment
Pupil-teacher ratio (PTR)Student-classroom ratio (SCR)% Schools with <= 50 students% Schools with PTR > 100% Female teachers
% Schools established since 1995
Regular teachers Para-teachers
% minorrepairs
% majorrepairs
# = not applicable na = not available * Some totals may not match due to no response in classificatory data items
1.7 88.81.8 93.0
0.4 96.63.5 94.01.0 94.2
2123
49.92927
49.11.3
43.719.7
47.13530
0.01.8
41.74.8
49.83441
20.50.0
24.511.0
54.23424
9.19.1
51.29.1
15.1 17.1 31.3 70.7 58.5
94994636.513.1
Category
PrivateGovt.PrivateGovtPrivateGovt.PrivateGovt.PrivateGovt.
Total population (in 000's)
Number of blocks/taluks
District
Decadal growth rate
Primary onlyPrimary with upper primaryPrimary with upper primary & sec/higher sec.Upper primary onlyUpper primary with sec./higher secondary
% Single classroom schools% Single teacher schools
P + UP P+sec/hs U.P. only UP+secP. only
No response in school category
Primary with upper primaryPrimary with U.P. & sec/higherUpper primary onlyUpper primary with sec./higher sec
Primary only
Primary onlyPrimary with upper primaryPrimary with Upper primary & sec/higherUpper primary only
Para-teachers
School category
Upper primary with sec./higher secondary
Primary onlyPrimary with upper prim.
P. onlyP + UPP+sec/hsU.P. onlyUP+sec
NER(U.Prim)GER(U.Prim)NER (Primary)GER (Primary)
Transition ratePrim. to U. Prim
32.2
Performance indicators
SC/ST Enrolment
Indicators
Classrooms/Other rooms
Prim.with U.P.&Sec/H.SUpper Primary onlyU. Primary with Sec./H.S.
Basic Data, 2001
Data reported from
58,543 59,303 59,231 58,96720,04818,20315,62415,667
94.0
0.94
## #
38,061 1,960 1,793
0
0 0 0
1 - 5 6 - 7
98.3 28.699.2 26.290.6 16.093.3 15.8
Elementary Education: Report Card - JHARSUGUDA
Ori
ssa

396
Elementary Education in India - Where do we stand ?
Ori
ssa
21.3 23.7
Key data: Elementary Education
1335
KALAHANDI
(Previous academic year)
(Previous year)
Gender and caste distribution of teachers*
No. of schools by type of building*
BoysWith disability
Flow rates
Primary Level
Enrolment*
Number of schools
Grade
GER / NER
School category
Primary Upper primaryBoys Boys GirlsGirls
IncentiveType
School categoryMultiple
TypeKuccha
PartiallyPucca
PuccaTotal % good condition
Otherrooms
TentNo
Building
Classrooms
Belowsecondary
Highersecondary
Postgraduate
M. Phil.GraduateSecondarySchool category OthersNo
response
ST teachers
Total Male Female No res Male Female No res Male Female Male FemaleSC teachers
Text booksUniformAttendanceStationery
% Passed
Avg. No. of Tchs.
%
Female literacyOverall literacy
dev. grant grantSchool T L M
Male Female
IVV
IIIIII
Grade R.R. D.O.R. P.R.
VIIVI
# #
I - V
Enrolment by medium of instructions
Examination results
Retention rate
GPI
Primary cycle U. primary cycleState
DISTRICT ELEMENTARY EDUCATION REPORT CARD : 2005-06
GirlsGrade
IIIIIIIVVVI
VIII
AllGirls
Total
VII
% TotalGrossness
School category
418119417
21 4068 10
220
9212
10 0 0
1,342 2014 76,442
4 2,52121 8,870
0 2,2630 0
1,295 17 103,526 8093,909 72,519 1,9412,620 2,332 9361,060 8,467 961
0 0 00 1,553 0
107,881 1,043 3,1811,884
109227
P + UP P+sec/hs U.P. only UP+sec
School categoryP. only
4.6 0.5 0.0 3.4 0.016.5
Number of Clusters 19631582
% Schools with SCR > 602.5 0.0 0.0 5.9
5.8 9.6 10.5 12.9 11.8% Schools with pre-primary sections 3.4 5.7 36.8 0.9 0.0% Schools with common toilets 20.9 46.7 57.9 36.2 58.8
% Schools with girls toilets 5.9 15.3 52.6 8.6 23.5% Schools with drinking water facility 88.3 90.4 94.7 82.8 94.1
% Enrolment in Govt. schools 99.0 95.1 49.0 89.3 100.097.8 99.8 94.7 98.3 100.0
% No female teacher schools (tch>=2) 54.8 51.3 42.1 83.6 70.611.0 1.5 0.0 0.0 3.9
0.9 0.0 0.0 0.7 0.0%Enrolment in schools without blackboard 0.6 0.0 13.2 0.7 0.0
2001-02 2002-03 2003-04 2004-05 2005-06IIIIIIIVV
VIVII
Total U.P
49,17134,48031,67628,46726,42420,074
16,317
42,72434,14029,44926,88523,017
14,71513,079
51,64334,32830,74125,53721,628
14,14013,311
46,86135,03427,89723,79921,610
14,79813,484
53,06933,84628,39324,95521,675
14,11612,645
98.7
29.4
92.4
28.2
119.3
40.4
43.3
0.00.0
24,88817,06715,34113,21011,856
8,3056,593
261180203188165105
78
185127113
90725039
3,650
classrooms
2,194212267
78
45.752.371.739.728.2
30.226.5
24.1
19.324.350.0
21.29.0
36.021.8
99285
19955
1,845 629 200 15 0 484 34131 37 0 0 270 1
10 0 0 0 9 055 25 3 0 31 2
7 9 0 0 1 0
347 1,462 607 677 93 5 0102 804 359 700 96 1 0 2
5 37 36 81 12 0 1 00 88 69 150 16 0 0 00 13 17 51 8 0 0 0
1 42 40 52 9 0 0 0
24721580
89287
82
4848336
7
720 1 81 16 0 407 111 459 720000
30000
17000
0000
2671112
5
76630
1918
164
47340
Terminalgrade Passed
VII boysV girlsV boys
VII girls
2 with >60%
72.132902111
172323
89
64.524.763.8
3.7
58.848.3
4.838.9
0.0
108252Oriya English Others Bodo
79171382592532263
7724
131600
566456
0677
0
400000
% Schools recvd.
0.10.00.00.00.0
0.00.00.00.00.0
79015634130
1457
17474519
9265
73307673184
1584
12521208
65239
2.44.89.12.85.2
34.315.812.0
9.2
4.23.7
7.417.8
2005-062004-052003-04
ORISSA
48.3
Upper PrimaryPrimary
Sex ratio Sex ratio 0-6
13 205
VIII10.5
Enrolment of children
VIIITotal Pr.
276 4789 0
0 0
56 116
%Teachers recvd.in-service training
Total schools* Rural schools* Total enrolment* Rural enrolment* Teachers*
23.5 27.7
91.3
29.2
75.1 72.9
21.4 20.3% SC enrolment% SC girls to SC enrolment% ST enrolment
48.5 43.227.947.9 35.9
47.0
48.7
46.8
41.1
Position of teachers by educational qualification (other than para teacher)
(Previous academic year)Incentives : Number of beneficiaries
% ST girls to ST enrolment
% Girls
Number of villages
% 0 - 6 population
% SC population % ST population
% Urban population
% Schools with blackboard
% Enrolment in single-teacher schools
% Enrolment in schools without building
Primary Upperprimary
OBC EnrolmentPrimary U. Primary
% OBCEnrolment% OBC girls toOBC Enrolment
Pupil-teacher ratio (PTR)Student-classroom ratio (SCR)% Schools with <= 50 students% Schools with PTR > 100% Female teachers
% Schools established since 1995
Regular teachers Para-teachers
% minorrepairs
% majorrepairs
# = not applicable na = not available * Some totals may not match due to no response in classificatory data items
1.7 82.5
8.0 84.60.7 81.6
2430
49.13330
33.81.2
22.49.2
45.63837
0.91.4
23.72.7
41.33137
26.70.0
11.17.8
33.42529
5.90.07.90.0
18.0 17.7 28.6 45.9 29.3
98410017.516.3
Category
PrivateGovt.PrivateGovtPrivateGovt.PrivateGovt.PrivateGovt.
Total population (in 000's)
Number of blocks/taluks
District
Decadal growth rate
Primary onlyPrimary with upper primaryPrimary with upper primary & sec/higher sec.Upper primary onlyUpper primary with sec./higher secondary
% Single classroom schools% Single teacher schools
P + UP P+sec/hs U.P. only UP+secP. only
No response in school category
Primary with upper primaryPrimary with U.P. & sec/higherUpper primary onlyUpper primary with sec./higher sec
Primary only
Primary onlyPrimary with upper primaryPrimary with Upper primary & sec/higherUpper primary only
Para-teachers
School category
Upper primary with sec./higher secondary
Primary onlyPrimary with upper prim.
P. onlyP + UPP+sec/hsU.P. onlyUP+sec
NER(U.Prim)GER(U.Prim)NER (Primary)GER (Primary)
Transition ratePrim. to U. Prim
22.8
Performance indicators
SC/ST Enrolment
Indicators
Classrooms/Other rooms
Prim.with U.P.&Sec/H.SUpper Primary onlyU. Primary with Sec./H.S.
Basic Data, 2001
Data reported from
161,938 155,201 163,877 156,215 170,21836,39127,79427,45128,28226,761
84.6
46.6
0.94
## #
97,260 1,180 676
0
0 0 0
1 - 5 6 - 7
46.6
99.1 15.799.2 13.696.8 11.795.9 10.4
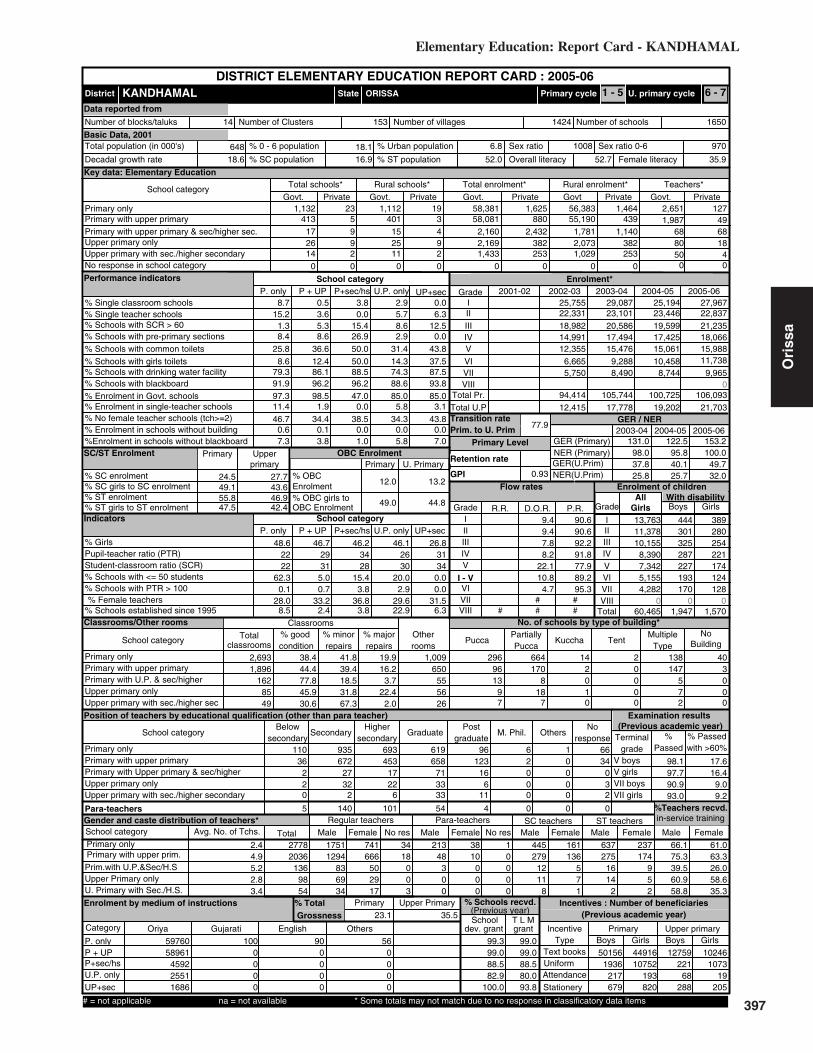
397
24.5 27.7
Key data: Elementary Education
648
KANDHAMAL
(Previous academic year)
(Previous year)
Gender and caste distribution of teachers*
No. of schools by type of building*
BoysWith disability
Flow rates
Primary Level
Enrolment*
Number of schools
Grade
GER / NER
School category
Primary Upper primaryBoys Boys GirlsGirls
IncentiveType
School categoryMultiple
TypeKuccha
PartiallyPucca
PuccaTotal % good condition
Otherrooms
TentNo
Building
Classrooms
Belowsecondary
Highersecondary
Postgraduate
M. Phil.GraduateSecondarySchool category OthersNo
response
ST teachers
Total Male Female No res Male Female No res Male Female Male FemaleSC teachers
Text booksUniformAttendanceStationery
% Passed
Avg. No. of Tchs.
%
Female literacyOverall literacy
dev. grant grantSchool T L M
Male Female
IVV
IIIIII
Grade R.R. D.O.R. P.R.
VIIVI
# #
I - V
Enrolment by medium of instructions
Examination results
Retention rate
GPI
Primary cycle U. primary cycleState
DISTRICT ELEMENTARY EDUCATION REPORT CARD : 2005-06
GirlsGrade
IIIIIIIVVVI
VIII
AllGirls
Total
VII
% TotalGrossness
School category
413172614
5 4019 1592
2511
0 0 0
1,132 233 58,0814 2,1609 2,1692 1,4330 0
1,112 19 56,383 1,464880 55,190 439
2,432 1,781 1,140382 2,073 382
0 0 0253 1,029 253
58,381 1,625 2,6511,987
12749
P + UP P+sec/hs U.P. only UP+sec
School categoryP. only
8.7 0.5 3.8 2.9 0.015.2
Number of Clusters 16501424
% Schools with SCR > 603.6 0.0 5.7 6.3
1.3 5.3 15.4 8.6 12.5% Schools with pre-primary sections 8.4 8.6 26.9 2.9 0.0% Schools with common toilets 25.8 36.6 50.0 31.4 43.8
% Schools with girls toilets 8.6 12.4 50.0 14.3 37.5% Schools with drinking water facility 79.3 86.1 88.5 74.3 87.5
% Enrolment in Govt. schools 97.3 98.5 47.0 85.0 85.091.9 96.2 96.2 88.6 93.8
% No female teacher schools (tch>=2) 46.7 34.4 38.5 34.3 43.811.4 1.9 0.0 5.8 3.1
0.6 0.1 0.0 0.0 0.0%Enrolment in schools without blackboard 7.3 3.8 1.0 5.8 7.0
2001-02 2002-03 2003-04 2004-05 2005-06IIIIIIIVV
VIVII
Total U.P
27,96722,83721,23518,06615,98811,738
9,965
25,19423,44619,59917,42515,061
10,4588,744
29,08723,10120,58617,49415,476
9,2888,490
25,75522,33118,98214,99112,355
6,6655,750
131.0
37.8
122.5
40.1
153.2
49.7
46.2
15.43.8
13,76311,37810,155
8,3907,3425,1554,282
444301325287227193170
389280254221174124128
2,693
classrooms
1,896162
8549
38.444.477.845.930.6
41.839.4
19.9
18.531.867.3
16.23.7
22.42.0
650555626
1,009 296 664 14 2 138 4096 170 2 0 147 313 8 0 0 5 0
9 18 1 0 7 07 7 0 0 2 0
110 935 693 619 96 6 136 672 453 658 123 2 0 34
2 27 17 71 16 0 0 02 32 22 33 6 0 0 30 2 6 33 11 0 0 2
5 140 101 54 4 0 0 0
17511294
836934
666502917
741 34 213 38 1 445 161 637 23718
003
48300
10000
0000
2791211
8
136571
2751614
2
174952
Terminalgrade Passed
VII boysV girlsV boys
VII girls
66 with >60%
66.127782036
1369854
75.339.560.958.8
61.063.326.058.635.3
59760Oriya Gujarati English Others
58961459225511686
1000000
900000
560000
% Schools recvd.
99.399.088.582.9
100.0
99.099.088.580.093.8
501561936
217679
12759221
68288
4491610752
193820
102461073
19205
2.44.95.22.83.4
2005-062004-052003-04
ORISSA
36.8
Upper PrimaryPrimary
Sex ratio Sex ratio 0-6
14 153
VIII3.8
Enrolment of children
VIIITotal Pr.
80 1850 4
0 0
68 68
%Teachers recvd.in-service training
Total schools* Rural schools* Total enrolment* Rural enrolment* Teachers*
23.1 35.5
100.0
32.0
98.0 95.8
25.8 25.7% SC enrolment% SC girls to SC enrolment% ST enrolment
49.1 43.655.847.5 42.4
12.0
49.0
13.2
44.8
Position of teachers by educational qualification (other than para teacher)
(Previous academic year)Incentives : Number of beneficiaries
% ST girls to ST enrolment
% Girls
Number of villages
% 0 - 6 population
% SC population % ST population
% Urban population
% Schools with blackboard
% Enrolment in single-teacher schools
% Enrolment in schools without building
Primary Upperprimary
OBC EnrolmentPrimary U. Primary
% OBCEnrolment% OBC girls toOBC Enrolment
Pupil-teacher ratio (PTR)Student-classroom ratio (SCR)% Schools with <= 50 students% Schools with PTR > 100% Female teachers
% Schools established since 1995
Regular teachers Para-teachers
% minorrepairs
% majorrepairs
# = not applicable na = not available * Some totals may not match due to no response in classificatory data items
9.4 90.69.4 90.67.8 92.28.2 91.8
22.1 77.910.8 89.2
4.7 95.3
2834
48.62222
62.30.1
28.08.5
46.72931
5.00.7
33.22.4
46.12630
20.02.9
29.622.9
26.83134
0.00.0
31.56.3
18.6 16.9 52.0 52.7 35.9
97010086.818.1
Category
PrivateGovt.PrivateGovtPrivateGovt.PrivateGovt.PrivateGovt.
Total population (in 000's)
Number of blocks/taluks
District
Decadal growth rate
Primary onlyPrimary with upper primaryPrimary with upper primary & sec/higher sec.Upper primary onlyUpper primary with sec./higher secondary
% Single classroom schools% Single teacher schools
P + UP P+sec/hs U.P. only UP+secP. only
No response in school category
Primary with upper primaryPrimary with U.P. & sec/higherUpper primary onlyUpper primary with sec./higher sec
Primary only
Primary onlyPrimary with upper primaryPrimary with Upper primary & sec/higherUpper primary only
Para-teachers
School category
Upper primary with sec./higher secondary
Primary onlyPrimary with upper prim.
P. onlyP + UPP+sec/hsU.P. onlyUP+sec
NER(U.Prim)GER(U.Prim)NER (Primary)GER (Primary)
Transition ratePrim. to U. Prim
46.9
Performance indicators
SC/ST Enrolment
Indicators
Classrooms/Other rooms
Prim.with U.P.&Sec/H.SUpper Primary onlyU. Primary with Sec./H.S.
Basic Data, 2001
Data reported from
94,414 105,744 100,725 106,09321,70319,20217,77812,415
77.9
0.93
## #
60,465 1,947 1,570
0
0 0 0
1 - 5 6 - 7
98.1 17.697.7 16.490.9 9.093.0 9.2
Elementary Education: Report Card - KANDHAMAL
Ori
ssa

398
Elementary Education in India - Where do we stand ?
Ori
ssa
24.8 21.9
Key data: Elementary Education
1302
KENDRAPARA
(Previous academic year)
(Previous year)
Gender and caste distribution of teachers*
No. of schools by type of building*
BoysWith disability
Flow rates
Primary Level
Enrolment*
Number of schools
Grade
GER / NER
School category
Primary Upper primaryBoys Boys GirlsGirls
IncentiveType
School categoryMultiple
TypeKuccha
PartiallyPucca
PuccaTotal % good condition
Otherrooms
TentNo
Building
Classrooms
Belowsecondary
Highersecondary
Postgraduate
M. Phil.GraduateSecondarySchool category OthersNo
response
ST teachers
Total Male Female No res Male Female No res Male Female Male FemaleSC teachers
Text booksUniformAttendanceStationery
% Passed
Avg. No. of Tchs.
%
Female literacyOverall literacy
dev. grant grantSchool T L M
Male Female
IVV
IIIIII
Grade R.R. D.O.R. P.R.
VIIVI
# #
I - V
Enrolment by medium of instructions
Examination results
Retention rate
GPI
Primary cycle U. primary cycleState
DISTRICT ELEMENTARY EDUCATION REPORT CARD : 2005-06
GirlsGrade
IIIIIIIVVVI
VIII
AllGirls
Total
VII
% TotalGrossness
School category
4394
11030
25 4265 3
1089
10626
6 0 1
1,027 5115 93,372
2 708107 9,128
8 2,2940 0
985 41 91,365 2,9873,897 90,088 1,7881,392 563 4276,880 8,770 6,827
0 0 0246 1,735 219
95,944 4,052 2,5972,316
342252
P + UP P+sec/hs U.P. only UP+sec
School categoryP. only
16.1 0.9 0.0 12.4 5.117.3
Number of Clusters 18141304
% Schools with SCR > 600.9 11.1 5.0 17.9
15.7 21.3 0.0 12.4 2.6% Schools with pre-primary sections 7.1 8.6 22.2 1.4 0.0% Schools with common toilets 30.1 42.5 66.7 30.7 33.3
% Schools with girls toilets 13.6 16.4 55.6 11.0 25.6% Schools with drinking water facility 69.6 78.4 55.6 67.4 69.2
% Enrolment in Govt. schools 95.9 96.0 33.7 57.0 90.396.3 96.8 88.9 95.4 89.7
% No female teacher schools (tch>=2) 30.7 29.5 33.3 65.1 33.310.1 0.7 18.3 3.9 25.0
1.1 0.0 0.0 2.2 0.0%Enrolment in schools without blackboard 2.3 2.5 18.3 1.4 7.6
2001-02 2002-03 2003-04 2004-05 2005-06IIIIIIIVV
VIVII
Total U.P
29,53931,58435,31035,83332,66827,556
25,423
31,60037,25539,05734,58030,539
25,70925,189
39,13742,03738,38832,86729,824
25,66426,023
40,19634,55732,27629,24826,551
19,79519,706
113.6
55.3
106.5
53.8
118.5
60.4
49.7
11.111.1
14,14715,33417,33717,72215,94113,19812,246
281381448438419286234
231275355378314197172
2,718
classrooms
2,21977
418140
44.442.564.934.531.2
31.828.2
23.8
26.024.534.8
29.39.1
41.034.1
75840
17264
969 373 250 26 0 379 50101 75 3 0 279 6
6 0 0 0 2 174 72 31 0 25 1613 16 2 0 7 1
55 1,212 524 745 97 2 012 685 385 969 174 3 5 230
0 5 3 29 10 0 0 303 58 72 281 65 0 1 81 11 12 54 23 0 2 33
1 47 45 79 12 0 0 0
16381633
20401
65
618277838
1016 212 44 29 0 196 92 38 23212
309
33
65040
40231
0000
1372
122
61112
37063
8000
Terminalgrade Passed
VII boysV girlsV boys
VII girls
231 with >60%
44.429392568
79495137
56.25.0
44.41.5
44.147.6
0.033.3
2.6
97974Oriya Urdu Others Sanskrit English
965051955
159652440
1609656
000
387108145
058
000
4442
260000
% Schools recvd.
0.20.00.00.00.0
0.00.00.00.00.0
90678122
0128
3889200
20
88294262
1101
3635000
10
2.75.58.82.33.5
10.14.84.33.0
1.62.3
2.34.8
2005-062004-052003-04
ORISSA
36.7
Upper PrimaryPrimary
Sex ratio Sex ratio 0-6
11 154
VIII33.3
Enrolment of children
VIIITotal Pr.
279 216106 31
0 0
20 59
%Teachers recvd.in-service training
Total schools* Rural schools* Total enrolment* Rural enrolment* Teachers*
16.1 46.0
99.5
32.6
93.4 89.9
32.6 30.3% SC enrolment% SC girls to SC enrolment% ST enrolment
49.0 47.21.7
44.6 44.3
52.8
48.9
54.6
48.4
Position of teachers by educational qualification (other than para teacher)
(Previous academic year)Incentives : Number of beneficiaries
% ST girls to ST enrolment
% Girls
Number of villages
% 0 - 6 population
% SC population % ST population
% Urban population
% Schools with blackboard
% Enrolment in single-teacher schools
% Enrolment in schools without building
Primary Upperprimary
OBC EnrolmentPrimary U. Primary
% OBCEnrolment% OBC girls toOBC Enrolment
Pupil-teacher ratio (PTR)Student-classroom ratio (SCR)% Schools with <= 50 students% Schools with PTR > 100% Female teachers
% Schools established since 1995
Regular teachers Para-teachers
% minorrepairs
% majorrepairs
# = not applicable na = not available * Some totals may not match due to no response in classificatory data items
4.9 90.36.7 89.14.5 92.58.8 88.94.2 90.91.8 96.6
2727
49.23437
24.32.6
35.69.0
48.03844
1.71.9
25.66.0
48.63238
21.10.5
16.47.3
49.01918
53.810.328.5
2.6
13.3 20.5 0.5 76.8 66.8
94010145.713.4
Category
PrivateGovt.PrivateGovtPrivateGovt.PrivateGovt.PrivateGovt.
Total population (in 000's)
Number of blocks/taluks
District
Decadal growth rate
Primary onlyPrimary with upper primaryPrimary with upper primary & sec/higher sec.Upper primary onlyUpper primary with sec./higher secondary
% Single classroom schools% Single teacher schools
P + UP P+sec/hs U.P. only UP+secP. only
No response in school category
Primary with upper primaryPrimary with U.P. & sec/higherUpper primary onlyUpper primary with sec./higher sec
Primary only
Primary onlyPrimary with upper primaryPrimary with Upper primary & sec/higherUpper primary only
Para-teachers
School category
Upper primary with sec./higher secondary
Primary onlyPrimary with upper prim.
P. onlyP + UPP+sec/hsU.P. onlyUP+sec
NER(U.Prim)GER(U.Prim)NER (Primary)GER (Primary)
Transition ratePrim. to U. Prim
2.0
Performance indicators
SC/ST Enrolment
Indicators
Classrooms/Other rooms
Prim.with U.P.&Sec/H.SUpper Primary onlyU. Primary with Sec./H.S.
Basic Data, 2001
Data reported from
162,828 182,253 173,031 164,93452,97950,89851,68739,501
88.9
0.95
## #
105,925 2,487 1,922
0
0 0 0
1 - 5 6 - 7
98.7 20.098.6 20.296.6 11.497.5 13.8

399
11.9 14.1
Key data: Elementary Education
1562
KEONJHAR
(Previous academic year)
(Previous year)
Gender and caste distribution of teachers*
No. of schools by type of building*
BoysWith disability
Flow rates
Primary Level
Enrolment*
Number of schools
Grade
GER / NER
School category
Primary Upper primaryBoys Boys GirlsGirls
IncentiveType
School categoryMultiple
TypeKuccha
PartiallyPucca
PuccaTotal % good condition
Otherrooms
TentNo
Building
Classrooms
Belowsecondary
Highersecondary
Postgraduate
M. Phil.GraduateSecondarySchool category OthersNo
response
ST teachers
Total Male Female No res Male Female No res Male Female Male FemaleSC teachers
Text booksUniformAttendanceStationery
% Passed
Avg. No. of Tchs.
%
Female literacyOverall literacy
dev. grant grantSchool T L M
Male Female
IVV
IIIIII
Grade R.R. D.O.R. P.R.
VIIVI
# #
I - V
Enrolment by medium of instructions
Examination results
Retention rate
GPI
Primary cycle U. primary cycleState
DISTRICT ELEMENTARY EDUCATION REPORT CARD : 2005-06
GirlsGrade
IIIIIIIVVVI
VIII
AllGirls
Total
VII
% TotalGrossness
School category
46511
19722
22 4455 10
1121
19115
19 0 3
1,500 3518 91,417
4 1,972105 15,584
1 2,5650 44
1,428 30 124,801 2,0414,819 85,071 3,4031,367 1,940 1,0546,149 14,800 5,582
0 0 060 1,652 60
133,529 3,119 3,6482,396
191228
P + UP P+sec/hs U.P. only UP+sec
School categoryP. only
5.9 0.6 12.5 3.9 4.312.0
Number of Clusters 23891770
% Schools with SCR > 600.2 6.3 2.3 13.0
6.7 13.8 18.8 7.1 30.4% Schools with pre-primary sections 0.7 2.5 18.8 0.0 0.0% Schools with common toilets 22.0 40.5 43.8 31.7 30.4
% Schools with girls toilets 5.2 12.1 37.5 8.4 47.8% Schools with drinking water facility 79.5 86.2 100.0 72.5 95.7
% Enrolment in Govt. schools 97.7 95.0 59.1 71.7 97.792.1 93.2 81.3 90.0 91.3
% No female teacher schools (tch>=2) 44.4 37.2 25.0 75.7 56.59.1 0.2 1.0 1.8 17.5
0.7 0.1 0.0 1.7 0.0%Enrolment in schools without blackboard 6.8 5.9 7.6 8.2 11.8
2001-02 2002-03 2003-04 2004-05 2005-06IIIIIIIVV
VIVII
Total U.P
54,74842,09440,25636,73033,92427,831
25,042
51,37345,65539,97536,43432,065
25,28224,134
59,52745,41340,06334,20329,746
23,36323,180
60,33946,17638,60932,05028,390
23,62222,077
65,86146,89938,01431,67428,484
23,39421,470
107.8
41.3
104.3
43.1
124.5
50.2
40.6
6.30.0
26,40320,12219,16917,33515,87612,87511,656
821610538529474299267
670530445427354274245
4,219
classrooms
2,485112634
82
41.239.363.430.443.9
29.629.3
29.2
25.928.029.3
31.510.741.626.8
1,17636
48941
2,491 504 167 32 1 814 16105 32 6 0 342 2
11 2 0 0 3 0100 63 41 0 93 12
18 4 1 0 0 0
57 1,409 693 924 85 0 118 636 393 1,008 123 2 0 52
1 13 11 47 3 0 0 133 137 109 371 49 0 1 250 6 8 26 9 1 0 0
7 234 254 446 68 0 0 0
23151607
43613
36
575317414
871 62 381 207 3 421 119 593 1525014
80
2581413
3
1322
120
2000
1855
232
58470
2898
342
79250
Terminalgrade Passed
VII boysV girlsV boys
VII girls
79 with >60%
44.538392624
104720
53
49.031.635.112.8
42.743.118.244.214.3
135402Oriya Others English Hindi Urdu
956283016
212462625
679445
0195
0
17900
1520
00
32300
1880000
% Schools recvd.
0.00.20.00.00.0
0.00.00.00.00.0
989611793
2041042
26903329
47202
905832267
1121018
23624597
3255
2.55.46.52.32.3
21.710.3
7.65.7
3.33.6
4.810.9
2005-062004-052003-04
ORISSA
31.7
Upper PrimaryPrimary
Sex ratio Sex ratio 0-6
17 201
VIII18.8
Enrolment of children
VIIITotal Pr.
497 22351 2
8 0
41 63
%Teachers recvd.in-service training
Total schools* Rural schools* Total enrolment* Rural enrolment* Teachers*
22.0 36.2
97.1
32.0
83.4 83.2
27.5 27.6% SC enrolment% SC girls to SC enrolment% ST enrolment
49.5 48.554.246.3 43.5
27.2
49.2
36.2
48.3
Position of teachers by educational qualification (other than para teacher)
(Previous academic year)Incentives : Number of beneficiaries
% ST girls to ST enrolment
% Girls
Number of villages
% 0 - 6 population
% SC population % ST population
% Urban population
% Schools with blackboard
% Enrolment in single-teacher schools
% Enrolment in schools without building
Primary Upperprimary
OBC EnrolmentPrimary U. Primary
% OBCEnrolment% OBC girls toOBC Enrolment
Pupil-teacher ratio (PTR)Student-classroom ratio (SCR)% Schools with <= 50 students% Schools with PTR > 100% Female teachers
% Schools established since 1995
Regular teachers Para-teachers
% minorrepairs
% majorrepairs
# = not applicable na = not available * Some totals may not match due to no response in classificatory data items
5.5 72.88.2 81.55.7 86.75.5 88.9
11.0 84.27.0 82.11.1 95.7
3032
47.93632
22.61.8
28.111.9
46.73739
0.80.4
26.92.9
47.93034
31.70.0
11.92.6
45.15032
8.713.026.4
0.0
16.8 11.6 44.5 59.2 46.2
96297713.615.6
Category
PrivateGovt.PrivateGovtPrivateGovt.PrivateGovt.PrivateGovt.
Total population (in 000's)
Number of blocks/taluks
District
Decadal growth rate
Primary onlyPrimary with upper primaryPrimary with upper primary & sec/higher sec.Upper primary onlyUpper primary with sec./higher secondary
% Single classroom schools% Single teacher schools
P + UP P+sec/hs U.P. only UP+secP. only
No response in school category
Primary with upper primaryPrimary with U.P. & sec/higherUpper primary onlyUpper primary with sec./higher sec
Primary only
Primary onlyPrimary with upper primaryPrimary with Upper primary & sec/higherUpper primary only
Para-teachers
School category
Upper primary with sec./higher secondary
Primary onlyPrimary with upper prim.
P. onlyP + UPP+sec/hsU.P. onlyUP+sec
NER(U.Prim)GER(U.Prim)NER (Primary)GER (Primary)
Transition ratePrim. to U. Prim
38.8
Performance indicators
SC/ST Enrolment
Indicators
Classrooms/Other rooms
Prim.with U.P.&Sec/H.SUpper Primary onlyU. Primary with Sec./H.S.
Basic Data, 2001
Data reported from
210,932 205,564 208,952 205,502 207,75252,87349,41646,54345,69944,864
84.2
49.2
0.91
## #
123,436 3,538 2,945
0
0 0 0
1 - 5 6 - 7
49.2
98.1 22.698.1 19.894.3 15.095.4 13.6
Elementary Education: Report Card - KEONJHAR
Ori
ssa

400
Elementary Education in India - Where do we stand ?
Ori
ssa
16.9 13.9
Key data: Elementary Education
1877
KHORDHA
(Previous academic year)
(Previous year)
Gender and caste distribution of teachers*
No. of schools by type of building*
BoysWith disability
Flow rates
Primary Level
Enrolment*
Number of schools
Grade
GER / NER
School category
Primary Upper primaryBoys Boys GirlsGirls
IncentiveType
School categoryMultiple
TypeKuccha
PartiallyPucca
PuccaTotal % good condition
Otherrooms
TentNo
Building
Classrooms
Belowsecondary
Highersecondary
Postgraduate
M. Phil.GraduateSecondarySchool category OthersNo
response
ST teachers
Total Male Female No res Male Female No res Male Female Male FemaleSC teachers
Text booksUniformAttendanceStationery
% Passed
Avg. No. of Tchs.
%
Female literacyOverall literacy
dev. grant grantSchool T L M
Male Female
IVV
IIIIII
Grade R.R. D.O.R. P.R.
VIIVI
# #
I - V
Enrolment by medium of instructions
Examination results
Retention rate
GPI
Primary cycle U. primary cycleState
DISTRICT ELEMENTARY EDUCATION REPORT CARD : 2005-06
GirlsGrade
IIIIIIIVVVI
VIII
AllGirls
Total
VII
% TotalGrossness
School category
35523
12438
43 26730 868
5113
1122 0 0
1,000 5513 84,148
1 5,77552 13,835
2 7,1650 0
850 34 82,603 1,6365,806 60,671 1,257
10,055 1,671 864,375 12,634 3,368
0 0 0341 1,546 134
107,477 3,104 3,1002,175
327397
P + UP P+sec/hs U.P. only UP+sec
School categoryP. only
5.5 0.5 0.0 1.0 0.018.2
Number of Clusters 17631084
% Schools with SCR > 601.0 0.0 6.3 9.3
8.0 15.6 1.9 14.6 7.0% Schools with pre-primary sections 7.2 14.6 66.0 0.5 2.3% Schools with common toilets 36.9 56.5 69.8 34.4 79.1
% Schools with girls toilets 14.2 27.6 79.2 13.5 34.9% Schools with drinking water facility 83.1 93.7 96.2 85.4 90.7
% Enrolment in Govt. schools 97.2 93.5 36.5 76.0 95.588.8 89.4 56.6 86.5 95.3
% No female teacher schools (tch>=2) 21.0 18.1 5.7 54.2 11.68.9 0.4 0.0 3.4 6.1
1.7 0.5 0.0 0.8 0.0%Enrolment in schools without blackboard 3.9 6.7 27.9 4.9 3.3
2001-02 2002-03 2003-04 2004-05 2005-06IIIIIIIVV
VIVII
Total U.P
35,12836,74538,69937,09935,15430,663
28,593
40,65942,70641,94939,26436,374
31,80330,038
42,55940,39840,31236,63034,068
29,12728,008
38,90136,17236,92833,79431,550
27,06225,246
82.0
41.5
82.9
43.8
91.1
46.8
41.8
28.35.7
16,61517,54318,61318,02016,73314,58513,712
302235304277242209203
180149211185166131150
3,178
classrooms
2,178486437271
43.951.688.335.464.2
31.929.0
24.2
8.036.321.0
19.53.7
28.214.8
654184225141
1,050 312 228 14 1 367 133111 44 3 0 209 30
23 2 0 0 6 2274 55 12 0 30 2132 5 0 0 4 2
65 797 533 1,132 228 5 321 380 274 1,010 289 5 11 62
4 26 34 238 109 4 0 2453 67 64 248 55 0 1 70 24 13 93 60 1 0 15
6 199 250 586 139 11 3 0
1197893263323
79
1139361115125
1584 33 325 286 2 276 146 118 502036
72
2640
352
2509
354
6000
1187
114
799
153
85261
40330
Terminalgrade Passed
VII boysV girlsV boys
VII girls
51 with >60%
38.834272572
669515212
30.03.8
32.117.3
37.126.1
3.035.330.2
108832Oriya English Urdu Others Bengali
881837630
181567104
118512708207
0402
4470000
107212
042
0
690000
% Schools recvd.
12.611.3
3.86.32.3
12.611.6
3.86.32.3
79082119
16517
2942688
61
75226171
17508
28028272
854
3.26.5
12.62.74.9
8.55.04.53.1
1.51.2
2.44.8
2005-062004-052003-04
ORISSA
55.3
Upper PrimaryPrimary
Sex ratio Sex ratio 0-6
11 182
VIII13.2
Enrolment of children
VIIITotal Pr.
360 155199 13
19 0
183 486
%Teachers recvd.in-service training
Total schools* Rural schools* Total enrolment* Rural enrolment* Teachers*
17.6 46.1
75.1
25.3
65.3 67.0
24.2 24.2% SC enrolment% SC girls to SC enrolment% ST enrolment
48.2 47.36.5
45.7 35.4
29.4
48.2
29.5
48.6
Position of teachers by educational qualification (other than para teacher)
(Previous academic year)Incentives : Number of beneficiaries
% ST girls to ST enrolment
% Girls
Number of villages
% 0 - 6 population
% SC population % ST population
% Urban population
% Schools with blackboard
% Enrolment in single-teacher schools
% Enrolment in schools without building
Primary Upperprimary
OBC EnrolmentPrimary U. Primary
% OBCEnrolment% OBC girls toOBC Enrolment
Pupil-teacher ratio (PTR)Student-classroom ratio (SCR)% Schools with <= 50 students% Schools with PTR > 100% Female teachers
% Schools established since 1995
Regular teachers Para-teachers
% minorrepairs
% majorrepairs
# = not applicable na = not available * Some totals may not match due to no response in classificatory data items
6.4 85.18.8 86.29.9 85.69.6 87.3
14.6 83.09.8 85.59.7 88.8
3324
48.43235
27.51.6
54.612.9
48.13541
6.03.8
54.09.0
48.73542
24.01.6
29.111.5
46.33528
11.69.3
60.84.7
24.8 13.5 5.2 79.6 70.4
92690242.912.3
Category
PrivateGovt.PrivateGovtPrivateGovt.PrivateGovt.PrivateGovt.
Total population (in 000's)
Number of blocks/taluks
District
Decadal growth rate
Primary onlyPrimary with upper primaryPrimary with upper primary & sec/higher sec.Upper primary onlyUpper primary with sec./higher secondary
% Single classroom schools% Single teacher schools
P + UP P+sec/hs U.P. only UP+secP. only
No response in school category
Primary with upper primaryPrimary with U.P. & sec/higherUpper primary onlyUpper primary with sec./higher sec
Primary only
Primary onlyPrimary with upper primaryPrimary with Upper primary & sec/higherUpper primary only
Para-teachers
School category
Upper primary with sec./higher secondary
Primary onlyPrimary with upper prim.
P. onlyP + UPP+sec/hsU.P. onlyUP+sec
NER(U.Prim)GER(U.Prim)NER (Primary)GER (Primary)
Transition ratePrim. to U. Prim
4.1
Performance indicators
SC/ST Enrolment
Indicators
Classrooms/Other rooms
Prim.with U.P.&Sec/H.SUpper Primary onlyU. Primary with Sec./H.S.
Basic Data, 2001
Data reported from
177,345 193,967 200,952 182,82559,25661,84157,13552,308
83.0
0.92
## #
115,821 1,772 1,172
0
0 0 0
1 - 5 6 - 7
97.6 23.598.1 22.696.5 17.197.3 15.6

401
18.0 21.2
Key data: Elementary Education
1181
KORAPUT
(Previous academic year)
(Previous year)
Gender and caste distribution of teachers*
No. of schools by type of building*
BoysWith disability
Flow rates
Primary Level
Enrolment*
Number of schools
Grade
GER / NER
School category
Primary Upper primaryBoys Boys GirlsGirls
IncentiveType
School categoryMultiple
TypeKuccha
PartiallyPucca
PuccaTotal % good condition
Otherrooms
TentNo
Building
Classrooms
Belowsecondary
Highersecondary
Postgraduate
M. Phil.GraduateSecondarySchool category OthersNo
response
ST teachers
Total Male Female No res Male Female No res Male Female Male FemaleSC teachers
Text booksUniformAttendanceStationery
% Passed
Avg. No. of Tchs.
%
Female literacyOverall literacy
dev. grant grantSchool T L M
Male Female
IVV
IIIIII
Grade R.R. D.O.R. P.R.
VIIVI
# #
I - V
Enrolment by medium of instructions
Examination results
Retention rate
GPI
Primary cycle U. primary cycleState
DISTRICT ELEMENTARY EDUCATION REPORT CARD : 2005-06
GirlsGrade
IIIIIIIVVVI
VIII
AllGirls
Total
VII
% TotalGrossness
School category
410142732
18 38817 9
55
2220
0 0 0
1,608 475 57,5803 3,3584 3,1821 4,1580 0
1,445 39 97,682 2,7143,041 53,228 8536,315 2,371 1,991
279 2,385 224
0 0 0961 1,853 134
113,701 3,850 3,6951,709
166169
P + UP P+sec/hs U.P. only UP+sec
School categoryP. only
14.4 3.3 3.2 3.1 2.724.2
Number of Clusters 21831362
% Schools with SCR > 601.4 0.0 3.1 13.5
6.2 11.0 6.5 18.8 16.2% Schools with pre-primary sections 0.9 2.8 38.7 3.1 0.0% Schools with common toilets 12.4 30.1 77.4 46.9 59.5
% Schools with girls toilets 7.7 19.9 67.7 37.5 54.1% Schools with drinking water facility 73.7 87.6 93.5 81.3 89.2
% Enrolment in Govt. schools 96.7 95.0 34.7 91.9 81.287.3 91.6 87.1 87.5 78.4
% No female teacher schools (tch>=2) 35.1 41.1 19.4 43.8 37.817.1 0.9 0.0 1.1 8.4
4.1 0.2 0.0 0.0 0.0%Enrolment in schools without blackboard 10.3 8.4 3.1 9.8 20.4
2001-02 2002-03 2003-04 2004-05 2005-06IIIIIIIVV
VIVII
Total U.P
37,91633,33137,25329,98929,77815,461
12,697
34,42540,43232,56633,75125,008
12,28210,246
40,97136,39638,58428,60820,958
10,4748,821
37,47242,36332,06222,55618,688
6,5415,785
113.5
22.7
112.4
26.2
133.4
35.4
44.6
6.50.0
18,71716,06018,13914,15413,950
5,9694,640
281249297244267167
92
241212270203202
6938
3,592
classrooms
1,710415
80192
40.954.583.035.560.7
41.730.7
17.3
13.446.132.7
14.83.5
18.46.5
519142
4383
1,408 947 430 15 8 110 138254 80 0 1 82 9
23 2 0 0 2 323 6 0 0 2 130 4 0 0 0 3
210 1,677 631 739 117 1 175 657 254 435 98 3 2 100
2 19 12 103 59 1 0 1752 38 12 35 8 0 0 23 24 24 57 28 3 0 23
13 218 151 168 53 0 0 0
21731019
866198
530116
3544
1253 79 225 130 1 339 159 477 15475
1691
20
187521
67750
0000
13910
112
69923
27762
11
36534
Terminalgrade Passed
VII boysV girlsV boys
VII girls
129 with >60%
58.338611878
383104163
50.36.6
49.25.1
52.647.4
4.132.5
0.0
109490Oriya Others English Hindi Bengali
56223671432374818
63653127
77266
211
239404
202900
00
16400
1090000
% Schools recvd.
0.10.00.00.00.0
0.00.00.00.00.0
801834160
4947479
14111523224552
7184335947
4347603
81773691
181468
2.34.4
12.43.34.4
10.38.08.66.5
6.113.6
6.08.0
2005-062004-052003-04
ORISSA
32.1
Upper PrimaryPrimary
Sex ratio Sex ratio 0-6
18 130
VIII0.0
Enrolment of children
VIIITotal Pr.
94 10140 23
0 0
103 280
%Teachers recvd.in-service training
Total schools* Rural schools* Total enrolment* Rural enrolment* Teachers*
22.5 36.5
100.0
22.5
87.4 89.1
15.4 17.2% SC enrolment% SC girls to SC enrolment% ST enrolment
48.6 40.455.947.9 30.3
6.2
48.9
6.1
37.3
Position of teachers by educational qualification (other than para teacher)
(Previous academic year)Incentives : Number of beneficiaries
% ST girls to ST enrolment
% Girls
Number of villages
% 0 - 6 population
% SC population % ST population
% Urban population
% Schools with blackboard
% Enrolment in single-teacher schools
% Enrolment in schools without building
Primary Upperprimary
OBC EnrolmentPrimary U. Primary
% OBCEnrolment% OBC girls toOBC Enrolment
Pupil-teacher ratio (PTR)Student-classroom ratio (SCR)% Schools with <= 50 students% Schools with PTR > 100% Female teachers
% Schools established since 1995
Regular teachers Para-teachers
% minorrepairs
% majorrepairs
# = not applicable na = not available * Some totals may not match due to no response in classificatory data items
2.3 87.46.7 85.26.0 85.49.8 83.8
35.2 58.810.6 81.5
1.9 92.1
2325
49.23033
43.11.0
35.814.6
42.73235
5.81.2
31.83.0
37.13343
21.90.0
38.56.3
45.53127
2.78.1
27.02.7
14.4 13.0 49.6 35.7 24.3
98399916.817.0
Category
PrivateGovt.PrivateGovtPrivateGovt.PrivateGovt.PrivateGovt.
Total population (in 000's)
Number of blocks/taluks
District
Decadal growth rate
Primary onlyPrimary with upper primaryPrimary with upper primary & sec/higher sec.Upper primary onlyUpper primary with sec./higher secondary
% Single classroom schools% Single teacher schools
P + UP P+sec/hs U.P. only UP+secP. only
No response in school category
Primary with upper primaryPrimary with U.P. & sec/higherUpper primary onlyUpper primary with sec./higher sec
Primary only
Primary onlyPrimary with upper primaryPrimary with Upper primary & sec/higherUpper primary only
Para-teachers
School category
Upper primary with sec./higher secondary
Primary onlyPrimary with upper prim.
P. onlyP + UPP+sec/hsU.P. onlyUP+sec
NER(U.Prim)GER(U.Prim)NER (Primary)GER (Primary)
Transition ratePrim. to U. Prim
36.1
Performance indicators
SC/ST Enrolment
Indicators
Classrooms/Other rooms
Prim.with U.P.&Sec/H.SUpper Primary onlyU. Primary with Sec./H.S.
Basic Data, 2001
Data reported from
153,141 165,517 166,182 168,26728,15822,52819,29512,326
58.8
0.93
## #
91,629 1,597 1,235
0
0 0 0
1 - 5 6 - 7
98.7 18.399.0 18.366.4 12.677.5 16.8
Elementary Education: Report Card - KORAPUT
Ori
ssa
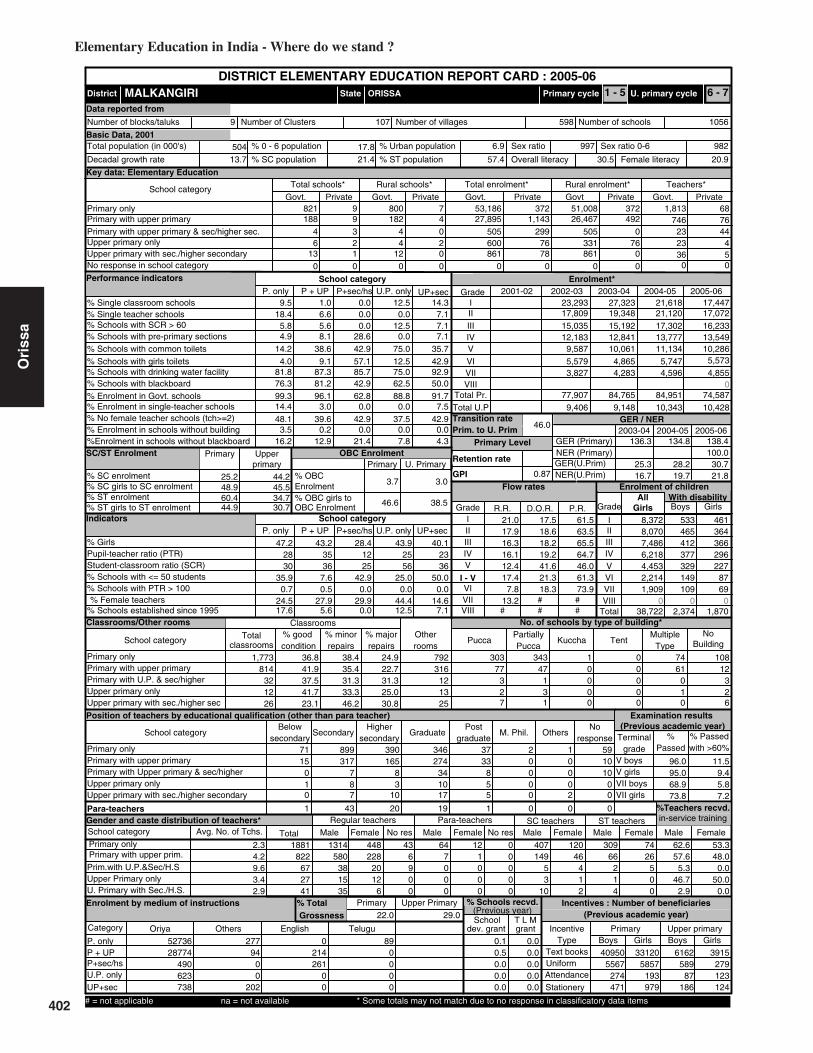
402
Elementary Education in India - Where do we stand ?
Ori
ssa
25.2 44.2
Key data: Elementary Education
504
MALKANGIRI
(Previous academic year)
(Previous year)
Gender and caste distribution of teachers*
No. of schools by type of building*
BoysWith disability
Flow rates
Primary Level
Enrolment*
Number of schools
Grade
GER / NER
School category
Primary Upper primaryBoys Boys GirlsGirls
IncentiveType
School categoryMultiple
TypeKuccha
PartiallyPucca
PuccaTotal % good condition
Otherrooms
TentNo
Building
Classrooms
Belowsecondary
Highersecondary
Postgraduate
M. Phil.GraduateSecondarySchool category OthersNo
response
ST teachers
Total Male Female No res Male Female No res Male Female Male FemaleSC teachers
Text booksUniformAttendanceStationery
% Passed
Avg. No. of Tchs.
%
Female literacyOverall literacy
dev. grant grantSchool T L M
Male Female
IVV
IIIIII
Grade R.R. D.O.R. P.R.
VIIVI
# #
I - V
Enrolment by medium of instructions
Examination results
Retention rate
GPI
Primary cycle U. primary cycleState
DISTRICT ELEMENTARY EDUCATION REPORT CARD : 2005-06
GirlsGrade
IIIIIIIVVVI
VIII
AllGirls
Total
VII
% TotalGrossness
School category
18846
13
9 1823 421
412
0 0 0
821 94 27,8950 5052 6000 8610 0
800 7 51,008 3721,143 26,467 492
299 505 076 331 76
0 0 078 861 0
53,186 372 1,813746
6876
P + UP P+sec/hs U.P. only UP+sec
School categoryP. only
9.5 1.0 0.0 12.5 14.318.4
Number of Clusters 1056598
% Schools with SCR > 606.6 0.0 0.0 7.1
5.8 5.6 0.0 12.5 7.1% Schools with pre-primary sections 4.9 8.1 28.6 0.0 7.1% Schools with common toilets 14.2 38.6 42.9 75.0 35.7
% Schools with girls toilets 4.0 9.1 57.1 12.5 42.9% Schools with drinking water facility 81.8 87.3 85.7 75.0 92.9
% Enrolment in Govt. schools 99.3 96.1 62.8 88.8 91.776.3 81.2 42.9 62.5 50.0
% No female teacher schools (tch>=2) 48.1 39.6 42.9 37.5 42.914.4 3.0 0.0 0.0 7.5
3.5 0.2 0.0 0.0 0.0%Enrolment in schools without blackboard 16.2 12.9 21.4 7.8 4.3
2001-02 2002-03 2003-04 2004-05 2005-06IIIIIIIVV
VIVII
Total U.P
17,44717,07216,23313,54910,286
5,573
4,855
21,61821,12017,30213,77711,134
5,7474,596
27,32319,34815,19212,84110,061
4,8654,283
23,29317,80915,03512,183
9,587
5,5793,827
136.3
25.3
134.8
28.2
138.4
30.7
28.4
42.90.0
8,3728,0707,4866,2184,4532,2141,909
533465412377329149109
461364366296227
8769
1,773
classrooms
814321226
36.841.937.541.723.1
38.435.4
24.9
31.333.346.2
22.731.325.030.8
316121325
792 303 343 1 0 74 10877 47 0 0 61 12
3 1 0 0 0 32 3 0 0 1 27 1 0 0 0 6
71 899 390 346 37 2 115 317 165 274 33 0 0 10
0 7 8 34 8 0 0 101 8 3 10 5 0 0 00 7 10 17 5 0 2 0
1 43 20 19 1 0 0 0
1314580
381535
2282012
6
448 43 64 12 0 407 120 309 746900
7000
1000
0000
14953
10
46412
66214
26500
Terminalgrade Passed
VII boysV girlsV boys
VII girls
59 with >60%
62.61881822
672741
57.65.3
46.72.9
53.348.0
0.050.0
0.0
52736Oriya Others English Telugu
28774490623738
27794
00
202
0214261
00
890000
% Schools recvd.
0.10.50.00.00.0
0.00.00.00.00.0
409505567
274471
6162589
87186
331205857
193979
3915279123124
2.34.29.63.42.9
21.017.916.316.1
7.813.2
12.417.4
2005-062004-052003-04
ORISSA
29.9
Upper PrimaryPrimary
Sex ratio Sex ratio 0-6
9 107
VIII0.0
Enrolment of children
VIIITotal Pr.
23 436 5
0 0
23 44
%Teachers recvd.in-service training
Total schools* Rural schools* Total enrolment* Rural enrolment* Teachers*
22.0 29.0
100.0
21.816.7 19.7% SC enrolment% SC girls to SC enrolment% ST enrolment
48.9 45.560.444.9 30.7
3.7
46.6
3.0
38.5
Position of teachers by educational qualification (other than para teacher)
(Previous academic year)Incentives : Number of beneficiaries
% ST girls to ST enrolment
% Girls
Number of villages
% 0 - 6 population
% SC population % ST population
% Urban population
% Schools with blackboard
% Enrolment in single-teacher schools
% Enrolment in schools without building
Primary Upperprimary
OBC EnrolmentPrimary U. Primary
% OBCEnrolment% OBC girls toOBC Enrolment
Pupil-teacher ratio (PTR)Student-classroom ratio (SCR)% Schools with <= 50 students% Schools with PTR > 100% Female teachers
% Schools established since 1995
Regular teachers Para-teachers
% minorrepairs
% majorrepairs
# = not applicable na = not available * Some totals may not match due to no response in classificatory data items
17.5 61.518.6 63.518.2 65.519.2 64.741.6 46.021.3 61.318.3 73.9
2512
47.22830
35.90.7
24.517.6
43.23536
7.60.5
27.95.6
43.92556
25.00.0
44.412.5
40.12336
50.00.0
14.67.1
13.7 21.4 57.4 30.5 20.9
9829976.917.8
Category
PrivateGovt.PrivateGovtPrivateGovt.PrivateGovt.PrivateGovt.
Total population (in 000's)
Number of blocks/taluks
District
Decadal growth rate
Primary onlyPrimary with upper primaryPrimary with upper primary & sec/higher sec.Upper primary onlyUpper primary with sec./higher secondary
% Single classroom schools% Single teacher schools
P + UP P+sec/hs U.P. only UP+secP. only
No response in school category
Primary with upper primaryPrimary with U.P. & sec/higherUpper primary onlyUpper primary with sec./higher sec
Primary only
Primary onlyPrimary with upper primaryPrimary with Upper primary & sec/higherUpper primary only
Para-teachers
School category
Upper primary with sec./higher secondary
Primary onlyPrimary with upper prim.
P. onlyP + UPP+sec/hsU.P. onlyUP+sec
NER(U.Prim)GER(U.Prim)NER (Primary)GER (Primary)
Transition ratePrim. to U. Prim
34.7
Performance indicators
SC/ST Enrolment
Indicators
Classrooms/Other rooms
Prim.with U.P.&Sec/H.SUpper Primary onlyU. Primary with Sec./H.S.
Basic Data, 2001
Data reported from
77,907 84,765 84,951 74,58710,42810,3439,1489,406
46.0
0.87
## #
38,722 2,374 1,870
0
0 0 0
1 - 5 6 - 7
96.0 11.595.0 9.468.9 5.873.8 7.2

403
7.8 8.4
Key data: Elementary Education
2223
MAYURBHANJ
(Previous academic year)
(Previous year)
Gender and caste distribution of teachers*
No. of schools by type of building*
BoysWith disability
Flow rates
Primary Level
Enrolment*
Number of schools
Grade
GER / NER
School category
Primary Upper primaryBoys Boys GirlsGirls
IncentiveType
School categoryMultiple
TypeKuccha
PartiallyPucca
PuccaTotal % good condition
Otherrooms
TentNo
Building
Classrooms
Belowsecondary
Highersecondary
Postgraduate
M. Phil.GraduateSecondarySchool category OthersNo
response
ST teachers
Total Male Female No res Male Female No res Male Female Male FemaleSC teachers
Text booksUniformAttendanceStationery
% Passed
Avg. No. of Tchs.
%
Female literacyOverall literacy
dev. grant grantSchool T L M
Male Female
IVV
IIIIII
Grade R.R. D.O.R. P.R.
VIIVI
# #
I - V
Enrolment by medium of instructions
Examination results
Retention rate
GPI
Primary cycle U. primary cycleState
DISTRICT ELEMENTARY EDUCATION REPORT CARD : 2005-06
GirlsGrade
IIIIIIIVVVI
VIII
AllGirls
Total
VII
% TotalGrossness
School category
67321
22321
9 6550 19
440
21716
26 0 3
2,465 39 116,3170 3,351
44 18,4160 2,1430 727
2,414 3 197,454 2782,010 112,767 2,010
0 2,994 02,686 17,795 2,686
0 0 00 1,210 0
201,717 278 6,3973,387
2373
P + UP P+sec/hs U.P. only UP+sec
School categoryP. only
7.0 1.6 0.0 7.5 4.815.1
Number of Clusters 34852798
% Schools with SCR > 601.6 0.0 1.1 23.8
5.3 8.2 4.8 12.4 4.8% Schools with pre-primary sections 11.3 13.3 28.6 12.0 0.0% Schools with common toilets 17.1 30.5 19.0 22.1 38.1
% Schools with girls toilets 3.6 8.7 14.3 5.6 28.6% Schools with drinking water facility 84.3 89.4 81.0 76.0 90.5
% Enrolment in Govt. schools 99.9 98.3 100.0 87.3 100.083.2 87.0 95.2 80.1 81.0
% No female teacher schools (tch>=2) 34.0 29.2 14.3 66.3 42.99.9 0.8 0.0 0.4 6.4
1.1 0.1 0.0 0.4 0.0%Enrolment in schools without blackboard 14.2 10.8 6.7 15.6 4.6
2001-02 2002-03 2003-04 2004-05 2005-06IIIIIIIVV
VIVII
Total U.P
81,82355,33456,19348,71444,03733,151
28,393
78,23963,22753,21546,77339,325
30,92627,523
103,08961,50151,51841,89835,470
28,39525,799
87,98848,38237,06230,95528,747
21,10519,649
106.2
33.7
99.8
35.7
120.4
41.1
47.9
9.54.8
38,56825,84726,54422,61820,11315,05212,789
920554516444379280271
772500402363306212220
6,682
classrooms
3,307112583131
39.336.428.629.528.0
32.234.5
28.5
49.531.429.3
29.121.939.042.7
1,62448
50743
3,612 750 189 32 4 1,267 221125 32 5 0 475 45
5 1 0 0 14 166 47 20 0 106 27
6 6 1 0 5 3
168 2,546 1,172 1,441 173 1 243 940 568 1,249 170 1 1 106
3 28 26 39 11 0 0 16 168 97 311 44 0 0 380 6 6 28 7 0 1 67
8 227 347 501 89 1 1 0
35311984
51522
35
101556
11313
2023 144 392 323 7 569 259 1017 38979
12967
2182
481
1635
170
1000
2208
200
951015
0
3827
662
1671510
0
Terminalgrade Passed
VII boysV girlsV boys
VII girls
195 with >60%
29.564203460
115729116
31.620.828.2
5.6
27.424.416.426.9
0.0
196335Oriya Others English Bodo Hindi
1119583064
186732072
885763
13163
0
196202
000
2880000
2035
0106
0
% Schools recvd.
0.20.00.00.40.0
0.00.00.00.00.0
1343141448
182500
32997104
6778
1155234297
133431
27645271
5680
2.65.15.52.75.5
20.87.35.03.8
3.84.5
2.99.4
2005-062004-052003-04
ORISSA
53.0
Upper PrimaryPrimary
Sex ratio Sex ratio 0-6
30 409
VIII0.0
Enrolment of children
VIIITotal Pr.
632 97116 0
32 0
115 0
%Teachers recvd.in-service training
Total schools* Rural schools* Total enrolment* Rural enrolment* Teachers*
23.2 35.4
92.5
26.5
78.5 80.0
22.8 22.9% SC enrolment% SC girls to SC enrolment% ST enrolment
47.8 46.564.045.6 42.3
21.6
49.2
26.8
48.9
Position of teachers by educational qualification (other than para teacher)
(Previous academic year)Incentives : Number of beneficiaries
% ST girls to ST enrolment
% Girls
Number of villages
% 0 - 6 population
% SC population % ST population
% Urban population
% Schools with blackboard
% Enrolment in single-teacher schools
% Enrolment in schools without building
Primary Upperprimary
OBC EnrolmentPrimary U. Primary
% OBCEnrolment% OBC girls toOBC Enrolment
Pupil-teacher ratio (PTR)Student-classroom ratio (SCR)% Schools with <= 50 students% Schools with PTR > 100% Female teachers
% Schools established since 1995
Regular teachers Para-teachers
% minorrepairs
% majorrepairs
# = not applicable na = not available * Some totals may not match due to no response in classificatory data items
14.4 64.88.0 84.76.8 88.24.5 91.7
15.8 81.310.1 80.5
8.4 87.8
3029
47.23130
25.00.7
36.510.0
45.53436
4.30.4
34.01.3
44.62936
28.10.0
17.83.0
48.11816
33.30.0
11.24.8
17.9 7.7 56.6 51.9 37.8
9569807.016.4
Category
PrivateGovt.PrivateGovtPrivateGovt.PrivateGovt.PrivateGovt.
Total population (in 000's)
Number of blocks/taluks
District
Decadal growth rate
Primary onlyPrimary with upper primaryPrimary with upper primary & sec/higher sec.Upper primary onlyUpper primary with sec./higher secondary
% Single classroom schools% Single teacher schools
P + UP P+sec/hs U.P. only UP+secP. only
No response in school category
Primary with upper primaryPrimary with U.P. & sec/higherUpper primary onlyUpper primary with sec./higher sec
Primary only
Primary onlyPrimary with upper primaryPrimary with Upper primary & sec/higherUpper primary only
Para-teachers
School category
Upper primary with sec./higher secondary
Primary onlyPrimary with upper prim.
P. onlyP + UPP+sec/hsU.P. onlyUP+sec
NER(U.Prim)GER(U.Prim)NER (Primary)GER (Primary)
Transition ratePrim. to U. Prim
51.7
Performance indicators
SC/ST Enrolment
Indicators
Classrooms/Other rooms
Prim.with U.P.&Sec/H.SUpper Primary onlyU. Primary with Sec./H.S.
Basic Data, 2001
Data reported from
233,134 293,476 280,779 286,10161,54458,44954,19440,754
81.3
0.88
## #
161,531 3,364 2,775
0
0 0 0
1 - 5 6 - 7
99.3 33.899.3 28.998.0 18.297.5 17.6
Elementary Education: Report Card - MAYURBHANJ
Ori
ssa

404
Elementary Education in India - Where do we stand ?
Ori
ssa
17.5 26.7
Key data: Elementary Education
1026
NAWARANGAPUR
(Previous academic year)
(Previous year)
Gender and caste distribution of teachers*
No. of schools by type of building*
BoysWith disability
Flow rates
Primary Level
Enrolment*
Number of schools
Grade
GER / NER
School category
Primary Upper primaryBoys Boys GirlsGirls
IncentiveType
School categoryMultiple
TypeKuccha
PartiallyPucca
PuccaTotal % good condition
Otherrooms
TentNo
Building
Classrooms
Belowsecondary
Highersecondary
Postgraduate
M. Phil.GraduateSecondarySchool category OthersNo
response
ST teachers
Total Male Female No res Male Female No res Male Female Male FemaleSC teachers
Text booksUniformAttendanceStationery
% Passed
Avg. No. of Tchs.
%
Female literacyOverall literacy
dev. grant grantSchool T L M
Male Female
IVV
IIIIII
Grade R.R. D.O.R. P.R.
VIIVI
# #
I - V
Enrolment by medium of instructions
Examination results
Retention rate
GPI
Primary cycle U. primary cycleState
DISTRICT ELEMENTARY EDUCATION REPORT CARD : 2005-06
GirlsGrade
IIIIIIIVVVI
VIII
AllGirls
Total
VII
% TotalGrossness
School category
2916
2921
9 2783 620
2817
4 0 1
1,001 214 59,4941 1,6052 3,1150 2,3390 317
965 17 91,087 9631,271 56,505 528
609 1,605 178224 2,933 224
0 0 00 1,980 0
94,711 995 2,4251,437
9396
P + UP P+sec/hs U.P. only UP+sec
School categoryP. only
7.0 1.0 11.1 0.0 4.89.8
Number of Clusters 1387824
% Schools with SCR > 601.0 0.0 0.0 14.3
10.0 19.3 44.4 25.8 19.0% Schools with pre-primary sections 3.4 6.3 33.3 0.0 0.0% Schools with common toilets 15.7 42.3 33.3 25.8 28.6
% Schools with girls toilets 4.2 14.3 55.6 6.5 47.6% Schools with drinking water facility 85.8 89.7 100.0 77.4 100.0
% Enrolment in Govt. schools 99.0 97.9 72.5 93.3 100.092.6 95.3 100.0 96.8 81.0
% No female teacher schools (tch>=2) 53.0 37.3 44.4 29.0 38.16.8 0.9 0.0 0.0 11.9
0.3 0.4 0.0 0.0 0.0%Enrolment in schools without blackboard 5.2 2.6 0.0 2.6 12.5
2001-02 2002-03 2003-04 2004-05 2005-06IIIIIIIVV
VIVII
Total U.P
35,42229,03329,48626,81220,74812,516
10,663
31,61933,80728,35324,35519,229
9,9418,927
43,18732,87828,48122,78616,270
8,5798,878
37,59132,55526,61918,79214,272
13,4377,448
112.1
23.4
105.1
24.8
129.1
33.5
29.7
0.00.0
17,79314,27314,47612,300
9,3714,9783,939
327271292286210
9492
279232261172127
5945
2,748
classrooms
1,454466670
53.655.247.842.958.6
31.728.1
14.7
26.141.331.4
16.726.115.910.0
635346349
1,468 403 280 10 0 304 2599 35 0 0 158 8
2 3 1 0 3 014 5 0 0 11 112 5 0 0 1 3
210 1,054 377 479 53 1 058 568 279 465 64 1 0 7
2 7 9 27 9 0 1 10 35 24 29 5 3 0 10 25 14 42 4 0 1 0
1 180 103 120 9 0 0 0
1583993
406859
443162827
596 25 276 38 0 377 121 570 976010
76251
15011
0000
199697
78120
2517
123
62064
Terminalgrade Passed
VII boysV girlsV boys
VII girls
30 with >60%
50.525181533
58103
88
41.826.234.215.0
45.929.5
6.341.4
7.1
95017Oriya Others English Bodo Hindi
60308179233182055
55030
136122
0129414
00
1100000
0000
77
% Schools recvd.
0.00.30.00.00.0
0.00.00.00.00.0
664163667
195494
13440401114155
6049112497
2851075
8727916
43224
2.55.16.43.34.2
20.716.115.413.3
10.119.8
10.015.7
2005-062004-052003-04
ORISSA
27.6
Upper PrimaryPrimary
Sex ratio Sex ratio 0-6
10 144
VIII11.1
Enrolment of children
VIIITotal Pr.
99 488 0
8 0
27 31
%Teachers recvd.in-service training
Total schools* Rural schools* Total enrolment* Rural enrolment* Teachers*
22.8 30.2
99.6
23.4
85.7 84.3
17.3 17.5% SC enrolment% SC girls to SC enrolment% ST enrolment
48.8 43.557.447.8 34.6
12.8
48.4
10.5
36.7
Position of teachers by educational qualification (other than para teacher)
(Previous academic year)Incentives : Number of beneficiaries
% ST girls to ST enrolment
% Girls
Number of villages
% 0 - 6 population
% SC population % ST population
% Urban population
% Schools with blackboard
% Enrolment in single-teacher schools
% Enrolment in schools without building
Primary Upperprimary
OBC EnrolmentPrimary U. Primary
% OBCEnrolment% OBC girls toOBC Enrolment
Pupil-teacher ratio (PTR)Student-classroom ratio (SCR)% Schools with <= 50 students% Schools with PTR > 100% Female teachers
% Schools established since 1995
Regular teachers Para-teachers
% minorrepairs
% majorrepairs
# = not applicable na = not available * Some totals may not match due to no response in classificatory data items
4.8 74.69.5 74.31.5 83.19.4 77.3
30.1 59.99.6 74.70.5 89.4
4838
48.63835
17.31.4
25.213.4
45.64042
3.71.7
29.93.3
39.93251
9.70.0
28.29.7
33.52733
14.34.8
31.814.3
20.3 14.1 55.0 33.9 20.7
9999915.818.2
Category
PrivateGovt.PrivateGovtPrivateGovt.PrivateGovt.PrivateGovt.
Total population (in 000's)
Number of blocks/taluks
District
Decadal growth rate
Primary onlyPrimary with upper primaryPrimary with upper primary & sec/higher sec.Upper primary onlyUpper primary with sec./higher secondary
% Single classroom schools% Single teacher schools
P + UP P+sec/hs U.P. only UP+secP. only
No response in school category
Primary with upper primaryPrimary with U.P. & sec/higherUpper primary onlyUpper primary with sec./higher sec
Primary only
Primary onlyPrimary with upper primaryPrimary with Upper primary & sec/higherUpper primary only
Para-teachers
School category
Upper primary with sec./higher secondary
Primary onlyPrimary with upper prim.
P. onlyP + UPP+sec/hsU.P. onlyUP+sec
NER(U.Prim)GER(U.Prim)NER (Primary)GER (Primary)
Transition ratePrim. to U. Prim
43.6
Performance indicators
SC/ST Enrolment
Indicators
Classrooms/Other rooms
Prim.with U.P.&Sec/H.SUpper Primary onlyU. Primary with Sec./H.S.
Basic Data, 2001
Data reported from
129,829 143,602 137,363 141,50123,17918,86817,45720,885
59.9
0.93
## #
77,130 1,572 1,175
0
0 0 0
1 - 5 6 - 7
98.4 10.698.8 9.971.5 4.069.8 5.2

405
16.7 13.0
Key data: Elementary Education
865
NAYAGARH
(Previous academic year)
(Previous year)
Gender and caste distribution of teachers*
No. of schools by type of building*
BoysWith disability
Flow rates
Primary Level
Enrolment*
Number of schools
Grade
GER / NER
School category
Primary Upper primaryBoys Boys GirlsGirls
IncentiveType
School categoryMultiple
TypeKuccha
PartiallyPucca
PuccaTotal % good condition
Otherrooms
TentNo
Building
Classrooms
Belowsecondary
Highersecondary
Postgraduate
M. Phil.GraduateSecondarySchool category OthersNo
response
ST teachers
Total Male Female No res Male Female No res Male Female Male FemaleSC teachers
Text booksUniformAttendanceStationery
% Passed
Avg. No. of Tchs.
%
Female literacyOverall literacy
dev. grant grantSchool T L M
Male Female
IVV
IIIIII
Grade R.R. D.O.R. P.R.
VIIVI
# #
I - V
Enrolment by medium of instructions
Examination results
Retention rate
GPI
Primary cycle U. primary cycleState
DISTRICT ELEMENTARY EDUCATION REPORT CARD : 2005-06
GirlsGrade
IIIIIIIVVVI
VIII
AllGirls
Total
VII
% TotalGrossness
School category
2604
7015
14 2553 4
332
6811
11 0 2
638 3212 53,024
1 61533 6,793
1 1,5560 82
625 25 53,118 1,5621,650 52,209 1,364
585 615 02,033 6,696 2,033
0 82 0117 1,008 62
54,783 2,074 1,7991,461
190142
P + UP P+sec/hs U.P. only UP+sec
School categoryP. only
6.1 0.4 0.0 1.0 0.012.2
Number of Clusters 1082855
% Schools with SCR > 600.4 0.0 6.8 5.9
3.0 9.5 0.0 12.6 11.8% Schools with pre-primary sections 3.3 2.9 28.6 1.0 0.0% Schools with common toilets 30.9 48.9 57.1 37.9 29.4
% Schools with girls toilets 12.2 21.9 57.1 13.6 17.6% Schools with drinking water facility 86.4 94.9 85.7 80.6 82.4
% Enrolment in Govt. schools 96.4 97.0 51.3 77.0 93.085.8 91.2 71.4 90.3 76.5
% No female teacher schools (tch>=2) 48.2 39.8 28.6 67.0 29.45.6 0.1 0.0 3.3 0.0
1.6 0.0 0.0 0.7 0.0%Enrolment in schools without blackboard 5.3 2.1 0.0 3.0 11.3
2001-02 2002-03 2003-04 2004-05 2005-06IIIIIIIVV
VIVII
Total U.P
18,90218,37219,77119,64918,33214,832
13,454
21,34822,28621,64319,95517,835
14,83413,456
26,05024,05421,69819,18217,475
14,42813,544
24,24920,18617,88716,71214,967
14,28810,584
102.4
45.4
96.3
45.4
102.9
48.6
38.5
28.60.0
8,9628,7599,4639,5228,6727,0016,339
194156177162142123
88
124129128103
907746
1,886
classrooms
1,40535
22650
40.839.268.641.518.0
36.233.8
23.0
17.130.452.0
26.914.328.130.0
55415
13624
771 196 174 9 0 210 8044 46 6 0 159 19
5 0 0 0 0 243 34 1 0 18 7
5 4 1 0 4 3
25 613 306 527 74 3 14 337 221 494 85 2 1 180 6 4 20 2 0 0 90 35 42 150 20 0 0 11 3 9 26 12 0 0 6
4 155 243 422 66 4 0 0
1112877
23222
31
2669
2521
438 14 295 126 4 208 43 157 4619
915
2771
122
1634
161
1000
109161
47131
87020
27020
Terminalgrade Passed
VII boysV girlsV boys
VII girls
15 with >60%
44.119891603
46276
60
50.425.034.2
9.1
42.245.2
7.734.131.8
56612Oriya Others English Bodo Urdu
53441107785561673
332538
0270
0
0531123
00
0137
000
630000
% Schools recvd.
0.10.70.00.05.9
0.00.00.00.00.0
48524318
49319
14461606060
44787300112230
132451
161
3.05.96.62.73.5
15.58.25.83.9
3.23.8
3.67.6
2005-062004-052003-04
ORISSA
28.3
Upper PrimaryPrimary
Sex ratio Sex ratio 0-6
10 130
VIII14.3
Enrolment of children
VIIITotal Pr.
215 6156 4
4 0
19 27
%Teachers recvd.in-service training
Total schools* Rural schools* Total enrolment* Rural enrolment* Teachers*
17.9 41.0
84.5
28.6
81.2 78.8
29.6 28.5% SC enrolment% SC girls to SC enrolment% ST enrolment
47.2 45.56.8
46.1 37.2
60.3
48.2
66.2
48.3
Position of teachers by educational qualification (other than para teacher)
(Previous academic year)Incentives : Number of beneficiaries
% ST girls to ST enrolment
% Girls
Number of villages
% 0 - 6 population
% SC population % ST population
% Urban population
% Schools with blackboard
% Enrolment in single-teacher schools
% Enrolment in schools without building
Primary Upperprimary
OBC EnrolmentPrimary U. Primary
% OBCEnrolment% OBC girls toOBC Enrolment
Pupil-teacher ratio (PTR)Student-classroom ratio (SCR)% Schools with <= 50 students% Schools with PTR > 100% Female teachers
% Schools established since 1995
Regular teachers Para-teachers
% minorrepairs
% majorrepairs
# = not applicable na = not available * Some totals may not match due to no response in classificatory data items
6.9 77.58.8 83.17.0 87.27.4 88.6
15.9 80.59.0 83.49.6 87.2
3426
48.22930
34.00.4
28.416.1
47.13439
8.40.0
26.88.0
48.23239
19.40.0
14.912.6
46.82833
17.60.0
36.70.0
10.4 14.0 5.9 70.5 57.6
9049384.313.1
Category
PrivateGovt.PrivateGovtPrivateGovt.PrivateGovt.PrivateGovt.
Total population (in 000's)
Number of blocks/taluks
District
Decadal growth rate
Primary onlyPrimary with upper primaryPrimary with upper primary & sec/higher sec.Upper primary onlyUpper primary with sec./higher secondary
% Single classroom schools% Single teacher schools
P + UP P+sec/hs U.P. only UP+secP. only
No response in school category
Primary with upper primaryPrimary with U.P. & sec/higherUpper primary onlyUpper primary with sec./higher sec
Primary only
Primary onlyPrimary with upper primaryPrimary with Upper primary & sec/higherUpper primary only
Para-teachers
School category
Upper primary with sec./higher secondary
Primary onlyPrimary with upper prim.
P. onlyP + UPP+sec/hsU.P. onlyUP+sec
NER(U.Prim)GER(U.Prim)NER (Primary)GER (Primary)
Transition ratePrim. to U. Prim
3.6
Performance indicators
SC/ST Enrolment
Indicators
Classrooms/Other rooms
Prim.with U.P.&Sec/H.SUpper Primary onlyU. Primary with Sec./H.S.
Basic Data, 2001
Data reported from
94,001 108,459 103,067 95,02628,28628,29027,97224,872
80.5
0.91
## #
58,718 1,042 697
0
0 0 0
1 - 5 6 - 7
98.8 21.698.5 17.696.7 14.396.7 11.8
Elementary Education: Report Card - NAYAGARH
Ori
ssa

406
Elementary Education in India - Where do we stand ?
Ori
ssa
15.6 17.7
Key data: Elementary Education
531
NUAPADA
(Previous academic year)
(Previous year)
Gender and caste distribution of teachers*
No. of schools by type of building*
BoysWith disability
Flow rates
Primary Level
Enrolment*
Number of schools
Grade
GER / NER
School category
Primary Upper primaryBoys Boys GirlsGirls
IncentiveType
School categoryMultiple
TypeKuccha
PartiallyPucca
PuccaTotal % good condition
Otherrooms
TentNo
Building
Classrooms
Belowsecondary
Highersecondary
Postgraduate
M. Phil.GraduateSecondarySchool category OthersNo
response
ST teachers
Total Male Female No res Male Female No res Male Female Male FemaleSC teachers
Text booksUniformAttendanceStationery
% Passed
Avg. No. of Tchs.
%
Female literacyOverall literacy
dev. grant grantSchool T L M
Male Female
IVV
IIIIII
Grade R.R. D.O.R. P.R.
VIIVI
# #
I - V
Enrolment by medium of instructions
Examination results
Retention rate
GPI
Primary cycle U. primary cycleState
DISTRICT ELEMENTARY EDUCATION REPORT CARD : 2005-06
GirlsGrade
IIIIIIIVVVI
VIII
AllGirls
Total
VII
% TotalGrossness
School category
2112
4611
0 1981 1
340
438
0 0 0
625 10 36,5861 519
34 2,4970 1,3320 0
599 1 49,456 00 34,094 00 123 0
1,485 2,156 1,485
0 0 00 1,004 0
52,103 0 1,8421,053
30
P + UP P+sec/hs U.P. only UP+sec
School categoryP. only
5.4 0.9 0.0 5.0 0.07.7
Number of Clusters 931606
% Schools with SCR > 600.9 0.0 2.5 9.1
4.5 8.5 0.0 5.0 9.1% Schools with pre-primary sections 0.5 0.9 0.0 0.0 0.0% Schools with common toilets 16.6 45.5 66.7 27.5 54.5
% Schools with girls toilets 4.0 7.1 66.7 5.0 36.4% Schools with drinking water facility 89.0 92.9 100.0 75.0 100.0
% Enrolment in Govt. schools 100.0 100.0 100.0 62.7 100.096.5 100.0 66.7 75.0 100.0
% No female teacher schools (tch>=2) 56.9 60.2 33.3 83.8 72.74.8 0.6 0.0 1.0 11.2
0.0 0.0 0.0 0.0 0.0%Enrolment in schools without blackboard 0.0 0.0 0.0 0.0 0.0
2001-02 2002-03 2003-04 2004-05 2005-06IIIIIIIVV
VIVII
Total U.P
20,72717,00316,00714,17211,690
8,288
6,635
20,66718,22016,18312,93711,404
7,1136,164
23,54918,72415,09612,28310,149
5,9955,739
15,20610,680
8,1616,4705,663
3,4852,731
122.1
30.8
120.0
34.5
140.4
41.7
39.5
33.30.0
10,4758,7357,8696,7525,2823,5942,591
14697
10278654128
94906864482119
1,693
classrooms
1,04523
12555
56.860.773.960.872.7
30.929.9
12.3
17.424.010.9
9.58.7
15.216.4
3073
4122
489 321 90 19 0 174 2270 20 1 0 120 0
1 0 0 0 1 131 17 7 0 5 20
5 2 0 0 4 0
94 914 371 371 50 2 047 409 214 236 54 0 1 91
3 3 2 7 3 0 0 44 67 42 75 17 0 0 90 7 7 11 3 0 0 0
1 1 3 2 1 0 0 0
1360742
7190
24
2231316
4
445 33 7 0 0 212 77 372 4787
280
0000
1000
0000
95161
32140
1762
142
40550
Terminalgrade Passed
VII boysV girlsV boys
VII girls
36 with >60%
79.618451053
22214
28
84.60.0
56.341.7
76.075.9
0.081.350.0
51833Oriya English Hindi Others Bengali
36171123
39701332
045
39800
0290
000
19380
012
0
770000
% Schools recvd.
83.288.2
0.048.827.3
82.988.2
0.048.827.3
38513322
948
9527314829
373728677
26426
6919855
5638
2.95.07.32.72.5
25.811.3
9.37.3
4.41.7
5.813.2
2005-062004-052003-04
ORISSA
59.1
Upper PrimaryPrimary
Sex ratio Sex ratio 0-6
5 85
VIII0.0
Enrolment of children
VIIITotal Pr.
143 7128 0
0 0
12 10
%Teachers recvd.in-service training
Total schools* Rural schools* Total enrolment* Rural enrolment* Teachers*
20.9 29.7
100.0
29.4
94.4 94.3
21.7 25.4% SC enrolment% SC girls to SC enrolment% ST enrolment
48.2 43.135.950.1 39.0
44.2
49.1
46.4
40.9
Position of teachers by educational qualification (other than para teacher)
(Previous academic year)Incentives : Number of beneficiaries
% ST girls to ST enrolment
% Girls
Number of villages
% 0 - 6 population
% SC population % ST population
% Urban population
% Schools with blackboard
% Enrolment in single-teacher schools
% Enrolment in schools without building
Primary Upperprimary
OBC EnrolmentPrimary U. Primary
% OBCEnrolment% OBC girls toOBC Enrolment
Pupil-teacher ratio (PTR)Student-classroom ratio (SCR)% Schools with <= 50 students% Schools with PTR > 100% Female teachers
% Schools established since 1995
Regular teachers Para-teachers
% minorrepairs
% majorrepairs
# = not applicable na = not available * Some totals may not match due to no response in classificatory data items
1.9 72.39.1 79.69.0 81.77.4 85.3
24.3 69.99.1 77.73.8 91.8
2324
50.12831
26.80.3
24.115.3
45.93535
3.80.9
21.33.8
39.01932
58.80.07.57.5
46.94824
0.09.1
14.30.0
13.0 13.6 34.7 42.0 25.8
96910075.715.9
Category
PrivateGovt.PrivateGovtPrivateGovt.PrivateGovt.PrivateGovt.
Total population (in 000's)
Number of blocks/taluks
District
Decadal growth rate
Primary onlyPrimary with upper primaryPrimary with upper primary & sec/higher sec.Upper primary onlyUpper primary with sec./higher secondary
% Single classroom schools% Single teacher schools
P + UP P+sec/hs U.P. only UP+secP. only
No response in school category
Primary with upper primaryPrimary with U.P. & sec/higherUpper primary onlyUpper primary with sec./higher sec
Primary only
Primary onlyPrimary with upper primaryPrimary with Upper primary & sec/higherUpper primary only
Para-teachers
School category
Upper primary with sec./higher secondary
Primary onlyPrimary with upper prim.
P. onlyP + UPP+sec/hsU.P. onlyUP+sec
NER(U.Prim)GER(U.Prim)NER (Primary)GER (Primary)
Transition ratePrim. to U. Prim
29.2
Performance indicators
SC/ST Enrolment
Indicators
Classrooms/Other rooms
Prim.with U.P.&Sec/H.SUpper Primary onlyU. Primary with Sec./H.S.
Basic Data, 2001
Data reported from
46,180 79,801 79,411 79,59914,92313,27711,7346,216
69.9
0.97
## #
45,298 557 404
0
0 0 0
1 - 5 6 - 7
97.7 14.198.4 13.895.6 9.197.1 8.4

407
0.4900.464
23.5 19.7
Key data: Elementary Education
1503
PURI
(Previous academic year)
(Previous year)
Gender and caste distribution of teachers*
No. of schools by type of building*
BoysWith disability
Flow rates
Primary Level
Enrolment*
Number of schools
Grade
GER / NER
School category
Primary Upper primaryBoys Boys GirlsGirls
IncentiveType
School categoryMultiple
TypeKuccha
PartiallyPucca
PuccaTotal % good condition
Otherrooms
TentNo
Building
Classrooms
Belowsecondary
Highersecondary
Postgraduate
M. Phil.GraduateSecondarySchool category OthersNo
response
ST teachers
Total Male Female No res Male Female No res Male Female Male FemaleSC teachers
Text booksUniformAttendanceStationery
% Passed
Avg. No. of Tchs.
%
Female literacyOverall literacy
dev. grant grantSchool T L M
Male Female
IVV
IIIIII
Grade R.R. D.O.R. P.R.
VIIVI
# #
I - V
Enrolment by medium of instructions
Examination results
Retention rate
GPI
Primary cycle U. primary cycleState
DISTRICT ELEMENTARY EDUCATION REPORT CARD : 2005-06
GirlsGrade
IIIIIIIVVVI
VIII
AllGirls
Total
VII
% TotalGrossness
School category
4254
14436
26 4008 3
1000
13721
0 0 0
1,161 368 94,2200 1,179
97 13,5680 5,2350 0
1,095 23 96,932 1,0834,907 87,735 1,0253,026 682 06,963 12,760 6,714
0 0 00 2,385 0
107,580 2,038 2,9142,211
200276
P + UP P+sec/hs U.P. only UP+sec
School categoryP. only
11.0 0.0 0.0 4.1 0.013.9
Number of Clusters 19401354
% Schools with SCR > 600.0 0.0 7.0 13.9
11.6 18.4 0.0 10.2 11.1% Schools with pre-primary sections 8.1 9.3 8.3 0.0 0.0% Schools with common toilets 26.7 38.6 83.3 22.5 66.7
% Schools with girls toilets 12.3 15.3 91.7 11.5 52.8% Schools with drinking water facility 76.0 85.4 100.0 57.4 94.4
% Enrolment in Govt. schools 98.1 95.0 28.0 66.1 100.090.1 96.9 91.7 94.7 91.7
% No female teacher schools (tch>=2) 25.6 20.0 0.0 63.9 13.98.7 0.0 0.0 5.1 9.7
5.6 0.0 0.0 4.7 1.5%Enrolment in schools without blackboard 5.6 3.0 1.3 3.9 5.3
2001-02 2002-03 2003-04 2004-05 2005-06IIIIIIIVV
VIVII
Total U.P
34,92734,74837,63936,82435,17530,611
28,792
34,95638,47037,82535,56232,285
27,65026,322
41,73840,09838,12633,60231,109
25,59424,432
41,41439,06935,50030,94931,433
25,43024,099
99.4
46.3
95.0
49.2
111.7
58.7
42.7
0.00.0
16,58716,75618,29518,06417,27014,69913,673
326290282248224166132
209206193184133110106
3,082
classrooms
2,351154475204
35.934.682.523.832.8
40.239.8
23.8
13.638.945.6
25.63.9
37.321.6
78356
25995
1,167 323 342 25 0 381 12593 106 6 0 245 111 0 0 0 1 068 116 13 0 25 2214 12 3 0 6 1
95 875 665 1,242 221 11 026 469 440 1,205 339 5 0 3
3 2 10 84 39 1 1 12 70 111 310 47 0 0 00 9 14 90 37 2 1 0
0 0 0 0 0 0 0 0
15941392
62451
76
1095798977
1519 1 0 0 0 336 154 41 260000
0000
0000
0000
2072
197
103113
15160
12110
Terminalgrade Passed
VII boysV girlsV boys
VII girls
5 with >60%
54.331142487
141540153
41.78.1
40.813.2
42.831.1
2.534.8
7.8
108708Oriya English Others Telugu Urdu
975192371
204655235
545840
183400
150282
066
0
0370
000
215116
000
% Schools recvd.
80.181.216.748.847.2
77.481.416.748.447.2
85363146
48194
269540
1891
824071710
43160
24854952726
2.65.5
11.82.24.3
13.15.74.22.8
1.94.5
2.35.6
2005-062004-052003-04
ORISSA
56.0
Upper PrimaryPrimary
Sex ratio Sex ratio 0-6
11 191
VIII16.7
Enrolment of children
VIIITotal Pr.
344 196153 0
0 0
30 111
%Teachers recvd.in-service training
Total schools* Rural schools* Total enrolment* Rural enrolment* Teachers*
17.5 43.0
92.1
33.4
79.7 78.8
28.6 28.3% SC enrolment% SC girls to SC enrolment% ST enrolment
49.2 46.8
40.4 35.7
55.4
48.7
55.9
48.3
Position of teachers by educational qualification (other than para teacher)
(Previous academic year)Incentives : Number of beneficiaries
% ST girls to ST enrolment
% Girls
Number of villages
% 0 - 6 population
% SC population % ST population
% Urban population
% Schools with blackboard
% Enrolment in single-teacher schools
% Enrolment in schools without building
Primary Upperprimary
OBC EnrolmentPrimary U. Primary
% OBCEnrolment% OBC girls toOBC Enrolment
Pupil-teacher ratio (PTR)Student-classroom ratio (SCR)% Schools with <= 50 students% Schools with PTR > 100% Female teachers
% Schools established since 1995
Regular teachers Para-teachers
% minorrepairs
% majorrepairs
# = not applicable na = not available * Some totals may not match due to no response in classificatory data items
0.6 93.71.1 94.70.4 96.84.5 93.20.0 94.3
2730
48.83536
30.72.8
48.817.0
48.24042
0.41.3
44.05.1
48.73843
12.71.6
16.511.5
45.43426
13.95.6
50.32.8
14.8 18.2 0.3 78.0 67.6
93196813.612.5
Category
PrivateGovt.PrivateGovtPrivateGovt.PrivateGovt.PrivateGovt.
Total population (in 000's)
Number of blocks/taluks
District
Decadal growth rate
Primary onlyPrimary with upper primaryPrimary with upper primary & sec/higher sec.Upper primary onlyUpper primary with sec./higher secondary
% Single classroom schools% Single teacher schools
P + UP P+sec/hs U.P. only UP+secP. only
No response in school category
Primary with upper primaryPrimary with U.P. & sec/higherUpper primary onlyUpper primary with sec./higher sec
Primary only
Primary onlyPrimary with upper primaryPrimary with Upper primary & sec/higherUpper primary only
Para-teachers
School category
Upper primary with sec./higher secondary
Primary onlyPrimary with upper prim.
P. onlyP + UPP+sec/hsU.P. onlyUP+sec
NER(U.Prim)GER(U.Prim)NER (Primary)GER (Primary)
Transition ratePrim. to U. Prim
Performance indicators
SC/ST Enrolment
Indicators
Classrooms/Other rooms
Prim.with U.P.&Sec/H.SUpper Primary onlyU. Primary with Sec./H.S.
Basic Data, 2001
Data reported from
178,365 184,673 179,098 179,31359,40353,97250,02649,529
93.2
0.94
## #
115,344 1,668 1,141
0
0 0 0
1 - 5 6 - 7
98.6 27.399.1 27.394.0 10.294.8 10.4
Elementary Education: Report Card - PURI
Ori
ssa

408
Elementary Education in India - Where do we stand ?
Ori
ssa
18.7 21.9
Key data: Elementary Education
831
RAYAGADA
(Previous academic year)
(Previous year)
Gender and caste distribution of teachers*
No. of schools by type of building*
BoysWith disability
Flow rates
Primary Level
Enrolment*
Number of schools
Grade
GER / NER
School category
Primary Upper primaryBoys Boys GirlsGirls
IncentiveType
School categoryMultiple
TypeKuccha
PartiallyPucca
PuccaTotal % good condition
Otherrooms
TentNo
Building
Classrooms
Belowsecondary
Highersecondary
Postgraduate
M. Phil.GraduateSecondarySchool category OthersNo
response
ST teachers
Total Male Female No res Male Female No res Male Female Male FemaleSC teachers
Text booksUniformAttendanceStationery
% Passed
Avg. No. of Tchs.
%
Female literacyOverall literacy
dev. grant grantSchool T L M
Male Female
IVV
IIIIII
Grade R.R. D.O.R. P.R.
VIIVI
# #
I - V
Enrolment by medium of instructions
Examination results
Retention rate
GPI
Primary cycle U. primary cycleState
DISTRICT ELEMENTARY EDUCATION REPORT CARD : 2005-06
GirlsGrade
IIIIIIIVVVI
VIII
AllGirls
Total
VII
% TotalGrossness
School category
323102028
11 30810 10
44
2021
27 0 2
1,285 353 45,8276 1,6833 2,3764 3,6820 256
1,230 24 68,408 1,2031,469 40,240 3161,568 1,683 802
205 2,376 105
0 0 0496 2,375 496
73,805 1,775 2,8041,421
200115
P + UP P+sec/hs U.P. only UP+sec
School categoryP. only
19.8 3.9 0.0 4.2 6.320.1
Number of Clusters 17571494
% Schools with SCR > 601.2 0.0 0.0 9.4
4.9 12.0 0.0 16.7 12.5% Schools with pre-primary sections 2.3 3.3 35.0 0.0 0.0% Schools with common toilets 23.4 56.9 65.0 41.7 31.3
% Schools with girls toilets 11.0 21.6 70.0 29.2 37.5% Schools with drinking water facility 78.0 88.6 90.0 79.2 84.4
% Enrolment in Govt. schools 97.7 96.9 51.8 92.1 88.192.7 93.7 95.0 91.7 87.5
% No female teacher schools (tch>=2) 48.7 51.5 25.0 37.5 62.514.1 0.7 0.0 0.0 9.4
1.9 0.1 0.0 0.0 0.0%Enrolment in schools without blackboard 3.9 4.9 0.0 0.0 12.6
2001-02 2002-03 2003-04 2004-05 2005-06IIIIIIIVV
VIVII
Total U.P
25,54421,28723,43721,41620,72211,275
9,461
23,67722,64222,53322,58519,071
10,3737,914
23,75722,97624,53420,44618,029
8,8086,922
24,17825,14522,73020,11117,412
7,8836,641
27,83624,85827,11619,25715,334
7,5256,261
106.8
26.3
105.9
30.1
126.6
37.0
51.9
5.00.0
11,8189,924
11,10510,225
9,9774,4803,645
206215255224218134
85
192158179194172
8753
2,821
classrooms
1,391193
67175
49.052.679.842.258.4
36.330.4
14.7
17.134.429.2
17.03.1
23.412.4
526714290
1,079 504 452 9 0 279 75102 46 1 0 181 3
10 6 0 0 3 19 4 0 0 8 3
17 6 0 0 7 2
225 1,176 478 665 95 0 059 483 209 548 75 1 0 11
3 12 17 104 31 2 0 120 22 14 30 8 0 0 00 6 20 45 17 3 0 9
5 105 117 232 45 0 0 0
2012996
774775
383922716
637 8 257 90 0 307 60 480 1157
1209
99241
51032
0000
130934
34742
180426
5210
21
Terminalgrade Passed
VII boysV girlsV boys
VII girls
18 with >60%
11.630041536
18381
103
11.23.87.82.6
8.96.20.06.75.6
72953Oriya Telugu English Others Hindi
45493263924763608
756866
038
333
201421457
083
332129116
9075
171000
62
% Schools recvd.
0.20.30.00.00.0
0.00.00.00.00.0
523423311
1554895
12314858
8811
4865214171
1334642
85861671
2638
2.34.69.23.43.2
5.55.68.47.8
6.47.7
7.36.9
2005-062004-052003-04
ORISSA
50.3
Upper PrimaryPrimary
Sex ratio Sex ratio 0-6
11 207
VIII15.0
Enrolment of children
VIIITotal Pr.
72 980 2315 0
56 127
%Teachers recvd.in-service training
Total schools* Rural schools* Total enrolment* Rural enrolment* Teachers*
22.1 34.3
98.6
24.3
84.9 84.6
16.9 20.0% SC enrolment% SC girls to SC enrolment% ST enrolment
48.4 40.659.946.5 33.0
9.5
47.9
12.4
40.6
Position of teachers by educational qualification (other than para teacher)
(Previous academic year)Incentives : Number of beneficiaries
% ST girls to ST enrolment
% Girls
Number of villages
% 0 - 6 population
% SC population % ST population
% Urban population
% Schools with blackboard
% Enrolment in single-teacher schools
% Enrolment in schools without building
Primary Upperprimary
OBC EnrolmentPrimary U. Primary
% OBCEnrolment% OBC girls toOBC Enrolment
Pupil-teacher ratio (PTR)Student-classroom ratio (SCR)% Schools with <= 50 students% Schools with PTR > 100% Female teachers
% Schools established since 1995
Regular teachers Para-teachers
% minorrepairs
% majorrepairs
# = not applicable na = not available * Some totals may not match due to no response in classificatory data items
9.9 84.6
4.4 87.26.6 85.6
37.1 55.610.6 82.5
8.3 85.3
1718
48.82527
61.10.2
24.214.3
41.83134
6.60.0
28.32.4
41.93239
12.50.0
37.016.7
38.54124
9.412.517.515.6
15.3 13.9 55.8 36.1 24.6
981102813.917.5
Category
PrivateGovt.PrivateGovtPrivateGovt.PrivateGovt.PrivateGovt.
Total population (in 000's)
Number of blocks/taluks
District
Decadal growth rate
Primary onlyPrimary with upper primaryPrimary with upper primary & sec/higher sec.Upper primary onlyUpper primary with sec./higher secondary
% Single classroom schools% Single teacher schools
P + UP P+sec/hs U.P. only UP+secP. only
No response in school category
Primary with upper primaryPrimary with U.P. & sec/higherUpper primary onlyUpper primary with sec./higher sec
Primary only
Primary onlyPrimary with upper primaryPrimary with Upper primary & sec/higherUpper primary only
Para-teachers
School category
Upper primary with sec./higher secondary
Primary onlyPrimary with upper prim.
P. onlyP + UPP+sec/hsU.P. onlyUP+sec
NER(U.Prim)GER(U.Prim)NER (Primary)GER (Primary)
Transition ratePrim. to U. Prim
41.3
Performance indicators
SC/ST Enrolment
Indicators
Classrooms/Other rooms
Prim.with U.P.&Sec/H.SUpper Primary onlyU. Primary with Sec./H.S.
Basic Data, 2001
Data reported from
114,401 109,576 109,742 110,508 112,40620,73618,28715,73014,52413,786
55.6
69.4
0.89
## #
61,174 1,337 1,035
0
0 0 0
1 - 5 6 - 7
69.4
97.7 10.296.7 9.085.1 5.283.9 8.6

409
20.1 18.4
Key data: Elementary Education
936
SAMBALPUR
(Previous academic year)
(Previous year)
Gender and caste distribution of teachers*
No. of schools by type of building*
BoysWith disability
Flow rates
Primary Level
Enrolment*
Number of schools
Grade
GER / NER
School category
Primary Upper primaryBoys Boys GirlsGirls
IncentiveType
School categoryMultiple
TypeKuccha
PartiallyPucca
PuccaTotal % good condition
Otherrooms
TentNo
Building
Classrooms
Belowsecondary
Highersecondary
Postgraduate
M. Phil.GraduateSecondarySchool category OthersNo
response
ST teachers
Total Male Female No res Male Female No res Male Female Male FemaleSC teachers
Text booksUniformAttendanceStationery
% Passed
Avg. No. of Tchs.
%
Female literacyOverall literacy
dev. grant grantSchool T L M
Male Female
IVV
IIIIII
Grade R.R. D.O.R. P.R.
VIIVI
# #
I - V
Enrolment by medium of instructions
Examination results
Retention rate
GPI
Primary cycle U. primary cycleState
DISTRICT ELEMENTARY EDUCATION REPORT CARD : 2005-06
GirlsGrade
IIIIIIIVVVI
VIII
AllGirls
Total
VII
% TotalGrossness
School category
294188017
31 2746 13
262
589
61 0 0
920 2513 41,453
0 2,91423 7,662
1 2,2500 128
826 14 48,414 1,0783,417 37,107 830
447 1,815 01,670 5,737 1,407
0 0 0508 922 35
61,968 2,843 2,2301,290
107186
P + UP P+sec/hs U.P. only UP+sec
School categoryP. only
6.3 3.4 0.0 2.8 0.025.9
Number of Clusters 14801014
% Schools with SCR > 603.1 8.3 6.6 5.3
1.7 2.2 4.2 17.9 21.1% Schools with pre-primary sections 5.1 6.2 20.8 0.9 10.5% Schools with common toilets 23.5 41.2 58.3 37.7 57.9
% Schools with girls toilets 8.4 16.3 58.3 8.5 47.4% Schools with drinking water facility 89.9 91.4 95.8 85.8 94.7
% Enrolment in Govt. schools 95.6 92.4 86.7 82.1 81.692.4 90.2 83.3 91.5 84.2
% No female teacher schools (tch>=2) 27.2 30.5 16.7 41.5 36.813.8 1.9 5.7 5.0 1.3
0.2 0.0 0.0 0.8 0.0%Enrolment in schools without blackboard 3.9 2.9 0.0 0.7 1.3
2001-02 2002-03 2003-04 2004-05 2005-06IIIIIIIVV
VIVII
Total U.P
19,12517,21017,90720,17120,01415,958
14,875
19,40318,45719,16219,69718,667
14,17713,341
17,21716,38915,67715,77514,134
9,9088,781
26,57722,07420,91119,05017,400
12,41211,784
29,33624,74921,79219,72617,687
15,05713,758
68.6
27.8
81.4
40.4
94.4
48.9
50.0
29.24.2
9,3558,3268,883
10,1229,6917,6036,959
1078176
101116
6462
71626571654037
2,524
classrooms
1,544130230130
51.150.171.535.761.5
31.528.2
17.4
20.036.526.2
21.88.5
27.812.3
51940
12347
977 409 125 8 0 355 48101 32 2 0 167 23
12 3 0 0 5 435 37 1 0 23 1010 6 0 0 1 2
85 955 438 582 102 4 220 421 282 511 132 5 2 32
4 30 10 64 23 0 0 93 58 48 125 24 0 0 30 9 5 35 19 0 0 25
1 42 41 104 23 2 0 0
1157788
55174
41
584758728
1032 19 81 48 0 168 110 295 1343310
024
400
101
31210
0000
975
122
57433
1526
238
744
133
Terminalgrade Passed
VII boysV girlsV boys
VII girls
40 with >60%
17.223371476
142272
94
17.60.0
17.97.1
10.220.2
2.619.3
0.0
62415Oriya Hindi English Others
43399314088612285
955303
0307473
1294328218
00
305850
078
0
% Schools recvd.
0.10.00.00.00.0
0.00.00.00.00.0
45887466115527
13931103
75110
44701822140421
12497128
8751
2.54.55.92.64.9
13.86.85.24.0
4.29.5
4.16.8
2005-062004-052003-04
ORISSA
54.2
Upper PrimaryPrimary
Sex ratio Sex ratio 0-6
13 150
VIII8.3
Enrolment of children
VIIITotal Pr.
214 5883 1110 0
87 55
%Teachers recvd.in-service training
Total schools* Rural schools* Total enrolment* Rural enrolment* Teachers*
19.3 35.4
76.2
31.6
62.7 66.2
19.7 27.0% SC enrolment% SC girls to SC enrolment% ST enrolment
49.0 46.942.148.8 47.3
28.0
49.7
30.1
47.9
Position of teachers by educational qualification (other than para teacher)
(Previous academic year)Incentives : Number of beneficiaries
% ST girls to ST enrolment
% Girls
Number of villages
% 0 - 6 population
% SC population % ST population
% Urban population
% Schools with blackboard
% Enrolment in single-teacher schools
% Enrolment in schools without building
Primary Upperprimary
OBC EnrolmentPrimary U. Primary
% OBCEnrolment% OBC girls toOBC Enrolment
Pupil-teacher ratio (PTR)Student-classroom ratio (SCR)% Schools with <= 50 students% Schools with PTR > 100% Female teachers
% Schools established since 1995
Regular teachers Para-teachers
% minorrepairs
% majorrepairs
# = not applicable na = not available * Some totals may not match due to no response in classificatory data items
4.0 82.31.6 91.6
13.6 82.32.1 91.1
2624
49.12826
52.50.1
46.211.4
48.53029
14.81.2
41.75.2
49.83441
23.60.0
32.44.7
34.72921
21.10.0
29.85.3
14.2 17.0 34.5 67.3 55.2
95996927.113.4
Category
PrivateGovt.PrivateGovtPrivateGovt.PrivateGovt.PrivateGovt.
Total population (in 000's)
Number of blocks/taluks
District
Decadal growth rate
Primary onlyPrimary with upper primaryPrimary with upper primary & sec/higher sec.Upper primary onlyUpper primary with sec./higher secondary
% Single classroom schools% Single teacher schools
P + UP P+sec/hs U.P. only UP+secP. only
No response in school category
Primary with upper primaryPrimary with U.P. & sec/higherUpper primary onlyUpper primary with sec./higher sec
Primary only
Primary onlyPrimary with upper primaryPrimary with Upper primary & sec/higherUpper primary only
Para-teachers
School category
Upper primary with sec./higher secondary
Primary onlyPrimary with upper prim.
P. onlyP + UPP+sec/hsU.P. onlyUP+sec
NER(U.Prim)GER(U.Prim)NER (Primary)GER (Primary)
Transition ratePrim. to U. Prim
38.3
Performance indicators
SC/ST Enrolment
Indicators
Classrooms/Other rooms
Prim.with U.P.&Sec/H.SUpper Primary onlyU. Primary with Sec./H.S.
Basic Data, 2001
Data reported from
113,290 106,012 79,192 95,386 94,42730,83327,51818,68924,19628,815
82.3
65.6
0.97
## #
60,939 607 411
0
0 0 0
1 - 5 6 - 7
65.6
98.1 19.198.0 19.287.3 8.089.0 8.0
Elementary Education: Report Card - SAMBALPUR
Ori
ssa

410
Elementary Education in India - Where do we stand ?
Ori
ssa
27.9 26.7
Key data: Elementary Education
542
SONEPUR
(Previous academic year)
(Previous year)
Gender and caste distribution of teachers*
No. of schools by type of building*
BoysWith disability
Flow rates
Primary Level
Enrolment*
Number of schools
Grade
GER / NER
School category
Primary Upper primaryBoys Boys GirlsGirls
IncentiveType
School categoryMultiple
TypeKuccha
PartiallyPucca
PuccaTotal % good condition
Otherrooms
TentNo
Building
Classrooms
Belowsecondary
Highersecondary
Postgraduate
M. Phil.GraduateSecondarySchool category OthersNo
response
ST teachers
Total Male Female No res Male Female No res Male Female Male FemaleSC teachers
Text booksUniformAttendanceStationery
% Passed
Avg. No. of Tchs.
%
Female literacyOverall literacy
dev. grant grantSchool T L M
Male Female
IVV
IIIIII
Grade R.R. D.O.R. P.R.
VIIVI
# #
I - V
Enrolment by medium of instructions
Examination results
Retention rate
GPI
Primary cycle U. primary cycleState
DISTRICT ELEMENTARY EDUCATION REPORT CARD : 2005-06
GirlsGrade
IIIIIIIVVVI
VIII
AllGirls
Total
VII
% TotalGrossness
School category
2173
446
5 2113 0
213
433
0 0 0
660 34 37,5721 575
20 4,9941 5040 0
620 2 36,238 98555 36,019 451576 0 106
1,177 4,863 1,124
0 0 0117 254 23
39,162 350 1,388951
2438
P + UP P+sec/hs U.P. only UP+sec
School categoryP. only
24.3 5.0 0.0 0.0 11.133.6
Number of Clusters 965761
% Schools with SCR > 605.4 0.0 4.6 11.1
4.2 21.6 0.0 20.0 22.2% Schools with pre-primary sections 2.4 6.8 50.0 0.0 0.0% Schools with common toilets 10.1 27.0 33.3 18.5 55.6
% Schools with girls toilets 4.1 9.0 66.7 7.7 44.4% Schools with drinking water facility 83.0 88.7 100.0 80.0 88.9
% Enrolment in Govt. schools 99.1 98.5 50.0 80.9 81.278.4 86.5 83.3 75.4 88.9
% No female teacher schools (tch>=2) 42.2 55.0 50.0 73.8 66.720.2 3.6 0.0 4.1 3.7
4.9 0.8 0.0 3.5 0.0%Enrolment in schools without blackboard 18.0 12.0 9.2 21.3 11.6
2001-02 2002-03 2003-04 2004-05 2005-06IIIIIIIVV
VIVII
Total U.P
11,17511,37513,31113,16914,00511,166
11,381
12,03213,61814,07614,86413,228
10,7639,948
14,23813,74215,29013,78113,468
10,1208,766
14,82716,83714,38313,82612,458
9,2918,491
105.6
48.6
100.2
52.6
108.9
61.8
35.4
0.00.0
5,3275,5746,6376,4716,8435,3585,390
53476964923953
41396249613535
1,322
classrooms
88148
13340
46.241.070.827.170.0
34.335.9
19.4
18.840.620.0
23.110.432.310.0
224105620
344 322 113 6 0 134 8875 34 3 0 103 7
4 0 1 0 1 027 21 2 0 6 8
6 1 0 0 2 0
48 575 238 231 24 1 014 299 127 254 30 0 0 71
0 0 0 16 2 0 0 400 42 23 69 11 1 0 40 1 0 14 2 0 0 10
8 84 158 167 24 0 0 0
912570
16129
13
1604
183
221 43 168 62 6 187 37 114 336538
311
1493
160
45140
0210
980
121
17020
78160
25030
Terminalgrade Passed
VII boysV girlsV boys
VII girls
59 with >60%
44.81412989
64171
27
47.00.0
26.27.7
49.848.3
0.013.633.3
37836Oriya Others English
3721110556016
513
1676815
96155108
0101
000
% Schools recvd.
89.392.8
0.089.244.4
89.193.2
0.089.244.4
320239616
175
119710
289
307771619
25202
11144192
3610
2.14.5
10.72.63.0
5.33.33.93.2
4.09.5
3.83.9
2005-062004-052003-04
ORISSA
7.8
Upper PrimaryPrimary
Sex ratio Sex ratio 0-6
9 102
VIII0.0
Enrolment of children
VIIITotal Pr.
130 4120 7
0 0
36 28
%Teachers recvd.in-service training
Total schools* Rural schools* Total enrolment* Rural enrolment* Teachers*
19.4 42.9
87.8
35.3
83.6 81.9
28.8 29.4% SC enrolment% SC girls to SC enrolment% ST enrolment
48.9 46.210.750.0 46.7
50.5
48.9
50.7
48.3
Position of teachers by educational qualification (other than para teacher)
(Previous academic year)Incentives : Number of beneficiaries
% ST girls to ST enrolment
% Girls
Number of villages
% 0 - 6 population
% SC population % ST population
% Urban population
% Schools with blackboard
% Enrolment in single-teacher schools
% Enrolment in schools without building
Primary Upperprimary
OBC EnrolmentPrimary U. Primary
% OBCEnrolment% OBC girls toOBC Enrolment
Pupil-teacher ratio (PTR)Student-classroom ratio (SCR)% Schools with <= 50 students% Schools with PTR > 100% Female teachers
% Schools established since 1995
Regular teachers Para-teachers
% minorrepairs
% majorrepairs
# = not applicable na = not available * Some totals may not match due to no response in classificatory data items
3.9 90.82.9 93.75.9 90.25.9 90.9
15.1 81.26.8 89.4
2418
49.62830
54.60.2
20.019.9
47.83943
2.32.7
20.74.5
50.23646
7.71.5
12.96.2
46.42316
33.30.0
11.133.3
13.4 23.6 9.8 62.8 46.2
9679667.414.3
Category
PrivateGovt.PrivateGovtPrivateGovt.PrivateGovt.PrivateGovt.
Total population (in 000's)
Number of blocks/taluks
District
Decadal growth rate
Primary onlyPrimary with upper primaryPrimary with upper primary & sec/higher sec.Upper primary onlyUpper primary with sec./higher secondary
% Single classroom schools% Single teacher schools
P + UP P+sec/hs U.P. only UP+secP. only
No response in school category
Primary with upper primaryPrimary with U.P. & sec/higherUpper primary onlyUpper primary with sec./higher sec
Primary only
Primary onlyPrimary with upper primaryPrimary with Upper primary & sec/higherUpper primary only
Para-teachers
School category
Upper primary with sec./higher secondary
Primary onlyPrimary with upper prim.
P. onlyP + UPP+sec/hsU.P. onlyUP+sec
NER(U.Prim)GER(U.Prim)NER (Primary)GER (Primary)
Transition ratePrim. to U. Prim
9.7
Performance indicators
SC/ST Enrolment
Indicators
Classrooms/Other rooms
Prim.with U.P.&Sec/H.SUpper Primary onlyU. Primary with Sec./H.S.
Basic Data, 2001
Data reported from
72,331 70,519 67,818 63,03522,54720,71118,88617,782
81.2
0.96
## #
41,600 417 322
0
0 0 0
1 - 5 6 - 7
99.0 10.798.1 8.285.2 6.886.2 5.4
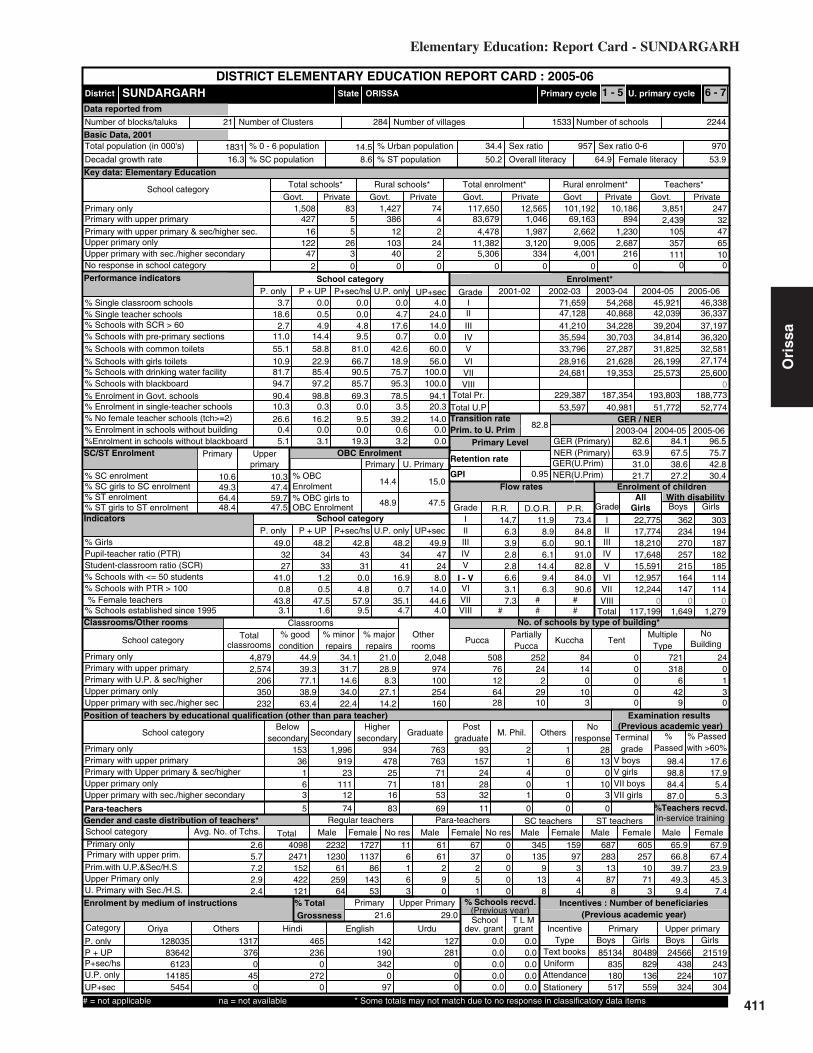
411
10.6 10.3
Key data: Elementary Education
1831
SUNDARGARH
(Previous academic year)
(Previous year)
Gender and caste distribution of teachers*
No. of schools by type of building*
BoysWith disability
Flow rates
Primary Level
Enrolment*
Number of schools
Grade
GER / NER
School category
Primary Upper primaryBoys Boys GirlsGirls
IncentiveType
School categoryMultiple
TypeKuccha
PartiallyPucca
PuccaTotal % good condition
Otherrooms
TentNo
Building
Classrooms
Belowsecondary
Highersecondary
Postgraduate
M. Phil.GraduateSecondarySchool category OthersNo
response
ST teachers
Total Male Female No res Male Female No res Male Female Male FemaleSC teachers
Text booksUniformAttendanceStationery
% Passed
Avg. No. of Tchs.
%
Female literacyOverall literacy
dev. grant grantSchool T L M
Male Female
IVV
IIIIII
Grade R.R. D.O.R. P.R.
VIIVI
# #
I - V
Enrolment by medium of instructions
Examination results
Retention rate
GPI
Primary cycle U. primary cycleState
DISTRICT ELEMENTARY EDUCATION REPORT CARD : 2005-06
GirlsGrade
IIIIIIIVVVI
VIII
AllGirls
Total
VII
% TotalGrossness
School category
42716
12247
5 3865 12
263
10340
2 0 0
1,508 834 83,6792 4,478
24 11,3822 5,3060 0
1,427 74 101,192 10,1861,046 69,163 8941,987 2,662 1,2303,120 9,005 2,687
0 0 0334 4,001 216
117,650 12,565 3,8512,439
24732
P + UP P+sec/hs U.P. only UP+sec
School categoryP. only
3.7 0.0 0.0 0.0 4.018.6
Number of Clusters 22441533
% Schools with SCR > 600.5 0.0 4.7 24.0
2.7 4.9 4.8 17.6 14.0% Schools with pre-primary sections 11.0 14.4 9.5 0.7 0.0% Schools with common toilets 55.1 58.8 81.0 42.6 60.0
% Schools with girls toilets 10.9 22.9 66.7 18.9 56.0% Schools with drinking water facility 81.7 85.4 90.5 75.7 100.0
% Enrolment in Govt. schools 90.4 98.8 69.3 78.5 94.194.7 97.2 85.7 95.3 100.0
% No female teacher schools (tch>=2) 26.6 16.2 9.5 39.2 14.010.3 0.3 0.0 3.5 20.3
0.4 0.0 0.0 0.6 0.0%Enrolment in schools without blackboard 5.1 3.1 19.3 3.2 0.0
2001-02 2002-03 2003-04 2004-05 2005-06IIIIIIIVV
VIVII
Total U.P
46,33836,33737,19736,32032,58127,174
25,600
45,92142,03939,20434,81431,825
26,19925,573
54,26840,86834,22830,70327,287
21,62819,353
71,65947,12841,21035,59433,796
28,91624,681
82.6
31.0
84.1
38.6
96.5
42.8
42.8
0.04.8
22,77517,77418,21017,64815,59112,95712,244
362234270257215164147
303194187182185114114
4,879
classrooms
2,574206350232
44.939.377.138.963.4
34.131.7
21.0
14.634.022.4
28.98.3
27.114.2
974100254160
2,048 508 252 84 0 721 2476 24 14 0 318 012 2 0 0 6 164 29 10 0 42 328 10 3 0 9 0
153 1,996 934 763 93 2 136 919 478 763 157 1 6 13
1 23 25 71 24 4 0 06 111 71 181 28 0 1 103 12 16 53 32 1 0 3
5 74 83 69 11 0 0 0
22321230
61259
64
113786
14353
1727 11 61 67 0 345 159 687 6056163
61290
37251
0000
1359
138
97344
2831387
8
2571071
3
Terminalgrade Passed
VII boysV girlsV boys
VII girls
28 with >60%
65.940982471
152422121
66.839.749.3
9.4
67.967.423.945.3
7.4
128035Oriya Others Hindi English Urdu
836426123
141855454
1317376
045
0
465236
0272
0
142190342
097
127281
000
% Schools recvd.
0.00.00.00.00.0
0.00.00.00.00.0
85134835180517
24566438224324
80489829136559
21519243107304
2.65.77.22.92.4
14.76.33.92.8
3.17.3
2.86.6
2005-062004-052003-04
ORISSA
57.9
Upper PrimaryPrimary
Sex ratio Sex ratio 0-6
21 284
VIII9.5
Enrolment of children
VIIITotal Pr.
357 65111 10
0 0
105 47
%Teachers recvd.in-service training
Total schools* Rural schools* Total enrolment* Rural enrolment* Teachers*
21.6 29.0
75.7
30.4
63.9 67.5
21.7 27.2% SC enrolment% SC girls to SC enrolment% ST enrolment
49.3 47.464.448.4 47.5
14.4
48.9
15.0
47.5
Position of teachers by educational qualification (other than para teacher)
(Previous academic year)Incentives : Number of beneficiaries
% ST girls to ST enrolment
% Girls
Number of villages
% 0 - 6 population
% SC population % ST population
% Urban population
% Schools with blackboard
% Enrolment in single-teacher schools
% Enrolment in schools without building
Primary Upperprimary
OBC EnrolmentPrimary U. Primary
% OBCEnrolment% OBC girls toOBC Enrolment
Pupil-teacher ratio (PTR)Student-classroom ratio (SCR)% Schools with <= 50 students% Schools with PTR > 100% Female teachers
% Schools established since 1995
Regular teachers Para-teachers
% minorrepairs
% majorrepairs
# = not applicable na = not available * Some totals may not match due to no response in classificatory data items
11.9 73.48.9 84.86.0 90.16.1 91.0
14.4 82.89.4 84.06.3 90.6
3143
49.03227
41.00.8
43.83.1
48.23433
1.20.5
47.51.6
48.23441
16.90.7
35.14.7
49.94724
8.014.044.6
4.0
16.3 8.6 50.2 64.9 53.9
97095734.414.5
Category
PrivateGovt.PrivateGovtPrivateGovt.PrivateGovt.PrivateGovt.
Total population (in 000's)
Number of blocks/taluks
District
Decadal growth rate
Primary onlyPrimary with upper primaryPrimary with upper primary & sec/higher sec.Upper primary onlyUpper primary with sec./higher secondary
% Single classroom schools% Single teacher schools
P + UP P+sec/hs U.P. only UP+secP. only
No response in school category
Primary with upper primaryPrimary with U.P. & sec/higherUpper primary onlyUpper primary with sec./higher sec
Primary only
Primary onlyPrimary with upper primaryPrimary with Upper primary & sec/higherUpper primary only
Para-teachers
School category
Upper primary with sec./higher secondary
Primary onlyPrimary with upper prim.
P. onlyP + UPP+sec/hsU.P. onlyUP+sec
NER(U.Prim)GER(U.Prim)NER (Primary)GER (Primary)
Transition ratePrim. to U. Prim
59.7
Performance indicators
SC/ST Enrolment
Indicators
Classrooms/Other rooms
Prim.with U.P.&Sec/H.SUpper Primary onlyU. Primary with Sec./H.S.
Basic Data, 2001
Data reported from
229,387 187,354 193,803 188,77352,77451,77240,98153,597
82.8
0.95
## #
117,199 1,649 1,279
0
0 0 0
1 - 5 6 - 7
98.4 17.698.8 17.984.4 5.487.0 5.3
Elementary Education: Report Card - SUNDARGARH
Ori
ssa
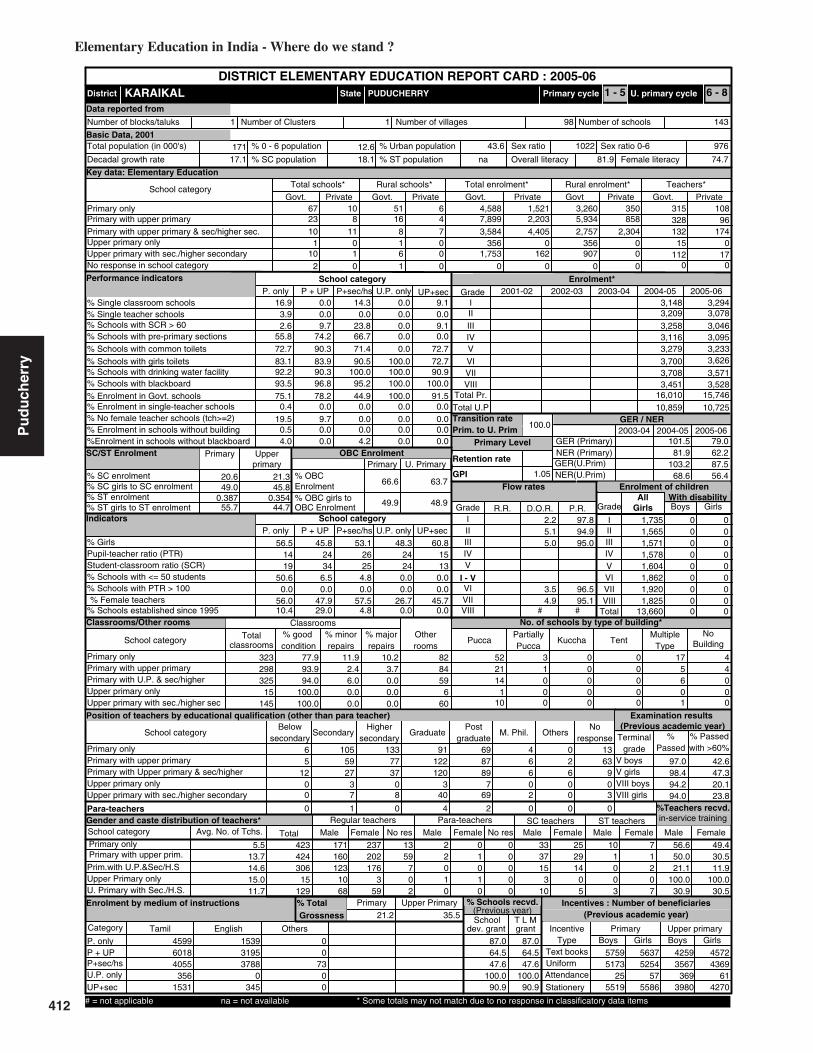
412
Elementary Education in India - Where do we stand ?
Pu
du
cher
ry
0.3540.387
20.6 21.3
Key data: Elementary Education
171
KARAIKAL
(Previous academic year)
(Previous year)
Gender and caste distribution of teachers*
No. of schools by type of building*
BoysWith disability
Flow rates
Primary Level
Enrolment*
Number of schools
Grade
GER / NER
School category
Primary Upper primaryBoys Boys GirlsGirls
IncentiveType
School categoryMultiple
TypeKuccha
PartiallyPucca
PuccaTotal % good condition
Otherrooms
TentNo
Building
Classrooms
Belowsecondary
Highersecondary
Postgraduate
M. Phil.GraduateSecondarySchool category OthersNo
response
ST teachers
Total Male Female No res Male Female No res Male Female Male FemaleSC teachers
Text booksUniformAttendanceStationery
% Passed
Avg. No. of Tchs.
%
Female literacyOverall literacy
dev. grant grantSchool T L M
Male Female
IVV
IIIIII
Grade R.R. D.O.R. P.R.
VIIVI
# #
I - V
Enrolment by medium of instructions
Examination results
Retention rate
GPI
Primary cycle U. primary cycleState
DISTRICT ELEMENTARY EDUCATION REPORT CARD : 2005-06
GirlsGrade
IIIIIIIVVVI
VIII
AllGirls
Total
VII
% TotalGrossness
School category
2310
110
8 1611 8
01
16
2 0 1
67 104 7,8997 3,5840 3560 1,7530 0
51 6 3,260 3502,203 5,934 8584,405 2,757 2,304
0 356 0
0 0 0162 907 0
4,588 1,521 315328
10896
P + UP P+sec/hs U.P. only UP+sec
School categoryP. only
16.9 0.0 14.3 0.0 9.13.9
Number of Clusters 14398
% Schools with SCR > 600.0 0.0 0.0 0.0
2.6 9.7 23.8 0.0 9.1% Schools with pre-primary sections 55.8 74.2 66.7 0.0 0.0% Schools with common toilets 72.7 90.3 71.4 0.0 72.7
% Schools with girls toilets 83.1 83.9 90.5 100.0 72.7% Schools with drinking water facility 92.2 90.3 100.0 100.0 90.9
% Enrolment in Govt. schools 75.1 78.2 44.9 100.0 91.593.5 96.8 95.2 100.0 100.0
% No female teacher schools (tch>=2) 19.5 9.7 0.0 0.0 0.00.4 0.0 0.0 0.0 0.0
0.5 0.0 0.0 0.0 0.0%Enrolment in schools without blackboard 4.0 0.0 4.2 0.0 0.0
2001-02 2002-03 2003-04 2004-05 2005-06IIIIIIIVV
VIVII
Total U.P
3,2943,0783,0463,0953,2333,626
3,571
3,1483,2093,2583,1163,279
3,7003,708
10,72510,859
101.5
103.2
79.0
87.5
53.1
4.80.0
1,7351,5651,5711,5781,6041,8621,9201,825
13,660
000000000
000000000
323
classrooms
298325
15145
77.993.994.0
100.0100.0
11.92.4
10.2
6.00.00.0
3.70.00.00.0
8459
660
82 52 3 0 0 17 421 1 0 0 5 414 0 0 0 6 0
1 0 0 0 0 010 0 0 0 1 0
6 105 133 91 69 4 05 59 77 122 87 6 2 63
12 27 37 120 89 6 6 90 3 0 3 7 0 0 00 7 8 40 69 2 0 3
0 1 0 4 2 0 0 0
171160123
1068
202176
359
237 13 2 0 0 33 25 10 759
702
2010
1010
0000
3715
310
2914
05
1003
1207
Terminalgrade Passed
VIII boysV girlsV boys
VIII girls
13 with >60%
56.6423424306
15129
50.021.1
100.030.9
49.430.511.9
100.030.5
4599Tamil English Others
60184055
3561531
153931953788
0345
00
7300
% Schools recvd.
87.064.547.6
100.090.9
87.064.547.6
100.090.9
57595173
255519
42593567
3693980
56375254
575586
45724369
614270
5.513.714.615.011.7
100.0
1.05
2005-062004-052003-04
PUDUCHERRY
57.5
Upper PrimaryPrimary
Sex ratio Sex ratio 0-6
1 1
VIII4.8
Enrolment of children
VIII 3,451 3,528Total Pr. 16,010 15,746
1 - 5 6 - 8
15 0112 17
0 0
132 174
%Teachers recvd.in-service training
Total schools* Rural schools* Total enrolment* Rural enrolment* Teachers*
21.2 35.5
62.2
56.4
81.9
68.6% SC enrolment% SC girls to SC enrolment% ST enrolment
49.0 45.8
55.7 44.7
66.6
49.9
63.7
48.9
Position of teachers by educational qualification (other than para teacher)
(Previous academic year)Incentives : Number of beneficiaries
% ST girls to ST enrolment
% Girls
Number of villages
% 0 - 6 population
% SC population % ST population
% Urban population
% Schools with blackboard
% Enrolment in single-teacher schools
% Enrolment in schools without building
Primary Upperprimary
OBC EnrolmentPrimary U. Primary
% OBCEnrolment% OBC girls toOBC Enrolment
Pupil-teacher ratio (PTR)Student-classroom ratio (SCR)% Schools with <= 50 students% Schools with PTR > 100% Female teachers
% Schools established since 1995
Regular teachers Para-teachers
% minorrepairs
% majorrepairs
# = not applicable na = not available * Some totals may not match due to no response in classificatory data items
2.2 97.85.1 94.95.0 95.0
3.5 96.54.9 95.1
2526
56.51419
50.60.0
56.010.4
45.82434
6.50.0
47.929.0
48.32424
0.00.0
26.70.0
60.81513
0.00.0
45.70.0
17.1 18.1 na 81.9 74.7
976102243.612.6
Category
PrivateGovt.PrivateGovtPrivateGovt.PrivateGovt.PrivateGovt.
Total population (in 000's)
Number of blocks/taluks
District
Decadal growth rate
Primary onlyPrimary with upper primaryPrimary with upper primary & sec/higher sec.Upper primary onlyUpper primary with sec./higher secondary
% Single classroom schools% Single teacher schools
P + UP P+sec/hs U.P. only UP+secP. only
No response in school category
Primary with upper primaryPrimary with U.P. & sec/higherUpper primary onlyUpper primary with sec./higher sec
Primary only
Primary onlyPrimary with upper primaryPrimary with Upper primary & sec/higherUpper primary only
Para-teachers
School category
Upper primary with sec./higher secondary
Primary onlyPrimary with upper prim.
P. onlyP + UPP+sec/hsU.P. onlyUP+sec
NER(U.Prim)GER(U.Prim)NER (Primary)GER (Primary)
Transition ratePrim. to U. Prim
SC/ST Enrolment
Indicators
Classrooms/Other rooms
Prim.with U.P.&Sec/H.SUpper Primary onlyU. Primary with Sec./H.S.
Basic Data, 2001
Data reported from
Performance indicators
97.0 42.698.4 47.394.2 20.194.0 23.8

413
0.0000.000
0.4470.298
Key data: Elementary Education
37
MAHE
(Previous academic year)
(Previous year)
Gender and caste distribution of teachers*
No. of schools by type of building*
BoysWith disability
Flow rates
Primary Level
Enrolment*
Number of schools
Grade
GER / NER
School category
Primary Upper primaryBoys Boys GirlsGirls
IncentiveType
School categoryMultiple
TypeKuccha
PartiallyPucca
PuccaTotal % good condition
Otherrooms
TentNo
Building
Classrooms
Belowsecondary
Highersecondary
Postgraduate
M. Phil.GraduateSecondarySchool category OthersNo
response
ST teachers
Total Male Female No res Male Female No res Male Female Male FemaleSC teachers
Text booksUniformAttendanceStationery
% Passed
Avg. No. of Tchs.
%
Female literacyOverall literacy
dev. grant grantSchool T L M
Male Female
IVV
IIIIII
Grade R.R. D.O.R. P.R.
VIIVI
# #
I - V
Enrolment by medium of instructions
Examination results
Retention rate
GPI
Primary cycle U. primary cycleState
DISTRICT ELEMENTARY EDUCATION REPORT CARD : 2005-06
GirlsGrade
IIIIIIIVVVI
VIII
AllGirls
Total
VII
% TotalGrossness
School category
1204
5 02 000
00
0 0 0
12 21 1730 5880 00 7360 0
3 0 248 01,760 0 428
566 0 00 0 0
0 0 00 0 0
2,317 344 737
1056
P + UP P+sec/hs U.P. only UP+sec
School categoryP. only
0.0 0.0 0.0 0.0 0.00.0
Number of Clusters 2814
% Schools with SCR > 600.0 0.0 0.0 0.0
14.3 0.0 0.0 0.0 0.0% Schools with pre-primary sections 78.6 83.3 25.0 0.0 0.0% Schools with common toilets 50.0 83.3 100.0 0.0 75.0
% Schools with girls toilets 78.6 100.0 75.0 0.0 100.0% Schools with drinking water facility 100.0 100.0 100.0 0.0 100.0
% Enrolment in Govt. schools 87.1 8.9 51.0 0.0 100.085.7 83.3 100.0 0.0 50.0
% No female teacher schools (tch>=2) 0.0 0.0 0.0 0.0 0.00.0 0.0 0.0 0.0 0.0
0.0 0.0 0.0 0.0 0.0%Enrolment in schools without blackboard 15.4 22.1 0.0 0.0 44.7
2001-02 2002-03 2003-04 2004-05 2005-06IIIIIIIVV
VIVII
Total U.P
1,2451,1301,0941,210
687462
460
885886980843625
535459
1,1181,349
126.7
60.7
124.8
42.3
48.1
0.00.0
602546527596331233267
883,190
000000000
000000000
110
classrooms
7947
044
99.1100.0
93.60.0
86.4
0.90.0
0.0
6.40.0
13.6
0.00.00.00.0
1612
018
25 11 0 0 0 3 06 0 0 0 0 02 0 0 0 2 00 0 0 0 0 02 0 0 0 2 0
4 22 14 35 8 0 00 3 0 60 0 0 0 00 12 1 26 0 0 0 00 0 0 0 0 0 0 00 15 1 19 11 2 0 1
0 0 0 0 0 0 0 0
18490
23
5930
025
65 0 0 0 0 2 4 0 00001
0000
0000
0000
0301
0101
0000
0000
Terminalgrade Passed
VIII boysV girlsV boys
VIII girls
0 with >60%
38.9836339
049
0.033.3
0.00.0
26.20.0
16.70.00.0
% Schools recvd.
57.116.750.0
0.050.0
64.316.750.0
0.050.0
918748
0918
195171
0127
909909
0909
239213
0205
5.910.5
9.80.0
12.3
73.9
0.94
2005-062004-052003-04
PUDUCHERRY
76.9
Upper PrimaryPrimary
Sex ratio Sex ratio 0-6
1 1
VIII0.0
Enrolment of children
VIII 355 196Total Pr. 4,219 5,366
1 - 5 6 - 8
0 049 0
0 0
19 20
%Teachers recvd.in-service training
Total schools* Rural schools* Total enrolment* Rural enrolment* Teachers*
38.9 33.2
76.3
28.3
98.4
33.6% SC enrolment% SC girls to SC enrolment% ST enrolment
62.5 0.0
0.0 0.0
70.9
48.2
115.1
33.6
Position of teachers by educational qualification (other than para teacher)
(Previous academic year)Incentives : Number of beneficiaries
% ST girls to ST enrolment
% Girls
Number of villages
% 0 - 6 population
% SC population % ST population
% Urban population
% Schools with blackboard
% Enrolment in single-teacher schools
% Enrolment in schools without building
Primary Upperprimary
OBC EnrolmentPrimary U. Primary
% OBCEnrolment% OBC girls toOBC Enrolment
Pupil-teacher ratio (PTR)Student-classroom ratio (SCR)% Schools with <= 50 students% Schools with PTR > 100% Female teachers
% Schools established since 1995
Regular teachers Para-teachers
% minorrepairs
% majorrepairs
# = not applicable na = not available * Some totals may not match due to no response in classificatory data items
18.5 81.526.1 73.9
14.0 86.057.3 42.7
2530
49.63224
0.00.0
78.37.1
47.73124
0.00.0
93.716.7
0.000
0.00.00.00.0
53.41517
0.00.0
51.00.0
10.1 0.3 na 95.7 94.0
9201147100.011.6
Category
PrivateGovt.PrivateGovtPrivateGovt.PrivateGovt.PrivateGovt.
Total population (in 000's)
Number of blocks/taluks
District
Decadal growth rate
Primary onlyPrimary with upper primaryPrimary with upper primary & sec/higher sec.Upper primary onlyUpper primary with sec./higher secondary
% Single classroom schools% Single teacher schools
P + UP P+sec/hs U.P. only UP+secP. only
No response in school category
Primary with upper primaryPrimary with U.P. & sec/higherUpper primary onlyUpper primary with sec./higher sec
Primary only
Primary onlyPrimary with upper primaryPrimary with Upper primary & sec/higherUpper primary only
Para-teachers
School category
Upper primary with sec./higher secondary
Primary onlyPrimary with upper prim.
P. onlyP + UPP+sec/hsU.P. onlyUP+sec
NER(U.Prim)GER(U.Prim)NER (Primary)GER (Primary)
Transition ratePrim. to U. Prim
SC/ST Enrolment
Indicators
Classrooms/Other rooms
Prim.with U.P.&Sec/H.SUpper Primary onlyU. Primary with Sec./H.S.
Basic Data, 2001
Data reported from
Performance indicators
99.7 46.696.6 55.450.7 66.999.7 65.2
Elementary Education: Report Card - MAHE
Pu
du
cher
ry

414
Elementary Education in India - Where do we stand ?
Pu
du
cher
ry
0.0000.000
18.2 20.4
Key data: Elementary Education
735
PUDUCHERRY (DISTRICT)
(Previous academic year)
(Previous year)
Gender and caste distribution of teachers*
No. of schools by type of building*
BoysWith disability
Flow rates
Primary Level
Enrolment*
Number of schools
Grade
GER / NER
School category
Primary Upper primaryBoys Boys GirlsGirls
IncentiveType
School categoryMultiple
TypeKuccha
PartiallyPucca
PuccaTotal % good condition
Otherrooms
TentNo
Building
Classrooms
Belowsecondary
Highersecondary
Postgraduate
M. Phil.GraduateSecondarySchool category OthersNo
response
ST teachers
Total Male Female No res Male Female No res Male Female Male FemaleSC teachers
Text booksUniformAttendanceStationery
% Passed
Avg. No. of Tchs.
%
Female literacyOverall literacy
dev. grant grantSchool T L M
Male Female
IVV
IIIIII
Grade R.R. D.O.R. P.R.
VIIVI
# #
I - V
Enrolment by medium of instructions
Examination results
Retention rate
GPI
Primary cycle U. primary cycleState
DISTRICT ELEMENTARY EDUCATION REPORT CARD : 2005-06
GirlsGrade
IIIIIIIVVVI
VIII
AllGirls
Total
VII
% TotalGrossness
School category
5090
57
30 3269 6
03
027
0 0 0
160 4118 16,90125 1,715
0 01 13,4590 0
92 13 12,710 8304,954 10,455 2,877
38,847 1,063 8,0130 0 0
0 0 0296 6,462 108
22,875 3,356 963663
238271
P + UP P+sec/hs U.P. only UP+sec
School categoryP. only
6.5 2.5 2.6 0.0 1.72.0
Number of Clusters 419226
% Schools with SCR > 600.0 0.0 0.0 0.0
6.0 7.5 2.6 0.0 5.0% Schools with pre-primary sections 69.7 73.8 78.2 0.0 3.3% Schools with common toilets 58.7 38.8 42.3 0.0 51.7
% Schools with girls toilets 67.7 90.0 92.3 0.0 76.7% Schools with drinking water facility 97.5 98.8 94.9 0.0 98.3
% Enrolment in Govt. schools 87.2 77.3 4.2 0.0 97.872.6 71.3 57.7 0.0 61.7
% No female teacher schools (tch>=2) 4.0 3.8 0.0 0.0 3.30.9 0.0 0.0 0.0 0.0
0.9 0.0 0.0 0.0 0.0%Enrolment in schools without blackboard 25.4 24.6 52.6 0.0 34.8
2001-02 2002-03 2003-04 2004-05 2005-06IIIIIIIVV
VIVII
Total U.P
14,06312,54112,33312,48914,19812,780
12,165
10,89311,50310,48110,42810,483
11,78411,929
36,77934,706
78.3
75.8
76.4
69.7
54.9
26.92.6
7,4886,7726,4446,6766,8116,5466,2226,001
52,960
000000000
000000000
1,050
classrooms
7141,160
0817
91.991.794.6
0.094.5
7.28.3
0.9
5.00.04.6
0.00.50.01.0
134325
0172
175 162 2 0 0 17 2053 1 0 0 12 1336 1 0 0 22 19
0 0 0 0 0 053 0 0 0 3 4
30 228 216 412 282 22 220 81 114 443 243 19 0 1314 37 61 917 145 13 8 9
0 0 0 0 0 0 0 023 65 16 394 223 6 2 55
0 0 0 0 1 0 0 0
466406177
0321
5141018
0408
726 9 0 0 0 63 51 0 013
90
55
1000
0000
0000
6170
29
3318
023
2001
0001
Terminalgrade Passed
VIII boysV girlsV boys
VIII girls
9 with >60%
14.21201934
12040
784
9.311.9
0.013.1
9.29.94.50.09.1
% Schools recvd.
69.253.816.7
0.073.3
70.155.021.8
0.073.3
1722916372
7217095
1319312558
10112892
1910417606
15218912
1252211346
1012027
6.011.715.4
0.013.1
100.0
1.09
2005-062004-052003-04
PUDUCHERRY
84.6
Upper PrimaryPrimary
Sex ratio Sex ratio 0-6
3 1
VIII9.0
Enrolment of children
VIII 10,993 11,834Total Pr. 53,788 65,624
1 - 5 6 - 8
0 0752 32
0 0
112 1,092
%Teachers recvd.in-service training
Total schools* Rural schools* Total enrolment* Rural enrolment* Teachers*
29.1 29.4
54.2
49.2
67.7
56.7% SC enrolment% SC girls to SC enrolment% ST enrolment
46.2 47.4
0.0 0.0
57.2
50.1
68.0
48.5
Position of teachers by educational qualification (other than para teacher)
(Previous academic year)Incentives : Number of beneficiaries
% ST girls to ST enrolment
% Girls
Number of villages
% 0 - 6 population
% SC population % ST population
% Urban population
% Schools with blackboard
% Enrolment in single-teacher schools
% Enrolment in schools without building
Primary Upperprimary
OBC EnrolmentPrimary U. Primary
% OBCEnrolment% OBC girls toOBC Enrolment
Pupil-teacher ratio (PTR)Student-classroom ratio (SCR)% Schools with <= 50 students% Schools with PTR > 100% Female teachers
% Schools established since 1995
Regular teachers Para-teachers
% minorrepairs
% majorrepairs
# = not applicable na = not available * Some totals may not match due to no response in classificatory data items
0.8 99.2
3534
49.92225
28.41.0
60.422.4
54.62331
16.31.3
55.015.0
0.000
0.00.00.00.0
41.11817
11.71.7
52.03.3
20.8 16.5 na 80.7 72.8
96699068.812.0
Category
PrivateGovt.PrivateGovtPrivateGovt.PrivateGovt.PrivateGovt.
Total population (in 000's)
Number of blocks/taluks
District
Decadal growth rate
Primary onlyPrimary with upper primaryPrimary with upper primary & sec/higher sec.Upper primary onlyUpper primary with sec./higher secondary
% Single classroom schools% Single teacher schools
P + UP P+sec/hs U.P. only UP+secP. only
No response in school category
Primary with upper primaryPrimary with U.P. & sec/higherUpper primary onlyUpper primary with sec./higher sec
Primary only
Primary onlyPrimary with upper primaryPrimary with Upper primary & sec/higherUpper primary only
Para-teachers
School category
Upper primary with sec./higher secondary
Primary onlyPrimary with upper prim.
P. onlyP + UPP+sec/hsU.P. onlyUP+sec
NER(U.Prim)GER(U.Prim)NER (Primary)GER (Primary)
Transition ratePrim. to U. Prim
SC/ST Enrolment
Indicators
Classrooms/Other rooms
Prim.with U.P.&Sec/H.SUpper Primary onlyU. Primary with Sec./H.S.
Basic Data, 2001
Data reported from
Performance indicators
96.8 50.697.8 51.991.9 32.694.7 33.8

415
0.0000.000
14.2 16.3
Key data: Elementary Education
31
YANAM
(Previous academic year)
(Previous year)
Gender and caste distribution of teachers*
No. of schools by type of building*
BoysWith disability
Flow rates
Primary Level
Enrolment*
Number of schools
Grade
GER / NER
School category
Primary Upper primaryBoys Boys GirlsGirls
IncentiveType
School categoryMultiple
TypeKuccha
PartiallyPucca
PuccaTotal % good condition
Otherrooms
TentNo
Building
Classrooms
Belowsecondary
Highersecondary
Postgraduate
M. Phil.GraduateSecondarySchool category OthersNo
response
ST teachers
Total Male Female No res Male Female No res Male Female Male FemaleSC teachers
Text booksUniformAttendanceStationery
% Passed
Avg. No. of Tchs.
%
Female literacyOverall literacy
dev. grant grantSchool T L M
Male Female
IVV
IIIIII
Grade R.R. D.O.R. P.R.
VIIVI
# #
I - V
Enrolment by medium of instructions
Examination results
Retention rate
GPI
Primary cycle U. primary cycleState
DISTRICT ELEMENTARY EDUCATION REPORT CARD : 2005-06
GirlsGrade
IIIIIIIVVVI
VIII
AllGirls
Total
VII
% TotalGrossness
School category
1015
2 03 001
01
0 0 0
13 00 1900 00 2960 8490 0
0 0 0 0443 0 0
1,621 0 00 0 0
0 0 0178 164 0
2,064 0 577
030
P + UP P+sec/hs U.P. only UP+sec
School categoryP. only
0.0 0.0 0.0 0.0 0.015.4
Number of Clusters 268
% Schools with SCR > 600.0 0.0 0.0 0.0
15.4 0.0 0.0 0.0 0.0% Schools with pre-primary sections 61.5 100.0 100.0 0.0 16.7% Schools with common toilets 38.5 33.3 33.3 0.0 66.7
% Schools with girls toilets 69.2 66.7 100.0 100.0 66.7% Schools with drinking water facility 100.0 100.0 100.0 100.0 100.0
% Enrolment in Govt. schools 100.0 30.0 0.0 100.0 82.7100.0 100.0 100.0 100.0 83.3
% No female teacher schools (tch>=2) 15.4 0.0 0.0 0.0 16.77.3 0.0 0.0 0.0 0.0
0.0 0.0 0.0 0.0 0.0%Enrolment in schools without blackboard 0.0 0.0 0.0 0.0 17.3
2001-02 2002-03 2003-04 2004-05 2005-06IIIIIIIVV
VIVII
Total U.P
860724773683703704
571
591601556907591
434378
1,8981,162
100.5
53.9
102.1
84.3
47.6
0.00.0
426335359374347316280313
2,750
000000000
000000000
64
classrooms
37721151
95.389.2
100.018.296.1
0.010.8
4.7
0.081.8
0.0
0.00.00.03.9
1099
46
26 11 0 0 0 1 13 0 0 0 0 01 0 0 0 2 01 0 0 0 0 06 0 0 0 0 0
1 7 5 28 15 1 00 0 0 27 8 1 0 10 5 2 28 10 0 0 00 0 0 14 0 0 0 00 0 2 39 34 0 0 0
0 0 0 0 0 0 0 0
321223
254
24221221
25 0 0 0 0 2 6 0 01000
0000
0000
0000
1306
4322
0000
3000
Terminalgrade Passed
VIII boysV girlsV boys
VIII girls
0 with >60%
71.95737451475
0.00.00.0
48.1
52.00.00.0
50.028.6
% Schools recvd.
84.633.3
0.0100.0
66.7
84.633.3
0.0100.0
66.7
12021126
01126
549549
0549
12671190
01187
691691
0691
4.412.315.014.012.5
100.0
0.97
2005-062004-052003-04
PUDUCHERRY
48.9
Upper PrimaryPrimary
Sex ratio Sex ratio 0-6
1 1
VIII0.0
Enrolment of children
VIII 350 623Total Pr. 3,246 3,743
1 - 5 6 - 8
14 060 15
0 0
0 45
%Teachers recvd.in-service training
Total schools* Rural schools* Total enrolment* Rural enrolment* Teachers*
39.6 66.9
61.7
27.9
70.0
29.2% SC enrolment% SC girls to SC enrolment% ST enrolment
49.5 60.6
0.0 0.0
46.1
54.4
28.5
69.6
Position of teachers by educational qualification (other than para teacher)
(Previous academic year)Incentives : Number of beneficiaries
% ST girls to ST enrolment
% Girls
Number of villages
% 0 - 6 population
% SC population % ST population
% Urban population
% Schools with blackboard
% Enrolment in single-teacher schools
% Enrolment in schools without building
Primary Upperprimary
OBC EnrolmentPrimary U. Primary
% OBCEnrolment% OBC girls toOBC Enrolment
Pupil-teacher ratio (PTR)Student-classroom ratio (SCR)% Schools with <= 50 students% Schools with PTR > 100% Female teachers
% Schools established since 1995
Regular teachers Para-teachers
% minorrepairs
% majorrepairs
# = not applicable na = not available * Some totals may not match due to no response in classificatory data items
22.5 77.52336
50.83632
15.47.7
43.90.0
46.31717
0.00.0
64.966.7
100.02127
0.00.0
85.70.0
33.11420
0.00.0
28.00.0
54.5 18.5 na 73.7 68.5
961975100.014.2
Category
PrivateGovt.PrivateGovtPrivateGovt.PrivateGovt.PrivateGovt.
Total population (in 000's)
Number of blocks/taluks
District
Decadal growth rate
Primary onlyPrimary with upper primaryPrimary with upper primary & sec/higher sec.Upper primary onlyUpper primary with sec./higher secondary
% Single classroom schools% Single teacher schools
P + UP P+sec/hs U.P. only UP+secP. only
No response in school category
Primary with upper primaryPrimary with U.P. & sec/higherUpper primary onlyUpper primary with sec./higher sec
Primary only
Primary onlyPrimary with upper primaryPrimary with Upper primary & sec/higherUpper primary only
Para-teachers
School category
Upper primary with sec./higher secondary
Primary onlyPrimary with upper prim.
P. onlyP + UPP+sec/hsU.P. onlyUP+sec
NER(U.Prim)GER(U.Prim)NER (Primary)GER (Primary)
Transition ratePrim. to U. Prim
SC/ST Enrolment
Indicators
Classrooms/Other rooms
Prim.with U.P.&Sec/H.SUpper Primary onlyU. Primary with Sec./H.S.
Basic Data, 2001
Data reported from
Performance indicators
99.1 53.5100.0 39.8
89.8 37.593.6 29.1
Elementary Education: Report Card - YANAM
Pu
du
cher
ry
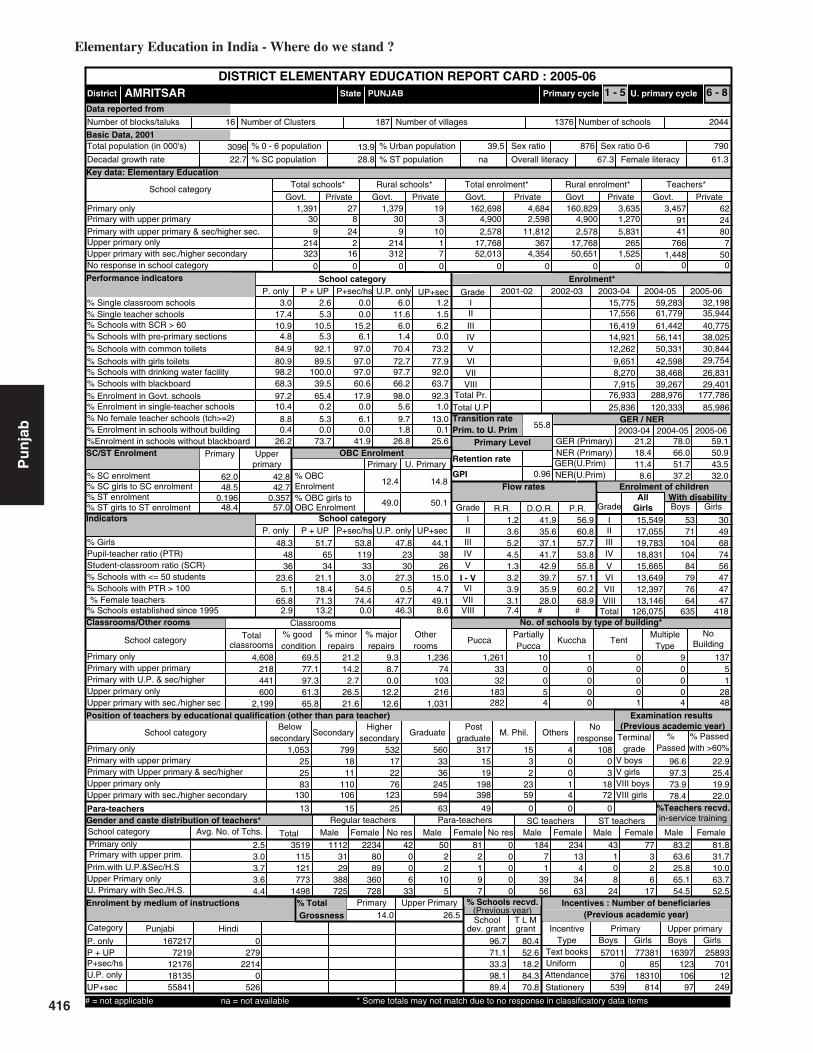
416
Elementary Education in India - Where do we stand ?
Pu
nja
b
0.3570.196
62.0 42.8
Key data: Elementary Education
3096
AMRITSAR
(Previous academic year)
(Previous year)
Gender and caste distribution of teachers*
No. of schools by type of building*
BoysWith disability
Flow rates
Primary Level
Enrolment*
Number of schools
Grade
GER / NER
School category
Primary Upper primaryBoys Boys GirlsGirls
IncentiveType
School categoryMultiple
TypeKuccha
PartiallyPucca
PuccaTotal % good condition
Otherrooms
TentNo
Building
Classrooms
Belowsecondary
Highersecondary
Postgraduate
M. Phil.GraduateSecondarySchool category OthersNo
response
ST teachers
Total Male Female No res Male Female No res Male Female Male FemaleSC teachers
Text booksUniformAttendanceStationery
% Passed
Avg. No. of Tchs.
%
Female literacyOverall literacy
dev. grant grantSchool T L M
Male Female
IVV
IIIIII
Grade R.R. D.O.R. P.R.
VIIVI
# #
I - V
Enrolment by medium of instructions
Examination results
Retention rate
GPI
Primary cycle U. primary cycleState
DISTRICT ELEMENTARY EDUCATION REPORT CARD : 2005-06
GirlsGrade
IIIIIIIVVVI
VIII
AllGirls
Total
VII
% TotalGrossness
School category
309
214323
8 3024 9
216
214312
0 0 0
1,391 273 4,900
10 2,5781 17,7687 52,0130 0
1,379 19 160,829 3,6352,598 4,900 1,270
11,812 2,578 5,831367 17,768 265
0 0 04,354 50,651 1,525
162,698 4,684 3,45791
6224
P + UP P+sec/hs U.P. only UP+sec
School categoryP. only
3.0 2.6 0.0 6.0 1.217.4
Number of Clusters 20441376
% Schools with SCR > 605.3 0.0 11.6 1.5
10.9 10.5 15.2 6.0 6.2% Schools with pre-primary sections 4.8 5.3 6.1 1.4 0.0% Schools with common toilets 84.9 92.1 97.0 70.4 73.2
% Schools with girls toilets 80.9 89.5 97.0 72.7 77.9% Schools with drinking water facility 98.2 100.0 97.0 97.7 92.0
% Enrolment in Govt. schools 97.2 65.4 17.9 98.0 92.368.3 39.5 60.6 66.2 63.7
% No female teacher schools (tch>=2) 8.8 5.3 6.1 9.7 13.010.4 0.2 0.0 5.6 1.0
0.4 0.0 0.0 1.8 0.1%Enrolment in schools without blackboard 26.2 73.7 41.9 26.8 25.6
2001-02 2002-03 2003-04 2004-05 2005-06IIIIIIIVV
VIVII
Total U.P
32,19835,94440,77538,02530,84429,754
26,831
59,28361,77961,44256,14150,331
42,59838,468
15,77517,55616,41914,92112,262
9,6518,270
85,986120,33325,836
21.2
11.4
78.0
51.7
59.1
43.5
53.8
3.054.5
15,54917,05519,78318,83115,66513,64912,39713,146
126,075
5371
104104
84797664
635
3049687456474747
418
4,608
classrooms
218441600
2,199
69.577.197.361.365.8
21.214.2
9.3
2.726.521.6
8.70.0
12.212.6
74103216
1,031
1,236 1,261 10 1 0 9 13733 0 0 0 0 532 0 0 0 0 1
183 5 0 0 0 28282 4 0 1 4 48
1,053 799 532 560 317 15 425 18 17 33 15 3 0 025 11 22 36 19 2 0 383 110 76 245 198 23 1 18
130 106 123 594 398 59 4 72
13 15 25 63 49 0 0 0
11123129
388725
8089
360728
2234 42 50 81 0 184 234 43 77006
33
22
105
2197
0000
71
3956
134
3463
108
24
326
17
Terminalgrade Passed
VIII boysV girlsV boys
VIII girls
108 with >60%
83.23519115121773
1498
63.625.865.154.5
81.831.710.063.752.5
167217Punjabi Hindi
7219121761813555841
0279
22140
526
% Schools recvd.
96.771.133.398.189.4
80.452.618.284.370.8
570110
376539
16397123106
97
7738185
18310814
25893701
12249
2.53.03.73.64.4
1.23.65.24.5
3.93.17.4
1.33.2
55.8
0.96
2005-062004-052003-04
PUNJAB
74.4
Upper PrimaryPrimary
Sex ratio Sex ratio 0-6
16 187
VIII0.0
Enrolment of children
VIII 7,915 39,267 29,401Total Pr. 76,933 288,976 177,786
1 - 5 6 - 8
766 71,448 50
0 0
41 80
%Teachers recvd.in-service training
Total schools* Rural schools* Total enrolment* Rural enrolment* Teachers*
14.0 26.5
50.9
32.0
18.4 66.0
8.6 37.2% SC enrolment% SC girls to SC enrolment% ST enrolment
48.5 42.7
48.4 57.0
12.4
49.0
14.8
50.1
Position of teachers by educational qualification (other than para teacher)
(Previous academic year)Incentives : Number of beneficiaries
% ST girls to ST enrolment
% Girls
Number of villages
% 0 - 6 population
% SC population % ST population
% Urban population
% Schools with blackboard
% Enrolment in single-teacher schools
% Enrolment in schools without building
Primary Upperprimary
OBC EnrolmentPrimary U. Primary
% OBCEnrolment% OBC girls toOBC Enrolment
Pupil-teacher ratio (PTR)Student-classroom ratio (SCR)% Schools with <= 50 students% Schools with PTR > 100% Female teachers
% Schools established since 1995
Regular teachers Para-teachers
% minorrepairs
% majorrepairs
# = not applicable na = not available * Some totals may not match due to no response in classificatory data items
41.9 56.935.6 60.837.1 57.741.7 53.842.9 55.839.7 57.135.9 60.228.0 68.9
33119
48.34836
23.65.1
65.82.9
51.76534
21.118.471.313.2
47.82330
27.30.5
47.746.3
44.13826
15.04.7
49.18.6
22.7 28.8 na 67.3 61.3
79087639.513.9
Category
PrivateGovt.PrivateGovtPrivateGovt.PrivateGovt.PrivateGovt.
Total population (in 000's)
Number of blocks/taluks
District
Decadal growth rate
Primary onlyPrimary with upper primaryPrimary with upper primary & sec/higher sec.Upper primary onlyUpper primary with sec./higher secondary
% Single classroom schools% Single teacher schools
P + UP P+sec/hs U.P. only UP+secP. only
No response in school category
Primary with upper primaryPrimary with U.P. & sec/higherUpper primary onlyUpper primary with sec./higher sec
Primary only
Primary onlyPrimary with upper primaryPrimary with Upper primary & sec/higherUpper primary only
Para-teachers
School category
Upper primary with sec./higher secondary
Primary onlyPrimary with upper prim.
P. onlyP + UPP+sec/hsU.P. onlyUP+sec
NER(U.Prim)GER(U.Prim)NER (Primary)GER (Primary)
Transition ratePrim. to U. Prim
SC/ST Enrolment
Indicators
Classrooms/Other rooms
Prim.with U.P.&Sec/H.SUpper Primary onlyU. Primary with Sec./H.S.
Basic Data, 2001
Data reported from
Performance indicators
96.6 22.997.3 25.473.9 19.978.4 22.0

417
Elementary Education: Report Card - BATHINDA
Pu
nja
b
0.1530.191
44.7 31.3
Key data: Elementary Education
1183
BATHINDA
(Previous academic year)
(Previous year)
Gender and caste distribution of teachers*
No. of schools by type of building*
BoysWith disability
Flow rates
Primary Level
Enrolment*
Number of schools
Grade
GER / NER
School category
Primary Upper primaryBoys Boys GirlsGirls
IncentiveType
School categoryMultiple
TypeKuccha
PartiallyPucca
PuccaTotal % good condition
Otherrooms
TentNo
Building
Classrooms
Belowsecondary
Highersecondary
Postgraduate
M. Phil.GraduateSecondarySchool category OthersNo
response
ST teachers
Total Male Female No res Male Female No res Male Female Male FemaleSC teachers
Text booksUniformAttendanceStationery
% Passed
Avg. No. of Tchs.
%
Female literacyOverall literacy
dev. grant grantSchool T L M
Male Female
IVV
IIIIII
Grade R.R. D.O.R. P.R.
VIIVI
# #
I - V
Enrolment by medium of instructions
Examination results
Retention rate
GPI
Primary cycle U. primary cycleState
DISTRICT ELEMENTARY EDUCATION REPORT CARD : 2005-06
GirlsGrade
IIIIIIIVVVI
VIII
AllGirls
Total
VII
% TotalGrossness
School category
544556
122
138 4268 36
34
51108
0 0 0
400 236104 6,168
34 12,6731 5,8902 25,5240 0
350 185 57,216 10,82619,031 4,671 12,16123,646 7,394 7,574
451 5,395 169
0 0 01,048 22,240 209
64,802 15,034 1,355283
917849
P + UP P+sec/hs U.P. only UP+sec
School categoryP. only
1.6 0.0 0.0 0.0 0.014.2
Number of Clusters 1126384
% Schools with SCR > 605.7 5.3 11.9 9.5
3.1 0.5 6.2 3.4 12.7% Schools with pre-primary sections 36.0 53.1 41.6 5.1 3.2% Schools with common toilets 82.2 85.4 81.4 64.4 77.8
% Schools with girls toilets 78.0 81.3 94.7 83.1 88.1% Schools with drinking water facility 91.5 92.7 95.6 89.8 95.2
% Enrolment in Govt. schools 81.2 24.5 34.9 92.9 96.192.5 90.6 92.0 93.2 89.7
% No female teacher schools (tch>=2) 10.8 8.9 9.7 15.3 6.312.2 4.6 3.9 10.2 9.5
0.5 0.0 0.0 0.0 0.0%Enrolment in schools without blackboard 5.8 8.5 7.6 4.1 10.9
2001-02 2002-03 2003-04 2004-05 2005-06IIIIIIIVV
VIVII
Total U.P
25,80721,93822,72321,75621,87521,370
18,140
19,42718,31417,92317,42217,631
17,85215,836
14,59412,80512,69211,62211,234
11,61310,113
60,16849,46230,735
45.7
35.5
64.6
56.0
99.3
79.7
40.2
2.78.8
10,9179,5399,9839,5859,8329,4128,2369,196
76,700
11072
1029085565373
641
6147535252683264
429
2,925
classrooms
1,3141,485
206815
90.994.497.290.382.1
6.25.3
2.9
1.76.8
14.2
0.31.12.93.7
398470113336
850 614 0 0 0 0 21185 3 0 0 0 4112 0 0 0 0 1
58 0 0 0 0 1124 0 0 0 1 1
269 436 412 519 313 4 332 92 191 329 265 5 2 18315 64 43 285 236 2 2 52619 34 11 63 115 2 0 3235 86 46 228 234 3 0 174
8 17 41 45 24 0 0 0
632290221127271
694592121394
1377 186 26 50 1 145 149 16 29115360
28141
10405
23916
0000
2917
621
4624
518
4034
8404
Terminalgrade Passed
VIII boysV girlsV boys
VIII girls
239 with >60%
24.3227211321186
277817
14.711.628.330.4
17.06.07.3
26.228.0
78070Punjabi English Hindi Gujarati Others
2367528745
634126572
23211115629
00
584413855
00
4180
109000
5320000
% Schools recvd.
56.319.831.994.996.0
56.319.833.691.596.0
19711106
70370
8630126
233258
28270287
13565525
1766080
204047
3.65.9
10.54.76.5
16.913.111.6
9.4
11.910.424.8
4.711.3
100.0
0.78
2005-062004-052003-04
PUNJAB
50.7
Upper PrimaryPrimary
Sex ratio Sex ratio 0-6
8 57
VIII34.5
Enrolment of children
VIII 9,009 15,774 20,658Total Pr. 62,947 90,717 114,099
1 - 5 6 - 8
265 12769 48
0 0
424 762
%Teachers recvd.in-service training
Total schools* Rural schools* Total enrolment* Rural enrolment* Teachers*
22.4 32.3
77.0
54.0
34.5 50.4
24.4 37.8% SC enrolment% SC girls to SC enrolment% ST enrolment
45.9 45.7
42.7 54.3
11.2
44.5
12.8
46.7
Position of teachers by educational qualification (other than para teacher)
(Previous academic year)Incentives : Number of beneficiaries
% ST girls to ST enrolment
% Girls
Number of villages
% 0 - 6 population
% SC population % ST population
% Urban population
% Schools with blackboard
% Enrolment in single-teacher schools
% Enrolment in schools without building
Primary Upperprimary
OBC EnrolmentPrimary U. Primary
% OBCEnrolment% OBC girls toOBC Enrolment
Pupil-teacher ratio (PTR)Student-classroom ratio (SCR)% Schools with <= 50 students% Schools with PTR > 100% Female teachers
% Schools established since 1995
Regular teachers Para-teachers
% minorrepairs
% majorrepairs
# = not applicable na = not available * Some totals may not match due to no response in classificatory data items
2431
45.43527
22.26.4
62.834.4
39.52219
14.13.1
63.370.3
48.22331
10.25.1
44.062.7
48.43333
1.612.749.015.1
19.9 30.0 na 61.2 53.7
78587029.712.6
Category
PrivateGovt.PrivateGovtPrivateGovt.PrivateGovt.PrivateGovt.
Total population (in 000's)
Number of blocks/taluks
District
Decadal growth rate
Primary onlyPrimary with upper primaryPrimary with upper primary & sec/higher sec.Upper primary onlyUpper primary with sec./higher secondary
% Single classroom schools% Single teacher schools
P + UP P+sec/hs U.P. only UP+secP. only
No response in school category
Primary with upper primaryPrimary with U.P. & sec/higherUpper primary onlyUpper primary with sec./higher sec
Primary only
Primary onlyPrimary with upper primaryPrimary with Upper primary & sec/higherUpper primary only
Para-teachers
School category
Upper primary with sec./higher secondary
Primary onlyPrimary with upper prim.
P. onlyP + UPP+sec/hsU.P. onlyUP+sec
NER(U.Prim)GER(U.Prim)NER (Primary)GER (Primary)
Transition ratePrim. to U. Prim
SC/ST Enrolment
Indicators
Classrooms/Other rooms
Prim.with U.P.&Sec/H.SUpper Primary onlyU. Primary with Sec./H.S.
Basic Data, 2001
Data reported from
Performance indicators
95.3 35.593.9 36.966.6 30.672.7 34.8

418
Elementary Education in India - Where do we stand ?
Pu
nja
b
0.4100.261
56.0 40.5
Key data: Elementary Education
551
FARIDKOT
(Previous academic year)
(Previous year)
Gender and caste distribution of teachers*
No. of schools by type of building*
BoysWith disability
Flow rates
Primary Level
Enrolment*
Number of schools
Grade
GER / NER
School category
Primary Upper primaryBoys Boys GirlsGirls
IncentiveType
School categoryMultiple
TypeKuccha
PartiallyPucca
PuccaTotal % good condition
Otherrooms
TentNo
Building
Classrooms
Belowsecondary
Highersecondary
Postgraduate
M. Phil.GraduateSecondarySchool category OthersNo
response
ST teachers
Total Male Female No res Male Female No res Male Female Male FemaleSC teachers
Text booksUniformAttendanceStationery
% Passed
Avg. No. of Tchs.
%
Female literacyOverall literacy
dev. grant grantSchool T L M
Male Female
IVV
IIIIII
Grade R.R. D.O.R. P.R.
VIIVI
# #
I - V
Enrolment by medium of instructions
Examination results
Retention rate
GPI
Primary cycle U. primary cycleState
DISTRICT ELEMENTARY EDUCATION REPORT CARD : 2005-06
GirlsGrade
IIIIIIIVVVI
VIII
AllGirls
Total
VII
% TotalGrossness
School category
41
7972
22 137 0
00
6765
0 0 0
250 1219 47020 892
0 6,4810 12,4710 0
205 7 30,363 5023,450 108 2,424
16,121 0 6,2570 5,252 0
0 0 00 10,287 0
37,057 1,234 94135
71196
P + UP P+sec/hs U.P. only UP+sec
School categoryP. only
3.4 0.0 0.0 1.3 0.06.9
Number of Clusters 477238
% Schools with SCR > 600.0 0.0 1.3 0.0
4.6 0.0 0.0 1.3 5.6% Schools with pre-primary sections 38.9 65.4 76.3 3.8 0.0% Schools with common toilets 86.3 92.3 84.2 81.0 75.0
% Schools with girls toilets 75.6 84.6 94.7 79.7 86.1% Schools with drinking water facility 97.3 96.2 97.4 93.7 94.4
% Enrolment in Govt. schools 96.8 12.0 5.2 100.0 100.096.2 100.0 92.1 92.4 93.1
% No female teacher schools (tch>=2) 13.0 0.0 0.0 8.9 5.62.1 0.0 0.0 0.3 0.0
0.2 0.0 0.0 0.0 0.0%Enrolment in schools without blackboard 3.7 0.0 6.4 8.6 5.9
2001-02 2002-03 2003-04 2004-05 2005-06IIIIIIIVV
VIVII
Total U.P
10,65210,20010,63510,351
9,4829,391
8,432
12,69612,50012,28411,74111,185
10,6489,422
7,0086,9266,6826,3915,742
5,8804,911
26,85629,77415,096
50.9
37.3
92.0
72.1
96.0
76.4
38.4
2.62.6
4,6254,4394,8414,6884,3174,1933,7494,178
35,030
2823362746453636
277
1425171925282330
181
1,159
classrooms
223856245528
76.397.895.671.471.4
16.62.2
7.2
4.422.023.1
0.00.06.55.5
60184133293
376 257 1 0 0 2 226 0 0 0 0 038 0 0 0 0 079 0 0 0 0 071 0 0 0 1 0
174 203 130 250 156 1 26 8 35 107 67 0 0 0
15 30 41 249 180 2 2 2532 52 21 100 190 2 2 323 34 21 160 167 5 5 8
3 6 26 54 23 0 0 0
31850
131189176
173404210239
603 4 42 40 5 78 85 13 130938
0614
8324
0014
7162722
11231220
2337
7543
Terminalgrade Passed
VIII boysV girlsV boys
VIII girls
9 with >60%
86.91012231553406435
0.00.7
81.676.1
83.20.00.7
81.184.0
38217Punjabi English Hindi
299477006481
12471
29626
790300
45300
141000
% Schools recvd.
93.90.02.6
97.5100.0
95.00.00.0
100.0100.0
1277873
4336
50410
178430
1910281
2168357
82980
122821
3.98.9
14.65.16.0
10.211.010.8
9.9
8.76.1
15.6
4.59.4
75.6
0.81
2005-062004-052003-04
PUNJAB
73.6
Upper PrimaryPrimary
Sex ratio Sex ratio 0-6
2 30
VIII44.7
Enrolment of children
VIII 4,305 9,704 9,033Total Pr. 32,749 60,406 51,320
1 - 5 6 - 8
406 0435 0
0 0
17 536
%Teachers recvd.in-service training
Total schools* Rural schools* Total enrolment* Rural enrolment* Teachers*
20.7 30.8
76.1
52.9
40.0 73.4
25.8 51.4% SC enrolment% SC girls to SC enrolment% ST enrolment
46.7 45.3
44.0 48.2
7.8
45.5
10.5
49.8
Position of teachers by educational qualification (other than para teacher)
(Previous academic year)Incentives : Number of beneficiaries
% ST girls to ST enrolment
% Girls
Number of villages
% 0 - 6 population
% SC population % ST population
% Urban population
% Schools with blackboard
% Enrolment in single-teacher schools
% Enrolment in schools without building
Primary Upperprimary
OBC EnrolmentPrimary U. Primary
% OBCEnrolment% OBC girls toOBC Enrolment
Pupil-teacher ratio (PTR)Student-classroom ratio (SCR)% Schools with <= 50 students% Schools with PTR > 100% Female teachers
% Schools established since 1995
Regular teachers Para-teachers
% minorrepairs
% majorrepairs
# = not applicable na = not available * Some totals may not match due to no response in classificatory data items
20.3 69.514.5 74.514.5 74.813.6 76.519.8 75.616.5 74.117.5 73.814.1 79.8
2031
46.83833
16.41.1
63.56.5
38.11718
11.50.0
78.476.9
44.71626
12.70.0
52.275.9
49.62924
1.41.4
55.919.4
21.4 36.2 na 62.0 55.0
81288335.113.4
Category
PrivateGovt.PrivateGovtPrivateGovt.PrivateGovt.PrivateGovt.
Total population (in 000's)
Number of blocks/taluks
District
Decadal growth rate
Primary onlyPrimary with upper primaryPrimary with upper primary & sec/higher sec.Upper primary onlyUpper primary with sec./higher secondary
% Single classroom schools% Single teacher schools
P + UP P+sec/hs U.P. only UP+secP. only
No response in school category
Primary with upper primaryPrimary with U.P. & sec/higherUpper primary onlyUpper primary with sec./higher sec
Primary only
Primary onlyPrimary with upper primaryPrimary with Upper primary & sec/higherUpper primary only
Para-teachers
School category
Upper primary with sec./higher secondary
Primary onlyPrimary with upper prim.
P. onlyP + UPP+sec/hsU.P. onlyUP+sec
NER(U.Prim)GER(U.Prim)NER (Primary)GER (Primary)
Transition ratePrim. to U. Prim
SC/ST Enrolment
Indicators
Classrooms/Other rooms
Prim.with U.P.&Sec/H.SUpper Primary onlyU. Primary with Sec./H.S.
Basic Data, 2001
Data reported from
Performance indicators
94.7 28.095.9 29.070.0 30.972.9 34.8

419
Elementary Education: Report Card - FATEHGARH SAHIB
Pu
nja
b
0.1830.185
59.3 48.1
Key data: Elementary Education
538
FATEHGARH SAHIB
(Previous academic year)
(Previous year)
Gender and caste distribution of teachers*
No. of schools by type of building*
BoysWith disability
Flow rates
Primary Level
Enrolment*
Number of schools
Grade
GER / NER
School category
Primary Upper primaryBoys Boys GirlsGirls
IncentiveType
School categoryMultiple
TypeKuccha
PartiallyPucca
PuccaTotal % good condition
Otherrooms
TentNo
Building
Classrooms
Belowsecondary
Highersecondary
Postgraduate
M. Phil.GraduateSecondarySchool category OthersNo
response
ST teachers
Total Male Female No res Male Female No res Male Female Male FemaleSC teachers
Text booksUniformAttendanceStationery
% Passed
Avg. No. of Tchs.
%
Female literacyOverall literacy
dev. grant grantSchool T L M
Male Female
IVV
IIIIII
Grade R.R. D.O.R. P.R.
VIIVI
# #
I - V
Enrolment by medium of instructions
Examination results
Retention rate
GPI
Primary cycle U. primary cycleState
DISTRICT ELEMENTARY EDUCATION REPORT CARD : 2005-06
GirlsGrade
IIIIIIIVVVI
VIII
AllGirls
Total
VII
% TotalGrossness
School category
47163142
0 461 1200
3136
0 0 0
414 10 5,8911 1,6280 3,0100 4,5940 0
386 1 24,826 50 5,702 0
47 1,485 470 3,010 0
0 0 00 3,656 0
28,689 5 798240
10
P + UP P+sec/hs U.P. only UP+sec
School categoryP. only
5.8 0.0 5.9 0.0 2.433.0
Number of Clusters 552448
% Schools with SCR > 608.5 5.9 0.0 0.0
4.3 2.1 0.0 0.0 0.0% Schools with pre-primary sections 14.2 12.8 5.9 22.6 14.3% Schools with common toilets 73.0 72.3 35.3 80.6 66.7
% Schools with girls toilets 66.0 78.7 88.2 93.5 92.9% Schools with drinking water facility 97.3 97.9 100.0 100.0 97.6
% Enrolment in Govt. schools 100.0 100.0 97.2 100.0 100.083.1 87.2 35.3 77.4 50.0
% No female teacher schools (tch>=2) 12.3 4.3 0.0 6.5 7.121.2 6.1 2.8 0.0 0.0
0.0 0.0 0.0 0.0 0.0%Enrolment in schools without blackboard 9.4 4.0 26.6 21.8 20.6
2001-02 2002-03 2003-04 2004-05 2005-06IIIIIIIVV
VIVII
Total U.P
6,2925,7016,1936,4326,1424,594
3,858
6,9266,5407,0307,0497,443
6,0035,831
8,3667,8467,9318,1048,239
7,6506,621
13,10417,76720,299
64.8
51.7
55.0
44.4
58.9
38.2
45.9
52.90.0
2,8082,6542,7733,0392,9202,1701,8942,330
20,588
4337272329141325
211
15191915241415
9130
1,121
classrooms
20469
115219
63.962.382.664.362.6
28.933.8
7.2
8.730.423.3
3.98.75.2
14.2
691479
105
401 370 0 0 0 6 3945 0 0 0 0 2
9 0 0 0 0 831 0 0 0 0 025 0 0 0 1 16
174 107 119 194 145 4 133 25 23 66 83 5 0 216 5 15 25 41 0 0 015 24 11 57 57 3 1 416 23 24 93 138 1 2 27
4 3 5 13 10 0 0 0
316105
4378
130
1305990
167
433 24 14 11 1 116 107 5 9204
27
2022
1020
0000
277
1838
30152324
3120
12016
Terminalgrade Passed
VIII boysV girlsV boys
VIII girls
29 with >60%
72.1799240102176326
87.932.678.825.8
72.773.323.777.231.7
28554Punjabi Gujarati Hindi English
5891166930104585
770000
560609
70000
% Schools recvd.
91.195.752.9
100.061.9
84.393.641.296.859.5
89290
171146
247554
28912
132780
2680132
463946
34116
1.95.16.05.77.8
14.09.19.38.7
10.07.2
22.0
4.29.0
53.6
0.86
2005-062004-052003-04
PUNJAB
57.8
Upper PrimaryPrimary
Sex ratio Sex ratio 0-6
5 62
VIII29.4
Enrolment of children
VIII 6,028 5,933 4,652Total Pr. 40,486 34,988 30,760
1 - 5 6 - 8
176 0326 0
0 0
101 1
%Teachers recvd.in-service training
Total schools* Rural schools* Total enrolment* Rural enrolment* Teachers*
22.2 34.7
45.8
24.9
47.5 43.3
32.3 30.0% SC enrolment% SC girls to SC enrolment% ST enrolment
46.5 47.3
49.1 41.7
13.3
46.5
15.8
50.4
Position of teachers by educational qualification (other than para teacher)
(Previous academic year)Incentives : Number of beneficiaries
% ST girls to ST enrolment
% Girls
Number of villages
% 0 - 6 population
% SC population % ST population
% Urban population
% Schools with blackboard
% Enrolment in single-teacher schools
% Enrolment in schools without building
Primary Upperprimary
OBC EnrolmentPrimary U. Primary
% OBCEnrolment% OBC girls toOBC Enrolment
Pupil-teacher ratio (PTR)Student-classroom ratio (SCR)% Schools with <= 50 students% Schools with PTR > 100% Female teachers
% Schools established since 1995
Regular teachers Para-teachers
% minorrepairs
% majorrepairs
# = not applicable na = not available * Some totals may not match due to no response in classificatory data items
12.3 73.76.2 84.77.9 82.88.6 82.7
42.2 53.615.9 75.132.7 57.335.4 57.4
2416
46.53626
41.73.6
55.65.1
45.62529
8.54.3
54.619.1
46.01726
0.00.0
52.361.3
52.51421
40.50.0
51.211.9
18.6 30.7 na 73.6 68.3
76685428.112.3
Category
PrivateGovt.PrivateGovtPrivateGovt.PrivateGovt.PrivateGovt.
Total population (in 000's)
Number of blocks/taluks
District
Decadal growth rate
Primary onlyPrimary with upper primaryPrimary with upper primary & sec/higher sec.Upper primary onlyUpper primary with sec./higher secondary
% Single classroom schools% Single teacher schools
P + UP P+sec/hs U.P. only UP+secP. only
No response in school category
Primary with upper primaryPrimary with U.P. & sec/higherUpper primary onlyUpper primary with sec./higher sec
Primary only
Primary onlyPrimary with upper primaryPrimary with Upper primary & sec/higherUpper primary only
Para-teachers
School category
Upper primary with sec./higher secondary
Primary onlyPrimary with upper prim.
P. onlyP + UPP+sec/hsU.P. onlyUP+sec
NER(U.Prim)GER(U.Prim)NER (Primary)GER (Primary)
Transition ratePrim. to U. Prim
SC/ST Enrolment
Indicators
Classrooms/Other rooms
Prim.with U.P.&Sec/H.SUpper Primary onlyU. Primary with Sec./H.S.
Basic Data, 2001
Data reported from
Performance indicators
92.8 18.894.7 23.854.2 11.158.0 18.8
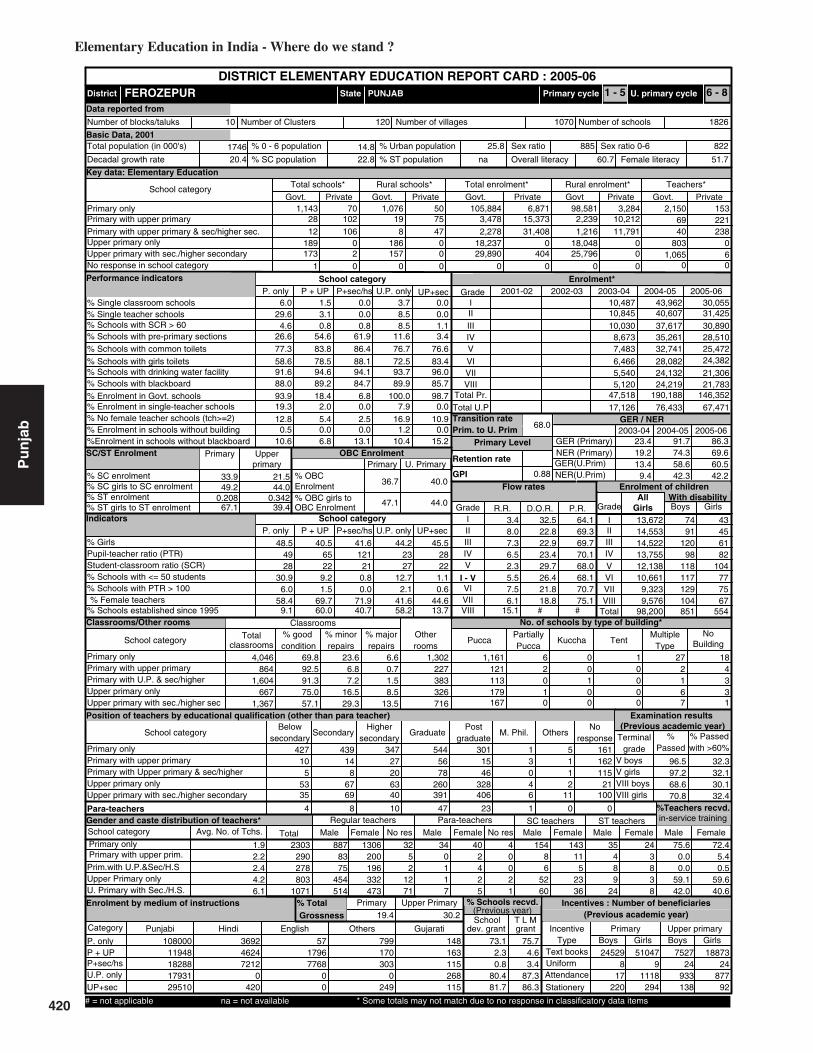
420
Elementary Education in India - Where do we stand ?
Pu
nja
b
0.3420.208
33.9 21.5
Key data: Elementary Education
1746
FEROZEPUR
(Previous academic year)
(Previous year)
Gender and caste distribution of teachers*
No. of schools by type of building*
BoysWith disability
Flow rates
Primary Level
Enrolment*
Number of schools
Grade
GER / NER
School category
Primary Upper primaryBoys Boys GirlsGirls
IncentiveType
School categoryMultiple
TypeKuccha
PartiallyPucca
PuccaTotal % good condition
Otherrooms
TentNo
Building
Classrooms
Belowsecondary
Highersecondary
Postgraduate
M. Phil.GraduateSecondarySchool category OthersNo
response
ST teachers
Total Male Female No res Male Female No res Male Female Male FemaleSC teachers
Text booksUniformAttendanceStationery
% Passed
Avg. No. of Tchs.
%
Female literacyOverall literacy
dev. grant grantSchool T L M
Male Female
IVV
IIIIII
Grade R.R. D.O.R. P.R.
VIIVI
# #
I - V
Enrolment by medium of instructions
Examination results
Retention rate
GPI
Primary cycle U. primary cycleState
DISTRICT ELEMENTARY EDUCATION REPORT CARD : 2005-06
GirlsGrade
IIIIIIIVVVI
VIII
AllGirls
Total
VII
% TotalGrossness
School category
2812
189173
102 19106 8
02
186157
1 0 0
1,143 7075 3,47847 2,278
0 18,2370 29,8900 0
1,076 50 98,581 3,28415,373 2,239 10,21231,408 1,216 11,791
0 18,048 0
0 0 0404 25,796 0
105,884 6,871 2,15069
153221
P + UP P+sec/hs U.P. only UP+sec
School categoryP. only
6.0 1.5 0.0 3.7 0.029.6
Number of Clusters 18261070
% Schools with SCR > 603.1 0.0 8.5 0.0
4.6 0.8 0.8 8.5 1.1% Schools with pre-primary sections 26.6 54.6 61.9 11.6 3.4% Schools with common toilets 77.3 83.8 86.4 76.7 76.6
% Schools with girls toilets 58.6 78.5 88.1 72.5 83.4% Schools with drinking water facility 91.6 94.6 94.1 93.7 96.0
% Enrolment in Govt. schools 93.9 18.4 6.8 100.0 98.788.0 89.2 84.7 89.9 85.7
% No female teacher schools (tch>=2) 12.8 5.4 2.5 16.9 10.919.3 2.0 0.0 7.9 0.0
0.5 0.0 0.0 1.2 0.0%Enrolment in schools without blackboard 10.6 6.8 13.1 10.4 15.2
2001-02 2002-03 2003-04 2004-05 2005-06IIIIIIIVV
VIVII
Total U.P
30,05531,42530,89028,51025,47224,382
21,306
43,96240,60737,61735,26132,741
28,08224,132
10,48710,84510,030
8,6737,483
6,4665,540
67,47176,43317,126
23.4
13.4
91.7
58.6
86.3
60.5
41.6
0.80.0
13,67214,55314,52213,75512,13810,661
9,3239,576
98,200
7491
12098
118117129104851
43456182
104777567
554
4,046
classrooms
8641,604
6671,367
69.892.591.375.057.1
23.66.8
6.6
7.216.529.3
0.71.58.5
13.5
227383326716
1,302 1,161 6 0 1 27 18121 2 0 0 2 4113 0 1 0 1 3179 1 0 0 6 3167 0 0 0 7 1
427 439 347 544 301 1 510 14 27 56 15 3 1 162
5 8 20 78 46 0 1 11553 67 63 260 328 4 2 2135 69 40 391 406 6 11 100
4 8 10 47 23 1 0 0
8878375
454514
200196332473
1306 32 34 40 4 154 143 35 2452
1271
0117
2425
0021
86
5260
115
2336
489
24
3838
Terminalgrade Passed
VIII boysV girlsV boys
VIII girls
161 with >60%
75.62303290278803
1071
0.00.0
59.142.0
72.45.40.5
59.640.6
108000Punjabi Hindi English Others Gujarati
11948182881793129510
369246247212
0420
5717967768
00
799170303
0249
148163115268115
% Schools recvd.
73.12.30.8
80.481.7
75.74.63.4
87.386.3
245298
17220
752724
933138
510479
1118294
1887324
87792
1.92.22.44.26.1
3.48.07.36.5
7.56.1
15.1
2.35.5
68.0
0.88
2005-062004-052003-04
PUNJAB
71.9
Upper PrimaryPrimary
Sex ratio Sex ratio 0-6
10 120
VIII40.7
Enrolment of children
VIII 5,120 24,219 21,783Total Pr. 47,518 190,188 146,352
1 - 5 6 - 8
803 01,065 6
0 0
40 238
%Teachers recvd.in-service training
Total schools* Rural schools* Total enrolment* Rural enrolment* Teachers*
19.4 30.2
69.6
42.2
19.2 74.3
9.4 42.3% SC enrolment% SC girls to SC enrolment% ST enrolment
49.2 44.0
67.1 39.4
36.7
47.1
40.0
44.0
Position of teachers by educational qualification (other than para teacher)
(Previous academic year)Incentives : Number of beneficiaries
% ST girls to ST enrolment
% Girls
Number of villages
% 0 - 6 population
% SC population % ST population
% Urban population
% Schools with blackboard
% Enrolment in single-teacher schools
% Enrolment in schools without building
Primary Upperprimary
OBC EnrolmentPrimary U. Primary
% OBCEnrolment% OBC girls toOBC Enrolment
Pupil-teacher ratio (PTR)Student-classroom ratio (SCR)% Schools with <= 50 students% Schools with PTR > 100% Female teachers
% Schools established since 1995
Regular teachers Para-teachers
% minorrepairs
% majorrepairs
# = not applicable na = not available * Some totals may not match due to no response in classificatory data items
32.5 64.122.8 69.322.9 69.723.4 70.129.7 68.026.4 68.121.8 70.718.8 75.1
21121
48.54928
30.96.0
58.49.1
40.56522
9.21.5
69.760.0
44.22327
12.72.1
41.658.2
45.52822
1.10.6
44.613.7
20.4 22.8 na 60.7 51.7
82288525.814.8
Category
PrivateGovt.PrivateGovtPrivateGovt.PrivateGovt.PrivateGovt.
Total population (in 000's)
Number of blocks/taluks
District
Decadal growth rate
Primary onlyPrimary with upper primaryPrimary with upper primary & sec/higher sec.Upper primary onlyUpper primary with sec./higher secondary
% Single classroom schools% Single teacher schools
P + UP P+sec/hs U.P. only UP+secP. only
No response in school category
Primary with upper primaryPrimary with U.P. & sec/higherUpper primary onlyUpper primary with sec./higher sec
Primary only
Primary onlyPrimary with upper primaryPrimary with Upper primary & sec/higherUpper primary only
Para-teachers
School category
Upper primary with sec./higher secondary
Primary onlyPrimary with upper prim.
P. onlyP + UPP+sec/hsU.P. onlyUP+sec
NER(U.Prim)GER(U.Prim)NER (Primary)GER (Primary)
Transition ratePrim. to U. Prim
SC/ST Enrolment
Indicators
Classrooms/Other rooms
Prim.with U.P.&Sec/H.SUpper Primary onlyU. Primary with Sec./H.S.
Basic Data, 2001
Data reported from
Performance indicators
96.5 32.397.2 32.168.6 30.170.8 32.4
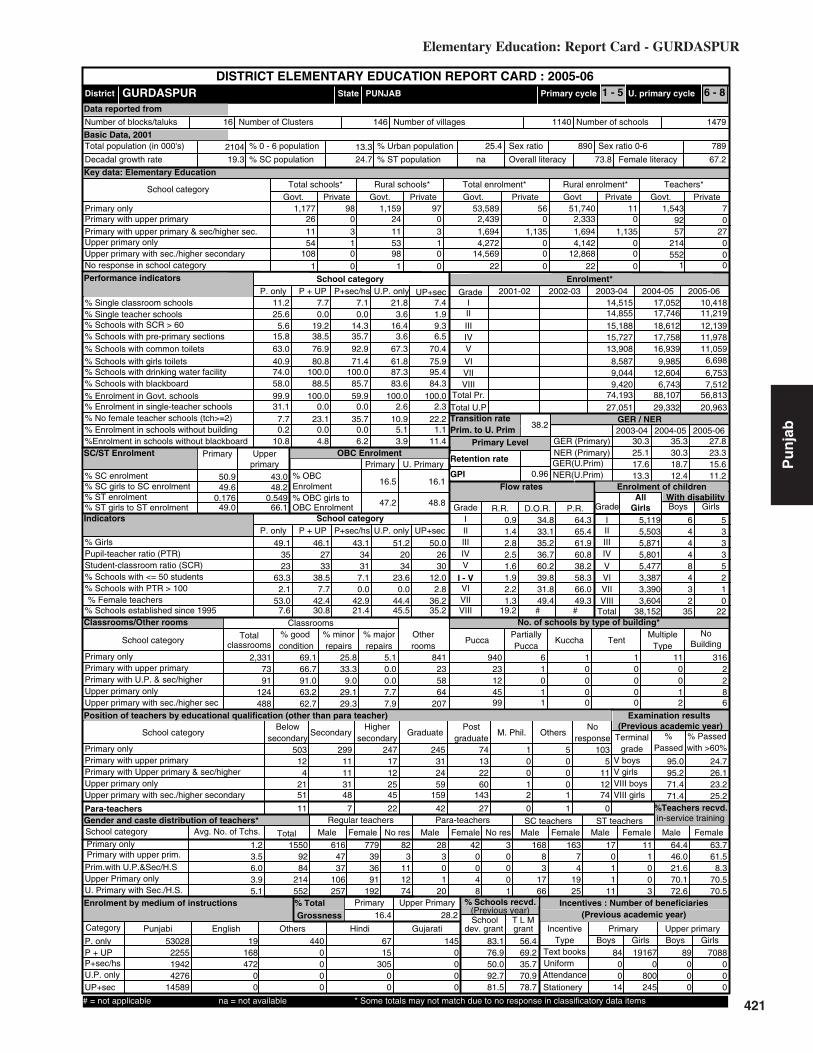
421
Elementary Education: Report Card - GURDASPUR
Pu
nja
b
0.5490.176
50.9 43.0
Key data: Elementary Education
2104
GURDASPUR
(Previous academic year)
(Previous year)
Gender and caste distribution of teachers*
No. of schools by type of building*
BoysWith disability
Flow rates
Primary Level
Enrolment*
Number of schools
Grade
GER / NER
School category
Primary Upper primaryBoys Boys GirlsGirls
IncentiveType
School categoryMultiple
TypeKuccha
PartiallyPucca
PuccaTotal % good condition
Otherrooms
TentNo
Building
Classrooms
Belowsecondary
Highersecondary
Postgraduate
M. Phil.GraduateSecondarySchool category OthersNo
response
ST teachers
Total Male Female No res Male Female No res Male Female Male FemaleSC teachers
Text booksUniformAttendanceStationery
% Passed
Avg. No. of Tchs.
%
Female literacyOverall literacy
dev. grant grantSchool T L M
Male Female
IVV
IIIIII
Grade R.R. D.O.R. P.R.
VIIVI
# #
I - V
Enrolment by medium of instructions
Examination results
Retention rate
GPI
Primary cycle U. primary cycleState
DISTRICT ELEMENTARY EDUCATION REPORT CARD : 2005-06
GirlsGrade
IIIIIIIVVVI
VIII
AllGirls
Total
VII
% TotalGrossness
School category
261154
108
0 243 1110
5398
1 0 1
1,177 980 2,4393 1,6941 4,2720 14,5690 22
1,159 97 51,740 110 2,333 0
1,135 1,694 1,1350 4,142 0
0 22 00 12,868 0
53,589 56 1,54392
70
P + UP P+sec/hs U.P. only UP+sec
School categoryP. only
11.2 7.7 7.1 21.8 7.425.6
Number of Clusters 14791140
% Schools with SCR > 600.0 0.0 3.6 1.9
5.6 19.2 14.3 16.4 9.3% Schools with pre-primary sections 15.8 38.5 35.7 3.6 6.5% Schools with common toilets 63.0 76.9 92.9 67.3 70.4
% Schools with girls toilets 40.9 80.8 71.4 61.8 75.9% Schools with drinking water facility 74.0 100.0 100.0 87.3 95.4
% Enrolment in Govt. schools 99.9 100.0 59.9 100.0 100.058.0 88.5 85.7 83.6 84.3
% No female teacher schools (tch>=2) 7.7 23.1 35.7 10.9 22.231.1 0.0 0.0 2.6 2.3
0.2 0.0 0.0 5.1 1.1%Enrolment in schools without blackboard 10.8 4.8 6.2 3.9 11.4
2001-02 2002-03 2003-04 2004-05 2005-06IIIIIIIVV
VIVII
Total U.P
10,41811,21912,13911,97811,059
6,698
6,753
17,05217,74618,61217,75816,939
9,98512,604
14,51514,85515,18815,72713,908
8,5879,044
20,96329,33227,051
30.3
17.6
35.3
18.7
27.8
15.6
43.1
7.10.0
5,1195,5035,8715,8015,4773,3873,3903,604
38,152
64448432
35
53335210
22
2,331
classrooms
7391
124488
69.166.791.063.262.7
25.833.3
5.1
9.029.129.3
0.00.07.77.9
235864
207
841 940 6 1 1 11 31623 1 0 0 0 212 0 0 0 0 245 1 0 0 1 899 1 0 0 2 6
503 299 247 245 74 1 512 11 17 31 13 0 0 5
4 11 12 24 22 0 0 1121 31 25 59 60 1 0 1251 48 45 159 143 2 1 74
11 7 22 42 27 0 1 0
6164737
106257
393691
192
779 82 28 42 3 168 163 17 113
111274
301
20
0048
0001
83
1766
74
1925
011
11
1003
Terminalgrade Passed
VIII boysV girlsV boys
VIII girls
103 with >60%
64.415509284
214552
46.021.670.172.6
63.761.5
8.370.570.5
53028Punjabi English Others Hindi Gujarati
225519424276
14589
19168472
00
4400000
6715
30500
1450000
% Schools recvd.
83.176.950.092.781.5
56.469.235.770.978.7
8400
14
89000
191670
800245
7088000
1.23.56.03.95.1
0.91.42.82.5
2.21.3
19.2
1.61.9
38.2
0.96
2005-062004-052003-04
PUNJAB
42.9
Upper PrimaryPrimary
Sex ratio Sex ratio 0-6
16 146
VIII21.4
Enrolment of children
VIII 9,420 6,743 7,512Total Pr. 74,193 88,107 56,813
1 - 5 6 - 8
214 0552 0
1 0
57 27
%Teachers recvd.in-service training
Total schools* Rural schools* Total enrolment* Rural enrolment* Teachers*
16.4 28.2
23.3
11.2
25.1 30.3
13.3 12.4% SC enrolment% SC girls to SC enrolment% ST enrolment
49.6 48.2
49.0 66.1
16.5
47.2
16.1
48.8
Position of teachers by educational qualification (other than para teacher)
(Previous academic year)Incentives : Number of beneficiaries
% ST girls to ST enrolment
% Girls
Number of villages
% 0 - 6 population
% SC population % ST population
% Urban population
% Schools with blackboard
% Enrolment in single-teacher schools
% Enrolment in schools without building
Primary Upperprimary
OBC EnrolmentPrimary U. Primary
% OBCEnrolment% OBC girls toOBC Enrolment
Pupil-teacher ratio (PTR)Student-classroom ratio (SCR)% Schools with <= 50 students% Schools with PTR > 100% Female teachers
% Schools established since 1995
Regular teachers Para-teachers
% minorrepairs
% majorrepairs
# = not applicable na = not available * Some totals may not match due to no response in classificatory data items
34.8 64.333.1 65.435.2 61.936.7 60.860.2 38.239.8 58.331.8 66.049.4 49.3
3134
49.13523
63.32.1
53.07.6
46.12733
38.57.7
42.430.8
51.22034
23.60.0
44.445.5
50.02630
12.02.8
36.235.2
19.3 24.7 na 73.8 67.2
78989025.413.3
Category
PrivateGovt.PrivateGovtPrivateGovt.PrivateGovt.PrivateGovt.
Total population (in 000's)
Number of blocks/taluks
District
Decadal growth rate
Primary onlyPrimary with upper primaryPrimary with upper primary & sec/higher sec.Upper primary onlyUpper primary with sec./higher secondary
% Single classroom schools% Single teacher schools
P + UP P+sec/hs U.P. only UP+secP. only
No response in school category
Primary with upper primaryPrimary with U.P. & sec/higherUpper primary onlyUpper primary with sec./higher sec
Primary only
Primary onlyPrimary with upper primaryPrimary with Upper primary & sec/higherUpper primary only
Para-teachers
School category
Upper primary with sec./higher secondary
Primary onlyPrimary with upper prim.
P. onlyP + UPP+sec/hsU.P. onlyUP+sec
NER(U.Prim)GER(U.Prim)NER (Primary)GER (Primary)
Transition ratePrim. to U. Prim
SC/ST Enrolment
Indicators
Classrooms/Other rooms
Prim.with U.P.&Sec/H.SUpper Primary onlyU. Primary with Sec./H.S.
Basic Data, 2001
Data reported from
Performance indicators
95.0 24.795.2 26.171.4 23.271.4 25.2

422
Elementary Education in India - Where do we stand ?
Pu
nja
b
0.6410.424
46.0 43.0
Key data: Elementary Education
1481
HOSHIARPUR
(Previous academic year)
(Previous year)
Gender and caste distribution of teachers*
No. of schools by type of building*
BoysWith disability
Flow rates
Primary Level
Enrolment*
Number of schools
Grade
GER / NER
School category
Primary Upper primaryBoys Boys GirlsGirls
IncentiveType
School categoryMultiple
TypeKuccha
PartiallyPucca
PuccaTotal % good condition
Otherrooms
TentNo
Building
Classrooms
Belowsecondary
Highersecondary
Postgraduate
M. Phil.GraduateSecondarySchool category OthersNo
response
ST teachers
Total Male Female No res Male Female No res Male Female Male FemaleSC teachers
Text booksUniformAttendanceStationery
% Passed
Avg. No. of Tchs.
%
Female literacyOverall literacy
dev. grant grantSchool T L M
Male Female
IVV
IIIIII
Grade R.R. D.O.R. P.R.
VIIVI
# #
I - V
Enrolment by medium of instructions
Examination results
Retention rate
GPI
Primary cycle U. primary cycleState
DISTRICT ELEMENTARY EDUCATION REPORT CARD : 2005-06
GirlsGrade
IIIIIIIVVVI
VIII
AllGirls
Total
VII
% TotalGrossness
School category
4236
176213
123 36108 26
210
174208
0 0 0
1,299 12498 5,17478 8,572
2 16,2015 41,8250 0
1,286 113 86,332 6,32314,403 3,841 11,48627,894 5,433 20,656
316 15,989 316
0 0 01,953 40,925 805
87,657 7,165 2,647301
564867
P + UP P+sec/hs U.P. only UP+sec
School categoryP. only
2.1 1.2 0.0 2.2 0.025.7
Number of Clusters 21331267
% Schools with SCR > 600.6 0.7 3.4 0.0
1.5 1.8 1.4 2.8 6.3% Schools with pre-primary sections 10.5 67.9 70.1 2.8 2.7% Schools with common toilets 88.8 79.4 83.3 52.8 60.5
% Schools with girls toilets 64.6 75.8 88.2 50.6 77.6% Schools with drinking water facility 96.4 98.2 98.6 94.4 98.7
% Enrolment in Govt. schools 92.4 26.4 23.5 98.1 95.595.1 92.7 89.6 93.3 92.8
% No female teacher schools (tch>=2) 9.1 0.6 0.0 10.1 8.117.0 0.3 0.7 2.3 0.0
0.3 0.0 1.2 2.5 0.0%Enrolment in schools without blackboard 5.2 4.5 12.1 6.2 8.2
2001-02 2002-03 2003-04 2004-05 2005-06IIIIIIIVV
VIVII
Total U.P
26,86324,94926,33026,48725,73424,849
24,737
26,22124,95825,44625,40424,688
23,63522,829
4,3684,7164,7284,8974,747
4,8924,531
80,79771,65614,108
13.8
13.2
73.4
66.0
90.7
85.5
38.6
2.80.7
11,79611,02911,58412,18911,89911,41911,52514,55695,997
5569699463475165
513
3745574141363352
342
4,414
classrooms
1,1551,908
5841,834
72.994.197.063.059.7
22.45.5
4.7
1.530.130.2
0.41.56.8
10.1
273470289928
1,376 1,377 8 4 0 21 13163 1 0 0 0 1140 1 0 0 1 2165 3 0 0 5 5207 4 0 0 11 1
324 1,135 641 659 288 2 823 134 278 463 210 2 2 3310 96 235 553 375 0 2 7643 219 63 332 248 2 1 465 261 115 906 655 8 5 156
10 21 36 70 39 0 1 0
983183357508
1224
945980403927
2111 13 38 66 0 374 469 33 601710
120
112
14
2219
313
0000
3986
133327
168185
86161
9152114
3220
79
Terminalgrade Passed
VIII boysV girlsV boys
VIII girls
50 with >60%
86.2321111681367
9172198
7.18.4
88.876.6
64.62.72.3
83.574.1
91504Punjabi English Hindi Others Gujarati
12073177251628743031
14523994
116511615
178735107090
107732
3600
1070
430000
% Schools recvd.
88.86.72.8
98.994.6
86.45.52.8
97.894.2
261714896
290
1411095
428136
4069648
6465361
26677159523173
2.37.19.55.29.9
6.35.96.05.2
7.56.7
34.0
2.05.1
93.5
0.81
2005-062004-052003-04
PUNJAB
73.1
Upper PrimaryPrimary
Sex ratio Sex ratio 0-6
10 165
VIII36.1
Enrolment of children
VIII 4,685 25,192 31,211Total Pr. 23,456 126,717 130,363
1 - 5 6 - 8
904 132,116 82
0 0
367 1,000
%Teachers recvd.in-service training
Total schools* Rural schools* Total enrolment* Rural enrolment* Teachers*
19.4 30.9
73.1
59.1
10.4 58.1
9.3 46.5% SC enrolment% SC girls to SC enrolment% ST enrolment
46.3 47.7
44.7 53.3
19.9
45.0
21.7
46.5
Position of teachers by educational qualification (other than para teacher)
(Previous academic year)Incentives : Number of beneficiaries
% ST girls to ST enrolment
% Girls
Number of villages
% 0 - 6 population
% SC population % ST population
% Urban population
% Schools with blackboard
% Enrolment in single-teacher schools
% Enrolment in schools without building
Primary Upperprimary
OBC EnrolmentPrimary U. Primary
% OBCEnrolment% OBC girls toOBC Enrolment
Pupil-teacher ratio (PTR)Student-classroom ratio (SCR)% Schools with <= 50 students% Schools with PTR > 100% Female teachers
% Schools established since 1995
Regular teachers Para-teachers
% minorrepairs
% majorrepairs
# = not applicable na = not available * Some totals may not match due to no response in classificatory data items
4.1 89.6
4.5 93.51927
46.63021
45.51.5
67.87.5
42.91717
18.20.0
82.857.6
48.81828
14.00.6
44.352.8
48.62024
0.90.4
42.813.5
13.8 34.3 na 81.0 75.3
81293519.712.4
Category
PrivateGovt.PrivateGovtPrivateGovt.PrivateGovt.PrivateGovt.
Total population (in 000's)
Number of blocks/taluks
District
Decadal growth rate
Primary onlyPrimary with upper primaryPrimary with upper primary & sec/higher sec.Upper primary onlyUpper primary with sec./higher secondary
% Single classroom schools% Single teacher schools
P + UP P+sec/hs U.P. only UP+secP. only
No response in school category
Primary with upper primaryPrimary with U.P. & sec/higherUpper primary onlyUpper primary with sec./higher sec
Primary only
Primary onlyPrimary with upper primaryPrimary with Upper primary & sec/higherUpper primary only
Para-teachers
School category
Upper primary with sec./higher secondary
Primary onlyPrimary with upper prim.
P. onlyP + UPP+sec/hsU.P. onlyUP+sec
NER(U.Prim)GER(U.Prim)NER (Primary)GER (Primary)
Transition ratePrim. to U. Prim
SC/ST Enrolment
Indicators
Classrooms/Other rooms
Prim.with U.P.&Sec/H.SUpper Primary onlyU. Primary with Sec./H.S.
Basic Data, 2001
Data reported from
Performance indicators
97.0 29.897.7 34.356.0 28.060.5 33.1

423
Elementary Education: Report Card - JALANDHAR
Pu
nja
b
0.0000.000
63.8 59.0
Key data: Elementary Education
1963
JALANDHAR
(Previous academic year)
(Previous year)
Gender and caste distribution of teachers*
No. of schools by type of building*
BoysWith disability
Flow rates
Primary Level
Enrolment*
Number of schools
Grade
GER / NER
School category
Primary Upper primaryBoys Boys GirlsGirls
IncentiveType
School categoryMultiple
TypeKuccha
PartiallyPucca
PuccaTotal % good condition
Otherrooms
TentNo
Building
Classrooms
Belowsecondary
Highersecondary
Postgraduate
M. Phil.GraduateSecondarySchool category OthersNo
response
ST teachers
Total Male Female No res Male Female No res Male Female Male FemaleSC teachers
Text booksUniformAttendanceStationery
% Passed
Avg. No. of Tchs.
%
Female literacyOverall literacy
dev. grant grantSchool T L M
Male Female
IVV
IIIIII
Grade R.R. D.O.R. P.R.
VIIVI
# #
I - V
Enrolment by medium of instructions
Examination results
Retention rate
GPI
Primary cycle U. primary cycleState
DISTRICT ELEMENTARY EDUCATION REPORT CARD : 2005-06
GirlsGrade
IIIIIIIVVVI
VIII
AllGirls
Total
VII
% TotalGrossness
School category
47
172257
8 133 0
518
143201
0 0 0
989 231 6245 5,6321 15,7528 45,2810 0
841 1 71,943 752,136 126 453
13,886 0 1,5661,250 12,966 193
0 0 04,261 33,886 1,562
90,758 6,386 2,31832
11876
P + UP P+sec/hs U.P. only UP+sec
School categoryP. only
3.9 0.0 0.0 4.0 0.719.4
Number of Clusters 1516948
% Schools with SCR > 600.0 0.0 5.6 1.1
3.2 0.0 2.5 5.6 6.2% Schools with pre-primary sections 27.7 25.0 27.5 4.5 1.8% Schools with common toilets 80.3 83.3 87.5 75.1 71.6
% Schools with girls toilets 54.7 75.0 87.5 72.9 82.2% Schools with drinking water facility 93.5 100.0 87.5 92.7 96.7
% Enrolment in Govt. schools 93.4 22.6 28.9 92.6 91.491.5 75.0 82.5 91.5 89.8
% No female teacher schools (tch>=2) 10.6 0.0 7.5 7.3 7.310.6 0.0 0.0 5.0 0.8
1.3 0.0 5.0 0.0 0.4%Enrolment in schools without blackboard 8.8 31.2 15.0 8.0 11.5
2001-02 2002-03 2003-04 2004-05 2005-06IIIIIIIVV
VIVII
Total U.P
20,84021,06023,06723,20121,57224,678
23,821
26,81225,75826,47526,49124,898
24,61423,072
17,01918,32219,27119,46117,782
19,59917,747
76,22672,08855,299
40.3
38.6
56.3
49.5
57.6
60.8
46.0
2.57.5
9,6129,525
10,53210,85610,60911,78011,85613,70088,470
4051575438616043
404
1724353422494462
287
3,556
classrooms
119630611
2,085
83.5100.0
98.688.178.6
12.70.0
3.9
1.410.017.3
0.00.02.04.2
28209373948
1,413 965 3 0 0 16 2811 0 0 0 0 134 0 0 0 0 6
171 3 0 1 2 0266 4 0 0 3 2
574 436 315 541 409 0 34 5 15 46 22 0 0 14
24 35 40 155 66 2 0 19580 127 73 240 239 4 5 30
108 202 118 614 470 9 4 65
9 5 37 62 43 0 0 0
6991777
293626
86311498964
1619 0 57 61 0 284 382 26 523
12970
1027
13
1312
0000
76
96192
1019
109219
016
11
24
1414
Terminalgrade Passed
VIII boysV girlsV boys
VIII girls
40 with >60%
90.12436108520813
1609
0.02.6
80.371.7
81.20.05.4
75.170.5
91090Punjabi Hindi English Others Gujarati
15575894
1653647355
5139872
7210466
1849
10594
55030
328
232237913
00
5830000
% Schools recvd.
91.50.07.5
93.285.5
91.60.05.0
95.589.1
3383287
2751380
18842216
84001128
41114173
5502438
29979459
23961179
2.49.0
13.04.65.9
5.16.97.56.8
11.29.1
27.3
1.25.5
88.0
0.87
2005-062004-052003-04
PUNJAB
60.4
Upper PrimaryPrimary
Sex ratio Sex ratio 0-6
10 147
VIII5.0
Enrolment of children
VIII 17,953 24,402 27,727Total Pr. 91,855 130,434 109,740
1 - 5 6 - 8
775 381,450 159
0 0
194 326
%Teachers recvd.in-service training
Total schools* Rural schools* Total enrolment* Rural enrolment* Teachers*
24.3 35.2
43.6
39.4
30.5 43.6
25.6 34.5% SC enrolment% SC girls to SC enrolment% ST enrolment
47.1 50.2
0.0 0.0
10.3
47.1
12.0
47.5
Position of teachers by educational qualification (other than para teacher)
(Previous academic year)Incentives : Number of beneficiaries
% ST girls to ST enrolment
% Girls
Number of villages
% 0 - 6 population
% SC population % ST population
% Urban population
% Schools with blackboard
% Enrolment in single-teacher schools
% Enrolment in schools without building
Primary Upperprimary
OBC EnrolmentPrimary U. Primary
% OBCEnrolment% OBC girls toOBC Enrolment
Pupil-teacher ratio (PTR)Student-classroom ratio (SCR)% Schools with <= 50 students% Schools with PTR > 100% Female teachers
% Schools established since 1995
Regular teachers Para-teachers
% minorrepairs
% majorrepairs
# = not applicable na = not available * Some totals may not match due to no response in classificatory data items
23.0 71.911.2 81.911.7 80.812.8 80.310.8 88.014.0 80.5
0.5 88.3
3138
46.84027
28.32.5
69.03.3
40.32623
8.30.0
80.68.3
49.92128
9.01.7
62.955.9
49.33124
0.41.8
60.76.9
18.4 37.7 na 78.0 73.1
80688747.511.7
Category
PrivateGovt.PrivateGovtPrivateGovt.PrivateGovt.PrivateGovt.
Total population (in 000's)
Number of blocks/taluks
District
Decadal growth rate
Primary onlyPrimary with upper primaryPrimary with upper primary & sec/higher sec.Upper primary onlyUpper primary with sec./higher secondary
% Single classroom schools% Single teacher schools
P + UP P+sec/hs U.P. only UP+secP. only
No response in school category
Primary with upper primaryPrimary with U.P. & sec/higherUpper primary onlyUpper primary with sec./higher sec
Primary only
Primary onlyPrimary with upper primaryPrimary with Upper primary & sec/higherUpper primary only
Para-teachers
School category
Upper primary with sec./higher secondary
Primary onlyPrimary with upper prim.
P. onlyP + UPP+sec/hsU.P. onlyUP+sec
NER(U.Prim)GER(U.Prim)NER (Primary)GER (Primary)
Transition ratePrim. to U. Prim
SC/ST Enrolment
Indicators
Classrooms/Other rooms
Prim.with U.P.&Sec/H.SUpper Primary onlyU. Primary with Sec./H.S.
Basic Data, 2001
Data reported from
Performance indicators
98.6 20.498.9 29.361.9 15.471.1 27.8
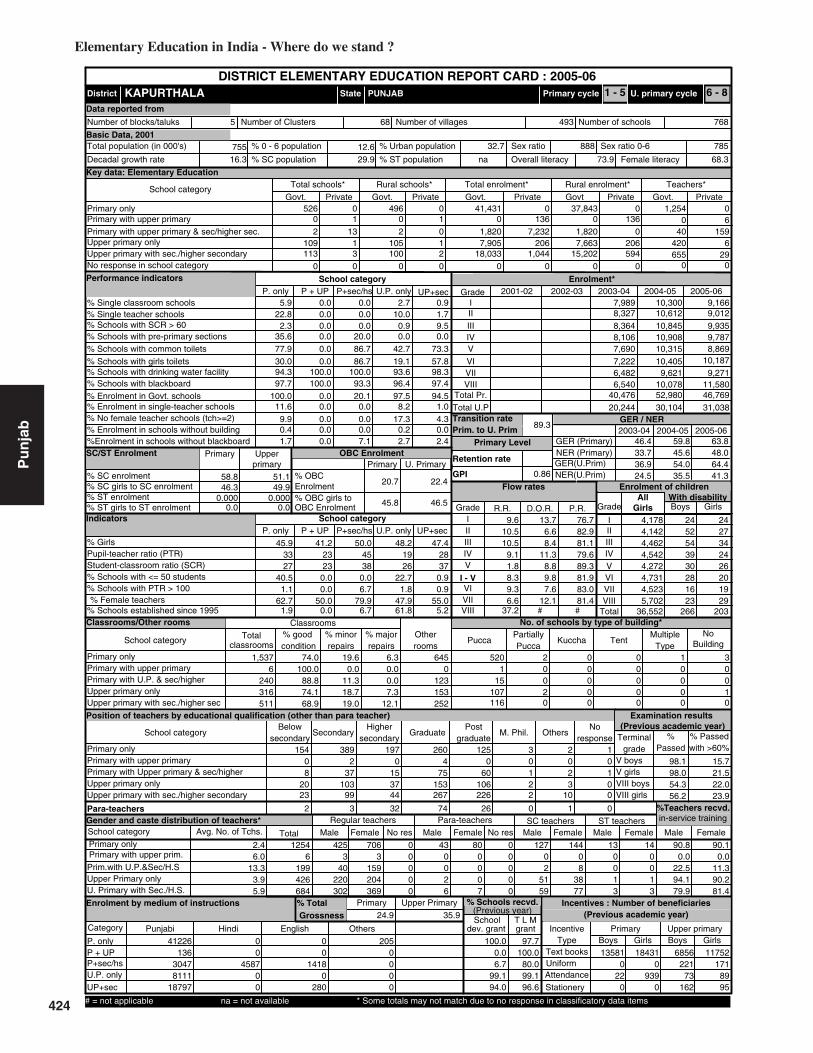
424
Elementary Education in India - Where do we stand ?
Pu
nja
b
0.0000.000
58.8 51.1
Key data: Elementary Education
755
KAPURTHALA
(Previous academic year)
(Previous year)
Gender and caste distribution of teachers*
No. of schools by type of building*
BoysWith disability
Flow rates
Primary Level
Enrolment*
Number of schools
Grade
GER / NER
School category
Primary Upper primaryBoys Boys GirlsGirls
IncentiveType
School categoryMultiple
TypeKuccha
PartiallyPucca
PuccaTotal % good condition
Otherrooms
TentNo
Building
Classrooms
Belowsecondary
Highersecondary
Postgraduate
M. Phil.GraduateSecondarySchool category OthersNo
response
ST teachers
Total Male Female No res Male Female No res Male Female Male FemaleSC teachers
Text booksUniformAttendanceStationery
% Passed
Avg. No. of Tchs.
%
Female literacyOverall literacy
dev. grant grantSchool T L M
Male Female
IVV
IIIIII
Grade R.R. D.O.R. P.R.
VIIVI
# #
I - V
Enrolment by medium of instructions
Examination results
Retention rate
GPI
Primary cycle U. primary cycleState
DISTRICT ELEMENTARY EDUCATION REPORT CARD : 2005-06
GirlsGrade
IIIIIIIVVVI
VIII
AllGirls
Total
VII
% TotalGrossness
School category
02
109113
1 013 2
13
105100
0 0 0
526 01 00 1,8201 7,9052 18,0330 0
496 0 37,843 0136 0 136
7,232 1,820 0206 7,663 206
0 0 01,044 15,202 594
41,431 0 1,2540
06
P + UP P+sec/hs U.P. only UP+sec
School categoryP. only
5.9 0.0 0.0 2.7 0.922.8
Number of Clusters 768493
% Schools with SCR > 600.0 0.0 10.0 1.7
2.3 0.0 0.0 0.9 9.5% Schools with pre-primary sections 35.6 0.0 20.0 0.0 0.0% Schools with common toilets 77.9 0.0 86.7 42.7 73.3
% Schools with girls toilets 30.0 0.0 86.7 19.1 57.8% Schools with drinking water facility 94.3 100.0 100.0 93.6 98.3
% Enrolment in Govt. schools 100.0 0.0 20.1 97.5 94.597.7 100.0 93.3 96.4 97.4
% No female teacher schools (tch>=2) 9.9 0.0 0.0 17.3 4.311.6 0.0 0.0 8.2 1.0
0.4 0.0 0.0 0.2 0.0%Enrolment in schools without blackboard 1.7 0.0 7.1 2.7 2.4
2001-02 2002-03 2003-04 2004-05 2005-06IIIIIIIVV
VIVII
Total U.P
9,1669,0129,9359,7878,869
10,187
9,271
10,30010,61210,84510,90810,315
10,4059,621
7,9898,3278,3648,1067,690
7,2226,482
31,03830,10420,244
46.4
36.9
59.8
54.0
63.8
64.4
50.0
0.06.7
4,1784,1424,4624,5424,2724,7314,5235,702
36,552
2452543930281623
266
2427342426201929
203
1,537
classrooms
6240316511
74.0100.0
88.874.168.9
19.60.0
6.3
11.318.719.0
0.00.07.3
12.1
0123153252
645 520 2 0 0 1 31 0 0 0 0 0
15 0 0 0 0 0107 2 0 0 0 1116 0 0 0 0 0
154 389 197 260 125 3 20 2 0 4 0 0 0 08 37 15 75 60 1 2 1
20 103 37 153 106 2 3 023 99 44 267 226 2 10 0
2 3 32 74 26 0 1 0
4253
40220302
3159204369
706 0 43 80 0 127 144 13 140000
0026
0007
0000
02
5159
08
3877
0013
0013
Terminalgrade Passed
VIII boysV girlsV boys
VIII girls
1 with >60%
90.812546
199426684
0.022.594.179.9
90.10.0
11.390.281.4
41226Punjabi Hindi English Others
13630478111
18797
00
458700
00
14180
280
2050000
% Schools recvd.
100.00.06.7
99.194.0
97.7100.0
80.099.196.6
135810
220
6856221
73162
184310
9390
11752171
8995
2.46.0
13.33.95.9
9.610.510.5
9.1
9.36.6
37.2
1.88.3
89.3
0.86
2005-062004-052003-04
PUNJAB
79.9
Upper PrimaryPrimary
Sex ratio Sex ratio 0-6
5 68
VIII6.7
Enrolment of children
VIII 6,540 10,078 11,580Total Pr. 40,476 52,980 46,769
1 - 5 6 - 8
420 6655 29
0 0
40 159
%Teachers recvd.in-service training
Total schools* Rural schools* Total enrolment* Rural enrolment* Teachers*
24.9 35.9
48.0
41.3
33.7 45.6
24.5 35.5% SC enrolment% SC girls to SC enrolment% ST enrolment
46.3 49.9
0.0 0.0
20.7
45.8
22.4
46.5
Position of teachers by educational qualification (other than para teacher)
(Previous academic year)Incentives : Number of beneficiaries
% ST girls to ST enrolment
% Girls
Number of villages
% 0 - 6 population
% SC population % ST population
% Urban population
% Schools with blackboard
% Enrolment in single-teacher schools
% Enrolment in schools without building
Primary Upperprimary
OBC EnrolmentPrimary U. Primary
% OBCEnrolment% OBC girls toOBC Enrolment
Pupil-teacher ratio (PTR)Student-classroom ratio (SCR)% Schools with <= 50 students% Schools with PTR > 100% Female teachers
% Schools established since 1995
Regular teachers Para-teachers
% minorrepairs
% majorrepairs
# = not applicable na = not available * Some totals may not match due to no response in classificatory data items
13.7 76.76.6 82.98.4 81.1
11.3 79.68.8 89.39.8 81.97.6 83.0
12.1 81.4
3845
45.93327
40.51.1
62.71.9
41.22323
0.00.0
50.00.0
48.21926
22.71.8
47.961.8
47.42837
0.90.9
55.05.2
16.3 29.9 na 73.9 68.3
78588832.712.6
Category
PrivateGovt.PrivateGovtPrivateGovt.PrivateGovt.PrivateGovt.
Total population (in 000's)
Number of blocks/taluks
District
Decadal growth rate
Primary onlyPrimary with upper primaryPrimary with upper primary & sec/higher sec.Upper primary onlyUpper primary with sec./higher secondary
% Single classroom schools% Single teacher schools
P + UP P+sec/hs U.P. only UP+secP. only
No response in school category
Primary with upper primaryPrimary with U.P. & sec/higherUpper primary onlyUpper primary with sec./higher sec
Primary only
Primary onlyPrimary with upper primaryPrimary with Upper primary & sec/higherUpper primary only
Para-teachers
School category
Upper primary with sec./higher secondary
Primary onlyPrimary with upper prim.
P. onlyP + UPP+sec/hsU.P. onlyUP+sec
NER(U.Prim)GER(U.Prim)NER (Primary)GER (Primary)
Transition ratePrim. to U. Prim
SC/ST Enrolment
Indicators
Classrooms/Other rooms
Prim.with U.P.&Sec/H.SUpper Primary onlyU. Primary with Sec./H.S.
Basic Data, 2001
Data reported from
Performance indicators
98.1 15.798.0 21.554.3 22.056.2 23.9

425
Elementary Education: Report Card - LUDHIANA
Pu
nja
b
0.0700.016
53.1 47.3
Key data: Elementary Education
3033
LUDHIANA
(Previous academic year)
(Previous year)
Gender and caste distribution of teachers*
No. of schools by type of building*
BoysWith disability
Flow rates
Primary Level
Enrolment*
Number of schools
Grade
GER / NER
School category
Primary Upper primaryBoys Boys GirlsGirls
IncentiveType
School categoryMultiple
TypeKuccha
PartiallyPucca
PuccaTotal % good condition
Otherrooms
TentNo
Building
Classrooms
Belowsecondary
Highersecondary
Postgraduate
M. Phil.GraduateSecondarySchool category OthersNo
response
ST teachers
Total Male Female No res Male Female No res Male Female Male FemaleSC teachers
Text booksUniformAttendanceStationery
% Passed
Avg. No. of Tchs.
%
Female literacyOverall literacy
dev. grant grantSchool T L M
Male Female
IVV
IIIIII
Grade R.R. D.O.R. P.R.
VIIVI
# #
I - V
Enrolment by medium of instructions
Examination results
Retention rate
GPI
Primary cycle U. primary cycleState
DISTRICT ELEMENTARY EDUCATION REPORT CARD : 2005-06
GirlsGrade
IIIIIIIVVVI
VIII
AllGirls
Total
VII
% TotalGrossness
School category
3130
172275
36 1768 10
22
160232
0 0 0
956 2914 4,62017 8,119
1 14,5331 45,1070 0
817 10 88,291 8124,923 2,074 1,555
20,710 1,868 3,747560 13,178 44
0 0 0722 35,047 137
109,871 3,189 2,658215
145280
P + UP P+sec/hs U.P. only UP+sec
School categoryP. only
4.7 4.5 11.2 2.9 1.420.5
Number of Clusters 1601909
% Schools with SCR > 604.5 1.0 4.6 1.1
5.1 7.5 13.3 3.4 2.5% Schools with pre-primary sections 15.6 53.7 56.1 5.7 2.9% Schools with common toilets 68.4 77.6 77.6 67.2 71.5
% Schools with girls toilets 66.1 73.1 82.7 74.7 83.8% Schools with drinking water facility 88.4 86.6 92.9 81.0 91.3
% Enrolment in Govt. schools 97.2 48.4 28.2 96.3 98.482.4 82.1 82.7 77.0 84.5
% No female teacher schools (tch>=2) 14.1 7.5 2.0 17.2 11.210.8 3.4 1.4 5.6 0.9
0.9 1.7 0.9 0.5 0.0%Enrolment in schools without blackboard 11.3 11.1 12.5 10.1 8.3
2001-02 2002-03 2003-04 2004-05 2005-06IIIIIIIVV
VIVII
Total U.P
29,34028,27429,28828,49525,96224,664
22,688
33,93733,11033,59732,01630,796
33,55428,338
4,3684,7164,7284,8974,747
4,8924,531
70,99590,64114,108
6.6
6.3
44.8
39.5
48.0
36.7
43.0
3.13.1
13,13712,73513,62413,15812,19911,25110,83911,30098,243
7181797160
1089388
651
684066443089
10289
528
3,713
classrooms
4031,087
5462,128
74.771.572.567.468.8
19.418.9
6.0
19.826.222.6
9.77.76.48.6
149286322
1,108
1,377 900 6 0 1 4 7458 0 0 0 1 892 0 0 0 3 3
149 0 0 0 2 23255 0 0 0 2 19
766 355 293 546 428 8 626 45 114 161 70 2 1 6383 64 176 287 186 0 4 4786 81 66 239 255 6 8 96
131 130 151 699 665 14 16 228
13 12 28 68 26 0 2 0
72162
132323691
374673423
1141
1756 252 39 32 3 207 371 20 51464291
202
112
610
1218
814
0005
61765
155
232578
175
044
28
415
728
Terminalgrade Passed
VIII boysV girlsV boys
VIII girls
327 with >60%
64.72803495877851
2063
17.50.7
64.750.9
49.82.60.9
55.745.5
110115Punjabi Hindi English Others Assamese
5936176111491844313
156530057902
083
552602
28630
937
1220
19552
335
19600
1230
% Schools recvd.
84.013.4
5.185.687.7
85.214.9
4.183.976.9
37686233245
1203
16369272
2166170
50717300
167571041
28841370
2247196
2.87.48.94.97.4
8.68.08.27.9
10.37.8
19.6
2.67.1
68.9
0.85
2005-062004-052003-04
PUNJAB
78.8
Upper PrimaryPrimary
Sex ratio Sex ratio 0-6
12 123
VIII42.9
Enrolment of children
VIII 4,685 28,749 23,643Total Pr. 23,456 163,456 141,359
1 - 5 6 - 8
834 172,041 22
0 0
235 642
%Teachers recvd.in-service training
Total schools* Rural schools* Total enrolment* Rural enrolment* Teachers*
23.5 31.4
36.7
25.2
5.0 34.7
4.4 27.7% SC enrolment% SC girls to SC enrolment% ST enrolment
46.8 47.9
26.1 60.0
10.9
46.7
12.2
47.7
Position of teachers by educational qualification (other than para teacher)
(Previous academic year)Incentives : Number of beneficiaries
% ST girls to ST enrolment
% Girls
Number of villages
% 0 - 6 population
% SC population % ST population
% Urban population
% Schools with blackboard
% Enrolment in single-teacher schools
% Enrolment in schools without building
Primary Upperprimary
OBC EnrolmentPrimary U. Primary
% OBCEnrolment% OBC girls toOBC Enrolment
Pupil-teacher ratio (PTR)Student-classroom ratio (SCR)% Schools with <= 50 students% Schools with PTR > 100% Female teachers
% Schools established since 1995
Regular teachers Para-teachers
% minorrepairs
% majorrepairs
# = not applicable na = not available * Some totals may not match due to no response in classificatory data items
15.9 75.611.9 80.114.5 77.313.5 78.628.5 68.916.7 76.228.7 61.028.6 63.6
2733
46.64030
24.84.4
63.89.7
42.91924
9.01.5
78.055.2
47.81828
21.82.9
50.655.7
47.72222
7.90.7
56.018.1
24.8 25.0 na 76.5 71.9
81782455.812.2
Category
PrivateGovt.PrivateGovtPrivateGovt.PrivateGovt.PrivateGovt.
Total population (in 000's)
Number of blocks/taluks
District
Decadal growth rate
Primary onlyPrimary with upper primaryPrimary with upper primary & sec/higher sec.Upper primary onlyUpper primary with sec./higher secondary
% Single classroom schools% Single teacher schools
P + UP P+sec/hs U.P. only UP+secP. only
No response in school category
Primary with upper primaryPrimary with U.P. & sec/higherUpper primary onlyUpper primary with sec./higher sec
Primary only
Primary onlyPrimary with upper primaryPrimary with Upper primary & sec/higherUpper primary only
Para-teachers
School category
Upper primary with sec./higher secondary
Primary onlyPrimary with upper prim.
P. onlyP + UPP+sec/hsU.P. onlyUP+sec
NER(U.Prim)GER(U.Prim)NER (Primary)GER (Primary)
Transition ratePrim. to U. Prim
SC/ST Enrolment
Indicators
Classrooms/Other rooms
Prim.with U.P.&Sec/H.SUpper Primary onlyU. Primary with Sec./H.S.
Basic Data, 2001
Data reported from
Performance indicators
94.8 28.395.1 31.765.5 21.958.7 27.8
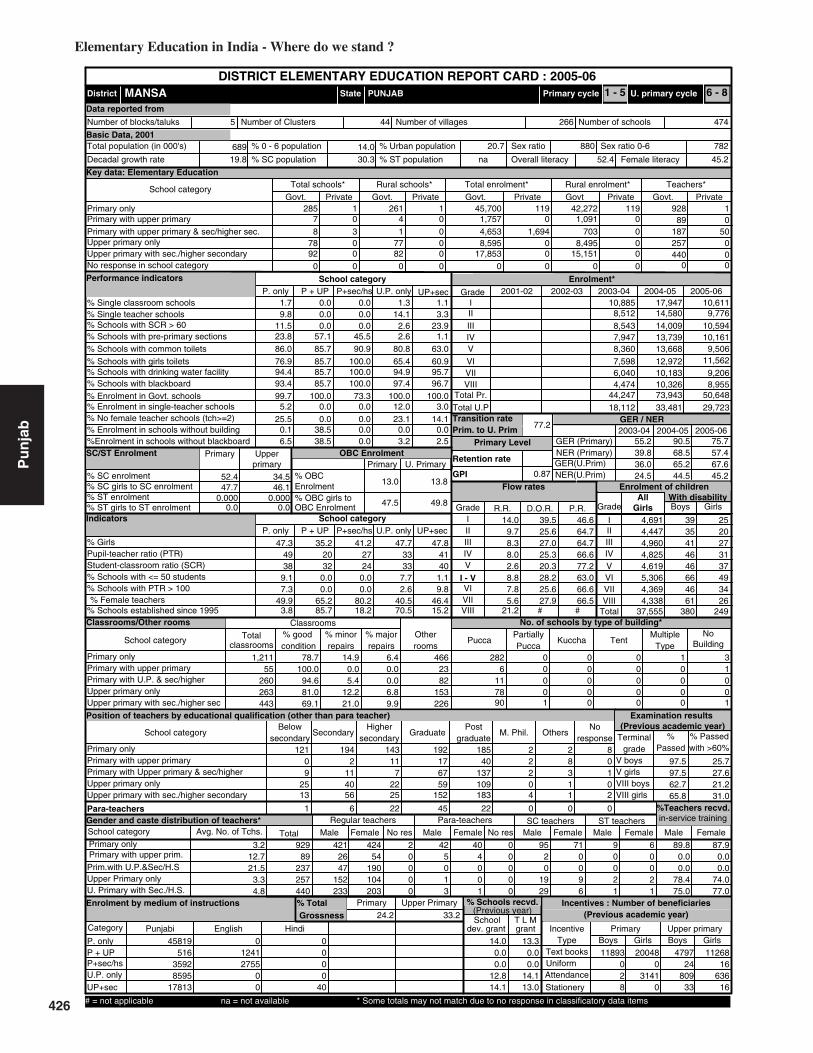
426
Elementary Education in India - Where do we stand ?
Pu
nja
b
0.0000.000
52.4 34.5
Key data: Elementary Education
689
MANSA
(Previous academic year)
(Previous year)
Gender and caste distribution of teachers*
No. of schools by type of building*
BoysWith disability
Flow rates
Primary Level
Enrolment*
Number of schools
Grade
GER / NER
School category
Primary Upper primaryBoys Boys GirlsGirls
IncentiveType
School categoryMultiple
TypeKuccha
PartiallyPucca
PuccaTotal % good condition
Otherrooms
TentNo
Building
Classrooms
Belowsecondary
Highersecondary
Postgraduate
M. Phil.GraduateSecondarySchool category OthersNo
response
ST teachers
Total Male Female No res Male Female No res Male Female Male FemaleSC teachers
Text booksUniformAttendanceStationery
% Passed
Avg. No. of Tchs.
%
Female literacyOverall literacy
dev. grant grantSchool T L M
Male Female
IVV
IIIIII
Grade R.R. D.O.R. P.R.
VIIVI
# #
I - V
Enrolment by medium of instructions
Examination results
Retention rate
GPI
Primary cycle U. primary cycleState
DISTRICT ELEMENTARY EDUCATION REPORT CARD : 2005-06
GirlsGrade
IIIIIIIVVVI
VIII
AllGirls
Total
VII
% TotalGrossness
School category
78
7892
0 43 100
7782
0 0 0
285 10 1,7570 4,6530 8,5950 17,8530 0
261 1 42,272 1190 1,091 0
1,694 703 00 8,495 0
0 0 00 15,151 0
45,700 119 92889
10
P + UP P+sec/hs U.P. only UP+sec
School categoryP. only
1.7 0.0 0.0 1.3 1.19.8
Number of Clusters 474266
% Schools with SCR > 600.0 0.0 14.1 3.3
11.5 0.0 0.0 2.6 23.9% Schools with pre-primary sections 23.8 57.1 45.5 2.6 1.1% Schools with common toilets 86.0 85.7 90.9 80.8 63.0
% Schools with girls toilets 76.9 85.7 100.0 65.4 60.9% Schools with drinking water facility 94.4 85.7 100.0 94.9 95.7
% Enrolment in Govt. schools 99.7 100.0 73.3 100.0 100.093.4 85.7 100.0 97.4 96.7
% No female teacher schools (tch>=2) 25.5 0.0 0.0 23.1 14.15.2 0.0 0.0 12.0 3.0
0.1 38.5 0.0 0.0 0.0%Enrolment in schools without blackboard 6.5 38.5 0.0 3.2 2.5
2001-02 2002-03 2003-04 2004-05 2005-06IIIIIIIVV
VIVII
Total U.P
10,6119,776
10,59410,161
9,50611,562
9,206
17,94714,58014,00913,73913,668
12,97210,183
10,8858,5128,5437,9478,360
7,5986,040
29,72333,48118,112
55.2
36.0
90.5
65.2
75.7
67.6
41.2
0.00.0
4,6914,4474,9604,8254,6195,3064,3694,338
37,555
3935414646664661
380
2520273137493426
249
1,211
classrooms
55260263443
78.7100.0
94.681.069.1
14.90.0
6.4
5.412.221.0
0.00.06.89.9
2382
153226
466 282 0 0 0 1 36 0 0 0 0 1
11 0 0 0 0 078 0 0 0 0 090 1 0 0 0 1
121 194 143 192 185 2 20 2 11 17 40 2 8 09 11 7 67 137 2 3 1
25 40 22 59 109 0 1 013 56 25 152 183 4 1 2
1 6 22 45 22 0 0 0
4212647
152233
54190104203
424 2 42 40 0 95 71 9 60000
5013
4001
0000
20
1929
0096
0021
0021
Terminalgrade Passed
VIII boysV girlsV boys
VIII girls
8 with >60%
89.892989
237257440
0.00.0
78.475.0
87.90.00.0
74.077.0
45819Punjabi English Hindi
51635928595
17813
012412755
00
0000
40
% Schools recvd.
14.00.00.0
12.814.1
13.30.00.0
14.113.0
11893028
479724
80933
200480
31410
1126816
63616
3.212.721.5
3.34.8
14.09.78.38.0
7.85.6
21.2
2.68.8
77.2
0.87
2005-062004-052003-04
PUNJAB
80.2
Upper PrimaryPrimary
Sex ratio Sex ratio 0-6
5 44
VIII18.2
Enrolment of children
VIII 4,474 10,326 8,955Total Pr. 44,247 73,943 50,648
1 - 5 6 - 8
257 0440 0
0 0
187 50
%Teachers recvd.in-service training
Total schools* Rural schools* Total enrolment* Rural enrolment* Teachers*
24.2 33.2
57.4
45.2
39.8 68.5
24.5 44.5% SC enrolment% SC girls to SC enrolment% ST enrolment
47.7 46.1
0.0 0.0
13.0
47.5
13.8
49.8
Position of teachers by educational qualification (other than para teacher)
(Previous academic year)Incentives : Number of beneficiaries
% ST girls to ST enrolment
% Girls
Number of villages
% 0 - 6 population
% SC population % ST population
% Urban population
% Schools with blackboard
% Enrolment in single-teacher schools
% Enrolment in schools without building
Primary Upperprimary
OBC EnrolmentPrimary U. Primary
% OBCEnrolment% OBC girls toOBC Enrolment
Pupil-teacher ratio (PTR)Student-classroom ratio (SCR)% Schools with <= 50 students% Schools with PTR > 100% Female teachers
% Schools established since 1995
Regular teachers Para-teachers
% minorrepairs
% majorrepairs
# = not applicable na = not available * Some totals may not match due to no response in classificatory data items
39.5 46.625.6 64.727.0 64.725.3 66.620.3 77.228.2 63.025.6 66.627.9 66.5
2427
47.34938
9.17.3
49.93.8
35.22032
0.00.0
65.285.7
47.73333
7.72.6
40.570.5
47.84140
1.19.8
46.415.2
19.8 30.3 na 52.4 45.2
78288020.714.0
Category
PrivateGovt.PrivateGovtPrivateGovt.PrivateGovt.PrivateGovt.
Total population (in 000's)
Number of blocks/taluks
District
Decadal growth rate
Primary onlyPrimary with upper primaryPrimary with upper primary & sec/higher sec.Upper primary onlyUpper primary with sec./higher secondary
% Single classroom schools% Single teacher schools
P + UP P+sec/hs U.P. only UP+secP. only
No response in school category
Primary with upper primaryPrimary with U.P. & sec/higherUpper primary onlyUpper primary with sec./higher sec
Primary only
Primary onlyPrimary with upper primaryPrimary with Upper primary & sec/higherUpper primary only
Para-teachers
School category
Upper primary with sec./higher secondary
Primary onlyPrimary with upper prim.
P. onlyP + UPP+sec/hsU.P. onlyUP+sec
NER(U.Prim)GER(U.Prim)NER (Primary)GER (Primary)
Transition ratePrim. to U. Prim
SC/ST Enrolment
Indicators
Classrooms/Other rooms
Prim.with U.P.&Sec/H.SUpper Primary onlyU. Primary with Sec./H.S.
Basic Data, 2001
Data reported from
Performance indicators
97.5 25.797.5 27.662.7 21.265.8 31.0
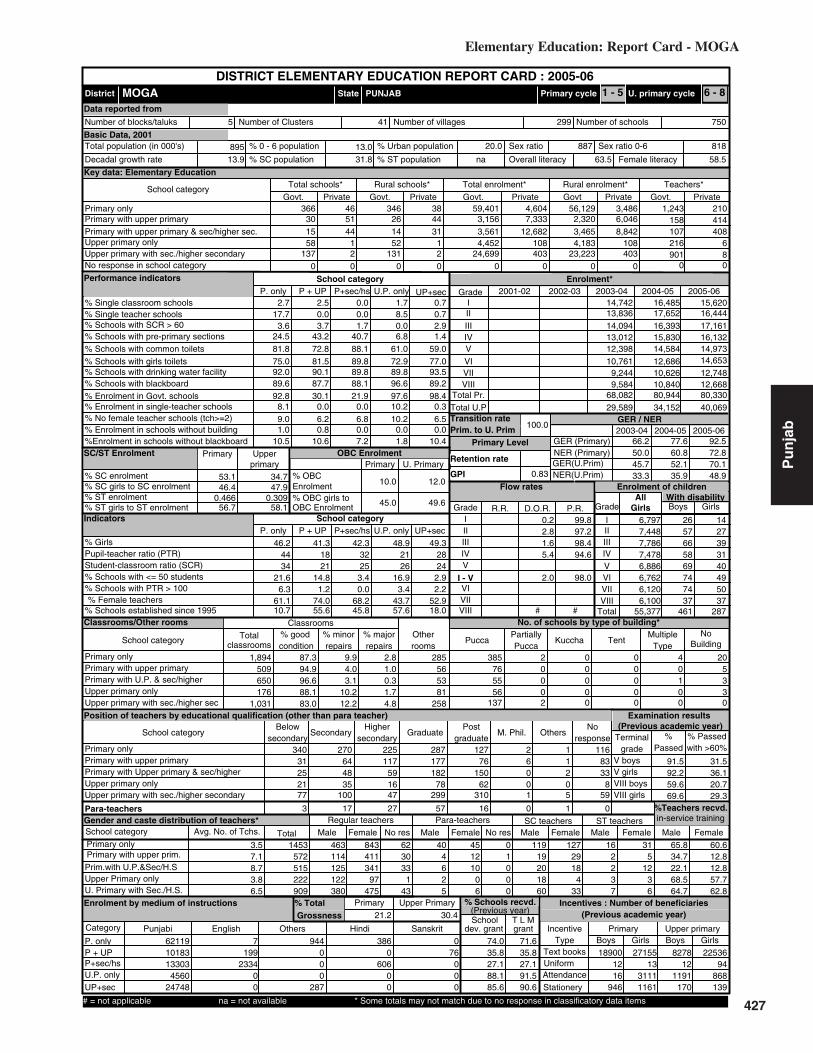
427
Elementary Education: Report Card - MOGA
Pu
nja
b
0.3090.466
53.1 34.7
Key data: Elementary Education
895
MOGA
(Previous academic year)
(Previous year)
Gender and caste distribution of teachers*
No. of schools by type of building*
BoysWith disability
Flow rates
Primary Level
Enrolment*
Number of schools
Grade
GER / NER
School category
Primary Upper primaryBoys Boys GirlsGirls
IncentiveType
School categoryMultiple
TypeKuccha
PartiallyPucca
PuccaTotal % good condition
Otherrooms
TentNo
Building
Classrooms
Belowsecondary
Highersecondary
Postgraduate
M. Phil.GraduateSecondarySchool category OthersNo
response
ST teachers
Total Male Female No res Male Female No res Male Female Male FemaleSC teachers
Text booksUniformAttendanceStationery
% Passed
Avg. No. of Tchs.
%
Female literacyOverall literacy
dev. grant grantSchool T L M
Male Female
IVV
IIIIII
Grade R.R. D.O.R. P.R.
VIIVI
# #
I - V
Enrolment by medium of instructions
Examination results
Retention rate
GPI
Primary cycle U. primary cycleState
DISTRICT ELEMENTARY EDUCATION REPORT CARD : 2005-06
GirlsGrade
IIIIIIIVVVI
VIII
AllGirls
Total
VII
% TotalGrossness
School category
301558
137
51 2644 14
12
52131
0 0 0
366 4644 3,15631 3,561
1 4,4522 24,6990 0
346 38 56,129 3,4867,333 2,320 6,046
12,682 3,465 8,842108 4,183 108
0 0 0403 23,223 403
59,401 4,604 1,243158
210414
P + UP P+sec/hs U.P. only UP+sec
School categoryP. only
2.7 2.5 0.0 1.7 0.717.7
Number of Clusters 750299
% Schools with SCR > 600.0 0.0 8.5 0.7
3.6 3.7 1.7 0.0 2.9% Schools with pre-primary sections 24.5 43.2 40.7 6.8 1.4% Schools with common toilets 81.8 72.8 88.1 61.0 59.0
% Schools with girls toilets 75.0 81.5 89.8 72.9 77.0% Schools with drinking water facility 92.0 90.1 89.8 89.8 93.5
% Enrolment in Govt. schools 92.8 30.1 21.9 97.6 98.489.6 87.7 88.1 96.6 89.2
% No female teacher schools (tch>=2) 9.0 6.2 6.8 10.2 6.58.1 0.0 0.0 10.2 0.3
1.0 0.8 0.0 0.0 0.0%Enrolment in schools without blackboard 10.5 10.6 7.2 1.8 10.4
2001-02 2002-03 2003-04 2004-05 2005-06IIIIIIIVV
VIVII
Total U.P
15,62016,44417,16116,13214,97314,653
12,748
16,48517,65216,39315,83014,584
12,68610,626
14,74213,83614,09413,01212,398
10,7619,244
40,06934,15229,589
66.2
45.7
77.6
52.1
92.5
70.1
42.3
3.40.0
6,7977,4487,7867,4786,8866,7626,1206,100
55,377
2657665869747437
461
1427393140495037
287
1,894
classrooms
509650176
1,031
87.394.996.688.183.0
9.94.0
2.8
3.110.212.2
1.00.31.74.8
565381
258
285 385 2 0 0 4 2076 0 0 0 0 555 0 0 0 1 356 0 0 0 0 3
137 2 0 0 0 0
340 270 225 287 127 2 131 64 117 177 76 6 1 8325 48 59 182 150 0 2 3321 35 16 78 62 0 0 877 100 47 299 310 1 5 59
3 17 27 57 16 0 1 0
463114125122380
411341
97475
843 62 40 45 0 119 127 16 313033
143
4625
1210
06
1000
19201860
2918
433
2237
512
36
Terminalgrade Passed
VIII boysV girlsV boys
VIII girls
116 with >60%
65.81453572515222909
34.722.168.564.7
60.612.812.857.762.8
62119Punjabi English Others Hindi Sanskrit
1018313303
456024748
7199
233400
944000
287
3860
60600
076
000
% Schools recvd.
74.035.827.188.185.6
71.635.827.191.590.6
189001216
946
827812
1191170
2715513
31111161
2253694
868139
3.57.18.73.86.5
100.0
0.83
2005-062004-052003-04
PUNJAB
68.2
Upper PrimaryPrimary
Sex ratio Sex ratio 0-6
5 41
VIII45.8
Enrolment of children
VIII 9,584 10,840 12,668Total Pr. 68,082 80,944 80,330
1 - 5 6 - 8
216 6901 8
0 0
107 408
%Teachers recvd.in-service training
Total schools* Rural schools* Total enrolment* Rural enrolment* Teachers*
21.2 30.4
72.8
48.9
50.0 60.8
33.3 35.9% SC enrolment% SC girls to SC enrolment% ST enrolment
46.4 47.9
56.7 58.1
10.0
45.0
12.0
49.6
Position of teachers by educational qualification (other than para teacher)
(Previous academic year)Incentives : Number of beneficiaries
% ST girls to ST enrolment
% Girls
Number of villages
% 0 - 6 population
% SC population % ST population
% Urban population
% Schools with blackboard
% Enrolment in single-teacher schools
% Enrolment in schools without building
Primary Upperprimary
OBC EnrolmentPrimary U. Primary
% OBCEnrolment% OBC girls toOBC Enrolment
Pupil-teacher ratio (PTR)Student-classroom ratio (SCR)% Schools with <= 50 students% Schools with PTR > 100% Female teachers
% Schools established since 1995
Regular teachers Para-teachers
% minorrepairs
% majorrepairs
# = not applicable na = not available * Some totals may not match due to no response in classificatory data items
0.2 99.82.8 97.21.6 98.45.4 94.6
2.0 98.02532
46.24434
21.66.3
61.110.7
41.31821
14.81.2
74.055.6
48.92126
16.93.4
43.757.6
49.32824
2.92.2
52.918.0
13.9 31.8 na 63.5 58.5
81888720.013.0
Category
PrivateGovt.PrivateGovtPrivateGovt.PrivateGovt.PrivateGovt.
Total population (in 000's)
Number of blocks/taluks
District
Decadal growth rate
Primary onlyPrimary with upper primaryPrimary with upper primary & sec/higher sec.Upper primary onlyUpper primary with sec./higher secondary
% Single classroom schools% Single teacher schools
P + UP P+sec/hs U.P. only UP+secP. only
No response in school category
Primary with upper primaryPrimary with U.P. & sec/higherUpper primary onlyUpper primary with sec./higher sec
Primary only
Primary onlyPrimary with upper primaryPrimary with Upper primary & sec/higherUpper primary only
Para-teachers
School category
Upper primary with sec./higher secondary
Primary onlyPrimary with upper prim.
P. onlyP + UPP+sec/hsU.P. onlyUP+sec
NER(U.Prim)GER(U.Prim)NER (Primary)GER (Primary)
Transition ratePrim. to U. Prim
SC/ST Enrolment
Indicators
Classrooms/Other rooms
Prim.with U.P.&Sec/H.SUpper Primary onlyU. Primary with Sec./H.S.
Basic Data, 2001
Data reported from
Performance indicators
91.5 31.592.2 36.159.6 20.769.6 29.3

428
Elementary Education in India - Where do we stand ?
Pu
nja
b
0.0000.066
64.0 42.9
Key data: Elementary Education
777
MUKTSAR
(Previous academic year)
(Previous year)
Gender and caste distribution of teachers*
No. of schools by type of building*
BoysWith disability
Flow rates
Primary Level
Enrolment*
Number of schools
Grade
GER / NER
School category
Primary Upper primaryBoys Boys GirlsGirls
IncentiveType
School categoryMultiple
TypeKuccha
PartiallyPucca
PuccaTotal % good condition
Otherrooms
TentNo
Building
Classrooms
Belowsecondary
Highersecondary
Postgraduate
M. Phil.GraduateSecondarySchool category OthersNo
response
ST teachers
Total Male Female No res Male Female No res Male Female Male FemaleSC teachers
Text booksUniformAttendanceStationery
% Passed
Avg. No. of Tchs.
%
Female literacyOverall literacy
dev. grant grantSchool T L M
Male Female
IVV
IIIIII
Grade R.R. D.O.R. P.R.
VIIVI
# #
I - V
Enrolment by medium of instructions
Examination results
Retention rate
GPI
Primary cycle U. primary cycleState
DISTRICT ELEMENTARY EDUCATION REPORT CARD : 2005-06
GirlsGrade
IIIIIIIVVVI
VIII
AllGirls
Total
VII
% TotalGrossness
School category
22
73130
37 116 2
01
71118
0 0 0
320 1822 171
6 3630 4,8080 19,5450 0
293 11 44,645 8227,444 36 3,0734,009 363 895
0 4,677 0
0 0 0137 16,385 0
48,873 1,706 1,08311
78300
P + UP P+sec/hs U.P. only UP+sec
School categoryP. only
3.3 0.0 0.0 1.4 0.810.4
Number of Clusters 599296
% Schools with SCR > 600.0 0.0 8.2 0.0
9.5 0.0 0.0 0.0 3.1% Schools with pre-primary sections 39.1 66.7 72.2 9.6 2.3% Schools with common toilets 87.6 84.6 94.4 79.5 81.7
% Schools with girls toilets 84.3 92.3 100.0 80.8 85.5% Schools with drinking water facility 97.9 100.0 100.0 98.6 100.0
% Enrolment in Govt. schools 96.6 2.2 8.3 100.0 99.394.4 92.3 94.4 93.2 97.7
% No female teacher schools (tch>=2) 12.1 5.1 0.0 17.8 14.55.4 0.0 0.0 4.0 0.0
0.0 0.0 0.0 0.0 0.0%Enrolment in schools without blackboard 3.7 7.8 8.5 4.7 1.9
2001-02 2002-03 2003-04 2004-05 2005-06IIIIIIIVV
VIVII
Total U.P
12,38211,47412,18311,33710,40611,302
7,464
12,06913,25612,85511,42112,022
8,1149,743
12,84612,15510,766
8,7508,571
8,0336,244
29,27426,63719,904
58.8
35.1
67.0
46.1
76.5
59.0
38.9
0.00.0
5,4965,2425,9395,5444,8695,1583,4284,830
40,506
3147535942525162
397
1531323643342440
255
1,431
classrooms
380195235731
68.892.497.970.264.0
23.07.4
8.2
2.126.027.4
0.30.03.88.6
8571
143407
498 331 3 0 0 2 238 1 0 0 0 018 0 0 0 0 072 1 0 0 0 0
130 0 0 0 1 0
197 270 164 290 136 2 07 32 63 114 83 0 0 57 9 11 89 81 1 1 0
27 40 27 105 100 5 2 1030 82 37 290 286 4 1 12
5 6 23 45 16 0 0 0
3857366
188375
226133118354
674 31 30 41 0 112 102 0 450
1013
0006
7218
0000
166
3548
164
1029
1001
1000
Terminalgrade Passed
VIII boysV girlsV boys
VIII girls
31 with >60%
75.41161311201317756
2.74.5
79.382.7
76.60.0
10.482.469.6
50440Punjabi English Hindi
594117014808
19668
140792
264000
0882
310
14
% Schools recvd.
88.52.6
11.197.396.9
87.32.65.6
93.296.2
1173110
34952
48239
468754
160906
468868
92744
282054
3.48.0
11.24.35.8
12.615.415.714.4
6.07.6
21.3
12.714.2
90.0
0.88
2005-062004-052003-04
PUNJAB
67.2
Upper PrimaryPrimary
Sex ratio Sex ratio 0-6
4 38
VIII50.0
Enrolment of children
VIII 5,627 8,780 10,508Total Pr. 53,088 61,623 57,782
1 - 5 6 - 8
317 0750 6
0 0
15 186
%Teachers recvd.in-service training
Total schools* Rural schools* Total enrolment* Rural enrolment* Teachers*
20.1 30.4
61.1
41.1
47.3 53.9
25.5 32.1% SC enrolment% SC girls to SC enrolment% ST enrolment
48.4 44.5
47.4 0.0
8.8
47.7
14.5
49.9
Position of teachers by educational qualification (other than para teacher)
(Previous academic year)Incentives : Number of beneficiaries
% ST girls to ST enrolment
% Girls
Number of villages
% 0 - 6 population
% SC population % ST population
% Urban population
% Schools with blackboard
% Enrolment in single-teacher schools
% Enrolment in schools without building
Primary Upperprimary
OBC EnrolmentPrimary U. Primary
% OBCEnrolment% OBC girls toOBC Enrolment
Pupil-teacher ratio (PTR)Student-classroom ratio (SCR)% Schools with <= 50 students% Schools with PTR > 100% Female teachers
% Schools established since 1995
Regular teachers Para-teachers
% minorrepairs
% majorrepairs
# = not applicable na = not available * Some totals may not match due to no response in classificatory data items
9.2 78.28.0 76.78.9 75.47.8 77.7
6.3 79.511.2 82.9
3.7 88.7
2222
48.34435
13.34.1
61.67.7
37.02420
15.40.0
74.969.2
48.21520
31.50.0
37.572.6
47.02627
2.30.0
47.920.6
18.7 37.8 na 58.2 50.3
81189125.513.5
Category
PrivateGovt.PrivateGovtPrivateGovt.PrivateGovt.PrivateGovt.
Total population (in 000's)
Number of blocks/taluks
District
Decadal growth rate
Primary onlyPrimary with upper primaryPrimary with upper primary & sec/higher sec.Upper primary onlyUpper primary with sec./higher secondary
% Single classroom schools% Single teacher schools
P + UP P+sec/hs U.P. only UP+secP. only
No response in school category
Primary with upper primaryPrimary with U.P. & sec/higherUpper primary onlyUpper primary with sec./higher sec
Primary only
Primary onlyPrimary with upper primaryPrimary with Upper primary & sec/higherUpper primary only
Para-teachers
School category
Upper primary with sec./higher secondary
Primary onlyPrimary with upper prim.
P. onlyP + UPP+sec/hsU.P. onlyUP+sec
NER(U.Prim)GER(U.Prim)NER (Primary)GER (Primary)
Transition ratePrim. to U. Prim
SC/ST Enrolment
Indicators
Classrooms/Other rooms
Prim.with U.P.&Sec/H.SUpper Primary onlyU. Primary with Sec./H.S.
Basic Data, 2001
Data reported from
Performance indicators
86.6 30.887.2 31.164.7 32.868.0 33.1

429
Elementary Education: Report Card - NAWANSHAHR
Pu
nja
b
0.1590.171
63.1 58.8
Key data: Elementary Education
587
NAWANSHAHR
(Previous academic year)
(Previous year)
Gender and caste distribution of teachers*
No. of schools by type of building*
BoysWith disability
Flow rates
Primary Level
Enrolment*
Number of schools
Grade
GER / NER
School category
Primary Upper primaryBoys Boys GirlsGirls
IncentiveType
School categoryMultiple
TypeKuccha
PartiallyPucca
PuccaTotal % good condition
Otherrooms
TentNo
Building
Classrooms
Belowsecondary
Highersecondary
Postgraduate
M. Phil.GraduateSecondarySchool category OthersNo
response
ST teachers
Total Male Female No res Male Female No res Male Female Male FemaleSC teachers
Text booksUniformAttendanceStationery
% Passed
Avg. No. of Tchs.
%
Female literacyOverall literacy
dev. grant grantSchool T L M
Male Female
IVV
IIIIII
Grade R.R. D.O.R. P.R.
VIIVI
# #
I - V
Enrolment by medium of instructions
Examination results
Retention rate
GPI
Primary cycle U. primary cycleState
DISTRICT ELEMENTARY EDUCATION REPORT CARD : 2005-06
GirlsGrade
IIIIIIIVVVI
VIII
AllGirls
Total
VII
% TotalGrossness
School category
00
90101
1 06 01
108994
0 0 0
441 11 01 01 7,3086 16,9510 0
428 0 32,142 0127 0 127
2,011 0 326104 7,186 104
0 0 01,697 15,675 770
33,705 157 9950
710
P + UP P+sec/hs U.P. only UP+sec
School categoryP. only
2.5 0.0 0.0 2.2 0.018.1
Number of Clusters 651438
% Schools with SCR > 600.0 0.0 11.0 0.9
0.7 0.0 0.0 1.1 0.9% Schools with pre-primary sections 36.9 100.0 16.7 7.7 1.8% Schools with common toilets 87.3 100.0 83.3 58.2 75.7
% Schools with girls toilets 75.3 100.0 100.0 65.9 88.3% Schools with drinking water facility 98.0 100.0 100.0 95.6 99.1
% Enrolment in Govt. schools 99.5 0.0 0.0 98.6 90.997.5 100.0 100.0 98.9 99.1
% No female teacher schools (tch>=2) 16.1 0.0 0.0 20.9 9.912.2 0.0 0.0 8.2 0.7
0.0 0.0 0.0 0.0 0.0%Enrolment in schools without blackboard 2.4 0.0 0.0 0.9 0.8
2001-02 2002-03 2003-04 2004-05 2005-06IIIIIIIVV
VIVII
Total U.P
6,4076,5207,1927,7217,1619,041
8,746
6,8927,1487,9677,8347,778
9,6648,426
6,1427,0716,9307,2787,446
7,5666,581
27,05926,86120,635
52.0
48.9
55.5
63.0
61.4
72.2
51.5
0.00.0
2,9302,8893,3053,5553,4564,2494,3454,856
29,585
1623282221211712
160
1018121316101326
118
1,487
classrooms
989
288939
80.6100.0
86.587.880.4
15.10.0
4.4
13.59.0
13.7
0.00.03.15.9
633
165550
618 438 1 0 0 2 11 0 0 0 0 06 0 0 0 0 0
91 0 0 0 0 0108 0 0 0 3 0
45 323 144 241 152 2 10 3 4 0 3 0 0 00 7 0 17 15 0 0 08 86 41 125 89 1 0 0
10 100 39 260 187 7 0 0
2 3 34 45 22 0 0 0
42727
218348
832
132255
481 0 40 54 0 213 179 10 190000
0013
0008
0000
00
90120
00
2966
0004
0020
Terminalgrade Passed
VIII boysV girlsV boys
VIII girls
0 with >60%
82.410021039
351614
0.00.0
74.471.5
72.10.00.0
69.758.9
33779Punjabi Hindi Gujarati
127766
737818561
00
12450
87
8300
340
% Schools recvd.
99.80.00.0
98.990.1
56.60.00.0
70.358.6
1124850
81
688825
11113
1504937
2805137
1193667
8794
2.310.0
6.53.95.5
5.96.47.47.6
13.910.429.0
1.85.8
99.0
0.86
2005-062004-052003-04
PUNJAB
82.1
Upper PrimaryPrimary
Sex ratio Sex ratio 0-6
5 58
VIII16.7
Enrolment of children
VIII 6,488 8,771 9,272Total Pr. 34,867 37,619 35,001
1 - 5 6 - 8
347 4551 63
0 0
0 39
%Teachers recvd.in-service training
Total schools* Rural schools* Total enrolment* Rural enrolment* Teachers*
22.1 34.3
47.8
47.4
40.1 44.2
33.5 43.0% SC enrolment% SC girls to SC enrolment% ST enrolment
45.8 50.5
43.3 48.8
15.4
47.4
16.2
49.7
Position of teachers by educational qualification (other than para teacher)
(Previous academic year)Incentives : Number of beneficiaries
% ST girls to ST enrolment
% Girls
Number of villages
% 0 - 6 population
% SC population % ST population
% Urban population
% Schools with blackboard
% Enrolment in single-teacher schools
% Enrolment in schools without building
Primary Upperprimary
OBC EnrolmentPrimary U. Primary
% OBCEnrolment% OBC girls toOBC Enrolment
Pupil-teacher ratio (PTR)Student-classroom ratio (SCR)% Schools with <= 50 students% Schools with PTR > 100% Female teachers
% Schools established since 1995
Regular teachers Para-teachers
% minorrepairs
% majorrepairs
# = not applicable na = not available * Some totals may not match due to no response in classificatory data items
6.1 88.01.3 92.33.1 89.52.8 89.7
2.5 91.84.7 81.49.7 79.8
2352
46.23423
32.81.4
53.40.7
36.21314
0.00.0
80.00.0
50.32126
22.01.1
37.654.9
49.03020
0.90.9
42.88.1
10.4 40.5 na 76.4 69.5
80891413.812.2
Category
PrivateGovt.PrivateGovtPrivateGovt.PrivateGovt.PrivateGovt.
Total population (in 000's)
Number of blocks/taluks
District
Decadal growth rate
Primary onlyPrimary with upper primaryPrimary with upper primary & sec/higher sec.Upper primary onlyUpper primary with sec./higher secondary
% Single classroom schools% Single teacher schools
P + UP P+sec/hs U.P. only UP+secP. only
No response in school category
Primary with upper primaryPrimary with U.P. & sec/higherUpper primary onlyUpper primary with sec./higher sec
Primary only
Primary onlyPrimary with upper primaryPrimary with Upper primary & sec/higherUpper primary only
Para-teachers
School category
Upper primary with sec./higher secondary
Primary onlyPrimary with upper prim.
P. onlyP + UPP+sec/hsU.P. onlyUP+sec
NER(U.Prim)GER(U.Prim)NER (Primary)GER (Primary)
Transition ratePrim. to U. Prim
SC/ST Enrolment
Indicators
Classrooms/Other rooms
Prim.with U.P.&Sec/H.SUpper Primary onlyU. Primary with Sec./H.S.
Basic Data, 2001
Data reported from
Performance indicators
98.7 16.598.9 24.562.2 18.467.2 23.6

430
Elementary Education in India - Where do we stand ?
Pu
nja
b
0.4130.014
42.3 32.6
Key data: Elementary Education
1845
PATIALA
(Previous academic year)
(Previous year)
Gender and caste distribution of teachers*
No. of schools by type of building*
BoysWith disability
Flow rates
Primary Level
Enrolment*
Number of schools
Grade
GER / NER
School category
Primary Upper primaryBoys Boys GirlsGirls
IncentiveType
School categoryMultiple
TypeKuccha
PartiallyPucca
PuccaTotal % good condition
Otherrooms
TentNo
Building
Classrooms
Belowsecondary
Highersecondary
Postgraduate
M. Phil.GraduateSecondarySchool category OthersNo
response
ST teachers
Total Male Female No res Male Female No res Male Female Male FemaleSC teachers
Text booksUniformAttendanceStationery
% Passed
Avg. No. of Tchs.
%
Female literacyOverall literacy
dev. grant grantSchool T L M
Male Female
IVV
IIIIII
Grade R.R. D.O.R. P.R.
VIIVI
# #
I - V
Enrolment by medium of instructions
Examination results
Retention rate
GPI
Primary cycle U. primary cycleState
DISTRICT ELEMENTARY EDUCATION REPORT CARD : 2005-06
GirlsGrade
IIIIIIIVVVI
VIII
AllGirls
Total
VII
% TotalGrossness
School category
3556
157204
5 2723 31
02
153180
0 0 0
1,098 11 4,0861 21,0910 16,3060 42,2370 0
993 1 85,190 201,362 2,492 57
10,680 6,039 1410 15,814 0
0 0 0383 35,405 0
95,837 20 2,290176
235
P + UP P+sec/hs U.P. only UP+sec
School categoryP. only
5.5 5.0 0.0 2.5 1.028.3
Number of Clusters 15811080
% Schools with SCR > 602.5 0.0 4.5 0.0
3.5 2.5 2.5 2.5 7.8% Schools with pre-primary sections 14.7 67.5 49.4 3.2 1.0% Schools with common toilets 83.3 85.0 93.7 79.6 84.0
% Schools with girls toilets 72.6 82.5 98.7 79.0 85.9% Schools with drinking water facility 93.7 95.0 96.2 96.2 97.1
% Enrolment in Govt. schools 100.0 75.0 66.4 100.0 99.194.8 100.0 94.9 91.7 94.2
% No female teacher schools (tch>=2) 8.9 2.5 2.5 9.6 6.318.2 0.5 0.0 2.3 0.0
0.3 0.0 0.0 0.5 0.8%Enrolment in schools without blackboard 4.9 0.0 6.3 8.4 5.6
2001-02 2002-03 2003-04 2004-05 2005-06IIIIIIIVV
VIVII
Total U.P
23,87723,38824,48723,83022,61326,491
22,887
23,41723,32123,14222,60122,866
24,72521,266
5,7965,5755,4205,2465,545
6,5535,612
73,80767,12417,553
12.8
13.0
52.6
48.7
66.0
62.7
43.4
5.17.6
10,61110,65011,34811,30310,74712,16410,99211,63089,445
6751837563636647
515
3945352737566866
373
3,482
classrooms
2861,142
5251,362
75.589.997.474.173.1
19.28.4
5.3
2.620.819.0
1.70.05.17.9
62348299698
1,278 1,081 6 0 1 4 738 0 0 0 0 279 0 0 0 0 0
154 1 0 0 1 1202 0 0 0 3 1
211 649 331 502 453 17 412 22 42 79 55 1 0 0
9 68 92 254 268 12 3 5941 98 63 219 355 24 0 447 129 89 406 607 31 5 4
4 7 23 36 47 1 1 0
71430
149355496
181592447821
1467 16 41 54 0 158 182 10 110
2421
0006
008
10
0000
25
7778
8125479
0041
3555
Terminalgrade Passed
VIII boysV girlsV boys
VIII girls
30 with >60%
91.32292211765812
1334
0.08.7
83.984.7
88.47.77.6
79.383.4
95206Punjabi English Hindi Gujarati
3310115881630642275
539710
140630
191
013646120
0154
11264
000
% Schools recvd.
92.70.06.3
94.393.7
81.00.06.3
79.082.0
2146743
0215
1034647
15431
4118657
1856286
2558552
12628
2.15.39.75.26.5
13.410.710.3
9.3
13.19.9
26.7
6.110.0
100.0
0.86
2005-062004-052003-04
PUNJAB
77.4
Upper PrimaryPrimary
Sex ratio Sex ratio 0-6
9 132
VIII36.7
Enrolment of children
VIII 5,388 21,133 24,429Total Pr. 27,582 115,347 118,195
1 - 5 6 - 8
812 01,325 9
0 0
502 263
%Teachers recvd.in-service training
Total schools* Rural schools* Total enrolment* Rural enrolment* Teachers*
20.8 31.7
52.2
42.8
9.8 41.2
9.3 32.3% SC enrolment% SC girls to SC enrolment% ST enrolment
47.1 46.9
35.3 35.4
23.1
46.6
23.7
47.5
Position of teachers by educational qualification (other than para teacher)
(Previous academic year)Incentives : Number of beneficiaries
% ST girls to ST enrolment
% Girls
Number of villages
% 0 - 6 population
% SC population % ST population
% Urban population
% Schools with blackboard
% Enrolment in single-teacher schools
% Enrolment in schools without building
Primary Upperprimary
OBC EnrolmentPrimary U. Primary
% OBCEnrolment% OBC girls toOBC Enrolment
Pupil-teacher ratio (PTR)Student-classroom ratio (SCR)% Schools with <= 50 students% Schools with PTR > 100% Female teachers
% Schools established since 1995
Regular teachers Para-teachers
% minorrepairs
% majorrepairs
# = not applicable na = not available * Some totals may not match due to no response in classificatory data items
2.8 84.11.8 88.3
2842
47.14228
29.64.1
66.42.5
43.02619
22.50.0
85.860.0
47.72031
7.00.0
56.054.8
47.93231
1.50.5
62.314.6
20.3 23.1 na 69.8 62.9
77786834.913.0
Category
PrivateGovt.PrivateGovtPrivateGovt.PrivateGovt.PrivateGovt.
Total population (in 000's)
Number of blocks/taluks
District
Decadal growth rate
Primary onlyPrimary with upper primaryPrimary with upper primary & sec/higher sec.Upper primary onlyUpper primary with sec./higher secondary
% Single classroom schools% Single teacher schools
P + UP P+sec/hs U.P. only UP+secP. only
No response in school category
Primary with upper primaryPrimary with U.P. & sec/higherUpper primary onlyUpper primary with sec./higher sec
Primary only
Primary onlyPrimary with upper primaryPrimary with Upper primary & sec/higherUpper primary only
Para-teachers
School category
Upper primary with sec./higher secondary
Primary onlyPrimary with upper prim.
P. onlyP + UPP+sec/hsU.P. onlyUP+sec
NER(U.Prim)GER(U.Prim)NER (Primary)GER (Primary)
Transition ratePrim. to U. Prim
SC/ST Enrolment
Indicators
Classrooms/Other rooms
Prim.with U.P.&Sec/H.SUpper Primary onlyU. Primary with Sec./H.S.
Basic Data, 2001
Data reported from
Performance indicators
92.0 22.693.4 25.163.0 20.067.1 26.5

431
Elementary Education: Report Card - ROPAR
Pu
nja
b
0.5760.356
41.9 31.8
Key data: Elementary Education
1116
ROPAR
(Previous academic year)
(Previous year)
Gender and caste distribution of teachers*
No. of schools by type of building*
BoysWith disability
Flow rates
Primary Level
Enrolment*
Number of schools
Grade
GER / NER
School category
Primary Upper primaryBoys Boys GirlsGirls
IncentiveType
School categoryMultiple
TypeKuccha
PartiallyPucca
PuccaTotal % good condition
Otherrooms
TentNo
Building
Classrooms
Belowsecondary
Highersecondary
Postgraduate
M. Phil.GraduateSecondarySchool category OthersNo
response
ST teachers
Total Male Female No res Male Female No res Male Female Male FemaleSC teachers
Text booksUniformAttendanceStationery
% Passed
Avg. No. of Tchs.
%
Female literacyOverall literacy
dev. grant grantSchool T L M
Male Female
IVV
IIIIII
Grade R.R. D.O.R. P.R.
VIIVI
# #
I - V
Enrolment by medium of instructions
Examination results
Retention rate
GPI
Primary cycle U. primary cycleState
DISTRICT ELEMENTARY EDUCATION REPORT CARD : 2005-06
GirlsGrade
IIIIIIIVVVI
VIII
AllGirls
Total
VII
% TotalGrossness
School category
04
109147
4 015 0
17
106136
0 0 0
863 40 03 2,1950 10,4443 28,5830 0
822 2 53,489 1702,223 0 06,632 0 1,189
512 10,119 0
0 0 01,627 26,008 558
58,432 366 1,6490
2023
P + UP P+sec/hs U.P. only UP+sec
School categoryP. only
10.8 0.0 0.0 2.7 0.634.1
Number of Clusters 1154814
% Schools with SCR > 600.0 5.3 1.8 1.3
4.0 0.0 26.3 3.6 12.3% Schools with pre-primary sections 12.7 0.0 36.8 8.2 3.2% Schools with common toilets 82.4 100.0 100.0 67.3 70.1
% Schools with girls toilets 55.2 100.0 89.5 60.9 84.4% Schools with drinking water facility 96.0 100.0 100.0 96.4 98.1
% Enrolment in Govt. schools 99.4 0.0 24.9 95.3 94.693.7 100.0 84.2 85.5 85.7
% No female teacher schools (tch>=2) 10.0 0.0 0.0 4.5 4.522.7 0.0 6.5 0.6 0.7
0.5 0.0 0.0 2.5 0.0%Enrolment in schools without blackboard 5.9 0.0 21.8 13.2 12.2
2001-02 2002-03 2003-04 2004-05 2005-06IIIIIIIVV
VIVII
Total U.P
12,13212,23913,42813,85313,19215,763
14,775
13,93114,84815,62615,51314,826
18,11516,542
2,4292,6562,6012,5112,578
2,6312,057
46,17051,0216,641
9.8
8.1
55.9
60.7
59.8
64.8
47.7
0.031.6
5,7285,7096,2636,6706,3817,4457,2187,829
53,243
6052464641293030
334
2632292616131934
195
2,192
classrooms
78220342934
86.7100.0
92.386.581.2
10.40.0
2.9
7.710.512.7
0.00.02.96.1
2391
172368
957 842 1 0 1 6 174 0 0 0 0 0
18 0 0 0 0 1101 2 0 0 2 5149 1 0 0 2 2
254 450 283 367 219 4 52 5 1 8 7 0 0 06 9 7 36 49 1 0 6
34 89 71 161 249 11 2 040 162 132 347 375 5 6 12
3 8 12 48 34 1 1 0
5610
17256416
2391
361650
1023 14 34 37 0 171 212 16 21060
13
0036
074
16
0000
01
5279
18
6084
0048
0049
Terminalgrade Passed
VIII boysV girlsV boys
VIII girls
16 with >60%
23.2166923
121624
1101
0.00.0
29.030.1
31.00.05.1
27.138.4
57865Punjabi English Hindi Others Gujarati
5434559
1076629905
16810693070
069
168611
1198190
40
310000
196
2650000
% Schools recvd.
97.80.0
10.598.290.9
95.80.00.0
98.292.9
141381691
358
661213
697130
2740532
2684571
17052120803202
1.95.86.45.77.1
10.17.26.24.4
13.28.9
21.8
0.95.7
90.2
0.90
2005-062004-052003-04
PUNJAB
81.0
Upper PrimaryPrimary
Sex ratio Sex ratio 0-6
7 100
VIII15.8
Enrolment of children
VIII 1,953 16,364 15,632Total Pr. 12,775 74,744 64,844
1 - 5 6 - 8
616 81,078 23
0 0
28 93
%Teachers recvd.in-service training
Total schools* Rural schools* Total enrolment* Rural enrolment* Teachers*
21.3 30.8
47.1
44.9
7.6 44.4
5.7 43.9% SC enrolment% SC girls to SC enrolment% ST enrolment
47.9 48.4
62.8 56.4
21.3
47.6
22.6
48.9
Position of teachers by educational qualification (other than para teacher)
(Previous academic year)Incentives : Number of beneficiaries
% ST girls to ST enrolment
% Girls
Number of villages
% 0 - 6 population
% SC population % ST population
% Urban population
% Schools with blackboard
% Enrolment in single-teacher schools
% Enrolment in schools without building
Primary Upperprimary
OBC EnrolmentPrimary U. Primary
% OBCEnrolment% OBC girls toOBC Enrolment
Pupil-teacher ratio (PTR)Student-classroom ratio (SCR)% Schools with <= 50 students% Schools with PTR > 100% Female teachers
% Schools established since 1995
Regular teachers Para-teachers
% minorrepairs
% majorrepairs
# = not applicable na = not available * Some totals may not match due to no response in classificatory data items
9.6 80.29.0 83.99.5 84.3
11.4 84.18.9 90.29.7 84.6
13.3 73.418.1 73.0
4073
47.43527
45.11.7
63.52.7
42.49729
0.025.0
100.00.0
46.61832
6.40.0
58.559.1
50.02732
1.31.3
60.512.3
23.4 23.9 na 78.1 71.4
79487132.512.8
Category
PrivateGovt.PrivateGovtPrivateGovt.PrivateGovt.PrivateGovt.
Total population (in 000's)
Number of blocks/taluks
District
Decadal growth rate
Primary onlyPrimary with upper primaryPrimary with upper primary & sec/higher sec.Upper primary onlyUpper primary with sec./higher secondary
% Single classroom schools% Single teacher schools
P + UP P+sec/hs U.P. only UP+secP. only
No response in school category
Primary with upper primaryPrimary with U.P. & sec/higherUpper primary onlyUpper primary with sec./higher sec
Primary only
Primary onlyPrimary with upper primaryPrimary with Upper primary & sec/higherUpper primary only
Para-teachers
School category
Upper primary with sec./higher secondary
Primary onlyPrimary with upper prim.
P. onlyP + UPP+sec/hsU.P. onlyUP+sec
NER(U.Prim)GER(U.Prim)NER (Primary)GER (Primary)
Transition ratePrim. to U. Prim
SC/ST Enrolment
Indicators
Classrooms/Other rooms
Prim.with U.P.&Sec/H.SUpper Primary onlyU. Primary with Sec./H.S.
Basic Data, 2001
Data reported from
Performance indicators
98.7 28.299.2 33.963.5 22.369.3 29.1

432
Elementary Education in India - Where do we stand ?
Pu
nja
b
0.3440.052
50.3 36.5
Key data: Elementary Education
2000
SANGRUR
(Previous academic year)
(Previous year)
Gender and caste distribution of teachers*
No. of schools by type of building*
BoysWith disability
Flow rates
Primary Level
Enrolment*
Number of schools
Grade
GER / NER
School category
Primary Upper primaryBoys Boys GirlsGirls
IncentiveType
School categoryMultiple
TypeKuccha
PartiallyPucca
PuccaTotal % good condition
Otherrooms
TentNo
Building
Classrooms
Belowsecondary
Highersecondary
Postgraduate
M. Phil.GraduateSecondarySchool category OthersNo
response
ST teachers
Total Male Female No res Male Female No res Male Female Male FemaleSC teachers
Text booksUniformAttendanceStationery
% Passed
Avg. No. of Tchs.
%
Female literacyOverall literacy
dev. grant grantSchool T L M
Male Female
IVV
IIIIII
Grade R.R. D.O.R. P.R.
VIIVI
# #
I - V
Enrolment by medium of instructions
Examination results
Retention rate
GPI
Primary cycle U. primary cycleState
DISTRICT ELEMENTARY EDUCATION REPORT CARD : 2005-06
GirlsGrade
IIIIIIIVVVI
VIII
AllGirls
Total
VII
% TotalGrossness
School category
4826
166252
83 4565 21
00
158223
9 0 0
857 6159 5,03937 3,898
0 15,8530 45,6160 0
749 45 92,562 2,62611,248 4,783 7,18617,730 2,753 6,589
0 14,338 0
0 0 00 37,600 0
105,117 3,697 1,979232
246508
P + UP P+sec/hs U.P. only UP+sec
School categoryP. only
2.5 2.3 0.0 1.8 0.019.3
Number of Clusters 1567822
% Schools with SCR > 602.3 3.3 11.4 1.6
6.0 3.8 2.2 0.0 4.0% Schools with pre-primary sections 12.9 62.6 59.3 4.2 2.0% Schools with common toilets 77.3 84.0 89.0 65.1 76.2
% Schools with girls toilets 78.6 78.6 86.8 77.7 84.9% Schools with drinking water facility 90.2 95.4 87.9 94.0 90.1
% Enrolment in Govt. schools 96.6 30.9 18.0 100.0 100.088.9 96.2 91.2 90.4 90.1
% No female teacher schools (tch>=2) 10.3 2.3 4.4 22.9 10.311.6 1.7 0.7 8.5 0.8
0.3 0.6 0.0 0.5 0.0%Enrolment in schools without blackboard 6.4 1.0 3.0 9.4 7.8
2001-02 2002-03 2003-04 2004-05 2005-06IIIIIIIVV
VIVII
Total U.P
28,04126,13426,70426,52425,83427,124
25,443
28,17128,20126,69126,50125,967
24,59516,809
18,68818,81318,94018,03221,163
13,34013,857
74,96150,38940,373
41.2
27.7
57.3
33.9
68.6
58.7
39.9
12.12.2
12,45111,90912,24212,34512,29112,24012,06810,17495,720
124105
939197
1199891
818
4768477558585789
499
3,362
classrooms
8361,095
5921,871
75.093.497.182.868.1
18.76.1
6.4
2.712.323.1
0.50.24.98.7
217281274933
1,205 854 3 0 0 3 58122 0 0 0 0 9
83 0 0 0 0 8163 1 0 0 0 2242 0 0 0 1 9
495 492 330 458 305 6 550 93 202 222 124 4 2 2536 59 133 304 195 2 6 8250 95 51 206 270 8 4 471 177 81 520 657 20 16 78
5 9 21 62 49 0 1 0
781174215430818
543526258733
1339 19 30 56 0 221 208 27 225
760
69
267
10
16939
0000
213070
141
42283161
277
13
11938
Terminalgrade Passed
VIII boysV girlsV boys
VIII girls
48 with >60%
67.62225740832698
1639
5.15.4
65.038.4
51.02.15.0
59.835.7
108190Punjabi English Hindi Oriya
13109119161508345278
44820645299
00
17611144413
699338
000
710
% Schools recvd.
72.14.65.5
75.366.7
67.45.33.3
71.768.7
283870
2866
118240
8610
456950
378015
257100
539
2.45.69.14.26.5
11.99.19.88.1
12.07.2
53.8
4.18.7
93.1
0.85
2005-062004-052003-04
PUNJAB
64.3
Upper PrimaryPrimary
Sex ratio Sex ratio 0-6
12 129
VIII47.3
Enrolment of children
VIII 13,176 8,985 22,394Total Pr. 95,636 135,531 133,237
1 - 5 6 - 8
698 01,639 0
0 0
202 630
%Teachers recvd.in-service training
Total schools* Rural schools* Total enrolment* Rural enrolment* Teachers*
23.5 32.4
52.5
39.7
30.3 43.9
17.8 23.9% SC enrolment% SC girls to SC enrolment% ST enrolment
47.4 45.1
40.6 88.0
14.6
47.0
16.8
47.8
Position of teachers by educational qualification (other than para teacher)
(Previous academic year)Incentives : Number of beneficiaries
% ST girls to ST enrolment
% Girls
Number of villages
% 0 - 6 population
% SC population % ST population
% Urban population
% Schools with blackboard
% Enrolment in single-teacher schools
% Enrolment in schools without building
Primary Upperprimary
OBC EnrolmentPrimary U. Primary
% OBCEnrolment% OBC girls toOBC Enrolment
Pupil-teacher ratio (PTR)Student-classroom ratio (SCR)% Schools with <= 50 students% Schools with PTR > 100% Female teachers
% Schools established since 1995
Regular teachers Para-teachers
% minorrepairs
% majorrepairs
# = not applicable na = not available * Some totals may not match due to no response in classificatory data items
4.4 83.75.5 85.4
2.8 93.12.1 89.3
2026
47.44932
21.57.1
62.79.9
40.82219
17.62.3
75.575.6
45.92327
14.52.4
37.469.9
47.32824
3.60.8
45.316.7
18.6 27.6 na 60.0 53.4
78687129.213.2
Category
PrivateGovt.PrivateGovtPrivateGovt.PrivateGovt.PrivateGovt.
Total population (in 000's)
Number of blocks/taluks
District
Decadal growth rate
Primary onlyPrimary with upper primaryPrimary with upper primary & sec/higher sec.Upper primary onlyUpper primary with sec./higher secondary
% Single classroom schools% Single teacher schools
P + UP P+sec/hs U.P. only UP+secP. only
No response in school category
Primary with upper primaryPrimary with U.P. & sec/higherUpper primary onlyUpper primary with sec./higher sec
Primary only
Primary onlyPrimary with upper primaryPrimary with Upper primary & sec/higherUpper primary only
Para-teachers
School category
Upper primary with sec./higher secondary
Primary onlyPrimary with upper prim.
P. onlyP + UPP+sec/hsU.P. onlyUP+sec
NER(U.Prim)GER(U.Prim)NER (Primary)GER (Primary)
Transition ratePrim. to U. Prim
SC/ST Enrolment
Indicators
Classrooms/Other rooms
Prim.with U.P.&Sec/H.SUpper Primary onlyU. Primary with Sec./H.S.
Basic Data, 2001
Data reported from
Performance indicators
94.5 30.195.0 30.165.3 24.568.8 28.5

433
Elementary Education: Report Card - AJMER
Raj
asth
an20.9 18.8
Key data: Elementary Education
2182
AJMER
(Previous academic year)
(Previous year)
Gender and caste distribution of teachers*
No. of schools by type of building*
BoysWith disability
Flow rates
Primary Level
Enrolment*
Number of schools
Grade
GER / NER
School category
Primary Upper primaryBoys Boys GirlsGirls
IncentiveType
School categoryMultiple
TypeKuccha
PartiallyPucca
PuccaTotal % good condition
Otherrooms
TentNo
Building
Classrooms
Belowsecondary
Highersecondary
Postgraduate
M. Phil.GraduateSecondarySchool category OthersNo
response
ST teachers
Total Male Female No res Male Female No res Male Female Male FemaleSC teachers
Text booksUniformAttendanceStationery
% Passed
Avg. No. of Tchs.
%
Female literacyOverall literacy
dev. grant grantSchool T L M
Male Female
IVV
IIIIII
Grade R.R. D.O.R. P.R.
VIIVI
# #
I - V
Enrolment by medium of instructions
Examination results
Retention rate
GPI
Primary cycle U. primary cycleState
DISTRICT ELEMENTARY EDUCATION REPORT CARD : 2005-06
GirlsGrade
IIIIIIIVVVI
VIII
AllGirls
Total
VII
% TotalGrossness
School category
58122
5199
270 47271 15
118
5161
0 0 0
1,272 216101 138,942
11 6,2060 5540 32,9930 0
1,141 117 107,129 9,52647,823 112,212 17,01225,825 3,800 3,072
75 554 0
0 0 03,842 24,495 0
124,531 19,090 3,5004,188
1,0652,224
P + UP P+sec/hs U.P. only UP+sec
School categoryP. only
1.7 0.4 1.1 0.0 0.020.1
Number of Clusters 26551166
% Schools with SCR > 600.4 0.0 16.7 1.8
5.0 5.9 6.5 0.0 1.8% Schools with pre-primary sections 11.0 26.1 55.9 0.0 4.1% Schools with common toilets 59.1 62.3 57.0 50.0 49.3
% Schools with girls toilets 35.7 63.7 88.2 50.0 51.6% Schools with drinking water facility 81.6 84.1 95.7 83.3 88.0
% Enrolment in Govt. schools 86.7 74.4 19.4 88.1 89.697.9 99.8 100.0 83.3 100.0
% No female teacher schools (tch>=2) 27.1 16.6 8.6 16.7 29.510.8 0.1 0.0 5.6 1.6
3.1 0.0 0.0 5.6 0.0%Enrolment in schools without blackboard 1.6 0.2 0.0 5.6 0.0
2001-02 2002-03 2003-04 2004-05 2005-06IIIIIIIVV
VIVII
Total U.P
82,51566,07555,42749,12745,17041,834
32,707
81,49862,33256,69947,98643,089
38,27127,016
55,79251,05840,43133,75531,615
23,57918,601
89,85967,28955,53347,92039,174
36,62630,307
101,56791,43658,39793,555
65.3
32.8
87.2
50.1
99.6
57.1
41.1
1.11.1
40,95832,55825,58121,69318,82615,04211,779
9,575176,012
499409438393425303202201
2,870
278248240232203130105
741,510
5,017
classrooms
6,1701,227
211,824
73.578.891.7
100.069.0
19.215.3
7.4
7.20.0
22.9
5.91.10.08.1
1,825447
121,554
1,755 1,388 6 0 0 19 75814 6 0 0 29 2
90 1 0 0 1 15 0 0 0 0 1
212 0 0 0 5 0
77 321 1,269 1,240 1,213 6 636 279 1,354 2,100 2,384 14 14 0
3 21 75 399 421 7 7 00 0 3 13 11 0 0 04 50 139 483 876 8 7 0
9 44 186 246 200 2 1 0
20643241
41516
1014
2940518
11553
2068 1 288 144 0 435 211 68 330000
7910
14
152604
0000
70646
7212
26822
337
9550
14
5010
04
Terminalgrade Passed
VIII boysV girlsV boys
VIII girls
1 with >60%
59.045656412
94027
1585
49.613.750.0
5.3
41.629.4
5.227.3
2.5
141595Hindi English Others Urdu Sindhi
18132224434
62936334
29429427175
0262
7571189
00
174
318545
000
73403
00
65
% Schools recvd.
58.065.124.766.7
6.5
47.056.517.250.0
7.8
110351172119989722
45272809
287183027
9906370122454
10451
286941426
100453849
3.17.5
10.14.57.3
24.621.015.2
9.2
15.29.1
11.6
6.216.7
83.6
0.88
2005-062004-052003-04
RAJASTHAN
55.7
Upper PrimaryPrimary
Sex ratio Sex ratio 0-6
16 96
VIII14.0
Enrolment of children
VIII 26,622 16,217 26,149 27,026Total Pr. 299,775 212,651 291,604 298,314
1 - 5 6 - 8
23 41,466 119
0 0
156 784
%Teachers recvd.in-service training
Total schools* Rural schools* Total enrolment* Rural enrolment* Teachers*
23.6 30.7
76.1
39.6
49.0 67.3
20.8 34.1% SC enrolment% SC girls to SC enrolment% ST enrolment
47.3 37.23.3
45.9 34.0
61.0
46.3
57.8
31.1
Position of teachers by educational qualification (other than para teacher)
(Previous academic year)Incentives : Number of beneficiaries
% ST girls to ST enrolment
% Girls
Number of villages
% 0 - 6 population
% SC population % ST population
% Urban population
% Schools with blackboard
% Enrolment in single-teacher schools
% Enrolment in schools without building
Primary Upperprimary
OBC EnrolmentPrimary U. Primary
% OBCEnrolment% OBC girls toOBC Enrolment
Pupil-teacher ratio (PTR)Student-classroom ratio (SCR)% Schools with <= 50 students% Schools with PTR > 100% Female teachers
% Schools established since 1995
Regular teachers Para-teachers
% minorrepairs
% majorrepairs
# = not applicable na = not available * Some totals may not match due to no response in classificatory data items
10.4 65.03.9 75.15.9 78.92.2 88.6
10.3 83.66.8 76.55.8 79.02.1 88.8
2634
46.43129
26.81.2
48.546.6
44.12930
1.50.1
48.221.4
44.22330
33.30.0
40.766.7
36.62320
1.82.3
35.13.7
26.1 17.7 2.4 64.6 48.9
92293140.117.1
Category
PrivateGovt.PrivateGovtPrivateGovt.PrivateGovt.PrivateGovt.
Total population (in 000's)
Number of blocks/taluks
District
Decadal growth rate
Primary onlyPrimary with upper primaryPrimary with upper primary & sec/higher sec.Upper primary onlyUpper primary with sec./higher secondary
% Single classroom schools% Single teacher schools
P + UP P+sec/hs U.P. only UP+secP. only
No response in school category
Primary with upper primaryPrimary with U.P. & sec/higherUpper primary onlyUpper primary with sec./higher sec
Primary only
Primary onlyPrimary with upper primaryPrimary with Upper primary & sec/higherUpper primary only
Para-teachers
School category
Upper primary with sec./higher secondary
Primary onlyPrimary with upper prim.
P. onlyP + UPP+sec/hsU.P. onlyUP+sec
NER(U.Prim)GER(U.Prim)NER (Primary)GER (Primary)
Transition ratePrim. to U. Prim
2.7
SC/ST Enrolment
Indicators
Classrooms/Other rooms
Prim.with U.P.&Sec/H.SUpper Primary onlyU. Primary with Sec./H.S.
Basic Data, 2001
Data reported from
Performance indicators
96.0 47.496.8 48.276.9 36.982.4 43.5
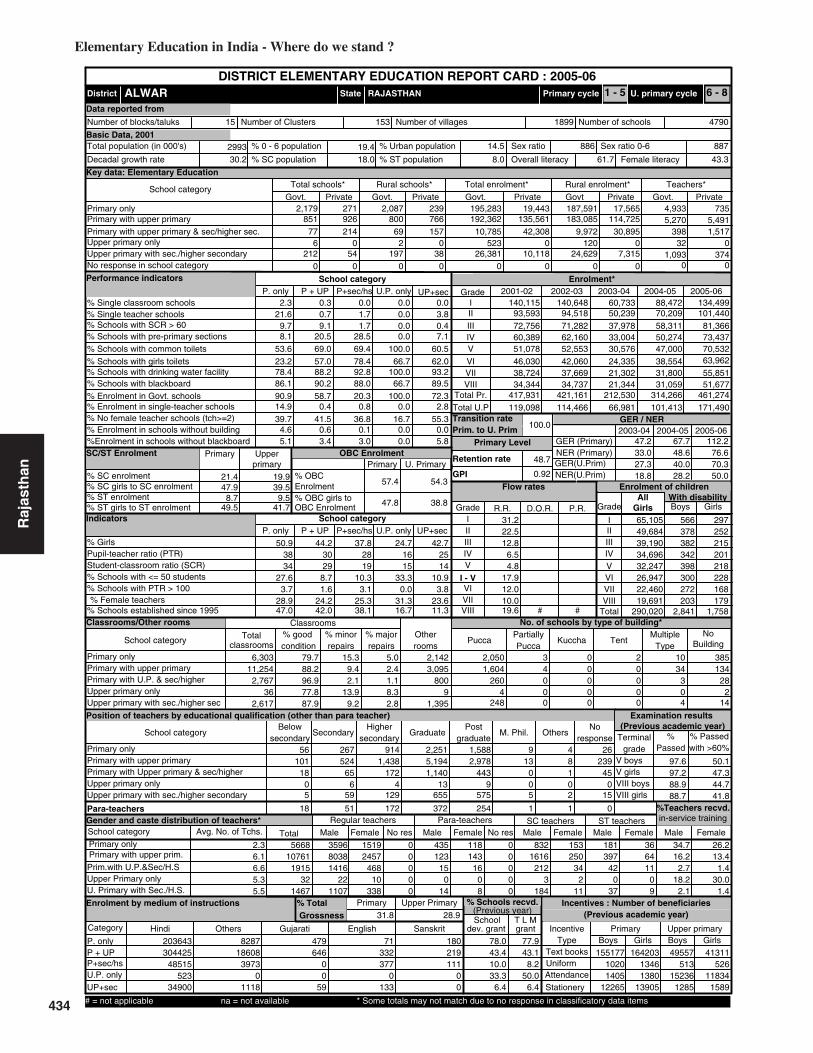
434
Elementary Education in India - Where do we stand ?
Raj
asth
an 21.4 19.9
Key data: Elementary Education
2993
ALWAR
(Previous academic year)
(Previous year)
Gender and caste distribution of teachers*
No. of schools by type of building*
BoysWith disability
Flow rates
Primary Level
Enrolment*
Number of schools
Grade
GER / NER
School category
Primary Upper primaryBoys Boys GirlsGirls
IncentiveType
School categoryMultiple
TypeKuccha
PartiallyPucca
PuccaTotal % good condition
Otherrooms
TentNo
Building
Classrooms
Belowsecondary
Highersecondary
Postgraduate
M. Phil.GraduateSecondarySchool category OthersNo
response
ST teachers
Total Male Female No res Male Female No res Male Female Male FemaleSC teachers
Text booksUniformAttendanceStationery
% Passed
Avg. No. of Tchs.
%
Female literacyOverall literacy
dev. grant grantSchool T L M
Male Female
IVV
IIIIII
Grade R.R. D.O.R. P.R.
VIIVI
# #
I - V
Enrolment by medium of instructions
Examination results
Retention rate
GPI
Primary cycle U. primary cycleState
DISTRICT ELEMENTARY EDUCATION REPORT CARD : 2005-06
GirlsGrade
IIIIIIIVVVI
VIII
AllGirls
Total
VII
% TotalGrossness
School category
85177
6212
926 800214 69
054
2197
0 0 0
2,179 271766 192,362157 10,785
0 52338 26,381
0 0
2,087 239 187,591 17,565135,561 183,085 114,725
42,308 9,972 30,8950 120 0
0 0 010,118 24,629 7,315
195,283 19,443 4,9335,270
7355,491
P + UP P+sec/hs U.P. only UP+sec
School categoryP. only
2.3 0.3 0.0 0.0 0.021.6
Number of Clusters 47901899
% Schools with SCR > 600.7 1.7 0.0 3.8
9.7 9.1 1.7 0.0 0.4% Schools with pre-primary sections 8.1 20.5 28.5 0.0 7.1% Schools with common toilets 53.6 69.0 69.4 100.0 60.5
% Schools with girls toilets 23.2 57.0 78.4 66.7 62.0% Schools with drinking water facility 78.4 88.2 92.8 100.0 93.2
% Enrolment in Govt. schools 90.9 58.7 20.3 100.0 72.386.1 90.2 88.0 66.7 89.5
% No female teacher schools (tch>=2) 39.7 41.5 36.8 16.7 55.314.9 0.4 0.8 0.0 2.8
4.6 0.6 0.1 0.0 0.0%Enrolment in schools without blackboard 5.1 3.4 3.0 0.0 5.8
2001-02 2002-03 2003-04 2004-05 2005-06IIIIIIIVV
VIVII
Total U.P
134,499101,440
81,36673,43770,53263,962
55,851
88,47270,20958,31150,27447,000
38,55431,800
60,73350,23937,97833,00430,576
24,33521,302
140,64894,51871,28262,16052,553
42,06037,669
140,11593,59372,75660,38951,078
46,03038,724
171,490101,41366,981114,466119,098
47.2
27.3
67.7
40.0
112.2
70.3
37.8
10.33.1
65,10549,68439,19034,69632,24726,94722,46019,691
290,020
566378382342398300272203
2,841
297252215201218228168179
1,758
6,303
classrooms
11,2542,767
362,617
79.788.296.977.887.9
15.39.4
5.0
2.113.9
9.2
2.41.18.32.8
3,095800
91,395
2,142 2,050 3 0 2 10 3851,604 4 0 0 34 134
260 0 0 0 3 284 0 0 0 0 2
248 0 0 0 4 14
56 267 914 2,251 1,588 9 4101 524 1,438 5,194 2,978 13 8 239
18 65 172 1,140 443 0 1 450 6 4 13 9 0 0 05 59 129 655 575 5 2 15
18 51 172 372 254 1 1 0
359680381416
221107
2457468
10338
1519 0 435 118 0 832 153 181 360000
12315
014
14316
08
0000
1616212
3184
25034
211
39742
037
6411
09
Terminalgrade Passed
VIII boysV girlsV boys
VIII girls
26 with >60%
34.7566810761
191532
1467
16.22.7
18.22.1
26.213.4
1.430.0
1.4
203643Hindi Others Gujarati English Sanskrit
30442548515
52334900
828718608
39730
1118
479646
00
59
71332377
0133
180219111
00
% Schools recvd.
78.043.410.033.3
6.4
77.943.1
8.250.0
6.4
15517710201405
12265
49557513
152361285
16420313461380
13905
41311526
118341589
2.36.16.65.35.5
31.222.512.8
6.5
12.010.019.6
4.817.9
48.7
100.0
0.92
2005-062004-052003-04
RAJASTHAN
25.3
Upper PrimaryPrimary
Sex ratio Sex ratio 0-6
15 153
VIII38.1
Enrolment of children
34,344VIII 34,737 21,344 31,059 51,677Total Pr. 417,931 421,161 212,530 314,266 461,274
1 - 5 6 - 8
32 01,093 374
0 0
398 1,517
%Teachers recvd.in-service training
Total schools* Rural schools* Total enrolment* Rural enrolment* Teachers*
31.8 28.9
76.6
50.0
33.0 48.6
18.8 28.2% SC enrolment% SC girls to SC enrolment% ST enrolment
47.9 39.58.7
49.5 41.7
57.4
47.8
54.3
38.8
Position of teachers by educational qualification (other than para teacher)
(Previous academic year)Incentives : Number of beneficiaries
% ST girls to ST enrolment
% Girls
Number of villages
% 0 - 6 population
% SC population % ST population
% Urban population
% Schools with blackboard
% Enrolment in single-teacher schools
% Enrolment in schools without building
Primary Upperprimary
OBC EnrolmentPrimary U. Primary
% OBCEnrolment% OBC girls toOBC Enrolment
Pupil-teacher ratio (PTR)Student-classroom ratio (SCR)% Schools with <= 50 students% Schools with PTR > 100% Female teachers
% Schools established since 1995
Regular teachers Para-teachers
% minorrepairs
% majorrepairs
# = not applicable na = not available * Some totals may not match due to no response in classificatory data items
1928
50.93834
27.63.7
28.947.0
44.23029
8.71.6
24.242.0
24.71615
33.30.0
31.316.7
42.72514
10.93.8
23.611.3
30.2 18.0 8.0 61.7 43.3
88788614.519.4
Category
PrivateGovt.PrivateGovtPrivateGovt.PrivateGovt.PrivateGovt.
Total population (in 000's)
Number of blocks/taluks
District
Decadal growth rate
Primary onlyPrimary with upper primaryPrimary with upper primary & sec/higher sec.Upper primary onlyUpper primary with sec./higher secondary
% Single classroom schools% Single teacher schools
P + UP P+sec/hs U.P. only UP+secP. only
No response in school category
Primary with upper primaryPrimary with U.P. & sec/higherUpper primary onlyUpper primary with sec./higher sec
Primary only
Primary onlyPrimary with upper primaryPrimary with Upper primary & sec/higherUpper primary only
Para-teachers
School category
Upper primary with sec./higher secondary
Primary onlyPrimary with upper prim.
P. onlyP + UPP+sec/hsU.P. onlyUP+sec
NER(U.Prim)GER(U.Prim)NER (Primary)GER (Primary)
Transition ratePrim. to U. Prim
9.5
SC/ST Enrolment
Indicators
Classrooms/Other rooms
Prim.with U.P.&Sec/H.SUpper Primary onlyU. Primary with Sec./H.S.
Basic Data, 2001
Data reported from
Performance indicators
97.6 50.197.2 47.388.9 44.788.7 41.8
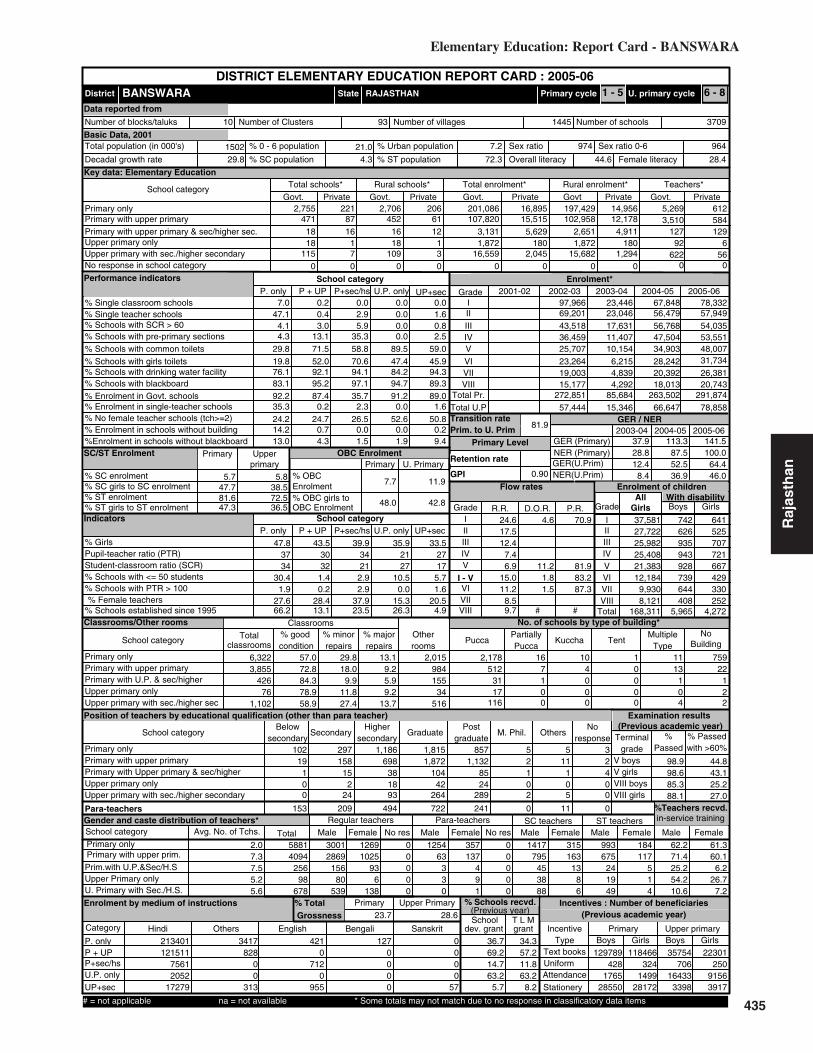
435
Elementary Education: Report Card - BANSWARA
Raj
asth
an5.7 5.8
Key data: Elementary Education
1502
BANSWARA
(Previous academic year)
(Previous year)
Gender and caste distribution of teachers*
No. of schools by type of building*
BoysWith disability
Flow rates
Primary Level
Enrolment*
Number of schools
Grade
GER / NER
School category
Primary Upper primaryBoys Boys GirlsGirls
IncentiveType
School categoryMultiple
TypeKuccha
PartiallyPucca
PuccaTotal % good condition
Otherrooms
TentNo
Building
Classrooms
Belowsecondary
Highersecondary
Postgraduate
M. Phil.GraduateSecondarySchool category OthersNo
response
ST teachers
Total Male Female No res Male Female No res Male Female Male FemaleSC teachers
Text booksUniformAttendanceStationery
% Passed
Avg. No. of Tchs.
%
Female literacyOverall literacy
dev. grant grantSchool T L M
Male Female
IVV
IIIIII
Grade R.R. D.O.R. P.R.
VIIVI
# #
I - V
Enrolment by medium of instructions
Examination results
Retention rate
GPI
Primary cycle U. primary cycleState
DISTRICT ELEMENTARY EDUCATION REPORT CARD : 2005-06
GirlsGrade
IIIIIIIVVVI
VIII
AllGirls
Total
VII
% TotalGrossness
School category
4711818
115
87 45216 16
17
18109
0 0 0
2,755 22161 107,82012 3,131
1 1,8723 16,5590 0
2,706 206 197,429 14,95615,515 102,958 12,178
5,629 2,651 4,911180 1,872 180
0 0 02,045 15,682 1,294
201,086 16,895 5,2693,510
612584
P + UP P+sec/hs U.P. only UP+sec
School categoryP. only
7.0 0.2 0.0 0.0 0.047.1
Number of Clusters 37091445
% Schools with SCR > 600.4 2.9 0.0 1.6
4.1 3.0 5.9 0.0 0.8% Schools with pre-primary sections 4.3 13.1 35.3 0.0 2.5% Schools with common toilets 29.8 71.5 58.8 89.5 59.0
% Schools with girls toilets 19.8 52.0 70.6 47.4 45.9% Schools with drinking water facility 76.1 92.1 94.1 84.2 94.3
% Enrolment in Govt. schools 92.2 87.4 35.7 91.2 89.083.1 95.2 97.1 94.7 89.3
% No female teacher schools (tch>=2) 24.2 24.7 26.5 52.6 50.835.3 0.2 2.3 0.0 1.6
14.2 0.7 0.0 0.0 0.2%Enrolment in schools without blackboard 13.0 4.3 1.5 1.9 9.4
2001-02 2002-03 2003-04 2004-05 2005-06IIIIIIIVV
VIVII
Total U.P
78,33257,94954,03553,55148,00731,734
26,381
67,84856,47956,76847,50434,903
28,24220,392
23,44623,04617,63111,40710,154
6,2154,839
97,96669,20143,51836,45925,707
23,26419,003
78,85866,64715,34657,444
37.9
12.4
113.3
52.5
141.5
64.4
39.9
2.92.9
37,58127,72225,98225,40821,38312,184
9,9308,121
168,311
742626935943928739644408
5,965
641525707721667429330252
4,272
6,322
classrooms
3,855426
761,102
57.072.884.378.958.9
29.818.0
13.1
9.911.827.4
9.25.99.2
13.7
984155
34516
2,015 2,178 16 10 1 11 759512 7 4 0 13 22
31 1 0 0 1 117 0 0 0 0 2
116 0 0 0 4 2
102 297 1,186 1,815 857 5 519 158 698 1,872 1,132 2 11 2
1 15 38 104 85 1 1 40 2 18 42 24 0 0 00 24 93 264 289 2 5 0
153 209 494 722 241 0 11 0
30012869
15680
539
102593
6138
1269 0 1254 357 0 1417 315 993 1840000
63330
137491
0000
795453888
16313
86
675241949
117514
Terminalgrade Passed
VIII boysV girlsV boys
VIII girls
3 with >60%
62.258814094
25698
678
71.425.254.210.6
61.360.1
6.226.7
7.2
213401Hindi Others English Bengali Sanskrit
12151175612052
17279
3417828
00
313
4210
7120
955
1270000
0000
57
% Schools recvd.
36.769.214.763.2
5.7
34.357.211.863.2
8.2
129789428
176528550
35754706
164333398
118466324
149928172
22301250
91563917
2.07.37.55.25.6
24.617.512.4
7.4
11.28.59.7
6.915.0
81.9
0.90
2005-062004-052003-04
RAJASTHAN
37.9
Upper PrimaryPrimary
Sex ratio Sex ratio 0-6
10 93
VIII23.5
Enrolment of children
VIII 15,177 4,292 18,013 20,743Total Pr. 272,851 85,684 263,502 291,874
1 - 5 6 - 8
92 6622 56
0 0
127 129
%Teachers recvd.in-service training
Total schools* Rural schools* Total enrolment* Rural enrolment* Teachers*
23.7 28.6
100.0
46.0
28.8 87.5
8.4 36.9% SC enrolment% SC girls to SC enrolment% ST enrolment
47.7 38.581.647.3 36.5
7.7
48.0
11.9
42.8
Position of teachers by educational qualification (other than para teacher)
(Previous academic year)Incentives : Number of beneficiaries
% ST girls to ST enrolment
% Girls
Number of villages
% 0 - 6 population
% SC population % ST population
% Urban population
% Schools with blackboard
% Enrolment in single-teacher schools
% Enrolment in schools without building
Primary Upperprimary
OBC EnrolmentPrimary U. Primary
% OBCEnrolment% OBC girls toOBC Enrolment
Pupil-teacher ratio (PTR)Student-classroom ratio (SCR)% Schools with <= 50 students% Schools with PTR > 100% Female teachers
% Schools established since 1995
Regular teachers Para-teachers
% minorrepairs
% majorrepairs
# = not applicable na = not available * Some totals may not match due to no response in classificatory data items
4.6 70.9
11.2 81.91.8 83.21.5 87.3
2134
47.83734
30.41.9
27.666.2
43.53032
1.40.2
28.413.1
35.92127
10.50.0
15.326.3
33.52717
5.71.6
20.54.9
29.8 4.3 72.3 44.6 28.4
9649747.221.0
Category
PrivateGovt.PrivateGovtPrivateGovt.PrivateGovt.PrivateGovt.
Total population (in 000's)
Number of blocks/taluks
District
Decadal growth rate
Primary onlyPrimary with upper primaryPrimary with upper primary & sec/higher sec.Upper primary onlyUpper primary with sec./higher secondary
% Single classroom schools% Single teacher schools
P + UP P+sec/hs U.P. only UP+secP. only
No response in school category
Primary with upper primaryPrimary with U.P. & sec/higherUpper primary onlyUpper primary with sec./higher sec
Primary only
Primary onlyPrimary with upper primaryPrimary with Upper primary & sec/higherUpper primary only
Para-teachers
School category
Upper primary with sec./higher secondary
Primary onlyPrimary with upper prim.
P. onlyP + UPP+sec/hsU.P. onlyUP+sec
NER(U.Prim)GER(U.Prim)NER (Primary)GER (Primary)
Transition ratePrim. to U. Prim
72.5
SC/ST Enrolment
Indicators
Classrooms/Other rooms
Prim.with U.P.&Sec/H.SUpper Primary onlyU. Primary with Sec./H.S.
Basic Data, 2001
Data reported from
Performance indicators
98.9 44.898.6 43.185.3 25.288.1 27.0

436
Elementary Education in India - Where do we stand ?
Raj
asth
an 20.5 18.9
Key data: Elementary Education
1022
BARAN
(Previous academic year)
(Previous year)
Gender and caste distribution of teachers*
No. of schools by type of building*
BoysWith disability
Flow rates
Primary Level
Enrolment*
Number of schools
Grade
GER / NER
School category
Primary Upper primaryBoys Boys GirlsGirls
IncentiveType
School categoryMultiple
TypeKuccha
PartiallyPucca
PuccaTotal % good condition
Otherrooms
TentNo
Building
Classrooms
Belowsecondary
Highersecondary
Postgraduate
M. Phil.GraduateSecondarySchool category OthersNo
response
ST teachers
Total Male Female No res Male Female No res Male Female Male FemaleSC teachers
Text booksUniformAttendanceStationery
% Passed
Avg. No. of Tchs.
%
Female literacyOverall literacy
dev. grant grantSchool T L M
Male Female
IVV
IIIIII
Grade R.R. D.O.R. P.R.
VIIVI
# #
I - V
Enrolment by medium of instructions
Examination results
Retention rate
GPI
Primary cycle U. primary cycleState
DISTRICT ELEMENTARY EDUCATION REPORT CARD : 2005-06
GirlsGrade
IIIIIIIVVVI
VIII
AllGirls
Total
VII
% TotalGrossness
School category
35327
268
263 34162 23
013
265
0 0 0
1,034 84161 75,375
21 6,2560 1462 9,1220 0
994 64 73,967 4,73944,702 70,487 27,17815,121 5,401 5,032
0 146 0
0 0 02,836 8,573 402
80,504 6,312 2,1812,018
4162,061
P + UP P+sec/hs U.P. only UP+sec
School categoryP. only
7.9 0.5 1.1 0.0 0.037.5
Number of Clusters 19061110
% Schools with SCR > 602.3 1.1 0.0 2.5
8.9 14.6 6.7 0.0 1.2% Schools with pre-primary sections 5.7 19.0 31.5 0.0 1.2% Schools with common toilets 45.8 74.0 62.9 0.0 46.9
% Schools with girls toilets 14.0 37.0 56.2 100.0 53.1% Schools with drinking water facility 73.5 88.1 91.0 100.0 95.1
% Enrolment in Govt. schools 92.7 62.8 29.3 100.0 76.383.5 96.3 97.8 100.0 96.3
% No female teacher schools (tch>=2) 37.7 38.1 28.1 0.0 58.024.1 1.3 0.5 0.0 1.8
10.7 0.9 0.5 0.0 0.0%Enrolment in schools without blackboard 12.0 3.0 1.0 0.0 6.5
2001-02 2002-03 2003-04 2004-05 2005-06IIIIIIIVV
VIVII
Total U.P
44,71533,89133,10133,02533,99025,286
19,800
11,6369,0719,7929,9628,735
7,0535,025
49,33346,79036,68228,53621,166
19,05615,205
50,93847,77537,25229,09021,631
19,60815,681
61,65217,04247,53248,942
119.6
57.1
31.4
19.9
127.4
74.0
39.7
1.13.4
21,13416,13315,71715,84716,01510,291
7,4875,595
108,219
375301306350403238158109
2,240
274224226252249101
5745
1,428
2,370
classrooms
3,391792
6624
66.281.993.683.377.7
23.013.5
10.7
5.30.0
17.0
4.61.1
16.75.3
775207
16367
721 853 27 24 1 18 194538 16 8 1 42 8
82 1 1 0 4 12 0 0 0 0 0
77 0 0 0 4 0
48 105 511 894 486 1 141 156 700 1,892 932 2 3 10
4 31 65 371 206 2 1 60 0 0 3 0 0 0 01 9 54 203 209 0 0 0
84 110 250 300 153 3 3 0
16203044
5010
384
692185
392
445 0 458 74 0 576 69 160 170000
19313
06
15011
01
0000
769107
084
10320
115
15216
018
17203
Terminalgrade Passed
VIII boysV girlsV boys
VIII girls
19 with >60%
42.925974079
7103
483
30.98.00.0
10.3
46.421.311.7
0.03.2
28062Hindi English Others Sanskrit Gujarati
4297211098
964631
95105668
00
30589
000
97254
000
00
10800
% Schools recvd.
58.247.412.4
0.06.2
58.247.614.6
0.09.9
64713192331898981
22162230
94225689
64647177026427909
1391256
52002934
2.36.68.01.56.0
31.228.529.820.0
41.432.539.1
18.825.9
100.0
0.90
2005-062004-052003-04
RAJASTHAN
27.6
Upper PrimaryPrimary
Sex ratio Sex ratio 0-6
7 82
VIII44.9
Enrolment of children
VIII 13,653 13,271 4,964 16,566Total Pr. 186,686 182,507 49,196 178,722
1 - 5 6 - 8
3 0384 99
0 0
162 548
%Teachers recvd.in-service training
Total schools* Rural schools* Total enrolment* Rural enrolment* Teachers*
21.3 28.6
100.0
52.9
92.8 24.0
40.3 13.5% SC enrolment% SC girls to SC enrolment% ST enrolment
47.5 35.224.847.4 33.4
45.7
47.6
49.7
38.4
Position of teachers by educational qualification (other than para teacher)
(Previous academic year)Incentives : Number of beneficiaries
% ST girls to ST enrolment
% Girls
Number of villages
% 0 - 6 population
% SC population % ST population
% Urban population
% Schools with blackboard
% Enrolment in single-teacher schools
% Enrolment in schools without building
Primary Upperprimary
OBC EnrolmentPrimary U. Primary
% OBCEnrolment% OBC girls toOBC Enrolment
Pupil-teacher ratio (PTR)Student-classroom ratio (SCR)% Schools with <= 50 students% Schools with PTR > 100% Female teachers
% Schools established since 1995
Regular teachers Para-teachers
% minorrepairs
% majorrepairs
# = not applicable na = not available * Some totals may not match due to no response in classificatory data items
2730
50.13337
36.51.6
20.052.6
42.72935
3.72.1
20.639.9
100.04924
50.00.0
100.0100.0
40.82519
4.92.5
19.312.3
26.2 17.7 21.2 59.5 41.5
91990916.818.6
Category
PrivateGovt.PrivateGovtPrivateGovt.PrivateGovt.PrivateGovt.
Total population (in 000's)
Number of blocks/taluks
District
Decadal growth rate
Primary onlyPrimary with upper primaryPrimary with upper primary & sec/higher sec.Upper primary onlyUpper primary with sec./higher secondary
% Single classroom schools% Single teacher schools
P + UP P+sec/hs U.P. only UP+secP. only
No response in school category
Primary with upper primaryPrimary with U.P. & sec/higherUpper primary onlyUpper primary with sec./higher sec
Primary only
Primary onlyPrimary with upper primaryPrimary with Upper primary & sec/higherUpper primary only
Para-teachers
School category
Upper primary with sec./higher secondary
Primary onlyPrimary with upper prim.
P. onlyP + UPP+sec/hsU.P. onlyUP+sec
NER(U.Prim)GER(U.Prim)NER (Primary)GER (Primary)
Transition ratePrim. to U. Prim
18.9
SC/ST Enrolment
Indicators
Classrooms/Other rooms
Prim.with U.P.&Sec/H.SUpper Primary onlyU. Primary with Sec./H.S.
Basic Data, 2001
Data reported from
Performance indicators
96.8 46.096.6 38.779.3 45.578.5 44.2

437
Elementary Education: Report Card - BARMER
Raj
asth
an17.2 14.5
Key data: Elementary Education
1965
BARMER
(Previous academic year)
(Previous year)
Gender and caste distribution of teachers*
No. of schools by type of building*
BoysWith disability
Flow rates
Primary Level
Enrolment*
Number of schools
Grade
GER / NER
School category
Primary Upper primaryBoys Boys GirlsGirls
IncentiveType
School categoryMultiple
TypeKuccha
PartiallyPucca
PuccaTotal % good condition
Otherrooms
TentNo
Building
Classrooms
Belowsecondary
Highersecondary
Postgraduate
M. Phil.GraduateSecondarySchool category OthersNo
response
ST teachers
Total Male Female No res Male Female No res Male Female Male FemaleSC teachers
Text booksUniformAttendanceStationery
% Passed
Avg. No. of Tchs.
%
Female literacyOverall literacy
dev. grant grantSchool T L M
Male Female
IVV
IIIIII
Grade R.R. D.O.R. P.R.
VIIVI
# #
I - V
Enrolment by medium of instructions
Examination results
Retention rate
GPI
Primary cycle U. primary cycleState
DISTRICT ELEMENTARY EDUCATION REPORT CARD : 2005-06
GirlsGrade
IIIIIIIVVVI
VIII
AllGirls
Total
VII
% TotalGrossness
School category
69192
135
113 67018 9
04
2132
0 0 0
4,026 11374 141,986
7 1,8410 1993 20,5530 0
3,991 96 274,263 8,26226,195 136,496 16,906
6,672 1,841 2,6970 199 0
0 0 0939 20,125 831
279,096 10,062 5,6674,197
454909
P + UP P+sec/hs U.P. only UP+sec
School categoryP. only
9.1 0.2 0.0 0.0 0.065.9
Number of Clusters 51111853
% Schools with SCR > 603.0 0.0 0.0 5.8
6.6 8.1 7.4 0.0 0.7% Schools with pre-primary sections 2.1 8.1 29.6 0.0 0.7% Schools with common toilets 43.7 67.8 44.4 100.0 59.7
% Schools with girls toilets 11.0 43.5 74.1 100.0 54.7% Schools with drinking water facility 43.8 64.7 81.5 50.0 78.4
% Enrolment in Govt. schools 96.5 84.4 21.6 100.0 95.690.0 97.5 100.0 100.0 91.4
% No female teacher schools (tch>=2) 18.4 33.5 37.0 0.0 67.657.1 1.7 0.0 0.0 3.3
10.1 0.2 0.0 0.0 0.0%Enrolment in schools without blackboard 8.0 2.5 0.0 0.0 10.5
2001-02 2002-03 2003-04 2004-05 2005-06IIIIIIIVV
VIVII
Total U.P
129,02387,22773,97966,41849,18434,669
27,636
75,70550,02548,05130,44624,002
17,73410,647
181,22976,90354,19844,23529,581
21,12016,064
179,87676,98953,93743,97229,406
20,98616,057
81,71236,85649,90150,022
128.9
30.5
73.5
21.7
150.4
51.0
34.2
0.00.0
60,61340,06233,28130,03919,24910,214
7,3654,937
205,760
1,294865861793668342286222
5,331
773538453419282119
7961
2,724
8,588
classrooms
5,140318
81,008
62.369.085.862.558.7
25.019.3
12.7
11.037.524.7
11.73.10.0
16.6
1,81196
4767
3,479 3,452 29 21 5 43 587751 11 0 0 39 2
26 0 0 0 1 02 0 0 0 0 0
131 0 0 0 7 1
63 179 1,032 1,475 760 8 915 153 697 2,415 1,461 8 4 0
1 7 25 142 70 1 0 00 0 0 7 1 0 0 01 11 89 339 312 2 1 0
309 336 847 1,151 319 0 4 0
29013908
1880
665
84558
890
625 0 2195 400 0 1097 141 85 140000
132109
221215
0000
93933
0153
155906
7500
13
7002
Terminalgrade Passed
VIII boysV girlsV boys
VIII girls
0 with >60%
78.961215106
2499
769
69.013.2
0.016.9
62.657.311.777.812.6
286622Hindi Others Assamese Konkani Kannada
1660458513
19921305
18221161
00
35
199384
000
138164
00
152
57294
000
% Schools recvd.
36.079.618.550.024.5
32.370.514.850.028.1
1885591592
71455183
43744166
8715493
1568401289
51947201
16608125
2595503
1.56.49.24.55.5
49.532.121.610.6
15.28.4
17.5
6.330.1
100.0
0.82
2005-062004-052003-04
RAJASTHAN
24.1
Upper PrimaryPrimary
Sex ratio Sex ratio 0-6
8 91
VIII14.8
Enrolment of children
VIII 12,979 12,717 8,475 19,407Total Pr. 384,180 386,146 228,229 405,831
1 - 5 6 - 8
9 0732 37
0 0
52 197
%Teachers recvd.in-service training
Total schools* Rural schools* Total enrolment* Rural enrolment* Teachers*
29.8 31.5
100.0
34.9
90.6 49.9
21.8 9.0% SC enrolment% SC girls to SC enrolment% ST enrolment
44.9 23.76.6
40.5 14.3
63.3
46.0
65.2
29.2
Position of teachers by educational qualification (other than para teacher)
(Previous academic year)Incentives : Number of beneficiaries
% ST girls to ST enrolment
% Girls
Number of villages
% 0 - 6 population
% SC population % ST population
% Urban population
% Schools with blackboard
% Enrolment in single-teacher schools
% Enrolment in schools without building
Primary Upperprimary
OBC EnrolmentPrimary U. Primary
% OBCEnrolment% OBC girls toOBC Enrolment
Pupil-teacher ratio (PTR)Student-classroom ratio (SCR)% Schools with <= 50 students% Schools with PTR > 100% Female teachers
% Schools established since 1995
Regular teachers Para-teachers
% minorrepairs
% majorrepairs
# = not applicable na = not available * Some totals may not match due to no response in classificatory data items
2734
46.34734
33.54.9
16.778.6
37.23333
0.72.2
20.916.5
84.42225
0.00.0
100.050.0
29.12821
5.02.9
12.43.6
36.8 15.7 6.0 59.0 43.5
9198927.422.2
Category
PrivateGovt.PrivateGovtPrivateGovt.PrivateGovt.PrivateGovt.
Total population (in 000's)
Number of blocks/taluks
District
Decadal growth rate
Primary onlyPrimary with upper primaryPrimary with upper primary & sec/higher sec.Upper primary onlyUpper primary with sec./higher secondary
% Single classroom schools% Single teacher schools
P + UP P+sec/hs U.P. only UP+secP. only
No response in school category
Primary with upper primaryPrimary with U.P. & sec/higherUpper primary onlyUpper primary with sec./higher sec
Primary only
Primary onlyPrimary with upper primaryPrimary with Upper primary & sec/higherUpper primary only
Para-teachers
School category
Upper primary with sec./higher secondary
Primary onlyPrimary with upper prim.
P. onlyP + UPP+sec/hsU.P. onlyUP+sec
NER(U.Prim)GER(U.Prim)NER (Primary)GER (Primary)
Transition ratePrim. to U. Prim
3.2
SC/ST Enrolment
Indicators
Classrooms/Other rooms
Prim.with U.P.&Sec/H.SUpper Primary onlyU. Primary with Sec./H.S.
Basic Data, 2001
Data reported from
Performance indicators
96.5 53.796.2 51.782.4 32.784.8 28.7

438
Elementary Education in India - Where do we stand ?
Raj
asth
an 24.5 21.3
Key data: Elementary Education
2101
BHARATPUR
(Previous academic year)
(Previous year)
Gender and caste distribution of teachers*
No. of schools by type of building*
BoysWith disability
Flow rates
Primary Level
Enrolment*
Number of schools
Grade
GER / NER
School category
Primary Upper primaryBoys Boys GirlsGirls
IncentiveType
School categoryMultiple
TypeKuccha
PartiallyPucca
PuccaTotal % good condition
Otherrooms
TentNo
Building
Classrooms
Belowsecondary
Highersecondary
Postgraduate
M. Phil.GraduateSecondarySchool category OthersNo
response
ST teachers
Total Male Female No res Male Female No res Male Female Male FemaleSC teachers
Text booksUniformAttendanceStationery
% Passed
Avg. No. of Tchs.
%
Female literacyOverall literacy
dev. grant grantSchool T L M
Male Female
IVV
IIIIII
Grade R.R. D.O.R. P.R.
VIIVI
# #
I - V
Enrolment by medium of instructions
Examination results
Retention rate
GPI
Primary cycle U. primary cycleState
DISTRICT ELEMENTARY EDUCATION REPORT CARD : 2005-06
GirlsGrade
IIIIIIIVVVI
VIII
AllGirls
Total
VII
% TotalGrossness
School category
5803015
184
648 538182 29
134
9167
0 0 0
1,375 180449 131,387
86 7,1940 1,616
13 21,6240 0
1,264 153 130,585 14,639115,110 122,407 82,712
41,915 6,305 20,312151 1,064 0
0 0 05,760 18,934 2,334
142,041 17,051 3,5433,742
7604,362
P + UP P+sec/hs U.P. only UP+sec
School categoryP. only
3.7 1.0 0.0 6.3 0.921.4
Number of Clusters 32291400
% Schools with SCR > 600.4 0.0 0.0 1.8
13.6 13.3 1.9 6.3 1.8% Schools with pre-primary sections 3.9 5.8 9.9 0.0 0.9% Schools with common toilets 72.5 67.4 63.2 31.3 56.0
% Schools with girls toilets 18.3 53.7 82.5 37.5 61.5% Schools with drinking water facility 67.1 80.5 92.9 62.5 83.9
% Enrolment in Govt. schools 89.3 53.3 14.6 91.5 79.095.6 95.5 97.6 100.0 93.6
% No female teacher schools (tch>=2) 48.6 51.2 49.1 25.0 69.714.5 0.2 0.0 0.0 1.8
4.3 0.5 0.0 17.5 0.0%Enrolment in schools without blackboard 4.3 4.6 2.5 0.0 7.4
2001-02 2002-03 2003-04 2004-05 2005-06IIIIIIIVV
VIVII
Total U.P
93,20478,32868,57661,82956,78146,784
41,172
87,94674,47467,97154,78648,624
39,58332,590
86,65580,66562,84449,01043,056
32,96428,038
102,35574,50057,08145,27436,587
29,59326,152
125,131102,82686,56879,536
102.5
50.5
103.4
58.4
124.3
73.0
36.1
1.90.5
43,21036,77332,47129,79225,38018,87015,60513,017
215,118
437442440484443264248181
2,939
273243286332283147126109
1,799
4,199
classrooms
7,4792,160
791,809
74.083.396.178.581.0
19.812.3
6.2
3.413.912.2
4.40.67.66.7
2,036627
521,223
1,562 1,434 8 0 0 17 961,119 17 0 0 74 18
198 0 0 0 11 311 0 0 0 0 5
210 0 0 0 6 2
43 262 837 1,489 1,188 9 371 351 1,293 3,621 2,061 7 7 333
3 24 157 877 362 4 0 1070 1 15 20 28 1 0 17 28 114 423 621 2 0 17
26 47 167 361 162 0 2 0
312865441278
491041
1200256
17171
797 0 312 66 0 528 68 82 170000
19226
112
16817
31
0000
933115
6131
11785
13
20434
019
15600
Terminalgrade Passed
VIII boysV girlsV boys
VIII girls
94 with >60%
25.3430381041577
701225
11.51.7
18.00.4
23.213.3
1.85.04.1
153466Hindi Others English Bengali Gujarati
23688245601
148926532
300253571742
278393
25483
142200
0215
000
0198
000
% Schools recvd.
78.846.8
8.062.5
9.2
71.844.6
7.568.811.9
115029533
47726202
34032254
13620610
121105146544776345
26687362
5417612
2.86.67.44.45.6
14.810.5
9.04.9
6.95.9
10.2
3.49.4
90.6
0.88
2005-062004-052003-04
RAJASTHAN
17.3
Upper PrimaryPrimary
Sex ratio Sex ratio 0-6
9 103
VIII45.3
Enrolment of children
VIII 23,791 25,566 30,653 37,175Total Pr. 315,797 322,230 333,801 358,718
1 - 5 6 - 8
66 41,006 219
0 0
180 1,397
%Teachers recvd.in-service training
Total schools* Rural schools* Total enrolment* Rural enrolment* Teachers*
24.5 27.0
93.8
53.3
76.8 78.8
35.7 42.0% SC enrolment% SC girls to SC enrolment% ST enrolment
46.8 34.82.7
47.9 42.0
60.2
46.7
58.6
37.2
Position of teachers by educational qualification (other than para teacher)
(Previous academic year)Incentives : Number of beneficiaries
% ST girls to ST enrolment
% Girls
Number of villages
% 0 - 6 population
% SC population % ST population
% Urban population
% Schools with blackboard
% Enrolment in single-teacher schools
% Enrolment in schools without building
Primary Upperprimary
OBC EnrolmentPrimary U. Primary
% OBCEnrolment% OBC girls toOBC Enrolment
Pupil-teacher ratio (PTR)Student-classroom ratio (SCR)% Schools with <= 50 students% Schools with PTR > 100% Female teachers
% Schools established since 1995
Regular teachers Para-teachers
% minorrepairs
% majorrepairs
# = not applicable na = not available * Some totals may not match due to no response in classificatory data items
5.0 80.25.6 83.94.0 87.0
6.0 90.63.4 87.3
2331
49.33738
19.13.9
20.140.3
43.53033
1.81.1
16.948.8
28.92522
6.30.0
28.631.3
41.22215
12.81.8
14.016.5
27.0 21.7 2.2 63.6 43.6
87985419.520.4
Category
PrivateGovt.PrivateGovtPrivateGovt.PrivateGovt.PrivateGovt.
Total population (in 000's)
Number of blocks/taluks
District
Decadal growth rate
Primary onlyPrimary with upper primaryPrimary with upper primary & sec/higher sec.Upper primary onlyUpper primary with sec./higher secondary
% Single classroom schools% Single teacher schools
P + UP P+sec/hs U.P. only UP+secP. only
No response in school category
Primary with upper primaryPrimary with U.P. & sec/higherUpper primary onlyUpper primary with sec./higher sec
Primary only
Primary onlyPrimary with upper primaryPrimary with Upper primary & sec/higherUpper primary only
Para-teachers
School category
Upper primary with sec./higher secondary
Primary onlyPrimary with upper prim.
P. onlyP + UPP+sec/hsU.P. onlyUP+sec
NER(U.Prim)GER(U.Prim)NER (Primary)GER (Primary)
Transition ratePrim. to U. Prim
3.5
SC/ST Enrolment
Indicators
Classrooms/Other rooms
Prim.with U.P.&Sec/H.SUpper Primary onlyU. Primary with Sec./H.S.
Basic Data, 2001
Data reported from
Performance indicators
97.9 68.097.7 62.882.9 55.181.4 50.7

439
Elementary Education: Report Card - BHILWARA
Raj
asth
an19.4 16.2
Key data: Elementary Education
2014
BHILWARA
(Previous academic year)
(Previous year)
Gender and caste distribution of teachers*
No. of schools by type of building*
BoysWith disability
Flow rates
Primary Level
Enrolment*
Number of schools
Grade
GER / NER
School category
Primary Upper primaryBoys Boys GirlsGirls
IncentiveType
School categoryMultiple
TypeKuccha
PartiallyPucca
PuccaTotal % good condition
Otherrooms
TentNo
Building
Classrooms
Belowsecondary
Highersecondary
Postgraduate
M. Phil.GraduateSecondarySchool category OthersNo
response
ST teachers
Total Male Female No res Male Female No res Male Female Male FemaleSC teachers
Text booksUniformAttendanceStationery
% Passed
Avg. No. of Tchs.
%
Female literacyOverall literacy
dev. grant grantSchool T L M
Male Female
IVV
IIIIII
Grade R.R. D.O.R. P.R.
VIIVI
# #
I - V
Enrolment by medium of instructions
Examination results
Retention rate
GPI
Primary cycle U. primary cycleState
DISTRICT ELEMENTARY EDUCATION REPORT CARD : 2005-06
GirlsGrade
IIIIIIIVVVI
VIII
AllGirls
Total
VII
% TotalGrossness
School category
69535
0199
233 63531 31
05
0179
0 0 0
2,222 22878 128,49214 5,912
0 01 27,0060 0
2,105 167 136,845 11,45039,076 113,290 11,685
8,547 4,772 3,8610 0 0
0 0 01,031 22,954 86
146,374 17,847 4,4824,141
1,0991,868
P + UP P+sec/hs U.P. only UP+sec
School categoryP. only
2.4 0.4 0.0 0.0 0.537.4
Number of Clusters 36481732
% Schools with SCR > 601.1 0.0 0.0 2.5
2.7 5.1 1.5 0.0 0.5% Schools with pre-primary sections 11.1 21.6 25.8 0.0 0.5% Schools with common toilets 35.3 60.5 45.5 0.0 42.6
% Schools with girls toilets 14.5 49.0 66.7 0.0 47.5% Schools with drinking water facility 78.6 85.2 90.9 0.0 91.2
% Enrolment in Govt. schools 89.1 76.7 40.9 0.0 96.390.7 94.8 93.9 0.0 88.2
% No female teacher schools (tch>=2) 24.2 21.3 21.2 0.0 46.124.2 0.6 0.0 0.0 2.2
6.2 0.0 0.7 0.0 0.6%Enrolment in schools without blackboard 5.8 3.7 4.2 0.0 6.8
2001-02 2002-03 2003-04 2004-05 2005-06IIIIIIIVV
VIVII
Total U.P
80,89055,69348,76046,15248,08141,263
30,044
85,05663,59759,32457,10847,309
40,85327,895
79,26169,44957,30643,35336,585
30,12222,482
90,64268,32545,80637,03630,899
25,92420,301
91,93843,49332,42327,20321,200
17,36011,448
94,70993,53271,31362,09837,793
95.1
43.5
101.2
55.5
101.1
57.7
42.0
3.00.0
40,11926,50622,06920,07019,67214,56910,667
8,430162,102
1,085920981975908568391281
6,109
686553579485480311192115
3,401
5,796
classrooms
5,738621
01,512
68.570.983.4
0.066.2
22.019.2
9.4
13.80.0
23.6
9.82.70.0
10.2
2,026326
01,331
2,348 1,999 14 1 0 19 417830 4 0 0 24 69
62 0 0 0 0 40 0 0 0 0 0
182 0 0 0 6 16
64 232 1,247 1,509 1,324 4 2022 190 1,177 2,120 2,128 7 12 0
3 8 62 214 198 4 2 00 0 0 0 0 0 0 06 18 87 376 704 17 11 0
33 45 394 652 437 2 9 0
25293336
2690
930
2320222
0289
1871 0 859 322 0 776 212 123 290000
9980
17
254508
0000
86841
0185
21090
13
10690
19
33100
Terminalgrade Passed
VIII boysV girlsV boys
VIII girls
0 with >60%
67.255816009
5040
1244
63.121.7
0.03.8
50.742.111.9
0.03.4
161154Hindi English Others Kannada Kashmiri
16299712856
027898
84436231478
072
1595548
2800
1670000
1030000
% Schools recvd.
57.169.821.2
0.013.7
46.263.616.7
0.014.7
116790790
56194616
50630324
9499254
99576812
59155505
22447274
122221255
2.36.57.60.06.1
12.98.15.23.1
8.64.87.7
2.57.1
51.0
79.8
0.85
2005-062004-052003-04
RAJASTHAN
45.0
Upper PrimaryPrimary
Sex ratio Sex ratio 0-6
18 134
VIII18.2
Enrolment of children
8,985VIII 15,873 18,709 24,784 23,402Total Pr. 216,257 272,708 285,954 312,394 279,576
1 - 5 6 - 8
0 01,187 57
0 0
215 289
%Teachers recvd.in-service training
Total schools* Rural schools* Total enrolment* Rural enrolment* Teachers*
22.1 29.2
78.8
40.8
75.6 49.4
30.6 37.2% SC enrolment% SC girls to SC enrolment% ST enrolment
45.3 33.310.142.9 28.8
53.9
46.1
51.2
32.4
Position of teachers by educational qualification (other than para teacher)
(Previous academic year)Incentives : Number of beneficiaries
% ST girls to ST enrolment
% Girls
Number of villages
% 0 - 6 population
% SC population % ST population
% Urban population
% Schools with blackboard
% Enrolment in single-teacher schools
% Enrolment in schools without building
Primary Upperprimary
OBC EnrolmentPrimary U. Primary
% OBCEnrolment% OBC girls toOBC Enrolment
Pupil-teacher ratio (PTR)Student-classroom ratio (SCR)% Schools with <= 50 students% Schools with PTR > 100% Female teachers
% Schools established since 1995
Regular teachers Para-teachers
% minorrepairs
% majorrepairs
# = not applicable na = not available * Some totals may not match due to no response in classificatory data items
27.6 59.420.1 71.819.9 74.914.8 82.117.7 79.820.8 72.121.1 70.318.2 77.0
2329
45.72928
44.90.9
39.359.4
42.92829
4.20.3
42.818.5
0.000
0.00.00.00.0
32.52319
7.41.5
23.92.0
26.1 15.7 9.0 50.7 33.5
94996220.617.9
Category
PrivateGovt.PrivateGovtPrivateGovt.PrivateGovt.PrivateGovt.
Total population (in 000's)
Number of blocks/taluks
District
Decadal growth rate
Primary onlyPrimary with upper primaryPrimary with upper primary & sec/higher sec.Upper primary onlyUpper primary with sec./higher secondary
% Single classroom schools% Single teacher schools
P + UP P+sec/hs U.P. only UP+secP. only
No response in school category
Primary with upper primaryPrimary with U.P. & sec/higherUpper primary onlyUpper primary with sec./higher sec
Primary only
Primary onlyPrimary with upper primaryPrimary with Upper primary & sec/higherUpper primary only
Para-teachers
School category
Upper primary with sec./higher secondary
Primary onlyPrimary with upper prim.
P. onlyP + UPP+sec/hsU.P. onlyUP+sec
NER(U.Prim)GER(U.Prim)NER (Primary)GER (Primary)
Transition ratePrim. to U. Prim
7.3
SC/ST Enrolment
Indicators
Classrooms/Other rooms
Prim.with U.P.&Sec/H.SUpper Primary onlyU. Primary with Sec./H.S.
Basic Data, 2001
Data reported from
Performance indicators
97.2 49.397.2 48.589.4 43.492.2 46.9

440
Elementary Education in India - Where do we stand ?
Raj
asth
an
0.9330.897
25.1 14.7
Key data: Elementary Education
1674
BIKANER
(Previous academic year)
(Previous year)
Gender and caste distribution of teachers*
No. of schools by type of building*
BoysWith disability
Flow rates
Primary Level
Enrolment*
Number of schools
Grade
GER / NER
School category
Primary Upper primaryBoys Boys GirlsGirls
IncentiveType
School categoryMultiple
TypeKuccha
PartiallyPucca
PuccaTotal % good condition
Otherrooms
TentNo
Building
Classrooms
Belowsecondary
Highersecondary
Postgraduate
M. Phil.GraduateSecondarySchool category OthersNo
response
ST teachers
Total Male Female No res Male Female No res Male Female Male FemaleSC teachers
Text booksUniformAttendanceStationery
% Passed
Avg. No. of Tchs.
%
Female literacyOverall literacy
dev. grant grantSchool T L M
Male Female
IVV
IIIIII
Grade R.R. D.O.R. P.R.
VIIVI
# #
I - V
Enrolment by medium of instructions
Examination results
Retention rate
GPI
Primary cycle U. primary cycleState
DISTRICT ELEMENTARY EDUCATION REPORT CARD : 2005-06
GirlsGrade
IIIIIIIVVVI
VIII
AllGirls
Total
VII
% TotalGrossness
School category
42924
197
311 35385 11
020
185
0 0 0
1,461 160114 108,803
22 6,9540 833 13,6030 0
1,391 88 131,324 9,29351,937 96,262 21,34621,982 3,913 6,647
0 83 0
0 0 04,305 12,185 451
137,974 16,967 2,8403,182
6432,121
P + UP P+sec/hs U.P. only UP+sec
School categoryP. only
2.0 0.3 0.0 0.0 0.044.4
Number of Clusters 2588803
% Schools with SCR > 601.9 0.9 0.0 6.8
8.4 8.1 2.8 0.0 0.0% Schools with pre-primary sections 7.6 26.8 38.5 0.0 7.7% Schools with common toilets 69.2 64.3 55.0 100.0 49.6
% Schools with girls toilets 38.4 73.0 91.7 0.0 77.8% Schools with drinking water facility 50.5 77.7 95.4 100.0 92.3
% Enrolment in Govt. schools 89.0 67.7 24.0 100.0 76.091.4 96.2 95.4 100.0 92.3
% No female teacher schools (tch>=2) 23.9 21.5 9.2 100.0 29.133.9 1.0 1.1 0.0 7.1
1.9 0.0 0.0 0.0 0.0%Enrolment in schools without blackboard 6.7 2.9 4.6 0.0 5.4
2001-02 2002-03 2003-04 2004-05 2005-06IIIIIIIVV
VIVII
Total U.P
94,43665,03249,05643,21037,76229,752
23,640
90,03455,48348,47437,53931,542
24,26317,311
51,05542,43927,70519,75016,188
9,7626,995
81,97740,79727,55720,64016,422
10,9008,355
73,11256,18622,48825,850
61.4
16.1
99.0
38.8
125.9
53.5
40.8
3.70.9
44,59830,83122,57519,49215,78711,330
8,4956,783
159,891
861583532547502327236182
3,770
516336294246247137
9062
1,928
5,162
classrooms
5,2621,293
91,183
69.785.896.333.378.1
21.110.9
9.1
2.733.317.2
3.31.0
33.34.7
1,906437
3883
2,287 1,478 11 6 2 38 86663 10 2 1 47 17
94 0 0 0 9 61 0 0 0 0 0
114 1 0 0 1 1
72 197 618 992 782 16 945 221 790 2,161 1,830 13 19 0
8 25 93 467 332 3 12 20 0 0 2 3 0 0 04 27 61 261 305 1 1 0
75 97 260 393 222 3 1 0
17063169
5115
424
1910431
0236
980 0 681 116 0 490 95 21 90000
83407
14115
04
0000
53470
277
14715
017
40404
34002
Terminalgrade Passed
VIII boysV girlsV boys
VIII girls
0 with >60%
56.334835303
9615
671
40.96.2
20.08.1
48.937.3
8.5
12.1
142625Hindi Others English Marathi Kannada
14825722239
8315438
1093584773770
01983
0582
29270
283
0624
000
3010000
% Schools recvd.
41.553.4
6.4100.0
8.5
38.051.1
8.3100.0
12.0
1108682010
46619005
22822211
4305649
1007081731
52618174
14422211
21731371
2.17.28.85.05.7
22.413.6
9.45.1
6.85.47.1
3.113.4
89.1
0.85
2005-062004-052003-04
RAJASTHAN
46.4
Upper PrimaryPrimary
Sex ratio Sex ratio 0-6
9 70
VIII52.3
Enrolment of children
VIII 6,595 5,731 14,612 19,720Total Pr. 187,393 157,137 263,072 289,496
1 - 5 6 - 8
5 0526 145
0 0
230 731
%Teachers recvd.in-service training
Total schools* Rural schools* Total enrolment* Rural enrolment* Teachers*
27.0 31.6
91.9
36.6
45.4 64.5
11.2 28.0% SC enrolment% SC girls to SC enrolment% ST enrolment
43.9 31.1
44.1 44.3
49.0
46.9
54.7
35.4
Position of teachers by educational qualification (other than para teacher)
(Previous academic year)Incentives : Number of beneficiaries
% ST girls to ST enrolment
% Girls
Number of villages
% 0 - 6 population
% SC population % ST population
% Urban population
% Schools with blackboard
% Enrolment in single-teacher schools
% Enrolment in schools without building
Primary Upperprimary
OBC EnrolmentPrimary U. Primary
% OBCEnrolment% OBC girls toOBC Enrolment
Pupil-teacher ratio (PTR)Student-classroom ratio (SCR)% Schools with <= 50 students% Schools with PTR > 100% Female teachers
% Schools established since 1995
Regular teachers Para-teachers
% minorrepairs
% majorrepairs
# = not applicable na = not available * Some totals may not match due to no response in classificatory data items
13.8 63.96.2 80.25.4 85.2
7.9 89.17.5 79.1
2230
46.74430
21.88.8
31.563.0
42.93031
4.91.8
38.742.7
13.317
90.00.00.00.0
37.32715
3.45.1
35.819.7
38.2 20.0 0.4 56.9 42.0
91689035.519.5
Category
PrivateGovt.PrivateGovtPrivateGovt.PrivateGovt.PrivateGovt.
Total population (in 000's)
Number of blocks/taluks
District
Decadal growth rate
Primary onlyPrimary with upper primaryPrimary with upper primary & sec/higher sec.Upper primary onlyUpper primary with sec./higher secondary
% Single classroom schools% Single teacher schools
P + UP P+sec/hs U.P. only UP+secP. only
No response in school category
Primary with upper primaryPrimary with U.P. & sec/higherUpper primary onlyUpper primary with sec./higher sec
Primary only
Primary onlyPrimary with upper primaryPrimary with Upper primary & sec/higherUpper primary only
Para-teachers
School category
Upper primary with sec./higher secondary
Primary onlyPrimary with upper prim.
P. onlyP + UPP+sec/hsU.P. onlyUP+sec
NER(U.Prim)GER(U.Prim)NER (Primary)GER (Primary)
Transition ratePrim. to U. Prim
SC/ST Enrolment
Indicators
Classrooms/Other rooms
Prim.with U.P.&Sec/H.SUpper Primary onlyU. Primary with Sec./H.S.
Basic Data, 2001
Data reported from
Performance indicators
97.8 58.198.2 58.586.6 45.386.6 47.2
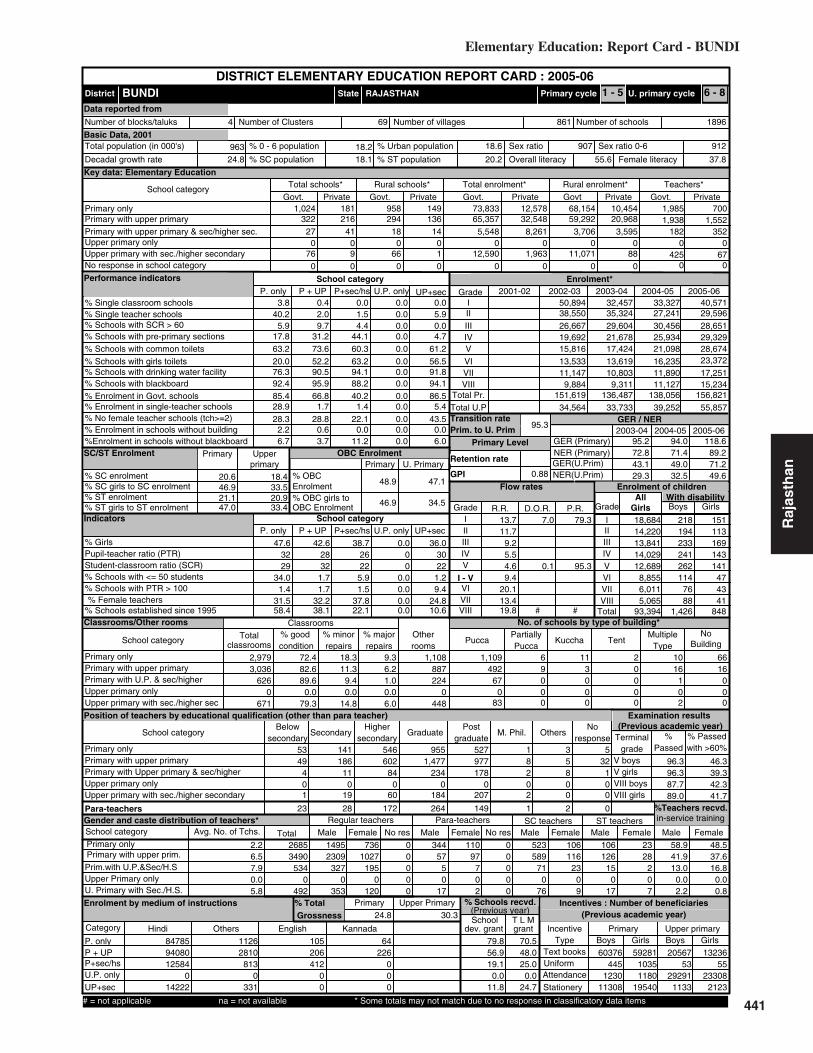
441
Elementary Education: Report Card - BUNDI
Raj
asth
an20.6 18.4
Key data: Elementary Education
963
BUNDI
(Previous academic year)
(Previous year)
Gender and caste distribution of teachers*
No. of schools by type of building*
BoysWith disability
Flow rates
Primary Level
Enrolment*
Number of schools
Grade
GER / NER
School category
Primary Upper primaryBoys Boys GirlsGirls
IncentiveType
School categoryMultiple
TypeKuccha
PartiallyPucca
PuccaTotal % good condition
Otherrooms
TentNo
Building
Classrooms
Belowsecondary
Highersecondary
Postgraduate
M. Phil.GraduateSecondarySchool category OthersNo
response
ST teachers
Total Male Female No res Male Female No res Male Female Male FemaleSC teachers
Text booksUniformAttendanceStationery
% Passed
Avg. No. of Tchs.
%
Female literacyOverall literacy
dev. grant grantSchool T L M
Male Female
IVV
IIIIII
Grade R.R. D.O.R. P.R.
VIIVI
# #
I - V
Enrolment by medium of instructions
Examination results
Retention rate
GPI
Primary cycle U. primary cycleState
DISTRICT ELEMENTARY EDUCATION REPORT CARD : 2005-06
GirlsGrade
IIIIIIIVVVI
VIII
AllGirls
Total
VII
% TotalGrossness
School category
32227
076
216 29441 18
09
066
0 0 0
1,024 181136 65,357
14 5,5480 01 12,5900 0
958 149 68,154 10,45432,548 59,292 20,968
8,261 3,706 3,5950 0 0
0 0 01,963 11,071 88
73,833 12,578 1,9851,938
7001,552
P + UP P+sec/hs U.P. only UP+sec
School categoryP. only
3.8 0.4 0.0 0.0 0.040.2
Number of Clusters 1896861
% Schools with SCR > 602.0 1.5 0.0 5.9
5.9 9.7 4.4 0.0 0.0% Schools with pre-primary sections 17.8 31.2 44.1 0.0 4.7% Schools with common toilets 63.2 73.6 60.3 0.0 61.2
% Schools with girls toilets 20.0 52.2 63.2 0.0 56.5% Schools with drinking water facility 76.3 90.5 94.1 0.0 91.8
% Enrolment in Govt. schools 85.4 66.8 40.2 0.0 86.592.4 95.9 88.2 0.0 94.1
% No female teacher schools (tch>=2) 28.3 28.8 22.1 0.0 43.528.9 1.7 1.4 0.0 5.4
2.2 0.6 0.0 0.0 0.0%Enrolment in schools without blackboard 6.7 3.7 11.2 0.0 6.0
2001-02 2002-03 2003-04 2004-05 2005-06IIIIIIIVV
VIVII
Total U.P
40,57129,59628,65129,32928,67423,372
17,251
33,32727,24130,45625,93421,098
16,23511,890
32,45735,32429,60421,67817,424
13,61910,803
50,89438,55026,66719,69215,816
13,53311,147
55,85739,25233,73334,564
95.2
43.1
94.0
49.0
118.6
71.2
38.7
5.91.5
18,68414,22013,84114,02912,689
8,8556,0115,065
93,394
218194233241262114
7688
1,426
151113169143141
474341
848
2,979
classrooms
3,036626
0671
72.482.689.6
0.079.3
18.311.3
9.3
9.40.0
14.8
6.21.00.06.0
887224
0448
1,108 1,109 6 11 2 10 66492 9 3 0 16 16
67 0 0 0 1 00 0 0 0 0 0
83 0 0 0 2 0
53 141 546 955 527 1 349 186 602 1,477 977 8 5 32
4 11 84 234 178 2 8 10 0 0 0 0 0 0 01 19 60 184 207 2 0 0
23 28 172 264 149 1 2 0
14952309
3270
353
1027195
0120
736 0 344 110 0 523 106 106 230000
5750
17
97702
0000
58971
076
11623
09
12615
017
28207
Terminalgrade Passed
VIII boysV girlsV boys
VIII girls
5 with >60%
58.926853490
5340
492
41.913.0
0.02.2
48.537.616.8
0.00.8
84785Hindi Others English Kannada
9408012584
014222
11262810
8130
331
105206412
00
64226
000
% Schools recvd.
79.856.919.1
0.011.8
70.548.025.0
0.024.7
60376445
123011308
2056753
292911133
5928110351180
19540
1323655
233082123
2.26.57.90.05.8
13.711.7
9.25.5
20.113.419.8
4.69.4
95.3
0.88
2005-062004-052003-04
RAJASTHAN
37.8
Upper PrimaryPrimary
Sex ratio Sex ratio 0-6
4 69
VIII22.1
Enrolment of children
VIII 9,884 9,311 11,127 15,234Total Pr. 151,619 136,487 138,056 156,821
1 - 5 6 - 8
0 0425 67
0 0
182 352
%Teachers recvd.in-service training
Total schools* Rural schools* Total enrolment* Rural enrolment* Teachers*
24.8 30.3
89.2
49.6
72.8 71.4
29.3 32.5% SC enrolment% SC girls to SC enrolment% ST enrolment
46.9 33.521.147.0 33.4
48.9
46.9
47.1
34.5
Position of teachers by educational qualification (other than para teacher)
(Previous academic year)Incentives : Number of beneficiaries
% ST girls to ST enrolment
% Girls
Number of villages
% 0 - 6 population
% SC population % ST population
% Urban population
% Schools with blackboard
% Enrolment in single-teacher schools
% Enrolment in schools without building
Primary Upperprimary
OBC EnrolmentPrimary U. Primary
% OBCEnrolment% OBC girls toOBC Enrolment
Pupil-teacher ratio (PTR)Student-classroom ratio (SCR)% Schools with <= 50 students% Schools with PTR > 100% Female teachers
% Schools established since 1995
Regular teachers Para-teachers
% minorrepairs
% majorrepairs
# = not applicable na = not available * Some totals may not match due to no response in classificatory data items
7.0 79.3
0.1 95.32226
47.63229
34.01.4
31.558.4
42.62832
1.71.7
32.238.1
0.000
0.00.00.00.0
36.03022
1.29.4
24.810.6
24.8 18.1 20.2 55.6 37.8
91290718.618.2
Category
PrivateGovt.PrivateGovtPrivateGovt.PrivateGovt.PrivateGovt.
Total population (in 000's)
Number of blocks/taluks
District
Decadal growth rate
Primary onlyPrimary with upper primaryPrimary with upper primary & sec/higher sec.Upper primary onlyUpper primary with sec./higher secondary
% Single classroom schools% Single teacher schools
P + UP P+sec/hs U.P. only UP+secP. only
No response in school category
Primary with upper primaryPrimary with U.P. & sec/higherUpper primary onlyUpper primary with sec./higher sec
Primary only
Primary onlyPrimary with upper primaryPrimary with Upper primary & sec/higherUpper primary only
Para-teachers
School category
Upper primary with sec./higher secondary
Primary onlyPrimary with upper prim.
P. onlyP + UPP+sec/hsU.P. onlyUP+sec
NER(U.Prim)GER(U.Prim)NER (Primary)GER (Primary)
Transition ratePrim. to U. Prim
20.9
SC/ST Enrolment
Indicators
Classrooms/Other rooms
Prim.with U.P.&Sec/H.SUpper Primary onlyU. Primary with Sec./H.S.
Basic Data, 2001
Data reported from
Performance indicators
96.3 46.396.3 39.387.7 42.389.0 41.7
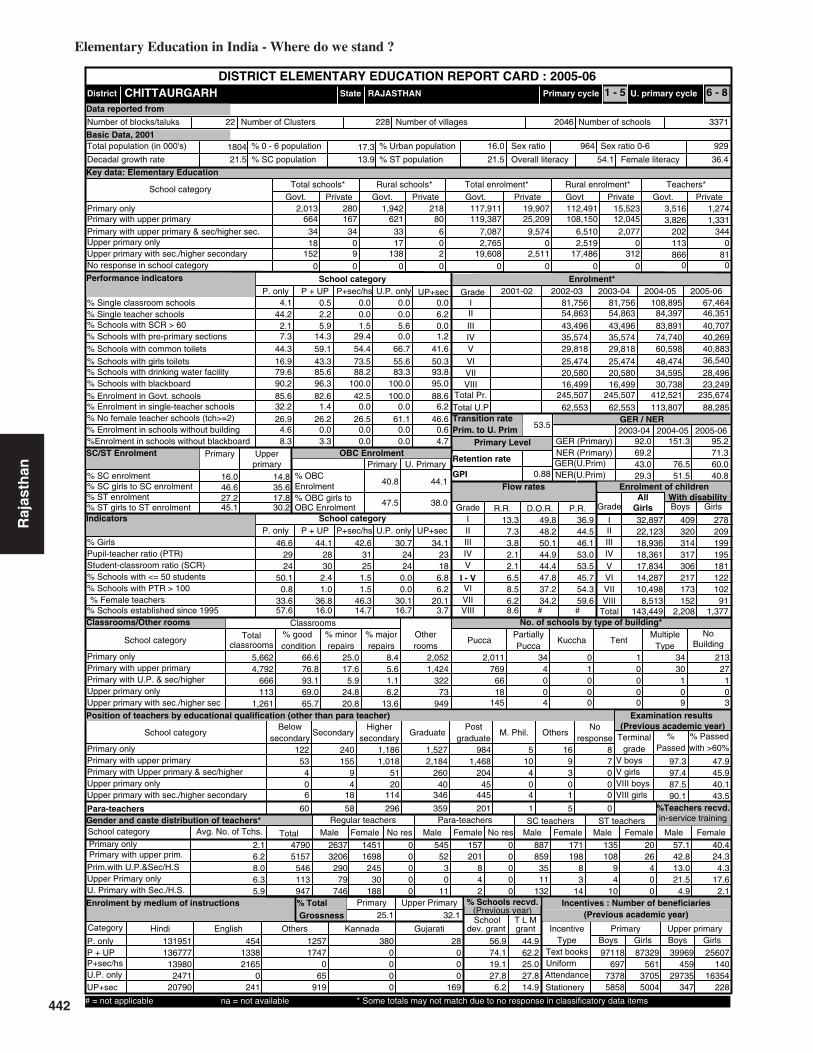
442
Elementary Education in India - Where do we stand ?
Raj
asth
an 16.0 14.8
Key data: Elementary Education
1804
CHITTAURGARH
(Previous academic year)
(Previous year)
Gender and caste distribution of teachers*
No. of schools by type of building*
BoysWith disability
Flow rates
Primary Level
Enrolment*
Number of schools
Grade
GER / NER
School category
Primary Upper primaryBoys Boys GirlsGirls
IncentiveType
School categoryMultiple
TypeKuccha
PartiallyPucca
PuccaTotal % good condition
Otherrooms
TentNo
Building
Classrooms
Belowsecondary
Highersecondary
Postgraduate
M. Phil.GraduateSecondarySchool category OthersNo
response
ST teachers
Total Male Female No res Male Female No res Male Female Male FemaleSC teachers
Text booksUniformAttendanceStationery
% Passed
Avg. No. of Tchs.
%
Female literacyOverall literacy
dev. grant grantSchool T L M
Male Female
IVV
IIIIII
Grade R.R. D.O.R. P.R.
VIIVI
# #
I - V
Enrolment by medium of instructions
Examination results
Retention rate
GPI
Primary cycle U. primary cycleState
DISTRICT ELEMENTARY EDUCATION REPORT CARD : 2005-06
GirlsGrade
IIIIIIIVVVI
VIII
AllGirls
Total
VII
% TotalGrossness
School category
6643418
152
167 62134 33
09
17138
0 0 0
2,013 28080 119,387
6 7,0870 2,7652 19,6080 0
1,942 218 112,491 15,52325,209 108,150 12,045
9,574 6,510 2,0770 2,519 0
0 0 02,511 17,486 312
117,911 19,907 3,5163,826
1,2741,331
P + UP P+sec/hs U.P. only UP+sec
School categoryP. only
4.1 0.5 0.0 0.0 0.044.2
Number of Clusters 33712046
% Schools with SCR > 602.2 0.0 0.0 6.2
2.1 5.9 1.5 5.6 0.0% Schools with pre-primary sections 7.3 14.3 29.4 0.0 1.2% Schools with common toilets 44.3 59.1 54.4 66.7 41.6
% Schools with girls toilets 16.9 43.3 73.5 55.6 50.3% Schools with drinking water facility 79.6 85.6 88.2 83.3 93.8
% Enrolment in Govt. schools 85.6 82.6 42.5 100.0 88.690.2 96.3 100.0 100.0 95.0
% No female teacher schools (tch>=2) 26.9 26.2 26.5 61.1 46.632.2 1.4 0.0 0.0 6.2
4.6 0.0 0.0 0.0 0.6%Enrolment in schools without blackboard 8.3 3.3 0.0 0.0 4.7
2001-02 2002-03 2003-04 2004-05 2005-06IIIIIIIVV
VIVII
Total U.P
67,46446,35140,70740,26940,88336,540
28,496
108,89584,39783,89174,74060,598
48,47434,595
81,75654,86343,49635,57429,818
25,47420,580
81,75654,86343,49635,57429,818
25,47420,580
88,285113,80762,55362,553
92.0
43.0
151.3
76.5
95.2
60.0
42.6
1.51.5
32,89722,12318,93618,36117,83414,28710,498
8,513143,449
409320314317306217173152
2,208
278209199195181122102
911,377
5,662
classrooms
4,792666113
1,261
66.676.893.169.065.7
25.017.6
8.4
5.924.820.8
5.61.16.2
13.6
1,424322
73949
2,052 2,011 34 0 1 34 213769 4 1 0 30 27
66 0 0 0 1 118 0 0 0 0 0
145 4 0 0 9 3
122 240 1,186 1,527 984 5 1653 155 1,018 2,184 1,468 10 9 7
4 9 51 260 204 4 3 00 4 20 40 45 0 0 06 18 114 346 445 4 1 0
60 58 296 359 201 1 5 0
26373206
29079
746
1698245
30188
1451 0 545 157 0 887 171 135 200000
5230
11
201842
0000
8593511
132
19883
14
10894
10
26400
Terminalgrade Passed
VIII boysV girlsV boys
VIII girls
8 with >60%
57.147905157
546113947
42.813.021.5
4.9
40.424.3
4.317.6
2.1
131951Hindi English Others Kannada Gujarati
13677713980
247120790
45413382165
0241
12571747
065
919
3800000
28000
169
% Schools recvd.
56.974.119.127.8
6.2
44.962.225.027.814.9
97118697
73785858
39969459
29735347
87329561
37055004
25607140
16354228
2.16.28.06.35.9
13.37.33.82.1
8.56.28.6
2.16.5
53.5
0.88
2005-062004-052003-04
RAJASTHAN
46.3
Upper PrimaryPrimary
Sex ratio Sex ratio 0-6
22 228
VIII14.7
Enrolment of children
VIII 16,499 16,499 30,738 23,249Total Pr. 245,507 245,507 412,521 235,674
1 - 5 6 - 8
113 0866 81
0 0
202 344
%Teachers recvd.in-service training
Total schools* Rural schools* Total enrolment* Rural enrolment* Teachers*
25.1 32.1
71.3
40.8
69.2
29.3 51.5% SC enrolment% SC girls to SC enrolment% ST enrolment
46.6 35.627.245.1 30.2
40.8
47.5
44.1
38.0
Position of teachers by educational qualification (other than para teacher)
(Previous academic year)Incentives : Number of beneficiaries
% ST girls to ST enrolment
% Girls
Number of villages
% 0 - 6 population
% SC population % ST population
% Urban population
% Schools with blackboard
% Enrolment in single-teacher schools
% Enrolment in schools without building
Primary Upperprimary
OBC EnrolmentPrimary U. Primary
% OBCEnrolment% OBC girls toOBC Enrolment
Pupil-teacher ratio (PTR)Student-classroom ratio (SCR)% Schools with <= 50 students% Schools with PTR > 100% Female teachers
% Schools established since 1995
Regular teachers Para-teachers
% minorrepairs
% majorrepairs
# = not applicable na = not available * Some totals may not match due to no response in classificatory data items
49.8 36.948.2 44.550.1 46.144.9 53.044.4 53.547.8 45.737.2 54.334.2 59.6
2531
46.62924
50.10.8
33.657.6
44.12830
2.41.0
36.816.0
30.72424
0.00.0
30.116.7
34.12318
6.86.2
20.13.7
21.5 13.9 21.5 54.1 36.4
92996416.017.3
Category
PrivateGovt.PrivateGovtPrivateGovt.PrivateGovt.PrivateGovt.
Total population (in 000's)
Number of blocks/taluks
District
Decadal growth rate
Primary onlyPrimary with upper primaryPrimary with upper primary & sec/higher sec.Upper primary onlyUpper primary with sec./higher secondary
% Single classroom schools% Single teacher schools
P + UP P+sec/hs U.P. only UP+secP. only
No response in school category
Primary with upper primaryPrimary with U.P. & sec/higherUpper primary onlyUpper primary with sec./higher sec
Primary only
Primary onlyPrimary with upper primaryPrimary with Upper primary & sec/higherUpper primary only
Para-teachers
School category
Upper primary with sec./higher secondary
Primary onlyPrimary with upper prim.
P. onlyP + UPP+sec/hsU.P. onlyUP+sec
NER(U.Prim)GER(U.Prim)NER (Primary)GER (Primary)
Transition ratePrim. to U. Prim
17.8
SC/ST Enrolment
Indicators
Classrooms/Other rooms
Prim.with U.P.&Sec/H.SUpper Primary onlyU. Primary with Sec./H.S.
Basic Data, 2001
Data reported from
Performance indicators
97.3 47.997.4 45.987.5 40.190.1 43.5
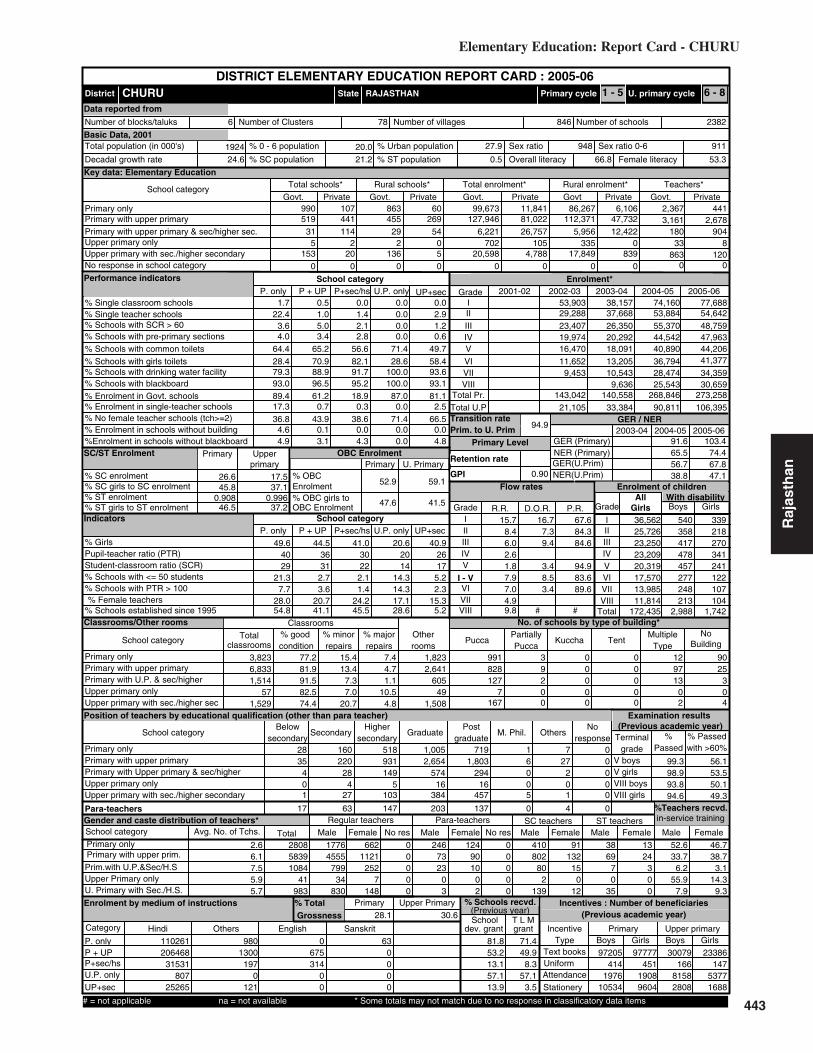
443
Elementary Education: Report Card - CHURU
Raj
asth
an
0.9960.908
26.6 17.5
Key data: Elementary Education
1924
CHURU
(Previous academic year)
(Previous year)
Gender and caste distribution of teachers*
No. of schools by type of building*
BoysWith disability
Flow rates
Primary Level
Enrolment*
Number of schools
Grade
GER / NER
School category
Primary Upper primaryBoys Boys GirlsGirls
IncentiveType
School categoryMultiple
TypeKuccha
PartiallyPucca
PuccaTotal % good condition
Otherrooms
TentNo
Building
Classrooms
Belowsecondary
Highersecondary
Postgraduate
M. Phil.GraduateSecondarySchool category OthersNo
response
ST teachers
Total Male Female No res Male Female No res Male Female Male FemaleSC teachers
Text booksUniformAttendanceStationery
% Passed
Avg. No. of Tchs.
%
Female literacyOverall literacy
dev. grant grantSchool T L M
Male Female
IVV
IIIIII
Grade R.R. D.O.R. P.R.
VIIVI
# #
I - V
Enrolment by medium of instructions
Examination results
Retention rate
GPI
Primary cycle U. primary cycleState
DISTRICT ELEMENTARY EDUCATION REPORT CARD : 2005-06
GirlsGrade
IIIIIIIVVVI
VIII
AllGirls
Total
VII
% TotalGrossness
School category
51931
5153
441 455114 29
220
2136
0 0 0
990 107269 127,946
54 6,2210 7025 20,5980 0
863 60 86,267 6,10681,022 112,371 47,73226,757 5,956 12,422
105 335 0
0 0 04,788 17,849 839
99,673 11,841 2,3673,161
4412,678
P + UP P+sec/hs U.P. only UP+sec
School categoryP. only
1.7 0.5 0.0 0.0 0.022.4
Number of Clusters 2382846
% Schools with SCR > 601.0 1.4 0.0 2.9
3.6 5.0 2.1 0.0 1.2% Schools with pre-primary sections 4.0 3.4 2.8 0.0 0.6% Schools with common toilets 64.4 65.2 56.6 71.4 49.7
% Schools with girls toilets 28.4 70.9 82.1 28.6 58.4% Schools with drinking water facility 79.3 88.9 91.7 100.0 93.6
% Enrolment in Govt. schools 89.4 61.2 18.9 87.0 81.193.0 96.5 95.2 100.0 93.1
% No female teacher schools (tch>=2) 36.8 43.9 38.6 71.4 66.517.3 0.7 0.3 0.0 2.5
4.6 0.1 0.0 0.0 0.0%Enrolment in schools without blackboard 4.9 3.1 4.3 0.0 4.8
2001-02 2002-03 2003-04 2004-05 2005-06IIIIIIIVV
VIVII
Total U.P
77,68854,64248,75947,96344,20641,377
34,359
74,16053,88455,37044,54240,890
36,79428,474
38,15737,66826,35020,29218,091
13,20510,543
53,90329,28823,40719,97416,470
11,6529,453
106,39590,81133,38421,105
91.6
56.7
103.4
67.8
41.0
2.11.4
36,56225,72623,25023,20920,31917,57013,98511,814
172,435
540358417478457277248213
2,988
339218270341241122107104
1,742
3,823
classrooms
6,8331,514
571,529
77.281.991.582.574.4
15.413.4
7.4
7.37.0
20.7
4.71.1
10.54.8
2,641605
491,508
1,823 991 3 0 0 12 90828 9 0 0 97 25127 2 0 0 13 3
7 0 0 0 0 0167 0 0 0 2 4
28 160 518 1,005 719 1 735 220 931 2,654 1,803 6 27 0
4 28 149 574 294 0 2 00 4 5 16 16 0 0 01 27 103 384 457 5 1 0
17 63 147 203 137 0 4 0
17764555
79934
830
1121252
7148
662 0 246 124 0 410 91 38 130000
7323
03
9010
02
0000
80280
2139
13215
012
6970
35
24300
Terminalgrade Passed
VIII boysV girlsV boys
VIII girls
0 with >60%
52.6280858391084
41983
33.76.2
55.97.9
46.738.7
3.114.3
9.3
110261Hindi Others English Sanskrit
20646831531
80725265
9801300
1970
121
0675314
00
630000
% Schools recvd.
81.853.213.157.113.9
71.449.9
8.357.1
3.5
97205414
197610534
30079166
81582808
97777451
19089604
23386147
53771688
2.66.17.55.95.7
15.78.46.02.6
7.04.99.8
1.87.9
94.9
0.90
2005-062004-052003-04
RAJASTHAN
24.2
Upper PrimaryPrimary
Sex ratio Sex ratio 0-6
6 78
VIII45.5
Enrolment of children
VIII 9,636 25,543 30,659Total Pr. 143,042 140,558 268,846 273,258
1 - 5 6 - 8
33 8863 120
0 0
180 904
%Teachers recvd.in-service training
Total schools* Rural schools* Total enrolment* Rural enrolment* Teachers*
28.1 30.6
74.4
47.1
65.5
38.8% SC enrolment% SC girls to SC enrolment% ST enrolment
45.8 37.1
46.5 37.2
52.9
47.6
59.1
41.5
Position of teachers by educational qualification (other than para teacher)
(Previous academic year)Incentives : Number of beneficiaries
% ST girls to ST enrolment
% Girls
Number of villages
% 0 - 6 population
% SC population % ST population
% Urban population
% Schools with blackboard
% Enrolment in single-teacher schools
% Enrolment in schools without building
Primary Upperprimary
OBC EnrolmentPrimary U. Primary
% OBCEnrolment% OBC girls toOBC Enrolment
Pupil-teacher ratio (PTR)Student-classroom ratio (SCR)% Schools with <= 50 students% Schools with PTR > 100% Female teachers
% Schools established since 1995
Regular teachers Para-teachers
% minorrepairs
% majorrepairs
# = not applicable na = not available * Some totals may not match due to no response in classificatory data items
16.7 67.67.3 84.39.4 84.6
3.4 94.98.5 83.63.4 89.6
2230
49.64029
21.37.7
28.054.8
44.53631
2.73.6
20.741.1
20.62014
14.314.317.128.6
40.92617
5.22.3
15.35.2
24.6 21.2 0.5 66.8 53.3
91194827.920.0
Category
PrivateGovt.PrivateGovtPrivateGovt.PrivateGovt.PrivateGovt.
Total population (in 000's)
Number of blocks/taluks
District
Decadal growth rate
Primary onlyPrimary with upper primaryPrimary with upper primary & sec/higher sec.Upper primary onlyUpper primary with sec./higher secondary
% Single classroom schools% Single teacher schools
P + UP P+sec/hs U.P. only UP+secP. only
No response in school category
Primary with upper primaryPrimary with U.P. & sec/higherUpper primary onlyUpper primary with sec./higher sec
Primary only
Primary onlyPrimary with upper primaryPrimary with Upper primary & sec/higherUpper primary only
Para-teachers
School category
Upper primary with sec./higher secondary
Primary onlyPrimary with upper prim.
P. onlyP + UPP+sec/hsU.P. onlyUP+sec
NER(U.Prim)GER(U.Prim)NER (Primary)GER (Primary)
Transition ratePrim. to U. Prim
SC/ST Enrolment
Indicators
Classrooms/Other rooms
Prim.with U.P.&Sec/H.SUpper Primary onlyU. Primary with Sec./H.S.
Basic Data, 2001
Data reported from
Performance indicators
99.3 56.198.9 53.593.8 50.194.6 49.3

444
Elementary Education in India - Where do we stand ?
Raj
asth
an 22.8 20.8
Key data: Elementary Education
1317
DAUSA
(Previous academic year)
(Previous year)
Gender and caste distribution of teachers*
No. of schools by type of building*
BoysWith disability
Flow rates
Primary Level
Enrolment*
Number of schools
Grade
GER / NER
School category
Primary Upper primaryBoys Boys GirlsGirls
IncentiveType
School categoryMultiple
TypeKuccha
PartiallyPucca
PuccaTotal % good condition
Otherrooms
TentNo
Building
Classrooms
Belowsecondary
Highersecondary
Postgraduate
M. Phil.GraduateSecondarySchool category OthersNo
response
ST teachers
Total Male Female No res Male Female No res Male Female Male FemaleSC teachers
Text booksUniformAttendanceStationery
% Passed
Avg. No. of Tchs.
%
Female literacyOverall literacy
dev. grant grantSchool T L M
Male Female
IVV
IIIIII
Grade R.R. D.O.R. P.R.
VIIVI
# #
I - V
Enrolment by medium of instructions
Examination results
Retention rate
GPI
Primary cycle U. primary cycleState
DISTRICT ELEMENTARY EDUCATION REPORT CARD : 2005-06
GirlsGrade
IIIIIIIVVVI
VIII
AllGirls
Total
VII
% TotalGrossness
School category
40126
999
325 396102 26
08
895
0 0 0
1,217 100287 98,604
78 6,3470 5756 16,3130 0
1,178 97 106,333 10,27256,312 97,437 49,90523,684 6,347 18,371
0 477 0
0 0 02,831 15,765 1,854
110,457 10,657 2,5722,610
4532,160
P + UP P+sec/hs U.P. only UP+sec
School categoryP. only
3.4 0.8 0.0 0.0 0.030.7
Number of Clusters 2287934
% Schools with SCR > 600.1 0.8 0.0 2.8
7.1 9.6 2.3 0.0 0.9% Schools with pre-primary sections 7.7 25.3 32.8 22.2 1.9% Schools with common toilets 47.2 72.3 61.7 33.3 53.3
% Schools with girls toilets 14.8 51.1 71.9 33.3 49.5% Schools with drinking water facility 83.8 90.9 96.9 100.0 91.6
% Enrolment in Govt. schools 91.2 63.6 21.1 100.0 85.290.7 96.0 95.3 88.9 89.7
% No female teacher schools (tch>=2) 48.4 56.7 48.4 66.7 66.421.3 0.1 0.6 0.0 3.8
5.6 0.2 0.1 7.5 0.7%Enrolment in schools without blackboard 8.9 4.3 3.4 4.0 13.2
2001-02 2002-03 2003-04 2004-05 2005-06IIIIIIIVV
VIVII
Total U.P
66,94650,97142,54438,51038,13232,922
29,321
66,99749,40043,28038,70835,163
29,57523,379
60,53751,93842,38234,64831,932
23,59018,864
79,31056,26742,52136,98330,539
23,78221,129
88,67774,20260,63264,272
111.2
55.8
113.6
66.2
131.1
82.6
35.7
2.32.3
31,64525,07821,01118,77917,55513,33210,844
8,927147,171
352282292287260171147136
1,927
232196190200166
805351
1,168
3,460
classrooms
4,6221,240
21911
65.879.387.481.074.8
21.914.5
12.3
10.19.5
18.1
6.32.59.57.1
1,523459
28664
1,467 1,122 7 0 5 12 171628 12 0 2 44 40110 0 0 1 9 8
7 0 0 0 0 299 0 0 0 1 7
57 122 468 953 784 10 153 156 707 2,211 1,435 14 10 52
1 34 110 534 238 7 4 263 1 3 10 16 1 0 02 12 50 222 297 2 11 0
16 25 144 385 210 4 5 0
20374058
80828
515
580146
681
366 0 546 76 0 755 66 248 120000
8016
010
52514
0000
1019162
1493
10618
014
33044
152
24325
Terminalgrade Passed
VIII boysV girlsV boys
VIII girls
8 with >60%
68.430254770
97535
610
37.56.9
85.79.9
52.736.1
4.614.3
9.4
119627Hindi Others Un-Specified Kannada English
14993029326
57518159
8501980
00
536
45618127
00
00
1700
256
170254
000
% Schools recvd.
82.551.7
7.877.812.1
40.048.111.777.819.6
80306125
11877361
2151322
7203322
88545402
116011212
1539324
42244424
2.36.67.63.95.7
21.815.9
8.43.8
5.83.7
10.9
2.712.2
88.7
0.93
2005-062004-052003-04
RAJASTHAN
15.5
Upper PrimaryPrimary
Sex ratio Sex ratio 0-6
5 72
VIII32.8
Enrolment of children
VIII 19,361 18,178 21,248 26,434Total Pr. 245,620 221,437 233,548 237,103
1 - 5 6 - 8
35 0517 93
0 0
151 824
%Teachers recvd.in-service training
Total schools* Rural schools* Total enrolment* Rural enrolment* Teachers*
28.2 27.5
94.1
59.8
80.3 81.9
39.8 47.9% SC enrolment% SC girls to SC enrolment% ST enrolment
47.7 34.128.748.9 38.5
34.9
47.9
32.0
34.2
Position of teachers by educational qualification (other than para teacher)
(Previous academic year)Incentives : Number of beneficiaries
% ST girls to ST enrolment
% Girls
Number of villages
% 0 - 6 population
% SC population % ST population
% Urban population
% Schools with blackboard
% Enrolment in single-teacher schools
% Enrolment in schools without building
Primary Upperprimary
OBC EnrolmentPrimary U. Primary
% OBCEnrolment% OBC girls toOBC Enrolment
Pupil-teacher ratio (PTR)Student-classroom ratio (SCR)% Schools with <= 50 students% Schools with PTR > 100% Female teachers
% Schools established since 1995
Regular teachers Para-teachers
% minorrepairs
% majorrepairs
# = not applicable na = not available * Some totals may not match due to no response in classificatory data items
13.8 64.45.4 78.76.0 85.60.2 96.18.6 88.77.5 80.3
2431
51.04035
18.33.0
14.662.0
43.23234
1.40.6
13.237.5
29.71627
33.30.0
20.033.3
39.53121
0.95.6
13.91.9
32.4 21.2 26.8 61.8 42.3
90689910.320.1
Category
PrivateGovt.PrivateGovtPrivateGovt.PrivateGovt.PrivateGovt.
Total population (in 000's)
Number of blocks/taluks
District
Decadal growth rate
Primary onlyPrimary with upper primaryPrimary with upper primary & sec/higher sec.Upper primary onlyUpper primary with sec./higher secondary
% Single classroom schools% Single teacher schools
P + UP P+sec/hs U.P. only UP+secP. only
No response in school category
Primary with upper primaryPrimary with U.P. & sec/higherUpper primary onlyUpper primary with sec./higher sec
Primary only
Primary onlyPrimary with upper primaryPrimary with Upper primary & sec/higherUpper primary only
Para-teachers
School category
Upper primary with sec./higher secondary
Primary onlyPrimary with upper prim.
P. onlyP + UPP+sec/hsU.P. onlyUP+sec
NER(U.Prim)GER(U.Prim)NER (Primary)GER (Primary)
Transition ratePrim. to U. Prim
31.4
SC/ST Enrolment
Indicators
Classrooms/Other rooms
Prim.with U.P.&Sec/H.SUpper Primary onlyU. Primary with Sec./H.S.
Basic Data, 2001
Data reported from
Performance indicators
98.8 57.598.6 50.682.3 46.482.2 44.0
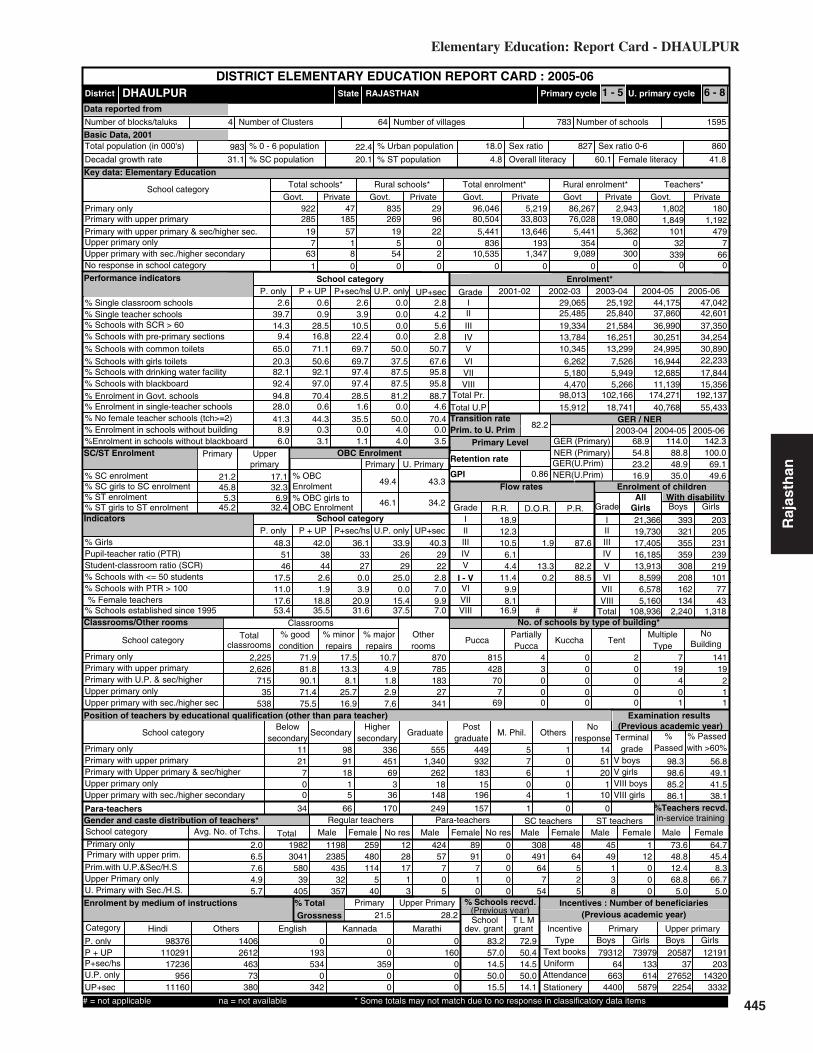
445
Elementary Education: Report Card - DHAULPUR
Raj
asth
an21.2 17.1
Key data: Elementary Education
983
DHAULPUR
(Previous academic year)
(Previous year)
Gender and caste distribution of teachers*
No. of schools by type of building*
BoysWith disability
Flow rates
Primary Level
Enrolment*
Number of schools
Grade
GER / NER
School category
Primary Upper primaryBoys Boys GirlsGirls
IncentiveType
School categoryMultiple
TypeKuccha
PartiallyPucca
PuccaTotal % good condition
Otherrooms
TentNo
Building
Classrooms
Belowsecondary
Highersecondary
Postgraduate
M. Phil.GraduateSecondarySchool category OthersNo
response
ST teachers
Total Male Female No res Male Female No res Male Female Male FemaleSC teachers
Text booksUniformAttendanceStationery
% Passed
Avg. No. of Tchs.
%
Female literacyOverall literacy
dev. grant grantSchool T L M
Male Female
IVV
IIIIII
Grade R.R. D.O.R. P.R.
VIIVI
# #
I - V
Enrolment by medium of instructions
Examination results
Retention rate
GPI
Primary cycle U. primary cycleState
DISTRICT ELEMENTARY EDUCATION REPORT CARD : 2005-06
GirlsGrade
IIIIIIIVVVI
VIII
AllGirls
Total
VII
% TotalGrossness
School category
28519
763
185 26957 19
18
554
1 0 0
922 4796 80,50422 5,441
0 8362 10,5350 0
835 29 86,267 2,94333,803 76,028 19,08013,646 5,441 5,362
193 354 0
0 0 01,347 9,089 300
96,046 5,219 1,8021,849
1801,192
P + UP P+sec/hs U.P. only UP+sec
School categoryP. only
2.6 0.6 2.6 0.0 2.839.7
Number of Clusters 1595783
% Schools with SCR > 600.9 3.9 0.0 4.2
14.3 28.5 10.5 0.0 5.6% Schools with pre-primary sections 9.4 16.8 22.4 0.0 2.8% Schools with common toilets 65.0 71.1 69.7 50.0 50.7
% Schools with girls toilets 20.3 50.6 69.7 37.5 67.6% Schools with drinking water facility 82.1 92.1 97.4 87.5 95.8
% Enrolment in Govt. schools 94.8 70.4 28.5 81.2 88.792.4 97.0 97.4 87.5 95.8
% No female teacher schools (tch>=2) 41.3 44.3 35.5 50.0 70.428.0 0.6 1.6 0.0 4.6
8.9 0.3 0.0 4.0 0.0%Enrolment in schools without blackboard 6.0 3.1 1.1 4.0 3.5
2001-02 2002-03 2003-04 2004-05 2005-06IIIIIIIVV
VIVII
Total U.P
47,04242,60137,35034,25430,89022,233
17,844
44,17537,86036,99030,25124,995
16,94412,685
25,19225,84021,58416,25113,299
7,5265,949
29,06525,48519,33413,78410,345
6,2625,180
55,43340,76818,74115,912
68.9
23.2
114.0
48.9
142.3
69.1
36.1
0.03.9
21,36619,73017,40516,18513,913
8,5996,5785,160
108,936
393321355359308208162134
2,240
203205231239219101
7743
1,318
2,225
classrooms
2,626715
35538
71.981.890.171.475.5
17.513.3
10.7
8.125.716.9
4.91.82.97.6
785183
27341
870 815 4 0 2 7 141428 3 0 0 19 19
70 0 0 0 4 27 0 0 0 0 1
69 0 0 0 1 1
11 98 336 555 449 5 121 91 451 1,340 932 7 0 51
7 18 69 262 183 6 1 200 1 3 18 15 0 0 10 5 36 148 196 4 1 10
34 66 170 249 157 1 0 0
11982385
43532
357
480114
540
259 12 424 89 0 308 48 45 12817
13
57705
91710
0000
49164
754
64525
49138
12000
Terminalgrade Passed
VIII boysV girlsV boys
VIII girls
14 with >60%
73.619823041
58039
405
48.812.468.8
5.0
64.745.4
8.366.7
5.0
98376Hindi Others English Kannada Marathi
11029117236
95611160
14062612
46373
380
0193534
0342
00
35900
0160
000
% Schools recvd.
83.257.014.550.015.5
72.950.414.550.014.1
7931264
6634400
2058737
276522254
73979133614
5879
12191203
143203332
2.06.57.64.95.7
18.912.310.5
6.1
9.98.1
16.9
4.411.4
82.2
0.86
2005-062004-052003-04
RAJASTHAN
20.9
Upper PrimaryPrimary
Sex ratio Sex ratio 0-6
4 64
VIII31.6
Enrolment of children
VIII 4,470 5,266 11,139 15,356Total Pr. 98,013 102,166 174,271 192,137
1 - 5 6 - 8
32 7339 66
0 0
101 479
%Teachers recvd.in-service training
Total schools* Rural schools* Total enrolment* Rural enrolment* Teachers*
21.5 28.2
100.0
49.6
54.8 88.8
16.9 35.0% SC enrolment% SC girls to SC enrolment% ST enrolment
45.8 32.35.3
45.2 32.4
49.4
46.1
43.3
34.2
Position of teachers by educational qualification (other than para teacher)
(Previous academic year)Incentives : Number of beneficiaries
% ST girls to ST enrolment
% Girls
Number of villages
% 0 - 6 population
% SC population % ST population
% Urban population
% Schools with blackboard
% Enrolment in single-teacher schools
% Enrolment in schools without building
Primary Upperprimary
OBC EnrolmentPrimary U. Primary
% OBCEnrolment% OBC girls toOBC Enrolment
Pupil-teacher ratio (PTR)Student-classroom ratio (SCR)% Schools with <= 50 students% Schools with PTR > 100% Female teachers
% Schools established since 1995
Regular teachers Para-teachers
% minorrepairs
% majorrepairs
# = not applicable na = not available * Some totals may not match due to no response in classificatory data items
1.9 87.6
13.3 82.20.2 88.5
2733
48.35146
17.511.017.653.4
42.03844
2.61.9
18.835.5
33.92629
25.00.0
15.437.5
40.32922
2.87.09.97.0
31.1 20.1 4.8 60.1 41.8
86082718.022.4
Category
PrivateGovt.PrivateGovtPrivateGovt.PrivateGovt.PrivateGovt.
Total population (in 000's)
Number of blocks/taluks
District
Decadal growth rate
Primary onlyPrimary with upper primaryPrimary with upper primary & sec/higher sec.Upper primary onlyUpper primary with sec./higher secondary
% Single classroom schools% Single teacher schools
P + UP P+sec/hs U.P. only UP+secP. only
No response in school category
Primary with upper primaryPrimary with U.P. & sec/higherUpper primary onlyUpper primary with sec./higher sec
Primary only
Primary onlyPrimary with upper primaryPrimary with Upper primary & sec/higherUpper primary only
Para-teachers
School category
Upper primary with sec./higher secondary
Primary onlyPrimary with upper prim.
P. onlyP + UPP+sec/hsU.P. onlyUP+sec
NER(U.Prim)GER(U.Prim)NER (Primary)GER (Primary)
Transition ratePrim. to U. Prim
6.9
SC/ST Enrolment
Indicators
Classrooms/Other rooms
Prim.with U.P.&Sec/H.SUpper Primary onlyU. Primary with Sec./H.S.
Basic Data, 2001
Data reported from
Performance indicators
98.3 56.898.6 49.185.2 41.586.1 38.1

446
Elementary Education in India - Where do we stand ?
Raj
asth
an 5.0 6.5
Key data: Elementary Education
1108
DUNGARPUR
(Previous academic year)
(Previous year)
Gender and caste distribution of teachers*
No. of schools by type of building*
BoysWith disability
Flow rates
Primary Level
Enrolment*
Number of schools
Grade
GER / NER
School category
Primary Upper primaryBoys Boys GirlsGirls
IncentiveType
School categoryMultiple
TypeKuccha
PartiallyPucca
PuccaTotal % good condition
Otherrooms
TentNo
Building
Classrooms
Belowsecondary
Highersecondary
Postgraduate
M. Phil.GraduateSecondarySchool category OthersNo
response
ST teachers
Total Male Female No res Male Female No res Male Female Male FemaleSC teachers
Text booksUniformAttendanceStationery
% Passed
Avg. No. of Tchs.
%
Female literacyOverall literacy
dev. grant grantSchool T L M
Male Female
IVV
IIIIII
Grade R.R. D.O.R. P.R.
VIIVI
# #
I - V
Enrolment by medium of instructions
Examination results
Retention rate
GPI
Primary cycle U. primary cycleState
DISTRICT ELEMENTARY EDUCATION REPORT CARD : 2005-06
GirlsGrade
IIIIIIIVVVI
VIII
AllGirls
Total
VII
% TotalGrossness
School category
38633
883
98 3695 3317
880
0 0 0
1,920 16571 79,053
1 5,7751 1,5586 12,4220 0
1,877 155 128,417 11,49918,554 75,842 13,034
1,947 5,775 110131 1,558 131
0 0 01,282 11,978 926
131,298 12,302 3,5732,743
683844
P + UP P+sec/hs U.P. only UP+sec
School categoryP. only
12.9 0.4 0.0 0.0 0.046.0
Number of Clusters 2706874
% Schools with SCR > 600.0 5.3 0.0 1.1
5.6 2.3 2.6 0.0 1.1% Schools with pre-primary sections 7.9 17.4 15.8 0.0 6.7% Schools with common toilets 19.1 53.3 39.5 66.7 47.8
% Schools with girls toilets 5.5 38.8 68.4 77.8 70.0% Schools with drinking water facility 86.4 93.8 94.7 88.9 95.6
% Enrolment in Govt. schools 91.4 81.0 74.8 92.2 90.673.0 83.5 84.2 77.8 80.0
% No female teacher schools (tch>=2) 27.4 28.7 57.9 33.3 52.236.0 0.0 3.2 0.0 1.5
2.6 0.0 0.0 0.0 0.0%Enrolment in schools without blackboard 26.7 15.1 11.7 20.7 22.5
2001-02 2002-03 2003-04 2004-05 2005-06IIIIIIIVV
VIVII
Total U.P
62,43340,32733,96633,03932,36525,470
20,422
18,70614,65712,339
9,9718,881
7,0725,216
13,82111,088
9,2807,3156,435
5,1793,922
73,13045,98432,76827,64821,862
19,09014,742
62,19216,77712,53145,220
29.0
13.9
38.0
18.1
132.9
68.9
39.8
0.05.3
29,87619,34816,18215,48314,70610,689
8,3306,700
121,314
441307323313366252175139
2,316
323244269285250155125
761,727
5,237
classrooms
3,484344
76726
53.764.062.250.056.3
35.327.0
10.9
24.742.128.8
9.013.1
7.914.9
848141
34424
1,453 1,857 33 21 0 34 140440 6 0 0 23 15
36 0 0 0 2 09 0 0 0 0 0
86 1 0 0 1 2
95 217 967 1,487 747 2 042 133 641 1,624 1,038 3 1 6
1 11 42 117 88 0 0 00 1 5 28 21 0 0 07 11 82 241 241 1 1 0
65 89 227 322 137 0 1 0
25002539
23447
479
94925
8105
1017 0 591 148 0 444 113 1190 2800000
20000
79210
0000
400231640
84136
75147
778
213408
Terminalgrade Passed
VIII boysV girlsV boys
VIII girls
2 with >60%
34.442563587
26156
584
28.19.8
34.03.3
33.220.514.811.1
1.0
140934Hindi Others English Gujarati Sanskrit
9577171871689
13223
669371
00
187
190110412
00
100155
000
1060
12300
% Schools recvd.
45.867.821.111.114.4
53.269.426.377.813.3
74465227
103116184
24778261
118181870
69417278
108416875
18311187
78363243
2.07.46.96.26.5
61.033.521.915.8
38.827.834.8
17.334.3
100.0
0.90
2005-062004-052003-04
RAJASTHAN
10.3
Upper PrimaryPrimary
Sex ratio Sex ratio 0-6
7 71
VIII2.6
Enrolment of children
VIII 11,388 3,430 4,489 16,300Total Pr. 201,392 47,939 64,554 202,130
1 - 5 6 - 8
45 11528 56
0 0
214 47
%Teachers recvd.in-service training
Total schools* Rural schools* Total enrolment* Rural enrolment* Teachers*
26.4 28.6
97.8
49.1
13.2 20.0
11.2 13.8% SC enrolment% SC girls to SC enrolment% ST enrolment
47.2 43.976.447.3 39.6
12.1
48.1
17.1
45.0
Position of teachers by educational qualification (other than para teacher)
(Previous academic year)Incentives : Number of beneficiaries
% ST girls to ST enrolment
% Girls
Number of villages
% 0 - 6 population
% SC population % ST population
% Urban population
% Schools with blackboard
% Enrolment in single-teacher schools
% Enrolment in schools without building
Primary Upperprimary
OBC EnrolmentPrimary U. Primary
% OBCEnrolment% OBC girls toOBC Enrolment
Pupil-teacher ratio (PTR)Student-classroom ratio (SCR)% Schools with <= 50 students% Schools with PTR > 100% Female teachers
% Schools established since 1995
Regular teachers Para-teachers
% minorrepairs
% majorrepairs
# = not applicable na = not available * Some totals may not match due to no response in classificatory data items
2230
47.93427
31.91.4
27.469.1
45.02728
1.00.0
28.717.6
37.73022
0.00.0
16.10.0
35.92319
2.22.2
18.015.6
26.6 4.2 65.1 48.6 31.8
95510227.320.9
Category
PrivateGovt.PrivateGovtPrivateGovt.PrivateGovt.PrivateGovt.
Total population (in 000's)
Number of blocks/taluks
District
Decadal growth rate
Primary onlyPrimary with upper primaryPrimary with upper primary & sec/higher sec.Upper primary onlyUpper primary with sec./higher secondary
% Single classroom schools% Single teacher schools
P + UP P+sec/hs U.P. only UP+secP. only
No response in school category
Primary with upper primaryPrimary with U.P. & sec/higherUpper primary onlyUpper primary with sec./higher sec
Primary only
Primary onlyPrimary with upper primaryPrimary with Upper primary & sec/higherUpper primary only
Para-teachers
School category
Upper primary with sec./higher secondary
Primary onlyPrimary with upper prim.
P. onlyP + UPP+sec/hsU.P. onlyUP+sec
NER(U.Prim)GER(U.Prim)NER (Primary)GER (Primary)
Transition ratePrim. to U. Prim
64.5
SC/ST Enrolment
Indicators
Classrooms/Other rooms
Prim.with U.P.&Sec/H.SUpper Primary onlyU. Primary with Sec./H.S.
Basic Data, 2001
Data reported from
Performance indicators
98.3 43.898.5 42.184.5 28.585.8 26.4

447
Elementary Education: Report Card - GANGANAGAR
Raj
asth
an
0.5460.562
44.3 31.9
Key data: Elementary Education
1789
GANGANAGAR
(Previous academic year)
(Previous year)
Gender and caste distribution of teachers*
No. of schools by type of building*
BoysWith disability
Flow rates
Primary Level
Enrolment*
Number of schools
Grade
GER / NER
School category
Primary Upper primaryBoys Boys GirlsGirls
IncentiveType
School categoryMultiple
TypeKuccha
PartiallyPucca
PuccaTotal % good condition
Otherrooms
TentNo
Building
Classrooms
Belowsecondary
Highersecondary
Postgraduate
M. Phil.GraduateSecondarySchool category OthersNo
response
ST teachers
Total Male Female No res Male Female No res Male Female Male FemaleSC teachers
Text booksUniformAttendanceStationery
% Passed
Avg. No. of Tchs.
%
Female literacyOverall literacy
dev. grant grantSchool T L M
Male Female
IVV
IIIIII
Grade R.R. D.O.R. P.R.
VIIVI
# #
I - V
Enrolment by medium of instructions
Examination results
Retention rate
GPI
Primary cycle U. primary cycleState
DISTRICT ELEMENTARY EDUCATION REPORT CARD : 2005-06
GirlsGrade
IIIIIIIVVVI
VIII
AllGirls
Total
VII
% TotalGrossness
School category
57832
055
336 52972 29
043
049
0 0 0
1,360 52241 97,314
46 6,5320 0
30 5,3450 0
1,287 38 80,194 4,34068,290 88,663 49,72115,561 5,819 10,329
0 0 0
0 0 06,103 4,743 3,412
87,200 6,731 2,5773,004
2021,981
P + UP P+sec/hs U.P. only UP+sec
School categoryP. only
3.8 0.7 0.0 0.0 0.042.4
Number of Clusters 25281239
% Schools with SCR > 602.2 0.0 0.0 3.1
3.7 8.1 5.8 0.0 0.0% Schools with pre-primary sections 17.6 24.4 26.0 0.0 10.2% Schools with common toilets 56.1 57.3 39.4 0.0 52.0
% Schools with girls toilets 35.8 74.6 87.5 0.0 73.5% Schools with drinking water facility 75.8 86.7 92.3 0.0 92.9
% Enrolment in Govt. schools 92.8 58.8 29.6 0.0 46.797.0 97.2 97.1 0.0 93.9
% No female teacher schools (tch>=2) 21.7 28.8 21.2 0.0 22.431.1 1.0 0.0 0.0 1.1
1.4 0.0 0.0 0.0 0.0%Enrolment in schools without blackboard 2.4 1.9 2.1 0.0 0.6
2001-02 2002-03 2003-04 2004-05 2005-06IIIIIIIVV
VIVII
Total U.P
56,78441,34737,64137,35237,65431,471
27,025
23,53317,01017,03716,32015,456
12,3579,349
58,09145,34641,68736,88733,423
24,94321,070
71,87147,96740,84635,60430,945
24,84321,583
78,25943,82335,76129,44625,381
19,99916,430
82,29830,76566,25165,94050,825
80.4
45.3
32.5
20.5
85.8
56.4
42.2
4.83.8
26,42119,72617,77717,72617,55114,23511,90610,165
135,507
277136139154145111
7261
1,095
9990
10986
114715643
668
3,769
classrooms
5,673977
0768
88.989.487.8
0.086.2
7.68.1
3.5
9.80.07.8
2.52.40.06.0
1,986329
0600
1,714 1,303 9 4 0 26 70774 27 11 0 82 20
96 1 0 0 6 10 0 0 0 0 0
91 0 0 0 2 5
56 124 431 1,007 690 2 5155 208 641 2,559 1,166 8 14 11
45 8 50 457 183 1 0 20 0 0 0 0 0 0 0
22 22 41 302 212 3 1 0
25 25 186 317 147 1 4 0
13923135
4940
396
1627252
0207
923 0 352 112 0 365 86 25 160000
9411
03
129301
0000
52434
050
121809
11013
09
2510
04
Terminalgrade Passed
VIII boysV girlsV boys
VIII girls
0 with >60%
17.127794985
7600
607
8.32.40.02.0
11.38.69.40.03.8
83817Hindi Others Gujarati Kashmiri English
15113320858
09108
5551690
000
0235
000
1950000
10914
000
% Schools recvd.
84.656.119.2
0.022.4
45.136.017.3
0.021.4
73025392828
5454
18993106
13071398
69353542659
6362
1711284
129011111
2.05.57.30.06.2
28.711.1
6.94.2
9.47.2
12.2
2.712.2
47.6
100.0
0.89
2005-062004-052003-04
RAJASTHAN
33.6
Upper PrimaryPrimary
Sex ratio Sex ratio 0-6
9 159
VIII27.9
Enrolment of children
14,396VIII 19,514 20,238 9,059 23,802Total Pr. 212,670 227,233 215,434 89,356 210,778
1 - 5 6 - 8
0 0322 285
0 0
192 568
%Teachers recvd.in-service training
Total schools* Rural schools* Total enrolment* Rural enrolment* Teachers*
24.5 25.7
64.7
41.9
60.4 24.8
32.6 14.5% SC enrolment% SC girls to SC enrolment% ST enrolment
47.4 42.1
42.7 38.5
35.9
46.6
44.5
44.8
Position of teachers by educational qualification (other than para teacher)
(Previous academic year)Incentives : Number of beneficiaries
% ST girls to ST enrolment
% Girls
Number of villages
% 0 - 6 population
% SC population % ST population
% Urban population
% Schools with blackboard
% Enrolment in single-teacher schools
% Enrolment in schools without building
Primary Upperprimary
OBC EnrolmentPrimary U. Primary
% OBCEnrolment% OBC girls toOBC Enrolment
Pupil-teacher ratio (PTR)Student-classroom ratio (SCR)% Schools with <= 50 students% Schools with PTR > 100% Female teachers
% Schools established since 1995
Regular teachers Para-teachers
% minorrepairs
% majorrepairs
# = not applicable na = not available * Some totals may not match due to no response in classificatory data items
2329
48.23425
49.23.2
37.242.1
45.83329
5.63.2
35.229.8
0.000
0.00.00.00.0
43.61915
20.41.0
34.311.2
27.5 33.7 0.8 64.7 52.4
85087325.316.7
Category
PrivateGovt.PrivateGovtPrivateGovt.PrivateGovt.PrivateGovt.
Total population (in 000's)
Number of blocks/taluks
District
Decadal growth rate
Primary onlyPrimary with upper primaryPrimary with upper primary & sec/higher sec.Upper primary onlyUpper primary with sec./higher secondary
% Single classroom schools% Single teacher schools
P + UP P+sec/hs U.P. only UP+secP. only
No response in school category
Primary with upper primaryPrimary with U.P. & sec/higherUpper primary onlyUpper primary with sec./higher sec
Primary only
Primary onlyPrimary with upper primaryPrimary with Upper primary & sec/higherUpper primary only
Para-teachers
School category
Upper primary with sec./higher secondary
Primary onlyPrimary with upper prim.
P. onlyP + UPP+sec/hsU.P. onlyUP+sec
NER(U.Prim)GER(U.Prim)NER (Primary)GER (Primary)
Transition ratePrim. to U. Prim
SC/ST Enrolment
Indicators
Classrooms/Other rooms
Prim.with U.P.&Sec/H.SUpper Primary onlyU. Primary with Sec./H.S.
Basic Data, 2001
Data reported from
Performance indicators
95.4 71.595.4 70.190.9 65.990.8 64.0

448
Elementary Education in India - Where do we stand ?
Raj
asth
an
0.5960.622
33.7 23.4
Key data: Elementary Education
1518
HANUMANGARH
(Previous academic year)
(Previous year)
Gender and caste distribution of teachers*
No. of schools by type of building*
BoysWith disability
Flow rates
Primary Level
Enrolment*
Number of schools
Grade
GER / NER
School category
Primary Upper primaryBoys Boys GirlsGirls
IncentiveType
School categoryMultiple
TypeKuccha
PartiallyPucca
PuccaTotal % good condition
Otherrooms
TentNo
Building
Classrooms
Belowsecondary
Highersecondary
Postgraduate
M. Phil.GraduateSecondarySchool category OthersNo
response
ST teachers
Total Male Female No res Male Female No res Male Female Male FemaleSC teachers
Text booksUniformAttendanceStationery
% Passed
Avg. No. of Tchs.
%
Female literacyOverall literacy
dev. grant grantSchool T L M
Male Female
IVV
IIIIII
Grade R.R. D.O.R. P.R.
VIIVI
# #
I - V
Enrolment by medium of instructions
Examination results
Retention rate
GPI
Primary cycle U. primary cycleState
DISTRICT ELEMENTARY EDUCATION REPORT CARD : 2005-06
GirlsGrade
IIIIIIIVVVI
VIII
AllGirls
Total
VII
% TotalGrossness
School category
37630
057
300 35743 28
022
050
0 0 0
829 362181 86,741
17 4,3060 0
10 8,4380 0
773 233 75,988 39,84347,904 82,043 29,269
7,713 3,649 3,0630 0 0
0 0 03,321 6,950 990
83,820 60,399 1,9972,205
2,2431,814
P + UP P+sec/hs U.P. only UP+sec
School categoryP. only
2.0 0.1 0.0 0.0 0.028.4
Number of Clusters 2019983
% Schools with SCR > 601.3 0.0 0.0 8.9
3.9 5.8 1.4 0.0 5.1% Schools with pre-primary sections 27.1 23.2 15.1 0.0 1.3% Schools with common toilets 61.8 58.3 39.7 0.0 48.1
% Schools with girls toilets 55.1 84.6 82.2 0.0 82.3% Schools with drinking water facility 74.6 76.9 91.8 0.0 75.9
% Enrolment in Govt. schools 58.1 64.4 35.8 0.0 71.8100.0 100.0 100.0 0.0 100.0
% No female teacher schools (tch>=2) 35.5 40.2 31.5 0.0 44.314.1 1.1 0.0 0.0 8.7
0.1 0.0 0.0 0.0 0.0%Enrolment in schools without blackboard 0.0 0.0 0.0 0.0 0.0
2001-02 2002-03 2003-04 2004-05 2005-06IIIIIIIVV
VIVII
Total U.P
61,94341,89336,48135,38535,62234,074
29,906
67,16841,72539,31137,08936,653
33,38926,611
60,78542,63437,78435,53734,139
27,27323,169
67,71241,82037,77034,53929,759
23,77121,634
91,31885,66972,99464,586
93.3
59.2
95.9
67.8
101.4
73.8
41.7
6.80.0
29,16419,74817,29916,86716,59715,38013,06911,730
139,854
465268293338369263204202
2,402
272215229229249177158186
1,715
5,844
classrooms
4,797652
0666
84.686.287.0
0.085.3
11.39.3
4.1
9.20.09.8
4.63.80.05.0
1,689284
0471
2,065 1,137 10 0 0 38 5635 13 0 0 27 1
70 0 0 0 3 00 0 0 0 0 0
77 0 0 0 2 0
16 186 689 1,779 1,107 4 124 186 514 1,830 1,209 4 3 6
1 10 66 276 155 1 0 00 0 0 0 0 0 0 02 12 52 167 151 0 0 7
5 25 171 333 174 0 0 0
28622857
3630
312
918146
079
933 0 351 94 0 573 103 37 81000
9770
10
146201
0000
55546
063
11616
08
57205
21000
Terminalgrade Passed
VIII boysV girlsV boys
VIII girls
13 with >60%
38.242404019
5180
402
47.210.5
0.015.8
41.239.814.2
0.08.8
140707Hindi English Others Bengali Garo
13186411773
011271
21261457
5100
888611195
0488
23488
000
0271
000
% Schools recvd.
69.457.224.7
0.034.2
63.652.712.3
0.010.1
68288229334
4123
21246178
160401304
72540462371
6573
20772241
65541719
3.65.97.10.05.1
22.27.65.02.5
5.73.89.6
1.79.7
87.8
0.89
2005-062004-052003-04
RAJASTHAN
28.6
Upper PrimaryPrimary
Sex ratio Sex ratio 0-6
13 72
VIII30.1
Enrolment of children
VIII 19,181 22,552 25,669 27,338Total Pr. 211,600 210,879 221,946 211,324
1 - 5 6 - 8
0 0259 143
0 0
187 331
%Teachers recvd.in-service training
Total schools* Rural schools* Total enrolment* Rural enrolment* Teachers*
26.0 27.9
75.0
53.2
69.0 70.3
42.9 49.1% SC enrolment% SC girls to SC enrolment% ST enrolment
48.0 42.2
47.1 41.0
51.7
46.9
60.8
44.5
Position of teachers by educational qualification (other than para teacher)
(Previous academic year)Incentives : Number of beneficiaries
% ST girls to ST enrolment
% Girls
Number of villages
% 0 - 6 population
% SC population % ST population
% Urban population
% Schools with blackboard
% Enrolment in single-teacher schools
% Enrolment in schools without building
Primary Upperprimary
OBC EnrolmentPrimary U. Primary
% OBCEnrolment% OBC girls toOBC Enrolment
Pupil-teacher ratio (PTR)Student-classroom ratio (SCR)% Schools with <= 50 students% Schools with PTR > 100% Female teachers
% Schools established since 1995
Regular teachers Para-teachers
% minorrepairs
% majorrepairs
# = not applicable na = not available * Some totals may not match due to no response in classificatory data items
20.1 57.79.7 82.77.3 87.73.2 94.3
10.4 87.811.5 78.8
7.8 86.52.7 93.5
1823
44.93425
22.04.4
24.259.4
48.53428
3.41.8
26.535.1
0.000
0.00.00.00.0
40.62918
6.37.6
19.917.7
24.3 26.1 0.7 63.1 49.6
87289420.016.9
Category
PrivateGovt.PrivateGovtPrivateGovt.PrivateGovt.PrivateGovt.
Total population (in 000's)
Number of blocks/taluks
District
Decadal growth rate
Primary onlyPrimary with upper primaryPrimary with upper primary & sec/higher sec.Upper primary onlyUpper primary with sec./higher secondary
% Single classroom schools% Single teacher schools
P + UP P+sec/hs U.P. only UP+secP. only
No response in school category
Primary with upper primaryPrimary with U.P. & sec/higherUpper primary onlyUpper primary with sec./higher sec
Primary only
Primary onlyPrimary with upper primaryPrimary with Upper primary & sec/higherUpper primary only
Para-teachers
School category
Upper primary with sec./higher secondary
Primary onlyPrimary with upper prim.
P. onlyP + UPP+sec/hsU.P. onlyUP+sec
NER(U.Prim)GER(U.Prim)NER (Primary)GER (Primary)
Transition ratePrim. to U. Prim
SC/ST Enrolment
Indicators
Classrooms/Other rooms
Prim.with U.P.&Sec/H.SUpper Primary onlyU. Primary with Sec./H.S.
Basic Data, 2001
Data reported from
Performance indicators
98.7 69.698.7 67.892.2 70.192.6 67.9

449
Elementary Education: Report Card - JAIPUR
Raj
asth
an19.8 16.2
Key data: Elementary Education
5251
JAIPUR
(Previous academic year)
(Previous year)
Gender and caste distribution of teachers*
No. of schools by type of building*
BoysWith disability
Flow rates
Primary Level
Enrolment*
Number of schools
Grade
GER / NER
School category
Primary Upper primaryBoys Boys GirlsGirls
IncentiveType
School categoryMultiple
TypeKuccha
PartiallyPucca
PuccaTotal % good condition
Otherrooms
TentNo
Building
Classrooms
Belowsecondary
Highersecondary
Postgraduate
M. Phil.GraduateSecondarySchool category OthersNo
response
ST teachers
Total Male Female No res Male Female No res Male Female Male FemaleSC teachers
Text booksUniformAttendanceStationery
% Passed
Avg. No. of Tchs.
%
Female literacyOverall literacy
dev. grant grantSchool T L M
Male Female
IVV
IIIIII
Grade R.R. D.O.R. P.R.
VIIVI
# #
I - V
Enrolment by medium of instructions
Examination results
Retention rate
GPI
Primary cycle U. primary cycleState
DISTRICT ELEMENTARY EDUCATION REPORT CARD : 2005-06
GirlsGrade
IIIIIIIVVVI
VIII
AllGirls
Total
VII
% TotalGrossness
School category
1,08061
1297
929 911343 56
333
0278
0 0 0
2,890 136710 251,782251 17,423
1 28219 43,720
0 0
2,509 122 208,312 10,436154,363 205,766 119,886
79,727 14,789 59,292326 0 58
0 0 07,104 40,523 3,838
252,399 12,551 6,1457,146
5356,354
P + UP P+sec/hs U.P. only UP+sec
School categoryP. only
2.7 0.4 0.2 25.0 0.036.1
Number of Clusters 57732104
% Schools with SCR > 600.5 0.2 0.0 6.1
6.2 6.0 1.5 25.0 1.5% Schools with pre-primary sections 7.7 25.6 35.6 0.0 4.5% Schools with common toilets 50.7 65.2 61.1 75.0 55.2
% Schools with girls toilets 20.9 50.7 86.9 25.0 54.8% Schools with drinking water facility 74.6 87.1 95.3 100.0 88.8
% Enrolment in Govt. schools 95.3 62.0 17.9 46.4 86.090.3 96.2 95.0 100.0 92.4
% No female teacher schools (tch>=2) 28.8 33.8 35.1 50.0 47.324.2 0.4 0.1 0.0 4.4
9.7 0.3 0.0 0.0 0.0%Enrolment in schools without blackboard 7.4 3.4 4.9 0.0 7.0
2001-02 2002-03 2003-04 2004-05 2005-06IIIIIIIVV
VIVII
Total U.P
175,939128,209103,599
94,01892,70884,647
73,336
163,011120,232101,367
90,58386,449
76,68760,381
164,040131,419103,666
90,31684,060
65,94553,286
183,408124,338
96,43782,72369,986
53,56147,678
225,204195,687172,007108,950
71.9
39.5
68.0
43.4
82.4
52.6
38.3
1.01.7
83,44963,46350,35345,69243,02436,51729,88025,714
378,092
636450447386433260237220
3,069
359298297284263185123101
1,910
8,025
classrooms
13,5394,496
193,000
67.780.593.5
100.077.1
24.214.4
8.1
5.00.0
17.1
5.11.50.05.8
4,5091,326
112,433
3,694 2,542 11 1 1 16 4541,927 15 1 1 42 22
389 0 0 0 11 44 0 0 0 0 0
328 0 0 0 0 1
55 281 1,183 1,986 2,192 18 292 451 1,904 6,207 4,285 49 28 6619 57 277 1,909 855 5 0 38
1 1 2 10 7 0 0 08 42 176 650 843 6 2 0
16 44 256 701 406 2 2 0
356592992509
171313
3783651
4414
2167 0 772 176 0 1105 233 119 310000
19025
09
22815
86
0000
2310456
1292
42047
047
31151
112
66504
Terminalgrade Passed
VIII boysV girlsV boys
VIII girls
15 with >60%
17.8668013500
320029
1742
11.92.10.00.8
13.210.8
5.60.01.2
256338Hindi Others English Gujarati Urdu
39470892288
60850049
422464942227
0542
111269
72800
450428
100200
10300000
% Schools recvd.
76.549.011.425.0
6.1
15.428.137.175.035.2
18543910171566
16272
61185267
87121067
19784810611673
16472
49731266
52001095
2.26.77.97.35.3
17.112.6
6.03.0
5.64.18.3
2.19.6
92.9
0.93
2005-062004-052003-04
RAJASTHAN
20.8
Upper PrimaryPrimary
Sex ratio Sex ratio 0-6
24 173
VIII55.4
Enrolment of children
VIII 7,711 52,776 58,619 67,221Total Pr. 556,892 573,501 561,642 594,473
1 - 5 6 - 8
9 201,499 243
0 0
416 2,784
%Teachers recvd.in-service training
Total schools* Rural schools* Total enrolment* Rural enrolment* Teachers*
29.1 28.9
58.4
37.4
51.1 49.3
27.0 30.1% SC enrolment% SC girls to SC enrolment% ST enrolment
47.8 38.112.247.8 36.1
48.6
48.1
52.9
40.9
Position of teachers by educational qualification (other than para teacher)
(Previous academic year)Incentives : Number of beneficiaries
% ST girls to ST enrolment
% Girls
Number of villages
% 0 - 6 population
% SC population % ST population
% Urban population
% Schools with blackboard
% Enrolment in single-teacher schools
% Enrolment in schools without building
Primary Upperprimary
OBC EnrolmentPrimary U. Primary
% OBCEnrolment% OBC girls toOBC Enrolment
Pupil-teacher ratio (PTR)Student-classroom ratio (SCR)% Schools with <= 50 students% Schools with PTR > 100% Female teachers
% Schools established since 1995
Regular teachers Para-teachers
% minorrepairs
% majorrepairs
# = not applicable na = not available * Some totals may not match due to no response in classificatory data items
13.6 69.36.3 81.14.0 90.0
5.0 92.96.2 84.22.0 92.4
2230
51.14033
25.02.5
35.154.5
45.63030
1.90.8
29.740.0
40.02132
25.00.0
41.425.0
39.72917
3.05.5
24.18.5
35.1 14.8 7.9 69.9 55.5
89989749.417.5
Category
PrivateGovt.PrivateGovtPrivateGovt.PrivateGovt.PrivateGovt.
Total population (in 000's)
Number of blocks/taluks
District
Decadal growth rate
Primary onlyPrimary with upper primaryPrimary with upper primary & sec/higher sec.Upper primary onlyUpper primary with sec./higher secondary
% Single classroom schools% Single teacher schools
P + UP P+sec/hs U.P. only UP+secP. only
No response in school category
Primary with upper primaryPrimary with U.P. & sec/higherUpper primary onlyUpper primary with sec./higher sec
Primary only
Primary onlyPrimary with upper primaryPrimary with Upper primary & sec/higherUpper primary only
Para-teachers
School category
Upper primary with sec./higher secondary
Primary onlyPrimary with upper prim.
P. onlyP + UPP+sec/hsU.P. onlyUP+sec
NER(U.Prim)GER(U.Prim)NER (Primary)GER (Primary)
Transition ratePrim. to U. Prim
11.3
SC/ST Enrolment
Indicators
Classrooms/Other rooms
Prim.with U.P.&Sec/H.SUpper Primary onlyU. Primary with Sec./H.S.
Basic Data, 2001
Data reported from
Performance indicators
98.2 52.898.1 49.280.0 50.578.8 47.7

450
Elementary Education in India - Where do we stand ?
Raj
asth
an 16.4 17.3
Key data: Elementary Education
508
JAISALMER
(Previous academic year)
(Previous year)
Gender and caste distribution of teachers*
No. of schools by type of building*
BoysWith disability
Flow rates
Primary Level
Enrolment*
Number of schools
Grade
GER / NER
School category
Primary Upper primaryBoys Boys GirlsGirls
IncentiveType
School categoryMultiple
TypeKuccha
PartiallyPucca
PuccaTotal % good condition
Otherrooms
TentNo
Building
Classrooms
Belowsecondary
Highersecondary
Postgraduate
M. Phil.GraduateSecondarySchool category OthersNo
response
ST teachers
Total Male Female No res Male Female No res Male Female Male FemaleSC teachers
Text booksUniformAttendanceStationery
% Passed
Avg. No. of Tchs.
%
Female literacyOverall literacy
dev. grant grantSchool T L M
Male Female
IVV
IIIIII
Grade R.R. D.O.R. P.R.
VIIVI
# #
I - V
Enrolment by medium of instructions
Examination results
Retention rate
GPI
Primary cycle U. primary cycleState
DISTRICT ELEMENTARY EDUCATION REPORT CARD : 2005-06
GirlsGrade
IIIIIIIVVVI
VIII
AllGirls
Total
VII
% TotalGrossness
School category
23311
241
37 2192 1108
238
0 0 0
1,157 5125 39,481
2 1,9260 2026 4,3940 0
1,123 42 60,166 3,1146,711 36,326 4,156
462 1,926 4620 202 0
0 0 0943 4,068 612
62,961 3,925 1,6171,413
215298
P + UP P+sec/hs U.P. only UP+sec
School categoryP. only
11.2 0.4 0.0 0.0 0.071.9
Number of Clusters 1542571
% Schools with SCR > 602.2 0.0 0.0 12.2
2.3 2.2 0.0 0.0 2.0% Schools with pre-primary sections 8.5 12.6 7.7 0.0 12.2% Schools with common toilets 32.8 68.9 53.8 50.0 69.4
% Schools with girls toilets 13.4 51.5 69.2 50.0 57.1% Schools with drinking water facility 50.1 64.4 53.8 100.0 83.7
% Enrolment in Govt. schools 94.1 85.5 80.7 100.0 82.373.9 89.3 84.6 100.0 81.6
% No female teacher schools (tch>=2) 13.7 34.4 61.5 0.0 59.257.7 1.1 0.0 0.0 5.1
7.6 0.2 0.0 0.0 0.0%Enrolment in schools without blackboard 19.1 8.0 20.4 0.0 15.2
2001-02 2002-03 2003-04 2004-05 2005-06IIIIIIIVV
VIVII
Total U.P
38,36321,44117,23315,04211,298
7,904
5,627
28,57716,15614,527
9,7227,421
4,5992,611
22,55915,72111,950
6,8025,541
3,2582,231
41,07816,72611,262
8,5805,787
4,3943,242
17,6289,4737,51610,268
79.1
17.4
92.2
21.0
148.1
42.5
31.7
0.07.7
18,2119,6227,3066,2903,9972,0341,305
85849,623
373228233219154
869860
1,451
214116105
9055171314
624
2,855
classrooms
1,898115
11331
59.466.564.363.656.8
27.024.1
13.5
26.136.425.7
9.49.60.0
17.5
92571
4446
1,271 956 3 6 1 10 231244 1 0 0 7 18
12 0 0 0 0 12 0 0 0 0 0
43 1 0 0 2 3
31 90 352 536 257 2 010 79 351 663 471 7 13 5
0 2 21 26 25 1 0 00 1 0 5 3 0 0 00 9 39 119 113 0 0 0
60 81 173 264 101 0 1 0
9711247
655
251
35210
429
300 0 501 60 0 398 39 31 30000
52203
60200
0000
30418
353
35222
27009
6001
Terminalgrade Passed
VIII boysV girlsV boys
VIII girls
3 with >60%
41.218321711
799
283
33.920.920.011.0
24.723.1
0.00.0
13.8
65366Hindi Others English Gujarati
454532294
2024875
875371
940
462
20117
000
690000
% Schools recvd.
52.878.553.8
100.08.2
56.772.653.8
0.014.3
45988150
38798732
968255
6916843
36013461879
6321
342278
1653281
1.56.36.14.55.8
42.325.117.710.4
15.99.9
19.8
7.026.5
96.6
0.78
2005-062004-052003-04
RAJASTHAN
15.2
Upper PrimaryPrimary
Sex ratio Sex ratio 0-6
3 54
VIII23.1
Enrolment of children
VIII 2,632 2,027 2,263 4,097Total Pr. 83,433 62,573 76,403 103,377
1 - 5 6 - 8
9 0228 55
0 0
63 16
%Teachers recvd.in-service training
Total schools* Rural schools* Total enrolment* Rural enrolment* Teachers*
30.6 37.3
100.0
26.7
53.9 66.6
12.3 12.5% SC enrolment% SC girls to SC enrolment% ST enrolment
45.4 26.87.4
43.3 18.0
48.4
45.0
42.1
25.0
Position of teachers by educational qualification (other than para teacher)
(Previous academic year)Incentives : Number of beneficiaries
% ST girls to ST enrolment
% Girls
Number of villages
% 0 - 6 population
% SC population % ST population
% Urban population
% Schools with blackboard
% Enrolment in single-teacher schools
% Enrolment in schools without building
Primary Upperprimary
OBC EnrolmentPrimary U. Primary
% OBCEnrolment% OBC girls toOBC Enrolment
Pupil-teacher ratio (PTR)Student-classroom ratio (SCR)% Schools with <= 50 students% Schools with PTR > 100% Female teachers
% Schools established since 1995
Regular teachers Para-teachers
% minorrepairs
% majorrepairs
# = not applicable na = not available * Some totals may not match due to no response in classificatory data items
2130
45.63723
56.62.5
19.772.0
37.22724
3.71.5
24.117.0
20.32218
50.00.0
44.450.0
21.61916
16.30.0
10.210.2
47.5 14.6 5.5 51.0 32.0
86982115.022.0
Category
PrivateGovt.PrivateGovtPrivateGovt.PrivateGovt.PrivateGovt.
Total population (in 000's)
Number of blocks/taluks
District
Decadal growth rate
Primary onlyPrimary with upper primaryPrimary with upper primary & sec/higher sec.Upper primary onlyUpper primary with sec./higher secondary
% Single classroom schools% Single teacher schools
P + UP P+sec/hs U.P. only UP+secP. only
No response in school category
Primary with upper primaryPrimary with U.P. & sec/higherUpper primary onlyUpper primary with sec./higher sec
Primary only
Primary onlyPrimary with upper primaryPrimary with Upper primary & sec/higherUpper primary only
Para-teachers
School category
Upper primary with sec./higher secondary
Primary onlyPrimary with upper prim.
P. onlyP + UPP+sec/hsU.P. onlyUP+sec
NER(U.Prim)GER(U.Prim)NER (Primary)GER (Primary)
Transition ratePrim. to U. Prim
5.2
SC/ST Enrolment
Indicators
Classrooms/Other rooms
Prim.with U.P.&Sec/H.SUpper Primary onlyU. Primary with Sec./H.S.
Basic Data, 2001
Data reported from
Performance indicators
89.5 44.390.9 40.584.7 34.885.4 36.1

451
Elementary Education: Report Card - JALOR
Raj
asth
an20.7 17.3
Key data: Elementary Education
1449
JALOR
(Previous academic year)
(Previous year)
Gender and caste distribution of teachers*
No. of schools by type of building*
BoysWith disability
Flow rates
Primary Level
Enrolment*
Number of schools
Grade
GER / NER
School category
Primary Upper primaryBoys Boys GirlsGirls
IncentiveType
School categoryMultiple
TypeKuccha
PartiallyPucca
PuccaTotal % good condition
Otherrooms
TentNo
Building
Classrooms
Belowsecondary
Highersecondary
Postgraduate
M. Phil.GraduateSecondarySchool category OthersNo
response
ST teachers
Total Male Female No res Male Female No res Male Female Male FemaleSC teachers
Text booksUniformAttendanceStationery
% Passed
Avg. No. of Tchs.
%
Female literacyOverall literacy
dev. grant grantSchool T L M
Male Female
IVV
IIIIII
Grade R.R. D.O.R. P.R.
VIIVI
# #
I - V
Enrolment by medium of instructions
Examination results
Retention rate
GPI
Primary cycle U. primary cycleState
DISTRICT ELEMENTARY EDUCATION REPORT CARD : 2005-06
GirlsGrade
IIIIIIIVVVI
VIII
AllGirls
Total
VII
% TotalGrossness
School category
45219
289
161 43320 18
013
288
0 0 0
1,573 176126 113,464
9 4,8470 2476 14,2190 0
1,531 146 149,743 14,10831,641 109,069 24,690
6,229 4,509 2,6680 247 0
0 0 02,006 14,177 915
153,603 17,958 2,7952,565
6631,153
P + UP P+sec/hs U.P. only UP+sec
School categoryP. only
2.0 0.7 0.0 0.0 1.050.4
Number of Clusters 2505726
% Schools with SCR > 604.9 0.0 0.0 2.0
11.1 16.5 5.1 0.0 1.0% Schools with pre-primary sections 5.4 10.6 25.6 50.0 2.9% Schools with common toilets 27.6 58.9 48.7 100.0 56.9
% Schools with girls toilets 11.2 38.7 61.5 100.0 50.0% Schools with drinking water facility 52.8 77.8 89.7 100.0 94.1
% Enrolment in Govt. schools 89.5 78.2 43.8 100.0 87.690.9 97.6 97.4 100.0 94.1
% No female teacher schools (tch>=2) 35.5 43.7 41.0 0.0 74.537.2 2.2 0.0 0.0 1.3
6.5 0.5 0.0 0.0 0.0%Enrolment in schools without blackboard 6.7 1.8 1.7 0.0 4.8
2001-02 2002-03 2003-04 2004-05 2005-06IIIIIIIVV
VIVII
Total U.P
84,57657,96148,59942,34636,77631,816
24,929
73,14557,13950,86337,93533,083
28,43118,627
88,47960,65142,93534,40429,766
22,29615,954
108,15857,56642,68136,28627,174
20,79916,561
73,95661,39250,77249,222
118.3
42.9
113.4
50.6
135.8
62.6
34.4
2.62.6
39,73826,71521,66918,16514,18910,369
7,1594,578
142,582
877706715651625451315236
4,576
544396381337283139112
572,249
4,529
classrooms
3,726376
15751
62.971.080.380.063.6
24.218.6
12.9
15.720.023.7
10.44.00.0
12.6
1,414122
10526
1,827 1,406 52 13 0 65 213509 30 2 0 55 17
31 2 0 0 6 01 0 0 0 0 1
95 2 0 0 5 0
34 116 726 999 399 4 1127 144 558 1,769 928 19 6 1
5 4 43 169 75 0 1 00 0 1 5 5 0 0 04 17 64 275 250 5 0 0
88 110 391 630 228 3 3 0
19912889
2527
576
56345
439
301 3 1061 102 0 730 66 69 50000
14460
13
122104
0000
69559
2127
90413
9850
26
17001
Terminalgrade Passed
VIII boysV girlsV boys
VIII girls
6 with >60%
46.334583718
30411
632
39.514.0
0.09.0
38.735.223.9
0.00.0
160635Hindi Others English Un-Specified Dogri
13761011076
24715854
98915090
00
263
49364
000
19991
00
88
0308
000
% Schools recvd.
40.364.917.9
0.012.7
13.019.617.950.026.5
119228285
71009354
37567227
105543851
101608323
36588063
15855130
33142218
2.06.17.85.56.2
23.215.711.0
5.6
10.16.69.3
4.313.9
87.5
0.80
2005-062004-052003-04
RAJASTHAN
15.1
Upper PrimaryPrimary
Sex ratio Sex ratio 0-6
10 56
VIII33.3
Enrolment of children
VIII 11,862 12,522 14,334 17,211Total Pr. 271,865 256,235 252,165 270,258
1 - 5 6 - 8
11 0540 92
0 0
112 192
%Teachers recvd.in-service training
Total schools* Rural schools* Total enrolment* Rural enrolment* Teachers*
29.8 34.3
95.3
41.1
83.5 80.0
28.9 32.5% SC enrolment% SC girls to SC enrolment% ST enrolment
43.8 28.010.038.6 18.6
53.2
45.5
56.7
30.3
Position of teachers by educational qualification (other than para teacher)
(Previous academic year)Incentives : Number of beneficiaries
% ST girls to ST enrolment
% Girls
Number of villages
% 0 - 6 population
% SC population % ST population
% Urban population
% Schools with blackboard
% Enrolment in single-teacher schools
% Enrolment in schools without building
Primary Upperprimary
OBC EnrolmentPrimary U. Primary
% OBCEnrolment% OBC girls toOBC Enrolment
Pupil-teacher ratio (PTR)Student-classroom ratio (SCR)% Schools with <= 50 students% Schools with PTR > 100% Female teachers
% Schools established since 1995
Regular teachers Para-teachers
% minorrepairs
% majorrepairs
# = not applicable na = not available * Some totals may not match due to no response in classificatory data items
9.8 67.09.1 75.39.9 79.11.2 93.28.2 87.58.2 77.96.6 83.38.1 85.3
2936
45.55038
18.69.4
11.774.0
39.03939
3.33.4
18.433.8
72.92216
0.00.0
36.40.0
24.72622
4.92.06.89.8
26.8 18.0 8.8 46.5 27.8
9219647.621.5
Category
PrivateGovt.PrivateGovtPrivateGovt.PrivateGovt.PrivateGovt.
Total population (in 000's)
Number of blocks/taluks
District
Decadal growth rate
Primary onlyPrimary with upper primaryPrimary with upper primary & sec/higher sec.Upper primary onlyUpper primary with sec./higher secondary
% Single classroom schools% Single teacher schools
P + UP P+sec/hs U.P. only UP+secP. only
No response in school category
Primary with upper primaryPrimary with U.P. & sec/higherUpper primary onlyUpper primary with sec./higher sec
Primary only
Primary onlyPrimary with upper primaryPrimary with Upper primary & sec/higherUpper primary only
Para-teachers
School category
Upper primary with sec./higher secondary
Primary onlyPrimary with upper prim.
P. onlyP + UPP+sec/hsU.P. onlyUP+sec
NER(U.Prim)GER(U.Prim)NER (Primary)GER (Primary)
Transition ratePrim. to U. Prim
4.8
SC/ST Enrolment
Indicators
Classrooms/Other rooms
Prim.with U.P.&Sec/H.SUpper Primary onlyU. Primary with Sec./H.S.
Basic Data, 2001
Data reported from
Performance indicators
97.6 52.397.6 47.479.0 34.083.0 37.0

452
Elementary Education in India - Where do we stand ?
Raj
asth
an 20.1 16.8
Key data: Elementary Education
1180
JHALAWAR
(Previous academic year)
(Previous year)
Gender and caste distribution of teachers*
No. of schools by type of building*
BoysWith disability
Flow rates
Primary Level
Enrolment*
Number of schools
Grade
GER / NER
School category
Primary Upper primaryBoys Boys GirlsGirls
IncentiveType
School categoryMultiple
TypeKuccha
PartiallyPucca
PuccaTotal % good condition
Otherrooms
TentNo
Building
Classrooms
Belowsecondary
Highersecondary
Postgraduate
M. Phil.GraduateSecondarySchool category OthersNo
response
ST teachers
Total Male Female No res Male Female No res Male Female Male FemaleSC teachers
Text booksUniformAttendanceStationery
% Passed
Avg. No. of Tchs.
%
Female literacyOverall literacy
dev. grant grantSchool T L M
Male Female
IVV
IIIIII
Grade R.R. D.O.R. P.R.
VIIVI
# #
I - V
Enrolment by medium of instructions
Examination results
Retention rate
GPI
Primary cycle U. primary cycleState
DISTRICT ELEMENTARY EDUCATION REPORT CARD : 2005-06
GirlsGrade
IIIIIIIVVVI
VIII
AllGirls
Total
VII
% TotalGrossness
School category
46233
070
190 44527 33
03
064
0 0 0
1,258 73145 90,269
15 6,9850 00 9,0770 0
1,215 57 89,382 4,33133,081 84,937 25,615
7,140 6,985 3,2890 0 0
0 0 0481 8,042 0
94,189 5,748 2,3552,776
3061,444
P + UP P+sec/hs U.P. only UP+sec
School categoryP. only
2.3 0.6 0.0 0.0 0.048.2
Number of Clusters 21161629
% Schools with SCR > 602.3 0.0 0.0 11.0
4.9 16.3 6.7 0.0 0.0% Schools with pre-primary sections 14.9 34.2 38.3 0.0 6.8% Schools with common toilets 41.2 70.4 75.0 0.0 50.7
% Schools with girls toilets 13.0 44.9 71.7 0.0 60.3% Schools with drinking water facility 74.8 85.9 88.3 0.0 83.6
% Enrolment in Govt. schools 94.2 73.2 49.5 0.0 95.093.4 96.2 96.7 0.0 93.2
% No female teacher schools (tch>=2) 31.1 38.2 35.0 0.0 52.138.4 0.9 0.0 0.0 10.7
12.4 0.5 0.8 0.0 0.0%Enrolment in schools without blackboard 5.3 2.7 1.8 0.0 8.1
2001-02 2002-03 2003-04 2004-05 2005-06IIIIIIIVV
VIVII
Total U.P
45,19839,17138,82037,58132,58822,215
17,097
40,83839,51443,63234,26327,682
18,70013,189
38,42042,95136,88026,99022,519
14,22911,443
59,20749,14239,23129,66020,368
15,56512,457
51,50540,85533,22621,21517,346
12,8739,711
53,61244,60136,06138,67230,419
95.7
37.7
103.7
45.6
119.3
55.7
38.5
1.73.3
21,09718,78518,84018,27614,459
8,2805,9164,644
110,297
240253264318310111
9184
1,671
166164173185157
624324
974
2,706
classrooms
3,378549
0544
71.580.486.5
0.076.1
20.014.2
8.5
8.40.0
18.4
5.45.10.05.5
838191
0298
931 1,033 13 3 0 9 273589 14 1 0 16 32
54 0 0 0 1 50 0 0 0 0 0
69 0 0 0 3 1
31 105 586 891 531 1 037 146 688 1,890 1,243 7 1 2
9 7 51 216 150 4 0 00 0 0 0 0 0 0 00 7 45 135 149 0 0 0
27 63 195 281 189 2 0 0
15352990
3390
270
102498
066
611 0 449 66 0 517 117 69 170000
9112
04
11520
00
0000
76569
067
15850
10
7211
05
11200
Terminalgrade Passed
VIII boysV girlsV boys
VIII girls
1 with >60%
68.226614220
4690
340
47.221.9
0.04.4
58.943.814.4
0.01.5
97060Hindi Others English Gujarati Urdu
11804613657
08610
6131410
540
205
9975
41400
10180
000
39000
123
% Schools recvd.
80.865.021.7
0.09.6
80.364.021.7
0.08.2
78651323
11717537
24699284
63251495
77977798
182121497
14082239
138311550
2.06.57.80.04.7
11.010.612.1
8.2
14.011.717.4
6.510.0
59.8
70.8
0.90
2005-062004-052003-04
RAJASTHAN
25.2
Upper PrimaryPrimary
Sex ratio Sex ratio 0-6
11 101
VIII26.7
Enrolment of children
7,835VIII 10,650 10,389 12,712 14,300Total Pr. 164,147 197,608 167,760 185,929 193,358
1 - 5 6 - 8
0 0318 22
0 0
213 256
%Teachers recvd.in-service training
Total schools* Rural schools* Total enrolment* Rural enrolment* Teachers*
21.0 28.1
94.2
40.1
72.2 83.1
24.8 32.3% SC enrolment% SC girls to SC enrolment% ST enrolment
47.2 30.714.846.7 31.7
53.9
47.8
54.2
35.1
Position of teachers by educational qualification (other than para teacher)
(Previous academic year)Incentives : Number of beneficiaries
% ST girls to ST enrolment
% Girls
Number of villages
% 0 - 6 population
% SC population % ST population
% Urban population
% Schools with blackboard
% Enrolment in single-teacher schools
% Enrolment in schools without building
Primary Upperprimary
OBC EnrolmentPrimary U. Primary
% OBCEnrolment% OBC girls toOBC Enrolment
Pupil-teacher ratio (PTR)Student-classroom ratio (SCR)% Schools with <= 50 students% Schools with PTR > 100% Female teachers
% Schools established since 1995
Regular teachers Para-teachers
% minorrepairs
% majorrepairs
# = not applicable na = not available * Some totals may not match due to no response in classificatory data items
3.4 85.64.5 84.98.2 79.72.0 89.9
22.7 70.87.4 82.72.8 83.2
2630
48.73837
30.43.5
25.455.3
42.32937
2.51.8
27.029.1
0.000
0.00.00.00.0
42.02818
1.48.2
19.45.5
23.3 15.6 12.0 57.3 40.0
93492614.317.7
Category
PrivateGovt.PrivateGovtPrivateGovt.PrivateGovt.PrivateGovt.
Total population (in 000's)
Number of blocks/taluks
District
Decadal growth rate
Primary onlyPrimary with upper primaryPrimary with upper primary & sec/higher sec.Upper primary onlyUpper primary with sec./higher secondary
% Single classroom schools% Single teacher schools
P + UP P+sec/hs U.P. only UP+secP. only
No response in school category
Primary with upper primaryPrimary with U.P. & sec/higherUpper primary onlyUpper primary with sec./higher sec
Primary only
Primary onlyPrimary with upper primaryPrimary with Upper primary & sec/higherUpper primary only
Para-teachers
School category
Upper primary with sec./higher secondary
Primary onlyPrimary with upper prim.
P. onlyP + UPP+sec/hsU.P. onlyUP+sec
NER(U.Prim)GER(U.Prim)NER (Primary)GER (Primary)
Transition ratePrim. to U. Prim
12.9
SC/ST Enrolment
Indicators
Classrooms/Other rooms
Prim.with U.P.&Sec/H.SUpper Primary onlyU. Primary with Sec./H.S.
Basic Data, 2001
Data reported from
Performance indicators
98.1 47.398.0 42.273.8 35.976.3 39.2
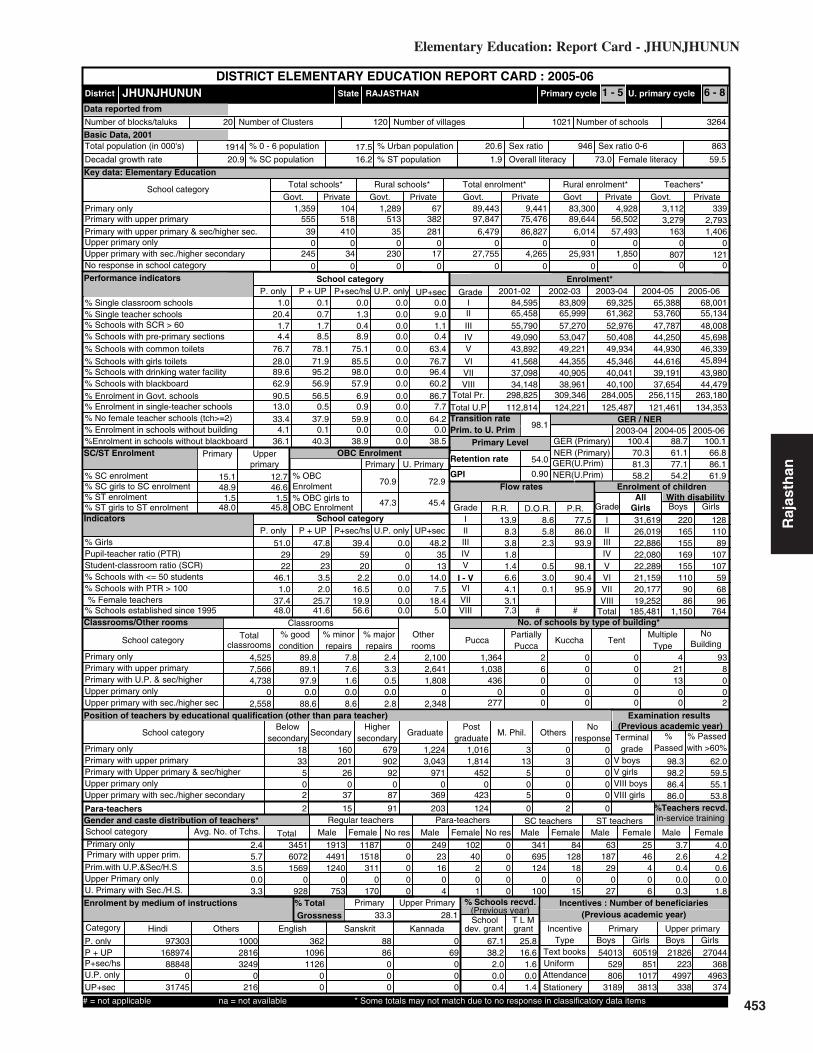
453
Elementary Education: Report Card - JHUNJHUNUN
Raj
asth
an15.1 12.7
Key data: Elementary Education
1914
JHUNJHUNUN
(Previous academic year)
(Previous year)
Gender and caste distribution of teachers*
No. of schools by type of building*
BoysWith disability
Flow rates
Primary Level
Enrolment*
Number of schools
Grade
GER / NER
School category
Primary Upper primaryBoys Boys GirlsGirls
IncentiveType
School categoryMultiple
TypeKuccha
PartiallyPucca
PuccaTotal % good condition
Otherrooms
TentNo
Building
Classrooms
Belowsecondary
Highersecondary
Postgraduate
M. Phil.GraduateSecondarySchool category OthersNo
response
ST teachers
Total Male Female No res Male Female No res Male Female Male FemaleSC teachers
Text booksUniformAttendanceStationery
% Passed
Avg. No. of Tchs.
%
Female literacyOverall literacy
dev. grant grantSchool T L M
Male Female
IVV
IIIIII
Grade R.R. D.O.R. P.R.
VIIVI
# #
I - V
Enrolment by medium of instructions
Examination results
Retention rate
GPI
Primary cycle U. primary cycleState
DISTRICT ELEMENTARY EDUCATION REPORT CARD : 2005-06
GirlsGrade
IIIIIIIVVVI
VIII
AllGirls
Total
VII
% TotalGrossness
School category
55539
0245
518 513410 35
034
0230
0 0 0
1,359 104382 97,847281 6,479
0 017 27,755
0 0
1,289 67 83,300 4,92875,476 89,644 56,50286,827 6,014 57,493
0 0 0
0 0 04,265 25,931 1,850
89,443 9,441 3,1123,279
3392,793
P + UP P+sec/hs U.P. only UP+sec
School categoryP. only
1.0 0.1 0.0 0.0 0.020.4
Number of Clusters 32641021
% Schools with SCR > 600.7 1.3 0.0 9.0
1.7 1.7 0.4 0.0 1.1% Schools with pre-primary sections 4.4 8.5 8.9 0.0 0.4% Schools with common toilets 76.7 78.1 75.1 0.0 63.4
% Schools with girls toilets 28.0 71.9 85.5 0.0 76.7% Schools with drinking water facility 89.6 95.2 98.0 0.0 96.4
% Enrolment in Govt. schools 90.5 56.5 6.9 0.0 86.762.9 56.9 57.9 0.0 60.2
% No female teacher schools (tch>=2) 33.4 37.9 59.9 0.0 64.213.0 0.5 0.9 0.0 7.7
4.1 0.1 0.0 0.0 0.0%Enrolment in schools without blackboard 36.1 40.3 38.9 0.0 38.5
2001-02 2002-03 2003-04 2004-05 2005-06IIIIIIIVV
VIVII
Total U.P
68,00155,13448,00845,69846,33945,894
43,980
65,38853,76047,78744,25044,930
44,61639,191
69,32561,36252,97650,40849,934
45,34640,041
83,80965,99957,27053,04749,221
44,35540,905
84,59565,45855,79049,09043,892
41,56837,098
134,353121,461125,487124,221112,814
100.4
81.3
88.7
77.1
100.1
86.1
39.4
2.216.5
31,61926,01922,88622,08022,28921,15920,17719,252
185,481
220165155169155110
9086
1,150
128110
89107107
596896
764
4,525
classrooms
7,5664,738
02,558
89.889.197.9
0.088.6
7.87.6
2.4
1.60.08.6
3.30.50.02.8
2,6411,808
02,348
2,100 1,364 2 0 0 4 931,038 6 0 0 21 8
436 0 0 0 13 00 0 0 0 0 0
277 0 0 0 0 2
18 160 679 1,224 1,016 3 033 201 902 3,043 1,814 13 3 0
5 26 92 971 452 5 0 00 0 0 0 0 0 0 02 37 87 369 423 5 0 0
2 15 91 203 124 0 2 0
191344911240
0753
1518311
0170
1187 0 249 102 0 341 84 63 250000
2316
04
40201
0000
695124
0100
12818
015
18729
027
46406
Terminalgrade Passed
VIII boysV girlsV boys
VIII girls
0 with >60%
3.7345160721569
0928
2.60.40.00.3
4.04.20.60.01.8
97303Hindi Others English Sanskrit Kannada
16897488848
031745
100028163249
0216
36210961126
00
8886
000
069
000
% Schools recvd.
67.138.2
2.00.00.4
25.816.6
1.60.01.4
54013529806
3189
21826223
4997338
60519851
10173813
27044368
4963374
2.45.73.50.03.3
13.98.33.81.8
4.13.17.3
1.46.6
54.0
98.1
0.90
2005-062004-052003-04
RAJASTHAN
19.9
Upper PrimaryPrimary
Sex ratio Sex ratio 0-6
20 120
VIII56.6
Enrolment of children
34,148VIII 38,961 40,100 37,654 44,479Total Pr. 298,825 309,346 284,005 256,115 263,180
1 - 5 6 - 8
0 0807 121
0 0
163 1,406
%Teachers recvd.in-service training
Total schools* Rural schools* Total enrolment* Rural enrolment* Teachers*
33.3 28.1
66.8
61.9
70.3 61.1
58.2 54.2% SC enrolment% SC girls to SC enrolment% ST enrolment
48.9 46.61.5
48.0 45.8
70.9
47.3
72.9
45.4
Position of teachers by educational qualification (other than para teacher)
(Previous academic year)Incentives : Number of beneficiaries
% ST girls to ST enrolment
% Girls
Number of villages
% 0 - 6 population
% SC population % ST population
% Urban population
% Schools with blackboard
% Enrolment in single-teacher schools
% Enrolment in schools without building
Primary Upperprimary
OBC EnrolmentPrimary U. Primary
% OBCEnrolment% OBC girls toOBC Enrolment
Pupil-teacher ratio (PTR)Student-classroom ratio (SCR)% Schools with <= 50 students% Schools with PTR > 100% Female teachers
% Schools established since 1995
Regular teachers Para-teachers
% minorrepairs
% majorrepairs
# = not applicable na = not available * Some totals may not match due to no response in classificatory data items
8.6 77.55.8 86.02.3 93.9
0.5 98.13.0 90.40.1 95.9
2059
51.02922
46.11.0
37.448.0
47.82923
3.52.0
25.741.6
0.000
0.00.00.00.0
48.23513
14.07.5
18.45.0
20.9 16.2 1.9 73.0 59.5
86394620.617.5
Category
PrivateGovt.PrivateGovtPrivateGovt.PrivateGovt.PrivateGovt.
Total population (in 000's)
Number of blocks/taluks
District
Decadal growth rate
Primary onlyPrimary with upper primaryPrimary with upper primary & sec/higher sec.Upper primary onlyUpper primary with sec./higher secondary
% Single classroom schools% Single teacher schools
P + UP P+sec/hs U.P. only UP+secP. only
No response in school category
Primary with upper primaryPrimary with U.P. & sec/higherUpper primary onlyUpper primary with sec./higher sec
Primary only
Primary onlyPrimary with upper primaryPrimary with Upper primary & sec/higherUpper primary only
Para-teachers
School category
Upper primary with sec./higher secondary
Primary onlyPrimary with upper prim.
P. onlyP + UPP+sec/hsU.P. onlyUP+sec
NER(U.Prim)GER(U.Prim)NER (Primary)GER (Primary)
Transition ratePrim. to U. Prim
1.5
SC/ST Enrolment
Indicators
Classrooms/Other rooms
Prim.with U.P.&Sec/H.SUpper Primary onlyU. Primary with Sec./H.S.
Basic Data, 2001
Data reported from
Performance indicators
98.3 62.098.2 59.586.4 55.186.0 53.8
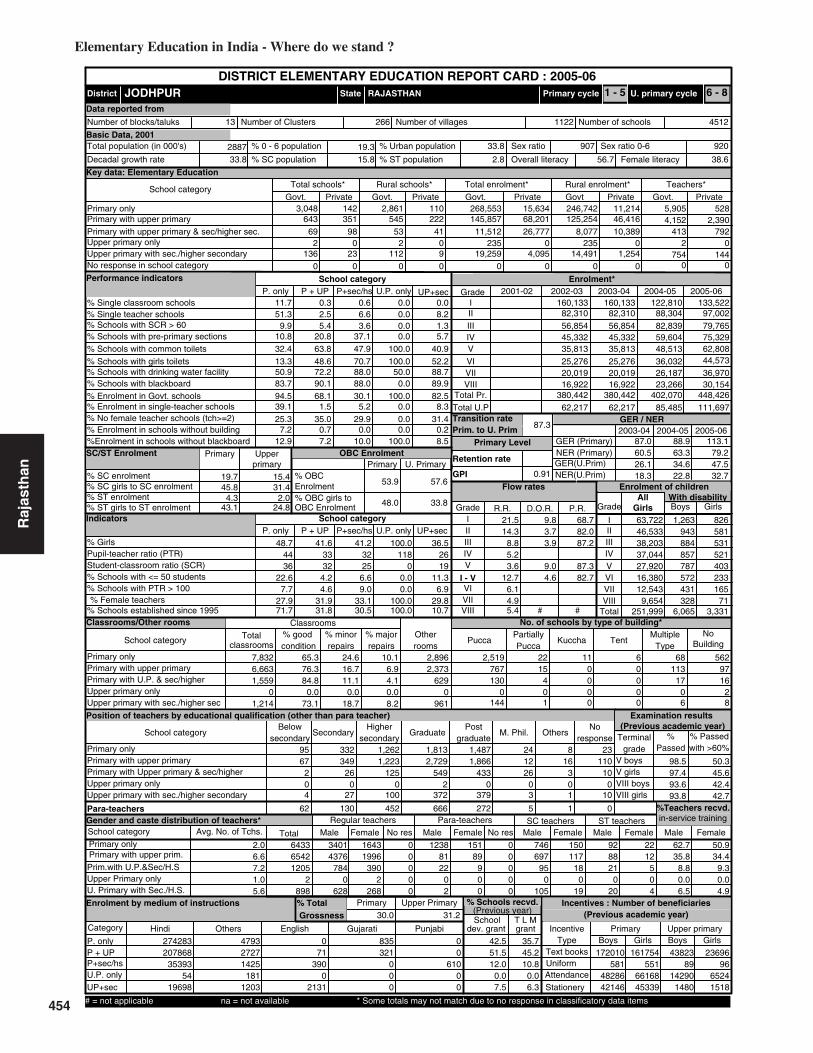
454
Elementary Education in India - Where do we stand ?
Raj
asth
an 19.7 15.4
Key data: Elementary Education
2887
JODHPUR
(Previous academic year)
(Previous year)
Gender and caste distribution of teachers*
No. of schools by type of building*
BoysWith disability
Flow rates
Primary Level
Enrolment*
Number of schools
Grade
GER / NER
School category
Primary Upper primaryBoys Boys GirlsGirls
IncentiveType
School categoryMultiple
TypeKuccha
PartiallyPucca
PuccaTotal % good condition
Otherrooms
TentNo
Building
Classrooms
Belowsecondary
Highersecondary
Postgraduate
M. Phil.GraduateSecondarySchool category OthersNo
response
ST teachers
Total Male Female No res Male Female No res Male Female Male FemaleSC teachers
Text booksUniformAttendanceStationery
% Passed
Avg. No. of Tchs.
%
Female literacyOverall literacy
dev. grant grantSchool T L M
Male Female
IVV
IIIIII
Grade R.R. D.O.R. P.R.
VIIVI
# #
I - V
Enrolment by medium of instructions
Examination results
Retention rate
GPI
Primary cycle U. primary cycleState
DISTRICT ELEMENTARY EDUCATION REPORT CARD : 2005-06
GirlsGrade
IIIIIIIVVVI
VIII
AllGirls
Total
VII
% TotalGrossness
School category
64369
2136
351 54598 53
023
2112
0 0 0
3,048 142222 145,857
41 11,5120 2359 19,2590 0
2,861 110 246,742 11,21468,201 125,254 46,41626,777 8,077 10,389
0 235 0
0 0 04,095 14,491 1,254
268,553 15,634 5,9054,152
5282,390
P + UP P+sec/hs U.P. only UP+sec
School categoryP. only
11.7 0.3 0.6 0.0 0.051.3
Number of Clusters 45121122
% Schools with SCR > 602.5 6.6 0.0 8.2
9.9 5.4 3.6 0.0 1.3% Schools with pre-primary sections 10.8 20.8 37.1 0.0 5.7% Schools with common toilets 32.4 63.8 47.9 100.0 40.9
% Schools with girls toilets 13.3 48.6 70.7 100.0 52.2% Schools with drinking water facility 50.9 72.2 88.0 50.0 88.7
% Enrolment in Govt. schools 94.5 68.1 30.1 100.0 82.583.7 90.1 88.0 0.0 89.9
% No female teacher schools (tch>=2) 25.3 35.0 29.9 0.0 31.439.1 1.5 5.2 0.0 8.3
7.2 0.7 0.0 0.0 0.2%Enrolment in schools without blackboard 12.9 7.2 10.0 100.0 8.5
2001-02 2002-03 2003-04 2004-05 2005-06IIIIIIIVV
VIVII
Total U.P
133,52297,00279,76575,32962,80844,573
36,970
122,81088,30482,83959,60448,513
36,03226,187
160,13382,31056,85445,33235,813
25,27620,019
160,13382,31056,85445,33235,813
25,27620,019
111,69785,48562,21762,217
87.0
26.1
88.9
34.6
113.1
47.5
41.2
6.69.0
63,72246,53338,20337,04427,92016,38012,543
9,654251,999
1,263943884857787572431328
6,065
826581531521403233165
713,331
7,832
classrooms
6,6631,559
01,214
65.376.384.8
0.073.1
24.616.7
10.1
11.10.0
18.7
6.94.10.08.2
2,373629
0961
2,896 2,519 22 11 6 68 562767 15 0 0 113 97130 4 0 0 17 16
0 0 0 0 0 2144 1 0 0 6 8
95 332 1,262 1,813 1,487 24 867 349 1,223 2,729 1,866 12 16 110
2 26 125 549 433 26 3 100 0 0 2 0 0 0 04 27 100 372 379 3 1 10
62 130 452 666 272 5 1 0
34014376
7840
628
1996390
2268
1643 0 1238 151 0 746 150 92 220000
8122
02
89900
0000
69795
0105
11718
019
8821
020
12504
Terminalgrade Passed
VIII boysV girlsV boys
VIII girls
23 with >60%
62.7643365421205
2898
35.88.80.06.5
50.934.4
9.30.04.9
274283Hindi Others English Gujarati Punjabi
20786835393
5419698
479327271425
1811203
071
3900
2131
835321
000
00
61000
% Schools recvd.
42.551.512.0
0.07.5
35.745.210.8
0.06.3
172010581
4828642146
4382389
142901480
161754551
6616845339
2369696
65241518
2.06.67.21.05.6
21.514.3
8.85.2
6.14.95.4
3.612.7
87.3
0.91
2005-062004-052003-04
RAJASTHAN
33.1
Upper PrimaryPrimary
Sex ratio Sex ratio 0-6
13 266
VIII30.5
Enrolment of children
VIII 16,922 16,922 23,266 30,154Total Pr. 380,442 380,442 402,070 448,426
1 - 5 6 - 8
2 0754 144
0 0
413 792
%Teachers recvd.in-service training
Total schools* Rural schools* Total enrolment* Rural enrolment* Teachers*
30.0 31.2
79.2
32.7
60.5 63.3
18.3 22.8% SC enrolment% SC girls to SC enrolment% ST enrolment
45.8 31.44.3
43.1 24.8
53.9
48.0
57.6
33.8
Position of teachers by educational qualification (other than para teacher)
(Previous academic year)Incentives : Number of beneficiaries
% ST girls to ST enrolment
% Girls
Number of villages
% 0 - 6 population
% SC population % ST population
% Urban population
% Schools with blackboard
% Enrolment in single-teacher schools
% Enrolment in schools without building
Primary Upperprimary
OBC EnrolmentPrimary U. Primary
% OBCEnrolment% OBC girls toOBC Enrolment
Pupil-teacher ratio (PTR)Student-classroom ratio (SCR)% Schools with <= 50 students% Schools with PTR > 100% Female teachers
% Schools established since 1995
Regular teachers Para-teachers
% minorrepairs
% majorrepairs
# = not applicable na = not available * Some totals may not match due to no response in classificatory data items
9.8 68.73.7 82.03.9 87.2
9.0 87.34.6 82.7
2532
48.74436
22.67.7
27.971.7
41.63332
4.24.6
31.931.8
100.0118
00.00.0
100.0100.0
36.52619
11.36.9
29.810.7
33.8 15.8 2.8 56.7 38.6
92090733.819.3
Category
PrivateGovt.PrivateGovtPrivateGovt.PrivateGovt.PrivateGovt.
Total population (in 000's)
Number of blocks/taluks
District
Decadal growth rate
Primary onlyPrimary with upper primaryPrimary with upper primary & sec/higher sec.Upper primary onlyUpper primary with sec./higher secondary
% Single classroom schools% Single teacher schools
P + UP P+sec/hs U.P. only UP+secP. only
No response in school category
Primary with upper primaryPrimary with U.P. & sec/higherUpper primary onlyUpper primary with sec./higher sec
Primary only
Primary onlyPrimary with upper primaryPrimary with Upper primary & sec/higherUpper primary only
Para-teachers
School category
Upper primary with sec./higher secondary
Primary onlyPrimary with upper prim.
P. onlyP + UPP+sec/hsU.P. onlyUP+sec
NER(U.Prim)GER(U.Prim)NER (Primary)GER (Primary)
Transition ratePrim. to U. Prim
2.0
SC/ST Enrolment
Indicators
Classrooms/Other rooms
Prim.with U.P.&Sec/H.SUpper Primary onlyU. Primary with Sec./H.S.
Basic Data, 2001
Data reported from
Performance indicators
98.5 50.397.4 45.693.6 42.493.8 42.7

455
Elementary Education: Report Card - KARAULI
Raj
asth
an27.7 22.8
Key data: Elementary Education
1210
KARAULI
(Previous academic year)
(Previous year)
Gender and caste distribution of teachers*
No. of schools by type of building*
BoysWith disability
Flow rates
Primary Level
Enrolment*
Number of schools
Grade
GER / NER
School category
Primary Upper primaryBoys Boys GirlsGirls
IncentiveType
School categoryMultiple
TypeKuccha
PartiallyPucca
PuccaTotal % good condition
Otherrooms
TentNo
Building
Classrooms
Belowsecondary
Highersecondary
Postgraduate
M. Phil.GraduateSecondarySchool category OthersNo
response
ST teachers
Total Male Female No res Male Female No res Male Female Male FemaleSC teachers
Text booksUniformAttendanceStationery
% Passed
Avg. No. of Tchs.
%
Female literacyOverall literacy
dev. grant grantSchool T L M
Male Female
IVV
IIIIII
Grade R.R. D.O.R. P.R.
VIIVI
# #
I - V
Enrolment by medium of instructions
Examination results
Retention rate
GPI
Primary cycle U. primary cycleState
DISTRICT ELEMENTARY EDUCATION REPORT CARD : 2005-06
GirlsGrade
IIIIIIIVVVI
VIII
AllGirls
Total
VII
% TotalGrossness
School category
316221081
194 29769 22
04
1079
0 0 0
1,189 70184 69,542
62 4,6420 9634 11,6700 0
1,131 66 98,854 7,09638,468 65,655 36,40116,323 4,642 14,025
0 963 0
0 0 0845 11,509 845
104,461 7,507 2,4501,714
45228
P + UP P+sec/hs U.P. only UP+sec
School categoryP. only
1.7 0.6 0.0 0.0 0.037.0
Number of Clusters 1955265
% Schools with SCR > 602.2 1.1 0.0 10.6
3.4 7.6 3.3 0.0 0.0% Schools with pre-primary sections 6.7 12.0 11.0 0.0 2.4% Schools with common toilets 36.1 62.4 65.9 40.0 35.3
% Schools with girls toilets 15.7 39.0 61.5 20.0 31.8% Schools with drinking water facility 63.9 82.9 83.5 90.0 80.0
% Enrolment in Govt. schools 93.3 64.4 22.1 100.0 93.256.2 66.7 83.5 60.0 87.1
% No female teacher schools (tch>=2) 39.3 37.3 18.7 60.0 58.824.5 2.5 1.1 0.0 8.3
12.4 1.7 0.0 0.0 0.0%Enrolment in schools without blackboard 44.2 34.0 11.4 48.9 11.2
2001-02 2002-03 2003-04 2004-05 2005-06IIIIIIIVV
VIVII
Total U.P
46,34542,04736,63937,03731,94623,082
19,988
29,34424,62628,02220,93218,790
8,7456,079
23,62727,64722,88718,29115,744
10,3028,457
59,57645,68638,13830,25122,455
17,77115,351
60,40720,00226,70147,916
59.5
26.9
64.9
19.5
116.8
61.2
31.5
2.23.3
21,50119,74117,26118,71114,349
8,5026,7395,072
111,876
223188184188215
826766
1,213
145148113132117
413919
754
1,633
classrooms
1,592484
24599
47.050.958.154.251.9
40.242.6
12.7
32.233.339.4
6.59.7
12.58.7
472123
5392
557 536 4 1 1 23 694231 4 0 0 31 244
49 1 0 0 5 366 0 0 0 1 3
66 0 0 0 6 13
35 134 392 839 595 18 526 104 330 795 623 6 1 0
1 4 19 66 49 1 0 02 1 6 15 21 0 0 00 8 38 126 148 0 0 0
34 37 134 218 126 1 1 0
17341664
12743
301
22113
219
284 0 428 49 0 691 41 241 180000
2730
11
30210
0000
45251
876
51200
17890
35
20300
Terminalgrade Passed
VIII boysV girlsV boys
VIII girls
0 with >60%
26.224951942
14546
331
20.86.2
65.11.9
29.113.540.066.7
5.3
97840Hindi Others Assamese Gujarati Kashmiri
8406611646
9177417
1268122853
898346
4792
1760
33600
1730000
1390000
% Schools recvd.
36.926.3
4.460.0
5.9
34.623.3
5.560.0
8.2
69687470352
4902
17341202
3754160
74999373361
4765
1089879
320576
2.03.81.64.63.9
9.79.06.84.9
10.09.0
21.2
3.87.1
100.0
0.89
2005-062004-052003-04
RAJASTHAN
10.3
Upper PrimaryPrimary
Sex ratio Sex ratio 0-6
5 59
VIII52.7
Enrolment of children
VIII 14,794 7,942 5,178 17,337Total Pr. 196,106 108,196 121,714 194,014
1 - 5 6 - 8
46 0324 7
0 0
85 60
%Teachers recvd.in-service training
Total schools* Rural schools* Total enrolment* Rural enrolment* Teachers*
39.1 35.6
71.1
39.4
34.7 39.4
16.4 12.2% SC enrolment% SC girls to SC enrolment% ST enrolment
45.6 27.324.448.6 37.6
37.4
47.3
34.4
30.4
Position of teachers by educational qualification (other than para teacher)
(Previous academic year)Incentives : Number of beneficiaries
% ST girls to ST enrolment
% Girls
Number of villages
% 0 - 6 population
% SC population % ST population
% Urban population
% Schools with blackboard
% Enrolment in single-teacher schools
% Enrolment in schools without building
Primary Upperprimary
OBC EnrolmentPrimary U. Primary
% OBCEnrolment% OBC girls toOBC Enrolment
Pupil-teacher ratio (PTR)Student-classroom ratio (SCR)% Schools with <= 50 students% Schools with PTR > 100% Female teachers
% Schools established since 1995
Regular teachers Para-teachers
% minorrepairs
% majorrepairs
# = not applicable na = not available * Some totals may not match due to no response in classificatory data items
43145
50.04569
24.53.5
13.361.6
41.25668
2.22.9
12.941.0
22.42140
20.00.06.5
10.0
37.03821
3.57.15.7
15.3
30.0 23.2 22.4 63.4 44.4
87385514.220.6
Category
PrivateGovt.PrivateGovtPrivateGovt.PrivateGovt.PrivateGovt.
Total population (in 000's)
Number of blocks/taluks
District
Decadal growth rate
Primary onlyPrimary with upper primaryPrimary with upper primary & sec/higher sec.Upper primary onlyUpper primary with sec./higher secondary
% Single classroom schools% Single teacher schools
P + UP P+sec/hs U.P. only UP+secP. only
No response in school category
Primary with upper primaryPrimary with U.P. & sec/higherUpper primary onlyUpper primary with sec./higher sec
Primary only
Primary onlyPrimary with upper primaryPrimary with Upper primary & sec/higherUpper primary only
Para-teachers
School category
Upper primary with sec./higher secondary
Primary onlyPrimary with upper prim.
P. onlyP + UPP+sec/hsU.P. onlyUP+sec
NER(U.Prim)GER(U.Prim)NER (Primary)GER (Primary)
Transition ratePrim. to U. Prim
29.4
SC/ST Enrolment
Indicators
Classrooms/Other rooms
Prim.with U.P.&Sec/H.SUpper Primary onlyU. Primary with Sec./H.S.
Basic Data, 2001
Data reported from
Performance indicators
96.8 55.696.1 46.892.7 48.192.6 42.0

456
Elementary Education in India - Where do we stand ?
Raj
asth
an 26.4 21.6
Key data: Elementary Education
1569
KOTA
(Previous academic year)
(Previous year)
Gender and caste distribution of teachers*
No. of schools by type of building*
BoysWith disability
Flow rates
Primary Level
Enrolment*
Number of schools
Grade
GER / NER
School category
Primary Upper primaryBoys Boys GirlsGirls
IncentiveType
School categoryMultiple
TypeKuccha
PartiallyPucca
PuccaTotal % good condition
Otherrooms
TentNo
Building
Classrooms
Belowsecondary
Highersecondary
Postgraduate
M. Phil.GraduateSecondarySchool category OthersNo
response
ST teachers
Total Male Female No res Male Female No res Male Female Male FemaleSC teachers
Text booksUniformAttendanceStationery
% Passed
Avg. No. of Tchs.
%
Female literacyOverall literacy
dev. grant grantSchool T L M
Male Female
IVV
IIIIII
Grade R.R. D.O.R. P.R.
VIIVI
# #
I - V
Enrolment by medium of instructions
Examination results
Retention rate
GPI
Primary cycle U. primary cycleState
DISTRICT ELEMENTARY EDUCATION REPORT CARD : 2005-06
GirlsGrade
IIIIIIIVVVI
VIII
AllGirls
Total
VII
% TotalGrossness
School category
35131
0113
364 272217 14
039
082
0 0 0
824 140159 80,189
36 8,0840 04 16,8860 0
703 99 55,949 7,53754,999 59,364 26,80650,333 2,974 9,232
0 0 0
0 0 08,128 12,062 554
71,299 11,192 2,1682,553
7052,833
P + UP P+sec/hs U.P. only UP+sec
School categoryP. only
2.9 0.0 0.4 0.0 0.025.8
Number of Clusters 2079928
% Schools with SCR > 600.7 0.4 0.0 1.3
3.9 7.7 4.4 0.0 0.0% Schools with pre-primary sections 25.9 46.3 78.2 0.0 20.4% Schools with common toilets 66.4 74.1 52.4 0.0 52.0
% Schools with girls toilets 29.9 65.6 89.1 0.0 64.5% Schools with drinking water facility 90.7 95.7 97.6 0.0 96.7
% Enrolment in Govt. schools 86.4 59.3 13.8 0.0 67.592.3 94.5 95.2 0.0 92.8
% No female teacher schools (tch>=2) 33.2 19.6 10.5 0.0 25.016.8 0.3 0.3 0.0 1.0
7.8 0.9 0.0 0.0 0.0%Enrolment in schools without blackboard 8.1 6.6 5.3 0.0 5.3
2001-02 2002-03 2003-04 2004-05 2005-06IIIIIIIVV
VIVII
Total U.P
53,06641,10540,93839,06137,52634,621
28,410
39,57335,88737,42231,06426,806
22,52316,368
34,83435,52330,74523,64320,719
13,50810,858
44,74536,05029,39824,33318,838
14,35011,920
42,26431,55825,57319,58216,525
12,6469,529
89,41452,32024,36628,12829,835
61.8
19.0
70.6
39.6
98.3
69.9
42.9
4.02.0
25,12019,89920,19819,11317,93615,48312,30611,011
141,066
286253321369349233171195
2,177
215204232250230142126121
1,520
2,709
classrooms
4,4662,756
01,378
80.088.296.8
0.083.7
15.08.5
5.0
2.40.0
11.6
3.30.80.04.6
1,116879
0756
742 768 12 17 0 14 153606 20 9 1 33 45214 3 0 0 9 22
0 0 0 0 0 0140 0 0 0 5 7
56 122 623 965 756 4 9234 192 870 2,256 1,566 6 44 1379 51 227 1,003 638 8 2 1
0 0 0 0 0 0 0 091 33 126 373 389 6 2 3
12 24 145 294 153 3 11 0
154030391152
0593
21301157
0430
995 0 237 101 0 462 106 177 210000
9437
017
12325
013
0000
639191
0133
21665
031
17237
028
4622
08
Terminalgrade Passed
VIII boysV girlsV boys
VIII girls
0 with >60%
63.8287353862371
01053
36.23.60.0
11.3
53.928.4
4.20.07.0
78832Hindi Others English Sanskrit Urdu
12754550159
023845
237853241675
01123
92310546583
046
0370
000
23193
000
% Schools recvd.
76.845.5
4.80.02.0
72.942.7
5.20.04.6
59959147613976564
23688786
94813916
6529137141147
11230
20003780
68034082
3.07.59.60.06.9
12.110.511.4
8.4
15.811.324.6
6.210.0
84.8
100.0
0.93
2005-062004-052003-04
RAJASTHAN
49.9
Upper PrimaryPrimary
Sex ratio Sex ratio 0-6
6 67
VIII29.8
Enrolment of children
7,660VIII 1,858 13,429 26,383Total Pr. 135,502 153,364 145,464 170,752 211,696
1 - 5 6 - 8
0 0707 346
0 0
251 2,120
%Teachers recvd.in-service training
Total schools* Rural schools* Total enrolment* Rural enrolment* Teachers*
24.1 28.8
74.5
49.8
46.9 53.2
13.8 27.8% SC enrolment% SC girls to SC enrolment% ST enrolment
48.3 40.811.447.2 40.4
41.3
48.9
42.6
43.5
Position of teachers by educational qualification (other than para teacher)
(Previous academic year)Incentives : Number of beneficiaries
% ST girls to ST enrolment
% Girls
Number of villages
% 0 - 6 population
% SC population % ST population
% Urban population
% Schools with blackboard
% Enrolment in single-teacher schools
% Enrolment in schools without building
Primary Upperprimary
OBC EnrolmentPrimary U. Primary
% OBCEnrolment% OBC girls toOBC Enrolment
Pupil-teacher ratio (PTR)Student-classroom ratio (SCR)% Schools with <= 50 students% Schools with PTR > 100% Female teachers
% Schools established since 1995
Regular teachers Para-teachers
% minorrepairs
% majorrepairs
# = not applicable na = not available * Some totals may not match due to no response in classificatory data items
2125
50.42930
31.82.7
38.153.1
46.62530
4.20.6
41.840.1
0.000
0.00.00.00.0
45.82418
6.61.3
42.115.1
28.5 19.2 9.7 73.5 60.4
91289653.516.0
Category
PrivateGovt.PrivateGovtPrivateGovt.PrivateGovt.PrivateGovt.
Total population (in 000's)
Number of blocks/taluks
District
Decadal growth rate
Primary onlyPrimary with upper primaryPrimary with upper primary & sec/higher sec.Upper primary onlyUpper primary with sec./higher secondary
% Single classroom schools% Single teacher schools
P + UP P+sec/hs U.P. only UP+secP. only
No response in school category
Primary with upper primaryPrimary with U.P. & sec/higherUpper primary onlyUpper primary with sec./higher sec
Primary only
Primary onlyPrimary with upper primaryPrimary with Upper primary & sec/higherUpper primary only
Para-teachers
School category
Upper primary with sec./higher secondary
Primary onlyPrimary with upper prim.
P. onlyP + UPP+sec/hsU.P. onlyUP+sec
NER(U.Prim)GER(U.Prim)NER (Primary)GER (Primary)
Transition ratePrim. to U. Prim
10.9
SC/ST Enrolment
Indicators
Classrooms/Other rooms
Prim.with U.P.&Sec/H.SUpper Primary onlyU. Primary with Sec./H.S.
Basic Data, 2001
Data reported from
Performance indicators
97.4 47.897.6 43.476.3 45.876.7 47.5

457
Elementary Education: Report Card - NAGAUR
Raj
asth
an
0.8930.804
23.7 15.3
Key data: Elementary Education
2775
NAGAUR
(Previous academic year)
(Previous year)
Gender and caste distribution of teachers*
No. of schools by type of building*
BoysWith disability
Flow rates
Primary Level
Enrolment*
Number of schools
Grade
GER / NER
School category
Primary Upper primaryBoys Boys GirlsGirls
IncentiveType
School categoryMultiple
TypeKuccha
PartiallyPucca
PuccaTotal % good condition
Otherrooms
TentNo
Building
Classrooms
Belowsecondary
Highersecondary
Postgraduate
M. Phil.GraduateSecondarySchool category OthersNo
response
ST teachers
Total Male Female No res Male Female No res Male Female Male FemaleSC teachers
Text booksUniformAttendanceStationery
% Passed
Avg. No. of Tchs.
%
Female literacyOverall literacy
dev. grant grantSchool T L M
Male Female
IVV
IIIIII
Grade R.R. D.O.R. P.R.
VIIVI
# #
I - V
Enrolment by medium of instructions
Examination results
Retention rate
GPI
Primary cycle U. primary cycleState
DISTRICT ELEMENTARY EDUCATION REPORT CARD : 2005-06
GirlsGrade
IIIIIIIVVVI
VIII
AllGirls
Total
VII
% TotalGrossness
School category
81274
9249
610 776169 71
848
6225
0 0 0
2,460 416465 175,258108 12,257
7 1,10332 31,771
0 0
2,321 329 184,966 26,917113,610 167,993 86,846
44,988 12,106 28,742968 970 968
0 0 09,300 28,803 6,218
196,907 33,023 4,9624,622
1,2424,077
P + UP P+sec/hs U.P. only UP+sec
School categoryP. only
5.9 1.3 0.0 0.0 1.036.9
Number of Clusters 48551576
% Schools with SCR > 603.0 3.3 0.0 4.4
7.3 10.5 1.2 5.9 2.0% Schools with pre-primary sections 5.3 11.8 17.3 17.6 2.7% Schools with common toilets 46.1 68.1 60.5 58.8 56.9
% Schools with girls toilets 17.5 60.8 76.5 64.7 50.8% Schools with drinking water facility 54.7 74.1 84.8 64.7 82.5
% Enrolment in Govt. schools 85.6 60.7 21.4 53.3 77.481.5 86.1 85.6 64.7 84.2
% No female teacher schools (tch>=2) 40.2 51.5 42.8 52.9 66.025.3 2.8 4.5 0.0 3.8
12.0 0.3 0.5 0.0 0.0%Enrolment in schools without blackboard 12.3 7.7 8.8 13.7 7.5
2001-02 2002-03 2003-04 2004-05 2005-06IIIIIIIVV
VIVII
Total U.P
140,85699,36882,07073,70371,09160,393
50,042
137,42590,24077,84666,21561,879
50,82539,061
125,98696,41774,21762,97955,433
43,00532,428
164,62996,22273,76662,42051,766
38,67432,212
160,08087,61964,99950,70240,966
34,69325,738
152,097122,249103,66797,06080,991
99.5
45.5
101.0
52.2
122.6
67.2
36.1
6.63.3
65,91546,35937,79433,54330,58923,18117,78813,667
268,836
1,310929847820795549479340
6,069
838627582522424286231169
3,679
6,368
classrooms
8,5342,475
902,470
71.579.286.168.971.1
21.114.6
7.4
10.620.022.4
6.23.2
11.16.6
2,905784
341,665
2,685 2,083 19 4 0 53 7171,145 15 3 0 131 128
192 4 0 0 31 1610 0 0 0 3 4
285 0 0 0 12 0
115 295 1,017 2,170 1,368 18 10132 372 1,426 4,075 2,272 22 17 72
31 55 190 986 552 7 0 210 6 14 49 25 0 0 1
34 74 202 723 715 6 1 17
45 84 395 694 349 5 3 0
412170171516
721533
1371326
23239
906 0 1043 134 0 850 121 121 220000
18625
436
12515
012
0000
1208176
7209
14920
418
16133
034
28507
Terminalgrade Passed
VIII boysV girlsV boys
VIII girls
34 with >60%
35.0620486991882
991820
20.63.7
11.88.1
28.922.3
1.50.08.8
218607Hindi Others Kannada Gujarati English
27781453891
207139861
540329671293
0766
16691811
61100
10220
27600
76457
9500
% Schools recvd.
69.649.915.623.513.1
18.412.910.7
5.910.4
151736713
439249360
44616531
16834792
153586833
5729214014
31391217
147761770
2.26.17.75.86.1
22.416.1
9.54.3
6.94.66.3
3.313.3
43.1
92.0
0.85
2005-062004-052003-04
RAJASTHAN
18.1
Upper PrimaryPrimary
Sex ratio Sex ratio 0-6
21 163
VIII50.6
Enrolment of children
20,560VIII 26,174 28,234 32,363 41,662Total Pr. 404,366 448,803 415,032 433,605 467,088
1 - 5 6 - 8
54 451,481 339
0 0
409 1,473
%Teachers recvd.in-service training
Total schools* Rural schools* Total enrolment* Rural enrolment* Teachers*
30.3 29.7
85.5
47.2
68.8 70.8
31.3 35.4% SC enrolment% SC girls to SC enrolment% ST enrolment
45.3 27.7
46.1 43.0
60.8
45.9
65.0
36.1
Position of teachers by educational qualification (other than para teacher)
(Previous academic year)Incentives : Number of beneficiaries
% ST girls to ST enrolment
% Girls
Number of villages
% 0 - 6 population
% SC population % ST population
% Urban population
% Schools with blackboard
% Enrolment in single-teacher schools
% Enrolment in schools without building
Primary Upperprimary
OBC EnrolmentPrimary U. Primary
% OBCEnrolment% OBC girls toOBC Enrolment
Pupil-teacher ratio (PTR)Student-classroom ratio (SCR)% Schools with <= 50 students% Schools with PTR > 100% Female teachers
% Schools established since 1995
Regular teachers Para-teachers
% minorrepairs
% majorrepairs
# = not applicable na = not available * Some totals may not match due to no response in classificatory data items
15.9 61.71.1 82.7
4.7 92.04.6 82.2
2330
47.53736
31.52.3
16.867.9
42.73334
5.83.0
17.244.9
31.32123
17.60.0
23.235.3
36.32317
10.43.4
13.818.9
29.3 19.6 0.2 57.3 39.7
91594717.219.0
Category
PrivateGovt.PrivateGovtPrivateGovt.PrivateGovt.PrivateGovt.
Total population (in 000's)
Number of blocks/taluks
District
Decadal growth rate
Primary onlyPrimary with upper primaryPrimary with upper primary & sec/higher sec.Upper primary onlyUpper primary with sec./higher secondary
% Single classroom schools% Single teacher schools
P + UP P+sec/hs U.P. only UP+secP. only
No response in school category
Primary with upper primaryPrimary with U.P. & sec/higherUpper primary onlyUpper primary with sec./higher sec
Primary only
Primary onlyPrimary with upper primaryPrimary with Upper primary & sec/higherUpper primary only
Para-teachers
School category
Upper primary with sec./higher secondary
Primary onlyPrimary with upper prim.
P. onlyP + UPP+sec/hsU.P. onlyUP+sec
NER(U.Prim)GER(U.Prim)NER (Primary)GER (Primary)
Transition ratePrim. to U. Prim
SC/ST Enrolment
Indicators
Classrooms/Other rooms
Prim.with U.P.&Sec/H.SUpper Primary onlyU. Primary with Sec./H.S.
Basic Data, 2001
Data reported from
Performance indicators
91.6 54.691.0 52.481.3 47.081.3 46.7

458
Elementary Education in India - Where do we stand ?
Raj
asth
an 21.4 18.2
Key data: Elementary Education
1820
PALI
(Previous academic year)
(Previous year)
Gender and caste distribution of teachers*
No. of schools by type of building*
BoysWith disability
Flow rates
Primary Level
Enrolment*
Number of schools
Grade
GER / NER
School category
Primary Upper primaryBoys Boys GirlsGirls
IncentiveType
School categoryMultiple
TypeKuccha
PartiallyPucca
PuccaTotal % good condition
Otherrooms
TentNo
Building
Classrooms
Belowsecondary
Highersecondary
Postgraduate
M. Phil.GraduateSecondarySchool category OthersNo
response
ST teachers
Total Male Female No res Male Female No res Male Female Male FemaleSC teachers
Text booksUniformAttendanceStationery
% Passed
Avg. No. of Tchs.
%
Female literacyOverall literacy
dev. grant grantSchool T L M
Male Female
IVV
IIIIII
Grade R.R. D.O.R. P.R.
VIIVI
# #
I - V
Enrolment by medium of instructions
Examination results
Retention rate
GPI
Primary cycle U. primary cycleState
DISTRICT ELEMENTARY EDUCATION REPORT CARD : 2005-06
GirlsGrade
IIIIIIIVVVI
VIII
AllGirls
Total
VII
% TotalGrossness
School category
66347
0137
263 61537 45
011
0123
0 0 0
1,514 272185 145,910
16 8,9070 08 19,5220 0
1,422 236 127,593 25,79847,311 134,613 32,466
9,412 8,126 3,5710 0 0
0 0 01,597 18,033 1,175
138,462 30,777 3,4123,900
1,1861,827
P + UP P+sec/hs U.P. only UP+sec
School categoryP. only
2.2 0.8 0.0 0.0 0.732.5
Number of Clusters 2944960
% Schools with SCR > 605.0 6.0 0.0 5.4
5.2 4.3 2.4 0.0 1.4% Schools with pre-primary sections 11.8 22.5 29.8 0.0 7.4% Schools with common toilets 36.7 60.4 51.2 0.0 46.6
% Schools with girls toilets 20.9 47.3 69.0 0.0 60.1% Schools with drinking water facility 75.2 81.4 82.1 0.0 94.6
% Enrolment in Govt. schools 81.8 75.5 48.6 0.0 92.482.0 85.0 85.7 0.0 89.2
% No female teacher schools (tch>=2) 42.6 43.0 38.1 0.0 60.120.3 2.6 4.2 0.0 6.2
2.9 0.9 0.0 0.0 0.1%Enrolment in schools without blackboard 15.3 9.3 8.9 0.0 6.2
2001-02 2002-03 2003-04 2004-05 2005-06IIIIIIIVV
VIVII
Total U.P
85,45565,60854,32750,68248,96642,202
31,948
83,48259,76752,90347,86043,148
38,09925,784
52,68747,67038,12432,39427,926
23,54717,056
105,94074,18457,14147,15139,143
34,17527,445
96,86063,88354,42182,933
73.7
37.0
104.1
42.4
122.0
65.3
40.6
2.43.6
41,00131,47224,96922,59220,93116,13311,329
7,868176,295
674556533529537696459
214,005
497390335317317260198
52,319
5,310
classrooms
5,775733
01,208
69.176.172.9
0.064.8
22.817.3
8.1
22.00.0
22.9
6.65.20.0
12.3
1,986293
0847
2,033 1,417 28 1 1 51 287766 13 0 0 36 108
70 1 0 0 7 60 0 0 0 0 0
131 0 0 0 3 14
72 230 908 1,713 1,098 18 335 222 1,076 2,494 1,662 38 4 0
4 16 80 303 183 7 0 00 0 0 0 0 0 0 03 20 119 346 374 8 0 0
43 40 156 331 202 3 0 0
32614406
4510
734
1125142
0136
781 0 463 93 0 1049 118 142 240000
93507
103605
0000
111374
0142
16119
011
15080
35
25905
Terminalgrade Passed
VIII boysV girlsV boys
VIII girls
0 with >60%
43.345985727
6040
882
39.121.7
0.06.7
38.727.430.4
0.07.1
160506Hindi Others English Kannada Gujarati
18675917359
020730
43623567
1700
201
26485
72700
289327
000
199000
258
% Schools recvd.
51.755.327.4
0.010.8
48.756.733.3
0.014.2
1102212645
1132176452
44006950
453522383
10456711174
1028815619
27486305
397941134
2.66.27.20.06.0
25.118.710.7
6.6
12.79.1
4.414.9
86.6
0.86
2005-062004-052003-04
RAJASTHAN
24.5
Upper PrimaryPrimary
Sex ratio Sex ratio 0-6
10 195
VIII19.0
Enrolment of children
VIII 21,313 13,818 22,710Total Pr. 323,559 198,801 287,160 305,038
1 - 5 6 - 8
0 0781 101
0 0
282 322
%Teachers recvd.in-service training
Total schools* Rural schools* Total enrolment* Rural enrolment* Teachers*
29.9 32.7
85.6
43.9
51.6 71.4
25.0 29.5% SC enrolment% SC girls to SC enrolment% ST enrolment
45.9 35.36.8
41.7 29.7
57.5
47.1
58.0
34.4
Position of teachers by educational qualification (other than para teacher)
(Previous academic year)Incentives : Number of beneficiaries
% ST girls to ST enrolment
% Girls
Number of villages
% 0 - 6 population
% SC population % ST population
% Urban population
% Schools with blackboard
% Enrolment in single-teacher schools
% Enrolment in schools without building
Primary Upperprimary
OBC EnrolmentPrimary U. Primary
% OBCEnrolment% OBC girls toOBC Enrolment
Pupil-teacher ratio (PTR)Student-classroom ratio (SCR)% Schools with <= 50 students% Schools with PTR > 100% Female teachers
% Schools established since 1995
Regular teachers Para-teachers
% minorrepairs
% majorrepairs
# = not applicable na = not available * Some totals may not match due to no response in classificatory data items
9.8 65.2
9.0 86.63.2 81.89.6 77.7
12.8 78.1
2530
45.83732
25.04.2
19.062.2
43.63433
5.44.4
21.427.8
0.000
0.00.00.00.0
33.52417
6.86.8
16.09.5
22.4 17.8 5.8 54.4 36.5
92598121.518.6
Category
PrivateGovt.PrivateGovtPrivateGovt.PrivateGovt.PrivateGovt.
Total population (in 000's)
Number of blocks/taluks
District
Decadal growth rate
Primary onlyPrimary with upper primaryPrimary with upper primary & sec/higher sec.Upper primary onlyUpper primary with sec./higher secondary
% Single classroom schools% Single teacher schools
P + UP P+sec/hs U.P. only UP+secP. only
No response in school category
Primary with upper primaryPrimary with U.P. & sec/higherUpper primary onlyUpper primary with sec./higher sec
Primary only
Primary onlyPrimary with upper primaryPrimary with Upper primary & sec/higherUpper primary only
Para-teachers
School category
Upper primary with sec./higher secondary
Primary onlyPrimary with upper prim.
P. onlyP + UPP+sec/hsU.P. onlyUP+sec
NER(U.Prim)GER(U.Prim)NER (Primary)GER (Primary)
Transition ratePrim. to U. Prim
5.2
SC/ST Enrolment
Indicators
Classrooms/Other rooms
Prim.with U.P.&Sec/H.SUpper Primary onlyU. Primary with Sec./H.S.
Basic Data, 2001
Data reported from
Performance indicators
96.4 40.995.7 35.984.6 30.886.2 29.5
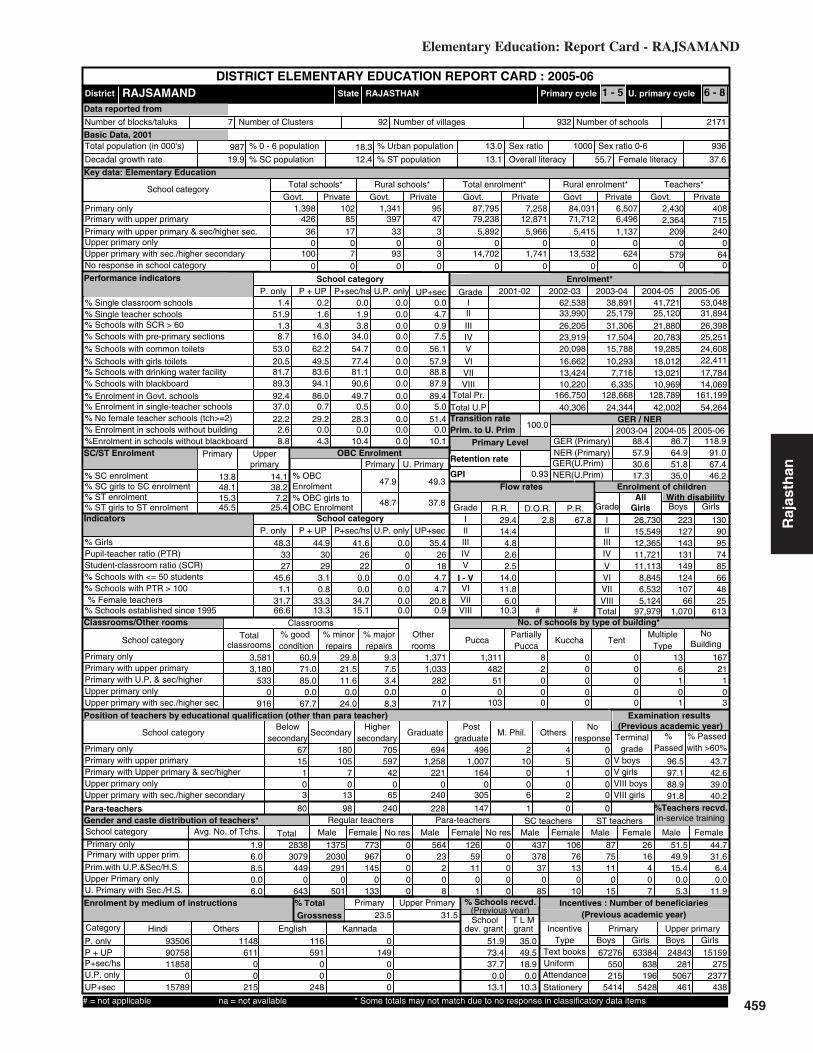
459
Elementary Education: Report Card - RAJSAMAND
Raj
asth
an13.8 14.1
Key data: Elementary Education
987
RAJSAMAND
(Previous academic year)
(Previous year)
Gender and caste distribution of teachers*
No. of schools by type of building*
BoysWith disability
Flow rates
Primary Level
Enrolment*
Number of schools
Grade
GER / NER
School category
Primary Upper primaryBoys Boys GirlsGirls
IncentiveType
School categoryMultiple
TypeKuccha
PartiallyPucca
PuccaTotal % good condition
Otherrooms
TentNo
Building
Classrooms
Belowsecondary
Highersecondary
Postgraduate
M. Phil.GraduateSecondarySchool category OthersNo
response
ST teachers
Total Male Female No res Male Female No res Male Female Male FemaleSC teachers
Text booksUniformAttendanceStationery
% Passed
Avg. No. of Tchs.
%
Female literacyOverall literacy
dev. grant grantSchool T L M
Male Female
IVV
IIIIII
Grade R.R. D.O.R. P.R.
VIIVI
# #
I - V
Enrolment by medium of instructions
Examination results
Retention rate
GPI
Primary cycle U. primary cycleState
DISTRICT ELEMENTARY EDUCATION REPORT CARD : 2005-06
GirlsGrade
IIIIIIIVVVI
VIII
AllGirls
Total
VII
% TotalGrossness
School category
42636
0100
85 39717 33
07
093
0 0 0
1,398 10247 79,238
3 5,8920 03 14,7020 0
1,341 95 84,031 6,50712,871 71,712 6,496
5,966 5,415 1,1370 0 0
0 0 01,741 13,532 624
87,795 7,258 2,4302,364
408715
P + UP P+sec/hs U.P. only UP+sec
School categoryP. only
1.4 0.2 0.0 0.0 0.051.9
Number of Clusters 2171932
% Schools with SCR > 601.6 1.9 0.0 4.7
1.3 4.3 3.8 0.0 0.9% Schools with pre-primary sections 8.7 16.0 34.0 0.0 7.5% Schools with common toilets 53.0 62.2 54.7 0.0 56.1
% Schools with girls toilets 20.5 49.5 77.4 0.0 57.9% Schools with drinking water facility 81.7 83.6 81.1 0.0 88.8
% Enrolment in Govt. schools 92.4 86.0 49.7 0.0 89.489.3 94.1 90.6 0.0 87.9
% No female teacher schools (tch>=2) 22.2 29.2 28.3 0.0 51.437.0 0.7 0.5 0.0 5.0
2.6 0.0 0.0 0.0 0.0%Enrolment in schools without blackboard 8.8 4.3 10.4 0.0 10.1
2001-02 2002-03 2003-04 2004-05 2005-06IIIIIIIVV
VIVII
Total U.P
53,04831,89426,39825,25124,60822,411
17,784
41,72125,12021,88020,78319,285
18,01213,021
38,89125,17931,30617,50415,788
10,2937,716
62,53833,99026,20523,91920,098
16,66213,424
54,26442,00224,34440,306
88.4
30.6
86.7
51.8
118.9
67.4
41.6
0.00.0
26,73015,54912,36511,72111,113
8,8456,5325,124
97,979
223127143131149124107
661,070
13090957485664825
613
3,581
classrooms
3,180533
0916
60.971.085.0
0.067.7
29.821.5
9.3
11.60.0
24.0
7.53.40.08.3
1,033282
0717
1,371 1,311 8 0 0 13 167482 2 0 0 6 21
51 0 0 0 1 10 0 0 0 0 0
103 0 0 0 1 3
67 180 705 694 496 2 415 105 597 1,258 1,007 10 5 0
1 7 42 221 164 0 1 00 0 0 0 0 0 0 03 13 65 240 305 6 2 0
80 98 240 228 147 1 0 0
13752030
2910
501
967145
0133
773 0 564 126 0 437 106 87 260000
23208
5911
01
0000
37837
085
7613
010
7511
015
16407
Terminalgrade Passed
VIII boysV girlsV boys
VIII girls
0 with >60%
51.528383079
4490
643
49.915.4
0.05.3
44.731.6
6.40.0
11.9
93506Hindi Others English Kannada
9075811858
015789
1148611
00
215
116591
00
248
0149
000
% Schools recvd.
51.973.437.7
0.013.1
35.049.518.9
0.010.3
67276550215
5414
24843281
5067461
63384838196
5428
15159275
2377438
1.96.08.50.06.0
29.414.4
4.82.6
11.86.0
10.3
2.514.0
100.0
0.93
2005-062004-052003-04
RAJASTHAN
34.7
Upper PrimaryPrimary
Sex ratio Sex ratio 0-6
7 92
VIII15.1
Enrolment of children
VIII 10,220 6,335 10,969 14,069Total Pr. 166,750 128,668 128,789 161,199
1 - 5 6 - 8
0 0579 64
0 0
209 240
%Teachers recvd.in-service training
Total schools* Rural schools* Total enrolment* Rural enrolment* Teachers*
23.5 31.5
91.0
46.2
57.9 64.9
17.3 35.0% SC enrolment% SC girls to SC enrolment% ST enrolment
48.1 38.215.345.5 25.4
47.9
48.7
49.3
37.8
Position of teachers by educational qualification (other than para teacher)
(Previous academic year)Incentives : Number of beneficiaries
% ST girls to ST enrolment
% Girls
Number of villages
% 0 - 6 population
% SC population % ST population
% Urban population
% Schools with blackboard
% Enrolment in single-teacher schools
% Enrolment in schools without building
Primary Upperprimary
OBC EnrolmentPrimary U. Primary
% OBCEnrolment% OBC girls toOBC Enrolment
Pupil-teacher ratio (PTR)Student-classroom ratio (SCR)% Schools with <= 50 students% Schools with PTR > 100% Female teachers
% Schools established since 1995
Regular teachers Para-teachers
% minorrepairs
% majorrepairs
# = not applicable na = not available * Some totals may not match due to no response in classificatory data items
2.8 67.8
2226
48.33327
45.61.1
31.766.6
44.93029
3.10.8
33.313.3
0.000
0.00.00.00.0
35.42618
4.74.7
20.80.9
19.9 12.4 13.1 55.7 37.6
936100013.018.3
Category
PrivateGovt.PrivateGovtPrivateGovt.PrivateGovt.PrivateGovt.
Total population (in 000's)
Number of blocks/taluks
District
Decadal growth rate
Primary onlyPrimary with upper primaryPrimary with upper primary & sec/higher sec.Upper primary onlyUpper primary with sec./higher secondary
% Single classroom schools% Single teacher schools
P + UP P+sec/hs U.P. only UP+secP. only
No response in school category
Primary with upper primaryPrimary with U.P. & sec/higherUpper primary onlyUpper primary with sec./higher sec
Primary only
Primary onlyPrimary with upper primaryPrimary with Upper primary & sec/higherUpper primary only
Para-teachers
School category
Upper primary with sec./higher secondary
Primary onlyPrimary with upper prim.
P. onlyP + UPP+sec/hsU.P. onlyUP+sec
NER(U.Prim)GER(U.Prim)NER (Primary)GER (Primary)
Transition ratePrim. to U. Prim
7.2
SC/ST Enrolment
Indicators
Classrooms/Other rooms
Prim.with U.P.&Sec/H.SUpper Primary onlyU. Primary with Sec./H.S.
Basic Data, 2001
Data reported from
Performance indicators
96.5 43.797.1 42.688.9 39.091.8 40.2
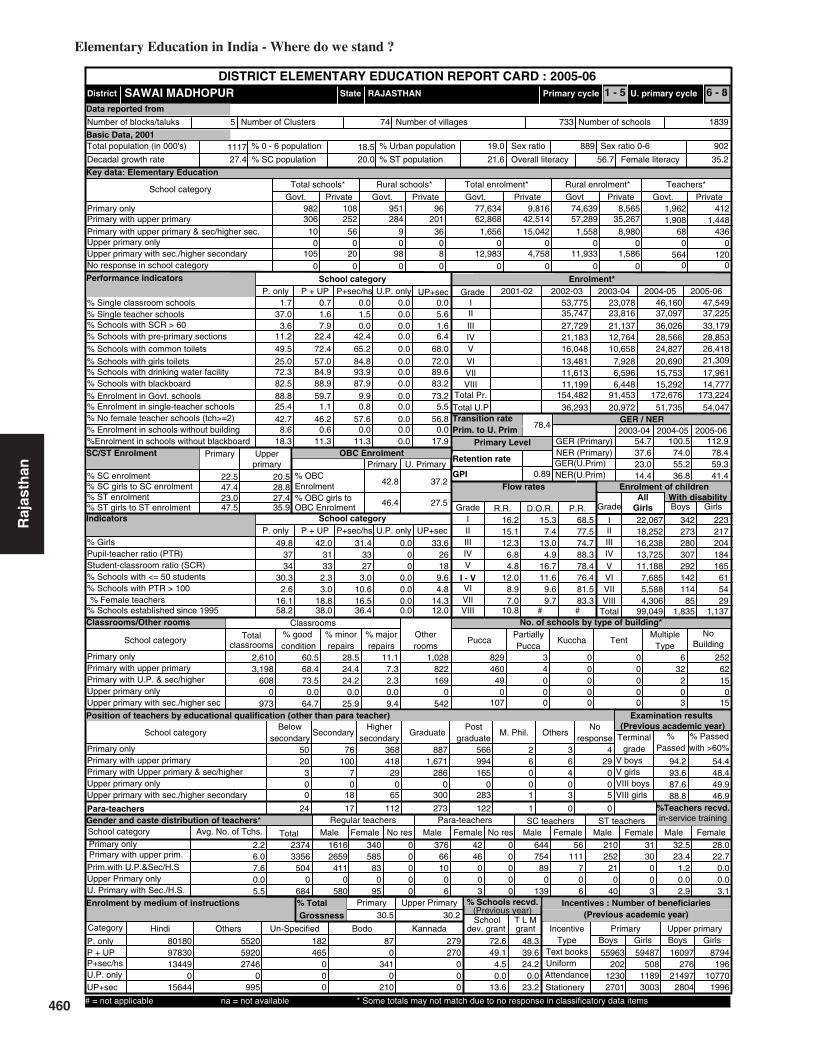
460
Elementary Education in India - Where do we stand ?
Raj
asth
an 22.5 20.5
Key data: Elementary Education
1117
SAWAI MADHOPUR
(Previous academic year)
(Previous year)
Gender and caste distribution of teachers*
No. of schools by type of building*
BoysWith disability
Flow rates
Primary Level
Enrolment*
Number of schools
Grade
GER / NER
School category
Primary Upper primaryBoys Boys GirlsGirls
IncentiveType
School categoryMultiple
TypeKuccha
PartiallyPucca
PuccaTotal % good condition
Otherrooms
TentNo
Building
Classrooms
Belowsecondary
Highersecondary
Postgraduate
M. Phil.GraduateSecondarySchool category OthersNo
response
ST teachers
Total Male Female No res Male Female No res Male Female Male FemaleSC teachers
Text booksUniformAttendanceStationery
% Passed
Avg. No. of Tchs.
%
Female literacyOverall literacy
dev. grant grantSchool T L M
Male Female
IVV
IIIIII
Grade R.R. D.O.R. P.R.
VIIVI
# #
I - V
Enrolment by medium of instructions
Examination results
Retention rate
GPI
Primary cycle U. primary cycleState
DISTRICT ELEMENTARY EDUCATION REPORT CARD : 2005-06
GirlsGrade
IIIIIIIVVVI
VIII
AllGirls
Total
VII
% TotalGrossness
School category
30610
0105
252 28456 9
020
098
0 0 0
982 108201 62,868
36 1,6560 08 12,9830 0
951 96 74,639 8,56542,514 57,289 35,26715,042 1,558 8,980
0 0 0
0 0 04,758 11,933 1,586
77,634 9,816 1,9621,908
4121,448
P + UP P+sec/hs U.P. only UP+sec
School categoryP. only
1.7 0.7 0.0 0.0 0.037.0
Number of Clusters 1839733
% Schools with SCR > 601.6 1.5 0.0 5.6
3.6 7.9 0.0 0.0 1.6% Schools with pre-primary sections 11.2 22.4 42.4 0.0 6.4% Schools with common toilets 49.5 72.4 65.2 0.0 68.0
% Schools with girls toilets 25.0 57.0 84.8 0.0 72.0% Schools with drinking water facility 72.3 84.9 93.9 0.0 89.6
% Enrolment in Govt. schools 88.8 59.7 9.9 0.0 73.282.5 88.9 87.9 0.0 83.2
% No female teacher schools (tch>=2) 42.7 46.2 57.6 0.0 56.825.4 1.1 0.8 0.0 5.5
8.6 0.6 0.0 0.0 0.0%Enrolment in schools without blackboard 18.3 11.3 11.3 0.0 17.9
2001-02 2002-03 2003-04 2004-05 2005-06IIIIIIIVV
VIVII
Total U.P
47,54937,22533,17928,85326,41821,309
17,961
46,16037,09736,02628,56624,827
20,69015,753
23,07823,81621,13712,76410,658
7,9286,596
53,77535,74727,72921,18316,048
13,48111,613
54,04751,73520,97236,293
54.7
23.0
100.5
55.2
112.9
59.3
31.4
3.010.6
22,06718,25216,23813,72511,188
7,6855,5884,306
99,049
342273280307292142114
851,835
223217204184165
615429
1,137
2,610
classrooms
3,198608
0973
60.568.473.5
0.064.7
28.524.4
11.1
24.20.0
25.9
7.32.30.09.4
822169
0542
1,028 829 3 0 0 6 252460 4 0 0 32 62
49 0 0 0 2 150 0 0 0 0 0
107 0 0 0 3 15
50 76 368 887 566 2 320 100 418 1,671 994 6 6 29
3 7 29 286 165 0 4 00 0 0 0 0 0 0 00 18 65 300 283 1 3 5
24 17 112 273 122 1 0 0
16162659
4110
580
58583
095
340 0 376 42 0 644 56 210 310000
6610
06
46003
0000
75489
0139
111706
25221
040
30003
Terminalgrade Passed
VIII boysV girlsV boys
VIII girls
4 with >60%
32.523743356
5040
684
23.41.20.02.9
28.022.7
0.00.03.1
80180Hindi Others Un-Specified Bodo Kannada
9783013449
015644
552059202746
0995
182465
000
870
3410
210
279270
000
% Schools recvd.
72.649.1
4.50.0
13.6
48.339.624.2
0.023.2
55963202
12302701
16097276
214972804
59487508
11893003
8794196
107701996
2.26.07.60.05.5
16.215.112.3
6.8
8.97.0
10.8
4.812.0
78.4
0.89
2005-062004-052003-04
RAJASTHAN
16.5
Upper PrimaryPrimary
Sex ratio Sex ratio 0-6
5 74
VIII36.4
Enrolment of children
VIII 11,199 6,448 15,292 14,777Total Pr. 154,482 91,453 172,676 173,224
1 - 5 6 - 8
0 0564 120
0 0
68 436
%Teachers recvd.in-service training
Total schools* Rural schools* Total enrolment* Rural enrolment* Teachers*
30.5 30.2
78.4
41.4
37.6 74.0
14.4 36.8% SC enrolment% SC girls to SC enrolment% ST enrolment
47.4 28.823.047.5 35.9
42.8
46.4
37.2
27.5
Position of teachers by educational qualification (other than para teacher)
(Previous academic year)Incentives : Number of beneficiaries
% ST girls to ST enrolment
% Girls
Number of villages
% 0 - 6 population
% SC population % ST population
% Urban population
% Schools with blackboard
% Enrolment in single-teacher schools
% Enrolment in schools without building
Primary Upperprimary
OBC EnrolmentPrimary U. Primary
% OBCEnrolment% OBC girls toOBC Enrolment
Pupil-teacher ratio (PTR)Student-classroom ratio (SCR)% Schools with <= 50 students% Schools with PTR > 100% Female teachers
% Schools established since 1995
Regular teachers Para-teachers
% minorrepairs
% majorrepairs
# = not applicable na = not available * Some totals may not match due to no response in classificatory data items
15.3 68.57.4 77.5
13.0 74.74.9 88.3
16.7 78.411.6 76.4
9.6 81.59.7 83.3
2733
49.83734
30.32.6
16.158.2
42.03133
2.33.0
18.838.0
0.000
0.00.00.00.0
33.62618
9.64.8
14.312.0
27.4 20.0 21.6 56.7 35.2
90288919.018.5
Category
PrivateGovt.PrivateGovtPrivateGovt.PrivateGovt.PrivateGovt.
Total population (in 000's)
Number of blocks/taluks
District
Decadal growth rate
Primary onlyPrimary with upper primaryPrimary with upper primary & sec/higher sec.Upper primary onlyUpper primary with sec./higher secondary
% Single classroom schools% Single teacher schools
P + UP P+sec/hs U.P. only UP+secP. only
No response in school category
Primary with upper primaryPrimary with U.P. & sec/higherUpper primary onlyUpper primary with sec./higher sec
Primary only
Primary onlyPrimary with upper primaryPrimary with Upper primary & sec/higherUpper primary only
Para-teachers
School category
Upper primary with sec./higher secondary
Primary onlyPrimary with upper prim.
P. onlyP + UPP+sec/hsU.P. onlyUP+sec
NER(U.Prim)GER(U.Prim)NER (Primary)GER (Primary)
Transition ratePrim. to U. Prim
27.4
SC/ST Enrolment
Indicators
Classrooms/Other rooms
Prim.with U.P.&Sec/H.SUpper Primary onlyU. Primary with Sec./H.S.
Basic Data, 2001
Data reported from
Performance indicators
94.2 54.493.6 48.487.6 49.988.8 46.9

461
Elementary Education: Report Card - SIKAR
Raj
asth
an18.2 14.5
Key data: Elementary Education
2288
SIKAR
(Previous academic year)
(Previous year)
Gender and caste distribution of teachers*
No. of schools by type of building*
BoysWith disability
Flow rates
Primary Level
Enrolment*
Number of schools
Grade
GER / NER
School category
Primary Upper primaryBoys Boys GirlsGirls
IncentiveType
School categoryMultiple
TypeKuccha
PartiallyPucca
PuccaTotal % good condition
Otherrooms
TentNo
Building
Classrooms
Belowsecondary
Highersecondary
Postgraduate
M. Phil.GraduateSecondarySchool category OthersNo
response
ST teachers
Total Male Female No res Male Female No res Male Female Male FemaleSC teachers
Text booksUniformAttendanceStationery
% Passed
Avg. No. of Tchs.
%
Female literacyOverall literacy
dev. grant grantSchool T L M
Male Female
IVV
IIIIII
Grade R.R. D.O.R. P.R.
VIIVI
# #
I - V
Enrolment by medium of instructions
Examination results
Retention rate
GPI
Primary cycle U. primary cycleState
DISTRICT ELEMENTARY EDUCATION REPORT CARD : 2005-06
GirlsGrade
IIIIIIIVVVI
VIII
AllGirls
Total
VII
% TotalGrossness
School category
60939
0154
702 566432 29
065
0145
0 0 0
1,796 308533 122,649252 7,964
0 039 22,507
0 0
1,680 228 137,446 18,622129,273 115,088 100,656
88,285 6,193 52,2210 0 0
0 0 013,741 21,297 7,937
147,350 25,233 4,1063,766
7764,156
P + UP P+sec/hs U.P. only UP+sec
School categoryP. only
4.9 2.0 1.9 0.0 1.433.2
Number of Clusters 41051139
% Schools with SCR > 602.8 3.4 0.0 5.5
6.2 8.5 6.4 0.0 5.5% Schools with pre-primary sections 13.5 16.3 15.1 0.0 10.5% Schools with common toilets 73.1 75.0 71.3 0.0 69.4
% Schools with girls toilets 25.7 60.9 66.9 0.0 58.9% Schools with drinking water facility 86.8 94.4 97.9 0.0 98.2
% Enrolment in Govt. schools 85.4 48.7 8.3 0.0 62.129.0 29.4 22.7 0.0 30.1
% No female teacher schools (tch>=2) 36.5 48.4 45.6 0.0 66.722.7 1.4 1.3 0.0 3.8
3.6 0.0 0.1 0.0 0.0%Enrolment in schools without blackboard 71.5 69.5 76.3 0.0 71.2
2001-02 2002-03 2003-04 2004-05 2005-06IIIIIIIVV
VIVII
Total U.P
103,96878,55170,31366,19766,82361,420
57,207
91,30764,87858,22055,59755,756
51,89543,497
91,86869,61162,42458,74656,128
48,94839,278
113,47777,76067,18562,09855,783
44,65340,443
111,32370,11959,43552,28242,585
39,10833,654
171,150136,094125,673123,652106,338
99.6
67.7
93.5
71.6
122.8
91.7
40.0
4.54.5
48,60137,44833,36331,86131,52328,01825,28622,015
258,115
494234322290293196155123
2,107
242181201189221100103
681,305
6,528
classrooms
9,1184,253
01,995
77.078.088.2
0.080.5
18.818.2
4.2
10.20.0
15.9
3.81.60.03.6
3,6421,486
01,316
3,240 1,933 6 2 5 22 1361,190 12 0 0 88 19
398 6 0 0 54 110 0 0 0 0 0
204 1 0 0 9 5
48 228 835 1,620 1,312 15 465 308 1,163 3,768 2,331 30 13 1831 83 315 1,688 839 9 8 6
0 0 0 0 0 0 0 014 42 129 461 457 7 2 2
18 29 237 524 308 2 1 0
307863662418
0959
1330561
0155
991 0 612 201 0 717 101 146 320000
14745
018
7911
08
0000
1141359
0189
13245
011
21759
026
30705
Terminalgrade Passed
VIII boysV girlsV boys
VIII girls
7 with >60%
7.6488279223035
01140
3.50.20.01.8
5.83.90.90.00.6
146602Hindi Others English Assamese Gujarati
21919976380
029783
253902879217797
06203
6314611969
00
214278
000
0484
000
% Schools recvd.
51.127.7
4.90.0
11.4
3.03.60.60.04.6
87975312
12637176
31498152
6136759
95405356
145510191
33769105357151044
2.36.06.40.05.2
12.46.42.61.3
3.02.14.8
1.05.6
59.5
100.0
0.90
2005-062004-052003-04
RAJASTHAN
18.8
Upper PrimaryPrimary
Sex ratio Sex ratio 0-6
17 123
VIII52.0
Enrolment of children
33,576VIII 38,556 37,447 40,702 52,523Total Pr. 335,744 376,303 338,777 325,758 385,852
1 - 5 6 - 8
0 0751 389
0 0
230 2,805
%Teachers recvd.in-service training
Total schools* Rural schools* Total enrolment* Rural enrolment* Teachers*
32.2 28.6
83.2
65.5
71.2 66.5
47.1 50.7% SC enrolment% SC girls to SC enrolment% ST enrolment
46.9 41.63.9
47.7 42.1
59.4
47.4
61.8
44.1
Position of teachers by educational qualification (other than para teacher)
(Previous academic year)Incentives : Number of beneficiaries
% ST girls to ST enrolment
% Girls
Number of villages
% 0 - 6 population
% SC population % ST population
% Urban population
% Schools with blackboard
% Enrolment in single-teacher schools
% Enrolment in schools without building
Primary Upperprimary
OBC EnrolmentPrimary U. Primary
% OBCEnrolment% OBC girls toOBC Enrolment
Pupil-teacher ratio (PTR)Student-classroom ratio (SCR)% Schools with <= 50 students% Schools with PTR > 100% Female teachers
% Schools established since 1995
Regular teachers Para-teachers
% minorrepairs
% majorrepairs
# = not applicable na = not available * Some totals may not match due to no response in classificatory data items
6.1 81.5
2332
51.23526
33.53.0
24.454.6
45.53228
2.71.8
17.838.1
0.000
0.00.00.00.0
46.23218
1.84.6
14.316.4
24.1 14.9 2.7 70.5 56.1
88595120.618.3
Category
PrivateGovt.PrivateGovtPrivateGovt.PrivateGovt.PrivateGovt.
Total population (in 000's)
Number of blocks/taluks
District
Decadal growth rate
Primary onlyPrimary with upper primaryPrimary with upper primary & sec/higher sec.Upper primary onlyUpper primary with sec./higher secondary
% Single classroom schools% Single teacher schools
P + UP P+sec/hs U.P. only UP+secP. only
No response in school category
Primary with upper primaryPrimary with U.P. & sec/higherUpper primary onlyUpper primary with sec./higher sec
Primary only
Primary onlyPrimary with upper primaryPrimary with Upper primary & sec/higherUpper primary only
Para-teachers
School category
Upper primary with sec./higher secondary
Primary onlyPrimary with upper prim.
P. onlyP + UPP+sec/hsU.P. onlyUP+sec
NER(U.Prim)GER(U.Prim)NER (Primary)GER (Primary)
Transition ratePrim. to U. Prim
3.8
SC/ST Enrolment
Indicators
Classrooms/Other rooms
Prim.with U.P.&Sec/H.SUpper Primary onlyU. Primary with Sec./H.S.
Basic Data, 2001
Data reported from
Performance indicators
98.3 63.898.2 58.988.8 54.787.8 51.9
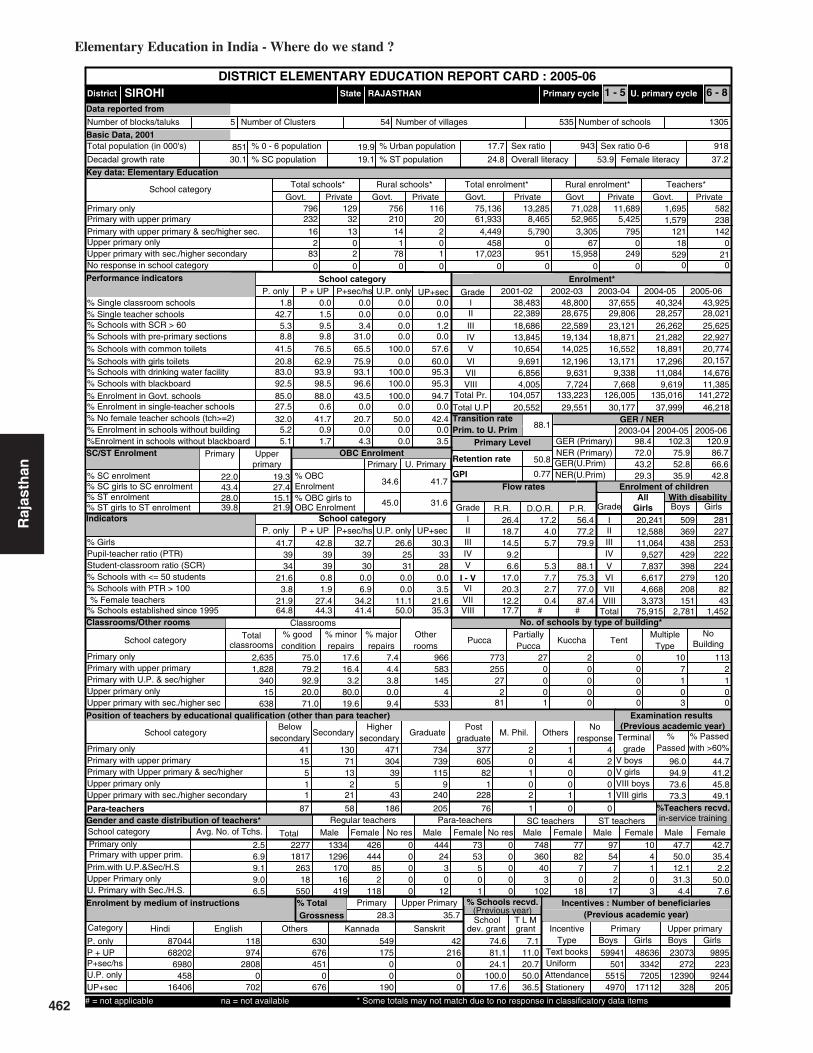
462
Elementary Education in India - Where do we stand ?
Raj
asth
an 22.0 19.3
Key data: Elementary Education
851
SIROHI
(Previous academic year)
(Previous year)
Gender and caste distribution of teachers*
No. of schools by type of building*
BoysWith disability
Flow rates
Primary Level
Enrolment*
Number of schools
Grade
GER / NER
School category
Primary Upper primaryBoys Boys GirlsGirls
IncentiveType
School categoryMultiple
TypeKuccha
PartiallyPucca
PuccaTotal % good condition
Otherrooms
TentNo
Building
Classrooms
Belowsecondary
Highersecondary
Postgraduate
M. Phil.GraduateSecondarySchool category OthersNo
response
ST teachers
Total Male Female No res Male Female No res Male Female Male FemaleSC teachers
Text booksUniformAttendanceStationery
% Passed
Avg. No. of Tchs.
%
Female literacyOverall literacy
dev. grant grantSchool T L M
Male Female
IVV
IIIIII
Grade R.R. D.O.R. P.R.
VIIVI
# #
I - V
Enrolment by medium of instructions
Examination results
Retention rate
GPI
Primary cycle U. primary cycleState
DISTRICT ELEMENTARY EDUCATION REPORT CARD : 2005-06
GirlsGrade
IIIIIIIVVVI
VIII
AllGirls
Total
VII
% TotalGrossness
School category
23216
283
32 21013 14
02
178
0 0 0
796 12920 61,933
2 4,4490 4581 17,0230 0
756 116 71,028 11,6898,465 52,965 5,4255,790 3,305 795
0 67 0
0 0 0951 15,958 249
75,136 13,285 1,6951,579
582238
P + UP P+sec/hs U.P. only UP+sec
School categoryP. only
1.8 0.0 0.0 0.0 0.042.7
Number of Clusters 1305535
% Schools with SCR > 601.5 0.0 0.0 0.0
5.3 9.5 3.4 0.0 1.2% Schools with pre-primary sections 8.8 9.8 31.0 0.0 0.0% Schools with common toilets 41.5 76.5 65.5 100.0 57.6
% Schools with girls toilets 20.8 62.9 75.9 0.0 60.0% Schools with drinking water facility 83.0 93.9 93.1 100.0 95.3
% Enrolment in Govt. schools 85.0 88.0 43.5 100.0 94.792.5 98.5 96.6 100.0 95.3
% No female teacher schools (tch>=2) 32.0 41.7 20.7 50.0 42.427.5 0.6 0.0 0.0 0.0
5.2 0.9 0.0 0.0 0.0%Enrolment in schools without blackboard 5.1 1.7 4.3 0.0 3.5
2001-02 2002-03 2003-04 2004-05 2005-06IIIIIIIVV
VIVII
Total U.P
43,92528,02125,62522,92720,77420,157
14,676
40,32428,25726,26221,28218,891
17,29611,084
37,65529,80623,12118,87116,552
13,1719,338
48,80028,67522,58919,13414,025
12,1969,631
38,48322,38918,68613,84510,654
9,6916,856
46,21837,99930,17729,55120,552
98.4
43.2
102.3
52.8
120.9
66.6
32.7
0.06.9
20,24112,58811,064
9,5277,8376,6174,6683,373
75,915
509369438429398279208151
2,781
281227253222224120
8243
1,452
2,635
classrooms
1,828340
15638
75.079.292.920.071.0
17.616.4
7.4
3.280.019.6
4.43.80.09.4
583145
4533
966 773 27 2 0 10 113255 0 0 0 7 2
27 0 0 0 1 12 0 0 0 0 0
81 1 0 0 3 0
41 130 471 734 377 2 115 71 304 739 605 0 4 2
5 13 39 115 82 1 0 01 2 5 9 1 0 0 01 21 43 240 228 2 1 1
87 58 186 205 76 1 0 0
13341296
17016
419
44485
2118
426 0 444 73 0 748 77 97 100000
2430
12
53501
0000
36040
3102
8270
18
5472
17
4103
Terminalgrade Passed
VIII boysV girlsV boys
VIII girls
4 with >60%
47.722771817
26318
550
50.012.131.3
4.4
42.735.4
2.250.0
7.6
87044Hindi English Others Kannada Sanskrit
682026980
45816406
118974
28080
702
630676451
0676
549175
00
190
42216
000
% Schools recvd.
74.681.124.1
100.017.6
7.111.020.750.036.5
59941501
55154970
23073272
12390328
4863633427205
17112
9895223
9244205
2.56.99.19.06.5
26.418.714.5
9.2
20.312.217.7
6.617.0
50.8
88.1
0.77
2005-062004-052003-04
RAJASTHAN
34.2
Upper PrimaryPrimary
Sex ratio Sex ratio 0-6
5 54
VIII41.4
Enrolment of children
4,005VIII 7,724 7,668 9,619 11,385Total Pr. 104,057 133,223 126,005 135,016 141,272
1 - 5 6 - 8
18 0529 21
0 0
121 142
%Teachers recvd.in-service training
Total schools* Rural schools* Total enrolment* Rural enrolment* Teachers*
28.3 35.7
86.7
42.8
72.0 75.9
29.3 35.9% SC enrolment% SC girls to SC enrolment% ST enrolment
43.4 27.428.039.8 21.9
34.6
45.0
41.7
31.6
Position of teachers by educational qualification (other than para teacher)
(Previous academic year)Incentives : Number of beneficiaries
% ST girls to ST enrolment
% Girls
Number of villages
% 0 - 6 population
% SC population % ST population
% Urban population
% Schools with blackboard
% Enrolment in single-teacher schools
% Enrolment in schools without building
Primary Upperprimary
OBC EnrolmentPrimary U. Primary
% OBCEnrolment% OBC girls toOBC Enrolment
Pupil-teacher ratio (PTR)Student-classroom ratio (SCR)% Schools with <= 50 students% Schools with PTR > 100% Female teachers
% Schools established since 1995
Regular teachers Para-teachers
% minorrepairs
% majorrepairs
# = not applicable na = not available * Some totals may not match due to no response in classificatory data items
17.2 56.44.0 77.25.7 79.9
5.3 88.17.7 75.32.7 77.00.4 87.4
3039
41.73934
21.63.8
21.964.8
42.83939
0.81.9
27.444.3
26.62531
0.00.0
11.150.0
30.33328
0.03.5
21.635.3
30.1 19.1 24.8 53.9 37.2
91894317.719.9
Category
PrivateGovt.PrivateGovtPrivateGovt.PrivateGovt.PrivateGovt.
Total population (in 000's)
Number of blocks/taluks
District
Decadal growth rate
Primary onlyPrimary with upper primaryPrimary with upper primary & sec/higher sec.Upper primary onlyUpper primary with sec./higher secondary
% Single classroom schools% Single teacher schools
P + UP P+sec/hs U.P. only UP+secP. only
No response in school category
Primary with upper primaryPrimary with U.P. & sec/higherUpper primary onlyUpper primary with sec./higher sec
Primary only
Primary onlyPrimary with upper primaryPrimary with Upper primary & sec/higherUpper primary only
Para-teachers
School category
Upper primary with sec./higher secondary
Primary onlyPrimary with upper prim.
P. onlyP + UPP+sec/hsU.P. onlyUP+sec
NER(U.Prim)GER(U.Prim)NER (Primary)GER (Primary)
Transition ratePrim. to U. Prim
15.1
SC/ST Enrolment
Indicators
Classrooms/Other rooms
Prim.with U.P.&Sec/H.SUpper Primary onlyU. Primary with Sec./H.S.
Basic Data, 2001
Data reported from
Performance indicators
96.0 44.794.9 41.273.6 45.873.3 49.1
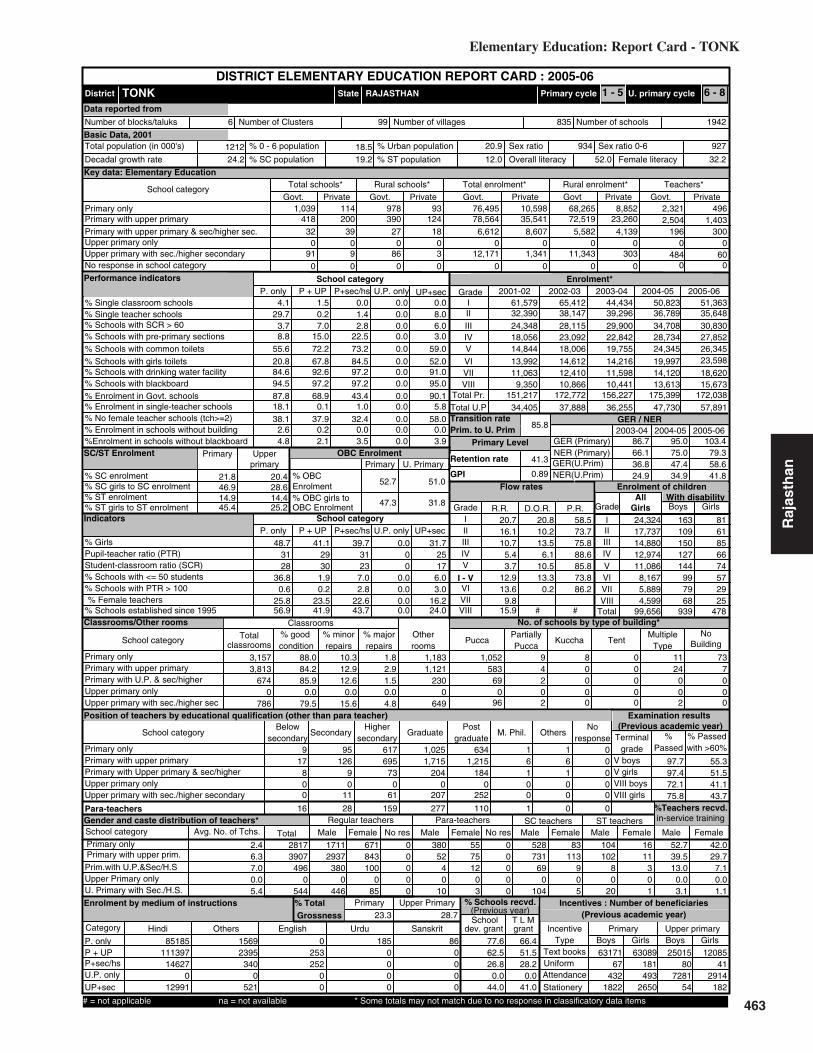
463
Elementary Education: Report Card - TONK
Raj
asth
an21.8 20.4
Key data: Elementary Education
1212
TONK
(Previous academic year)
(Previous year)
Gender and caste distribution of teachers*
No. of schools by type of building*
BoysWith disability
Flow rates
Primary Level
Enrolment*
Number of schools
Grade
GER / NER
School category
Primary Upper primaryBoys Boys GirlsGirls
IncentiveType
School categoryMultiple
TypeKuccha
PartiallyPucca
PuccaTotal % good condition
Otherrooms
TentNo
Building
Classrooms
Belowsecondary
Highersecondary
Postgraduate
M. Phil.GraduateSecondarySchool category OthersNo
response
ST teachers
Total Male Female No res Male Female No res Male Female Male FemaleSC teachers
Text booksUniformAttendanceStationery
% Passed
Avg. No. of Tchs.
%
Female literacyOverall literacy
dev. grant grantSchool T L M
Male Female
IVV
IIIIII
Grade R.R. D.O.R. P.R.
VIIVI
# #
I - V
Enrolment by medium of instructions
Examination results
Retention rate
GPI
Primary cycle U. primary cycleState
DISTRICT ELEMENTARY EDUCATION REPORT CARD : 2005-06
GirlsGrade
IIIIIIIVVVI
VIII
AllGirls
Total
VII
% TotalGrossness
School category
41832
091
200 39039 27
09
086
0 0 0
1,039 114124 78,564
18 6,6120 03 12,1710 0
978 93 68,265 8,85235,541 72,519 23,260
8,607 5,582 4,1390 0 0
0 0 01,341 11,343 303
76,495 10,598 2,3212,504
4961,403
P + UP P+sec/hs U.P. only UP+sec
School categoryP. only
4.1 1.5 0.0 0.0 0.029.7
Number of Clusters 1942835
% Schools with SCR > 600.2 1.4 0.0 8.0
3.7 7.0 2.8 0.0 6.0% Schools with pre-primary sections 8.8 15.0 22.5 0.0 3.0% Schools with common toilets 55.6 72.2 73.2 0.0 59.0
% Schools with girls toilets 20.8 67.8 84.5 0.0 52.0% Schools with drinking water facility 84.6 92.6 97.2 0.0 91.0
% Enrolment in Govt. schools 87.8 68.9 43.4 0.0 90.194.5 97.2 97.2 0.0 95.0
% No female teacher schools (tch>=2) 38.1 37.9 32.4 0.0 58.018.1 0.1 1.0 0.0 5.8
2.6 0.2 0.0 0.0 0.0%Enrolment in schools without blackboard 4.8 2.1 3.5 0.0 3.9
2001-02 2002-03 2003-04 2004-05 2005-06IIIIIIIVV
VIVII
Total U.P
51,36335,64830,83027,85226,34523,598
18,620
50,82336,78934,70828,73424,345
19,99714,120
44,43439,29629,90022,84219,755
14,21611,598
65,41238,14728,11523,09218,006
14,61212,410
61,57932,39024,34818,05614,844
13,99211,063
57,89147,73036,25537,88834,405
86.7
36.8
95.0
47.4
103.4
58.6
39.7
7.02.8
24,32417,73714,88012,97411,086
8,1675,8894,599
99,656
163109150127144
997968
939
8161856674572925
478
3,157
classrooms
3,813674
0786
88.084.285.9
0.079.5
10.312.9
1.8
12.60.0
15.6
2.91.50.04.8
1,121230
0649
1,183 1,052 9 8 0 11 73583 4 0 0 24 7
69 2 0 0 0 00 0 0 0 0 0
96 2 0 0 2 0
9 95 617 1,025 634 1 117 126 695 1,715 1,215 6 6 0
8 9 73 204 184 1 1 00 0 0 0 0 0 0 00 11 61 207 252 0 0 0
16 28 159 277 110 1 0 0
17112937
3800
446
843100
085
671 0 380 55 0 528 83 104 160000
5240
10
7512
03
0000
73169
0104
113905
10280
20
11301
Terminalgrade Passed
VIII boysV girlsV boys
VIII girls
0 with >60%
52.728173907
4960
544
39.513.0
0.03.1
42.029.7
7.10.01.1
85185Hindi Others English Urdu Sanskrit
11139714627
012991
15692395
3400
521
0253252
00
1850000
860000
% Schools recvd.
77.662.526.8
0.044.0
66.451.528.2
0.041.0
6317167
4321822
2501580
728154
63089181493
2650
1208541
2914182
2.46.37.00.05.4
20.716.110.7
5.4
13.69.8
15.9
3.712.9
41.3
85.8
0.89
2005-062004-052003-04
RAJASTHAN
22.6
Upper PrimaryPrimary
Sex ratio Sex ratio 0-6
6 99
VIII43.7
Enrolment of children
9,350VIII 10,866 10,441 13,613 15,673Total Pr. 151,217 172,772 156,227 175,399 172,038
1 - 5 6 - 8
0 0484 60
0 0
196 300
%Teachers recvd.in-service training
Total schools* Rural schools* Total enrolment* Rural enrolment* Teachers*
23.3 28.7
79.3
41.8
66.1 75.0
24.9 34.9% SC enrolment% SC girls to SC enrolment% ST enrolment
46.9 28.614.945.4 25.2
52.7
47.3
51.0
31.8
Position of teachers by educational qualification (other than para teacher)
(Previous academic year)Incentives : Number of beneficiaries
% ST girls to ST enrolment
% Girls
Number of villages
% 0 - 6 population
% SC population % ST population
% Urban population
% Schools with blackboard
% Enrolment in single-teacher schools
% Enrolment in schools without building
Primary Upperprimary
OBC EnrolmentPrimary U. Primary
% OBCEnrolment% OBC girls toOBC Enrolment
Pupil-teacher ratio (PTR)Student-classroom ratio (SCR)% Schools with <= 50 students% Schools with PTR > 100% Female teachers
% Schools established since 1995
Regular teachers Para-teachers
% minorrepairs
% majorrepairs
# = not applicable na = not available * Some totals may not match due to no response in classificatory data items
20.8 58.510.2 73.713.5 75.8
6.1 88.610.5 85.813.3 73.8
0.2 86.2
2331
48.73128
36.80.6
25.856.9
41.12930
1.90.2
23.541.9
0.000
0.00.00.00.0
31.72517
6.03.0
16.224.0
24.2 19.2 12.0 52.0 32.2
92793420.918.5
Category
PrivateGovt.PrivateGovtPrivateGovt.PrivateGovt.PrivateGovt.
Total population (in 000's)
Number of blocks/taluks
District
Decadal growth rate
Primary onlyPrimary with upper primaryPrimary with upper primary & sec/higher sec.Upper primary onlyUpper primary with sec./higher secondary
% Single classroom schools% Single teacher schools
P + UP P+sec/hs U.P. only UP+secP. only
No response in school category
Primary with upper primaryPrimary with U.P. & sec/higherUpper primary onlyUpper primary with sec./higher sec
Primary only
Primary onlyPrimary with upper primaryPrimary with Upper primary & sec/higherUpper primary only
Para-teachers
School category
Upper primary with sec./higher secondary
Primary onlyPrimary with upper prim.
P. onlyP + UPP+sec/hsU.P. onlyUP+sec
NER(U.Prim)GER(U.Prim)NER (Primary)GER (Primary)
Transition ratePrim. to U. Prim
14.4
SC/ST Enrolment
Indicators
Classrooms/Other rooms
Prim.with U.P.&Sec/H.SUpper Primary onlyU. Primary with Sec./H.S.
Basic Data, 2001
Data reported from
Performance indicators
97.7 55.397.4 51.572.1 41.175.8 43.7

464
Elementary Education in India - Where do we stand ?
Raj
asth
an 6.9 9.2
Key data: Elementary Education
2633
UDAIPUR
(Previous academic year)
(Previous year)
Gender and caste distribution of teachers*
No. of schools by type of building*
BoysWith disability
Flow rates
Primary Level
Enrolment*
Number of schools
Grade
GER / NER
School category
Primary Upper primaryBoys Boys GirlsGirls
IncentiveType
School categoryMultiple
TypeKuccha
PartiallyPucca
PuccaTotal % good condition
Otherrooms
TentNo
Building
Classrooms
Belowsecondary
Highersecondary
Postgraduate
M. Phil.GraduateSecondarySchool category OthersNo
response
ST teachers
Total Male Female No res Male Female No res Male Female Male FemaleSC teachers
Text booksUniformAttendanceStationery
% Passed
Avg. No. of Tchs.
%
Female literacyOverall literacy
dev. grant grantSchool T L M
Male Female
IVV
IIIIII
Grade R.R. D.O.R. P.R.
VIIVI
# #
I - V
Enrolment by medium of instructions
Examination results
Retention rate
GPI
Primary cycle U. primary cycleState
DISTRICT ELEMENTARY EDUCATION REPORT CARD : 2005-06
GirlsGrade
IIIIIIIVVVI
VIII
AllGirls
Total
VII
% TotalGrossness
School category
78255
0217
178 73473 44
018
0189
0 0 0
3,469 200106 145,914
14 9,4030 03 30,5750 0
3,359 152 229,153 10,63526,249 135,821 15,86122,006 7,825 3,509
0 0 0
0 0 04,291 26,608 323
239,293 14,738 6,4504,750
8511,425
P + UP P+sec/hs U.P. only UP+sec
School categoryP. only
12.9 0.2 0.0 0.0 0.448.6
Number of Clusters 49922221
% Schools with SCR > 601.3 1.6 0.0 4.3
4.3 4.2 3.9 0.0 0.9% Schools with pre-primary sections 10.3 19.5 43.8 0.0 2.1% Schools with common toilets 22.3 57.6 43.0 0.0 37.9
% Schools with girls toilets 10.8 40.4 70.3 0.0 54.5% Schools with drinking water facility 79.1 82.2 89.8 0.0 88.1
% Enrolment in Govt. schools 94.2 84.8 29.9 0.0 87.789.9 96.7 90.6 0.0 93.6
% No female teacher schools (tch>=2) 20.1 21.1 14.1 0.0 31.536.6 0.5 1.3 0.0 6.7
4.7 0.1 0.0 0.0 0.2%Enrolment in schools without blackboard 7.5 3.1 14.3 0.0 6.3
2001-02 2002-03 2003-04 2004-05 2005-06IIIIIIIVV
VIVII
Total U.P
134,64470,66661,23458,59754,28246,626
37,672
126,71971,08063,76655,27050,977
44,62330,777
164,71370,73256,08649,46338,816
31,81224,464
165,19270,98356,33149,76039,080
32,11824,780
113,046102,13276,26377,208
96.3
35.5
90.8
46.2
104.9
52.6
43.8
2.31.6
63,24532,71927,23925,88223,17118,80615,03211,792
217,886
914625571604575388278250
4,205
678421357376310216134112
2,604
8,811
classrooms
5,9981,382
01,955
56.267.274.7
0.059.4
33.024.6
10.8
21.90.0
30.6
8.23.40.0
10.0
1,738538
01,410
2,780 3,167 39 29 1 35 398877 10 2 0 37 33116 1 0 0 5 6
0 0 0 0 0 0211 2 0 0 9 13
237 402 1,454 1,876 1,623 15 932 184 1,060 2,393 2,145 22 5 1920 41 79 492 517 6 0 5
0 0 0 0 0 0 0 03 25 124 548 758 5 4 0
237 256 601 578 313 2 1 0
32033610
4690
944
2250691
0523
2445 5 1314 334 0 1556 512 585 1630000
54601
26125
04
0000
87458
0152
30637
018
27590
39
96306
Terminalgrade Passed
VIII boysV girlsV boys
VIII girls
37 with >60%
69.4730161751191
01472
73.019.8
0.07.4
63.649.7
6.70.07.0
249071Hindi English Others Sanskrit Bodo
16941824679
032718
58310056440
0467
3207897290
0297
99199
000
2290000
% Schools recvd.
44.070.914.8
0.015.3
40.371.517.2
0.023.0
1668421220
99014504
52702343
163181710
1411171660
89712718
33389438
49672318
2.06.49.30.06.3
17.98.54.53.0
9.87.08.1
3.29.5
82.9
0.83
2005-062004-052003-04
RAJASTHAN
60.1
Upper PrimaryPrimary
Sex ratio Sex ratio 0-6
16 115
VIII13.3
Enrolment of children
VIII 20,310 19,987 26,732 28,748Total Pr. 381,346 379,810 367,812 379,423
1 - 5 6 - 8
0 01,318 154
0 0
348 843
%Teachers recvd.in-service training
Total schools* Rural schools* Total enrolment* Rural enrolment* Teachers*
27.1 30.7
76.5
36.5
68.5 65.8
24.5 31.2% SC enrolment% SC girls to SC enrolment% ST enrolment
47.2 44.259.343.8 34.5
17.8
48.0
24.4
42.9
Position of teachers by educational qualification (other than para teacher)
(Previous academic year)Incentives : Number of beneficiaries
% ST girls to ST enrolment
% Girls
Number of villages
% 0 - 6 population
% SC population % ST population
% Urban population
% Schools with blackboard
% Enrolment in single-teacher schools
% Enrolment in schools without building
Primary Upperprimary
OBC EnrolmentPrimary U. Primary
% OBCEnrolment% OBC girls toOBC Enrolment
Pupil-teacher ratio (PTR)Student-classroom ratio (SCR)% Schools with <= 50 students% Schools with PTR > 100% Female teachers
% Schools established since 1995
Regular teachers Para-teachers
% minorrepairs
% majorrepairs
# = not applicable na = not available * Some totals may not match due to no response in classificatory data items
31.1 51.09.4 82.16.2 89.31.7 95.3
13.9 82.915.8 74.710.6 79.6
6.7 86.3
2326
45.73529
38.11.3
38.163.5
43.42829
3.50.3
40.715.2
0.000
0.00.00.00.0
38.42418
3.42.6
35.83.0
27.4 6.0 47.9 58.6 43.3
94897118.618.7
Category
PrivateGovt.PrivateGovtPrivateGovt.PrivateGovt.PrivateGovt.
Total population (in 000's)
Number of blocks/taluks
District
Decadal growth rate
Primary onlyPrimary with upper primaryPrimary with upper primary & sec/higher sec.Upper primary onlyUpper primary with sec./higher secondary
% Single classroom schools% Single teacher schools
P + UP P+sec/hs U.P. only UP+secP. only
No response in school category
Primary with upper primaryPrimary with U.P. & sec/higherUpper primary onlyUpper primary with sec./higher sec
Primary only
Primary onlyPrimary with upper primaryPrimary with Upper primary & sec/higherUpper primary only
Para-teachers
School category
Upper primary with sec./higher secondary
Primary onlyPrimary with upper prim.
P. onlyP + UPP+sec/hsU.P. onlyUP+sec
NER(U.Prim)GER(U.Prim)NER (Primary)GER (Primary)
Transition ratePrim. to U. Prim
40.6
SC/ST Enrolment
Indicators
Classrooms/Other rooms
Prim.with U.P.&Sec/H.SUpper Primary onlyU. Primary with Sec./H.S.
Basic Data, 2001
Data reported from
Performance indicators
98.2 46.997.9 46.983.0 33.883.0 36.4

465
Elementary Education: Report Card - EAST SIKKIM
Sik
kim
9.5 8.3
Key data: Elementary Education
245
EAST SIKKIM
(Previous academic year)
(Previous year)
Gender and caste distribution of teachers*
No. of schools by type of building*
BoysWith disability
Flow rates
Primary Level
Enrolment*
Number of schools
Grade
GER / NER
School category
Primary Upper primaryBoys Boys GirlsGirls
IncentiveType
School categoryMultiple
TypeKuccha
PartiallyPucca
PuccaTotal % good condition
Otherrooms
TentNo
Building
Classrooms
Belowsecondary
Highersecondary
Postgraduate
M. Phil.GraduateSecondarySchool category OthersNo
response
ST teachers
Total Male Female No res Male Female No res Male Female Male FemaleSC teachers
Text booksUniformAttendanceStationery
% Passed
Avg. No. of Tchs.
%
Female literacyOverall literacy
dev. grant grantSchool T L M
Male Female
IVV
IIIIII
Grade R.R. D.O.R. P.R.
VIIVI
# #
I - V
Enrolment by medium of instructions
Examination results
Retention rate
GPI
Primary cycle U. primary cycleState
DISTRICT ELEMENTARY EDUCATION REPORT CARD : 2005-06
GirlsGrade
IIIIIIIVVVI
VIII
AllGirls
Total
VII
% TotalGrossness
School category
4851
00
13 479 4500
00
0 0 0
162 658 11,5215 20,0140 00 00 0
157 53 11,061 1,7651,764 11,214 6194,186 16,105 1,185
0 0 0
0 0 00 0 0
11,434 2,819 1,071578
365112
P + UP P+sec/hs U.P. only UP+sec
School categoryP. only
1.3 1.6 1.7 0.0 0.00.4
Number of Clusters 348202
% Schools with SCR > 600.0 0.0 0.0 0.0
1.3 3.3 11.7 0.0 0.0% Schools with pre-primary sections 98.2 98.4 98.3 0.0 0.0% Schools with common toilets 76.2 68.9 66.7 0.0 0.0
% Schools with girls toilets 37.9 52.5 73.3 0.0 0.0% Schools with drinking water facility 68.7 75.4 78.3 0.0 0.0
% Enrolment in Govt. schools 80.2 86.7 82.7 0.0 0.071.4 72.1 71.7 0.0 0.0
% No female teacher schools (tch>=2) 10.1 8.2 10.0 0.0 0.00.1 0.0 0.0 0.0 0.0
0.7 0.0 2.2 0.0 0.0%Enrolment in schools without blackboard 27.1 19.1 31.0 0.0 0.0
2001-02 2002-03 2003-04 2004-05 2005-06IIIIIIIVV
VIVII
Total U.P
8,3587,6257,8427,1986,1535,719
4,493
7,4066,9606,9486,4765,521
5,1774,085
7,6866,7476,6785,8195,439
4,7593,720
14,56213,31412,175
98.9
57.5
98.2
60.6
142.8
84.2
52.2
3.33.3
4,0763,6873,9823,7863,2223,0292,3362,370
26,488
19152218101214
0110
1814151111
920
80
1,011
classrooms
538950
00
32.241.950.1
0.00.0
43.928.2
23.8
25.60.00.0
30.024.3
0.00.0
64183
00
102 69 40 19 0 53 4412 5 3 0 37 418 0 1 0 38 3
0 0 0 0 0 00 0 0 0 0 0
120 428 525 217 15 0 427 163 163 255 31 0 2 4932 122 136 238 20 0 1 159
0 0 0 0 0 0 0 00 0 0 0 0 0 0 0
0 0 0 0 0 0 0 0
668327273
00
323303
00
675 93 0 0 0 37 31 173 21840
13200
0000
0000
0000
1710
00
1918
00
8678
00
10495
00
Terminalgrade Passed
VIII boysV girlsV boys
VIII girls
127 with >60%
0.01436690708
00
0.00.00.00.0
0.00.00.00.00.0
14090English Others Nepali
1328323704
00
00
43800
1210
10200
% Schools recvd.
60.467.273.3
0.00.0
32.655.756.7
0.00.0
132115585
174295
724101
32504
135105250
174164
1658153
45670
6.311.311.8
0.00.0
22.516.415.313.7
16.614.623.1
13.316.5
88.0
1.02
2005-062004-052003-04
SIKKIM
42.8
Upper PrimaryPrimary
Sex ratio Sex ratio 0-6
3 37
VIII3.3
Enrolment of children
VIII 3,696 4,052 4,350Total Pr. 32,369 33,311 37,176
1 - 5 6 - 8
0 00 00 0
623 85
%Teachers recvd.in-service training
Total schools* Rural schools* Total enrolment* Rural enrolment* Teachers*
16.9 27.3
100.0
61.2
67.8 60.9
27.9 24.8% SC enrolment% SC girls to SC enrolment% ST enrolment
49.8 50.029.251.1 55.0
38.4
51.9
42.2
54.3
Position of teachers by educational qualification (other than para teacher)
(Previous academic year)Incentives : Number of beneficiaries
% ST girls to ST enrolment
% Girls
Number of villages
% 0 - 6 population
% SC population % ST population
% Urban population
% Schools with blackboard
% Enrolment in single-teacher schools
% Enrolment in schools without building
Primary Upperprimary
OBC EnrolmentPrimary U. Primary
% OBCEnrolment% OBC girls toOBC Enrolment
Pupil-teacher ratio (PTR)Student-classroom ratio (SCR)% Schools with <= 50 students% Schools with PTR > 100% Female teachers
% Schools established since 1995
Regular teachers Para-teachers
% minorrepairs
% majorrepairs
# = not applicable na = not available * Some totals may not match due to no response in classificatory data items
2.6 83.6
8.1 75.31.8 83.6
2534
49.01014
46.30.4
47.028.6
51.71925
13.11.6
46.811.5
0.000
0.00.00.00.0
0.000
0.00.00.00.0
37.2 5.8 18.5 74.7 66.8
95084421.612.8
Category
PrivateGovt.PrivateGovtPrivateGovt.PrivateGovt.PrivateGovt.
Total population (in 000's)
Number of blocks/taluks
District
Decadal growth rate
Primary onlyPrimary with upper primaryPrimary with upper primary & sec/higher sec.Upper primary onlyUpper primary with sec./higher secondary
% Single classroom schools% Single teacher schools
P + UP P+sec/hs U.P. only UP+secP. only
No response in school category
Primary with upper primaryPrimary with U.P. & sec/higherUpper primary onlyUpper primary with sec./higher sec
Primary only
Primary onlyPrimary with upper primaryPrimary with Upper primary & sec/higherUpper primary only
Para-teachers
School category
Upper primary with sec./higher secondary
Primary onlyPrimary with upper prim.
P. onlyP + UPP+sec/hsU.P. onlyUP+sec
NER(U.Prim)GER(U.Prim)NER (Primary)GER (Primary)
Transition ratePrim. to U. Prim
29.8
SC/ST Enrolment
Indicators
Classrooms/Other rooms
Prim.with U.P.&Sec/H.SUpper Primary onlyU. Primary with Sec./H.S.
Basic Data, 2001
Data reported from
Performance indicators
65.8 21.266.3 22.272.9 14.467.4 18.8

466
Elementary Education in India - Where do we stand ?
Sik
kim
3.7 4.4
Key data: Elementary Education
41
NORTH SIKKIM
(Previous academic year)
(Previous year)
Gender and caste distribution of teachers*
No. of schools by type of building*
BoysWith disability
Flow rates
Primary Level
Enrolment*
Number of schools
Grade
GER / NER
School category
Primary Upper primaryBoys Boys GirlsGirls
IncentiveType
School categoryMultiple
TypeKuccha
PartiallyPucca
PuccaTotal % good condition
Otherrooms
TentNo
Building
Classrooms
Belowsecondary
Highersecondary
Postgraduate
M. Phil.GraduateSecondarySchool category OthersNo
response
ST teachers
Total Male Female No res Male Female No res Male Female Male FemaleSC teachers
Text booksUniformAttendanceStationery
% Passed
Avg. No. of Tchs.
%
Female literacyOverall literacy
dev. grant grantSchool T L M
Male Female
IVV
IIIIII
Grade R.R. D.O.R. P.R.
VIIVI
# #
I - V
Enrolment by medium of instructions
Examination results
Retention rate
GPI
Primary cycle U. primary cycleState
DISTRICT ELEMENTARY EDUCATION REPORT CARD : 2005-06
GirlsGrade
IIIIIIIVVVI
VIII
AllGirls
Total
VII
% TotalGrossness
School category
1613
01
0 161 1300
01
0 0 0
77 160 2,1631 2,8480 00 1130 0
77 16 2,282 4650 2,163 0
421 2,848 4210 0 0
0 0 00 113 0
2,282 465 314206
830
P + UP P+sec/hs U.P. only UP+sec
School categoryP. only
7.5 0.0 0.0 0.0 0.04.3
Number of Clusters 12445
% Schools with SCR > 600.0 0.0 0.0 0.0
0.0 0.0 0.0 0.0 0.0% Schools with pre-primary sections 83.9 100.0 100.0 0.0 0.0% Schools with common toilets 87.1 100.0 64.3 0.0 0.0
% Schools with girls toilets 17.2 56.3 92.9 0.0 100.0% Schools with drinking water facility 74.2 81.3 64.3 0.0 100.0
% Enrolment in Govt. schools 83.1 100.0 87.1 0.0 100.071.0 75.0 78.6 0.0 0.0
% No female teacher schools (tch>=2) 8.6 0.0 0.0 0.0 0.03.4 0.0 0.0 0.0 0.0
2.5 0.0 0.0 0.0 0.0%Enrolment in schools without blackboard 18.5 17.8 19.2 0.0 100.0
2001-02 2002-03 2003-04 2004-05 2005-06IIIIIIIVV
VIVII
Total U.P
1,6591,4061,3481,129
859775
598
1,7401,4161,3091,035
870
805567
1,3501,1631,152
914739
643496
1,8911,8951,555
98.2
44.3
114.1
52.4
138.0
66.4
52.1
0.00.0
745670622563455415331271
4,072
118623502
37
53332110
18
308
classrooms
159210
012
54.640.558.6
0.00.0
28.145.8
17.3
26.20.00.0
13.715.2
0.0100.0
3247
010
51 30 22 13 0 16 121 3 1 0 11 04 0 0 0 10 00 0 0 0 0 00 0 0 0 1 0
48 106 168 61 1 0 019 48 46 76 4 0 1 118 48 53 122 9 0 1 0
0 0 0 0 0 0 0 00 0 0 3 8 0 0 0
0 0 10 16 3 0 1 0
192109143
010
85107
01
193 0 6 5 1 2 7 167 1541100
5300
6400
0000
1400
2200
7992
00
8185
00
Terminalgrade Passed
VIII boysV girlsV boys
VIII girls
1 with >60%
1.5397206258
011
0.00.00.00.0
3.52.20.00.00.0
2720English Bhutia
21633269
0113
270000
% Schools recvd.
46.293.878.6
0.00.0
44.187.571.4
0.00.0
27912682
521516
290233
245
27042570
321467
560322
7568
4.312.918.4
0.011.0
18.220.721.624.3
21.519.820.8
22.821.1
69.2
0.91
2005-062004-052003-04
SIKKIM
43.0
Upper PrimaryPrimary
Sex ratio Sex ratio 0-6
2 18
VIII0.0
Enrolment of children
VIII 416 523 518Total Pr. 5,318 6,370 6,401
1 - 5 6 - 8
0 011 0
0 0
244 14
%Teachers recvd.in-service training
Total schools* Rural schools* Total enrolment* Rural enrolment* Teachers*
41.4 62.8
80.8
24.7
59.6 68.5
17.1 17.2% SC enrolment% SC girls to SC enrolment% ST enrolment
46.9 51.276.747.2 55.8
12.7
51.4
11.5
49.1
Position of teachers by educational qualification (other than para teacher)
(Previous academic year)Incentives : Number of beneficiaries
% ST girls to ST enrolment
% Girls
Number of villages
% 0 - 6 population
% SC population % ST population
% Urban population
% Schools with blackboard
% Enrolment in single-teacher schools
% Enrolment in schools without building
Primary Upperprimary
OBC EnrolmentPrimary U. Primary
% OBCEnrolment% OBC girls toOBC Enrolment
Pupil-teacher ratio (PTR)Student-classroom ratio (SCR)% Schools with <= 50 students% Schools with PTR > 100% Female teachers
% Schools established since 1995
Regular teachers Para-teachers
% minorrepairs
% majorrepairs
# = not applicable na = not available * Some totals may not match due to no response in classificatory data items
17.9 64.04.1 75.2
11.3 67.111.9 63.9
8.0 69.211.1 67.818.1 60.4
8.1 72.1
1613
41.479
79.60.0
49.946.2
53.91114
0.00.0
44.20.0
0.000
0.00.00.00.0
60.210
90.00.09.10.0
31.3 2.1 53.1 67.2 55.4
9957523.014.5
Category
PrivateGovt.PrivateGovtPrivateGovt.PrivateGovt.PrivateGovt.
Total population (in 000's)
Number of blocks/taluks
District
Decadal growth rate
Primary onlyPrimary with upper primaryPrimary with upper primary & sec/higher sec.Upper primary onlyUpper primary with sec./higher secondary
% Single classroom schools% Single teacher schools
P + UP P+sec/hs U.P. only UP+secP. only
No response in school category
Primary with upper primaryPrimary with U.P. & sec/higherUpper primary onlyUpper primary with sec./higher sec
Primary only
Primary onlyPrimary with upper primaryPrimary with Upper primary & sec/higherUpper primary only
Para-teachers
School category
Upper primary with sec./higher secondary
Primary onlyPrimary with upper prim.
P. onlyP + UPP+sec/hsU.P. onlyUP+sec
NER(U.Prim)GER(U.Prim)NER (Primary)GER (Primary)
Transition ratePrim. to U. Prim
76.2
SC/ST Enrolment
Indicators
Classrooms/Other rooms
Prim.with U.P.&Sec/H.SUpper Primary onlyU. Primary with Sec./H.S.
Basic Data, 2001
Data reported from
Performance indicators
72.5 14.173.6 15.574.7 23.272.2 14.6
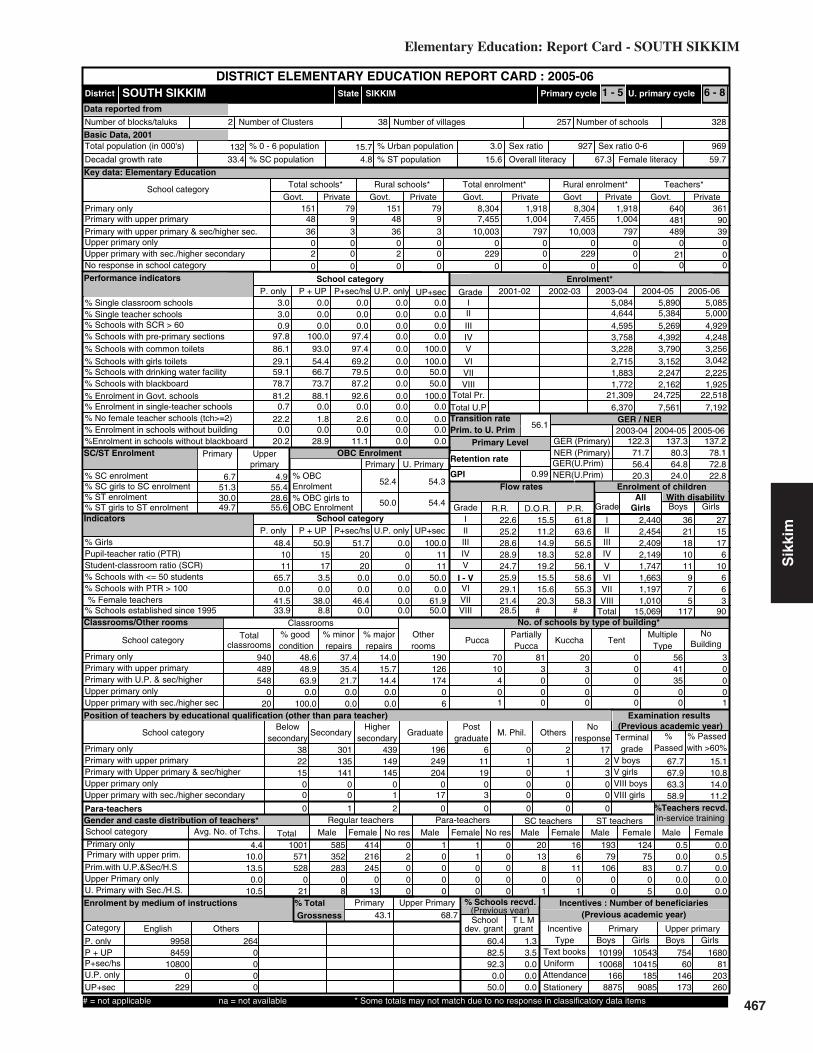
467
Elementary Education: Report Card - SOUTH SIKKIM
Sik
kim
6.7 4.9
Key data: Elementary Education
132
SOUTH SIKKIM
(Previous academic year)
(Previous year)
Gender and caste distribution of teachers*
No. of schools by type of building*
BoysWith disability
Flow rates
Primary Level
Enrolment*
Number of schools
Grade
GER / NER
School category
Primary Upper primaryBoys Boys GirlsGirls
IncentiveType
School categoryMultiple
TypeKuccha
PartiallyPucca
PuccaTotal % good condition
Otherrooms
TentNo
Building
Classrooms
Belowsecondary
Highersecondary
Postgraduate
M. Phil.GraduateSecondarySchool category OthersNo
response
ST teachers
Total Male Female No res Male Female No res Male Female Male FemaleSC teachers
Text booksUniformAttendanceStationery
% Passed
Avg. No. of Tchs.
%
Female literacyOverall literacy
dev. grant grantSchool T L M
Male Female
IVV
IIIIII
Grade R.R. D.O.R. P.R.
VIIVI
# #
I - V
Enrolment by medium of instructions
Examination results
Retention rate
GPI
Primary cycle U. primary cycleState
DISTRICT ELEMENTARY EDUCATION REPORT CARD : 2005-06
GirlsGrade
IIIIIIIVVVI
VIII
AllGirls
Total
VII
% TotalGrossness
School category
4836
02
9 483 3600
02
0 0 0
151 799 7,4553 10,0030 00 2290 0
151 79 8,304 1,9181,004 7,455 1,004
797 10,003 7970 0 0
0 0 00 229 0
8,304 1,918 640481
36190
P + UP P+sec/hs U.P. only UP+sec
School categoryP. only
3.0 0.0 0.0 0.0 0.03.0
Number of Clusters 328257
% Schools with SCR > 600.0 0.0 0.0 0.0
0.9 0.0 0.0 0.0 0.0% Schools with pre-primary sections 97.8 100.0 97.4 0.0 0.0% Schools with common toilets 86.1 93.0 97.4 0.0 100.0
% Schools with girls toilets 29.1 54.4 69.2 0.0 100.0% Schools with drinking water facility 59.1 66.7 79.5 0.0 50.0
% Enrolment in Govt. schools 81.2 88.1 92.6 0.0 100.078.7 73.7 87.2 0.0 50.0
% No female teacher schools (tch>=2) 22.2 1.8 2.6 0.0 0.00.7 0.0 0.0 0.0 0.0
0.0 0.0 0.0 0.0 0.0%Enrolment in schools without blackboard 20.2 28.9 11.1 0.0 0.0
2001-02 2002-03 2003-04 2004-05 2005-06IIIIIIIVV
VIVII
Total U.P
5,0855,0004,9294,2483,2563,042
2,225
5,8905,3845,2694,3923,790
3,1522,247
5,0844,6444,5953,7583,228
2,7151,883
7,1927,5616,370
122.3
56.4
137.3
64.8
137.2
72.8
51.7
0.00.0
2,4402,4542,4092,1491,7471,6631,1971,010
15,069
3621181011
975
117
271517
610
663
90
940
classrooms
489548
020
48.648.963.9
0.0100.0
37.435.4
14.0
21.70.00.0
15.714.4
0.00.0
126174
06
190 70 81 20 0 56 310 3 3 0 41 0
4 0 0 0 35 00 0 0 0 0 01 0 0 0 0 1
38 301 439 196 6 0 222 135 149 249 11 1 1 215 141 145 204 19 0 1 3
0 0 0 0 0 0 0 00 0 1 17 3 0 0 0
0 1 2 0 0 0 0 0
585352283
08
216245
013
414 0 1 1 0 20 16 193 1242000
0000
1000
0000
13801
611
01
79106
00
7583
05
Terminalgrade Passed
VIII boysV girlsV boys
VIII girls
17 with >60%
0.51001571528
021
0.00.70.00.0
0.00.50.00.00.0
9958English Others
845910800
0229
2640000
% Schools recvd.
60.482.592.3
0.050.0
1.33.50.00.00.0
1019910068
1668875
75460
146173
1054310415
1859085
168081
203260
4.410.013.5
0.010.5
22.625.228.628.9
29.121.428.5
24.725.9
56.1
0.99
2005-062004-052003-04
SIKKIM
46.4
Upper PrimaryPrimary
Sex ratio Sex ratio 0-6
2 38
VIII0.0
Enrolment of children
VIII 1,772 2,162 1,925Total Pr. 21,309 24,725 22,518
1 - 5 6 - 8
0 021 0
0 0
489 39
%Teachers recvd.in-service training
Total schools* Rural schools* Total enrolment* Rural enrolment* Teachers*
43.1 68.7
78.1
22.8
71.7 80.3
20.3 24.0% SC enrolment% SC girls to SC enrolment% ST enrolment
51.3 55.430.049.7 55.6
52.4
50.0
54.3
54.4
Position of teachers by educational qualification (other than para teacher)
(Previous academic year)Incentives : Number of beneficiaries
% ST girls to ST enrolment
% Girls
Number of villages
% 0 - 6 population
% SC population % ST population
% Urban population
% Schools with blackboard
% Enrolment in single-teacher schools
% Enrolment in schools without building
Primary Upperprimary
OBC EnrolmentPrimary U. Primary
% OBCEnrolment% OBC girls toOBC Enrolment
Pupil-teacher ratio (PTR)Student-classroom ratio (SCR)% Schools with <= 50 students% Schools with PTR > 100% Female teachers
% Schools established since 1995
Regular teachers Para-teachers
% minorrepairs
% majorrepairs
# = not applicable na = not available * Some totals may not match due to no response in classificatory data items
15.5 61.811.2 63.614.9 56.518.3 52.819.2 56.115.5 58.615.6 55.320.3 58.3
2020
48.41011
65.70.0
41.533.9
50.91517
3.50.0
38.08.8
0.000
0.00.00.00.0
100.01111
50.00.0
61.950.0
33.4 4.8 15.6 67.3 59.7
9699273.015.7
Category
PrivateGovt.PrivateGovtPrivateGovt.PrivateGovt.PrivateGovt.
Total population (in 000's)
Number of blocks/taluks
District
Decadal growth rate
Primary onlyPrimary with upper primaryPrimary with upper primary & sec/higher sec.Upper primary onlyUpper primary with sec./higher secondary
% Single classroom schools% Single teacher schools
P + UP P+sec/hs U.P. only UP+secP. only
No response in school category
Primary with upper primaryPrimary with U.P. & sec/higherUpper primary onlyUpper primary with sec./higher sec
Primary only
Primary onlyPrimary with upper primaryPrimary with Upper primary & sec/higherUpper primary only
Para-teachers
School category
Upper primary with sec./higher secondary
Primary onlyPrimary with upper prim.
P. onlyP + UPP+sec/hsU.P. onlyUP+sec
NER(U.Prim)GER(U.Prim)NER (Primary)GER (Primary)
Transition ratePrim. to U. Prim
28.6
SC/ST Enrolment
Indicators
Classrooms/Other rooms
Prim.with U.P.&Sec/H.SUpper Primary onlyU. Primary with Sec./H.S.
Basic Data, 2001
Data reported from
Performance indicators
67.7 15.167.9 10.863.3 14.058.9 11.2
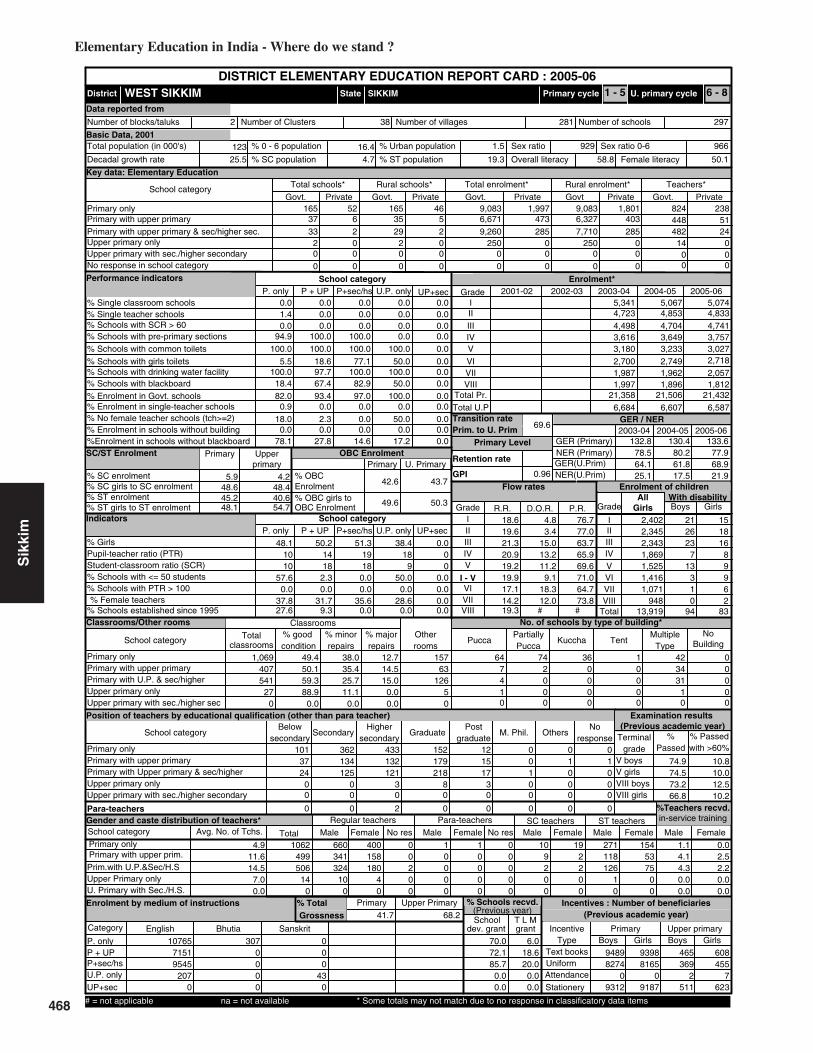
468
Elementary Education in India - Where do we stand ?
Sik
kim
5.9 4.2
Key data: Elementary Education
123
WEST SIKKIM
(Previous academic year)
(Previous year)
Gender and caste distribution of teachers*
No. of schools by type of building*
BoysWith disability
Flow rates
Primary Level
Enrolment*
Number of schools
Grade
GER / NER
School category
Primary Upper primaryBoys Boys GirlsGirls
IncentiveType
School categoryMultiple
TypeKuccha
PartiallyPucca
PuccaTotal % good condition
Otherrooms
TentNo
Building
Classrooms
Belowsecondary
Highersecondary
Postgraduate
M. Phil.GraduateSecondarySchool category OthersNo
response
ST teachers
Total Male Female No res Male Female No res Male Female Male FemaleSC teachers
Text booksUniformAttendanceStationery
% Passed
Avg. No. of Tchs.
%
Female literacyOverall literacy
dev. grant grantSchool T L M
Male Female
IVV
IIIIII
Grade R.R. D.O.R. P.R.
VIIVI
# #
I - V
Enrolment by medium of instructions
Examination results
Retention rate
GPI
Primary cycle U. primary cycleState
DISTRICT ELEMENTARY EDUCATION REPORT CARD : 2005-06
GirlsGrade
IIIIIIIVVVI
VIII
AllGirls
Total
VII
% TotalGrossness
School category
3733
20
6 352 2900
20
0 0 0
165 525 6,6712 9,2600 2500 00 0
165 46 9,083 1,801473 6,327 403285 7,710 285
0 250 0
0 0 00 0 0
9,083 1,997 824448
23851
P + UP P+sec/hs U.P. only UP+sec
School categoryP. only
0.0 0.0 0.0 0.0 0.01.4
Number of Clusters 297281
% Schools with SCR > 600.0 0.0 0.0 0.0
0.0 0.0 0.0 0.0 0.0% Schools with pre-primary sections 94.9 100.0 100.0 0.0 0.0% Schools with common toilets 100.0 100.0 100.0 100.0 0.0
% Schools with girls toilets 5.5 18.6 77.1 50.0 0.0% Schools with drinking water facility 100.0 97.7 100.0 100.0 0.0
% Enrolment in Govt. schools 82.0 93.4 97.0 100.0 0.018.4 67.4 82.9 50.0 0.0
% No female teacher schools (tch>=2) 18.0 2.3 0.0 50.0 0.00.9 0.0 0.0 0.0 0.0
0.0 0.0 0.0 0.0 0.0%Enrolment in schools without blackboard 78.1 27.8 14.6 17.2 0.0
2001-02 2002-03 2003-04 2004-05 2005-06IIIIIIIVV
VIVII
Total U.P
5,0744,8334,7413,7573,0272,718
2,057
5,0674,8534,7043,6493,233
2,7491,962
5,3414,7234,4983,6163,180
2,7001,987
6,5876,6076,684
132.8
64.1
130.4
61.8
133.6
68.9
51.3
0.00.0
2,4022,3452,3431,8691,5251,4161,071
94813,919
212623
713
310
94
151816
89962
83
1,069
classrooms
407541
270
49.450.159.388.9
0.0
38.035.4
12.7
25.711.1
0.0
14.515.0
0.00.0
63126
50
157 64 74 36 1 42 07 2 0 0 34 04 0 0 0 31 01 0 0 0 1 00 0 0 0 0 0
101 362 433 152 12 0 037 134 132 179 15 0 1 124 125 121 218 17 1 0 0
0 0 3 8 3 0 0 00 0 0 0 0 0 0 0
0 0 2 0 0 0 0 0
660341324
100
158180
40
400 0 1 1 0 10 19 271 1540200
0000
0000
0000
9200
2200
118126
10
5375
00
Terminalgrade Passed
VIII boysV girlsV boys
VIII girls
0 with >60%
1.11062499506
140
4.14.30.00.0
0.02.52.20.00.0
10765English Bhutia Sanskrit
71519545
2070
3070000
000
430
% Schools recvd.
70.072.185.7
0.00.0
6.018.620.0
0.00.0
94898274
09312
465369
2511
93988165
09187
608455
7623
4.911.614.5
7.00.0
18.619.621.320.9
17.114.219.3
19.219.9
69.6
0.96
2005-062004-052003-04
SIKKIM
35.6
Upper PrimaryPrimary
Sex ratio Sex ratio 0-6
2 38
VIII0.0
Enrolment of children
VIII 1,997 1,896 1,812Total Pr. 21,358 21,506 21,432
1 - 5 6 - 8
14 00 00 0
482 24
%Teachers recvd.in-service training
Total schools* Rural schools* Total enrolment* Rural enrolment* Teachers*
41.7 68.2
77.9
21.9
78.5 80.2
25.1 17.5% SC enrolment% SC girls to SC enrolment% ST enrolment
48.6 48.445.248.1 54.7
42.6
49.6
43.7
50.3
Position of teachers by educational qualification (other than para teacher)
(Previous academic year)Incentives : Number of beneficiaries
% ST girls to ST enrolment
% Girls
Number of villages
% 0 - 6 population
% SC population % ST population
% Urban population
% Schools with blackboard
% Enrolment in single-teacher schools
% Enrolment in schools without building
Primary Upperprimary
OBC EnrolmentPrimary U. Primary
% OBCEnrolment% OBC girls toOBC Enrolment
Pupil-teacher ratio (PTR)Student-classroom ratio (SCR)% Schools with <= 50 students% Schools with PTR > 100% Female teachers
% Schools established since 1995
Regular teachers Para-teachers
% minorrepairs
% majorrepairs
# = not applicable na = not available * Some totals may not match due to no response in classificatory data items
4.8 76.73.4 77.0
15.0 63.713.2 65.911.2 69.6
9.1 71.018.3 64.712.0 73.8
1819
48.11010
57.60.0
37.827.6
50.21418
2.30.0
31.79.3
38.418
950.0
0.028.6
0.0
0.000
0.00.00.00.0
25.5 4.7 19.3 58.8 50.1
9669291.516.4
Category
PrivateGovt.PrivateGovtPrivateGovt.PrivateGovt.PrivateGovt.
Total population (in 000's)
Number of blocks/taluks
District
Decadal growth rate
Primary onlyPrimary with upper primaryPrimary with upper primary & sec/higher sec.Upper primary onlyUpper primary with sec./higher secondary
% Single classroom schools% Single teacher schools
P + UP P+sec/hs U.P. only UP+secP. only
No response in school category
Primary with upper primaryPrimary with U.P. & sec/higherUpper primary onlyUpper primary with sec./higher sec
Primary only
Primary onlyPrimary with upper primaryPrimary with Upper primary & sec/higherUpper primary only
Para-teachers
School category
Upper primary with sec./higher secondary
Primary onlyPrimary with upper prim.
P. onlyP + UPP+sec/hsU.P. onlyUP+sec
NER(U.Prim)GER(U.Prim)NER (Primary)GER (Primary)
Transition ratePrim. to U. Prim
40.6
SC/ST Enrolment
Indicators
Classrooms/Other rooms
Prim.with U.P.&Sec/H.SUpper Primary onlyU. Primary with Sec./H.S.
Basic Data, 2001
Data reported from
Performance indicators
74.9 10.874.5 10.073.2 12.566.8 10.2

469
Elementary Education: Report Card - CHENNAI
Tam
il N
adu
24.8 23.5
Key data: Elementary Education
4344
CHENNAI
(Previous academic year)
(Previous year)
Gender and caste distribution of teachers*
No. of schools by type of building*
BoysWith disability
Flow rates
Primary Level
Enrolment*
Number of schools
Grade
GER / NER
School category
Primary Upper primaryBoys Boys GirlsGirls
IncentiveType
School categoryMultiple
TypeKuccha
PartiallyPucca
PuccaTotal % good condition
Otherrooms
TentNo
Building
Classrooms
Belowsecondary
Highersecondary
Postgraduate
M. Phil.GraduateSecondarySchool category OthersNo
response
ST teachers
Total Male Female No res Male Female No res Male Female Male FemaleSC teachers
Text booksUniformAttendanceStationery
% Passed
Avg. No. of Tchs.
%
Female literacyOverall literacy
dev. grant grantSchool T L M
Male Female
IVV
IIIIII
Grade R.R. D.O.R. P.R.
VIIVI
# #
I - V
Enrolment by medium of instructions
Examination results
Retention rate
GPI
Primary cycle U. primary cycleState
DISTRICT ELEMENTARY EDUCATION REPORT CARD : 2005-06
GirlsGrade
IIIIIIIVVVI
VIII
AllGirls
Total
VII
% TotalGrossness
School category
1234550
0
117 0192 0385
000
0 0 0
152 4330 42,9330 14,1360 26,2390 00 0
0 0 0 047,635 0 068,473 0 0
226,899 0 0
0 0 00 0 0
40,911 99,525 1,1541,198
4,0021,556
P + UP P+sec/hs U.P. only UP+sec
School categoryP. only
2.4 0.4 0.8 0.0 0.01.7
Number of Clusters 1497188
% Schools with SCR > 601.3 0.0 0.0 0.0
7.7 12.9 6.3 11.3 0.0% Schools with pre-primary sections 55.2 26.3 57.8 52.0 0.0% Schools with common toilets 76.4 68.8 63.7 65.7 0.0
% Schools with girls toilets 79.1 88.3 92.8 88.0 0.0% Schools with drinking water facility 96.1 94.6 97.0 98.2 0.0
% Enrolment in Govt. schools 29.1 47.4 17.1 10.4 0.091.3 95.4 92.4 87.6 0.0
% No female teacher schools (tch>=2) 0.9 0.0 1.7 0.7 0.00.3 0.3 0.0 0.0 0.0
0.0 0.0 0.0 0.0 0.0%Enrolment in schools without blackboard 8.0 5.4 6.3 12.1 0.0
2001-02 2002-03 2003-04 2004-05 2005-06IIIIIIIVV
VIVII
Total U.P
70,58869,11970,08471,07070,16574,935
71,030
67,87469,73171,04970,11470,134
75,88572,959
70,25170,00269,50969,60268,738
77,11274,849
46,50144,15445,57145,75345,394
54,76350,587
215,725220,351224,315152,991
86.1
87.6
85.5
85.2
96.7
92.5
48.5
6.31.3
34,82933,61134,70734,92534,79936,94135,31634,891
280,019
171185187203194247307266
1,760
122173162181157226193171
1,385
4,830
classrooms
2,5303,324
10,7790
93.691.195.795.3
0.0
5.67.4
0.8
3.83.70.0
1.50.51.00.0
8521,1453,448
0
1,249 532 18 0 0 34 1203 2 0 0 33 2213 2 0 0 20 2395 4 0 0 35 1
0 0 0 0 0 0
181 1,126 1,475 1,605 615 30 3153 665 679 797 487 20 27 079 391 353 1,754 999 87 48 0
247 1,089 921 4,152 4,409 482 147 00 0 0 0 0 0 0 0
27 54 66 211 188 30 0 0
222191499
22370
253732129210
0
4841 0 2 91 0 30 518 2 370000
51386
0
2180
2780
0000
3956
1500
274312502
0
12
100
122372
0
Terminalgrade Passed
VIII boysV girlsV boys
VIII girls
0 with >60%
42.4515627543804
118110
56.620.916.1
0.0
36.162.417.315.0
0.0
40612English Tamil Telugu Urdu Hindi
860151404
1849120
92578773662966460949
0
35553122
4802187
0
9021329
126704
0
47129
1552200
0
% Schools recvd.
41.575.032.932.9
0.0
44.177.935.934.7
0.0
7891147367
9413026
6829230572
261523050
7984746614
41813644
6878326694
471022302
8.811.516.127.2
0.0
3.32.82.92.9
6.15.44.8
2.72.9
100.0
0.97
2005-062004-052003-04
TAMIL NADU
86.5
Upper PrimaryPrimary
Sex ratio Sex ratio 0-6
10 148
VIII16.9
Enrolment of children
VIII 47,641 72,354 71,507 69,760Total Pr. 227,373 348,102 348,902 351,026
1 - 5 6 - 8
1,757 10,0540 00 0
677 3,127
%Teachers recvd.in-service training
Total schools* Rural schools* Total enrolment* Rural enrolment* Teachers*
20.4 27.9
76.9
66.7
71.0 71.1
65.9 64.0% SC enrolment% SC girls to SC enrolment% ST enrolment
49.5 49.01.1
45.4 35.2
51.3
49.1
54.5
50.1
Position of teachers by educational qualification (other than para teacher)
(Previous academic year)Incentives : Number of beneficiaries
% ST girls to ST enrolment
% Girls
Number of villages
% 0 - 6 population
% SC population % ST population
% Urban population
% Schools with blackboard
% Enrolment in single-teacher schools
% Enrolment in schools without building
Primary Upperprimary
OBC EnrolmentPrimary U. Primary
% OBCEnrolment% OBC girls toOBC Enrolment
Pupil-teacher ratio (PTR)Student-classroom ratio (SCR)% Schools with <= 50 students% Schools with PTR > 100% Female teachers
% Schools established since 1995
Regular teachers Para-teachers
% minorrepairs
% majorrepairs
# = not applicable na = not available * Some totals may not match due to no response in classificatory data items
5.5 88.43.7 90.9
2522
49.52729
15.70.9
95.722.4
48.83336
6.71.7
92.98.3
49.92123
2.80.9
80.37.1
0.000
0.00.00.00.0
9.8 13.8 0.2 85.3 80.4
972957100.010.0
Category
PrivateGovt.PrivateGovtPrivateGovt.PrivateGovt.PrivateGovt.
Total population (in 000's)
Number of blocks/taluks
District
Decadal growth rate
Primary onlyPrimary with upper primaryPrimary with upper primary & sec/higher sec.Upper primary onlyUpper primary with sec./higher secondary
% Single classroom schools% Single teacher schools
P + UP P+sec/hs U.P. only UP+secP. only
No response in school category
Primary with upper primaryPrimary with U.P. & sec/higherUpper primary onlyUpper primary with sec./higher sec
Primary only
Primary onlyPrimary with upper primaryPrimary with Upper primary & sec/higherUpper primary only
Para-teachers
School category
Upper primary with sec./higher secondary
Primary onlyPrimary with upper prim.
P. onlyP + UPP+sec/hsU.P. onlyUP+sec
NER(U.Prim)GER(U.Prim)NER (Primary)GER (Primary)
Transition ratePrim. to U. Prim
1.2
SC/ST Enrolment
Indicators
Classrooms/Other rooms
Prim.with U.P.&Sec/H.SUpper Primary onlyU. Primary with Sec./H.S.
Basic Data, 2001
Data reported from
Performance indicators
98.6 58.798.8 63.692.7 42.894.9 49.2

470
Elementary Education in India - Where do we stand ?
Tam
il N
adu
20.4 19.5
Key data: Elementary Education
4272
COIMBATORE
(Previous academic year)
(Previous year)
Gender and caste distribution of teachers*
No. of schools by type of building*
BoysWith disability
Flow rates
Primary Level
Enrolment*
Number of schools
Grade
GER / NER
School category
Primary Upper primaryBoys Boys GirlsGirls
IncentiveType
School categoryMultiple
TypeKuccha
PartiallyPucca
PuccaTotal % good condition
Otherrooms
TentNo
Building
Classrooms
Belowsecondary
Highersecondary
Postgraduate
M. Phil.GraduateSecondarySchool category OthersNo
response
ST teachers
Total Male Female No res Male Female No res Male Female Male FemaleSC teachers
Text booksUniformAttendanceStationery
% Passed
Avg. No. of Tchs.
%
Female literacyOverall literacy
dev. grant grantSchool T L M
Male Female
IVV
IIIIII
Grade R.R. D.O.R. P.R.
VIIVI
# #
I - V
Enrolment by medium of instructions
Examination results
Retention rate
GPI
Primary cycle U. primary cycleState
DISTRICT ELEMENTARY EDUCATION REPORT CARD : 2005-06
GirlsGrade
IIIIIIIVVVI
VIII
AllGirls
Total
VII
% TotalGrossness
School category
391105
950
77 317174 84212
059
00 0 0
1,249 44842 125,38096 32,069
110 50,6910 00 0
1,110 243 98,858 28,01229,692 91,965 12,31856,593 26,322 27,960
135,670 29,183 61,034
0 0 00 0 0
126,348 69,224 3,8292,794
3,104949
P + UP P+sec/hs U.P. only UP+sec
School categoryP. only
3.8 0.6 0.0 0.0 0.04.3
Number of Clusters 2751563
% Schools with SCR > 600.2 1.4 0.0 0.0
3.3 12.4 7.5 6.5 0.0% Schools with pre-primary sections 34.4 37.6 45.9 45.6 0.0% Schools with common toilets 66.2 57.3 45.2 46.6 0.0
% Schools with girls toilets 56.7 77.4 92.5 90.6 0.0% Schools with drinking water facility 95.6 97.6 96.8 98.0 0.0
% Enrolment in Govt. schools 64.6 80.9 36.2 27.2 0.096.3 97.0 91.8 91.2 0.0
% No female teacher schools (tch>=2) 6.6 2.6 2.5 0.7 0.01.5 0.1 1.0 0.0 0.0
0.0 0.0 0.0 0.0 0.0%Enrolment in schools without blackboard 4.4 3.9 8.8 8.0 0.0
2001-02 2002-03 2003-04 2004-05 2005-06IIIIIIIVV
VIVII
Total U.P
81,18271,93877,63381,55982,67686,132
76,866
72,80977,05480,57582,13379,606
82,56971,382
64,31264,66665,72064,77362,772
64,89458,405
79,06173,91372,43571,38867,048
74,82566,499
230,679221,198177,695199,813
79.4
69.1
94.7
84.3
110.6
100.5
48.9
2.23.2
39,82135,07137,82939,33439,86840,74037,18132,798
302,642
169138219228174237182142
1,489
128128160148121144101100
1,030
7,664
classrooms
3,9503,5597,888
0
80.874.991.691.0
0.0
15.019.2
4.2
6.27.20.0
5.82.21.80.0
7241,1712,185
0
1,567 1,387 133 3 0 170 4313 20 1 0 134 0208 10 0 0 61 0225 6 0 0 74 2
0 0 0 0 0 0
181 1,945 1,852 1,742 1,015 49 5964 709 1,030 1,014 838 49 28 048 351 307 1,140 681 61 42 090 647 512 1,941 1,138 84 59 0
0 0 0 0 0 0 0 0
10 10 22 89 42 6 11 0
1268903486800
0
282921443671
0
5575 0 8 82 0 176 566 14 570000
2870
94529
0
0000
1337869
0
366136201
0
13980
394533
0
Terminalgrade Passed
VIII boysV girlsV boys
VIII girls
0 with >60%
81.06933374326834507
0
72.534.632.6
0.0
54.467.717.921.3
0.0
170811Tamil English Malayalam Telugu Hindi
1494455835695460
0
179253775
1979561475
0
28814
250209
0
230389
000
130000
% Schools recvd.
78.986.541.938.4
0.0
79.087.841.940.4
0.0
12782294566
103919291
9083239925
303820432
12320391118
129619584
8945240285
415520542
4.18.09.6
14.70.0
1.21.00.91.0
6.44.33.1
1.01.0
100.0
0.95
2005-062004-052003-04
TAMIL NADU
81.6
Upper PrimaryPrimary
Sex ratio Sex ratio 0-6
22 231
VIII35.8
Enrolment of children
VIII 58,489 54,396 67,247 67,681Total Pr. 363,845 322,243 392,177 394,988
1 - 5 6 - 8
1,031 3,4760 00 0
630 2,053
%Teachers recvd.in-service training
Total schools* Rural schools* Total enrolment* Rural enrolment* Teachers*
17.2 26.4
91.6
74.0
65.2 80.5
52.1 64.5% SC enrolment% SC girls to SC enrolment% ST enrolment
49.1 47.51.7
47.0 45.8
69.0
48.5
70.3
47.8
Position of teachers by educational qualification (other than para teacher)
(Previous academic year)Incentives : Number of beneficiaries
% ST girls to ST enrolment
% Girls
Number of villages
% 0 - 6 population
% SC population % ST population
% Urban population
% Schools with blackboard
% Enrolment in single-teacher schools
% Enrolment in schools without building
Primary Upperprimary
OBC EnrolmentPrimary U. Primary
% OBCEnrolment% OBC girls toOBC Enrolment
Pupil-teacher ratio (PTR)Student-classroom ratio (SCR)% Schools with <= 50 students% Schools with PTR > 100% Female teachers
% Schools established since 1995
Regular teachers Para-teachers
% minorrepairs
% majorrepairs
# = not applicable na = not available * Some totals may not match due to no response in classificatory data items
1.1 97.7
4.3 89.33.7 91.9
2533
49.02826
34.30.1
81.619.7
49.04139
1.92.4
75.810.9
46.94124
0.34.2
82.112.4
0.000
0.00.00.00.0
20.4 14.8 0.7 77.0 69.1
96396366.010.4
Category
PrivateGovt.PrivateGovtPrivateGovt.PrivateGovt.PrivateGovt.
Total population (in 000's)
Number of blocks/taluks
District
Decadal growth rate
Primary onlyPrimary with upper primaryPrimary with upper primary & sec/higher sec.Upper primary onlyUpper primary with sec./higher secondary
% Single classroom schools% Single teacher schools
P + UP P+sec/hs U.P. only UP+secP. only
No response in school category
Primary with upper primaryPrimary with U.P. & sec/higherUpper primary onlyUpper primary with sec./higher sec
Primary only
Primary onlyPrimary with upper primaryPrimary with Upper primary & sec/higherUpper primary only
Para-teachers
School category
Upper primary with sec./higher secondary
Primary onlyPrimary with upper prim.
P. onlyP + UPP+sec/hsU.P. onlyUP+sec
NER(U.Prim)GER(U.Prim)NER (Primary)GER (Primary)
Transition ratePrim. to U. Prim
1.1
SC/ST Enrolment
Indicators
Classrooms/Other rooms
Prim.with U.P.&Sec/H.SUpper Primary onlyU. Primary with Sec./H.S.
Basic Data, 2001
Data reported from
Performance indicators
99.4 66.399.5 71.886.2 46.196.6 52.6
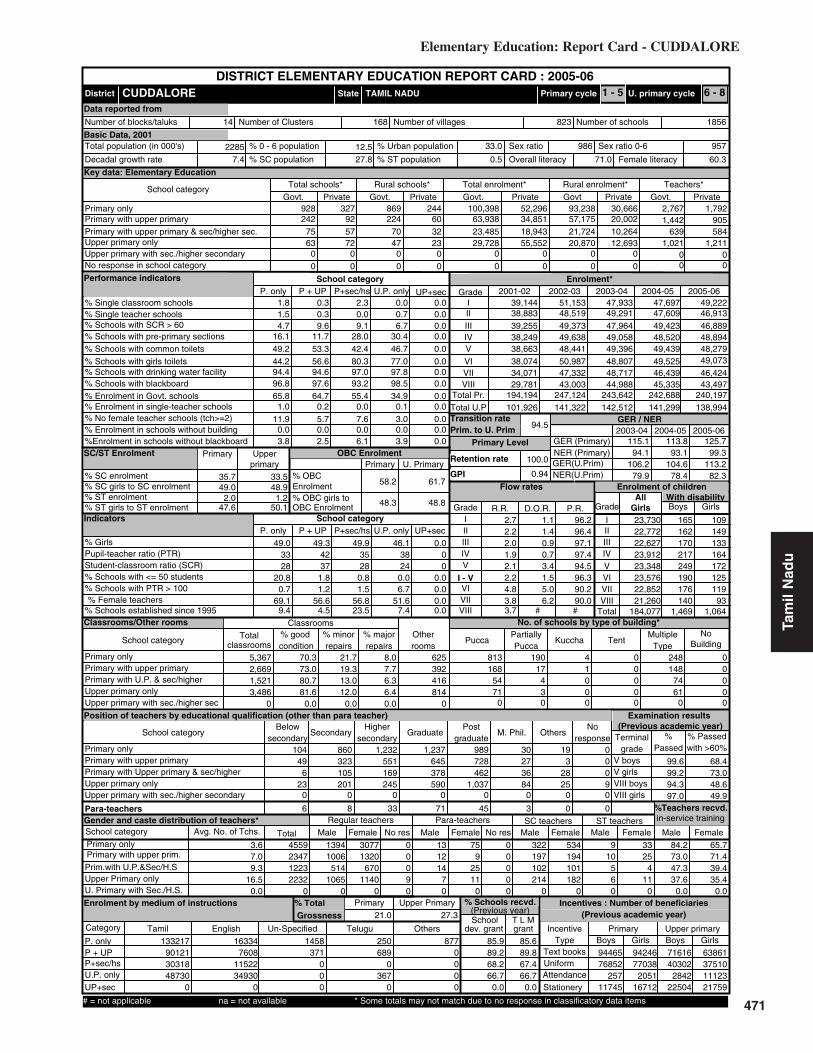
471
Elementary Education: Report Card - CUDDALORE
Tam
il N
adu
35.7 33.5
Key data: Elementary Education
2285
CUDDALORE
(Previous academic year)
(Previous year)
Gender and caste distribution of teachers*
No. of schools by type of building*
BoysWith disability
Flow rates
Primary Level
Enrolment*
Number of schools
Grade
GER / NER
School category
Primary Upper primaryBoys Boys GirlsGirls
IncentiveType
School categoryMultiple
TypeKuccha
PartiallyPucca
PuccaTotal % good condition
Otherrooms
TentNo
Building
Classrooms
Belowsecondary
Highersecondary
Postgraduate
M. Phil.GraduateSecondarySchool category OthersNo
response
ST teachers
Total Male Female No res Male Female No res Male Female Male FemaleSC teachers
Text booksUniformAttendanceStationery
% Passed
Avg. No. of Tchs.
%
Female literacyOverall literacy
dev. grant grantSchool T L M
Male Female
IVV
IIIIII
Grade R.R. D.O.R. P.R.
VIIVI
# #
I - V
Enrolment by medium of instructions
Examination results
Retention rate
GPI
Primary cycle U. primary cycleState
DISTRICT ELEMENTARY EDUCATION REPORT CARD : 2005-06
GirlsGrade
IIIIIIIVVVI
VIII
AllGirls
Total
VII
% TotalGrossness
School category
2427563
0
92 22457 7072
047
00 0 0
928 32760 63,93832 23,48523 29,728
0 00 0
869 244 93,238 30,66634,851 57,175 20,00218,943 21,724 10,26455,552 20,870 12,693
0 0 00 0 0
100,398 52,296 2,7671,442
1,792905
P + UP P+sec/hs U.P. only UP+sec
School categoryP. only
1.8 0.3 2.3 0.0 0.01.5
Number of Clusters 1856823
% Schools with SCR > 600.3 0.0 0.7 0.0
4.7 9.6 9.1 6.7 0.0% Schools with pre-primary sections 16.1 11.7 28.0 30.4 0.0% Schools with common toilets 49.2 53.3 42.4 46.7 0.0
% Schools with girls toilets 44.2 56.6 80.3 77.0 0.0% Schools with drinking water facility 94.4 94.6 97.0 97.8 0.0
% Enrolment in Govt. schools 65.8 64.7 55.4 34.9 0.096.8 97.6 93.2 98.5 0.0
% No female teacher schools (tch>=2) 11.9 5.7 7.6 3.0 0.01.0 0.2 0.0 0.1 0.0
0.0 0.0 0.0 0.0 0.0%Enrolment in schools without blackboard 3.8 2.5 6.1 3.9 0.0
2001-02 2002-03 2003-04 2004-05 2005-06IIIIIIIVV
VIVII
Total U.P
49,22246,91346,88948,89448,27949,073
46,424
47,69747,60949,42348,52049,439
49,52546,439
47,93349,29147,96449,05849,396
48,80748,717
51,15348,51949,37349,63848,441
50,98747,332
39,14438,88339,25538,24938,663
38,07434,071
138,994141,299142,512141,322101,926
115.1
106.2
113.8
104.6
125.7
113.2
49.9
0.81.5
23,73022,77222,62723,91223,34823,57622,85221,260
184,077
165162170217249190176140
1,469
109149133164172125119
931,064
5,367
classrooms
2,6691,5213,486
0
70.373.080.781.6
0.0
21.719.3
8.0
13.012.0
0.0
7.76.36.40.0
392416814
0
625 813 190 4 0 248 0168 17 1 0 148 0
54 4 0 0 74 071 3 0 0 61 0
0 0 0 0 0 0
104 860 1,232 1,237 989 30 1949 323 551 645 728 27 3 0
6 105 169 378 462 36 28 023 201 245 590 1,037 84 25 9
0 0 0 0 0 0 0 0
6 8 33 71 45 3 0 0
13941006
5141065
0
1320670
11400
3077 0 13 75 0 322 534 9 330090
1214
70
92511
0
0000
197102214
0
194101182
0
10560
254
110
Terminalgrade Passed
VIII boysV girlsV boys
VIII girls
0 with >60%
84.24559234712232232
0
73.047.337.6
0.0
65.771.439.435.4
0.0
133217Tamil English Un-Specified Telugu Others
901213031848730
0
163347608
1152234930
0
1458371
000
250689
0367
0
8770000
% Schools recvd.
85.989.268.266.7
0.0
85.689.867.466.7
0.0
9446576852
25711745
7161640302
284222504
9424677038
205116712
63861375101112321759
3.67.09.3
16.50.0
2.72.22.01.9
4.83.83.7
2.12.2
100.0
94.5
0.94
2005-062004-052003-04
TAMIL NADU
56.8
Upper PrimaryPrimary
Sex ratio Sex ratio 0-6
14 168
VIII23.5
Enrolment of children
29,781VIII 43,003 44,988 45,335 43,497Total Pr. 194,194 247,124 243,642 242,688 240,197
1 - 5 6 - 8
1,021 1,2110 00 0
639 584
%Teachers recvd.in-service training
Total schools* Rural schools* Total enrolment* Rural enrolment* Teachers*
21.0 27.3
99.3
82.3
94.1 93.1
79.9 78.4% SC enrolment% SC girls to SC enrolment% ST enrolment
49.0 48.92.0
47.6 50.1
58.2
48.3
61.7
48.8
Position of teachers by educational qualification (other than para teacher)
(Previous academic year)Incentives : Number of beneficiaries
% ST girls to ST enrolment
% Girls
Number of villages
% 0 - 6 population
% SC population % ST population
% Urban population
% Schools with blackboard
% Enrolment in single-teacher schools
% Enrolment in schools without building
Primary Upperprimary
OBC EnrolmentPrimary U. Primary
% OBCEnrolment% OBC girls toOBC Enrolment
Pupil-teacher ratio (PTR)Student-classroom ratio (SCR)% Schools with <= 50 students% Schools with PTR > 100% Female teachers
% Schools established since 1995
Regular teachers Para-teachers
% minorrepairs
% majorrepairs
# = not applicable na = not available * Some totals may not match due to no response in classificatory data items
1.1 96.21.4 96.40.9 97.10.7 97.43.4 94.51.5 96.35.0 90.26.2 90.0
2835
49.03328
20.80.7
69.19.4
49.34237
1.81.2
56.64.5
46.13824
0.06.7
51.67.4
0.000
0.00.00.00.0
7.4 27.8 0.5 71.0 60.3
95798633.012.5
Category
PrivateGovt.PrivateGovtPrivateGovt.PrivateGovt.PrivateGovt.
Total population (in 000's)
Number of blocks/taluks
District
Decadal growth rate
Primary onlyPrimary with upper primaryPrimary with upper primary & sec/higher sec.Upper primary onlyUpper primary with sec./higher secondary
% Single classroom schools% Single teacher schools
P + UP P+sec/hs U.P. only UP+secP. only
No response in school category
Primary with upper primaryPrimary with U.P. & sec/higherUpper primary onlyUpper primary with sec./higher sec
Primary only
Primary onlyPrimary with upper primaryPrimary with Upper primary & sec/higherUpper primary only
Para-teachers
School category
Upper primary with sec./higher secondary
Primary onlyPrimary with upper prim.
P. onlyP + UPP+sec/hsU.P. onlyUP+sec
NER(U.Prim)GER(U.Prim)NER (Primary)GER (Primary)
Transition ratePrim. to U. Prim
1.2
SC/ST Enrolment
Indicators
Classrooms/Other rooms
Prim.with U.P.&Sec/H.SUpper Primary onlyU. Primary with Sec./H.S.
Basic Data, 2001
Data reported from
Performance indicators
99.6 68.499.2 73.094.3 48.697.0 49.9

472
Elementary Education in India - Where do we stand ?
17.6 17.6
Key data: Elementary Education
2856
DHARMAPURI
(Previous academic year)
(Previous year)
Gender and caste distribution of teachers*
No. of schools by type of building*
BoysWith disability
Flow rates
Primary Level
Enrolment*
Number of schools
Grade
GER / NER
School category
Primary Upper primaryBoys Boys GirlsGirls
IncentiveType
School categoryMultiple
TypeKuccha
PartiallyPucca
PuccaTotal % good condition
Otherrooms
TentNo
Building
Classrooms
Belowsecondary
Highersecondary
Postgraduate
M. Phil.GraduateSecondarySchool category OthersNo
response
ST teachers
Total Male Female No res Male Female No res Male Female Male FemaleSC teachers
Text booksUniformAttendanceStationery
% Passed
Avg. No. of Tchs.
%
Female literacyOverall literacy
dev. grant grantSchool T L M
Male Female
IVV
IIIIII
Grade R.R. D.O.R. P.R.
VIIVI
# #
I - V
Enrolment by medium of instructions
Examination results
Retention rate
GPI
Primary cycle U. primary cycleState
DISTRICT ELEMENTARY EDUCATION REPORT CARD : 2005-06
GirlsGrade
IIIIIIIVVVI
VIII
AllGirls
Total
VII
% TotalGrossness
School category
2275170
0
16 21531 5026
060
00 0 0
862 8814 51,11328 15,41618 37,175
0 00 0
815 57 76,978 7,1363,520 47,878 3,395
11,505 15,313 9,97511,253 28,790 7,250
0 0 00 0 0
84,232 11,446 2,4681,259
653174
P + UP P+sec/hs U.P. only UP+sec
School categoryP. only
3.9 0.8 1.2 1.0 0.06.5
Number of Clusters 1371999
% Schools with SCR > 600.8 0.0 0.0 0.0
2.9 7.4 13.4 6.3 0.0% Schools with pre-primary sections 15.2 20.2 24.4 18.8 0.0% Schools with common toilets 47.2 48.6 46.3 46.9 0.0
% Schools with girls toilets 33.9 46.5 67.1 71.9 0.0% Schools with drinking water facility 92.9 89.3 92.7 97.9 0.0
% Enrolment in Govt. schools 88.0 93.6 57.3 76.8 0.097.4 99.2 89.0 93.8 0.0
% No female teacher schools (tch>=2) 16.0 8.2 9.8 2.1 0.03.6 0.3 0.0 0.0 0.0
0.1 0.0 1.7 0.0 0.0%Enrolment in schools without blackboard 1.4 1.2 14.5 10.3 0.0
2001-02 2002-03 2003-04 2004-05 2005-06IIIIIIIVV
VIVII
Total U.P
28,42529,37428,31129,41128,76829,311
27,934
64,79963,25664,81363,53863,621
64,68256,884
64,57064,12062,08262,77961,575
61,22555,507
73,00366,96267,30766,82062,404
65,96255,088
81,371174,040165,435169,344
117.0
96.9
116.8
100.3
60.4
53.0
43.1
3.70.0
13,09713,38812,74613,23112,96013,51712,75511,388
103,082
114136158150159157131126
1,131
6084798381
119122111739
3,541
classrooms
1,552957
1,9240
66.668.781.072.7
0.0
24.222.9
9.1
13.516.2
0.0
8.45.5
11.10.0
295248425
0
698 583 60 2 0 293 12111 2 0 0 129 1
41 0 0 0 35 650 2 0 0 42 2
0 0 0 0 0 0
92 713 1,032 737 438 19 3610 191 414 433 322 9 5 2834 91 98 319 297 18 14 148 157 149 382 536 45 33 6
0 0 0 0 0 0 0 0
11 17 16 41 15 2 0 0
1086617437678
0
767434673
0
1983 8 12 32 0 150 280 128 23328
150
24
140
192
170
0000
10574
1250
1276596
0
915282
0
1033361
0
Terminalgrade Passed
VIII boysV girlsV boys
VIII girls
10 with >60%
82.531211433
8781387
0
74.339.740.2
0.0
71.671.127.122.9
0.0
88123Tamil English Urdu Telugu Others
514551818538243
0
674226658736
100230
412510
000
2690000
9800
1620
% Schools recvd.
89.893.463.469.8
0.0
89.493.865.972.9
0.0
7101567320
2817835
463043337510537
7061
6041256575
402112155
4471728945
798612322
3.35.9
10.714.4
0.0
0.80.50.40.5
3.02.31.6
0.50.5
43.1
0.83
2005-062004-052003-04
TAMIL NADU
49.7
Upper PrimaryPrimary
Sex ratio Sex ratio 0-6
8 105
VIII40.2
Enrolment of children
VIII 48,294 48,703 52,474 24,126Total Pr. 336,496 315,126 320,027 144,289
1 - 5 6 - 8
1,035 3520 00 0
477 401
%Teachers recvd.in-service training
Total schools* Rural schools* Total enrolment* Rural enrolment* Teachers*
19.3 26.4
48.7
39.1
94.4 94.3
73.7 75.3% SC enrolment% SC girls to SC enrolment% ST enrolment
47.0 47.24.8
46.7 44.9
76.7
44.9
78.1
46.3
Position of teachers by educational qualification (other than para teacher)
(Previous academic year)Incentives : Number of beneficiaries
% ST girls to ST enrolment
% Girls
Number of villages
% 0 - 6 population
% SC population % ST population
% Urban population
% Schools with blackboard
% Enrolment in single-teacher schools
% Enrolment in schools without building
Primary Upperprimary
OBC EnrolmentPrimary U. Primary
% OBCEnrolment% OBC girls toOBC Enrolment
Pupil-teacher ratio (PTR)Student-classroom ratio (SCR)% Schools with <= 50 students% Schools with PTR > 100% Female teachers
% Schools established since 1995
Regular teachers Para-teachers
% minorrepairs
% majorrepairs
# = not applicable na = not available * Some totals may not match due to no response in classificatory data items
54.4 44.855.2 44.354.7 44.954.8 44.856.4 43.155.1 44.455.9 41.256.8 40.9
2831
45.83127
26.40.4
64.624.1
45.63835
1.60.8
54.810.3
47.03525
4.21.0
49.721.9
0.000
0.00.00.00.0
16.7 14.6 2.1 61.4 50.7
86993816.013.5
Category
PrivateGovt.PrivateGovtPrivateGovt.PrivateGovt.PrivateGovt.
Total population (in 000's)
Number of blocks/taluks
District
Decadal growth rate
Primary onlyPrimary with upper primaryPrimary with upper primary & sec/higher sec.Upper primary onlyUpper primary with sec./higher secondary
% Single classroom schools% Single teacher schools
P + UP P+sec/hs U.P. only UP+secP. only
No response in school category
Primary with upper primaryPrimary with U.P. & sec/higherUpper primary onlyUpper primary with sec./higher sec
Primary only
Primary onlyPrimary with upper primaryPrimary with Upper primary & sec/higherUpper primary only
Para-teachers
School category
Upper primary with sec./higher secondary
Primary onlyPrimary with upper prim.
P. onlyP + UPP+sec/hsU.P. onlyUP+sec
NER(U.Prim)GER(U.Prim)NER (Primary)GER (Primary)
Transition ratePrim. to U. Prim
3.7
SC/ST Enrolment
Indicators
Classrooms/Other rooms
Prim.with U.P.&Sec/H.SUpper Primary onlyU. Primary with Sec./H.S.
Basic Data, 2001
Data reported from
Performance indicators
99.5 71.799.4 75.295.9 48.793.9 48.5
Tam
il N
adu

473
Elementary Education: Report Card - DINDIGUL
Tam
il N
adu
0.2580.535
24.4 23.6
Key data: Elementary Education
1923
DINDIGUL
(Previous academic year)
(Previous year)
Gender and caste distribution of teachers*
No. of schools by type of building*
BoysWith disability
Flow rates
Primary Level
Enrolment*
Number of schools
Grade
GER / NER
School category
Primary Upper primaryBoys Boys GirlsGirls
IncentiveType
School categoryMultiple
TypeKuccha
PartiallyPucca
PuccaTotal % good condition
Otherrooms
TentNo
Building
Classrooms
Belowsecondary
Highersecondary
Postgraduate
M. Phil.GraduateSecondarySchool category OthersNo
response
ST teachers
Total Male Female No res Male Female No res Male Female Male FemaleSC teachers
Text booksUniformAttendanceStationery
% Passed
Avg. No. of Tchs.
%
Female literacyOverall literacy
dev. grant grantSchool T L M
Male Female
IVV
IIIIII
Grade R.R. D.O.R. P.R.
VIIVI
# #
I - V
Enrolment by medium of instructions
Examination results
Retention rate
GPI
Primary cycle U. primary cycleState
DISTRICT ELEMENTARY EDUCATION REPORT CARD : 2005-06
GirlsGrade
IIIIIIIVVVI
VIII
AllGirls
Total
VII
% TotalGrossness
School category
1745441
0
65 17075 5390
035
00 0 0
961 32946 44,85057 17,00556 18,943
0 00 0
940 270 75,334 38,43839,642 43,522 20,92516,825 16,931 12,51240,492 15,975 22,498
0 0 00 0 0
77,300 52,890 2,5561,234
1,725936
P + UP P+sec/hs U.P. only UP+sec
School categoryP. only
6.4 0.0 0.0 0.0 0.03.0
Number of Clusters 1789396
% Schools with SCR > 600.0 0.0 0.8 0.0
1.7 7.1 4.7 0.8 0.0% Schools with pre-primary sections 9.0 3.3 30.2 31.3 0.0% Schools with common toilets 61.6 64.0 46.5 45.0 0.0
% Schools with girls toilets 46.7 74.1 84.5 87.8 0.0% Schools with drinking water facility 96.4 97.9 94.6 98.5 0.0
% Enrolment in Govt. schools 59.4 53.1 50.3 31.9 0.098.4 96.7 100.0 96.9 0.0
% No female teacher schools (tch>=2) 8.8 3.8 3.1 5.3 0.01.7 0.0 0.0 0.1 0.0
0.0 0.0 0.0 0.0 0.0%Enrolment in schools without blackboard 1.9 4.4 0.0 8.0 0.0
2001-02 2002-03 2003-04 2004-05 2005-06IIIIIIIVV
VIVII
Total U.P
42,97039,29938,75840,07639,09039,207
35,943
45,51542,17643,02141,76940,973
40,22836,409
44,33441,09739,47238,18437,517
37,25134,800
47,00540,00337,84037,07035,750
36,63432,963
107,754110,660103,36898,732
112.3
91.3
118.4
96.8
124.5
104.3
46.8
5.40.0
20,63418,75818,52919,31318,74118,58416,92915,536
147,024
300274232232223166145156
1,728
171181165167169115111108
1,187
5,866
classrooms
2,2751,2813,058
0
72.078.690.587.4
0.0
24.218.5
3.9
8.09.00.0
2.91.53.60.0
299388778
0
836 437 443 1 0 408 144 24 0 0 171 075 7 1 0 46 067 4 0 0 59 1
0 0 0 0 0 0
95 1,231 1,722 751 435 19 653 510 876 413 293 14 10 028 159 189 448 402 35 12 041 331 305 793 1,124 125 55 0
0 0 0 0 0 0 0 0
1 1 15 33 36 1 0 0
1064629389
10170
1540884
17590
3195 0 6 16 0 152 410 9 190000
04
270
11122
0
0000
10253
1220
160105183
0
3020
5470
Terminalgrade Passed
VIII boysV girlsV boys
VIII girls
0 with >60%
90.24281217012882825
0
84.742.527.6
0.0
77.285.533.629.1
0.0
123824Tamil English
833982493939067
0
631210948416
192350
% Schools recvd.
88.996.259.755.7
0.0
89.095.458.961.1
0.0
8961074215
2449809
6210135164
671811892
8320168499
34811645
5287130590
668911332
3.39.1
10.021.6
0.0
3.11.91.61.5
5.14.34.0
1.82.0
90.7
0.92
2005-062004-052003-04
TAMIL NADU
69.5
Upper PrimaryPrimary
Sex ratio Sex ratio 0-6
16 163
VIII41.9
Enrolment of children
VIII 29,135 31,317 34,023 32,604Total Pr. 197,668 200,604 213,454 200,193
1 - 5 6 - 8
1,090 1,7350 00 0
549 739
%Teachers recvd.in-service training
Total schools* Rural schools* Total enrolment* Rural enrolment* Teachers*
18.8 23.8
100.0
79.5
90.4 96.4
72.5 76.2% SC enrolment% SC girls to SC enrolment% ST enrolment
47.8 47.8
47.6 46.4
74.2
48.0
74.5
47.5
Position of teachers by educational qualification (other than para teacher)
(Previous academic year)Incentives : Number of beneficiaries
% ST girls to ST enrolment
% Girls
Number of villages
% 0 - 6 population
% SC population % ST population
% Urban population
% Schools with blackboard
% Enrolment in single-teacher schools
% Enrolment in schools without building
Primary Upperprimary
OBC EnrolmentPrimary U. Primary
% OBCEnrolment% OBC girls toOBC Enrolment
Pupil-teacher ratio (PTR)Student-classroom ratio (SCR)% Schools with <= 50 students% Schools with PTR > 100% Female teachers
% Schools established since 1995
Regular teachers Para-teachers
% minorrepairs
% majorrepairs
# = not applicable na = not available * Some totals may not match due to no response in classificatory data items
12.3 84.57.8 90.26.7 91.76.7 91.87.5 90.78.3 89.79.5 85.49.8 85.8
2626
47.73022
38.40.5
75.08.2
49.63937
0.80.4
71.03.3
45.72119
3.81.5
63.08.4
0.000
0.00.00.00.0
9.0 19.6 0.3 69.3 58.9
93098635.011.4
Category
PrivateGovt.PrivateGovtPrivateGovt.PrivateGovt.PrivateGovt.
Total population (in 000's)
Number of blocks/taluks
District
Decadal growth rate
Primary onlyPrimary with upper primaryPrimary with upper primary & sec/higher sec.Upper primary onlyUpper primary with sec./higher secondary
% Single classroom schools% Single teacher schools
P + UP P+sec/hs U.P. only UP+secP. only
No response in school category
Primary with upper primaryPrimary with U.P. & sec/higherUpper primary onlyUpper primary with sec./higher sec
Primary only
Primary onlyPrimary with upper primaryPrimary with Upper primary & sec/higherUpper primary only
Para-teachers
School category
Upper primary with sec./higher secondary
Primary onlyPrimary with upper prim.
P. onlyP + UPP+sec/hsU.P. onlyUP+sec
NER(U.Prim)GER(U.Prim)NER (Primary)GER (Primary)
Transition ratePrim. to U. Prim
SC/ST Enrolment
Indicators
Classrooms/Other rooms
Prim.with U.P.&Sec/H.SUpper Primary onlyU. Primary with Sec./H.S.
Basic Data, 2001
Data reported from
Performance indicators
98.3 54.598.8 59.196.0 41.796.5 46.6

474
Elementary Education in India - Where do we stand ?
20.5 18.7
Key data: Elementary Education
2582
ERODE
(Previous academic year)
(Previous year)
Gender and caste distribution of teachers*
No. of schools by type of building*
BoysWith disability
Flow rates
Primary Level
Enrolment*
Number of schools
Grade
GER / NER
School category
Primary Upper primaryBoys Boys GirlsGirls
IncentiveType
School categoryMultiple
TypeKuccha
PartiallyPucca
PuccaTotal % good condition
Otherrooms
TentNo
Building
Classrooms
Belowsecondary
Highersecondary
Postgraduate
M. Phil.GraduateSecondarySchool category OthersNo
response
ST teachers
Total Male Female No res Male Female No res Male Female Male FemaleSC teachers
Text booksUniformAttendanceStationery
% Passed
Avg. No. of Tchs.
%
Female literacyOverall literacy
dev. grant grantSchool T L M
Male Female
IVV
IIIIII
Grade R.R. D.O.R. P.R.
VIIVI
# #
I - V
Enrolment by medium of instructions
Examination results
Retention rate
GPI
Primary cycle U. primary cycleState
DISTRICT ELEMENTARY EDUCATION REPORT CARD : 2005-06
GirlsGrade
IIIIIIIVVVI
VIII
AllGirls
Total
VII
% TotalGrossness
School category
2696975
0
31 244102 64109
060
00 0 0
1,313 24924 69,54074 16,84870 33,848
0 00 0
1,247 162 80,941 22,7327,289 56,949 5,031
31,752 15,261 21,48849,831 25,475 33,459
0 0 00 0 0
90,808 41,319 3,1521,783
1,436265
P + UP P+sec/hs U.P. only UP+sec
School categoryP. only
7.9 1.3 0.0 0.5 0.06.9
Number of Clusters 2217630
% Schools with SCR > 601.7 1.8 1.6 0.0
2.2 7.7 1.2 2.7 0.0% Schools with pre-primary sections 10.3 8.7 36.8 40.8 0.0% Schools with common toilets 53.1 44.3 31.0 34.2 0.0
% Schools with girls toilets 61.1 84.3 91.8 85.9 0.0% Schools with drinking water facility 97.4 97.7 96.5 100.0 0.0
% Enrolment in Govt. schools 68.7 90.5 34.7 40.4 0.098.2 98.0 92.4 96.2 0.0
% No female teacher schools (tch>=2) 11.1 5.7 2.3 2.2 0.03.0 0.4 0.6 0.4 0.0
0.2 0.0 0.3 0.0 0.0%Enrolment in schools without blackboard 2.0 1.7 5.4 3.4 0.0
2001-02 2002-03 2003-04 2004-05 2005-06IIIIIIIVV
VIVII
Total U.P
46,29140,79442,64445,07444,75046,654
39,084
41,31641,71243,68243,84442,555
43,45537,453
44,63444,71043,82043,47241,076
40,97737,010
39,73234,58034,00032,37530,747
30,33826,325
121,682116,515113,25480,093
90.4
74.2
87.6
75.5
101.7
87.8
49.8
3.55.8
22,28619,68520,54421,51921,35621,65318,45116,877
162,371
174155169150157131
9381
1,110
129101105
9494784257
700
5,237
classrooms
2,2172,0564,374
0
80.276.791.389.3
0.0
15.617.0
4.2
6.97.50.0
6.31.83.20.0
347655
1,3850
1,099 1,132 139 2 0 258 31187 10 0 0 101 2105 8 0 0 48 10
98 7 0 0 73 60 0 0 0 0 0
162 1,295 1,392 1,003 656 22 2853 317 622 468 532 24 5 035 172 201 634 695 60 39 042 352 313 1,188 1,737 212 96 0
0 0 0 0 0 0 0 0
8 13 57 94 96 3 4 0
1270690624
14210
133112122519
0
3288 1 4 25 0 166 433 13 170000
41033
0
2328
1480
0000
10475
1160
200102175
0
5360
8670
Terminalgrade Passed
VIII boysV girlsV boys
VIII girls
1 with >60%
89.34588204818744121
0
81.433.135.0
0.0
70.780.326.827.4
0.0
119113Tamil English Kannada Urdu
724453005547338
0
108302100
1814735998
0
17162284
000
000
450
% Schools recvd.
89.594.045.641.8
0.0
90.093.352.649.5
0.0
8516161404
6608811
4693218608
27327272
8045257347
107819586
3830517650
305814004
2.96.8
11.022.4
0.0
1.71.31.01.0
8.44.23.5
1.21.2
100.0
0.92
2005-062004-052003-04
TAMIL NADU
66.2
Upper PrimaryPrimary
Sex ratio Sex ratio 0-6
20 157
VIII39.2
Enrolment of children
VIII 23,430 35,267 35,607 35,944Total Pr. 171,434 217,712 213,109 219,553
1 - 5 6 - 8
1,868 2,2530 00 0
620 1,254
%Teachers recvd.in-service training
Total schools* Rural schools* Total enrolment* Rural enrolment* Teachers*
16.7 25.6
84.8
65.3
73.8 72.1
55.0 53.5% SC enrolment% SC girls to SC enrolment% ST enrolment
48.7 47.41.6
47.4 47.1
76.4
47.9
78.2
46.7
Position of teachers by educational qualification (other than para teacher)
(Previous academic year)Incentives : Number of beneficiaries
% ST girls to ST enrolment
% Girls
Number of villages
% 0 - 6 population
% SC population % ST population
% Urban population
% Schools with blackboard
% Enrolment in single-teacher schools
% Enrolment in schools without building
Primary Upperprimary
OBC EnrolmentPrimary U. Primary
% OBCEnrolment% OBC girls toOBC Enrolment
Pupil-teacher ratio (PTR)Student-classroom ratio (SCR)% Schools with <= 50 students% Schools with PTR > 100% Female teachers
% Schools established since 1995
Regular teachers Para-teachers
% minorrepairs
% majorrepairs
# = not applicable na = not available * Some totals may not match due to no response in classificatory data items
0.8 97.5
5.3 86.33.1 92.6
2426
48.92925
49.00.5
72.29.3
47.93835
4.01.0
66.16.3
43.92019
3.83.8
64.718.5
0.000
0.00.00.00.0
10.9 16.4 0.7 65.4 55.2
93997246.39.8
Category
PrivateGovt.PrivateGovtPrivateGovt.PrivateGovt.PrivateGovt.
Total population (in 000's)
Number of blocks/taluks
District
Decadal growth rate
Primary onlyPrimary with upper primaryPrimary with upper primary & sec/higher sec.Upper primary onlyUpper primary with sec./higher secondary
% Single classroom schools% Single teacher schools
P + UP P+sec/hs U.P. only UP+secP. only
No response in school category
Primary with upper primaryPrimary with U.P. & sec/higherUpper primary onlyUpper primary with sec./higher sec
Primary only
Primary onlyPrimary with upper primaryPrimary with Upper primary & sec/higherUpper primary only
Para-teachers
School category
Upper primary with sec./higher secondary
Primary onlyPrimary with upper prim.
P. onlyP + UPP+sec/hsU.P. onlyUP+sec
NER(U.Prim)GER(U.Prim)NER (Primary)GER (Primary)
Transition ratePrim. to U. Prim
1.1
SC/ST Enrolment
Indicators
Classrooms/Other rooms
Prim.with U.P.&Sec/H.SUpper Primary onlyU. Primary with Sec./H.S.
Basic Data, 2001
Data reported from
Performance indicators
99.3 61.998.9 67.693.0 41.096.0 46.6
Tam
il N
adu

475
Elementary Education: Report Card - KANCHEEPURAM
Tam
il N
adu
34.0 36.0
Key data: Elementary Education
2877
KANCHEEPURAM
(Previous academic year)
(Previous year)
Gender and caste distribution of teachers*
No. of schools by type of building*
BoysWith disability
Flow rates
Primary Level
Enrolment*
Number of schools
Grade
GER / NER
School category
Primary Upper primaryBoys Boys GirlsGirls
IncentiveType
School categoryMultiple
TypeKuccha
PartiallyPucca
PuccaTotal % good condition
Otherrooms
TentNo
Building
Classrooms
Belowsecondary
Highersecondary
Postgraduate
M. Phil.GraduateSecondarySchool category OthersNo
response
ST teachers
Total Male Female No res Male Female No res Male Female Male FemaleSC teachers
Text booksUniformAttendanceStationery
% Passed
Avg. No. of Tchs.
%
Female literacyOverall literacy
dev. grant grantSchool T L M
Male Female
IVV
IIIIII
Grade R.R. D.O.R. P.R.
VIIVI
# #
I - V
Enrolment by medium of instructions
Examination results
Retention rate
GPI
Primary cycle U. primary cycleState
DISTRICT ELEMENTARY EDUCATION REPORT CARD : 2005-06
GirlsGrade
IIIIIIIVVVI
VIII
AllGirls
Total
VII
% TotalGrossness
School category
269103
760
86 237111 82148
057
00 0 0
871 30541 77,82242 40,34659 37,286
0 00 0
787 202 81,223 21,42535,640 64,950 12,92134,222 29,537 11,28383,868 25,635 28,379
0 0 00 0 0
100,164 49,079 2,8231,885
1,838881
P + UP P+sec/hs U.P. only UP+sec
School categoryP. only
16.0 0.3 0.5 0.9 0.04.1
Number of Clusters 1969899
% Schools with SCR > 600.0 0.9 0.0 0.0
8.8 18.6 7.0 4.5 0.0% Schools with pre-primary sections 15.1 7.3 30.4 48.7 0.0% Schools with common toilets 54.9 53.0 49.5 48.2 0.0
% Schools with girls toilets 46.0 68.7 86.0 88.4 0.0% Schools with drinking water facility 96.7 98.0 95.3 99.6 0.0
% Enrolment in Govt. schools 67.1 68.6 54.1 30.8 0.098.2 98.6 94.9 93.8 0.0
% No female teacher schools (tch>=2) 8.1 3.9 4.7 0.9 0.01.6 0.0 0.3 0.0 0.0
0.0 0.0 0.0 0.0 0.0%Enrolment in schools without blackboard 3.5 1.4 3.5 6.8 0.0
2001-02 2002-03 2003-04 2004-05 2005-06IIIIIIIVV
VIVII
Total U.P
54,34850,71453,43958,10158,15364,678
61,495
47,91650,65355,44355,82358,171
62,82958,683
51,25654,86755,05357,57356,817
61,64658,256
58,73256,80958,86558,17557,839
63,55457,641
183,672176,988174,626173,571
101.1
101.1
96.5
100.6
114.2
118.8
47.9
1.44.2
27,10724,89726,21928,35528,34131,55429,75828,582
224,813
170168217229205283214185
1,671
126165166155144156127131
1,170
4,726
classrooms
2,7582,6474,785
0
73.372.884.487.9
0.0
20.822.0
5.9
11.97.90.0
5.13.74.20.0
455697
1,2270
697 581 237 0 0 350 8129 12 0 0 213 1145 1 0 0 66 2143 3 0 0 69 9
0 0 0 0 0 0
101 1,087 1,421 1,161 805 14 2039 464 749 781 644 30 10 1121 187 267 819 775 71 34 1142 354 301 1,202 1,516 137 43 110
0 0 0 0 0 0 0 0
1 18 36 133 80 3 2 0
1023727685
10880
198914892507
0
3581 21 3 33 0 196 568 8 181211
1120
12426
0
375297
0
0000
147124145
0
289192241
0
4130
1011
80
Terminalgrade Passed
VIII boysV girlsV boys
VIII girls
15 with >60%
79.84661276622613830
0
76.638.928.2
0.0
67.373.434.526.9
0.0
135300Tamil English Others Telugu Urdu
1047334912150595
0
137727891
2518869076
0
0220254888
0
0479
5595
0
42139
000
% Schools recvd.
83.090.155.145.1
0.0
83.591.559.346.9
0.0
10175377309
72128393
8898251453
486737520
10280878173
319227753
8945951432
474336073
4.07.8
10.617.1
0.0
1.10.60.60.8
5.54.93.9
0.50.7
100.0
0.96
2005-062004-052003-04
TAMIL NADU
68.2
Upper PrimaryPrimary
Sex ratio Sex ratio 0-6
13 174
VIII28.5
Enrolment of children
VIII 52,376 54,724 55,476 57,499Total Pr. 290,420 275,566 268,006 274,755
1 - 5 6 - 8
1,728 2,1020 00 0
1,274 987
%Teachers recvd.in-service training
Total schools* Rural schools* Total enrolment* Rural enrolment* Teachers*
19.0 28.9
92.5
84.5
80.3 79.7
81.8 75.9% SC enrolment% SC girls to SC enrolment% ST enrolment
49.3 48.62.8
48.0 46.7
55.9
49.1
55.9
49.3
Position of teachers by educational qualification (other than para teacher)
(Previous academic year)Incentives : Number of beneficiaries
% ST girls to ST enrolment
% Girls
Number of villages
% 0 - 6 population
% SC population % ST population
% Urban population
% Schools with blackboard
% Enrolment in single-teacher schools
% Enrolment in schools without building
Primary Upperprimary
OBC EnrolmentPrimary U. Primary
% OBCEnrolment% OBC girls toOBC Enrolment
Pupil-teacher ratio (PTR)Student-classroom ratio (SCR)% Schools with <= 50 students% Schools with PTR > 100% Female teachers
% Schools established since 1995
Regular teachers Para-teachers
% minorrepairs
% majorrepairs
# = not applicable na = not available * Some totals may not match due to no response in classificatory data items
1.2 93.30.7 94.3
2833
50.43232
30.80.4
77.511.1
49.34141
1.41.4
73.27.6
47.93225
5.49.4
68.012.9
0.000
0.00.00.00.0
18.8 25.1 0.9 76.9 68.8
96197553.311.7
Category
PrivateGovt.PrivateGovtPrivateGovt.PrivateGovt.PrivateGovt.
Total population (in 000's)
Number of blocks/taluks
District
Decadal growth rate
Primary onlyPrimary with upper primaryPrimary with upper primary & sec/higher sec.Upper primary onlyUpper primary with sec./higher secondary
% Single classroom schools% Single teacher schools
P + UP P+sec/hs U.P. only UP+secP. only
No response in school category
Primary with upper primaryPrimary with U.P. & sec/higherUpper primary onlyUpper primary with sec./higher sec
Primary only
Primary onlyPrimary with upper primaryPrimary with Upper primary & sec/higherUpper primary only
Para-teachers
School category
Upper primary with sec./higher secondary
Primary onlyPrimary with upper prim.
P. onlyP + UPP+sec/hsU.P. onlyUP+sec
NER(U.Prim)GER(U.Prim)NER (Primary)GER (Primary)
Transition ratePrim. to U. Prim
1.3
SC/ST Enrolment
Indicators
Classrooms/Other rooms
Prim.with U.P.&Sec/H.SUpper Primary onlyU. Primary with Sec./H.S.
Basic Data, 2001
Data reported from
Performance indicators
99.7 65.499.5 71.593.8 34.095.7 41.9

476
Elementary Education in India - Where do we stand ?
0.7980.595
7.4 9.2
Key data: Elementary Education
1676
KANNIYAKUMARI
(Previous academic year)
(Previous year)
Gender and caste distribution of teachers*
No. of schools by type of building*
BoysWith disability
Flow rates
Primary Level
Enrolment*
Number of schools
Grade
GER / NER
School category
Primary Upper primaryBoys Boys GirlsGirls
IncentiveType
School categoryMultiple
TypeKuccha
PartiallyPucca
PuccaTotal % good condition
Otherrooms
TentNo
Building
Classrooms
Belowsecondary
Highersecondary
Postgraduate
M. Phil.GraduateSecondarySchool category OthersNo
response
ST teachers
Total Male Female No res Male Female No res Male Female Male FemaleSC teachers
Text booksUniformAttendanceStationery
% Passed
Avg. No. of Tchs.
%
Female literacyOverall literacy
dev. grant grantSchool T L M
Male Female
IVV
IIIIII
Grade R.R. D.O.R. P.R.
VIIVI
# #
I - V
Enrolment by medium of instructions
Examination results
Retention rate
GPI
Primary cycle U. primary cycleState
DISTRICT ELEMENTARY EDUCATION REPORT CARD : 2005-06
GirlsGrade
IIIIIIIVVVI
VIII
AllGirls
Total
VII
% TotalGrossness
School category
1076954
0
82 96104 59129
043
00 0 0
288 23974 21,65589 11,06788 14,607
0 00 0
244 188 41,405 35,01424,403 19,368 21,73428,457 9,685 24,16554,849 11,362 31,363
0 0 00 0 0
47,715 48,282 1,192598
1,848837
P + UP P+sec/hs U.P. only UP+sec
School categoryP. only
3.8 1.1 0.0 0.0 0.02.1
Number of Clusters 1072140
% Schools with SCR > 600.0 1.2 0.5 0.0
8.7 7.4 1.7 1.6 0.0% Schools with pre-primary sections 24.9 16.4 30.1 32.8 0.0% Schools with common toilets 60.3 54.0 49.1 45.4 0.0
% Schools with girls toilets 77.4 89.4 94.8 95.1 0.0% Schools with drinking water facility 93.2 95.2 98.8 100.0 0.0
% Enrolment in Govt. schools 49.7 47.0 28.0 21.0 0.099.1 99.5 97.7 98.9 0.0
% No female teacher schools (tch>=2) 3.2 0.5 1.2 1.1 0.00.8 0.0 0.3 0.0 0.0
0.0 0.0 0.0 0.0 0.0%Enrolment in schools without blackboard 0.7 1.5 1.5 2.3 0.0
2001-02 2002-03 2003-04 2004-05 2005-06IIIIIIIVV
VIVII
Total U.P
33,15031,22832,17332,46331,04630,798
30,368
30,01030,48431,21629,64829,580
30,74730,300
30,90830,99629,01128,78329,147
30,71130,293
33,96530,21429,58729,94130,206
31,27231,105
90,97590,83891,23993,268
96.5
93.3
97.4
92.5
114.2
101.1
49.5
1.20.0
16,30915,27415,80615,88915,13814,76814,71414,546
122,444
102101116115128131125128946
7795
1057584888069
673
3,307
classrooms
1,6491,8664,120
0
85.382.189.590.3
0.0
11.813.0
2.9
8.66.90.0
4.91.82.80.0
382692
1,1610
752 304 91 3 2 126 1101 15 1 0 72 0104 7 0 0 62 0103 3 0 0 75 2
0 0 0 0 0 0
91 1,134 708 692 374 19 613 435 253 362 311 38 15 022 356 202 648 646 47 25 049 580 375 1,066 1,694 189 64 0
0 0 0 0 0 0 0 0
2 6 8 31 37 2 1 0
448283438
11990
114415082818
0
2576 0 1 15 0 37 138 1 50000
21
120
62426
0
0000
222737
0
7746
1070
0020
5330
Terminalgrade Passed
VIII boysV girlsV boys
VIII girls
0 with >60%
84.93040143519714055
0
86.049.746.2
0.0
59.263.534.337.0
0.0
82401Tamil English Malayalam Others Sindhi
395902330133045
0
96754376
1407733774
0
30911473
8832386
0
404227177
180
0323
000
% Schools recvd.
73.182.065.965.6
0.0
73.883.165.968.9
0.0
5883753113
1703134
5360631374
56054611
5720148486
1862915
5482431194
58974852
5.87.6
11.422.2
0.0
1.21.21.21.3
3.33.22.8
1.51.3
100.0
0.96
2005-062004-052003-04
TAMIL NADU
77.7
Upper PrimaryPrimary
Sex ratio Sex ratio 0-6
13 106
VIII11.6
Enrolment of children
VIII 30,891 30,235 29,791 29,809Total Pr. 153,913 148,845 150,938 160,060
1 - 5 6 - 8
1,155 2,9000 00 0
637 1,334
%Teachers recvd.in-service training
Total schools* Rural schools* Total enrolment* Rural enrolment* Teachers*
18.0 23.3
93.7
77.5
78.1 80.1
68.8 69.5% SC enrolment% SC girls to SC enrolment% ST enrolment
49.5 49.7
47.7 34.2
85.4
49.0
83.3
48.4
Position of teachers by educational qualification (other than para teacher)
(Previous academic year)Incentives : Number of beneficiaries
% ST girls to ST enrolment
% Girls
Number of villages
% 0 - 6 population
% SC population % ST population
% Urban population
% Schools with blackboard
% Enrolment in single-teacher schools
% Enrolment in schools without building
Primary Upperprimary
OBC EnrolmentPrimary U. Primary
% OBCEnrolment% OBC girls toOBC Enrolment
Pupil-teacher ratio (PTR)Student-classroom ratio (SCR)% Schools with <= 50 students% Schools with PTR > 100% Female teachers
% Schools established since 1995
Regular teachers Para-teachers
% minorrepairs
% majorrepairs
# = not applicable na = not available * Some totals may not match due to no response in classificatory data items
1.0 95.71.3 95.6
2120
50.63229
18.60.8
85.221.3
48.13228
2.10.5
80.16.9
46.31717
4.90.0
70.13.8
0.000
0.00.00.00.0
4.3 4.0 0.3 87.6 84.8
968101465.310.8
Category
PrivateGovt.PrivateGovtPrivateGovt.PrivateGovt.PrivateGovt.
Total population (in 000's)
Number of blocks/taluks
District
Decadal growth rate
Primary onlyPrimary with upper primaryPrimary with upper primary & sec/higher sec.Upper primary onlyUpper primary with sec./higher secondary
% Single classroom schools% Single teacher schools
P + UP P+sec/hs U.P. only UP+secP. only
No response in school category
Primary with upper primaryPrimary with U.P. & sec/higherUpper primary onlyUpper primary with sec./higher sec
Primary only
Primary onlyPrimary with upper primaryPrimary with Upper primary & sec/higherUpper primary only
Para-teachers
School category
Upper primary with sec./higher secondary
Primary onlyPrimary with upper prim.
P. onlyP + UPP+sec/hsU.P. onlyUP+sec
NER(U.Prim)GER(U.Prim)NER (Primary)GER (Primary)
Transition ratePrim. to U. Prim
SC/ST Enrolment
Indicators
Classrooms/Other rooms
Prim.with U.P.&Sec/H.SUpper Primary onlyU. Primary with Sec./H.S.
Basic Data, 2001
Data reported from
Performance indicators
99.6 57.199.7 68.296.5 40.497.9 49.0
Tam
il N
adu

477
Elementary Education: Report Card - KARUR
Tam
il N
adu
0.7470.202
23.9 22.5
Key data: Elementary Education
936
KARUR
(Previous academic year)
(Previous year)
Gender and caste distribution of teachers*
No. of schools by type of building*
BoysWith disability
Flow rates
Primary Level
Enrolment*
Number of schools
Grade
GER / NER
School category
Primary Upper primaryBoys Boys GirlsGirls
IncentiveType
School categoryMultiple
TypeKuccha
PartiallyPucca
PuccaTotal % good condition
Otherrooms
TentNo
Building
Classrooms
Belowsecondary
Highersecondary
Postgraduate
M. Phil.GraduateSecondarySchool category OthersNo
response
ST teachers
Total Male Female No res Male Female No res Male Female Male FemaleSC teachers
Text booksUniformAttendanceStationery
% Passed
Avg. No. of Tchs.
%
Female literacyOverall literacy
dev. grant grantSchool T L M
Male Female
IVV
IIIIII
Grade R.R. D.O.R. P.R.
VIIVI
# #
I - V
Enrolment by medium of instructions
Examination results
Retention rate
GPI
Primary cycle U. primary cycleState
DISTRICT ELEMENTARY EDUCATION REPORT CARD : 2005-06
GirlsGrade
IIIIIIIVVVI
VIII
AllGirls
Total
VII
% TotalGrossness
School category
1154231
0
20 10242 3922
022
00 0 0
584 9211 26,22029 11,36113 11,900
0 00 0
551 59 37,499 8,5294,328 22,034 2,224
13,274 10,289 9,09412,208 8,062 6,533
0 0 00 0 0
41,330 15,670 1,459727
593185
P + UP P+sec/hs U.P. only UP+sec
School categoryP. only
2.5 0.0 0.0 0.0 0.04.7
Number of Clusters 948200
% Schools with SCR > 600.0 0.0 0.0 0.0
1.5 4.4 2.4 1.9 0.0% Schools with pre-primary sections 7.5 8.1 35.7 17.0 0.0% Schools with common toilets 54.9 57.0 46.4 49.1 0.0
% Schools with girls toilets 60.8 83.0 90.5 77.4 0.0% Schools with drinking water facility 99.3 100.0 94.0 98.1 0.0
% Enrolment in Govt. schools 72.5 85.8 46.1 49.4 0.0100.0 100.0 100.0 100.0 0.0
% No female teacher schools (tch>=2) 11.8 4.4 2.4 1.9 0.02.8 0.0 0.0 0.0 0.0
0.0 0.0 0.0 0.0 0.0%Enrolment in schools without blackboard 0.0 0.0 0.0 0.0 0.0
2001-02 2002-03 2003-04 2004-05 2005-06IIIIIIIVV
VIVII
Total U.P
18,77016,76117,26818,28417,66817,896
15,619
18,11018,08118,70818,02517,618
17,41915,377
19,09619,13318,02417,87617,026
17,40414,854
20,99818,08818,06717,43216,517
17,70514,646
47,54046,49645,72845,160
104.8
82.9
103.1
83.6
113.5
94.6
47.1
1.20.0
8,9427,9588,2168,7088,4828,4637,5186,753
65,040
7374
1069389
1149267
708
4667737569563536
457
2,490
classrooms
1,0001,0311,281
0
70.968.187.578.8
0.0
22.524.1
6.6
10.911.2
0.0
7.81.69.90.0
161310404
0
452 315 182 1 0 178 048 10 0 0 77 043 2 0 0 39 016 3 0 0 34 0
0 0 0 0 0 0
29 369 869 462 292 9 158 112 301 260 218 10 2 1
16 51 109 489 366 32 15 017 73 101 308 577 60 12 0
0 0 0 0 0 0 0 0
0 0 0 0 0 0 0 0
535354344532
0
557734616
0
1510 7 0 0 0 119 244 1 111000
0000
0000
0000
845687
0
88110
740
1230
4230
Terminalgrade Passed
VIII boysV girlsV boys
VIII girls
7 with >60%
93.12052912
10781148
0
75.728.534.2
0.0
73.470.018.033.9
0.0
51875Tamil English Un-Specified
293611362716936
0
4331615
98754938
0
794572
11332234
0
% Schools recvd.
91.489.653.671.7
0.0
90.489.653.673.6
0.0
3827632505
2324724
2259413332
24027302
3860331552
9996322
2311811726
24768455
3.06.8
12.821.7
0.0
2.31.71.52.0
9.35.12.5
2.11.9
92.4
0.91
2005-062004-052003-04
TAMIL NADU
68.1
Upper PrimaryPrimary
Sex ratio Sex ratio 0-6
8 76
VIII41.7
Enrolment of children
VIII 12,809 13,470 13,700 14,025Total Pr. 91,102 91,155 90,542 88,751
1 - 5 6 - 8
700 4480 00 0
371 707
%Teachers recvd.in-service training
Total schools* Rural schools* Total enrolment* Rural enrolment* Teachers*
18.7 24.8
92.3
71.1
83.6 83.5
60.0 63.9% SC enrolment% SC girls to SC enrolment% ST enrolment
48.1 48.1
46.4 63.7
73.8
47.5
74.6
47.8
Position of teachers by educational qualification (other than para teacher)
(Previous academic year)Incentives : Number of beneficiaries
% ST girls to ST enrolment
% Girls
Number of villages
% 0 - 6 population
% SC population % ST population
% Urban population
% Schools with blackboard
% Enrolment in single-teacher schools
% Enrolment in schools without building
Primary Upperprimary
OBC EnrolmentPrimary U. Primary
% OBCEnrolment% OBC girls toOBC Enrolment
Pupil-teacher ratio (PTR)Student-classroom ratio (SCR)% Schools with <= 50 students% Schools with PTR > 100% Female teachers
% Schools established since 1995
Regular teachers Para-teachers
% minorrepairs
% majorrepairs
# = not applicable na = not available * Some totals may not match due to no response in classificatory data items
6.9 90.84.4 93.92.7 95.82.0 96.05.5 92.44.3 93.85.6 85.15.9 89.0
2423
48.32823
48.80.1
73.69.0
48.43331
1.50.7
61.15.9
46.02119
0.01.9
53.713.2
0.000
0.00.00.00.0
9.3 20.3 0.2 68.1 56.8
930101033.311.0
Category
PrivateGovt.PrivateGovtPrivateGovt.PrivateGovt.PrivateGovt.
Total population (in 000's)
Number of blocks/taluks
District
Decadal growth rate
Primary onlyPrimary with upper primaryPrimary with upper primary & sec/higher sec.Upper primary onlyUpper primary with sec./higher secondary
% Single classroom schools% Single teacher schools
P + UP P+sec/hs U.P. only UP+secP. only
No response in school category
Primary with upper primaryPrimary with U.P. & sec/higherUpper primary onlyUpper primary with sec./higher sec
Primary only
Primary onlyPrimary with upper primaryPrimary with Upper primary & sec/higherUpper primary only
Para-teachers
School category
Upper primary with sec./higher secondary
Primary onlyPrimary with upper prim.
P. onlyP + UPP+sec/hsU.P. onlyUP+sec
NER(U.Prim)GER(U.Prim)NER (Primary)GER (Primary)
Transition ratePrim. to U. Prim
SC/ST Enrolment
Indicators
Classrooms/Other rooms
Prim.with U.P.&Sec/H.SUpper Primary onlyU. Primary with Sec./H.S.
Basic Data, 2001
Data reported from
Performance indicators
99.5 56.899.1 63.195.8 40.396.7 45.8

478
Elementary Education in India - Where do we stand ?
16.4 15.6
Key data: Elementary Education
na
KRISHANAGIRI
(Previous academic year)
(Previous year)
Gender and caste distribution of teachers*
No. of schools by type of building*
BoysWith disability
Flow rates
Primary Level
Enrolment*
Number of schools
Grade
GER / NER
School category
Primary Upper primaryBoys Boys GirlsGirls
IncentiveType
School categoryMultiple
TypeKuccha
PartiallyPucca
PuccaTotal % good condition
Otherrooms
TentNo
Building
Classrooms
Belowsecondary
Highersecondary
Postgraduate
M. Phil.GraduateSecondarySchool category OthersNo
response
ST teachers
Total Male Female No res Male Female No res Male Female Male FemaleSC teachers
Text booksUniformAttendanceStationery
% Passed
Avg. No. of Tchs.
%
Female literacyOverall literacy
dev. grant grantSchool T L M
Male Female
IVV
IIIIII
Grade R.R. D.O.R. P.R.
VIIVI
# #
I - V
Enrolment by medium of instructions
Examination results
Retention rate
GPI
Primary cycle U. primary cycleState
DISTRICT ELEMENTARY EDUCATION REPORT CARD : 2005-06
GirlsGrade
IIIIIIIVVVI
VIII
AllGirls
Total
VII
% TotalGrossness
School category
25797
1390
23 25043 9531
0132
00 0 0
996 12417 53,47533 24,49021 40,844
0 00 0
978 98 90,058 9,6945,762 50,602 4,355
12,942 23,100 8,32021,345 34,228 13,832
0 0 00 0 0
94,516 15,681 2,6421,182
727221
P + UP P+sec/hs U.P. only UP+sec
School categoryP. only
3.1 0.0 0.7 0.6 0.09.3
Number of Clusters 17101189
% Schools with SCR > 602.9 3.6 6.5 0.0
4.6 10.4 8.6 9.4 0.0% Schools with pre-primary sections 19.5 21.1 24.3 16.5 0.0% Schools with common toilets 62.9 60.7 28.6 48.8 0.0
% Schools with girls toilets 27.1 43.2 57.1 44.7 0.0% Schools with drinking water facility 95.1 97.9 95.7 96.5 0.0
% Enrolment in Govt. schools 85.8 90.3 65.4 65.7 0.097.0 97.9 94.3 96.5 0.0
% No female teacher schools (tch>=2) 14.8 12.9 12.1 10.0 0.05.8 1.7 2.3 1.2 0.0
0.0 0.0 0.0 0.0 0.0%Enrolment in schools without blackboard 3.2 2.2 9.4 3.5 0.0
2001-02 2002-03 2003-04 2004-05 2005-06IIIIIIIVV
VIVII
Total U.P
35,98635,07134,26935,24134,66834,177
31,899
93,820
49.1
2.110.0
17,14516,82716,57116,80816,27216,04215,36113,384
128,410
2127304230212423
218
2319202325748990
363
4,021
classrooms
1,7131,3372,284
0
68.571.988.079.2
0.0
23.920.4
7.6
8.214.4
0.0
7.73.96.40.0
229348476
0
448 828 103 3 0 176 10163 6 0 0 110 1
97 2 0 0 32 6116 11 0 0 43 0
0 0 0 0 0 0
113 799 1,321 743 339 11 721 214 459 358 305 18 2 2115 86 113 376 219 16 8 738 216 199 461 307 18 8 11
0 0 0 0 0 0 0 0
0 6 19 7 8 2 0 0
1114561293448
0
816540799
0
2219 14 5 17 0 152 238 22 3021
711
0
0440
5340
0000
906753
0
1004662
0
4140
102
210
Terminalgrade Passed
VIII boysV girlsV boys
VIII girls
14 with >60%
84.333691403
8471266
0
74.047.856.4
0.0
68.969.431.142.0
0.0
16092Tamil English Telugu Urdu Kannada
1090755782638
0
3303708
20515483
0
624123461552
9150
583793
000
574461
0110
0
% Schools recvd.
88.492.170.781.2
0.0
86.690.765.781.2
0.0
7508864299
3994429
100517846
443815
7112261316
21058251
101407172
2951397
3.05.06.17.40.0
0.91
2005-062004-052003-04
TAMIL NADU
64.1
Upper PrimaryPrimary
Sex ratio Sex ratio 0-6
10 119
VIII48.6
Enrolment of children
VIII 27,744Total Pr. 175,235
1 - 5 6 - 8
765 5010 00 0
415 432
%Teachers recvd.in-service training
Total schools* Rural schools* Total enrolment* Rural enrolment* Teachers*
81.1 85.1
% SC enrolment% SC girls to SC enrolment% ST enrolment
48.7 48.51.7
47.7 49.2
77.6
47.5
76.6
47.5
Position of teachers by educational qualification (other than para teacher)
(Previous academic year)Incentives : Number of beneficiaries
% ST girls to ST enrolment
% Girls
Number of villages
% 0 - 6 population
% SC population % ST population
% Urban population
% Schools with blackboard
% Enrolment in single-teacher schools
% Enrolment in schools without building
Primary Upperprimary
OBC EnrolmentPrimary U. Primary
% OBCEnrolment% OBC girls toOBC Enrolment
Pupil-teacher ratio (PTR)Student-classroom ratio (SCR)% Schools with <= 50 students% Schools with PTR > 100% Female teachers
% Schools established since 1995
Regular teachers Para-teachers
% minorrepairs
% majorrepairs
# = not applicable na = not available * Some totals may not match due to no response in classificatory data items
2844
48.83327
31.10.9
66.422.9
47.94235
1.45.0
58.511.4
44.84927
14.75.3
63.421.2
0.000
0.00.00.00.0
na na na na na
nananana
Category
PrivateGovt.PrivateGovtPrivateGovt.PrivateGovt.PrivateGovt.
Total population (in 000's)
Number of blocks/taluks
District
Decadal growth rate
Primary onlyPrimary with upper primaryPrimary with upper primary & sec/higher sec.Upper primary onlyUpper primary with sec./higher secondary
% Single classroom schools% Single teacher schools
P + UP P+sec/hs U.P. only UP+secP. only
No response in school category
Primary with upper primaryPrimary with U.P. & sec/higherUpper primary onlyUpper primary with sec./higher sec
Primary only
Primary onlyPrimary with upper primaryPrimary with Upper primary & sec/higherUpper primary only
Para-teachers
School category
Upper primary with sec./higher secondary
Primary onlyPrimary with upper prim.
P. onlyP + UPP+sec/hsU.P. onlyUP+sec
NER(U.Prim)GER(U.Prim)NER (Primary)GER (Primary)
Transition ratePrim. to U. Prim
2.1
SC/ST Enrolment
Indicators
Classrooms/Other rooms
Prim.with U.P.&Sec/H.SUpper Primary onlyU. Primary with Sec./H.S.
Basic Data, 2001
Data reported from
Performance indicators
99.2 68.799.3 71.994.0 45.496.0 44.5
Tam
il N
adu
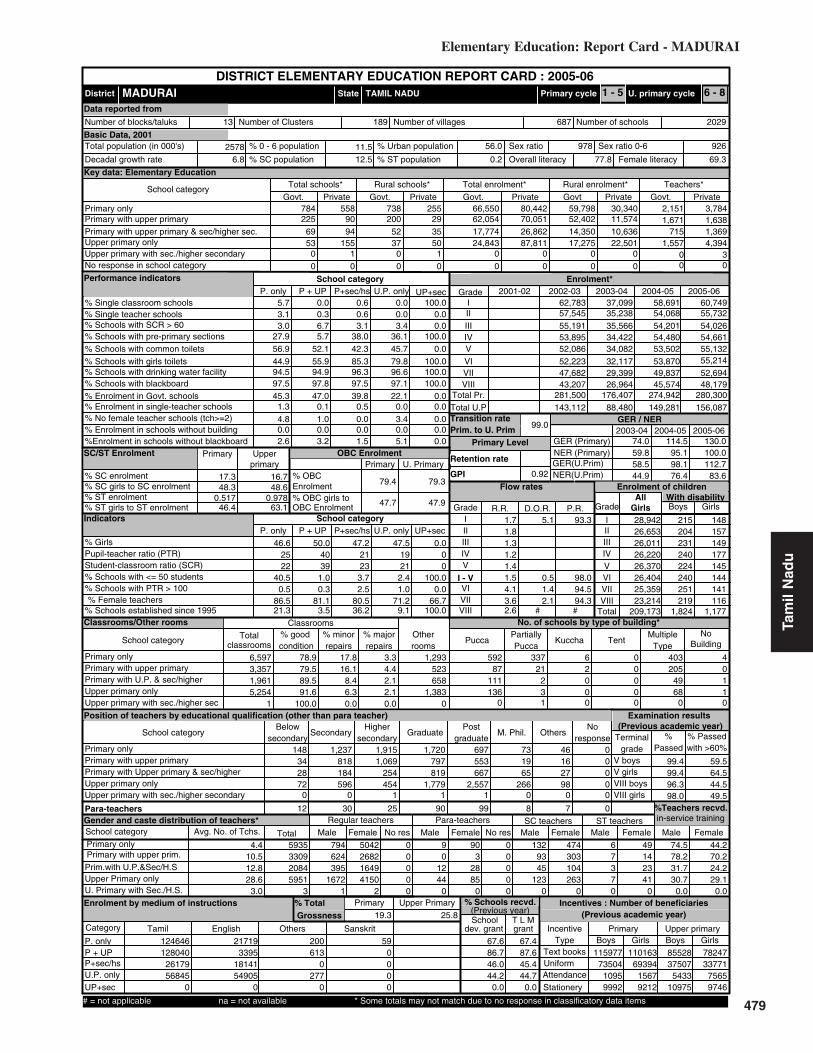
479
Elementary Education: Report Card - MADURAI
Tam
il N
adu
0.9780.517
17.3 16.7
Key data: Elementary Education
2578
MADURAI
(Previous academic year)
(Previous year)
Gender and caste distribution of teachers*
No. of schools by type of building*
BoysWith disability
Flow rates
Primary Level
Enrolment*
Number of schools
Grade
GER / NER
School category
Primary Upper primaryBoys Boys GirlsGirls
IncentiveType
School categoryMultiple
TypeKuccha
PartiallyPucca
PuccaTotal % good condition
Otherrooms
TentNo
Building
Classrooms
Belowsecondary
Highersecondary
Postgraduate
M. Phil.GraduateSecondarySchool category OthersNo
response
ST teachers
Total Male Female No res Male Female No res Male Female Male FemaleSC teachers
Text booksUniformAttendanceStationery
% Passed
Avg. No. of Tchs.
%
Female literacyOverall literacy
dev. grant grantSchool T L M
Male Female
IVV
IIIIII
Grade R.R. D.O.R. P.R.
VIIVI
# #
I - V
Enrolment by medium of instructions
Examination results
Retention rate
GPI
Primary cycle U. primary cycleState
DISTRICT ELEMENTARY EDUCATION REPORT CARD : 2005-06
GirlsGrade
IIIIIIIVVVI
VIII
AllGirls
Total
VII
% TotalGrossness
School category
2256953
0
90 20094 52
1551
370
0 0 0
784 55829 62,05435 17,77450 24,843
1 00 0
738 255 59,798 30,34070,051 52,402 11,57426,862 14,350 10,63687,811 17,275 22,501
0 0 00 0 0
66,550 80,442 2,1511,671
3,7841,638
P + UP P+sec/hs U.P. only UP+sec
School categoryP. only
5.7 0.0 0.6 0.0 100.03.1
Number of Clusters 2029687
% Schools with SCR > 600.3 0.6 0.0 0.0
3.0 6.7 3.1 3.4 0.0% Schools with pre-primary sections 27.9 5.7 38.0 36.1 100.0% Schools with common toilets 56.9 52.1 42.3 45.7 0.0
% Schools with girls toilets 44.9 55.9 85.3 79.8 100.0% Schools with drinking water facility 94.5 94.9 96.3 96.6 100.0
% Enrolment in Govt. schools 45.3 47.0 39.8 22.1 0.097.5 97.8 97.5 97.1 100.0
% No female teacher schools (tch>=2) 4.8 1.0 0.0 3.4 0.01.3 0.1 0.5 0.0 0.0
0.0 0.0 0.0 0.0 0.0%Enrolment in schools without blackboard 2.6 3.2 1.5 5.1 0.0
2001-02 2002-03 2003-04 2004-05 2005-06IIIIIIIVV
VIVII
Total U.P
60,74955,73254,02654,66155,13255,214
52,694
58,69154,06854,20154,48053,502
53,87049,837
37,09935,23835,56634,42234,082
32,11729,399
62,78357,54555,19153,89552,086
52,22347,682
156,087149,28188,480143,112
74.0
58.5
114.5
98.1
130.0
112.7
47.2
3.72.5
28,94226,65326,01126,22026,37026,40425,35923,214
209,173
215204231240224240251219
1,824
148157149177145144141116
1,177
6,597
classrooms
3,3571,9615,254
1
78.979.589.591.6
100.0
17.816.1
3.3
8.46.30.0
4.42.12.10.0
523658
1,3830
1,293 592 337 6 0 403 487 21 2 0 205 0
111 2 0 0 49 1136 3 0 0 68 1
0 1 0 0 0 0
148 1,237 1,915 1,720 697 73 4634 818 1,069 797 553 19 16 028 184 254 819 667 65 27 072 596 454 1,779 2,557 266 98 0
0 0 1 1 1 0 0 0
12 30 25 90 99 8 7 0
794624395
16721
268216494150
2
5042 0 9 90 0 132 474 6 490000
01244
0
32885
0
0000
9345
1230
303104263
0
7370
142341
0
Terminalgrade Passed
VIII boysV girlsV boys
VIII girls
0 with >60%
74.55935330920845951
3
78.231.730.7
0.0
44.270.224.229.1
0.0
124646Tamil English Others Sanskrit
1280402617956845
0
217193395
1814154905
0
200613
0277
0
590000
% Schools recvd.
67.686.746.044.2
0.0
67.487.645.444.7
0.0
11597773504
10959992
8552837507
543310975
11016369394
15679212
7824733771
75659746
4.410.512.828.6
3.0
1.71.81.31.2
4.13.62.6
1.41.5
99.0
0.92
2005-062004-052003-04
TAMIL NADU
80.5
Upper PrimaryPrimary
Sex ratio Sex ratio 0-6
13 189
VIII36.2
Enrolment of children
VIII 43,207 26,964 45,574 48,179Total Pr. 281,500 176,407 274,942 280,300
1 - 5 6 - 8
1,557 4,3940 30 0
715 1,369
%Teachers recvd.in-service training
Total schools* Rural schools* Total enrolment* Rural enrolment* Teachers*
19.3 25.8
100.0
83.6
59.8 95.1
44.9 76.4% SC enrolment% SC girls to SC enrolment% ST enrolment
48.3 48.6
46.4 63.1
79.4
47.7
79.3
47.9
Position of teachers by educational qualification (other than para teacher)
(Previous academic year)Incentives : Number of beneficiaries
% ST girls to ST enrolment
% Girls
Number of villages
% 0 - 6 population
% SC population % ST population
% Urban population
% Schools with blackboard
% Enrolment in single-teacher schools
% Enrolment in schools without building
Primary Upperprimary
OBC EnrolmentPrimary U. Primary
% OBCEnrolment% OBC girls toOBC Enrolment
Pupil-teacher ratio (PTR)Student-classroom ratio (SCR)% Schools with <= 50 students% Schools with PTR > 100% Female teachers
% Schools established since 1995
Regular teachers Para-teachers
% minorrepairs
% majorrepairs
# = not applicable na = not available * Some totals may not match due to no response in classificatory data items
5.1 93.3
0.5 98.01.4 94.52.1 94.3
2321
46.62522
40.50.5
86.521.3
50.04039
1.00.3
81.13.5
47.51921
2.41.0
71.29.1
0.000
100.00.0
66.7100.0
6.8 12.5 0.2 77.8 69.3
92697856.011.5
Category
PrivateGovt.PrivateGovtPrivateGovt.PrivateGovt.PrivateGovt.
Total population (in 000's)
Number of blocks/taluks
District
Decadal growth rate
Primary onlyPrimary with upper primaryPrimary with upper primary & sec/higher sec.Upper primary onlyUpper primary with sec./higher secondary
% Single classroom schools% Single teacher schools
P + UP P+sec/hs U.P. only UP+secP. only
No response in school category
Primary with upper primaryPrimary with U.P. & sec/higherUpper primary onlyUpper primary with sec./higher sec
Primary only
Primary onlyPrimary with upper primaryPrimary with Upper primary & sec/higherUpper primary only
Para-teachers
School category
Upper primary with sec./higher secondary
Primary onlyPrimary with upper prim.
P. onlyP + UPP+sec/hsU.P. onlyUP+sec
NER(U.Prim)GER(U.Prim)NER (Primary)GER (Primary)
Transition ratePrim. to U. Prim
SC/ST Enrolment
Indicators
Classrooms/Other rooms
Prim.with U.P.&Sec/H.SUpper Primary onlyU. Primary with Sec./H.S.
Basic Data, 2001
Data reported from
Performance indicators
99.4 59.599.4 64.596.3 44.598.0 49.5
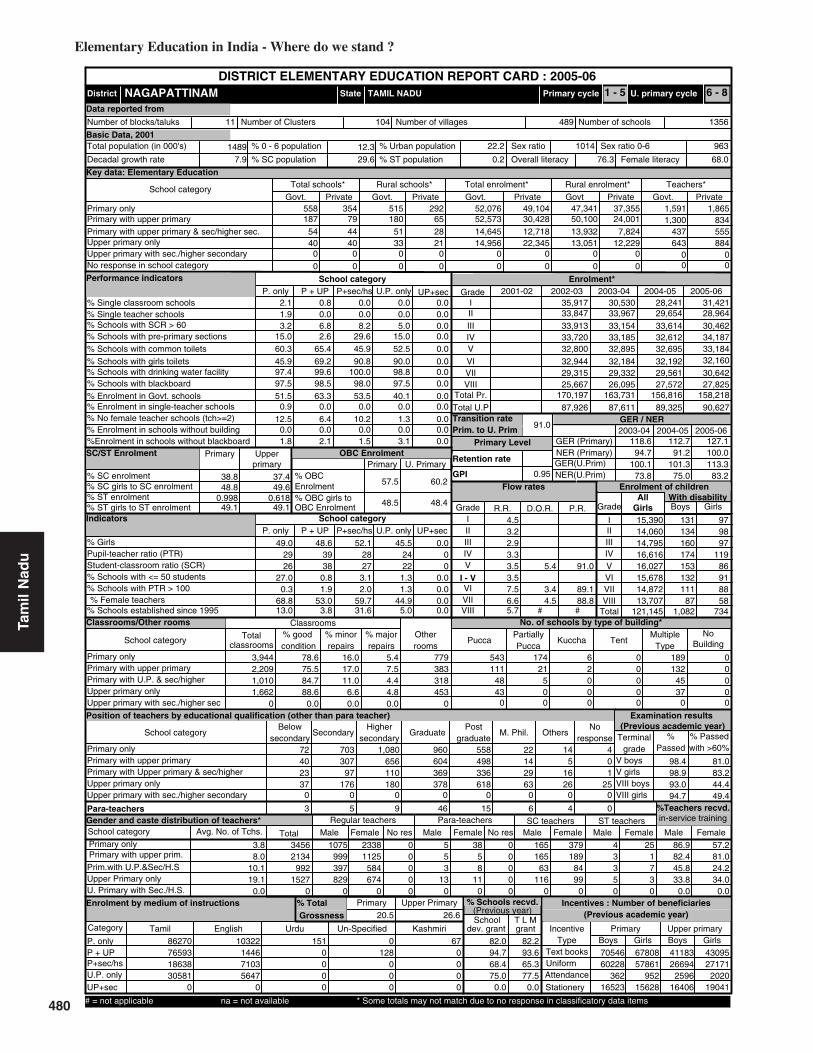
480
Elementary Education in India - Where do we stand ?
0.6180.998
38.8 37.4
Key data: Elementary Education
1489
NAGAPATTINAM
(Previous academic year)
(Previous year)
Gender and caste distribution of teachers*
No. of schools by type of building*
BoysWith disability
Flow rates
Primary Level
Enrolment*
Number of schools
Grade
GER / NER
School category
Primary Upper primaryBoys Boys GirlsGirls
IncentiveType
School categoryMultiple
TypeKuccha
PartiallyPucca
PuccaTotal % good condition
Otherrooms
TentNo
Building
Classrooms
Belowsecondary
Highersecondary
Postgraduate
M. Phil.GraduateSecondarySchool category OthersNo
response
ST teachers
Total Male Female No res Male Female No res Male Female Male FemaleSC teachers
Text booksUniformAttendanceStationery
% Passed
Avg. No. of Tchs.
%
Female literacyOverall literacy
dev. grant grantSchool T L M
Male Female
IVV
IIIIII
Grade R.R. D.O.R. P.R.
VIIVI
# #
I - V
Enrolment by medium of instructions
Examination results
Retention rate
GPI
Primary cycle U. primary cycleState
DISTRICT ELEMENTARY EDUCATION REPORT CARD : 2005-06
GirlsGrade
IIIIIIIVVVI
VIII
AllGirls
Total
VII
% TotalGrossness
School category
1875440
0
79 18044 5140
033
00 0 0
558 35465 52,57328 14,64521 14,956
0 00 0
515 292 47,341 37,35530,428 50,100 24,00112,718 13,932 7,82422,345 13,051 12,229
0 0 00 0 0
52,076 49,104 1,5911,300
1,865834
P + UP P+sec/hs U.P. only UP+sec
School categoryP. only
2.1 0.8 0.0 0.0 0.01.9
Number of Clusters 1356489
% Schools with SCR > 600.0 0.0 0.0 0.0
3.2 6.8 8.2 5.0 0.0% Schools with pre-primary sections 15.0 2.6 29.6 15.0 0.0% Schools with common toilets 60.3 65.4 45.9 52.5 0.0
% Schools with girls toilets 45.9 69.2 90.8 90.0 0.0% Schools with drinking water facility 97.4 99.6 100.0 98.8 0.0
% Enrolment in Govt. schools 51.5 63.3 53.5 40.1 0.097.5 98.5 98.0 97.5 0.0
% No female teacher schools (tch>=2) 12.5 6.4 10.2 1.3 0.00.9 0.0 0.0 0.0 0.0
0.0 0.0 0.0 0.0 0.0%Enrolment in schools without blackboard 1.8 2.1 1.5 3.1 0.0
2001-02 2002-03 2003-04 2004-05 2005-06IIIIIIIVV
VIVII
Total U.P
31,42128,96430,46234,18733,18432,160
30,642
28,24129,65433,61432,61232,695
32,19229,561
30,53033,96733,15433,18532,895
32,18429,332
35,91733,84733,91333,72032,800
32,94429,315
90,62789,32587,61187,926
118.6
100.1
112.7
101.3
127.1
113.3
52.1
3.12.0
15,39014,06014,79516,61616,02715,67814,87213,707
121,145
131134160174153132111
871,082
979897
11986918858
734
3,944
classrooms
2,2091,0101,662
0
78.675.584.788.6
0.0
16.017.0
5.4
11.06.60.0
7.54.44.80.0
383318453
0
779 543 174 6 0 189 0111 21 2 0 132 0
48 5 0 0 45 043 0 0 0 37 0
0 0 0 0 0 0
72 703 1,080 960 558 22 1440 307 656 604 498 14 5 023 97 110 369 336 29 16 137 176 180 378 618 63 26 25
0 0 0 0 0 0 0 0
3 5 9 46 15 6 4 0
1075999397829
0
1125584674
0
2338 0 5 38 0 165 379 4 250000
53
130
58
110
0000
16563
1160
1898499
0
3350
1730
Terminalgrade Passed
VIII boysV girlsV boys
VIII girls
4 with >60%
86.934562134
9921527
0
82.445.833.8
0.0
57.281.024.234.0
0.0
86270Tamil English Urdu Un-Specified Kashmiri
765931863830581
0
10322144671035647
0
1510000
0128
000
670000
% Schools recvd.
82.094.768.475.0
0.0
82.293.665.377.5
0.0
7054660228
36216523
4118326694
259616406
6780857861
95215628
4309527171
202019041
3.88.0
10.119.1
0.0
4.53.22.93.3
7.56.65.7
3.53.5
91.0
0.95
2005-062004-052003-04
TAMIL NADU
59.7
Upper PrimaryPrimary
Sex ratio Sex ratio 0-6
11 104
VIII31.6
Enrolment of children
VIII 25,667 26,095 27,572 27,825Total Pr. 170,197 163,731 156,816 158,218
1 - 5 6 - 8
643 8840 00 0
437 555
%Teachers recvd.in-service training
Total schools* Rural schools* Total enrolment* Rural enrolment* Teachers*
20.5 26.6
100.0
83.2
94.7 91.2
73.8 75.0% SC enrolment% SC girls to SC enrolment% ST enrolment
48.8 49.6
49.1 49.1
57.5
48.5
60.2
48.4
Position of teachers by educational qualification (other than para teacher)
(Previous academic year)Incentives : Number of beneficiaries
% ST girls to ST enrolment
% Girls
Number of villages
% 0 - 6 population
% SC population % ST population
% Urban population
% Schools with blackboard
% Enrolment in single-teacher schools
% Enrolment in schools without building
Primary Upperprimary
OBC EnrolmentPrimary U. Primary
% OBCEnrolment% OBC girls toOBC Enrolment
Pupil-teacher ratio (PTR)Student-classroom ratio (SCR)% Schools with <= 50 students% Schools with PTR > 100% Female teachers
% Schools established since 1995
Regular teachers Para-teachers
% minorrepairs
% majorrepairs
# = not applicable na = not available * Some totals may not match due to no response in classificatory data items
5.4 91.0
3.4 89.14.5 88.8
2728
49.02926
27.00.3
68.813.0
48.63938
0.81.9
53.03.8
45.52422
1.31.3
44.95.0
0.000
0.00.00.00.0
7.9 29.6 0.2 76.3 68.0
963101422.212.3
Category
PrivateGovt.PrivateGovtPrivateGovt.PrivateGovt.PrivateGovt.
Total population (in 000's)
Number of blocks/taluks
District
Decadal growth rate
Primary onlyPrimary with upper primaryPrimary with upper primary & sec/higher sec.Upper primary onlyUpper primary with sec./higher secondary
% Single classroom schools% Single teacher schools
P + UP P+sec/hs U.P. only UP+secP. only
No response in school category
Primary with upper primaryPrimary with U.P. & sec/higherUpper primary onlyUpper primary with sec./higher sec
Primary only
Primary onlyPrimary with upper primaryPrimary with Upper primary & sec/higherUpper primary only
Para-teachers
School category
Upper primary with sec./higher secondary
Primary onlyPrimary with upper prim.
P. onlyP + UPP+sec/hsU.P. onlyUP+sec
NER(U.Prim)GER(U.Prim)NER (Primary)GER (Primary)
Transition ratePrim. to U. Prim
SC/ST Enrolment
Indicators
Classrooms/Other rooms
Prim.with U.P.&Sec/H.SUpper Primary onlyU. Primary with Sec./H.S.
Basic Data, 2001
Data reported from
Performance indicators
98.4 81.098.9 83.293.0 44.494.7 49.4
Tam
il N
adu

481
Elementary Education: Report Card - NAMAKKAL
Tam
il N
adu
23.3 21.7
Key data: Elementary Education
1493
NAMAKKAL
(Previous academic year)
(Previous year)
Gender and caste distribution of teachers*
No. of schools by type of building*
BoysWith disability
Flow rates
Primary Level
Enrolment*
Number of schools
Grade
GER / NER
School category
Primary Upper primaryBoys Boys GirlsGirls
IncentiveType
School categoryMultiple
TypeKuccha
PartiallyPucca
PuccaTotal % good condition
Otherrooms
TentNo
Building
Classrooms
Belowsecondary
Highersecondary
Postgraduate
M. Phil.GraduateSecondarySchool category OthersNo
response
ST teachers
Total Male Female No res Male Female No res Male Female Male FemaleSC teachers
Text booksUniformAttendanceStationery
% Passed
Avg. No. of Tchs.
%
Female literacyOverall literacy
dev. grant grantSchool T L M
Male Female
IVV
IIIIII
Grade R.R. D.O.R. P.R.
VIIVI
# #
I - V
Enrolment by medium of instructions
Examination results
Retention rate
GPI
Primary cycle U. primary cycleState
DISTRICT ELEMENTARY EDUCATION REPORT CARD : 2005-06
GirlsGrade
IIIIIIIVVVI
VIII
AllGirls
Total
VII
% TotalGrossness
School category
23651
00
116 20754 47
00
00
0 0 0
666 11383 69,84045 9,702
0 00 00 0
632 84 53,810 11,63940,320 54,044 25,53418,642 8,259 14,514
0 0 0
0 0 00 0 0
61,029 18,142 1,9172,809
8422,187
P + UP P+sec/hs U.P. only UP+sec
School categoryP. only
3.3 0.9 6.7 0.0 0.03.5
Number of Clusters 1236332
% Schools with SCR > 600.6 9.5 0.0 0.0
1.8 3.1 5.7 0.0 0.0% Schools with pre-primary sections 9.1 16.2 38.1 0.0 0.0% Schools with common toilets 50.4 50.3 43.8 0.0 0.0
% Schools with girls toilets 34.0 70.5 81.9 0.0 0.0% Schools with drinking water facility 97.8 98.6 88.6 0.0 0.0
% Enrolment in Govt. schools 77.1 63.4 34.2 0.0 0.098.6 97.2 89.5 0.0 0.0
% No female teacher schools (tch>=2) 13.0 3.4 1.9 0.0 0.01.9 0.2 2.5 0.0 0.0
0.0 0.0 0.1 0.0 0.0%Enrolment in schools without blackboard 1.8 2.5 8.0 0.0 0.0
2001-02 2002-03 2003-04 2004-05 2005-06IIIIIIIVV
VIVII
Total U.P
29,19024,95727,16828,85128,37728,388
26,877
25,20127,78529,17628,34927,865
27,92124,348
20,15721,06019,89119,68118,969
17,52017,078
33,65730,48329,62828,76326,870
27,44923,746
79,13276,38449,77370,710
71.3
56.1
97.7
85.0
111.0
98.6
44.5
9.52.9
13,65111,72012,71913,39213,19013,19912,35011,028
101,249
9990
123127129225198154
1,145
5168798558827490
587
3,161
classrooms
5,1171,325
00
71.275.983.9
0.00.0
21.917.2
6.9
13.10.00.0
6.92.90.00.0
1,313409
00
694 239 259 2 0 267 12111 28 0 0 204 9
52 6 1 0 40 60 0 0 0 0 00 0 0 0 0 0
86 674 778 603 540 37 1971 525 600 1,237 2,099 192 88 12331 129 111 470 458 48 14 15
0 0 0 0 0 0 0 00 0 0 0 0 0 0 0
1 1 7 43 49 8 2 0
7951976
42600
2854843
00
1942 5 5 12 0 119 287 15 29105
700
2314
00
3819
00
0000
23868
00
33083
00
18600
2213
00
Terminalgrade Passed
VIII boysV girlsV boys
VIII girls
5 with >60%
82.4275949961309
00
40.929.5
0.00.0
68.141.119.6
0.00.0
73260Tamil English Telugu Urdu Others
8419713422
00
54382398413397
00
881030
22200
29108629
00
160310129
00
% Schools recvd.
87.773.639.0
0.00.0
87.774.742.9
0.00.0
5690240730
2924004
3454415651
68659979
5242937607
15683862
3152814887
39459111
3.514.212.5
0.00.0
1.61.31.21.1
4.23.52.7
1.21.3
97.7
0.88
2005-062004-052003-04
TAMIL NADU
65.9
Upper PrimaryPrimary
Sex ratio Sex ratio 0-6
15 99
VIII49.5
Enrolment of children
VIII 19,515 15,175 24,115 23,867Total Pr. 149,401 99,758 138,376 138,543
1 - 5 6 - 8
0 00 00 0
434 875
%Teachers recvd.in-service training
Total schools* Rural schools* Total enrolment* Rural enrolment* Teachers*
18.7 24.7
90.3
74.2
56.8 80.6
40.9 62.8% SC enrolment% SC girls to SC enrolment% ST enrolment
47.6 45.54.3
46.8 44.6
68.6
46.4
71.8
46.6
Position of teachers by educational qualification (other than para teacher)
(Previous academic year)Incentives : Number of beneficiaries
% ST girls to ST enrolment
% Girls
Number of villages
% 0 - 6 population
% SC population % ST population
% Urban population
% Schools with blackboard
% Enrolment in single-teacher schools
% Enrolment in schools without building
Primary Upperprimary
OBC EnrolmentPrimary U. Primary
% OBCEnrolment% OBC girls toOBC Enrolment
Pupil-teacher ratio (PTR)Student-classroom ratio (SCR)% Schools with <= 50 students% Schools with PTR > 100% Female teachers
% Schools established since 1995
Regular teachers Para-teachers
% minorrepairs
% majorrepairs
# = not applicable na = not available * Some totals may not match due to no response in classificatory data items
0.8 97.62.2 96.51.0 97.80.0 98.91.1 97.71.0 97.72.6 93.21.1 95.4
2122
47.92925
42.10.8
70.811.0
46.02222
5.72.6
57.913.1
0.000
0.00.00.00.0
0.000
0.00.00.00.0
13.1 18.8 3.4 67.4 57.0
88996636.510.2
Category
PrivateGovt.PrivateGovtPrivateGovt.PrivateGovt.PrivateGovt.
Total population (in 000's)
Number of blocks/taluks
District
Decadal growth rate
Primary onlyPrimary with upper primaryPrimary with upper primary & sec/higher sec.Upper primary onlyUpper primary with sec./higher secondary
% Single classroom schools% Single teacher schools
P + UP P+sec/hs U.P. only UP+secP. only
No response in school category
Primary with upper primaryPrimary with U.P. & sec/higherUpper primary onlyUpper primary with sec./higher sec
Primary only
Primary onlyPrimary with upper primaryPrimary with Upper primary & sec/higherUpper primary only
Para-teachers
School category
Upper primary with sec./higher secondary
Primary onlyPrimary with upper prim.
P. onlyP + UPP+sec/hsU.P. onlyUP+sec
NER(U.Prim)GER(U.Prim)NER (Primary)GER (Primary)
Transition ratePrim. to U. Prim
4.1
SC/ST Enrolment
Indicators
Classrooms/Other rooms
Prim.with U.P.&Sec/H.SUpper Primary onlyU. Primary with Sec./H.S.
Basic Data, 2001
Data reported from
Performance indicators
99.1 76.099.3 79.398.1 43.996.7 54.1

482
Elementary Education in India - Where do we stand ?
30.7 28.9
Key data: Elementary Education
494
PERAMBALUR
(Previous academic year)
(Previous year)
Gender and caste distribution of teachers*
No. of schools by type of building*
BoysWith disability
Flow rates
Primary Level
Enrolment*
Number of schools
Grade
GER / NER
School category
Primary Upper primaryBoys Boys GirlsGirls
IncentiveType
School categoryMultiple
TypeKuccha
PartiallyPucca
PuccaTotal % good condition
Otherrooms
TentNo
Building
Classrooms
Belowsecondary
Highersecondary
Postgraduate
M. Phil.GraduateSecondarySchool category OthersNo
response
ST teachers
Total Male Female No res Male Female No res Male Female Male FemaleSC teachers
Text booksUniformAttendanceStationery
% Passed
Avg. No. of Tchs.
%
Female literacyOverall literacy
dev. grant grantSchool T L M
Male Female
IVV
IIIIII
Grade R.R. D.O.R. P.R.
VIIVI
# #
I - V
Enrolment by medium of instructions
Examination results
Retention rate
GPI
Primary cycle U. primary cycleState
DISTRICT ELEMENTARY EDUCATION REPORT CARD : 2005-06
GirlsGrade
IIIIIIIVVVI
VIII
AllGirls
Total
VII
% TotalGrossness
School category
1556458
0
34 15515 6251
056
00 0 0
584 11634 39,28312 14,60436 21,307
0 00 0
570 109 59,142 17,46310,742 39,283 10,742
4,697 14,025 3,43318,453 20,554 12,366
0 0 00 0 0
61,079 21,291 1,7761,001
640287
P + UP P+sec/hs U.P. only UP+sec
School categoryP. only
2.0 0.0 0.0 0.0 0.01.3
Number of Clusters 1077508
% Schools with SCR > 600.0 2.5 0.0 0.0
3.0 4.8 8.9 4.6 0.0% Schools with pre-primary sections 5.3 3.2 3.8 20.2 0.0% Schools with common toilets 50.7 52.4 29.1 56.9 0.0
% Schools with girls toilets 37.1 57.7 70.9 84.4 0.0% Schools with drinking water facility 97.0 96.8 97.5 100.0 0.0
% Enrolment in Govt. schools 74.2 78.5 75.7 53.6 0.0100.0 100.0 100.0 100.0 0.0
% No female teacher schools (tch>=2) 14.1 6.9 12.7 8.3 0.00.9 0.0 2.2 0.0 0.0
0.0 0.0 0.0 0.0 0.0%Enrolment in schools without blackboard 0.0 0.0 0.0 0.0 0.0
2001-02 2002-03 2003-04 2004-05 2005-06IIIIIIIVV
VIVII
Total U.P
25,06522,98022,97324,74124,57525,592
23,451
23,67823,35125,28024,82725,545
25,51923,927
23,78725,12524,72325,41724,683
25,23223,344
26,02924,88125,65625,07925,036
25,38222,340
71,12271,63569,21968,129
238.6
291.6
268.2
47.6
1.36.3
12,14711,11511,20412,11711,85012,15911,26510,39392,250
112122
96144174140101
89978
777079
10898
1069366
697
2,910
classrooms
1,394555
1,9050
74.473.376.977.8
0.0
20.420.2
5.2
19.116.0
0.0
6.54.06.20.0
181176487
0
365 306 161 0 0 233 052 13 0 0 124 036 4 0 0 39 054 3 0 0 52 0
0 0 0 0 0 0
50 629 811 502 391 12 013 152 358 359 369 25 5 1
6 58 70 127 110 9 17 527 142 206 281 306 33 22 1
0 0 0 0 0 0 0 0
1 1 2 16 10 0 5 0
838575182422
0
706215595
0
1557 9 0 12 0 137 267 6 171510
1140
51
110
0000
1534198
0
1414399
0
3350
4330
Terminalgrade Passed
VIII boysV girlsV boys
VIII girls
9 with >60%
90.724161288
4041033
0
78.543.236.6
0.0
80.877.554.635.0
0.0
79057Tamil English
488871783830725
0
2978113814639035
0
% Schools recvd.
94.194.782.365.1
0.0
93.796.387.365.1
0.0
5751949253
58910587
4695622919
394713008
5569747671
167016508
4695021945
289814297
3.56.85.19.50.0
0.70.70.60.7
4.53.33.0
1.00.8
95.6
0.94
2005-062004-052003-04
TAMIL NADU
53.5
Upper PrimaryPrimary
Sex ratio Sex ratio 0-6
10 110
VIII35.4
Enrolment of children
VIII 20,407 20,643 22,189 22,079Total Pr. 126,681 123,735 122,681 120,334
1 - 5 6 - 8
505 5280 00 0
308 96
%Teachers recvd.in-service training
Total schools* Rural schools* Total enrolment* Rural enrolment* Teachers*
20.3 26.5
100.0
100.0% SC enrolment% SC girls to SC enrolment% ST enrolment
49.2 48.21.8
49.0 44.2
66.0
48.3
67.8
47.4
Position of teachers by educational qualification (other than para teacher)
(Previous academic year)Incentives : Number of beneficiaries
% ST girls to ST enrolment
% Girls
Number of villages
% 0 - 6 population
% SC population % ST population
% Urban population
% Schools with blackboard
% Enrolment in single-teacher schools
% Enrolment in schools without building
Primary Upperprimary
OBC EnrolmentPrimary U. Primary
% OBCEnrolment% OBC girls toOBC Enrolment
Pupil-teacher ratio (PTR)Student-classroom ratio (SCR)% Schools with <= 50 students% Schools with PTR > 100% Female teachers
% Schools established since 1995
Regular teachers Para-teachers
% minorrepairs
% majorrepairs
# = not applicable na = not available * Some totals may not match due to no response in classificatory data items
2.9 96.31.6 97.72.2 97.21.4 97.93.3 95.62.3 96.96.7 88.87.2 89.5
3548
48.63428
25.60.4
64.96.9
50.23936
0.00.5
55.22.1
45.13821
3.73.7
58.716.5
0.000
0.00.00.00.0
8.0 30.2 0.7 66.1 54.4
937100616.012.3
Category
PrivateGovt.PrivateGovtPrivateGovt.PrivateGovt.PrivateGovt.
Total population (in 000's)
Number of blocks/taluks
District
Decadal growth rate
Primary onlyPrimary with upper primaryPrimary with upper primary & sec/higher sec.Upper primary onlyUpper primary with sec./higher secondary
% Single classroom schools% Single teacher schools
P + UP P+sec/hs U.P. only UP+secP. only
No response in school category
Primary with upper primaryPrimary with U.P. & sec/higherUpper primary onlyUpper primary with sec./higher sec
Primary only
Primary onlyPrimary with upper primaryPrimary with Upper primary & sec/higherUpper primary only
Para-teachers
School category
Upper primary with sec./higher secondary
Primary onlyPrimary with upper prim.
P. onlyP + UPP+sec/hsU.P. onlyUP+sec
NER(U.Prim)GER(U.Prim)NER (Primary)GER (Primary)
Transition ratePrim. to U. Prim
1.3
SC/ST Enrolment
Indicators
Classrooms/Other rooms
Prim.with U.P.&Sec/H.SUpper Primary onlyU. Primary with Sec./H.S.
Basic Data, 2001
Data reported from
Performance indicators
99.8 55.799.9 59.694.3 40.294.8 41.8
Tam
il N
adu

483
Elementary Education: Report Card - PUDUKKOTTAI
Tam
il N
adu
0.7830.588
20.1 20.5
Key data: Elementary Education
1460
PUDUKKOTTAI
(Previous academic year)
(Previous year)
Gender and caste distribution of teachers*
No. of schools by type of building*
BoysWith disability
Flow rates
Primary Level
Enrolment*
Number of schools
Grade
GER / NER
School category
Primary Upper primaryBoys Boys GirlsGirls
IncentiveType
School categoryMultiple
TypeKuccha
PartiallyPucca
PuccaTotal % good condition
Otherrooms
TentNo
Building
Classrooms
Belowsecondary
Highersecondary
Postgraduate
M. Phil.GraduateSecondarySchool category OthersNo
response
ST teachers
Total Male Female No res Male Female No res Male Female Male FemaleSC teachers
Text booksUniformAttendanceStationery
% Passed
Avg. No. of Tchs.
%
Female literacyOverall literacy
dev. grant grantSchool T L M
Male Female
IVV
IIIIII
Grade R.R. D.O.R. P.R.
VIIVI
# #
I - V
Enrolment by medium of instructions
Examination results
Retention rate
GPI
Primary cycle U. primary cycleState
DISTRICT ELEMENTARY EDUCATION REPORT CARD : 2005-06
GirlsGrade
IIIIIIIVVVI
VIII
AllGirls
Total
VII
% TotalGrossness
School category
2918363
0
43 28233 7835
057
00 0 0
1,032 21729 56,94324 18,68622 22,563
0 00 0
1,019 166 72,419 16,35917,340 54,020 10,620
8,612 17,270 6,51816,331 20,809 9,028
0 0 00 0 0
74,698 21,710 1,8521,117
795364
P + UP P+sec/hs U.P. only UP+sec
School categoryP. only
15.9 0.9 5.2 0.0 0.017.3
Number of Clusters 1797548
% Schools with SCR > 6010.2 9.5 1.0 0.0
3.9 10.8 14.7 3.1 0.0% Schools with pre-primary sections 12.3 3.9 14.7 16.3 0.0% Schools with common toilets 54.5 47.3 39.7 49.0 0.0
% Schools with girls toilets 33.5 50.0 73.3 78.6 0.0% Schools with drinking water facility 95.5 96.7 90.5 96.9 0.0
% Enrolment in Govt. schools 77.5 76.7 68.5 58.0 0.0100.0 100.0 100.0 100.0 0.0
% No female teacher schools (tch>=2) 9.6 8.1 3.4 0.0 0.012.3 8.7 7.8 0.6 0.0
0.0 0.0 0.0 0.0 0.0%Enrolment in schools without blackboard 0.0 0.0 0.0 0.0 0.0
2001-02 2002-03 2003-04 2004-05 2005-06IIIIIIIVV
VIVII
Total U.P
31,53027,89628,24130,11530,81730,760
29,893
27,93428,01029,78030,56530,797
31,06629,300
28,65229,86930,69930,78930,303
30,45129,443
28,87528,76829,13428,61328,209
31,60129,276
88,28488,34486,47287,146
110.8
100.5
107.4
101.7
121.8
112.6
51.6
0.911.2
15,28113,65713,80714,74814,89014,86714,52213,388
115,160
166121155215252267278252
1,706
119100127142173214233230
1,338
4,037
classrooms
2,092843
1,8390
75.675.179.076.7
0.0
19.117.7
5.4
12.514.5
0.0
7.28.58.80.0
240265418
0
547 553 329 26 0 341 085 24 0 0 225 058 7 5 0 46 038 2 0 0 58 0
0 0 0 0 0 0
57 489 976 680 385 28 721 168 466 380 385 30 15 0
2 52 97 260 275 26 15 115 130 148 448 827 97 10 1
0 0 0 0 0 0 0 0
3 6 18 20 10 1 0 0
868549352877
0
916375798
0
1754 0 5 20 0 151 285 3 150110
4570
12230
0000
9661
1710
11355
1000
2010
5220
Terminalgrade Passed
VIII boysV girlsV boys
VIII girls
0 with >60%
87.526471481
7351686
0
81.646.838.5
0.0
68.274.143.842.1
0.0
87411Tamil English Telugu Others
721482355329713
0
8997213537459041
0
167171
000
2310000
% Schools recvd.
86.194.977.678.6
0.0
86.595.579.377.6
0.0
7066260085
5996985
5946638030
352310707
6863659439
10756864
5648634628
481511385
2.14.46.3
17.20.0
0.60.50.50.5
2.92.82.6
0.70.5
97.0
0.95
2005-062004-052003-04
TAMIL NADU
51.3
Upper PrimaryPrimary
Sex ratio Sex ratio 0-6
13 147
VIII48.3
Enrolment of children
VIII 26,269 26,578 27,978 27,631Total Pr. 143,599 150,312 147,086 148,599
1 - 5 6 - 8
1,147 5390 00 0
522 213
%Teachers recvd.in-service training
Total schools* Rural schools* Total enrolment* Rural enrolment* Teachers*
19.3 26.2
98.2
83.1
89.4 87.8
73.3 76.8% SC enrolment% SC girls to SC enrolment% ST enrolment
48.8 48.9
45.8 49.2
78.3
48.7
77.4
48.5
Position of teachers by educational qualification (other than para teacher)
(Previous academic year)Incentives : Number of beneficiaries
% ST girls to ST enrolment
% Girls
Number of villages
% 0 - 6 population
% SC population % ST population
% Urban population
% Schools with blackboard
% Enrolment in single-teacher schools
% Enrolment in schools without building
Primary Upperprimary
OBC EnrolmentPrimary U. Primary
% OBCEnrolment% OBC girls toOBC Enrolment
Pupil-teacher ratio (PTR)Student-classroom ratio (SCR)% Schools with <= 50 students% Schools with PTR > 100% Female teachers
% Schools established since 1995
Regular teachers Para-teachers
% minorrepairs
% majorrepairs
# = not applicable na = not available * Some totals may not match due to no response in classificatory data items
0.1 99.4
2.4 97.0
3.5 93.65.4 91.8
3237
49.03624
42.82.7
67.016.7
49.75036
0.612.962.7
4.8
43.72321
1.05.1
47.58.2
0.000
0.00.00.00.0
9.4 17.1 0.1 71.1 60.0
955101517.012.6
Category
PrivateGovt.PrivateGovtPrivateGovt.PrivateGovt.PrivateGovt.
Total population (in 000's)
Number of blocks/taluks
District
Decadal growth rate
Primary onlyPrimary with upper primaryPrimary with upper primary & sec/higher sec.Upper primary onlyUpper primary with sec./higher secondary
% Single classroom schools% Single teacher schools
P + UP P+sec/hs U.P. only UP+secP. only
No response in school category
Primary with upper primaryPrimary with U.P. & sec/higherUpper primary onlyUpper primary with sec./higher sec
Primary only
Primary onlyPrimary with upper primaryPrimary with Upper primary & sec/higherUpper primary only
Para-teachers
School category
Upper primary with sec./higher secondary
Primary onlyPrimary with upper prim.
P. onlyP + UPP+sec/hsU.P. onlyUP+sec
NER(U.Prim)GER(U.Prim)NER (Primary)GER (Primary)
Transition ratePrim. to U. Prim
SC/ST Enrolment
Indicators
Classrooms/Other rooms
Prim.with U.P.&Sec/H.SUpper Primary onlyU. Primary with Sec./H.S.
Basic Data, 2001
Data reported from
Performance indicators
99.7 66.599.7 69.597.0 40.897.4 44.3

484
Elementary Education in India - Where do we stand ?
0.6420.337
22.0 20.8
Key data: Elementary Education
1188
RAMANATHAPURAM
(Previous academic year)
(Previous year)
Gender and caste distribution of teachers*
No. of schools by type of building*
BoysWith disability
Flow rates
Primary Level
Enrolment*
Number of schools
Grade
GER / NER
School category
Primary Upper primaryBoys Boys GirlsGirls
IncentiveType
School categoryMultiple
TypeKuccha
PartiallyPucca
PuccaTotal % good condition
Otherrooms
TentNo
Building
Classrooms
Belowsecondary
Highersecondary
Postgraduate
M. Phil.GraduateSecondarySchool category OthersNo
response
ST teachers
Total Male Female No res Male Female No res Male Female Male FemaleSC teachers
Text booksUniformAttendanceStationery
% Passed
Avg. No. of Tchs.
%
Female literacyOverall literacy
dev. grant grantSchool T L M
Male Female
IVV
IIIIII
Grade R.R. D.O.R. P.R.
VIIVI
# #
I - V
Enrolment by medium of instructions
Examination results
Retention rate
GPI
Primary cycle U. primary cycleState
DISTRICT ELEMENTARY EDUCATION REPORT CARD : 2005-06
GirlsGrade
IIIIIIIVVVI
VIII
AllGirls
Total
VII
% TotalGrossness
School category
1784036
0
63 17343 3946
033
00 0 0
770 27349 36,07430 8,85826 13,071
0 00 0
755 216 49,831 24,79320,038 34,696 13,64012,628 8,434 7,98629,239 12,061 12,532
0 0 00 0 0
51,349 39,499 1,609730
1,309490
P + UP P+sec/hs U.P. only UP+sec
School categoryP. only
46.8 6.6 1.2 0.0 0.017.6
Number of Clusters 14491076
% Schools with SCR > 604.1 3.6 1.2 0.0
12.8 28.6 10.8 2.4 0.0% Schools with pre-primary sections 14.1 10.4 27.7 25.6 0.0% Schools with common toilets 57.3 68.0 60.2 56.1 0.0
% Schools with girls toilets 31.7 60.2 92.8 85.4 0.0% Schools with drinking water facility 94.7 97.1 92.8 95.1 0.0
% Enrolment in Govt. schools 56.5 64.3 41.2 30.9 0.098.6 97.9 91.6 98.8 0.0
% No female teacher schools (tch>=2) 8.3 10.0 4.8 3.7 0.08.4 1.9 2.9 1.5 0.0
0.0 0.0 0.0 0.0 0.0%Enrolment in schools without blackboard 1.7 3.6 6.4 1.1 0.0
2001-02 2002-03 2003-04 2004-05 2005-06IIIIIIIVV
VIVII
Total U.P
29,16125,04026,23026,88126,90529,313
24,726
25,13525,67226,60326,88527,107
25,95223,483
25,66925,65525,64625,78625,349
24,16623,280
28,48126,09425,95625,63724,739
23,94222,353
17,06315,79315,63815,56015,205
16,11014,504
76,53971,25468,64566,00143,806
116.9
98.8
119.2
102.0
135.2
120.0
49.6
1.28.4
14,21812,17912,66413,10013,08513,83211,90310,914
101,895
98114121127117145111109942
65697990
116998765
670
2,926
classrooms
1,333787
2,0330
70.875.080.386.6
0.0
20.019.1
9.1
15.06.60.0
5.94.76.80.0
247266518
0
591 453 391 0 0 199 077 27 0 0 137 036 5 0 0 42 035 0 0 0 47 0
0 0 0 0 0 0
79 718 1,283 583 228 4 529 225 411 303 220 13 14 012 62 100 206 140 5 5 013 149 201 251 215 17 9 7
0 0 0 0 0 0 0 0
3 9 8 13 5 1 0 0
818419209344
0
796321511
0
2082 1 1 16 0 151 265 9 230070
2300
313
10
0000
1082643
0
1223266
0
4050
4130
Terminalgrade Passed
VIII boysV girlsV boys
VIII girls
1 with >60%
84.129181220
546863
0
68.444.840.4
0.0
66.760.729.329.3
0.0
87062Tamil English Others
528631660730152
0
3395173936498172
0
4256
8900
% Schools recvd.
86.590.566.375.6
0.0
87.789.672.378.0
0.0
5803845303
15064578
3957219718
26735284
5497343482
13614108
3444018893
26624732
2.85.16.6
10.50.0
2.01.31.21.1
7.16.86.4
1.41.4
100.0
100.0
0.95
2005-062004-052003-04
TAMIL NADU
61.2
Upper PrimaryPrimary
Sex ratio Sex ratio 0-6
13 124
VIII31.3
Enrolment of children
13,192VIII 19,706 21,199 21,819 22,500Total Pr. 79,259 130,907 128,105 131,402 134,217
1 - 5 6 - 8
308 5550 00 0
210 336
%Teachers recvd.in-service training
Total schools* Rural schools* Total enrolment* Rural enrolment* Teachers*
21.4 30.1
100.0
83.9
94.3 97.8
77.8 78.3% SC enrolment% SC girls to SC enrolment% ST enrolment
48.9 48.4
48.2 57.2
73.6
48.4
76.7
47.7
Position of teachers by educational qualification (other than para teacher)
(Previous academic year)Incentives : Number of beneficiaries
% ST girls to ST enrolment
% Girls
Number of villages
% 0 - 6 population
% SC population % ST population
% Urban population
% Schools with blackboard
% Enrolment in single-teacher schools
% Enrolment in schools without building
Primary Upperprimary
OBC EnrolmentPrimary U. Primary
% OBCEnrolment% OBC girls toOBC Enrolment
Pupil-teacher ratio (PTR)Student-classroom ratio (SCR)% Schools with <= 50 students% Schools with PTR > 100% Female teachers
% Schools established since 1995
Regular teachers Para-teachers
% minorrepairs
% majorrepairs
# = not applicable na = not available * Some totals may not match due to no response in classificatory data items
0.3 98.7
3.7 89.13.3 89.9
2739
48.73131
53.51.4
71.913.9
49.44642
1.27.1
65.56.6
45.64921
2.411.059.3
4.9
0.000
0.00.00.00.0
5.7 18.2 0.1 73.0 63.4
964103625.512.6
Category
PrivateGovt.PrivateGovtPrivateGovt.PrivateGovt.PrivateGovt.
Total population (in 000's)
Number of blocks/taluks
District
Decadal growth rate
Primary onlyPrimary with upper primaryPrimary with upper primary & sec/higher sec.Upper primary onlyUpper primary with sec./higher secondary
% Single classroom schools% Single teacher schools
P + UP P+sec/hs U.P. only UP+secP. only
No response in school category
Primary with upper primaryPrimary with U.P. & sec/higherUpper primary onlyUpper primary with sec./higher sec
Primary only
Primary onlyPrimary with upper primaryPrimary with Upper primary & sec/higherUpper primary only
Para-teachers
School category
Upper primary with sec./higher secondary
Primary onlyPrimary with upper prim.
P. onlyP + UPP+sec/hsU.P. onlyUP+sec
NER(U.Prim)GER(U.Prim)NER (Primary)GER (Primary)
Transition ratePrim. to U. Prim
SC/ST Enrolment
Indicators
Classrooms/Other rooms
Prim.with U.P.&Sec/H.SUpper Primary onlyU. Primary with Sec./H.S.
Basic Data, 2001
Data reported from
Performance indicators
96.7 59.396.8 63.093.3 45.095.3 51.2
Tam
il N
adu

485
Elementary Education: Report Card - SALEM
Tam
il N
adu
19.4 19.4
Key data: Elementary Education
3016
SALEM
(Previous academic year)
(Previous year)
Gender and caste distribution of teachers*
No. of schools by type of building*
BoysWith disability
Flow rates
Primary Level
Enrolment*
Number of schools
Grade
GER / NER
School category
Primary Upper primaryBoys Boys GirlsGirls
IncentiveType
School categoryMultiple
TypeKuccha
PartiallyPucca
PuccaTotal % good condition
Otherrooms
TentNo
Building
Classrooms
Belowsecondary
Highersecondary
Postgraduate
M. Phil.GraduateSecondarySchool category OthersNo
response
ST teachers
Total Male Female No res Male Female No res Male Female Male FemaleSC teachers
Text booksUniformAttendanceStationery
% Passed
Avg. No. of Tchs.
%
Female literacyOverall literacy
dev. grant grantSchool T L M
Male Female
IVV
IIIIII
Grade R.R. D.O.R. P.R.
VIIVI
# #
I - V
Enrolment by medium of instructions
Examination results
Retention rate
GPI
Primary cycle U. primary cycleState
DISTRICT ELEMENTARY EDUCATION REPORT CARD : 2005-06
GirlsGrade
IIIIIIIVVVI
VIII
AllGirls
Total
VII
% TotalGrossness
School category
25099
1000
56 226117 83141
078
00 0 0
1,124 26334 74,23171 36,70667 58,235
0 00 0
1,009 136 119,102 17,03118,196 64,359 8,42038,952 29,712 19,78969,539 44,140 21,292
0 0 00 0 0
136,703 46,968 3,5451,645
2,184643
P + UP P+sec/hs U.P. only UP+sec
School categoryP. only
3.2 0.7 0.5 1.2 0.04.8
Number of Clusters 2150599
% Schools with SCR > 601.3 0.0 2.1 0.0
3.8 9.8 7.4 7.9 0.0% Schools with pre-primary sections 41.2 48.7 39.8 36.5 0.0% Schools with common toilets 41.4 43.8 42.1 49.4 0.0
% Schools with girls toilets 34.5 53.6 80.6 76.3 0.0% Schools with drinking water facility 95.7 99.3 94.9 97.9 0.0
% Enrolment in Govt. schools 74.4 80.3 48.5 45.6 0.074.3 78.4 74.1 84.6 0.0
% No female teacher schools (tch>=2) 11.1 7.8 1.9 1.7 0.01.8 0.6 0.0 0.2 0.0
0.0 0.0 0.0 0.0 0.0%Enrolment in schools without blackboard 23.0 20.2 27.1 19.6 0.0
2001-02 2002-03 2003-04 2004-05 2005-06IIIIIIIVV
VIVII
Total U.P
62,09658,43161,54364,53561,22460,555
57,222
57,38061,45964,23261,32161,420
57,50954,667
64,57865,54261,66261,97759,595
56,80952,818
70,98363,15163,34961,26058,698
55,48453,866
171,701162,841160,966153,506
110.2
89.3
105.8
88.9
122.1
106.0
40.4
3.70.5
28,23126,70127,94329,19928,01327,51526,25324,403
218,258
238260331317256273240198
2,113
150148181204168147142118
1,258
6,392
classrooms
2,4852,9164,784
0
75.275.984.383.7
0.0
20.017.0
4.8
11.311.7
0.0
7.04.44.60.0
426969
1,1940
1,436 629 234 2 0 508 13102 15 0 0 189 0126 3 0 0 86 0139 13 0 0 89 0
0 0 0 0 0 0
185 1,239 1,907 1,335 898 42 4671 367 739 547 512 17 16 062 257 296 1,149 951 69 44 065 547 605 1,629 2,023 153 103 0
0 0 0 0 0 0 0 0
13 26 31 90 48 2 3 0
1379744
10041752
0
153318333444
0
4292 0 6 52 0 231 652 31 520000
02334
0
115631
0
0000
132185252
0
196226352
0
111116
0
381933
0
Terminalgrade Passed
VIII boysV girlsV boys
VIII girls
0 with >60%
67.75729228829165261
0
66.022.825.9
0.0
49.158.118.927.8
0.0
164839Tamil English Others Un-Specified
880754598485450
0
179004352
2940941169
0
43508
11550
660
25700
% Schools recvd.
81.886.947.256.0
0.0
81.587.647.258.5
0.0
137923106891
148912646
7735838561
972522621
11874789341
321916297
6074135115
833816962
4.17.5
13.521.8
0.0
1.31.41.21.2
1.31.31.3
1.41.3
97.4
0.84
2005-062004-052003-04
TAMIL NADU
64.8
Upper PrimaryPrimary
Sex ratio Sex ratio 0-6
21 178
VIII38.0
Enrolment of children
VIII 44,156 51,339 50,665 53,924Total Pr. 317,441 313,354 305,812 307,829
1 - 5 6 - 8
2,113 3,1480 00 0
1,116 1,800
%Teachers recvd.in-service training
Total schools* Rural schools* Total enrolment* Rural enrolment* Teachers*
17.7 26.5
100.0
77.9
89.4 87.9
67.2 67.3% SC enrolment% SC girls to SC enrolment% ST enrolment
46.6 46.84.6
47.5 44.4
73.2
45.2
74.5
45.5
Position of teachers by educational qualification (other than para teacher)
(Previous academic year)Incentives : Number of beneficiaries
% ST girls to ST enrolment
% Girls
Number of villages
% 0 - 6 population
% SC population % ST population
% Urban population
% Schools with blackboard
% Enrolment in single-teacher schools
% Enrolment in schools without building
Primary Upperprimary
OBC EnrolmentPrimary U. Primary
% OBCEnrolment% OBC girls toOBC Enrolment
Pupil-teacher ratio (PTR)Student-classroom ratio (SCR)% Schools with <= 50 students% Schools with PTR > 100% Female teachers
% Schools established since 1995
Regular teachers Para-teachers
% minorrepairs
% majorrepairs
# = not applicable na = not available * Some totals may not match due to no response in classificatory data items
0.3 98.51.2 97.4
0.5 98.31.3 97.4
2626
46.13229
25.40.9
75.815.2
44.74037
2.34.2
67.57.8
48.32427
4.60.0
66.116.6
0.000
0.00.00.00.0
16.3 15.8 3.4 65.1 55.2
85192946.111.7
Category
PrivateGovt.PrivateGovtPrivateGovt.PrivateGovt.PrivateGovt.
Total population (in 000's)
Number of blocks/taluks
District
Decadal growth rate
Primary onlyPrimary with upper primaryPrimary with upper primary & sec/higher sec.Upper primary onlyUpper primary with sec./higher secondary
% Single classroom schools% Single teacher schools
P + UP P+sec/hs U.P. only UP+secP. only
No response in school category
Primary with upper primaryPrimary with U.P. & sec/higherUpper primary onlyUpper primary with sec./higher sec
Primary only
Primary onlyPrimary with upper primaryPrimary with Upper primary & sec/higherUpper primary only
Para-teachers
School category
Upper primary with sec./higher secondary
Primary onlyPrimary with upper prim.
P. onlyP + UPP+sec/hsU.P. onlyUP+sec
NER(U.Prim)GER(U.Prim)NER (Primary)GER (Primary)
Transition ratePrim. to U. Prim
3.7
SC/ST Enrolment
Indicators
Classrooms/Other rooms
Prim.with U.P.&Sec/H.SUpper Primary onlyU. Primary with Sec./H.S.
Basic Data, 2001
Data reported from
Performance indicators
99.8 71.899.9 75.894.4 40.293.9 48.3

486
Elementary Education in India - Where do we stand ?
0.0000.000
20.6 22.1
Key data: Elementary Education
1155
SIVAGANGA
(Previous academic year)
(Previous year)
Gender and caste distribution of teachers*
No. of schools by type of building*
BoysWith disability
Flow rates
Primary Level
Enrolment*
Number of schools
Grade
GER / NER
School category
Primary Upper primaryBoys Boys GirlsGirls
IncentiveType
School categoryMultiple
TypeKuccha
PartiallyPucca
PuccaTotal % good condition
Otherrooms
TentNo
Building
Classrooms
Belowsecondary
Highersecondary
Postgraduate
M. Phil.GraduateSecondarySchool category OthersNo
response
ST teachers
Total Male Female No res Male Female No res Male Female Male FemaleSC teachers
Text booksUniformAttendanceStationery
% Passed
Avg. No. of Tchs.
%
Female literacyOverall literacy
dev. grant grantSchool T L M
Male Female
IVV
IIIIII
Grade R.R. D.O.R. P.R.
VIIVI
# #
I - V
Enrolment by medium of instructions
Examination results
Retention rate
GPI
Primary cycle U. primary cycleState
DISTRICT ELEMENTARY EDUCATION REPORT CARD : 2005-06
GirlsGrade
IIIIIIIVVVI
VIII
AllGirls
Total
VII
% TotalGrossness
School category
19030
00
155 18077 28
00
00
0 0 0
771 203123 36,023
67 7,5230 00 00 0
757 163 44,084 19,37455,497 33,183 42,68718,988 6,700 15,300
0 0 0
0 0 00 0 0
45,701 26,652 1,7351,047
9032,035
P + UP P+sec/hs U.P. only UP+sec
School categoryP. only
10.6 0.9 0.9 0.0 0.04.6
Number of Clusters 1426611
% Schools with SCR > 601.2 4.7 0.0 0.0
2.0 7.0 9.3 0.0 0.0% Schools with pre-primary sections 8.2 10.4 16.8 0.0 0.0% Schools with common toilets 54.5 55.7 47.7 0.0 0.0
% Schools with girls toilets 28.3 62.3 77.6 0.0 0.0% Schools with drinking water facility 93.4 96.5 92.5 0.0 0.0
% Enrolment in Govt. schools 63.2 39.4 28.4 0.0 0.097.7 96.8 94.4 0.0 0.0
% No female teacher schools (tch>=2) 10.2 3.2 4.7 0.0 0.02.8 0.2 1.2 0.0 0.0
0.0 0.0 0.0 0.0 0.0%Enrolment in schools without blackboard 1.8 2.6 4.0 0.0 0.0
2001-02 2002-03 2003-04 2004-05 2005-06IIIIIIIVV
VIVII
Total U.P
24,21622,72222,65924,98424,07025,066
23,728
22,99422,46024,46923,33723,871
24,00623,058
23,92325,03723,59724,24723,774
24,04823,078
21,47217,90918,39518,38418,098
18,43317,066
71,73368,98168,13450,618
113.4
101.1
109.7
101.9
122.8
115.6
47.4
6.53.7
11,69811,00210,99112,06511,64611,89911,42011,04091,761
89118134116102110112
77858
6872868173655954
558
3,242
classrooms
3,427891
00
69.281.487.7
0.00.0
23.113.9
7.7
10.40.00.0
4.71.90.00.0
702276
00
693 463 260 3 0 247 1134 36 1 0 174 0
58 10 0 0 39 00 0 0 0 0 00 0 0 0 0 0
38 635 1,109 559 280 7 636 526 714 767 901 82 36 015 101 145 282 276 26 11 0
0 0 0 0 0 0 0 00 0 0 0 0 0 0 0
1 5 4 13 9 1 0 0
6801098
31600
1964540
00
1954 0 0 4 0 125 264 4 160000
10400
10500
0000
15046
00
22055
00
5600
7200
Terminalgrade Passed
VIII boysV girlsV boys
VIII girls
0 with >60%
90.626383082
86500
48.943.4
0.00.0
73.356.433.9
0.00.0
64865Tamil English Others Urdu Bodo
7709518063
00
706013604
822200
288690226
00
0131
000
180000
% Schools recvd.
89.185.873.8
0.00.0
89.486.770.1
0.00.0
5143040790
701904
3598020848
27964074
4802139656
19881822
3274620746
51374380
2.78.98.10.00.0
1.61.31.31.4
3.73.02.4
1.61.4
100.0
0.94
2005-062004-052003-04
TAMIL NADU
63.0
Upper PrimaryPrimary
Sex ratio Sex ratio 0-6
13 110
VIII34.6
Enrolment of children
VIII 15,119 21,008 21,917 22,939Total Pr. 94,258 120,578 117,131 118,651
1 - 5 6 - 8
0 00 00 0
225 640
%Teachers recvd.in-service training
Total schools* Rural schools* Total enrolment* Rural enrolment* Teachers*
16.5 24.5
100.0
87.3
91.4 90.2
75.8 77.4% SC enrolment% SC girls to SC enrolment% ST enrolment
49.1 51.2
0.0 0.0
77.1
48.2
74.9
47.3
Position of teachers by educational qualification (other than para teacher)
(Previous academic year)Incentives : Number of beneficiaries
% ST girls to ST enrolment
% Girls
Number of villages
% 0 - 6 population
% SC population % ST population
% Urban population
% Schools with blackboard
% Enrolment in single-teacher schools
% Enrolment in schools without building
Primary Upperprimary
OBC EnrolmentPrimary U. Primary
% OBCEnrolment% OBC girls toOBC Enrolment
Pupil-teacher ratio (PTR)Student-classroom ratio (SCR)% Schools with <= 50 students% Schools with PTR > 100% Female teachers
% Schools established since 1995
Regular teachers Para-teachers
% minorrepairs
% majorrepairs
# = not applicable na = not available * Some totals may not match due to no response in classificatory data items
0.9 97.5
0.3 96.0
3031
48.92722
54.30.3
74.29.4
47.93027
4.61.4
64.05.2
0.000
0.00.00.00.0
0.000
0.00.00.00.0
4.3 16.3 0.1 72.2 61.7
952103828.211.5
Category
PrivateGovt.PrivateGovtPrivateGovt.PrivateGovt.PrivateGovt.
Total population (in 000's)
Number of blocks/taluks
District
Decadal growth rate
Primary onlyPrimary with upper primaryPrimary with upper primary & sec/higher sec.Upper primary onlyUpper primary with sec./higher secondary
% Single classroom schools% Single teacher schools
P + UP P+sec/hs U.P. only UP+secP. only
No response in school category
Primary with upper primaryPrimary with U.P. & sec/higherUpper primary onlyUpper primary with sec./higher sec
Primary only
Primary onlyPrimary with upper primaryPrimary with Upper primary & sec/higherUpper primary only
Para-teachers
School category
Upper primary with sec./higher secondary
Primary onlyPrimary with upper prim.
P. onlyP + UPP+sec/hsU.P. onlyUP+sec
NER(U.Prim)GER(U.Prim)NER (Primary)GER (Primary)
Transition ratePrim. to U. Prim
SC/ST Enrolment
Indicators
Classrooms/Other rooms
Prim.with U.P.&Sec/H.SUpper Primary onlyU. Primary with Sec./H.S.
Basic Data, 2001
Data reported from
Performance indicators
99.6 53.999.7 58.597.1 39.998.6 43.2
Tam
il N
adu
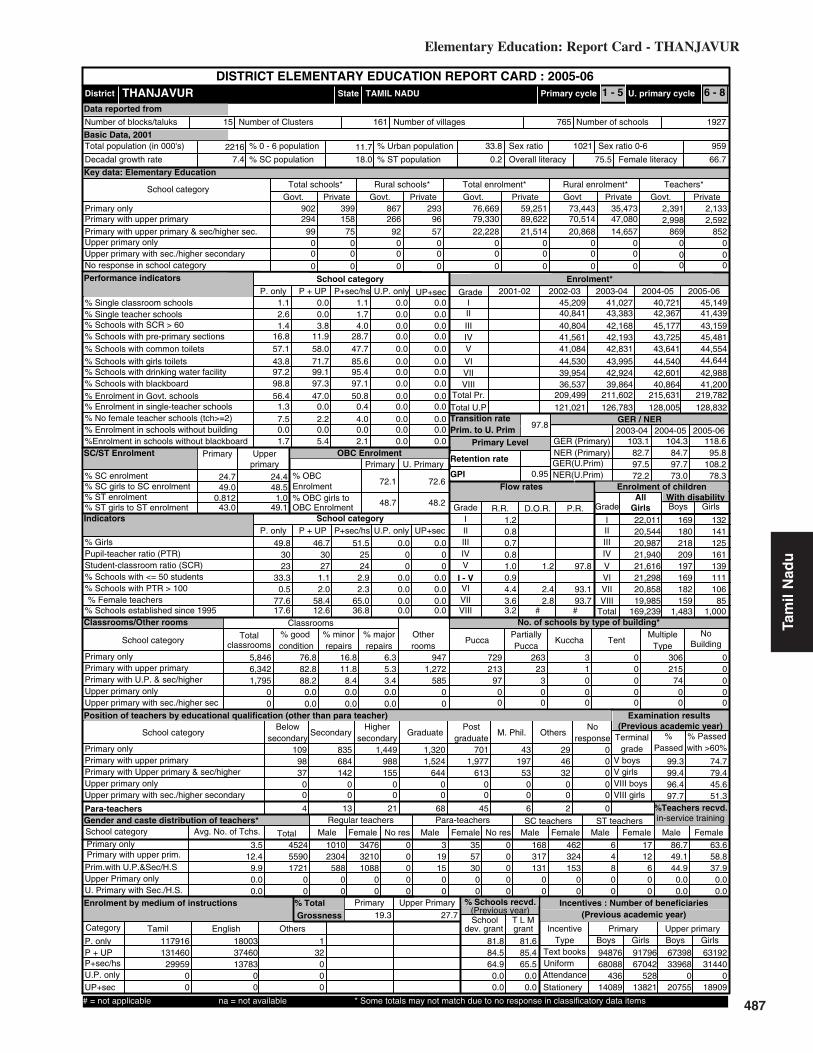
487
Elementary Education: Report Card - THANJAVUR
Tam
il N
adu
0.812
24.7 24.4
Key data: Elementary Education
2216
THANJAVUR
(Previous academic year)
(Previous year)
Gender and caste distribution of teachers*
No. of schools by type of building*
BoysWith disability
Flow rates
Primary Level
Enrolment*
Number of schools
Grade
GER / NER
School category
Primary Upper primaryBoys Boys GirlsGirls
IncentiveType
School categoryMultiple
TypeKuccha
PartiallyPucca
PuccaTotal % good condition
Otherrooms
TentNo
Building
Classrooms
Belowsecondary
Highersecondary
Postgraduate
M. Phil.GraduateSecondarySchool category OthersNo
response
ST teachers
Total Male Female No res Male Female No res Male Female Male FemaleSC teachers
Text booksUniformAttendanceStationery
% Passed
Avg. No. of Tchs.
%
Female literacyOverall literacy
dev. grant grantSchool T L M
Male Female
IVV
IIIIII
Grade R.R. D.O.R. P.R.
VIIVI
# #
I - V
Enrolment by medium of instructions
Examination results
Retention rate
GPI
Primary cycle U. primary cycleState
DISTRICT ELEMENTARY EDUCATION REPORT CARD : 2005-06
GirlsGrade
IIIIIIIVVVI
VIII
AllGirls
Total
VII
% TotalGrossness
School category
29499
00
158 26675 92
00
00
0 0 0
902 39996 79,33057 22,228
0 00 00 0
867 293 73,443 35,47389,622 70,514 47,08021,514 20,868 14,657
0 0 0
0 0 00 0 0
76,669 59,251 2,3912,998
2,1332,592
P + UP P+sec/hs U.P. only UP+sec
School categoryP. only
1.1 0.0 1.1 0.0 0.02.6
Number of Clusters 1927765
% Schools with SCR > 600.0 1.7 0.0 0.0
1.4 3.8 4.0 0.0 0.0% Schools with pre-primary sections 16.8 11.9 28.7 0.0 0.0% Schools with common toilets 57.1 58.0 47.7 0.0 0.0
% Schools with girls toilets 43.8 71.7 85.6 0.0 0.0% Schools with drinking water facility 97.2 99.1 95.4 0.0 0.0
% Enrolment in Govt. schools 56.4 47.0 50.8 0.0 0.098.8 97.3 97.1 0.0 0.0
% No female teacher schools (tch>=2) 7.5 2.2 4.0 0.0 0.01.3 0.0 0.4 0.0 0.0
0.0 0.0 0.0 0.0 0.0%Enrolment in schools without blackboard 1.7 5.4 2.1 0.0 0.0
2001-02 2002-03 2003-04 2004-05 2005-06IIIIIIIVV
VIVII
Total U.P
45,14941,43943,15945,48144,55444,644
42,988
40,72142,36745,17743,72543,641
44,54042,601
41,02743,38342,16842,19342,831
43,99542,924
45,20940,84140,80441,56141,084
44,53039,954
128,832128,005126,783121,021
103.1
97.5
104.3
97.7
118.6
108.2
51.5
2.92.3
22,01120,54420,98721,94021,61621,29820,85819,985
169,239
169180218209197169182159
1,483
132141125161139111106
851,000
5,846
classrooms
6,3421,795
00
76.882.888.2
0.00.0
16.811.8
6.3
8.40.00.0
5.33.40.00.0
1,272585
00
947 729 263 3 0 306 0213 23 1 0 215 0
97 3 0 0 74 00 0 0 0 0 00 0 0 0 0 0
109 835 1,449 1,320 701 43 2998 684 988 1,524 1,977 197 46 037 142 155 644 613 53 32 0
0 0 0 0 0 0 0 00 0 0 0 0 0 0 0
4 13 21 68 45 6 2 0
10102304
58800
32101088
00
3476 0 3 35 0 168 462 6 170000
1915
00
5730
00
0000
317131
00
324153
00
4800
12600
Terminalgrade Passed
VIII boysV girlsV boys
VIII girls
0 with >60%
86.7452455901721
00
49.144.9
0.00.0
63.658.837.9
0.00.0
117916Tamil English Others
13146029959
00
180033746013783
00
132
000
% Schools recvd.
81.884.564.9
0.00.0
81.685.465.5
0.00.0
9487668088
43614089
6739833968
020755
9179667042
52813821
6319231440
018909
3.512.4
9.90.00.0
1.20.80.70.8
4.43.63.2
1.00.9
97.8
0.95
2005-062004-052003-04
TAMIL NADU
65.0
Upper PrimaryPrimary
Sex ratio Sex ratio 0-6
15 161
VIII36.8
Enrolment of children
VIII 36,537 39,864 40,864 41,200Total Pr. 209,499 211,602 215,631 219,782
1 - 5 6 - 8
0 00 00 0
869 852
%Teachers recvd.in-service training
Total schools* Rural schools* Total enrolment* Rural enrolment* Teachers*
19.3 27.7
95.8
78.3
82.7 84.7
72.2 73.0% SC enrolment% SC girls to SC enrolment% ST enrolment
49.0 48.5
43.0 49.1
72.1
48.7
72.6
48.2
Position of teachers by educational qualification (other than para teacher)
(Previous academic year)Incentives : Number of beneficiaries
% ST girls to ST enrolment
% Girls
Number of villages
% 0 - 6 population
% SC population % ST population
% Urban population
% Schools with blackboard
% Enrolment in single-teacher schools
% Enrolment in schools without building
Primary Upperprimary
OBC EnrolmentPrimary U. Primary
% OBCEnrolment% OBC girls toOBC Enrolment
Pupil-teacher ratio (PTR)Student-classroom ratio (SCR)% Schools with <= 50 students% Schools with PTR > 100% Female teachers
% Schools established since 1995
Regular teachers Para-teachers
% minorrepairs
% majorrepairs
# = not applicable na = not available * Some totals may not match due to no response in classificatory data items
1.2 97.8
2.4 93.12.8 93.7
2425
49.83023
33.30.5
77.617.6
46.73027
1.12.0
58.412.6
0.000
0.00.00.00.0
0.000
0.00.00.00.0
7.4 18.0 0.2 75.5 66.7
959102133.811.7
Category
PrivateGovt.PrivateGovtPrivateGovt.PrivateGovt.PrivateGovt.
Total population (in 000's)
Number of blocks/taluks
District
Decadal growth rate
Primary onlyPrimary with upper primaryPrimary with upper primary & sec/higher sec.Upper primary onlyUpper primary with sec./higher secondary
% Single classroom schools% Single teacher schools
P + UP P+sec/hs U.P. only UP+secP. only
No response in school category
Primary with upper primaryPrimary with U.P. & sec/higherUpper primary onlyUpper primary with sec./higher sec
Primary only
Primary onlyPrimary with upper primaryPrimary with Upper primary & sec/higherUpper primary only
Para-teachers
School category
Upper primary with sec./higher secondary
Primary onlyPrimary with upper prim.
P. onlyP + UPP+sec/hsU.P. onlyUP+sec
NER(U.Prim)GER(U.Prim)NER (Primary)GER (Primary)
Transition ratePrim. to U. Prim
1.0
SC/ST Enrolment
Indicators
Classrooms/Other rooms
Prim.with U.P.&Sec/H.SUpper Primary onlyU. Primary with Sec./H.S.
Basic Data, 2001
Data reported from
Performance indicators
99.3 74.799.4 79.496.4 45.697.7 51.3
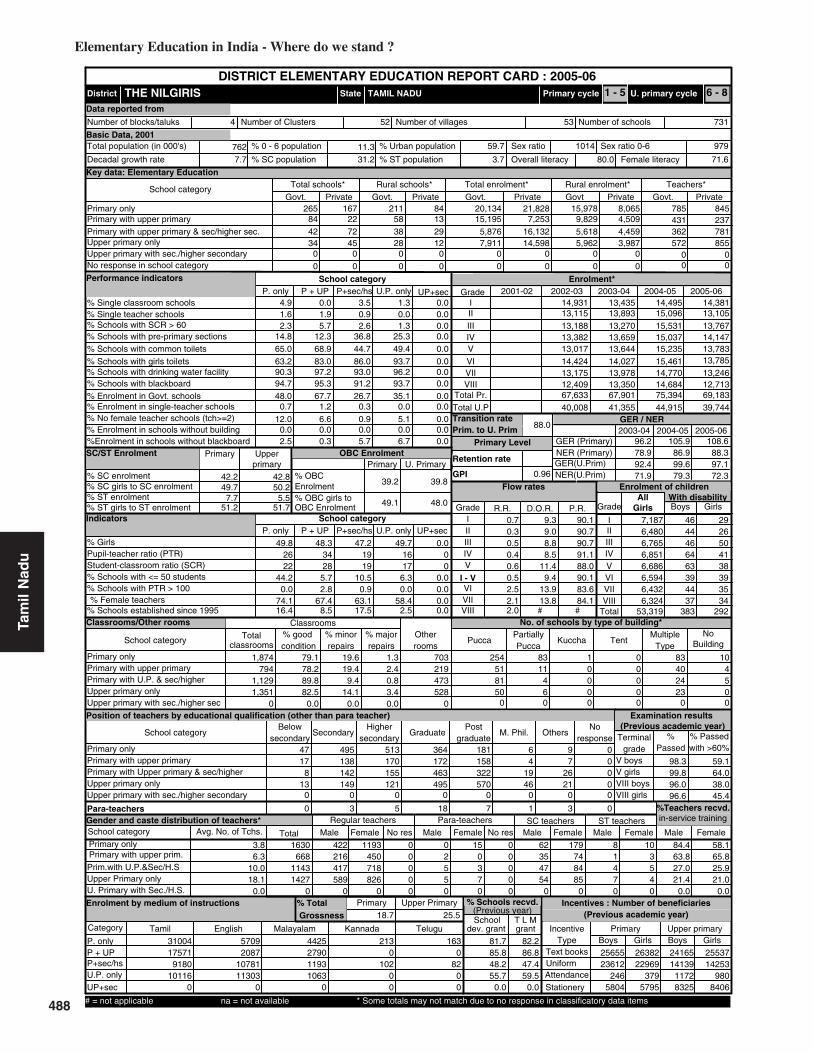
488
Elementary Education in India - Where do we stand ?
42.2 42.8
Key data: Elementary Education
762
THE NILGIRIS
(Previous academic year)
(Previous year)
Gender and caste distribution of teachers*
No. of schools by type of building*
BoysWith disability
Flow rates
Primary Level
Enrolment*
Number of schools
Grade
GER / NER
School category
Primary Upper primaryBoys Boys GirlsGirls
IncentiveType
School categoryMultiple
TypeKuccha
PartiallyPucca
PuccaTotal % good condition
Otherrooms
TentNo
Building
Classrooms
Belowsecondary
Highersecondary
Postgraduate
M. Phil.GraduateSecondarySchool category OthersNo
response
ST teachers
Total Male Female No res Male Female No res Male Female Male FemaleSC teachers
Text booksUniformAttendanceStationery
% Passed
Avg. No. of Tchs.
%
Female literacyOverall literacy
dev. grant grantSchool T L M
Male Female
IVV
IIIIII
Grade R.R. D.O.R. P.R.
VIIVI
# #
I - V
Enrolment by medium of instructions
Examination results
Retention rate
GPI
Primary cycle U. primary cycleState
DISTRICT ELEMENTARY EDUCATION REPORT CARD : 2005-06
GirlsGrade
IIIIIIIVVVI
VIII
AllGirls
Total
VII
% TotalGrossness
School category
844234
0
22 5872 3845
028
00 0 0
265 16713 15,19529 5,87612 7,911
0 00 0
211 84 15,978 8,0657,253 9,829 4,509
16,132 5,618 4,45914,598 5,962 3,987
0 0 00 0 0
20,134 21,828 785431
845237
P + UP P+sec/hs U.P. only UP+sec
School categoryP. only
4.9 0.0 3.5 1.3 0.01.6
Number of Clusters 73153
% Schools with SCR > 601.9 0.9 0.0 0.0
2.3 5.7 2.6 1.3 0.0% Schools with pre-primary sections 14.8 12.3 36.8 25.3 0.0% Schools with common toilets 65.0 68.9 44.7 49.4 0.0
% Schools with girls toilets 63.2 83.0 86.0 93.7 0.0% Schools with drinking water facility 90.3 97.2 93.0 96.2 0.0
% Enrolment in Govt. schools 48.0 67.7 26.7 35.1 0.094.7 95.3 91.2 93.7 0.0
% No female teacher schools (tch>=2) 12.0 6.6 0.9 5.1 0.00.7 1.2 0.3 0.0 0.0
0.0 0.0 0.0 0.0 0.0%Enrolment in schools without blackboard 2.5 0.3 5.7 6.7 0.0
2001-02 2002-03 2003-04 2004-05 2005-06IIIIIIIVV
VIVII
Total U.P
14,38113,10513,76714,14713,78313,785
13,246
14,49515,09615,53115,03715,235
15,46114,770
13,43513,89313,27013,65913,644
14,02713,978
14,93113,11513,18813,38213,017
14,42413,175
39,74444,91541,35540,008
96.2
92.4
105.9
99.6
108.6
97.1
47.2
10.50.9
7,1876,4806,7656,8516,6866,5946,4326,324
53,319
4644466463394437
383
2926504138393534
292
1,874
classrooms
7941,1291,351
0
79.178.289.882.5
0.0
19.619.4
1.3
9.414.1
0.0
2.40.83.40.0
219473528
0
703 254 83 1 0 83 1051 11 0 0 40 481 4 0 0 24 550 6 0 0 23 0
0 0 0 0 0 0
47 495 513 364 181 6 917 138 170 172 158 4 7 0
8 142 155 463 322 19 26 013 149 121 495 570 46 21 0
0 0 0 0 0 0 0 0
0 3 5 18 7 1 3 0
422216417589
0
450718826
0
1193 0 0 15 0 62 179 8 100000
2550
0370
0000
354754
0
748485
0
1470
3540
Terminalgrade Passed
VIII boysV girlsV boys
VIII girls
0 with >60%
84.41630668
11431427
0
63.827.021.4
0.0
58.165.825.921.0
0.0
31004Tamil English Malayalam Kannada Telugu
175719180
101160
57092087
1078111303
0
4425279011931063
0
2130
10200
1630
8200
% Schools recvd.
81.785.848.255.7
0.0
82.286.847.459.5
0.0
2565523612
2465804
2416514139
11728325
2638222969
3795795
2553714253
9808406
3.86.3
10.018.1
0.0
0.70.30.50.4
2.52.12.0
0.60.5
88.0
0.96
2005-062004-052003-04
TAMIL NADU
63.1
Upper PrimaryPrimary
Sex ratio Sex ratio 0-6
4 52
VIII17.5
Enrolment of children
VIII 12,409 13,350 14,684 12,713Total Pr. 67,633 67,901 75,394 69,183
1 - 5 6 - 8
572 8550 00 0
362 781
%Teachers recvd.in-service training
Total schools* Rural schools* Total enrolment* Rural enrolment* Teachers*
18.7 25.5
88.3
72.3
78.9 86.9
71.9 79.3% SC enrolment% SC girls to SC enrolment% ST enrolment
49.7 50.27.7
51.2 51.7
39.2
49.1
39.8
48.0
Position of teachers by educational qualification (other than para teacher)
(Previous academic year)Incentives : Number of beneficiaries
% ST girls to ST enrolment
% Girls
Number of villages
% 0 - 6 population
% SC population % ST population
% Urban population
% Schools with blackboard
% Enrolment in single-teacher schools
% Enrolment in schools without building
Primary Upperprimary
OBC EnrolmentPrimary U. Primary
% OBCEnrolment% OBC girls toOBC Enrolment
Pupil-teacher ratio (PTR)Student-classroom ratio (SCR)% Schools with <= 50 students% Schools with PTR > 100% Female teachers
% Schools established since 1995
Regular teachers Para-teachers
% minorrepairs
% majorrepairs
# = not applicable na = not available * Some totals may not match due to no response in classificatory data items
9.3 90.19.0 90.78.8 90.78.5 91.1
11.4 88.09.4 90.1
13.9 83.613.8 84.1
1919
49.82622
44.20.0
74.116.4
48.33428
5.72.8
67.48.5
49.71617
6.30.0
58.42.5
0.000
0.00.00.00.0
7.7 31.2 3.7 80.0 71.6
979101459.711.3
Category
PrivateGovt.PrivateGovtPrivateGovt.PrivateGovt.PrivateGovt.
Total population (in 000's)
Number of blocks/taluks
District
Decadal growth rate
Primary onlyPrimary with upper primaryPrimary with upper primary & sec/higher sec.Upper primary onlyUpper primary with sec./higher secondary
% Single classroom schools% Single teacher schools
P + UP P+sec/hs U.P. only UP+secP. only
No response in school category
Primary with upper primaryPrimary with U.P. & sec/higherUpper primary onlyUpper primary with sec./higher sec
Primary only
Primary onlyPrimary with upper primaryPrimary with Upper primary & sec/higherUpper primary only
Para-teachers
School category
Upper primary with sec./higher secondary
Primary onlyPrimary with upper prim.
P. onlyP + UPP+sec/hsU.P. onlyUP+sec
NER(U.Prim)GER(U.Prim)NER (Primary)GER (Primary)
Transition ratePrim. to U. Prim
5.5
SC/ST Enrolment
Indicators
Classrooms/Other rooms
Prim.with U.P.&Sec/H.SUpper Primary onlyU. Primary with Sec./H.S.
Basic Data, 2001
Data reported from
Performance indicators
98.3 59.199.8 64.096.0 38.096.6 45.4
Tam
il N
adu

489
Elementary Education: Report Card - THENI
Tam
il N
adu
0.9740.489
25.8 24.5
Key data: Elementary Education
1094
THENI
(Previous academic year)
(Previous year)
Gender and caste distribution of teachers*
No. of schools by type of building*
BoysWith disability
Flow rates
Primary Level
Enrolment*
Number of schools
Grade
GER / NER
School category
Primary Upper primaryBoys Boys GirlsGirls
IncentiveType
School categoryMultiple
TypeKuccha
PartiallyPucca
PuccaTotal % good condition
Otherrooms
TentNo
Building
Classrooms
Belowsecondary
Highersecondary
Postgraduate
M. Phil.GraduateSecondarySchool category OthersNo
response
ST teachers
Total Male Female No res Male Female No res Male Female Male FemaleSC teachers
Text booksUniformAttendanceStationery
% Passed
Avg. No. of Tchs.
%
Female literacyOverall literacy
dev. grant grantSchool T L M
Male Female
IVV
IIIIII
Grade R.R. D.O.R. P.R.
VIIVI
# #
I - V
Enrolment by medium of instructions
Examination results
Retention rate
GPI
Primary cycle U. primary cycleState
DISTRICT ELEMENTARY EDUCATION REPORT CARD : 2005-06
GirlsGrade
IIIIIIIVVVI
VIII
AllGirls
Total
VII
% TotalGrossness
School category
823944
0
84 8234 3938
044
00 0 0
321 18684 19,80834 7,22338 14,194
0 00 0
321 186 35,528 39,50939,024 19,808 39,024
9,210 7,223 9,21025,789 14,194 25,789
0 0 00 0 0
35,528 39,509 1,094605
1,2711,025
P + UP P+sec/hs U.P. only UP+sec
School categoryP. only
4.5 0.0 1.4 0.0 0.02.0
Number of Clusters 828102
% Schools with SCR > 600.0 0.0 0.0 0.0
1.4 4.8 2.7 7.3 0.0% Schools with pre-primary sections 11.4 7.8 24.7 19.5 0.0% Schools with common toilets 61.3 64.5 50.7 47.6 0.0
% Schools with girls toilets 62.5 84.3 79.5 85.4 0.0% Schools with drinking water facility 95.3 97.0 93.2 97.6 0.0
% Enrolment in Govt. schools 47.3 33.7 44.0 35.5 0.099.8 98.8 97.3 98.8 0.0
% No female teacher schools (tch>=2) 6.9 1.8 4.1 1.2 0.00.7 0.0 0.0 0.0 0.0
0.0 0.0 0.0 0.0 0.0%Enrolment in schools without blackboard 0.3 0.6 0.8 0.8 0.0
2001-02 2002-03 2003-04 2004-05 2005-06IIIIIIIVV
VIVII
Total U.P
27,08425,10323,65124,47623,67823,753
22,153
29,39925,52025,12124,07123,706
23,44521,710
30,26826,59424,56423,64223,659
23,08320,956
32,98026,15425,03724,09023,475
23,20221,231
66,29364,89763,47663,888
127.8
99.5
126.4
101.2
135.6
112.8
43.3
2.70.0
12,71911,72711,11311,39011,13610,94210,087
9,34288,456
155114141119
98118
96101942
8459777468895453
558
2,713
classrooms
1,703690
1,8450
86.388.595.592.7
0.0
10.49.1
3.3
3.85.00.0
2.30.72.30.0
307224514
0
582 230 89 3 0 184 173 21 0 0 71 146 7 0 0 18 247 1 0 0 34 0
0 0 0 0 0 0
44 704 902 391 248 5 1319 404 597 323 240 7 2 1
9 81 112 302 208 17 11 028 193 215 572 945 127 39 0
0 0 0 0 0 0 0 0
0 14 23 156 130 3 3 0
557489273911
0
1103467
12080
1750 0 5 53 0 106 284 2 61000
81246
0
2934
1420
0000
8045
1210
15555
1380
4030
2560
Terminalgrade Passed
VIII boysV girlsV boys
VIII girls
0 with >60%
87.523651630
7862307
0
82.348.838.9
0.0
76.979.534.933.5
0.0
72527Tamil English Others
570251236728300
0
254418074066
116830
0218
000
% Schools recvd.
88.089.867.179.3
0.0
88.291.065.879.3
0.0
6008143812
1086806
3911714858
32264762
5384138935
4785895
3040313564
31544955
4.79.8
10.828.1
0.0
6.14.23.22.9
5.34.53.5
2.73.9
95.0
0.88
2005-062004-052003-04
TAMIL NADU
63.7
Upper PrimaryPrimary
Sex ratio Sex ratio 0-6
8 85
VIII54.8
Enrolment of children
VIII 19,455 19,437 19,742 20,387Total Pr. 131,736 128,727 127,817 123,992
1 - 5 6 - 8
998 1,3090 00 0
298 488
%Teachers recvd.in-service training
Total schools* Rural schools* Total enrolment* Rural enrolment* Teachers*
18.2 23.4
100.0
86.473.7 78.0% SC enrolment% SC girls to SC enrolment% ST enrolment
46.9 45.6
46.0 42.3
72.9
46.8
73.6
46.0
Position of teachers by educational qualification (other than para teacher)
(Previous academic year)Incentives : Number of beneficiaries
% ST girls to ST enrolment
% Girls
Number of villages
% 0 - 6 population
% SC population % ST population
% Urban population
% Schools with blackboard
% Enrolment in single-teacher schools
% Enrolment in schools without building
Primary Upperprimary
OBC EnrolmentPrimary U. Primary
% OBCEnrolment% OBC girls toOBC Enrolment
Pupil-teacher ratio (PTR)Student-classroom ratio (SCR)% Schools with <= 50 students% Schools with PTR > 100% Female teachers
% Schools established since 1995
Regular teachers Para-teachers
% minorrepairs
% majorrepairs
# = not applicable na = not available * Some totals may not match due to no response in classificatory data items
12.2 81.76.2 89.62.2 94.71.4 95.72.4 95.05.2 90.94.4 90.34.7 90.8
2421
46.23228
31.20.0
76.213.8
47.73635
0.60.0
69.44.8
46.61722
0.00.0
58.59.8
0.000
0.00.00.00.0
4.3 19.4 0.2 71.6 61.2
89197854.111.5
Category
PrivateGovt.PrivateGovtPrivateGovt.PrivateGovt.PrivateGovt.
Total population (in 000's)
Number of blocks/taluks
District
Decadal growth rate
Primary onlyPrimary with upper primaryPrimary with upper primary & sec/higher sec.Upper primary onlyUpper primary with sec./higher secondary
% Single classroom schools% Single teacher schools
P + UP P+sec/hs U.P. only UP+secP. only
No response in school category
Primary with upper primaryPrimary with U.P. & sec/higherUpper primary onlyUpper primary with sec./higher sec
Primary only
Primary onlyPrimary with upper primaryPrimary with Upper primary & sec/higherUpper primary only
Para-teachers
School category
Upper primary with sec./higher secondary
Primary onlyPrimary with upper prim.
P. onlyP + UPP+sec/hsU.P. onlyUP+sec
NER(U.Prim)GER(U.Prim)NER (Primary)GER (Primary)
Transition ratePrim. to U. Prim
SC/ST Enrolment
Indicators
Classrooms/Other rooms
Prim.with U.P.&Sec/H.SUpper Primary onlyU. Primary with Sec./H.S.
Basic Data, 2001
Data reported from
Performance indicators
97.4 65.997.4 68.794.8 41.394.9 46.0

490
Elementary Education in India - Where do we stand ?
32.2 32.9
Key data: Elementary Education
2755
THIRUVALLUR
(Previous academic year)
(Previous year)
Gender and caste distribution of teachers*
No. of schools by type of building*
BoysWith disability
Flow rates
Primary Level
Enrolment*
Number of schools
Grade
GER / NER
School category
Primary Upper primaryBoys Boys GirlsGirls
IncentiveType
School categoryMultiple
TypeKuccha
PartiallyPucca
PuccaTotal % good condition
Otherrooms
TentNo
Building
Classrooms
Belowsecondary
Highersecondary
Postgraduate
M. Phil.GraduateSecondarySchool category OthersNo
response
ST teachers
Total Male Female No res Male Female No res Male Female Male FemaleSC teachers
Text booksUniformAttendanceStationery
% Passed
Avg. No. of Tchs.
%
Female literacyOverall literacy
dev. grant grantSchool T L M
Male Female
IVV
IIIIII
Grade R.R. D.O.R. P.R.
VIIVI
# #
I - V
Enrolment by medium of instructions
Examination results
Retention rate
GPI
Primary cycle U. primary cycleState
DISTRICT ELEMENTARY EDUCATION REPORT CARD : 2005-06
GirlsGrade
IIIIIIIVVVI
VIII
AllGirls
Total
VII
% TotalGrossness
School category
2769764
0
49 23596 78
1070
450
0 0 0
918 27428 76,04847 29,54027 32,618
0 00 0
825 180 69,134 22,38618,291 60,122 7,93331,196 22,499 14,82265,407 19,831 11,622
0 0 00 0 0
87,089 44,364 2,5971,830
1,666569
P + UP P+sec/hs U.P. only UP+sec
School categoryP. only
7.6 0.0 0.0 0.0 0.04.5
Number of Clusters 18811229
% Schools with SCR > 600.0 0.5 0.0 0.0
4.6 11.1 8.8 5.3 0.0% Schools with pre-primary sections 11.7 7.4 35.8 42.1 0.0% Schools with common toilets 42.5 57.5 42.5 55.0 0.0
% Schools with girls toilets 27.7 55.7 83.4 88.3 0.0% Schools with drinking water facility 95.5 97.5 96.9 100.0 0.0
% Enrolment in Govt. schools 66.3 80.6 48.6 33.3 0.098.2 95.4 91.7 95.9 0.0
% No female teacher schools (tch>=2) 10.5 2.2 2.6 0.0 0.02.1 0.0 0.3 0.0 0.0
0.0 0.0 0.0 0.0 0.0%Enrolment in schools without blackboard 1.4 5.0 6.2 3.7 0.0
2001-02 2002-03 2003-04 2004-05 2005-06IIIIIIIVV
VIVII
Total U.P
47,05445,17745,74949,24349,09052,008
50,002
42,72144,10147,62947,62748,405
52,10348,563
42,41345,21145,11946,07946,096
48,23246,161
48,14145,25046,55647,09245,891
50,86147,049
148,240146,742137,034140,896
85.6
82.3
85.8
86.2
102.6
100.2
51.3
2.14.1
23,26922,24322,55424,17324,12725,32824,31122,390
188,395
142142168192197243208203
1,495
115105115151107158108129988
4,601
classrooms
2,5622,2544,242
0
70.070.788.586.8
0.0
23.021.3
7.0
8.69.20.0
8.02.94.00.0
407596
1,0870
825 553 306 0 0 333 0120 12 0 0 193 0121 3 0 0 69 0110 5 0 0 56 0
0 0 0 0 0 0
61 1,013 1,430 1,065 629 27 1422 425 662 637 614 18 9 031 190 258 946 572 49 23 150 378 415 1,331 1,515 160 63 5
0 0 0 0 0 0 0 0
2 4 27 47 29 4 0 0
983608576
12940
177914932618
0
3256 0 3 21 0 177 555 10 470150
38
140
93025
0
0000
10491
1720
261166287
0
44
100
81030
0
Terminalgrade Passed
VIII boysV girlsV boys
VIII girls
0 with >60%
86.04263239921083956
0
80.737.727.9
0.0
65.472.124.729.7
0.0
114888Tamil English Telugu Un-Specified Others
876013361938853
0
131695107
2580057813
0
273114641188
9860
000
2890
1830
4500
% Schools recvd.
88.292.358.549.7
0.0
86.192.055.449.7
0.0
8772972938
60419446
7189749330
307924940
8942072945
417118725
6451138238
213221551
3.67.4
10.923.1
0.0
2.32.31.91.9
5.44.94.3
2.12.1
100.0
0.97
2005-062004-052003-04
TAMIL NADU
72.2
Upper PrimaryPrimary
Sex ratio Sex ratio 0-6
14 144
VIII36.8
Enrolment of children
VIII 42,986 42,641 46,076 46,230Total Pr. 232,930 224,918 230,483 236,313
1 - 5 6 - 8
1,813 2,1430 00 0
952 1,156
%Teachers recvd.in-service training
Total schools* Rural schools* Total enrolment* Rural enrolment* Teachers*
18.5 26.4
83.7
73.8
70.7 71.6
63.2 66.9% SC enrolment% SC girls to SC enrolment% ST enrolment
49.1 48.43.5
48.9 49.1
56.9
49.4
57.1
48.7
Position of teachers by educational qualification (other than para teacher)
(Previous academic year)Incentives : Number of beneficiaries
% ST girls to ST enrolment
% Girls
Number of villages
% 0 - 6 population
% SC population % ST population
% Urban population
% Schools with blackboard
% Enrolment in single-teacher schools
% Enrolment in schools without building
Primary Upperprimary
OBC EnrolmentPrimary U. Primary
% OBCEnrolment% OBC girls toOBC Enrolment
Pupil-teacher ratio (PTR)Student-classroom ratio (SCR)% Schools with <= 50 students% Schools with PTR > 100% Female teachers
% Schools established since 1995
Regular teachers Para-teachers
% minorrepairs
% majorrepairs
# = not applicable na = not available * Some totals may not match due to no response in classificatory data items
3.2 91.43.9 91.1
2729
49.93129
35.10.2
76.913.8
49.53937
0.30.6
74.511.1
45.82523
0.03.5
66.810.5
0.000
0.00.00.00.0
22.4 21.8 1.4 76.9 68.4
95797154.512.0
Category
PrivateGovt.PrivateGovtPrivateGovt.PrivateGovt.PrivateGovt.
Total population (in 000's)
Number of blocks/taluks
District
Decadal growth rate
Primary onlyPrimary with upper primaryPrimary with upper primary & sec/higher sec.Upper primary onlyUpper primary with sec./higher secondary
% Single classroom schools% Single teacher schools
P + UP P+sec/hs U.P. only UP+secP. only
No response in school category
Primary with upper primaryPrimary with U.P. & sec/higherUpper primary onlyUpper primary with sec./higher sec
Primary only
Primary onlyPrimary with upper primaryPrimary with Upper primary & sec/higherUpper primary only
Para-teachers
School category
Upper primary with sec./higher secondary
Primary onlyPrimary with upper prim.
P. onlyP + UPP+sec/hsU.P. onlyUP+sec
NER(U.Prim)GER(U.Prim)NER (Primary)GER (Primary)
Transition ratePrim. to U. Prim
2.1
SC/ST Enrolment
Indicators
Classrooms/Other rooms
Prim.with U.P.&Sec/H.SUpper Primary onlyU. Primary with Sec./H.S.
Basic Data, 2001
Data reported from
Performance indicators
99.4 61.299.5 66.294.0 41.796.8 43.9
Tam
il N
adu

491
Elementary Education: Report Card - THIRUVARUR
Tam
il N
adu
0.5850.523
41.8 41.3
Key data: Elementary Education
1169
THIRUVARUR
(Previous academic year)
(Previous year)
Gender and caste distribution of teachers*
No. of schools by type of building*
BoysWith disability
Flow rates
Primary Level
Enrolment*
Number of schools
Grade
GER / NER
School category
Primary Upper primaryBoys Boys GirlsGirls
IncentiveType
School categoryMultiple
TypeKuccha
PartiallyPucca
PuccaTotal % good condition
Otherrooms
TentNo
Building
Classrooms
Belowsecondary
Highersecondary
Postgraduate
M. Phil.GraduateSecondarySchool category OthersNo
response
ST teachers
Total Male Female No res Male Female No res Male Female Male FemaleSC teachers
Text booksUniformAttendanceStationery
% Passed
Avg. No. of Tchs.
%
Female literacyOverall literacy
dev. grant grantSchool T L M
Male Female
IVV
IIIIII
Grade R.R. D.O.R. P.R.
VIIVI
# #
I - V
Enrolment by medium of instructions
Examination results
Retention rate
GPI
Primary cycle U. primary cycleState
DISTRICT ELEMENTARY EDUCATION REPORT CARD : 2005-06
GirlsGrade
IIIIIIIVVVI
VIII
AllGirls
Total
VII
% TotalGrossness
School category
1557130
0
38 14842 6713
027
00 0 0
628 18528 38,81026 18,287
8 11,7300 00 0
609 134 52,428 15,39016,468 36,300 12,75214,828 17,490 7,890
7,626 11,195 4,244
0 0 00 0 0
54,379 26,451 1,7111,015
1,121420
P + UP P+sec/hs U.P. only UP+sec
School categoryP. only
1.7 0.5 0.9 0.0 0.03.6
Number of Clusters 1162472
% Schools with SCR > 601.0 1.8 2.3 0.0
1.2 5.7 5.3 0.0 0.0% Schools with pre-primary sections 15.7 4.1 20.4 9.3 0.0% Schools with common toilets 73.6 73.6 47.8 51.2 0.0
% Schools with girls toilets 71.0 87.0 92.9 81.4 0.0% Schools with drinking water facility 97.2 99.5 98.2 95.3 0.0
% Enrolment in Govt. schools 67.3 70.2 55.2 60.6 0.098.4 98.4 96.5 93.0 0.0
% No female teacher schools (tch>=2) 13.7 7.3 3.5 0.0 0.01.8 0.7 1.0 0.4 0.0
0.0 0.0 0.0 0.0 0.0%Enrolment in schools without blackboard 1.8 2.0 2.1 5.1 0.0
2001-02 2002-03 2003-04 2004-05 2005-06IIIIIIIVV
VIVII
Total U.P
23,12222,31623,29525,18224,36125,491
23,356
22,81423,41125,58124,43624,628
25,00822,751
24,16425,57524,41124,68824,430
24,30223,168
27,08724,53024,63224,75523,792
24,98822,426
70,30369,20368,36367,401
114.2
99.9
111.3
100.5
121.0
111.9
45.6
4.43.5
11,23611,04411,45212,21111,84312,16511,47210,40291,825
122118150135104167139139
1,074
7571969696
123102
58717
3,308
classrooms
1,5281,257
8570
72.072.485.276.4
0.0
19.919.7
8.1
11.216.6
0.0
7.93.67.00.0
182366252
0
451 524 101 1 0 186 192 12 0 0 89 053 1 0 0 59 010 1 0 0 31 1
0 0 0 0 0 0
35 516 972 802 445 16 1210 234 464 357 346 19 2 0
8 134 114 408 377 34 13 03 58 91 226 362 52 17 00 0 0 0 0 0 0 0
2 6 4 30 9 2 2 0
816609450478
0
823638331
0
1982 0 2 32 0 166 298 3 80000
1350
2820
0000
1137287
0
1009253
0
1110
2630
Terminalgrade Passed
VIII boysV girlsV boys
VIII girls
0 with >60%
88.5283214351099
8160
86.637.145.1
0.0
59.387.231.348.6
0.0
69650Tamil English
547162442616039
0
11116562
83503317
0
% Schools recvd.
84.496.468.186.0
0.0
84.596.966.486.0
0.0
5335143026
1422200
4271024557
187912988
5203741282
1882541
3978923615
317011744
3.57.49.7
19.00.0
1.71.21.01.1
7.66.15.1
1.51.3
95.8
0.96
2005-062004-052003-04
TAMIL NADU
58.8
Upper PrimaryPrimary
Sex ratio Sex ratio 0-6
10 95
VIII24.8
Enrolment of children
VIII 19,987 20,893 21,444 21,456Total Pr. 124,796 123,268 120,870 118,276
1 - 5 6 - 8
569 2470 00 0
554 545
%Teachers recvd.in-service training
Total schools* Rural schools* Total enrolment* Rural enrolment* Teachers*
19.9 25.4
96.9
83.5
90.7 89.3
71.1 73.4% SC enrolment% SC girls to SC enrolment% ST enrolment
48.9 47.4
49.4 47.0
55.9
48.9
55.9
49.2
Position of teachers by educational qualification (other than para teacher)
(Previous academic year)Incentives : Number of beneficiaries
% ST girls to ST enrolment
% Girls
Number of villages
% 0 - 6 population
% SC population % ST population
% Urban population
% Schools with blackboard
% Enrolment in single-teacher schools
% Enrolment in schools without building
Primary Upperprimary
OBC EnrolmentPrimary U. Primary
% OBCEnrolment% OBC girls toOBC Enrolment
Pupil-teacher ratio (PTR)Student-classroom ratio (SCR)% Schools with <= 50 students% Schools with PTR > 100% Female teachers
% Schools established since 1995
Regular teachers Para-teachers
% minorrepairs
% majorrepairs
# = not applicable na = not available * Some totals may not match due to no response in classificatory data items
1.8 96.60.4 98.41.6 97.40.7 98.12.6 95.81.4 97.34.6 87.84.4 89.5
2630
49.72924
33.70.4
71.118.8
48.93936
1.60.5
57.52.6
48.82423
2.32.3
40.87.0
0.000
0.00.00.00.0
5.9 32.3 0.2 76.6 67.9
970101420.312.0
Category
PrivateGovt.PrivateGovtPrivateGovt.PrivateGovt.PrivateGovt.
Total population (in 000's)
Number of blocks/taluks
District
Decadal growth rate
Primary onlyPrimary with upper primaryPrimary with upper primary & sec/higher sec.Upper primary onlyUpper primary with sec./higher secondary
% Single classroom schools% Single teacher schools
P + UP P+sec/hs U.P. only UP+secP. only
No response in school category
Primary with upper primaryPrimary with U.P. & sec/higherUpper primary onlyUpper primary with sec./higher sec
Primary only
Primary onlyPrimary with upper primaryPrimary with Upper primary & sec/higherUpper primary only
Para-teachers
School category
Upper primary with sec./higher secondary
Primary onlyPrimary with upper prim.
P. onlyP + UPP+sec/hsU.P. onlyUP+sec
NER(U.Prim)GER(U.Prim)NER (Primary)GER (Primary)
Transition ratePrim. to U. Prim
SC/ST Enrolment
Indicators
Classrooms/Other rooms
Prim.with U.P.&Sec/H.SUpper Primary onlyU. Primary with Sec./H.S.
Basic Data, 2001
Data reported from
Performance indicators
99.6 92.399.8 93.892.8 49.694.7 53.0
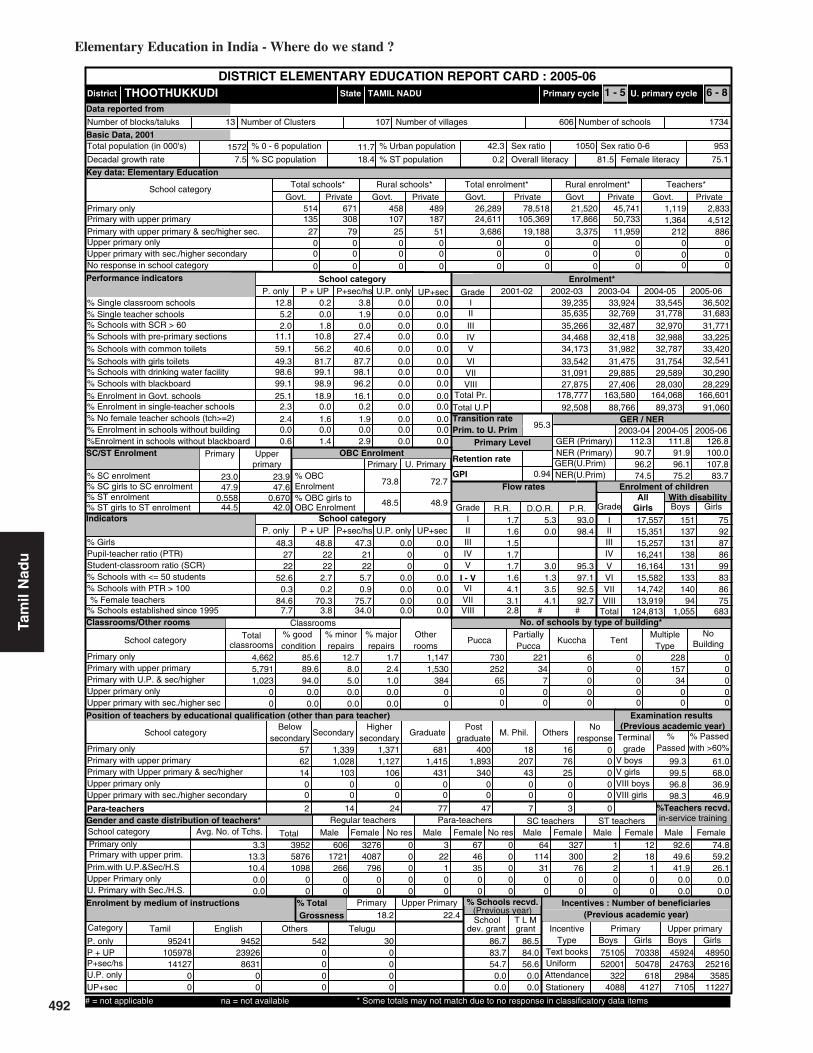
492
Elementary Education in India - Where do we stand ?
0.6700.558
23.0 23.9
Key data: Elementary Education
1572
THOOTHUKKUDI
(Previous academic year)
(Previous year)
Gender and caste distribution of teachers*
No. of schools by type of building*
BoysWith disability
Flow rates
Primary Level
Enrolment*
Number of schools
Grade
GER / NER
School category
Primary Upper primaryBoys Boys GirlsGirls
IncentiveType
School categoryMultiple
TypeKuccha
PartiallyPucca
PuccaTotal % good condition
Otherrooms
TentNo
Building
Classrooms
Belowsecondary
Highersecondary
Postgraduate
M. Phil.GraduateSecondarySchool category OthersNo
response
ST teachers
Total Male Female No res Male Female No res Male Female Male FemaleSC teachers
Text booksUniformAttendanceStationery
% Passed
Avg. No. of Tchs.
%
Female literacyOverall literacy
dev. grant grantSchool T L M
Male Female
IVV
IIIIII
Grade R.R. D.O.R. P.R.
VIIVI
# #
I - V
Enrolment by medium of instructions
Examination results
Retention rate
GPI
Primary cycle U. primary cycleState
DISTRICT ELEMENTARY EDUCATION REPORT CARD : 2005-06
GirlsGrade
IIIIIIIVVVI
VIII
AllGirls
Total
VII
% TotalGrossness
School category
13527
00
308 10779 25
00
00
0 0 0
514 671187 24,611
51 3,6860 00 00 0
458 489 21,520 45,741105,369 17,866 50,733
19,188 3,375 11,9590 0 0
0 0 00 0 0
26,289 78,518 1,1191,364
2,8334,512
P + UP P+sec/hs U.P. only UP+sec
School categoryP. only
12.8 0.2 3.8 0.0 0.05.2
Number of Clusters 1734606
% Schools with SCR > 600.0 1.9 0.0 0.0
2.0 1.8 0.0 0.0 0.0% Schools with pre-primary sections 11.1 10.8 27.4 0.0 0.0% Schools with common toilets 59.1 56.2 40.6 0.0 0.0
% Schools with girls toilets 49.3 81.7 87.7 0.0 0.0% Schools with drinking water facility 98.6 99.1 98.1 0.0 0.0
% Enrolment in Govt. schools 25.1 18.9 16.1 0.0 0.099.1 98.9 96.2 0.0 0.0
% No female teacher schools (tch>=2) 2.4 1.6 1.9 0.0 0.02.3 0.0 0.2 0.0 0.0
0.0 0.0 0.0 0.0 0.0%Enrolment in schools without blackboard 0.6 1.4 2.9 0.0 0.0
2001-02 2002-03 2003-04 2004-05 2005-06IIIIIIIVV
VIVII
Total U.P
36,50231,68331,77133,22533,42032,541
30,290
33,54531,77832,97032,98832,787
31,75429,589
33,92432,76932,48732,41831,982
31,47529,885
39,23535,63535,26634,46834,173
33,54231,091
91,06089,37388,76692,508
112.3
96.2
111.8
96.1
126.8
107.8
47.3
5.70.9
17,55715,35115,25716,24116,16415,58214,74213,919
124,813
151137131138131133140
941,055
7592878699838675
683
4,662
classrooms
5,7911,023
00
85.689.694.0
0.00.0
12.78.0
1.7
5.00.00.0
2.41.00.00.0
1,530384
00
1,147 730 221 6 0 228 0252 34 0 0 157 0
65 7 0 0 34 00 0 0 0 0 00 0 0 0 0 0
57 1,339 1,371 681 400 18 1662 1,028 1,127 1,415 1,893 207 76 014 103 106 431 340 43 25 0
0 0 0 0 0 0 0 00 0 0 0 0 0 0 0
2 14 24 77 47 7 3 0
6061721
26600
4087796
00
3276 0 3 67 0 64 327 1 120000
22100
4635
00
0000
11431
00
30076
00
2200
18100
Terminalgrade Passed
VIII boysV girlsV boys
VIII girls
0 with >60%
92.6395258761098
00
49.641.9
0.00.0
74.859.226.1
0.00.0
95241Tamil English Others Telugu
10597814127
00
945223926
863100
5420000
300000
% Schools recvd.
86.783.754.7
0.00.0
86.584.056.6
0.00.0
7510552001
3224088
4592424763
29847105
7033850478
6184127
4895025216
358511227
3.313.310.4
0.00.0
1.71.61.51.7
4.13.12.8
1.71.6
95.3
0.94
2005-062004-052003-04
TAMIL NADU
75.7
Upper PrimaryPrimary
Sex ratio Sex ratio 0-6
13 107
VIII34.0
Enrolment of children
VIII 27,875 27,406 28,030 28,229Total Pr. 178,777 163,580 164,068 166,601
1 - 5 6 - 8
0 00 00 0
212 886
%Teachers recvd.in-service training
Total schools* Rural schools* Total enrolment* Rural enrolment* Teachers*
18.2 22.4
100.0
83.7
90.7 91.9
74.5 75.2% SC enrolment% SC girls to SC enrolment% ST enrolment
47.9 47.6
44.5 42.0
73.8
48.5
72.7
48.9
Position of teachers by educational qualification (other than para teacher)
(Previous academic year)Incentives : Number of beneficiaries
% ST girls to ST enrolment
% Girls
Number of villages
% 0 - 6 population
% SC population % ST population
% Urban population
% Schools with blackboard
% Enrolment in single-teacher schools
% Enrolment in schools without building
Primary Upperprimary
OBC EnrolmentPrimary U. Primary
% OBCEnrolment% OBC girls toOBC Enrolment
Pupil-teacher ratio (PTR)Student-classroom ratio (SCR)% Schools with <= 50 students% Schools with PTR > 100% Female teachers
% Schools established since 1995
Regular teachers Para-teachers
% minorrepairs
% majorrepairs
# = not applicable na = not available * Some totals may not match due to no response in classificatory data items
5.3 93.00.0 98.4
3.0 95.31.3 97.13.5 92.54.1 92.7
2221
48.32722
52.60.3
84.67.7
48.82222
2.70.2
70.33.8
0.000
0.00.00.00.0
0.000
0.00.00.00.0
7.5 18.4 0.2 81.5 75.1
953105042.311.7
Category
PrivateGovt.PrivateGovtPrivateGovt.PrivateGovt.PrivateGovt.
Total population (in 000's)
Number of blocks/taluks
District
Decadal growth rate
Primary onlyPrimary with upper primaryPrimary with upper primary & sec/higher sec.Upper primary onlyUpper primary with sec./higher secondary
% Single classroom schools% Single teacher schools
P + UP P+sec/hs U.P. only UP+secP. only
No response in school category
Primary with upper primaryPrimary with U.P. & sec/higherUpper primary onlyUpper primary with sec./higher sec
Primary only
Primary onlyPrimary with upper primaryPrimary with Upper primary & sec/higherUpper primary only
Para-teachers
School category
Upper primary with sec./higher secondary
Primary onlyPrimary with upper prim.
P. onlyP + UPP+sec/hsU.P. onlyUP+sec
NER(U.Prim)GER(U.Prim)NER (Primary)GER (Primary)
Transition ratePrim. to U. Prim
SC/ST Enrolment
Indicators
Classrooms/Other rooms
Prim.with U.P.&Sec/H.SUpper Primary onlyU. Primary with Sec./H.S.
Basic Data, 2001
Data reported from
Performance indicators
99.3 61.099.5 68.096.8 36.998.3 46.9
Tam
il N
adu

493
Elementary Education: Report Card - TIRUCHIRAPPALLI
Tam
il N
adu
20.3 20.8
Key data: Elementary Education
2418
TIRUCHIRAPPALLI
(Previous academic year)
(Previous year)
Gender and caste distribution of teachers*
No. of schools by type of building*
BoysWith disability
Flow rates
Primary Level
Enrolment*
Number of schools
Grade
GER / NER
School category
Primary Upper primaryBoys Boys GirlsGirls
IncentiveType
School categoryMultiple
TypeKuccha
PartiallyPucca
PuccaTotal % good condition
Otherrooms
TentNo
Building
Classrooms
Belowsecondary
Highersecondary
Postgraduate
M. Phil.GraduateSecondarySchool category OthersNo
response
ST teachers
Total Male Female No res Male Female No res Male Female Male FemaleSC teachers
Text booksUniformAttendanceStationery
% Passed
Avg. No. of Tchs.
%
Female literacyOverall literacy
dev. grant grantSchool T L M
Male Female
IVV
IIIIII
Grade R.R. D.O.R. P.R.
VIIVI
# #
I - V
Enrolment by medium of instructions
Examination results
Retention rate
GPI
Primary cycle U. primary cycleState
DISTRICT ELEMENTARY EDUCATION REPORT CARD : 2005-06
GirlsGrade
IIIIIIIVVVI
VIII
AllGirls
Total
VII
% TotalGrossness
School category
2257458
0
111 19285 67
1090
430
0 0 0
817 37251 57,18346 16,42742 22,401
0 00 0
754 239 68,260 30,62944,608 46,790 17,14222,273 15,024 12,12461,426 16,855 22,677
0 0 00 0 0
75,901 58,844 2,4531,672
2,2571,298
P + UP P+sec/hs U.P. only UP+sec
School categoryP. only
2.6 0.0 0.6 0.6 0.02.9
Number of Clusters 1851494
% Schools with SCR > 600.0 0.6 0.6 0.0
2.3 6.8 9.4 7.8 0.0% Schools with pre-primary sections 14.8 3.9 33.3 20.4 0.0% Schools with common toilets 61.2 54.5 44.7 47.3 0.0
% Schools with girls toilets 42.5 75.3 79.2 83.2 0.0% Schools with drinking water facility 97.2 98.8 96.9 98.8 0.0
% Enrolment in Govt. schools 56.3 56.2 42.4 26.7 0.095.2 95.8 89.9 89.2 0.0
% No female teacher schools (tch>=2) 7.7 1.5 3.1 6.0 0.01.4 0.0 1.1 0.6 0.0
0.0 0.0 0.0 0.0 0.0%Enrolment in schools without blackboard 4.6 2.3 11.6 15.0 0.0
2001-02 2002-03 2003-04 2004-05 2005-06IIIIIIIVV
VIVII
Total U.P
47,34942,23645,39147,43446,16046,128
43,616
43,64847,03448,04046,92046,890
48,38044,154
49,51449,07047,51847,78446,874
48,59045,715
54,84048,53448,71247,90146,935
50,02044,001
130,493135,204137,234133,740
107.2
96.4
102.7
94.2
113.1
100.5
46.5
3.82.5
23,17720,64022,21022,92222,57422,62421,36920,321
175,837
389170205234200242199179
1,818
136110148133149154176181
1,187
5,480
classrooms
2,9651,5253,342
0
82.181.685.188.6
0.0
14.213.9
3.7
10.58.50.0
4.54.32.80.0
418448849
0
892 533 285 0 0 334 37106 23 0 0 200 7105 8 0 0 43 3
88 3 0 0 68 80 0 0 0 0 0
118 1,106 1,518 1,166 722 27 1853 606 969 656 644 20 10 1019 137 225 520 511 30 31 1726 453 415 819 1,077 116 48 106
0 0 0 0 0 0 0 0
0 4 2 25 12 4 0 0
974696396
11520
226210831843
0
3702 20 3 11 0 186 528 11 32101165
0
0540
219
30
0000
12086
1660
27093
2380
3790
26390
Terminalgrade Passed
VIII boysV girlsV boys
VIII girls
21 with >60%
64.84710297015143067
0
57.928.424.7
0.0
49.155.717.825.6
0.0
120728Tamil English Others Urdu
997412192653354
0
134952056
1658727593
0
14300
10680
1930
1500
% Schools recvd.
81.990.551.665.3
0.0
80.188.449.767.1
0.0
9354562983
46912140
5251027119
513813759
9034560675
293313511
5213124941
530412475
4.08.89.5
18.40.0
1.40.80.90.9
3.92.92.7
0.91.0
94.4
0.95
2005-062004-052003-04
TAMIL NADU
72.8
Upper PrimaryPrimary
Sex ratio Sex ratio 0-6
16 242
VIII27.0
Enrolment of children
VIII 39,719 42,929 42,670 40,749Total Pr. 246,922 240,760 232,532 228,570
1 - 5 6 - 8
1,070 1,9970 00 0
617 897
%Teachers recvd.in-service training
Total schools* Rural schools* Total enrolment* Rural enrolment* Teachers*
19.3 26.5
91.2
73.8
86.4 82.4
71.2 70.2% SC enrolment% SC girls to SC enrolment% ST enrolment
48.7 49.51.1
44.9 51.3
73.1
49.1
71.9
49.3
Position of teachers by educational qualification (other than para teacher)
(Previous academic year)Incentives : Number of beneficiaries
% ST girls to ST enrolment
% Girls
Number of villages
% 0 - 6 population
% SC population % ST population
% Urban population
% Schools with blackboard
% Enrolment in single-teacher schools
% Enrolment in schools without building
Primary Upperprimary
OBC EnrolmentPrimary U. Primary
% OBCEnrolment% OBC girls toOBC Enrolment
Pupil-teacher ratio (PTR)Student-classroom ratio (SCR)% Schools with <= 50 students% Schools with PTR > 100% Female teachers
% Schools established since 1995
Regular teachers Para-teachers
% minorrepairs
% majorrepairs
# = not applicable na = not available * Some totals may not match due to no response in classificatory data items
2.8 95.93.6 95.61.2 97.91.7 97.54.7 94.42.8 96.38.7 87.57.4 89.7
2526
48.72925
30.61.0
78.812.1
49.83434
0.90.3
76.23.3
49.52725
4.23.0
60.23.6
0.000
0.00.00.00.0
8.8 16.5 0.8 77.9 69.3
955100147.111.2
Category
PrivateGovt.PrivateGovtPrivateGovt.PrivateGovt.PrivateGovt.
Total population (in 000's)
Number of blocks/taluks
District
Decadal growth rate
Primary onlyPrimary with upper primaryPrimary with upper primary & sec/higher sec.Upper primary onlyUpper primary with sec./higher secondary
% Single classroom schools% Single teacher schools
P + UP P+sec/hs U.P. only UP+secP. only
No response in school category
Primary with upper primaryPrimary with U.P. & sec/higherUpper primary onlyUpper primary with sec./higher sec
Primary only
Primary onlyPrimary with upper primaryPrimary with Upper primary & sec/higherUpper primary only
Para-teachers
School category
Upper primary with sec./higher secondary
Primary onlyPrimary with upper prim.
P. onlyP + UPP+sec/hsU.P. onlyUP+sec
NER(U.Prim)GER(U.Prim)NER (Primary)GER (Primary)
Transition ratePrim. to U. Prim
1.1
SC/ST Enrolment
Indicators
Classrooms/Other rooms
Prim.with U.P.&Sec/H.SUpper Primary onlyU. Primary with Sec./H.S.
Basic Data, 2001
Data reported from
Performance indicators
98.4 53.299.0 60.494.2 40.396.6 46.7

494
Elementary Education in India - Where do we stand ?
0.9070.711
21.9 21.9
Key data: Elementary Education
2724
TIRUNELVELI
(Previous academic year)
(Previous year)
Gender and caste distribution of teachers*
No. of schools by type of building*
BoysWith disability
Flow rates
Primary Level
Enrolment*
Number of schools
Grade
GER / NER
School category
Primary Upper primaryBoys Boys GirlsGirls
IncentiveType
School categoryMultiple
TypeKuccha
PartiallyPucca
PuccaTotal % good condition
Otherrooms
TentNo
Building
Classrooms
Belowsecondary
Highersecondary
Postgraduate
M. Phil.GraduateSecondarySchool category OthersNo
response
ST teachers
Total Male Female No res Male Female No res Male Female Male FemaleSC teachers
Text booksUniformAttendanceStationery
% Passed
Avg. No. of Tchs.
%
Female literacyOverall literacy
dev. grant grantSchool T L M
Male Female
IVV
IIIIII
Grade R.R. D.O.R. P.R.
VIIVI
# #
I - V
Enrolment by medium of instructions
Examination results
Retention rate
GPI
Primary cycle U. primary cycleState
DISTRICT ELEMENTARY EDUCATION REPORT CARD : 2005-06
GirlsGrade
IIIIIIIVVVI
VIII
AllGirls
Total
VII
% TotalGrossness
School category
1145764
0
318 92106 51151
041
00 0 0
639 1,050255 24,590
62 12,57075 23,056
0 00 0
568 771 44,366 97,796117,905 19,561 85,147
29,049 11,279 17,05769,694 14,692 27,261
0 0 00 0 0
50,894 149,251 1,658643
4,5982,988
P + UP P+sec/hs U.P. only UP+sec
School categoryP. only
6.5 0.2 1.2 0.5 0.04.2
Number of Clusters 2499549
% Schools with SCR > 600.2 1.2 1.9 0.0
3.8 3.7 3.1 2.3 0.0% Schools with pre-primary sections 12.6 6.5 24.5 23.3 0.0% Schools with common toilets 64.4 68.3 53.4 54.0 0.0
% Schools with girls toilets 52.5 77.5 90.8 91.2 0.0% Schools with drinking water facility 97.8 99.1 97.5 98.1 0.0
% Enrolment in Govt. schools 25.4 17.3 30.2 24.9 0.099.2 97.5 98.2 98.6 0.0
% No female teacher schools (tch>=2) 4.4 1.9 1.8 1.9 0.01.9 0.1 0.6 0.4 0.0
0.0 0.0 0.0 0.0 0.0%Enrolment in schools without blackboard 0.8 4.2 1.5 3.9 0.0
2001-02 2002-03 2003-04 2004-05 2005-06IIIIIIIVV
VIVII
Total U.P
66,38159,31460,00262,41962,59759,211
55,267
75,81974,23978,27276,85276,455
77,30971,517
59,42058,81258,45857,89257,018
55,55452,425
62,69757,95456,67955,44755,198
53,39949,372
166,296216,722156,859123,861
114.6
97.2
148.1
132.7
136.4
113.7
46.7
3.11.2
32,18428,76929,05030,47130,16628,33126,79525,163
230,929
194192214228194238185179
1,624
131146190168136146120123
1,160
7,785
classrooms
4,1511,6054,780
0
87.087.491.591.8
0.0
11.311.0
1.7
7.56.20.0
1.60.92.10.0
785572
1,3970
1,883 801 463 20 0 404 0169 69 3 0 191 0102 7 0 0 54 0123 4 0 0 88 0
0 0 0 0 0 0
180 2,116 1,885 1,258 655 33 1459 1,117 1,140 759 502 23 25 026 205 220 631 519 35 31 053 588 357 1,179 1,669 175 84 0
0 0 0 0 0 0 0 0
1 15 35 79 27 4 1 0
13291042
5771645
0
258610942476
0
4817 0 4 106 0 160 535 5 160000
13
120
21123
0
0000
8756
1430
19992
1920
3620
187
100
Terminalgrade Passed
VIII boysV girlsV boys
VIII girls
0 with >60%
87.86256363116854156
0
81.244.129.6
0.0
66.178.031.327.3
0.0
180424Tamil English Telugu Others Hindi
1397743088461630
0
189362298
1040931120
0
378302
000
890000
00
2600
% Schools recvd.
81.575.540.538.1
0.0
79.275.050.346.5
0.0
14490092763
285510496
8596838864
507013080
128903898461922610739
77389396711271412573
3.78.4
10.319.3
0.0
1.11.21.11.3
4.13.53.2
1.61.3
73.3
0.94
2005-062004-052003-04
TAMIL NADU
65.6
Upper PrimaryPrimary
Sex ratio Sex ratio 0-6
21 201
VIII35.0
Enrolment of children
VIII 21,090 48,880 67,896 51,818Total Pr. 287,975 291,600 381,637 310,713
1 - 5 6 - 8
1,307 2,8490 00 0
547 1,138
%Teachers recvd.in-service training
Total schools* Rural schools* Total enrolment* Rural enrolment* Teachers*
19.3 23.8
100.0
86.6
92.3
75.3% SC enrolment% SC girls to SC enrolment% ST enrolment
48.5 47.9
45.5 41.8
73.4
48.7
73.0
48.6
Position of teachers by educational qualification (other than para teacher)
(Previous academic year)Incentives : Number of beneficiaries
% ST girls to ST enrolment
% Girls
Number of villages
% 0 - 6 population
% SC population % ST population
% Urban population
% Schools with blackboard
% Enrolment in single-teacher schools
% Enrolment in schools without building
Primary Upperprimary
OBC EnrolmentPrimary U. Primary
% OBCEnrolment% OBC girls toOBC Enrolment
Pupil-teacher ratio (PTR)Student-classroom ratio (SCR)% Schools with <= 50 students% Schools with PTR > 100% Female teachers
% Schools established since 1995
Regular teachers Para-teachers
% minorrepairs
% majorrepairs
# = not applicable na = not available * Some totals may not match due to no response in classificatory data items
21.8 77.019.0 79.720.5 78.518.8 79.925.1 73.321.1 77.727.6 68.227.1 69.4
2625
48.73226
31.90.6
78.77.5
49.43934
1.20.5
71.33.5
47.02219
2.31.4
60.110.2
0.000
0.00.00.00.0
12.0 17.7 0.3 76.1 67.4
957104248.011.8
Category
PrivateGovt.PrivateGovtPrivateGovt.PrivateGovt.PrivateGovt.
Total population (in 000's)
Number of blocks/taluks
District
Decadal growth rate
Primary onlyPrimary with upper primaryPrimary with upper primary & sec/higher sec.Upper primary onlyUpper primary with sec./higher secondary
% Single classroom schools% Single teacher schools
P + UP P+sec/hs U.P. only UP+secP. only
No response in school category
Primary with upper primaryPrimary with U.P. & sec/higherUpper primary onlyUpper primary with sec./higher sec
Primary only
Primary onlyPrimary with upper primaryPrimary with Upper primary & sec/higherUpper primary only
Para-teachers
School category
Upper primary with sec./higher secondary
Primary onlyPrimary with upper prim.
P. onlyP + UPP+sec/hsU.P. onlyUP+sec
NER(U.Prim)GER(U.Prim)NER (Primary)GER (Primary)
Transition ratePrim. to U. Prim
SC/ST Enrolment
Indicators
Classrooms/Other rooms
Prim.with U.P.&Sec/H.SUpper Primary onlyU. Primary with Sec./H.S.
Basic Data, 2001
Data reported from
Performance indicators
98.9 59.099.1 65.295.7 42.297.7 50.7
Tam
il N
adu

495
Elementary Education: Report Card - TIRUVANNAMALAI
Tam
il N
adu
25.1 26.3
Key data: Elementary Education
2186
TIRUVANNAMALAI
(Previous academic year)
(Previous year)
Gender and caste distribution of teachers*
No. of schools by type of building*
BoysWith disability
Flow rates
Primary Level
Enrolment*
Number of schools
Grade
GER / NER
School category
Primary Upper primaryBoys Boys GirlsGirls
IncentiveType
School categoryMultiple
TypeKuccha
PartiallyPucca
PuccaTotal % good condition
Otherrooms
TentNo
Building
Classrooms
Belowsecondary
Highersecondary
Postgraduate
M. Phil.GraduateSecondarySchool category OthersNo
response
ST teachers
Total Male Female No res Male Female No res Male Female Male FemaleSC teachers
Text booksUniformAttendanceStationery
% Passed
Avg. No. of Tchs.
%
Female literacyOverall literacy
dev. grant grantSchool T L M
Male Female
IVV
IIIIII
Grade R.R. D.O.R. P.R.
VIIVI
# #
I - V
Enrolment by medium of instructions
Examination results
Retention rate
GPI
Primary cycle U. primary cycleState
DISTRICT ELEMENTARY EDUCATION REPORT CARD : 2005-06
GirlsGrade
IIIIIIIVVVI
VIII
AllGirls
Total
VII
% TotalGrossness
School category
321136
720
20 31459 13343
062
00 0 0
1,286 22617 84,33545 37,18328 31,597
0 00 0
1,249 166 104,967 19,3878,985 81,455 6,875
14,429 36,213 10,90623,881 25,293 12,013
0 0 00 0 0
109,520 31,745 3,2781,920
1,213233
P + UP P+sec/hs U.P. only UP+sec
School categoryP. only
1.9 0.9 0.5 0.0 0.05.6
Number of Clusters 21631472
% Schools with SCR > 600.0 1.0 0.0 0.0
1.7 6.2 8.2 6.1 0.0% Schools with pre-primary sections 6.5 0.3 21.0 16.5 0.0% Schools with common toilets 63.8 52.8 46.2 49.6 0.0
% Schools with girls toilets 23.8 40.8 72.3 67.0 0.0% Schools with drinking water facility 95.2 92.7 90.8 98.3 0.0
% Enrolment in Govt. schools 77.5 90.4 72.0 57.0 0.0100.0 100.0 100.0 100.0 0.0
% No female teacher schools (tch>=2) 18.6 10.0 6.7 2.6 0.03.1 0.0 0.7 0.0 0.0
0.0 0.0 0.0 0.0 0.0%Enrolment in schools without blackboard 0.0 0.0 0.0 0.0 0.0
2001-02 2002-03 2003-04 2004-05 2005-06IIIIIIIVV
VIVII
Total U.P
43,72241,15441,54941,76943,28343,819
44,832
41,70041,63342,00143,43745,545
47,39543,729
40,66740,31941,43743,83445,106
46,58043,991
43,07142,72344,59846,27745,812
49,56843,835
44,29544,46045,86045,79145,363
46,94042,615
130,198132,257129,597133,041126,459
104.5
101.1
105.3
102.5
115.7
110.9
52.3
2.12.6
21,31320,00820,14220,45121,03921,11421,64120,186
165,894
282327261265276196226176
2,009
175258193248189126128
911,408
5,664
classrooms
2,4751,6942,422
0
70.668.988.485.2
0.0
21.321.2
8.1
9.38.80.0
9.92.46.00.0
238495492
0
704 833 237 0 0 441 1121 7 0 0 213 0111 4 0 0 80 0
60 4 0 0 51 00 0 0 0 0 0
122 990 1,383 961 981 16 1222 265 577 611 652 24 0 031 131 254 613 536 31 30 053 292 172 594 854 86 25 0
0 0 0 0 0 0 0 0
0 4 16 37 17 1 0 0
16741018
7701096
0
1133856985
0
2791 0 3 23 0 268 432 22 200000
111
80
15
230
0000
195134141
0
220122140
0
15250
7440
Terminalgrade Passed
VIII boysV girlsV boys
VIII girls
0 with >60%
92.84491215316422112
0
88.644.439.4
0.0
75.788.338.340.6
0.0
130646Tamil English Urdu Others
931664079837981
0
939627
1079716604
0
1192127
000
00
17893
0
% Schools recvd.
91.798.571.875.7
0.0
91.997.771.878.3
0.0
9632589678
1372837
7325245526
53936088
9486387281
25079840
6762844594
57229080
3.06.38.4
18.40.0
2.62.32.02.2
3.53.43.2
2.32.3
95.3
92.5
0.95
2005-062004-052003-04
TAMIL NADU
52.4
Upper PrimaryPrimary
Sex ratio Sex ratio 0-6
18 168
VIII41.5
Enrolment of children
36,904VIII 39,638 39,026 41,133 41,547Total Pr. 225,769 222,481 211,363 214,316 211,477
1 - 5 6 - 8
1,378 7340 00 0
1,010 632
%Teachers recvd.in-service training
Total schools* Rural schools* Total enrolment* Rural enrolment* Teachers*
19.5 25.2
93.1
82.9
84.7 85.4
72.9 76.3% SC enrolment% SC girls to SC enrolment% ST enrolment
49.1 49.36.2
46.3 41.1
66.5
48.8
68.6
48.3
Position of teachers by educational qualification (other than para teacher)
(Previous academic year)Incentives : Number of beneficiaries
% ST girls to ST enrolment
% Girls
Number of villages
% 0 - 6 population
% SC population % ST population
% Urban population
% Schools with blackboard
% Enrolment in single-teacher schools
% Enrolment in schools without building
Primary Upperprimary
OBC EnrolmentPrimary U. Primary
% OBCEnrolment% OBC girls toOBC Enrolment
Pupil-teacher ratio (PTR)Student-classroom ratio (SCR)% Schools with <= 50 students% Schools with PTR > 100% Female teachers
% Schools established since 1995
Regular teachers Para-teachers
% minorrepairs
% majorrepairs
# = not applicable na = not available * Some totals may not match due to no response in classificatory data items
1.0 96.4
0.8 97.20.6 97.25.1 92.51.5 96.25.1 91.44.5 92.0
3031
49.43125
35.30.2
62.711.0
49.24338
0.61.2
52.73.8
41.82623
0.00.9
47.78.7
0.000
0.00.00.00.0
6.8 21.4 3.3 67.4 55.6
94899518.312.0
Category
PrivateGovt.PrivateGovtPrivateGovt.PrivateGovt.PrivateGovt.
Total population (in 000's)
Number of blocks/taluks
District
Decadal growth rate
Primary onlyPrimary with upper primaryPrimary with upper primary & sec/higher sec.Upper primary onlyUpper primary with sec./higher secondary
% Single classroom schools% Single teacher schools
P + UP P+sec/hs U.P. only UP+secP. only
No response in school category
Primary with upper primaryPrimary with U.P. & sec/higherUpper primary onlyUpper primary with sec./higher sec
Primary only
Primary onlyPrimary with upper primaryPrimary with Upper primary & sec/higherUpper primary only
Para-teachers
School category
Upper primary with sec./higher secondary
Primary onlyPrimary with upper prim.
P. onlyP + UPP+sec/hsU.P. onlyUP+sec
NER(U.Prim)GER(U.Prim)NER (Primary)GER (Primary)
Transition ratePrim. to U. Prim
3.3
SC/ST Enrolment
Indicators
Classrooms/Other rooms
Prim.with U.P.&Sec/H.SUpper Primary onlyU. Primary with Sec./H.S.
Basic Data, 2001
Data reported from
Performance indicators
99.6 69.999.5 73.798.7 46.598.8 49.5
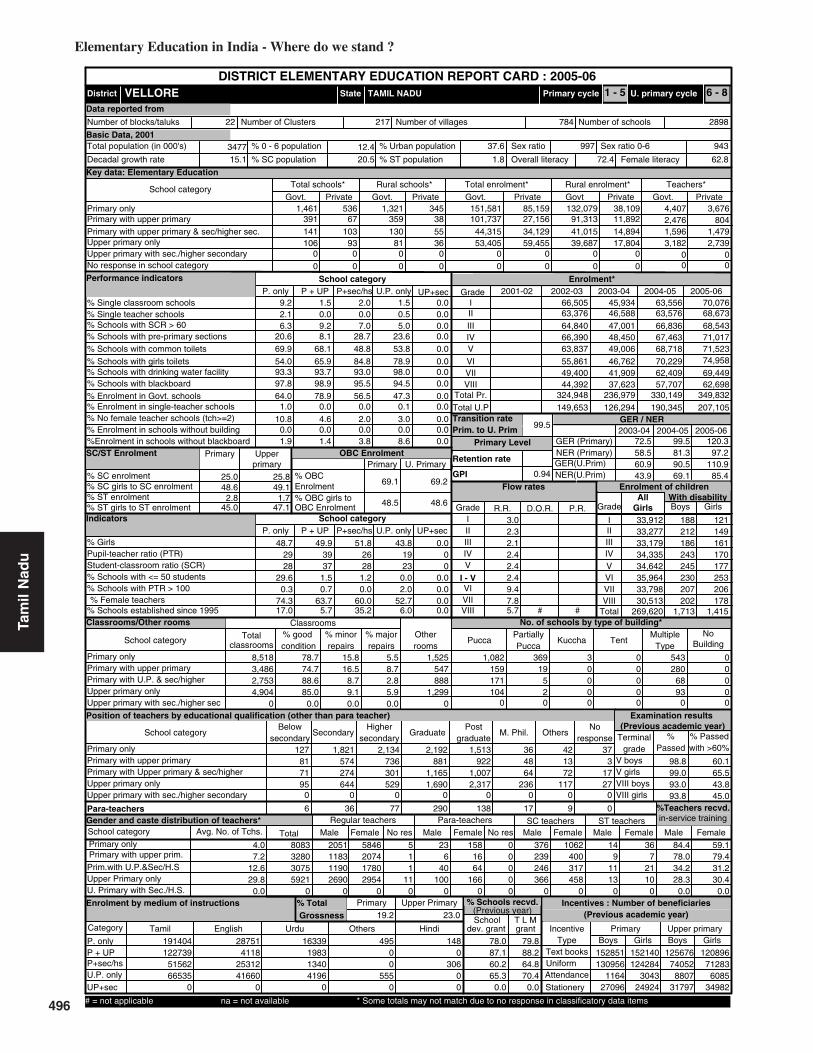
496
Elementary Education in India - Where do we stand ?
25.0 25.8
Key data: Elementary Education
3477
VELLORE
(Previous academic year)
(Previous year)
Gender and caste distribution of teachers*
No. of schools by type of building*
BoysWith disability
Flow rates
Primary Level
Enrolment*
Number of schools
Grade
GER / NER
School category
Primary Upper primaryBoys Boys GirlsGirls
IncentiveType
School categoryMultiple
TypeKuccha
PartiallyPucca
PuccaTotal % good condition
Otherrooms
TentNo
Building
Classrooms
Belowsecondary
Highersecondary
Postgraduate
M. Phil.GraduateSecondarySchool category OthersNo
response
ST teachers
Total Male Female No res Male Female No res Male Female Male FemaleSC teachers
Text booksUniformAttendanceStationery
% Passed
Avg. No. of Tchs.
%
Female literacyOverall literacy
dev. grant grantSchool T L M
Male Female
IVV
IIIIII
Grade R.R. D.O.R. P.R.
VIIVI
# #
I - V
Enrolment by medium of instructions
Examination results
Retention rate
GPI
Primary cycle U. primary cycleState
DISTRICT ELEMENTARY EDUCATION REPORT CARD : 2005-06
GirlsGrade
IIIIIIIVVVI
VIII
AllGirls
Total
VII
% TotalGrossness
School category
391141106
0
67 359103 130
930
810
0 0 0
1,461 53638 101,73755 44,31536 53,405
0 00 0
1,321 345 132,079 38,10927,156 91,313 11,89234,129 41,015 14,89459,455 39,687 17,804
0 0 00 0 0
151,581 85,159 4,4072,476
3,676804
P + UP P+sec/hs U.P. only UP+sec
School categoryP. only
9.2 1.5 2.0 1.5 0.02.1
Number of Clusters 2898784
% Schools with SCR > 600.0 0.0 0.5 0.0
6.3 9.2 7.0 5.0 0.0% Schools with pre-primary sections 20.6 8.1 28.7 23.6 0.0% Schools with common toilets 69.9 68.1 48.8 53.8 0.0
% Schools with girls toilets 54.0 65.9 84.8 78.9 0.0% Schools with drinking water facility 93.3 93.7 93.0 98.0 0.0
% Enrolment in Govt. schools 64.0 78.9 56.5 47.3 0.097.8 98.9 95.5 94.5 0.0
% No female teacher schools (tch>=2) 10.8 4.6 2.0 3.0 0.01.0 0.0 0.0 0.1 0.0
0.0 0.0 0.0 0.0 0.0%Enrolment in schools without blackboard 1.9 1.4 3.8 8.6 0.0
2001-02 2002-03 2003-04 2004-05 2005-06IIIIIIIVV
VIVII
Total U.P
70,07668,67368,54371,01771,52374,958
69,449
63,55663,57666,83667,46368,718
70,22962,409
45,93446,58847,00148,45049,006
46,76241,909
66,50563,37664,84066,39063,837
55,86149,400
207,105190,345126,294149,653
72.5
60.9
99.5
90.5
120.3
110.9
51.8
1.20.0
33,91233,27733,17934,33534,64235,96433,79830,513
269,620
188212186243245230207202
1,713
121149161170177253206178
1,415
8,518
classrooms
3,4862,7534,904
0
78.774.788.685.0
0.0
15.816.5
5.5
8.79.10.0
8.72.85.90.0
547888
1,2990
1,525 1,082 369 3 0 543 0159 19 0 0 280 0171 5 0 0 68 0104 2 0 0 93 0
0 0 0 0 0 0
127 1,821 2,134 2,192 1,513 36 4281 574 736 881 922 48 13 371 274 301 1,165 1,007 64 72 1795 644 529 1,690 2,317 236 117 27
0 0 0 0 0 0 0 0
6 36 77 290 138 17 9 0
2051118311902690
0
207417802954
0
5846 5 23 158 0 376 1062 14 3611
110
640
1000
1664
1660
0000
239246366
0
400317458
0
91113
0
72110
0
Terminalgrade Passed
VIII boysV girlsV boys
VIII girls
37 with >60%
84.48083328030755921
0
78.034.228.3
0.0
59.179.431.230.4
0.0
191404Tamil English Urdu Others Hindi
1227395156266535
0
287514118
2531241660
0
16339198313404196
0
49500
5550
1480
30600
% Schools recvd.
78.087.160.265.3
0.0
79.888.264.870.4
0.0
152851130956
116427096
12567674052
880731797
152140124284
304324924
12089671283
608534982
4.07.2
12.629.8
0.0
3.02.32.12.4
9.47.85.7
2.42.4
99.5
0.94
2005-062004-052003-04
TAMIL NADU
60.0
Upper PrimaryPrimary
Sex ratio Sex ratio 0-6
22 217
VIII35.2
Enrolment of children
VIII 44,392 37,623 57,707 62,698Total Pr. 324,948 236,979 330,149 349,832
1 - 5 6 - 8
3,182 2,7390 00 0
1,596 1,479
%Teachers recvd.in-service training
Total schools* Rural schools* Total enrolment* Rural enrolment* Teachers*
19.2 23.0
97.2
85.4
58.5 81.3
43.9 69.1% SC enrolment% SC girls to SC enrolment% ST enrolment
48.6 49.12.8
45.0 47.1
69.1
48.5
69.2
48.6
Position of teachers by educational qualification (other than para teacher)
(Previous academic year)Incentives : Number of beneficiaries
% ST girls to ST enrolment
% Girls
Number of villages
% 0 - 6 population
% SC population % ST population
% Urban population
% Schools with blackboard
% Enrolment in single-teacher schools
% Enrolment in schools without building
Primary Upperprimary
OBC EnrolmentPrimary U. Primary
% OBCEnrolment% OBC girls toOBC Enrolment
Pupil-teacher ratio (PTR)Student-classroom ratio (SCR)% Schools with <= 50 students% Schools with PTR > 100% Female teachers
% Schools established since 1995
Regular teachers Para-teachers
% minorrepairs
% majorrepairs
# = not applicable na = not available * Some totals may not match due to no response in classificatory data items
2826
48.72928
29.60.3
74.317.0
49.93937
1.50.7
63.75.7
43.81923
0.02.0
52.76.0
0.000
0.00.00.00.0
15.1 20.5 1.8 72.4 62.8
94399737.612.4
Category
PrivateGovt.PrivateGovtPrivateGovt.PrivateGovt.PrivateGovt.
Total population (in 000's)
Number of blocks/taluks
District
Decadal growth rate
Primary onlyPrimary with upper primaryPrimary with upper primary & sec/higher sec.Upper primary onlyUpper primary with sec./higher secondary
% Single classroom schools% Single teacher schools
P + UP P+sec/hs U.P. only UP+secP. only
No response in school category
Primary with upper primaryPrimary with U.P. & sec/higherUpper primary onlyUpper primary with sec./higher sec
Primary only
Primary onlyPrimary with upper primaryPrimary with Upper primary & sec/higherUpper primary only
Para-teachers
School category
Upper primary with sec./higher secondary
Primary onlyPrimary with upper prim.
P. onlyP + UPP+sec/hsU.P. onlyUP+sec
NER(U.Prim)GER(U.Prim)NER (Primary)GER (Primary)
Transition ratePrim. to U. Prim
1.7
SC/ST Enrolment
Indicators
Classrooms/Other rooms
Prim.with U.P.&Sec/H.SUpper Primary onlyU. Primary with Sec./H.S.
Basic Data, 2001
Data reported from
Performance indicators
98.8 60.199.0 65.593.0 43.893.8 45.0
Tam
il N
adu

497
Elementary Education: Report Card - VILLUPPURAM
Tam
il N
adu
33.7 34.2
Key data: Elementary Education
2960
VILUPPURAM
(Previous academic year)
(Previous year)
Gender and caste distribution of teachers*
No. of schools by type of building*
BoysWith disability
Flow rates
Primary Level
Enrolment*
Number of schools
Grade
GER / NER
School category
Primary Upper primaryBoys Boys GirlsGirls
IncentiveType
School categoryMultiple
TypeKuccha
PartiallyPucca
PuccaTotal % good condition
Otherrooms
TentNo
Building
Classrooms
Belowsecondary
Highersecondary
Postgraduate
M. Phil.GraduateSecondarySchool category OthersNo
response
ST teachers
Total Male Female No res Male Female No res Male Female Male FemaleSC teachers
Text booksUniformAttendanceStationery
% Passed
Avg. No. of Tchs.
%
Female literacyOverall literacy
dev. grant grantSchool T L M
Male Female
IVV
IIIIII
Grade R.R. D.O.R. P.R.
VIIVI
# #
I - V
Enrolment by medium of instructions
Examination results
Retention rate
GPI
Primary cycle U. primary cycleState
DISTRICT ELEMENTARY EDUCATION REPORT CARD : 2005-06
GirlsGrade
IIIIIIIVVVI
VIII
AllGirls
Total
VII
% TotalGrossness
School category
435127
970
77 42993 12664
090
00 0 0
1,298 47064 123,85076 35,17943 43,269
0 00 0
1,281 432 128,922 46,25028,358 120,819 21,79824,457 35,036 19,20438,749 40,339 22,926
0 0 00 0 0
130,479 54,886 3,6853,040
2,065726
P + UP P+sec/hs U.P. only UP+sec
School categoryP. only
11.2 1.0 2.3 0.0 0.05.1
Number of Clusters 26611389
% Schools with SCR > 600.4 0.9 0.0 0.0
8.8 18.4 10.0 5.6 0.0% Schools with pre-primary sections 18.9 12.7 25.0 18.6 0.0% Schools with common toilets 43.4 51.0 52.7 51.6 0.0
% Schools with girls toilets 30.8 43.8 70.5 75.2 0.0% Schools with drinking water facility 96.3 96.1 93.6 97.5 0.0
% Enrolment in Govt. schools 70.4 81.4 59.0 52.8 0.0100.0 100.0 100.0 100.0 0.0
% No female teacher schools (tch>=2) 15.4 7.2 10.0 3.7 0.02.1 0.2 0.5 0.0 0.0
0.0 0.0 0.0 0.0 0.0%Enrolment in schools without blackboard 0.0 0.0 0.0 0.0 0.0
2001-02 2002-03 2003-04 2004-05 2005-06IIIIIIIVV
VIVII
Total U.P
65,29557,09759,80062,59260,51358,911
59,009
54,87659,93762,49260,54862,292
61,39258,928
60,41163,86561,38663,62364,920
61,20859,095
64,99561,49763,85865,35262,980
64,05657,924
58,87161,26463,67761,69661,662
59,94653,021
173,930176,299173,376172,749157,812
114.7
99.9
108.9
100.9
123.4
109.4
48.1
0.92.3
32,01827,95229,14830,56629,52028,32928,38926,707
232,629
203256321368318321369337
2,493
169231225218201242228236
1,750
6,331
classrooms
3,5712,1563,481
0
76.170.886.584.3
0.0
18.421.0
5.6
10.510.7
0.0
8.23.15.00.0
384620799
0
776 882 415 0 0 470 1146 30 0 0 336 0121 6 0 0 93 0
75 2 0 0 84 00 0 0 0 0 0
64 1,036 1,882 1,469 1,226 26 1027 434 1,120 1,108 1,041 21 9 023 126 296 799 684 38 18 030 224 341 1,082 1,698 137 46 1
0 0 0 0 0 0 0 0
3 15 19 53 22 6 2 0
21691797
9591781
0
196310251777
0
3544 0 7 30 0 355 478 20 320010
01614
0
63413
0
0000
337189259
0
308159245
0
9560
11370
Terminalgrade Passed
VIII boysV girlsV boys
VIII girls
0 with >60%
88.75750376620343586
0
84.440.033.8
0.0
69.082.329.132.0
0.0
170956Tamil Un-Specified English Others Kashmiri
1501544429354021
0
142332054
1505525733
0
00
1202264
0
480
16800
430000
% Schools recvd.
85.496.961.870.8
0.0
84.996.560.972.7
0.0
131729122467
71528025
106963660941120040269
131069116971
436534204
96511625941280136274
3.37.49.2
22.30.0
1.01.11.01.3
2.02.02.0
1.31.1
100.0
92.6
0.96
2005-062004-052003-04
TAMIL NADU
52.1
Upper PrimaryPrimary
Sex ratio Sex ratio 0-6
24 237
VIII42.7
Enrolment of children
44,845VIII 50,769 53,073 55,979 56,010Total Pr. 307,170 318,682 314,205 300,145 305,297
1 - 5 6 - 8
2,199 1,3870 00 0
1,071 963
%Teachers recvd.in-service training
Total schools* Rural schools* Total enrolment* Rural enrolment* Teachers*
20.5 26.4
98.1
80.5
93.3 89.3
74.5 75.4% SC enrolment% SC girls to SC enrolment% ST enrolment
48.9 48.23.5
47.5 45.0
61.6
48.9
62.2
48.0
Position of teachers by educational qualification (other than para teacher)
(Previous academic year)Incentives : Number of beneficiaries
% ST girls to ST enrolment
% Girls
Number of villages
% 0 - 6 population
% SC population % ST population
% Urban population
% Schools with blackboard
% Enrolment in single-teacher schools
% Enrolment in schools without building
Primary Upperprimary
OBC EnrolmentPrimary U. Primary
% OBCEnrolment% OBC girls toOBC Enrolment
Pupil-teacher ratio (PTR)Student-classroom ratio (SCR)% Schools with <= 50 students% Schools with PTR > 100% Female teachers
% Schools established since 1995
Regular teachers Para-teachers
% minorrepairs
% majorrepairs
# = not applicable na = not available * Some totals may not match due to no response in classificatory data items
0.2 98.70.1 98.90.1 98.66.1 92.60.6 98.23.8 94.24.8 93.2
2829
49.13229
28.50.3
62.213.6
50.34043
0.60.8
52.32.5
44.32324
2.51.2
49.913.0
0.000
0.00.00.00.0
6.8 27.4 2.2 63.8 52.4
96198414.412.6
Category
PrivateGovt.PrivateGovtPrivateGovt.PrivateGovt.PrivateGovt.
Total population (in 000's)
Number of blocks/taluks
District
Decadal growth rate
Primary onlyPrimary with upper primaryPrimary with upper primary & sec/higher sec.Upper primary onlyUpper primary with sec./higher secondary
% Single classroom schools% Single teacher schools
P + UP P+sec/hs U.P. only UP+secP. only
No response in school category
Primary with upper primaryPrimary with U.P. & sec/higherUpper primary onlyUpper primary with sec./higher sec
Primary only
Primary onlyPrimary with upper primaryPrimary with Upper primary & sec/higherUpper primary only
Para-teachers
School category
Upper primary with sec./higher secondary
Primary onlyPrimary with upper prim.
P. onlyP + UPP+sec/hsU.P. onlyUP+sec
NER(U.Prim)GER(U.Prim)NER (Primary)GER (Primary)
Transition ratePrim. to U. Prim
2.3
SC/ST Enrolment
Indicators
Classrooms/Other rooms
Prim.with U.P.&Sec/H.SUpper Primary onlyU. Primary with Sec./H.S.
Basic Data, 2001
Data reported from
Performance indicators
99.9 67.299.9 71.299.4 43.599.3 47.5

498
Elementary Education in India - Where do we stand ?
0.527
25.3 24.1
Key data: Elementary Education
1751
VIRUDHUNAGAR
(Previous academic year)
(Previous year)
Gender and caste distribution of teachers*
No. of schools by type of building*
BoysWith disability
Flow rates
Primary Level
Enrolment*
Number of schools
Grade
GER / NER
School category
Primary Upper primaryBoys Boys GirlsGirls
IncentiveType
School categoryMultiple
TypeKuccha
PartiallyPucca
PuccaTotal % good condition
Otherrooms
TentNo
Building
Classrooms
Belowsecondary
Highersecondary
Postgraduate
M. Phil.GraduateSecondarySchool category OthersNo
response
ST teachers
Total Male Female No res Male Female No res Male Female Male FemaleSC teachers
Text booksUniformAttendanceStationery
% Passed
Avg. No. of Tchs.
%
Female literacyOverall literacy
dev. grant grantSchool T L M
Male Female
IVV
IIIIII
Grade R.R. D.O.R. P.R.
VIIVI
# #
I - V
Enrolment by medium of instructions
Examination results
Retention rate
GPI
Primary cycle U. primary cycleState
DISTRICT ELEMENTARY EDUCATION REPORT CARD : 2005-06
GirlsGrade
IIIIIIIVVVI
VIII
AllGirls
Total
VII
% TotalGrossness
School category
1363645
0
83 11755 3277
037
00 0 0
659 44837 33,71130 9,99325 18,457
0 00 0
640 322 46,548 45,18538,392 27,553 12,83314,694 8,611 7,47840,192 14,665 11,297
0 0 00 0 0
51,057 82,496 1,707884
2,4871,015
P + UP P+sec/hs U.P. only UP+sec
School categoryP. only
12.4 0.9 0.0 0.0 0.03.4
Number of Clusters 1539465
% Schools with SCR > 600.0 0.0 0.0 0.0
5.3 6.8 6.6 2.5 0.0% Schools with pre-primary sections 8.8 10.0 23.1 15.6 0.0% Schools with common toilets 51.9 54.3 48.4 45.9 0.0
% Schools with girls toilets 47.3 75.8 90.1 87.7 0.0% Schools with drinking water facility 97.2 98.6 96.7 98.4 0.0
% Enrolment in Govt. schools 38.2 46.8 40.5 31.5 0.099.7 99.1 96.7 95.9 0.0
% No female teacher schools (tch>=2) 8.2 1.4 2.2 3.3 0.01.7 0.0 0.0 0.0 0.0
0.0 0.0 0.0 0.0 0.0%Enrolment in schools without blackboard 0.1 1.7 5.5 4.9 0.0
2001-02 2002-03 2003-04 2004-05 2005-06IIIIIIIVV
VIVII
Total U.P
42,63837,11935,70437,88437,09936,145
32,517
40,64936,46038,48237,15137,089
35,26831,824
40,43539,34637,95537,48637,031
35,19532,383
43,73938,31537,57337,10535,914
33,76430,488
98,54897,03896,25588,107
117.5
92.8
114.6
92.4
130.1
104.8
49.3
1.10.0
20,72417,95217,36018,30818,12117,17815,56114,273
139,477
175162118124144126101109
1,059
119101
818389716447
655
4,496
classrooms
1,982882
2,7230
84.583.693.191.6
0.0
12.613.0
2.9
5.27.00.0
3.41.71.50.0
377327836
0
998 498 299 0 0 310 061 25 0 0 133 060 7 0 0 24 063 2 0 0 57 0
0 0 0 0 0 0
45 1,228 1,639 769 446 18 2331 523 529 405 373 20 9 0
7 128 140 389 303 26 24 012 349 301 754 1,290 216 54 0
0 0 0 0 0 0 0 0
2 3 8 20 24 1 1 0
972458299
13030
1432718
16730
3196 0 1 25 0 135 421 7 170000
1250
8890
0000
6940
1270
15468
1640
0020
6150
Terminalgrade Passed
VIII boysV girlsV boys
VIII girls
0 with >60%
89.64194189910272990
0
77.635.528.6
0.0
73.274.931.032.1
0.0
118362Tamil English Others
641811748441313
0
760121375631
138740
000
820
% Schools recvd.
89.591.365.982.0
0.0
89.890.968.180.3
0.0
8252061332
5114940
4653224491
29077101
7902457384
12844886
4247623483
47077082
3.88.7
11.324.5
0.0
1.61.11.01.1
4.33.12.8
1.51.3
93.4
0.94
2005-062004-052003-04
TAMIL NADU
70.7
Upper PrimaryPrimary
Sex ratio Sex ratio 0-6
11 148
VIII19.8
Enrolment of children
VIII 23,855 28,677 29,946 29,886Total Pr. 192,646 192,253 189,831 190,444
1 - 5 6 - 8
1,018 1,9720 00 0
380 647
%Teachers recvd.in-service training
Total schools* Rural schools* Total enrolment* Rural enrolment* Teachers*
18.5 24.3
100.0
79.3
93.4 91.7
66.3 70.6% SC enrolment% SC girls to SC enrolment% ST enrolment
48.8 47.6
45.2 48.0
73.0
48.4
73.0
47.7
Position of teachers by educational qualification (other than para teacher)
(Previous academic year)Incentives : Number of beneficiaries
% ST girls to ST enrolment
% Girls
Number of villages
% 0 - 6 population
% SC population % ST population
% Urban population
% Schools with blackboard
% Enrolment in single-teacher schools
% Enrolment in schools without building
Primary Upperprimary
OBC EnrolmentPrimary U. Primary
% OBCEnrolment% OBC girls toOBC Enrolment
Pupil-teacher ratio (PTR)Student-classroom ratio (SCR)% Schools with <= 50 students% Schools with PTR > 100% Female teachers
% Schools established since 1995
Regular teachers Para-teachers
% minorrepairs
% majorrepairs
# = not applicable na = not available * Some totals may not match due to no response in classificatory data items
8.1 90.32.0 96.91.6 97.40.5 98.45.1 93.43.5 95.26.4 89.45.6 91.3
2824
48.63230
38.10.5
76.85.3
49.53836
2.30.0
75.85.0
45.42022
0.80.0
56.32.5
0.000
0.00.00.00.0
11.9 19.0 0.1 73.7 63.6
958101244.411.9
Category
PrivateGovt.PrivateGovtPrivateGovt.PrivateGovt.PrivateGovt.
Total population (in 000's)
Number of blocks/taluks
District
Decadal growth rate
Primary onlyPrimary with upper primaryPrimary with upper primary & sec/higher sec.Upper primary onlyUpper primary with sec./higher secondary
% Single classroom schools% Single teacher schools
P + UP P+sec/hs U.P. only UP+secP. only
No response in school category
Primary with upper primaryPrimary with U.P. & sec/higherUpper primary onlyUpper primary with sec./higher sec
Primary only
Primary onlyPrimary with upper primaryPrimary with Upper primary & sec/higherUpper primary only
Para-teachers
School category
Upper primary with sec./higher secondary
Primary onlyPrimary with upper prim.
P. onlyP + UPP+sec/hsU.P. onlyUP+sec
NER(U.Prim)GER(U.Prim)NER (Primary)GER (Primary)
Transition ratePrim. to U. Prim
1.3
SC/ST Enrolment
Indicators
Classrooms/Other rooms
Prim.with U.P.&Sec/H.SUpper Primary onlyU. Primary with Sec./H.S.
Basic Data, 2001
Data reported from
Performance indicators
98.9 62.499.0 66.696.1 47.397.3 55.0
Tam
il N
adu

499
Elementary Education: Report Card - DHALAI
Trip
ura
15.2 21.3
Key data: Elementary Education
308
DHALAI
(Previous academic year)
(Previous year)
Gender and caste distribution of teachers*
No. of schools by type of building*
BoysWith disability
Flow rates
Primary Level
Enrolment*
Number of schools
Grade
GER / NER
School category
Primary Upper primaryBoys Boys GirlsGirls
IncentiveType
School categoryMultiple
TypeKuccha
PartiallyPucca
PuccaTotal % good condition
Otherrooms
TentNo
Building
Classrooms
Belowsecondary
Highersecondary
Postgraduate
M. Phil.GraduateSecondarySchool category OthersNo
response
ST teachers
Total Male Female No res Male Female No res Male Female Male FemaleSC teachers
Text booksUniformAttendanceStationery
% Passed
Avg. No. of Tchs.
%
Female literacyOverall literacy
dev. grant grantSchool T L M
Male Female
IVV
IIIIII
Grade R.R. D.O.R. P.R.
VIIVI
# #
I - V
Enrolment by medium of instructions
Examination results
Retention rate
GPI
Primary cycle U. primary cycleState
DISTRICT ELEMENTARY EDUCATION REPORT CARD : 2005-06
GirlsGrade
IIIIIIIVVVI
VIII
AllGirls
Total
VII
% TotalGrossness
School category
15447
06
2 1522 4101
06
0 0 0
363 12 26,1872 21,1000 01 1,1900 0
358 1 24,365 78320 25,637 320
1,055 18,607 1,0550 0 0
0 0 0161 1,190 161
24,662 78 974895
121
P + UP P+sec/hs U.P. only UP+sec
School categoryP. only
19.0 9.6 0.0 0.0 0.011.3
Number of Clusters 576152
% Schools with SCR > 603.8 0.0 0.0 0.0
10.4 18.6 40.8 0.0 0.0% Schools with pre-primary sections 1.4 1.9 2.0 0.0 0.0% Schools with common toilets 34.3 59.0 81.6 0.0 85.7
% Schools with girls toilets 0.5 6.4 28.6 0.0 42.9% Schools with drinking water facility 59.3 74.4 89.8 0.0 100.0
% Enrolment in Govt. schools 99.7 98.8 95.2 0.0 88.157.4 60.9 77.6 0.0 57.1
% No female teacher schools (tch>=2) 64.8 48.7 22.4 0.0 0.010.0 2.8 0.0 0.0 0.0
0.0 0.0 0.0 0.0 0.0%Enrolment in schools without blackboard 42.7 42.6 18.0 0.0 31.2
2001-02 2002-03 2003-04 2004-05 2005-06IIIIIIIVV
VIVII
Total U.P
14,72712,29710,978
9,8569,6076,791
5,879
16,18411,62011,102
9,9477,945
6,9535,555
15,15511,07611,002
8,9877,424
6,4545,358
17,28817,15716,110
143.8
64.0
150.7
67.5
140.9
74.7
46.3
0.00.0
6,9335,6714,9824,4713,9253,0452,6852,104
33,816
5856717351183731
395
4448423928232116
261
1,105
classrooms
781403
097
47.650.850.6
0.041.2
31.030.1
21.4
29.30.0
28.9
19.120.1
0.029.9
214212
099
279 188 10 111 1 53 086 5 18 0 46 026 4 2 0 17 0
0 0 0 0 0 05 2 0 0 0 0
373 334 119 28 0 1 1111 280 139 235 12 0 1 0
77 194 89 488 95 1 4 00 0 0 0 0 0 0 00 1 3 75 63 0 0 0
40 79 17 125 26 1 0 0
726621745
0114
157203
028
130 0 94 25 0 99 25 571 880000
11824
01
20600
0000
115156
016
1925
09
308142
06
8971
03
Terminalgrade Passed
VIII boysV girlsV boys
VIII girls
0 with >60%
49.1975916978
0143
54.046.6
0.025.2
62.652.534.9
0.017.9
24465Bengali English Bodo Others Urdu
2610820988
01136
139253
11670
215
0125
000
5821
000
780000
% Schools recvd.
98.996.295.9
0.071.4
94.288.595.9
0.085.7
2166243
338219
6863347410357
1938933224657
179
599327733005
167
2.75.9
20.00.0
20.4
13.89.6
10.08.9
12.313.5
9.2
7.510.5
74.7
0.83
2005-062004-052003-04
TRIPURA
21.4
Upper PrimaryPrimary
Sex ratio Sex ratio 0-6
5 40
VIII2.0
Enrolment of children
VIII 4,298 4,649 4,618Total Pr. 53,644 56,798 57,465
1 - 5 6 - 8
0 0129 14
0 0
936 42
%Teachers recvd.in-service training
Total schools* Rural schools* Total enrolment* Rural enrolment* Teachers*
11.0 21.4
100.0
58.849.4 46.9% SC enrolment% SC girls to SC enrolment% ST enrolment
48.5 49.069.443.7 41.2
10.1
48.9
20.2
50.7
Position of teachers by educational qualification (other than para teacher)
(Previous academic year)Incentives : Number of beneficiaries
% ST girls to ST enrolment
% Girls
Number of villages
% 0 - 6 population
% SC population % ST population
% Urban population
% Schools with blackboard
% Enrolment in single-teacher schools
% Enrolment in schools without building
Primary Upperprimary
OBC EnrolmentPrimary U. Primary
% OBCEnrolment% OBC girls toOBC Enrolment
Pupil-teacher ratio (PTR)Student-classroom ratio (SCR)% Schools with <= 50 students% Schools with PTR > 100% Female teachers
% Schools established since 1995
Regular teachers Para-teachers
% minorrepairs
% majorrepairs
# = not applicable na = not available * Some totals may not match due to no response in classificatory data items
17.1 69.15.5 84.99.2 80.80.6 90.6
17.7 74.710.4 79.214.0 73.811.0 75.5
5523
45.62522
34.62.2
15.934.1
44.42934
3.22.6
19.33.2
0.000
0.00.00.00.0
37.69
140.00.0
19.614.3
10.8 16.2 54.0 60.9 51.0
9659356.115.6
Category
PrivateGovt.PrivateGovtPrivateGovt.PrivateGovt.PrivateGovt.
Total population (in 000's)
Number of blocks/taluks
District
Decadal growth rate
Primary onlyPrimary with upper primaryPrimary with upper primary & sec/higher sec.Upper primary onlyUpper primary with sec./higher secondary
% Single classroom schools% Single teacher schools
P + UP P+sec/hs U.P. only UP+secP. only
No response in school category
Primary with upper primaryPrimary with U.P. & sec/higherUpper primary onlyUpper primary with sec./higher sec
Primary only
Primary onlyPrimary with upper primaryPrimary with Upper primary & sec/higherUpper primary only
Para-teachers
School category
Upper primary with sec./higher secondary
Primary onlyPrimary with upper prim.
P. onlyP + UPP+sec/hsU.P. onlyUP+sec
NER(U.Prim)GER(U.Prim)NER (Primary)GER (Primary)
Transition ratePrim. to U. Prim
50.9
SC/ST Enrolment
Indicators
Classrooms/Other rooms
Prim.with U.P.&Sec/H.SUpper Primary onlyU. Primary with Sec./H.S.
Basic Data, 2001
Data reported from
Performance indicators
86.9 11.087.2 12.390.0 8.891.3 8.5
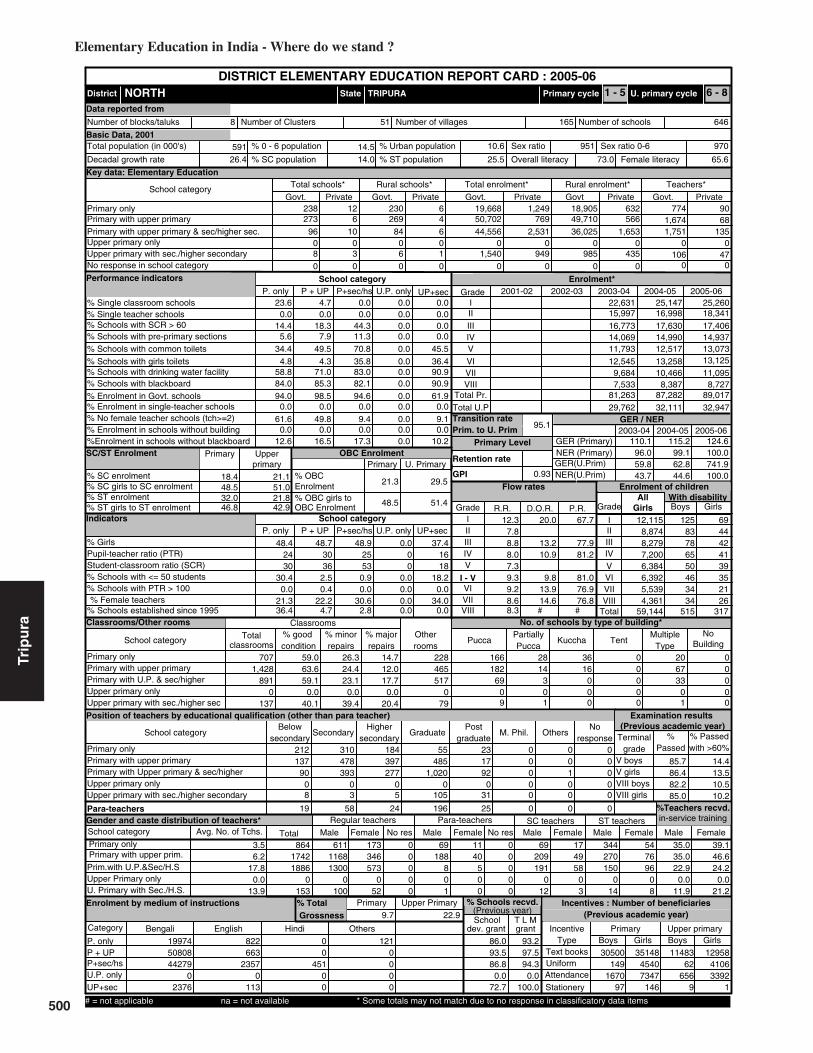
500
Elementary Education in India - Where do we stand ?
18.4 21.1
Key data: Elementary Education
591
NORTH
(Previous academic year)
(Previous year)
Gender and caste distribution of teachers*
No. of schools by type of building*
BoysWith disability
Flow rates
Primary Level
Enrolment*
Number of schools
Grade
GER / NER
School category
Primary Upper primaryBoys Boys GirlsGirls
IncentiveType
School categoryMultiple
TypeKuccha
PartiallyPucca
PuccaTotal % good condition
Otherrooms
TentNo
Building
Classrooms
Belowsecondary
Highersecondary
Postgraduate
M. Phil.GraduateSecondarySchool category OthersNo
response
ST teachers
Total Male Female No res Male Female No res Male Female Male FemaleSC teachers
Text booksUniformAttendanceStationery
% Passed
Avg. No. of Tchs.
%
Female literacyOverall literacy
dev. grant grantSchool T L M
Male Female
IVV
IIIIII
Grade R.R. D.O.R. P.R.
VIIVI
# #
I - V
Enrolment by medium of instructions
Examination results
Retention rate
GPI
Primary cycle U. primary cycleState
DISTRICT ELEMENTARY EDUCATION REPORT CARD : 2005-06
GirlsGrade
IIIIIIIVVVI
VIII
AllGirls
Total
VII
% TotalGrossness
School category
27396
08
6 26910 84
03
06
0 0 0
238 124 50,7026 44,5560 01 1,5400 0
230 6 18,905 632769 49,710 566
2,531 36,025 1,6530 0 0
0 0 0949 985 435
19,668 1,249 7741,674
9068
P + UP P+sec/hs U.P. only UP+sec
School categoryP. only
23.6 4.7 0.0 0.0 0.00.0
Number of Clusters 646165
% Schools with SCR > 600.0 0.0 0.0 0.0
14.4 18.3 44.3 0.0 0.0% Schools with pre-primary sections 5.6 7.9 11.3 0.0 0.0% Schools with common toilets 34.4 49.5 70.8 0.0 45.5
% Schools with girls toilets 4.8 4.3 35.8 0.0 36.4% Schools with drinking water facility 58.8 71.0 83.0 0.0 90.9
% Enrolment in Govt. schools 94.0 98.5 94.6 0.0 61.984.0 85.3 82.1 0.0 90.9
% No female teacher schools (tch>=2) 61.6 49.8 9.4 0.0 9.10.0 0.0 0.0 0.0 0.0
0.0 0.0 0.0 0.0 0.0%Enrolment in schools without blackboard 12.6 16.5 17.3 0.0 10.2
2001-02 2002-03 2003-04 2004-05 2005-06IIIIIIIVV
VIVII
Total U.P
25,26018,34117,40614,93713,07313,125
11,095
25,14716,99817,63014,99012,517
13,25810,466
22,63115,99716,77314,06911,793
12,5459,684
32,94732,11129,762
110.1
59.8
115.2
62.8
124.6
741.9
48.9
0.90.0
12,1158,8748,2797,2006,3846,3925,5394,361
59,144
12583786550463434
515
6944424139352126
317
707
classrooms
1,428891
0137
59.063.659.1
0.040.1
26.324.4
14.7
23.10.0
39.4
12.017.7
0.020.4
465517
079
228 166 28 36 0 20 0182 14 16 0 67 0
69 3 0 0 33 00 0 0 0 0 09 1 0 0 1 0
212 310 184 55 23 0 0137 478 397 485 17 0 0 0
90 393 277 1,020 92 0 1 00 0 0 0 0 0 0 08 3 5 105 31 0 0 0
19 58 24 196 25 0 0 0
61111681300
0100
346573
052
173 0 69 11 0 69 17 344 540000
188801
40500
0000
209191
012
4958
03
270150
014
7696
08
Terminalgrade Passed
VIII boysV girlsV boys
VIII girls
0 with >60%
35.086417421886
0153
35.022.9
0.011.9
39.146.624.2
0.021.2
19974Bengali English Hindi Others
5080844279
02376
822663
23570
113
00
45100
1210000
% Schools recvd.
86.093.586.8
0.072.7
93.297.594.3
0.0100.0
30500149
167097
1148362
6569
3514845407347
146
1295841063392
1
3.56.2
17.80.0
13.9
12.37.88.88.0
9.28.68.3
7.39.3
95.1
0.93
2005-062004-052003-04
TRIPURA
30.6
Upper PrimaryPrimary
Sex ratio Sex ratio 0-6
8 51
VIII2.8
Enrolment of children
VIII 7,533 8,387 8,727Total Pr. 81,263 87,282 89,017
1 - 5 6 - 8
0 0106 47
0 0
1,751 135
%Teachers recvd.in-service training
Total schools* Rural schools* Total enrolment* Rural enrolment* Teachers*
9.7 22.9
100.0
100.0
96.0 99.1
43.7 44.6% SC enrolment% SC girls to SC enrolment% ST enrolment
48.5 51.032.046.8 42.9
21.3
48.5
29.5
51.4
Position of teachers by educational qualification (other than para teacher)
(Previous academic year)Incentives : Number of beneficiaries
% ST girls to ST enrolment
% Girls
Number of villages
% 0 - 6 population
% SC population % ST population
% Urban population
% Schools with blackboard
% Enrolment in single-teacher schools
% Enrolment in schools without building
Primary Upperprimary
OBC EnrolmentPrimary U. Primary
% OBCEnrolment% OBC girls toOBC Enrolment
Pupil-teacher ratio (PTR)Student-classroom ratio (SCR)% Schools with <= 50 students% Schools with PTR > 100% Female teachers
% Schools established since 1995
Regular teachers Para-teachers
% minorrepairs
% majorrepairs
# = not applicable na = not available * Some totals may not match due to no response in classificatory data items
20.0 67.7
13.2 77.910.9 81.2
9.8 81.013.9 76.914.6 76.8
5325
48.42430
30.40.0
21.336.4
48.73036
2.50.4
22.24.7
0.000
0.00.00.00.0
37.41618
18.20.0
34.00.0
26.4 14.0 25.5 73.0 65.6
97095110.614.5
Category
PrivateGovt.PrivateGovtPrivateGovt.PrivateGovt.PrivateGovt.
Total population (in 000's)
Number of blocks/taluks
District
Decadal growth rate
Primary onlyPrimary with upper primaryPrimary with upper primary & sec/higher sec.Upper primary onlyUpper primary with sec./higher secondary
% Single classroom schools% Single teacher schools
P + UP P+sec/hs U.P. only UP+secP. only
No response in school category
Primary with upper primaryPrimary with U.P. & sec/higherUpper primary onlyUpper primary with sec./higher sec
Primary only
Primary onlyPrimary with upper primaryPrimary with Upper primary & sec/higherUpper primary only
Para-teachers
School category
Upper primary with sec./higher secondary
Primary onlyPrimary with upper prim.
P. onlyP + UPP+sec/hsU.P. onlyUP+sec
NER(U.Prim)GER(U.Prim)NER (Primary)GER (Primary)
Transition ratePrim. to U. Prim
21.8
SC/ST Enrolment
Indicators
Classrooms/Other rooms
Prim.with U.P.&Sec/H.SUpper Primary onlyU. Primary with Sec./H.S.
Basic Data, 2001
Data reported from
Performance indicators
85.7 14.486.4 13.582.2 10.585.0 10.2
Trip
ura

501
Elementary Education: Report Card - SOUTH
Trip
ura
17.0 20.0
Key data: Elementary Education
767
SOUTH
(Previous academic year)
(Previous year)
Gender and caste distribution of teachers*
No. of schools by type of building*
BoysWith disability
Flow rates
Primary Level
Enrolment*
Number of schools
Grade
GER / NER
School category
Primary Upper primaryBoys Boys GirlsGirls
IncentiveType
School categoryMultiple
TypeKuccha
PartiallyPucca
PuccaTotal % good condition
Otherrooms
TentNo
Building
Classrooms
Belowsecondary
Highersecondary
Postgraduate
M. Phil.GraduateSecondarySchool category OthersNo
response
ST teachers
Total Male Female No res Male Female No res Male Female Male FemaleSC teachers
Text booksUniformAttendanceStationery
% Passed
Avg. No. of Tchs.
%
Female literacyOverall literacy
dev. grant grantSchool T L M
Male Female
IVV
IIIIII
Grade R.R. D.O.R. P.R.
VIIVI
# #
I - V
Enrolment by medium of instructions
Examination results
Retention rate
GPI
Primary cycle U. primary cycleState
DISTRICT ELEMENTARY EDUCATION REPORT CARD : 2005-06
GirlsGrade
IIIIIIIVVVI
VIII
AllGirls
Total
VII
% TotalGrossness
School category
225134
031
1 2219 12503
022
0 0 0
601 11 52,1188 60,6850 02 6,9710 0
588 1 56,629 64520 50,521 520
3,908 56,384 3,2970 0 0
0 0 0878 5,142 384
59,714 64 1,9381,917
622
P + UP P+sec/hs U.P. only UP+sec
School categoryP. only
5.1 0.4 0.0 0.0 0.00.0
Number of Clusters 1005272
% Schools with SCR > 600.0 0.0 0.0 0.0
7.5 13.3 50.3 0.0 0.0% Schools with pre-primary sections 0.0 0.0 0.0 0.0 0.0% Schools with common toilets 99.8 100.0 99.3 0.0 94.1
% Schools with girls toilets 13.5 27.4 66.4 0.0 70.6% Schools with drinking water facility 95.0 96.5 100.0 0.0 97.1
% Enrolment in Govt. schools 99.9 99.0 93.9 0.0 88.888.0 96.0 96.5 0.0 94.1
% No female teacher schools (tch>=2) 72.6 46.5 21.0 0.0 20.60.0 0.0 0.0 0.0 0.0
0.0 0.0 0.0 0.0 0.0%Enrolment in schools without blackboard 9.9 4.2 4.3 0.0 5.0
2001-02 2002-03 2003-04 2004-05 2005-06IIIIIIIVV
VIVII
Total U.P
34,78529,04227,62724,64521,91618,540
15,418
35,05225,39125,98323,16719,829
18,43314,460
29,87522,70024,58620,30817,881
18,23014,733
46,84345,05844,751
125.2
72.0
139.7
72.1
151.1
83.0
47.1
0.00.0
16,40113,60812,74611,41810,123
8,9617,3806,103
86,740
9375818465785642
574
7654425042535837
412
2,159
classrooms
1,4761,168
0364
31.530.833.0
0.018.7
50.648.0
17.9
47.90.0
48.1
21.119.1
0.033.2
588770
0244
833 308 40 14 0 239 066 4 1 0 155 050 2 0 0 91 0
0 0 0 0 0 020 0 0 0 14 0
623 674 476 56 0 0 0251 565 322 725 1 0 0 0173 567 400 1,369 22 0 0 0
0 0 0 0 0 0 0 04 1 10 392 3 0 0 0
12 94 12 73 1 0 0 0
156915562039
0332
308492
078
260 0 100 15 0 227 35 927 1200000
66100
9100
0000
309453
061
4687
013
460348
029
92101
08
Terminalgrade Passed
VIII boysV girlsV boys
VIII girls
0 with >60%
46.4194419392533
0410
37.325.9
0.027.1
45.133.826.2
0.014.1
59609Bengali English Others Hindi
5219462988
07680
0444
14680
169
1690000
00
13700
% Schools recvd.
99.899.695.1
0.097.1
99.899.695.1
0.097.1
4644350
21991
141468
3176
6157439737497
88
2107736235803
5
3.28.6
17.70.0
12.1
34.013.614.012.6
24.613.711.5
12.818.9
70.7
0.87
2005-062004-052003-04
TRIPURA
19.5
Upper PrimaryPrimary
Sex ratio Sex ratio 0-6
15 88
VIII0.0
Enrolment of children
VIII 11,788 12,165 12,885Total Pr. 115,350 129,422 138,015
1 - 5 6 - 8
0 0367 43
0 0
2,384 149
%Teachers recvd.in-service training
Total schools* Rural schools* Total enrolment* Rural enrolment* Teachers*
6.4 16.5
100.0
69.252.5 51.1% SC enrolment% SC girls to SC enrolment% ST enrolment
47.2 50.347.645.9 44.7
11.3
48.7
18.9
50.8
Position of teachers by educational qualification (other than para teacher)
(Previous academic year)Incentives : Number of beneficiaries
% ST girls to ST enrolment
% Girls
Number of villages
% 0 - 6 population
% SC population % ST population
% Urban population
% Schools with blackboard
% Enrolment in single-teacher schools
% Enrolment in schools without building
Primary Upperprimary
OBC EnrolmentPrimary U. Primary
% OBCEnrolment% OBC girls toOBC Enrolment
Pupil-teacher ratio (PTR)Student-classroom ratio (SCR)% Schools with <= 50 students% Schools with PTR > 100% Female teachers
% Schools established since 1995
Regular teachers Para-teachers
% minorrepairs
% majorrepairs
# = not applicable na = not available * Some totals may not match due to no response in classificatory data items
2.4 83.63.7 83.7
16.5 70.70.2 80.92.5 72.96.9 79.4
5526
46.33128
19.91.5
14.122.8
47.52736
0.41.3
16.32.7
0.000
0.00.00.00.0
46.71922
0.00.0
19.02.9
6.1 16.6 37.7 69.9 60.3
9619457.114.3
Category
PrivateGovt.PrivateGovtPrivateGovt.PrivateGovt.PrivateGovt.
Total population (in 000's)
Number of blocks/taluks
District
Decadal growth rate
Primary onlyPrimary with upper primaryPrimary with upper primary & sec/higher sec.Upper primary onlyUpper primary with sec./higher secondary
% Single classroom schools% Single teacher schools
P + UP P+sec/hs U.P. only UP+secP. only
No response in school category
Primary with upper primaryPrimary with U.P. & sec/higherUpper primary onlyUpper primary with sec./higher sec
Primary only
Primary onlyPrimary with upper primaryPrimary with Upper primary & sec/higherUpper primary only
Para-teachers
School category
Upper primary with sec./higher secondary
Primary onlyPrimary with upper prim.
P. onlyP + UPP+sec/hsU.P. onlyUP+sec
NER(U.Prim)GER(U.Prim)NER (Primary)GER (Primary)
Transition ratePrim. to U. Prim
35.1
SC/ST Enrolment
Indicators
Classrooms/Other rooms
Prim.with U.P.&Sec/H.SUpper Primary onlyU. Primary with Sec./H.S.
Basic Data, 2001
Data reported from
Performance indicators
87.9 12.788.9 11.687.8 16.288.4 15.9

502
Elementary Education in India - Where do we stand ?
20.4 21.1
Key data: Elementary Education
1533
WEST
(Previous academic year)
(Previous year)
Gender and caste distribution of teachers*
No. of schools by type of building*
BoysWith disability
Flow rates
Primary Level
Enrolment*
Number of schools
Grade
GER / NER
School category
Primary Upper primaryBoys Boys GirlsGirls
IncentiveType
School categoryMultiple
TypeKuccha
PartiallyPucca
PuccaTotal % good condition
Otherrooms
TentNo
Building
Classrooms
Belowsecondary
Highersecondary
Postgraduate
M. Phil.GraduateSecondarySchool category OthersNo
response
ST teachers
Total Male Female No res Male Female No res Male Female Male FemaleSC teachers
Text booksUniformAttendanceStationery
% Passed
Avg. No. of Tchs.
%
Female literacyOverall literacy
dev. grant grantSchool T L M
Male Female
IVV
IIIIII
Grade R.R. D.O.R. P.R.
VIIVI
# #
I - V
Enrolment by medium of instructions
Examination results
Retention rate
GPI
Primary cycle U. primary cycleState
DISTRICT ELEMENTARY EDUCATION REPORT CARD : 2005-06
GirlsGrade
IIIIIIIVVVI
VIII
AllGirls
Total
VII
% TotalGrossness
School category
331266
013
13 31436 217
06
08
0 0 0
635 218 74,864
11 145,3700 03 3,3380 0
604 14 51,781 1,5633,717 69,029 2,079
29,019 108,925 7,1840 0 0
0 0 01,810 1,654 846
55,457 2,537 3,4193,693
148149
P + UP P+sec/hs U.P. only UP+sec
School categoryP. only
19.2 3.5 0.0 0.0 0.00.2
Number of Clusters 1321337
% Schools with SCR > 600.0 0.0 0.0 0.0
9.3 20.9 55.3 0.0 5.3% Schools with pre-primary sections 2.7 7.0 8.3 0.0 0.0% Schools with common toilets 40.7 61.0 67.9 0.0 63.2
% Schools with girls toilets 10.1 19.8 44.0 0.0 47.4% Schools with drinking water facility 51.1 68.0 79.8 0.0 84.2
% Enrolment in Govt. schools 95.6 95.3 83.4 0.0 64.8100.0 100.0 99.3 0.0 100.0
% No female teacher schools (tch>=2) 52.6 32.8 7.0 0.0 10.50.1 0.0 0.0 0.0 0.0
0.0 0.0 0.0 0.0 0.0%Enrolment in schools without blackboard 0.0 0.0 0.0 0.0 0.0
2001-02 2002-03 2003-04 2004-05 2005-06IIIIIIIVV
VIVII
Total U.P
44,61340,01346,80744,79739,76439,256
32,650
44,57739,20349,07044,24037,571
37,52430,701
41,29538,64349,94441,77336,385
35,30731,062
100,11894,34792,281
110.4
72.6
111.8
72.9
125.9
90.9
49.6
0.70.7
21,75119,60922,45921,94819,67019,33416,28413,933
154,988
163127165184128124
96108
1,095
10192
135116
93787862
755
2,371
classrooms
2,0452,968
0229
50.655.352.1
0.048.9
27.826.4
21.6
27.00.0
33.6
18.420.9
0.017.5
6941,482
0107
712 109 213 115 2 215 061 110 23 0 149 086 99 6 0 111 0
0 0 0 0 0 08 10 0 0 1 0
1,158 1,317 792 206 25 0 4638 1,343 685 1,070 25 1 8 0617 1,516 1,361 3,738 821 9 21 0
0 0 0 0 0 0 0 06 20 20 210 84 2 2 0
36 46 15 59 4 0 2 0
266829275141
0212
8432942
0132
834 0 51 14 0 321 59 1535 4370000
5719
00
15600
0000
359785
028
83320
014
1341961
019
309500
09
Terminalgrade Passed
VIII boysV girlsV boys
VIII girls
0 with >60%
12.3356738428108
0344
12.87.00.03.3
13.314.2
5.30.02.3
56284Bengali English Bodo Hindi Others
75295158755
04573
5521889
151200
575
566481
000
240670
000
242155100
00
% Schools recvd.
85.787.883.8
0.078.9
62.572.163.6
0.042.1
43034355895483
2700765
1170160
485241094315344
822
303409351
11717299
5.411.226.8
0.018.1
16.811.823.217.1
20.216.612.6
13.116.7
84.4
0.95
2005-062004-052003-04
TRIPURA
36.4
Upper PrimaryPrimary
Sex ratio Sex ratio 0-6
17 66
VIII2.6
Enrolment of children
VIII 25,912 26,122 28,212Total Pr. 208,040 214,661 215,994
1 - 5 6 - 8
0 0260 84
0 0
7,159 949
%Teachers recvd.in-service training
Total schools* Rural schools* Total enrolment* Rural enrolment* Teachers*
10.5 28.5
100.0
65.0
99.4 99.6
54.5 54.4% SC enrolment% SC girls to SC enrolment% ST enrolment
49.1 50.434.148.3 47.3
15.9
48.7
21.2
50.6
Position of teachers by educational qualification (other than para teacher)
(Previous academic year)Incentives : Number of beneficiaries
% ST girls to ST enrolment
% Girls
Number of villages
% 0 - 6 population
% SC population % ST population
% Urban population
% Schools with blackboard
% Enrolment in single-teacher schools
% Enrolment in schools without building
Primary Upperprimary
OBC EnrolmentPrimary U. Primary
% OBCEnrolment% OBC girls toOBC Enrolment
Pupil-teacher ratio (PTR)Student-classroom ratio (SCR)% Schools with <= 50 students% Schools with PTR > 100% Female teachers
% Schools established since 1995
Regular teachers Para-teachers
% minorrepairs
% majorrepairs
# = not applicable na = not available * Some totals may not match due to no response in classificatory data items
3.7 79.4
0.9 75.94.1 78.82.6 84.41.9 81.36.4 73.42.2 81.2
5922
48.51624
30.90.2
23.828.0
49.02038
2.00.3
22.33.8
0.000
0.00.00.00.0
37.11522
0.00.0
38.45.3
18.3 19.3 25.3 77.3 69.6
96795126.812.6
Category
PrivateGovt.PrivateGovtPrivateGovt.PrivateGovt.PrivateGovt.
Total population (in 000's)
Number of blocks/taluks
District
Decadal growth rate
Primary onlyPrimary with upper primaryPrimary with upper primary & sec/higher sec.Upper primary onlyUpper primary with sec./higher secondary
% Single classroom schools% Single teacher schools
P + UP P+sec/hs U.P. only UP+secP. only
No response in school category
Primary with upper primaryPrimary with U.P. & sec/higherUpper primary onlyUpper primary with sec./higher sec
Primary only
Primary onlyPrimary with upper primaryPrimary with Upper primary & sec/higherUpper primary only
Para-teachers
School category
Upper primary with sec./higher secondary
Primary onlyPrimary with upper prim.
P. onlyP + UPP+sec/hsU.P. onlyUP+sec
NER(U.Prim)GER(U.Prim)NER (Primary)GER (Primary)
Transition ratePrim. to U. Prim
29.9
SC/ST Enrolment
Indicators
Classrooms/Other rooms
Prim.with U.P.&Sec/H.SUpper Primary onlyU. Primary with Sec./H.S.
Basic Data, 2001
Data reported from
Performance indicators
85.0 17.286.6 17.085.6 13.087.8 14.1
Trip
ura

503
Elementary Education: Report Card - AGRA
Utt
ar P
rad
esh
0.0000.014
30.5 30.0
Key data: Elementary Education
3620
AGRA
(Previous academic year)
(Previous year)
Gender and caste distribution of teachers*
No. of schools by type of building*
BoysWith disability
Flow rates
Primary Level
Enrolment*
Number of schools
Grade
GER / NER
School category
Primary Upper primaryBoys Boys GirlsGirls
IncentiveType
School categoryMultiple
TypeKuccha
PartiallyPucca
PuccaTotal % good condition
Otherrooms
TentNo
Building
Classrooms
Belowsecondary
Highersecondary
Postgraduate
M. Phil.GraduateSecondarySchool category OthersNo
response
ST teachers
Total Male Female No res Male Female No res Male Female Male FemaleSC teachers
Text booksUniformAttendanceStationery
% Passed
Avg. No. of Tchs.
%
Female literacyOverall literacy
dev. grant grantSchool T L M
Male Female
IVV
IIIIII
Grade R.R. D.O.R. P.R.
VIIVI
# #
I - V
Enrolment by medium of instructions
Examination results
Retention rate
GPI
Primary cycle U. primary cycleState
DISTRICT ELEMENTARY EDUCATION REPORT CARD : 2005-06
GirlsGrade
IIIIIIIVVVI
VIII
AllGirls
Total
VII
% TotalGrossness
School category
191
3516
141 716 14329
3226
0 0 0
1,688 31581 9,62811 50633 35,05623 975
0 0
1,444 199 260,406 42,76663,533 2,847 35,822
7,818 506 5,2377,286 33,221 5,751
0 0 07,441 975 5,545
291,794 73,323 5,277108
1,288680
P + UP P+sec/hs U.P. only UP+sec
School categoryP. only
1.6 0.0 0.0 1.3 0.09.0
Number of Clusters 26091580
% Schools with SCR > 600.0 0.0 16.0 0.0
45.0 35.6 47.1 6.3 11.4% Schools with pre-primary sections 48.9 0.0 5.9 3.8 0.0% Schools with common toilets 86.3 93.1 100.0 84.0 94.3
% Schools with girls toilets 77.2 90.6 100.0 73.4 88.6% Schools with drinking water facility 87.1 99.4 100.0 80.5 100.0
% Enrolment in Govt. schools 79.9 13.2 6.1 82.8 11.699.3 96.3 100.0 99.5 100.0
% No female teacher schools (tch>=2) 33.0 45.6 58.8 55.6 82.94.6 0.0 0.0 7.3 0.0
0.7 0.0 0.0 0.0 0.5%Enrolment in schools without blackboard 0.0 1.2 0.0 0.0 0.0
2001-02 2002-03 2003-04 2004-05 2005-06IIIIIIIVV
VIVII
Total U.P
112,25995,64282,23769,63657,75830,104
25,980
107,42188,74279,30663,27453,190
24,20822,077
105,81890,39374,44061,02049,624
22,33620,076
109,98682,68169,34253,44644,010
20,05817,262
105,39378,68763,25650,57041,584
17,90116,016
79,82866,70160,72753,29848,211
66.3
19.4
66.1
20.7
84.5
26.4
31.9
0.047.1
51,57345,16438,97933,16626,62612,79710,880
9,483228,668
289312401349311117104
871,970
152209230231190
676448
1,191
6,082
classrooms
1,293143
1,537272
68.796.595.176.192.6
23.83.5
7.5
4.919.5
5.5
0.00.04.41.8
19320
51665
1,581 1,965 0 0 0 0 38157 0 0 0 0 3
17 0 0 0 0 0392 0 0 0 0 2
34 0 0 0 0 1
97 866 1,417 1,557 1,161 17 02 22 122 385 252 3 0 10 6 7 30 47 1 0 09 39 455 470 338 5 0 11 1 13 44 78 1 0 0
3 66 709 491 155 1 1 0
3511558
771067
118
22914
25020
1614 0 850 590 0 618 236 18 80000
1000
0010
0000
623
2387
304
680
1220
1010
Terminalgrade Passed
VIII boysV girlsV boys
VIII girls
10 with >60%
49.46565788
911318
138
0.00.0
47.04.2
44.40.00.0
39.40.0
364906Hindi Others
731618324
422218416
21100
1210
% Schools recvd.
67.80.00.0
50.35.7
67.33.10.0
51.317.1
1125103
220175
92484
137
1255173
176183
146334
209
3.34.95.43.33.9
4.13.33.32.8
1.71.41.6
2.33.3
53.6
55.8
0.88
2005-062004-052003-04
UTTAR PRADESH
15.4
Upper PrimaryPrimary
Sex ratio Sex ratio 0-6
17 122
VIII41.2
Enrolment of children
14,294VIII 15,978 18,315 20,416 23,744Total Pr. 339,490 359,465 381,295 391,933 417,532
1 - 5 6 - 8
1,149 16919 119
0 0
6 85
%Teachers recvd.in-service training
Total schools* Rural schools* Total enrolment* Rural enrolment* Teachers*
5.7 13.3
79.7
22.9
60.9 60.1
16.9 17.7% SC enrolment% SC girls to SC enrolment% ST enrolment
46.2 40.9
53.4 0.0
45.4
46.7
39.1
40.2
Position of teachers by educational qualification (other than para teacher)
(Previous academic year)Incentives : Number of beneficiaries
% ST girls to ST enrolment
% Girls
Number of villages
% 0 - 6 population
% SC population % ST population
% Urban population
% Schools with blackboard
% Enrolment in single-teacher schools
% Enrolment in schools without building
Primary Upperprimary
OBC EnrolmentPrimary U. Primary
% OBCEnrolment% OBC girls toOBC Enrolment
Pupil-teacher ratio (PTR)Student-classroom ratio (SCR)% Schools with <= 50 students% Schools with PTR > 100% Female teachers
% Schools established since 1995
Regular teachers Para-teachers
% minorrepairs
% majorrepairs
# = not applicable na = not available * Some totals may not match due to no response in classificatory data items
9.6 86.37.0 89.7
11.2 85.57.8 89.3
41.9 55.813.4 83.3
5891
47.75660
5.39.8
33.636.5
39.19357
1.936.929.147.5
44.93228
28.43.0
19.052.3
49.86131
8.611.414.5
2.9
31.3 21.8 na 62.6 48.3
86684643.318.2
Category
PrivateGovt.PrivateGovtPrivateGovt.PrivateGovt.PrivateGovt.
Total population (in 000's)
Number of blocks/taluks
District
Decadal growth rate
Primary onlyPrimary with upper primaryPrimary with upper primary & sec/higher sec.Upper primary onlyUpper primary with sec./higher secondary
% Single classroom schools% Single teacher schools
P + UP P+sec/hs U.P. only UP+secP. only
No response in school category
Primary with upper primaryPrimary with U.P. & sec/higherUpper primary onlyUpper primary with sec./higher sec
Primary only
Primary onlyPrimary with upper primaryPrimary with Upper primary & sec/higherUpper primary only
Para-teachers
School category
Upper primary with sec./higher secondary
Primary onlyPrimary with upper prim.
P. onlyP + UPP+sec/hsU.P. onlyUP+sec
NER(U.Prim)GER(U.Prim)NER (Primary)GER (Primary)
Transition ratePrim. to U. Prim
SC/ST Enrolment
Indicators
Classrooms/Other rooms
Prim.with U.P.&Sec/H.SUpper Primary onlyU. Primary with Sec./H.S.
Basic Data, 2001
Data reported from
Performance indicators
98.4 37.498.6 35.299.0 35.098.7 37.2

504
Elementary Education in India - Where do we stand ?
0.0000.001
30.3 28.6
Key data: Elementary Education
2992
ALIGARH
(Previous academic year)
(Previous year)
Gender and caste distribution of teachers*
No. of schools by type of building*
BoysWith disability
Flow rates
Primary Level
Enrolment*
Number of schools
Grade
GER / NER
School category
Primary Upper primaryBoys Boys GirlsGirls
IncentiveType
School categoryMultiple
TypeKuccha
PartiallyPucca
PuccaTotal % good condition
Otherrooms
TentNo
Building
Classrooms
Belowsecondary
Highersecondary
Postgraduate
M. Phil.GraduateSecondarySchool category OthersNo
response
ST teachers
Total Male Female No res Male Female No res Male Female Male FemaleSC teachers
Text booksUniformAttendanceStationery
% Passed
Avg. No. of Tchs.
%
Female literacyOverall literacy
dev. grant grantSchool T L M
Male Female
IVV
IIIIII
Grade R.R. D.O.R. P.R.
VIIVI
# #
I - V
Enrolment by medium of instructions
Examination results
Retention rate
GPI
Primary cycle U. primary cycleState
DISTRICT ELEMENTARY EDUCATION REPORT CARD : 2005-06
GirlsGrade
IIIIIIIVVVI
VIII
AllGirls
Total
VII
% TotalGrossness
School category
160
4633
158 50 0
13615
4573
64 0 1
1,511 31990 5,862
0 0125 43,528
15 2410 0
1,417 283 245,737 49,78960,784 1,292 38,053
0 0 023,591 43,135 21,514
0 0 02,682 241 2,682
256,117 54,549 4,63089
1,471838
P + UP P+sec/hs U.P. only UP+sec
School categoryP. only
1.1 0.0 0.0 0.0 0.02.7
Number of Clusters 26851459
% Schools with SCR > 600.0 0.0 10.0 0.0
29.9 25.9 0.0 4.8 11.1% Schools with pre-primary sections 13.4 2.9 0.0 5.3 5.6% Schools with common toilets 96.1 97.7 0.0 96.3 94.4
% Schools with girls toilets 92.4 92.5 0.0 89.8 88.9% Schools with drinking water facility 99.7 99.4 0.0 98.0 100.0
% Enrolment in Govt. schools 82.4 8.8 0.0 64.9 8.299.9 100.0 0.0 99.8 100.0
% No female teacher schools (tch>=2) 33.1 35.1 0.0 56.9 83.31.3 0.0 0.0 4.0 0.0
0.0 0.0 0.0 0.0 0.0%Enrolment in schools without blackboard 0.0 0.0 0.0 0.0 0.0
2001-02 2002-03 2003-04 2004-05 2005-06IIIIIIIVV
VIVII
Total U.P
91,51581,24172,57560,87548,94234,221
30,233
78,72267,28459,66646,10536,859
21,70619,307
81,61467,56454,43142,60635,073
22,74119,704
77,84356,77348,34137,38030,012
17,79815,036
92,20658,83059,96845,628
60.3
23.6
60.5
22.7
86.9
36.8
0.0
0.00.0
40,73837,26133,61628,00921,86614,27012,28611,028
199,074
3971,020
872642368177206197
3,879
810826652433211156176148
3,412
6,392
classrooms
1,4810
2,671213
80.194.2
0.083.687.8
16.95.5
3.0
0.014.0
8.0
0.30.02.54.2
3270
93265
1,739 1,826 0 1 0 1 2174 0 0 0 0 0
0 0 0 0 0 0597 0 0 0 1 1
18 0 0 0 0 0
90 766 1,750 1,432 1,046 19 67 23 231 207 309 2 1 70 0 0 0 0 0 0 0
16 122 1,014 453 782 8 1 41 1 8 12 62 0 0 0
4 34 845 140 117 4 0 0
3239474
01937
75
3080
4639
1871 0 586 405 0 327 101 64 365000
110093
30010
0000
560
2895
240
690
220
361
6070
Terminalgrade Passed
VIII boysV girlsV boys
VIII girls
1 with >60%
5.76101927
02410
87
0.30.0
11.30.0
5.90.00.0
11.20.0
310666Hindi Others
666460
669942923
000
1250
% Schools recvd.
72.02.30.0
56.911.1
71.11.10.0
56.85.6
919840
62028201
1126111
1039159
1081230
59301130
170465
742372
3.35.30.04.04.8
5.04.24.03.4
3.32.52.8
3.54.2
90.9
0.83
2005-062004-052003-04
UTTAR PRADESH
0.0
Upper PrimaryPrimary
Sex ratio Sex ratio 0-6
14 129
VIII0.0
Enrolment of children
VIII 12,794 17,523 17,817 27,752Total Pr. 250,349 281,288 288,636 355,148
1 - 5 6 - 8
1,762 64813 74
0 0
0 0
%Teachers recvd.in-service training
Total schools* Rural schools* Total enrolment* Rural enrolment* Teachers*
9.5 21.0
78.6
29.1
60.3 56.3
15.3 18.2% SC enrolment% SC girls to SC enrolment% ST enrolment
46.5 41.2
50.0 0.0
45.3
44.6
43.0
38.8
Position of teachers by educational qualification (other than para teacher)
(Previous academic year)Incentives : Number of beneficiaries
% ST girls to ST enrolment
% Girls
Number of villages
% 0 - 6 population
% SC population % ST population
% Urban population
% Schools with blackboard
% Enrolment in single-teacher schools
% Enrolment in schools without building
Primary Upperprimary
OBC EnrolmentPrimary U. Primary
% OBCEnrolment% OBC girls toOBC Enrolment
Pupil-teacher ratio (PTR)Student-classroom ratio (SCR)% Schools with <= 50 students% Schools with PTR > 100% Female teachers
% Schools established since 1995
Regular teachers Para-teachers
% minorrepairs
% majorrepairs
# = not applicable na = not available * Some totals may not match due to no response in classificatory data items
5.6 90.900
47.05149
4.58.8
37.337.5
35.07245
1.719.536.553.4
42.72825
20.41.7
19.353.9
37.33414
11.15.6
10.311.1
22.1 21.2 na 58.5 43.0
88586228.918.8
Category
PrivateGovt.PrivateGovtPrivateGovt.PrivateGovt.PrivateGovt.
Total population (in 000's)
Number of blocks/taluks
District
Decadal growth rate
Primary onlyPrimary with upper primaryPrimary with upper primary & sec/higher sec.Upper primary onlyUpper primary with sec./higher secondary
% Single classroom schools% Single teacher schools
P + UP P+sec/hs U.P. only UP+secP. only
No response in school category
Primary with upper primaryPrimary with U.P. & sec/higherUpper primary onlyUpper primary with sec./higher sec
Primary only
Primary onlyPrimary with upper primaryPrimary with Upper primary & sec/higherUpper primary only
Para-teachers
School category
Upper primary with sec./higher secondary
Primary onlyPrimary with upper prim.
P. onlyP + UPP+sec/hsU.P. onlyUP+sec
NER(U.Prim)GER(U.Prim)NER (Primary)GER (Primary)
Transition ratePrim. to U. Prim
SC/ST Enrolment
Indicators
Classrooms/Other rooms
Prim.with U.P.&Sec/H.SUpper Primary onlyU. Primary with Sec./H.S.
Basic Data, 2001
Data reported from
Performance indicators
98.9 47.098.5 45.797.1 42.097.9 44.2
Utt
ar P
rad
esh

505
Elementary Education: Report Card - ALLAHABAD
Utt
ar P
rad
esh
0.2370.130
31.2 25.4
Key data: Elementary Education
4936
ALLAHABAD
(Previous academic year)
(Previous year)
Gender and caste distribution of teachers*
No. of schools by type of building*
BoysWith disability
Flow rates
Primary Level
Enrolment*
Number of schools
Grade
GER / NER
School category
Primary Upper primaryBoys Boys GirlsGirls
IncentiveType
School categoryMultiple
TypeKuccha
PartiallyPucca
PuccaTotal % good condition
Otherrooms
TentNo
Building
Classrooms
Belowsecondary
Highersecondary
Postgraduate
M. Phil.GraduateSecondarySchool category OthersNo
response
ST teachers
Total Male Female No res Male Female No res Male Female Male FemaleSC teachers
Text booksUniformAttendanceStationery
% Passed
Avg. No. of Tchs.
%
Female literacyOverall literacy
dev. grant grantSchool T L M
Male Female
IVV
IIIIII
Grade R.R. D.O.R. P.R.
VIIVI
# #
I - V
Enrolment by medium of instructions
Examination results
Retention rate
GPI
Primary cycle U. primary cycleState
DISTRICT ELEMENTARY EDUCATION REPORT CARD : 2005-06
GirlsGrade
IIIIIIIVVVI
VIII
AllGirls
Total
VII
% TotalGrossness
School category
111
6912
285 817 1
3537
6582
2 0 0
2,156 284122 2,314
7 294283 77,830
7 7250 0
2,068 139 487,888 33,489118,652 1,766 55,895
6,865 294 3,08977,596 75,579 66,139
0 0 01,577 725 1,577
500,454 56,431 8,16846
9741,040
P + UP P+sec/hs U.P. only UP+sec
School categoryP. only
0.7 0.0 0.0 0.4 0.04.5
Number of Clusters 38092108
% Schools with SCR > 600.0 0.0 26.4 0.0
41.7 29.7 11.1 12.1 22.2% Schools with pre-primary sections 3.0 0.0 5.6 1.3 11.1% Schools with common toilets 92.5 97.3 100.0 91.9 88.9
% Schools with girls toilets 83.6 93.6 83.3 83.8 55.6% Schools with drinking water facility 92.3 99.3 100.0 87.5 100.0
% Enrolment in Govt. schools 89.9 1.9 4.1 50.1 31.5100.0 99.7 100.0 100.0 100.0
% No female teacher schools (tch>=2) 14.3 32.1 38.9 43.9 88.92.4 0.0 0.0 9.7 0.0
0.1 0.0 0.0 0.0 0.0%Enrolment in schools without blackboard 0.0 0.4 0.0 0.0 0.0
2001-02 2002-03 2003-04 2004-05 2005-06IIIIIIIVV
VIVII
Total U.P
158,596140,113128,405113,152
92,82778,162
67,967
128,392112,139106,555
83,77368,725
43,82339,767
131,839115,312
94,49077,62964,960
41,36936,736
129,41091,96180,62065,04653,440
32,87028,648
209,645121,089112,59087,652
62.3
26.6
62.6
27.9
93.9
50.8
60.6
0.066.7
77,23669,64163,59955,89945,21537,23531,56029,381
409,766
342415470461356158158167
2,527
229243364307247132116115
1,753
10,112
classrooms
2,616260
5,095117
77.296.0
100.087.6
100.0
18.53.8
4.4
0.010.2
0.0
0.20.02.20.0
68765
1,74546
2,852 2,392 24 5 0 15 4280 7 0 0 9 0
18 0 0 0 0 01,001 22 0 0 20 1
9 0 0 0 0 0
131 530 1,443 3,011 1,309 17 47 17 55 632 373 0 0 00 1 1 33 24 0 0 0
44 133 668 1,304 876 2 1 113 1 1 10 20 0 0 0
30 60 1,018 1,038 524 1 0 0
3498575
262267
33
50933
7722
2957 0 1249 1438 0 576 485 30 370000
1020
1000
0000
492
2970
460
1350
20
210
7060
Terminalgrade Passed
VIII boysV girlsV boys
VIII girls
10 with >60%
31.691421086
593041
35
0.93.8
14.73.0
23.51.03.0
11.90.0
555305Hindi Sanskrit Urdu Others
1183977159
1547342302
2692410
000
936159
000
10700
4460
% Schools recvd.
81.61.00.0
51.20.0
81.50.30.0
52.50.0
16968098
118299162
171950
152608
2084616
1175850
266520
1251514
3.73.73.32.93.9
3.01.61.31.1
0.61.20.8
1.11.8
100.0
0.97
2005-062004-052003-04
UTTAR PRADESH
55.9
Upper PrimaryPrimary
Sex ratio Sex ratio 0-6
22 297
VIII16.7
Enrolment of children
VIII 26,134 34,485 37,499 63,516Total Pr. 420,477 484,230 499,584 633,093
1 - 5 6 - 8
1,730 1,31112 23
0 0
5 54
%Teachers recvd.in-service training
Total schools* Rural schools* Total enrolment* Rural enrolment* Teachers*
14.6 21.9
80.2
39.6
58.6 58.0
23.9 23.4% SC enrolment% SC girls to SC enrolment% ST enrolment
48.0 45.0
43.6 56.3
49.9
49.7
48.0
46.5
Position of teachers by educational qualification (other than para teacher)
(Previous academic year)Incentives : Number of beneficiaries
% ST girls to ST enrolment
% Girls
Number of villages
% 0 - 6 population
% SC population % ST population
% Urban population
% Schools with blackboard
% Enrolment in single-teacher schools
% Enrolment in schools without building
Primary Upperprimary
OBC EnrolmentPrimary U. Primary
% OBCEnrolment% OBC girls toOBC Enrolment
Pupil-teacher ratio (PTR)Student-classroom ratio (SCR)% Schools with <= 50 students% Schools with PTR > 100% Female teachers
% Schools established since 1995
Regular teachers Para-teachers
% minorrepairs
% majorrepairs
# = not applicable na = not available * Some totals may not match due to no response in classificatory data items
28121
49.56155
2.812.948.133.7
47.7111
460.7
45.347.030.4
45.85131
23.714.025.452.2
42.56620
0.011.1
5.70.0
26.7 21.6 0.1 62.1 46.4
91787924.518.2
Category
PrivateGovt.PrivateGovtPrivateGovt.PrivateGovt.PrivateGovt.
Total population (in 000's)
Number of blocks/taluks
District
Decadal growth rate
Primary onlyPrimary with upper primaryPrimary with upper primary & sec/higher sec.Upper primary onlyUpper primary with sec./higher secondary
% Single classroom schools% Single teacher schools
P + UP P+sec/hs U.P. only UP+secP. only
No response in school category
Primary with upper primaryPrimary with U.P. & sec/higherUpper primary onlyUpper primary with sec./higher sec
Primary only
Primary onlyPrimary with upper primaryPrimary with Upper primary & sec/higherUpper primary only
Para-teachers
School category
Upper primary with sec./higher secondary
Primary onlyPrimary with upper prim.
P. onlyP + UPP+sec/hsU.P. onlyUP+sec
NER(U.Prim)GER(U.Prim)NER (Primary)GER (Primary)
Transition ratePrim. to U. Prim
SC/ST Enrolment
Indicators
Classrooms/Other rooms
Prim.with U.P.&Sec/H.SUpper Primary onlyU. Primary with Sec./H.S.
Basic Data, 2001
Data reported from
Performance indicators
98.4 35.898.0 32.598.6 34.697.3 35.3

506
Elementary Education in India - Where do we stand ?
0.1010.229
28.3 22.1
Key data: Elementary Education
2027
AMBEDKAR NAGAR
(Previous academic year)
(Previous year)
Gender and caste distribution of teachers*
No. of schools by type of building*
BoysWith disability
Flow rates
Primary Level
Enrolment*
Number of schools
Grade
GER / NER
School category
Primary Upper primaryBoys Boys GirlsGirls
IncentiveType
School categoryMultiple
TypeKuccha
PartiallyPucca
PuccaTotal % good condition
Otherrooms
TentNo
Building
Classrooms
Belowsecondary
Highersecondary
Postgraduate
M. Phil.GraduateSecondarySchool category OthersNo
response
ST teachers
Total Male Female No res Male Female No res Male Female Male FemaleSC teachers
Text booksUniformAttendanceStationery
% Passed
Avg. No. of Tchs.
%
Female literacyOverall literacy
dev. grant grantSchool T L M
Male Female
IVV
IIIIII
Grade R.R. D.O.R. P.R.
VIIVI
# #
I - V
Enrolment by medium of instructions
Examination results
Retention rate
GPI
Primary cycle U. primary cycleState
DISTRICT ELEMENTARY EDUCATION REPORT CARD : 2005-06
GirlsGrade
IIIIIIIVVVI
VIII
AllGirls
Total
VII
% TotalGrossness
School category
51
2662
49 54 1
1928
2612
0 0 0
1,172 39648 3,661
4 84176 68,952
8 1,3980 0
1,157 370 254,082 92,79919,882 3,661 19,190
854 84 85463,498 68,012 56,200
0 0 02,106 1,398 2,106
259,358 102,426 3,43723
1,357233
P + UP P+sec/hs U.P. only UP+sec
School categoryP. only
0.8 0.0 0.0 1.1 0.01.4
Number of Clusters 20951141
% Schools with SCR > 600.0 0.0 3.9 0.0
48.7 29.6 0.0 39.1 20.0% Schools with pre-primary sections 1.4 1.9 0.0 0.9 0.0% Schools with common toilets 91.8 92.6 60.0 89.1 100.0
% Schools with girls toilets 84.6 92.6 80.0 84.7 90.0% Schools with drinking water facility 99.6 100.0 80.0 99.1 100.0
% Enrolment in Govt. schools 71.7 15.6 9.0 52.1 39.986.8 100.0 100.0 99.6 100.0
% No female teacher schools (tch>=2) 38.7 51.9 100.0 57.4 70.01.4 0.0 0.0 2.9 0.0
0.6 0.0 0.0 1.2 0.0%Enrolment in schools without blackboard 12.7 0.0 0.0 1.0 0.0
2001-02 2002-03 2003-04 2004-05 2005-06IIIIIIIVV
VIVII
Total U.P
92,91578,62974,07668,42961,95652,358
48,685
87,05368,52265,05957,52951,920
41,96937,357
84,92767,84560,51052,81749,196
34,90131,627
93,18764,52757,51651,23845,690
29,07826,355
88,37560,09454,81146,40143,185
20,62118,176
146,214113,40895,48078,93854,909
99.3
55.3
101.4
64.1
135.9
86.3
44.9
0.00.0
45,72039,13837,20434,32031,13627,25525,47223,969
264,214
5623322714571930
258
22282013
7203211
153
6,248
classrooms
50134
2,715163
63.943.941.265.676.7
29.441.5
6.8
23.527.617.2
14.635.3
6.96.1
10820
81039
1,712 1,396 36 12 1 72 1029 6 0 0 19 0
5 0 0 0 0 0375 14 1 2 53 7
9 0 0 0 1 0
182 495 383 2,640 212 2 47 49 10 164 25 0 0 00 1 3 8 4 0 0 0
37 160 138 978 146 0 1 07 15 5 17 5 0 0 0
29 14 42 724 69 1 0 0
3093200
161165
40
550
2939
822 4 355 517 3 240 102 58 250020
1020
0010
0000
122
801
60
260
40
260
3090
Terminalgrade Passed
VIII boysV girlsV boys
VIII girls
1 with >60%
5.24794256
161463
49
4.06.35.32.5
3.83.6
6.522.2
348997Hindi Urdu Others Gujarati
22066938
1312853504
74231477
000
83000
11280
10060000
% Schools recvd.
64.43.70.0
28.610.0
63.51.90.0
21.80.0
623107
17581128
58990
3823142
8213185
18587286
18009133
3991107
3.14.73.23.24.9
0.00.0
0.0
70.1
100.0
0.99
2005-062004-052003-04
UTTAR PRADESH
0.0
Upper PrimaryPrimary
Sex ratio Sex ratio 0-6
10 111
VIII40.0
Enrolment of children
16,112VIII 23,505 28,952 34,082 45,171Total Pr. 292,866 312,158 315,295 330,083 376,005
1 - 5 6 - 8
754 7098 410 0
2 14
%Teachers recvd.in-service training
Total schools* Rural schools* Total enrolment* Rural enrolment* Teachers*
24.6 33.6
100.0
57.3
89.3 93.3
48.4 53.9% SC enrolment% SC girls to SC enrolment% ST enrolment
49.9 53.3
46.3 65.5
35.5
49.9
38.1
53.4
Position of teachers by educational qualification (other than para teacher)
(Previous academic year)Incentives : Number of beneficiaries
% ST girls to ST enrolment
% Girls
Number of villages
% 0 - 6 population
% SC population % ST population
% Urban population
% Schools with blackboard
% Enrolment in single-teacher schools
% Enrolment in schools without building
Primary Upperprimary
OBC EnrolmentPrimary U. Primary
% OBCEnrolment% OBC girls toOBC Enrolment
Pupil-teacher ratio (PTR)Student-classroom ratio (SCR)% Schools with <= 50 students% Schools with PTR > 100% Female teachers
% Schools established since 1995
Regular teachers Para-teachers
% minorrepairs
% majorrepairs
# = not applicable na = not available * Some totals may not match due to no response in classificatory data items
9.6 90.3
2859
50.07558
4.025.427.933.5
47.49247
0.037.021.527.8
52.89149
5.538.620.143.9
50.27221
0.040.018.4
0.0
24.3 24.4 na 58.4 45.3
9429788.919.4
Category
PrivateGovt.PrivateGovtPrivateGovt.PrivateGovt.PrivateGovt.
Total population (in 000's)
Number of blocks/taluks
District
Decadal growth rate
Primary onlyPrimary with upper primaryPrimary with upper primary & sec/higher sec.Upper primary onlyUpper primary with sec./higher secondary
% Single classroom schools% Single teacher schools
P + UP P+sec/hs U.P. only UP+secP. only
No response in school category
Primary with upper primaryPrimary with U.P. & sec/higherUpper primary onlyUpper primary with sec./higher sec
Primary only
Primary onlyPrimary with upper primaryPrimary with Upper primary & sec/higherUpper primary only
Para-teachers
School category
Upper primary with sec./higher secondary
Primary onlyPrimary with upper prim.
P. onlyP + UPP+sec/hsU.P. onlyUP+sec
NER(U.Prim)GER(U.Prim)NER (Primary)GER (Primary)
Transition ratePrim. to U. Prim
SC/ST Enrolment
Indicators
Classrooms/Other rooms
Prim.with U.P.&Sec/H.SUpper Primary onlyU. Primary with Sec./H.S.
Basic Data, 2001
Data reported from
Performance indicators
96.9 45.098.0 42.698.2 37.097.8 34.8
Utt
ar P
rad
esh

507
Elementary Education: Report Card - AURAIYA
Utt
ar P
rad
esh
0.0250.003
33.5 34.8
Key data: Elementary Education
1180
AURAIYA
(Previous academic year)
(Previous year)
Gender and caste distribution of teachers*
No. of schools by type of building*
BoysWith disability
Flow rates
Primary Level
Enrolment*
Number of schools
Grade
GER / NER
School category
Primary Upper primaryBoys Boys GirlsGirls
IncentiveType
School categoryMultiple
TypeKuccha
PartiallyPucca
PuccaTotal % good condition
Otherrooms
TentNo
Building
Classrooms
Belowsecondary
Highersecondary
Postgraduate
M. Phil.GraduateSecondarySchool category OthersNo
response
ST teachers
Total Male Female No res Male Female No res Male Female Male FemaleSC teachers
Text booksUniformAttendanceStationery
% Passed
Avg. No. of Tchs.
%
Female literacyOverall literacy
dev. grant grantSchool T L M
Male Female
IVV
IIIIII
Grade R.R. D.O.R. P.R.
VIIVI
# #
I - V
Enrolment by medium of instructions
Examination results
Retention rate
GPI
Primary cycle U. primary cycleState
DISTRICT ELEMENTARY EDUCATION REPORT CARD : 2005-06
GirlsGrade
IIIIIIIVVVI
VIII
AllGirls
Total
VII
% TotalGrossness
School category
01
3791
13 04 1
15130
3741
1 0 0
898 24213 0
4 471122 33,592
28 1950 0
875 198 130,814 37,6913,072 0 3,0721,775 471 1,775
25,501 33,303 20,672
0 0 05,730 195 5,456
133,374 47,615 2,7920
1,11476
P + UP P+sec/hs U.P. only UP+sec
School categoryP. only
0.4 0.0 0.0 0.0 0.00.3
Number of Clusters 17201028
% Schools with SCR > 600.0 0.0 10.6 0.0
24.7 15.4 20.0 4.5 0.0% Schools with pre-primary sections 0.2 0.0 0.0 0.2 0.0% Schools with common toilets 97.5 100.0 80.0 93.6 96.8
% Schools with girls toilets 94.6 100.0 60.0 90.6 93.5% Schools with drinking water facility 98.2 100.0 100.0 82.5 100.0
% Enrolment in Govt. schools 73.7 0.0 21.0 56.8 3.399.8 92.3 100.0 99.6 96.8
% No female teacher schools (tch>=2) 25.7 15.4 60.0 53.2 64.50.1 0.0 0.0 3.9 0.0
0.2 0.0 0.0 0.2 0.0%Enrolment in schools without blackboard 0.0 0.0 0.0 0.0 0.0
2001-02 2002-03 2003-04 2004-05 2005-06IIIIIIIVV
VIVII
Total U.P
39,48940,04637,55035,86630,71525,234
22,556
40,46137,18838,20332,03228,237
21,83918,749
38,60940,03635,49730,54627,201
19,61617,747
31,97325,76323,10619,71217,429
10,7508,526
67,65958,18453,54226,529
94.7
54.3
95.7
58.1
114.0
68.6
38.8
0.00.0
18,35519,00417,97317,64414,90512,04910,858
9,496120,284
9698
117125129
756670
776
485679
10799544826
517
3,944
classrooms
8661
2,078333
81.975.686.983.872.7
15.522.1
2.6
13.114.523.7
2.30.01.63.6
266
83497
1,410 1,134 1 0 0 0 512 0 0 0 0 1
5 0 0 0 0 0527 0 0 0 0 3
30 0 0 0 0 1
38 257 543 1,106 665 1 40 2 10 22 14 0 0 280 0 1 1 6 0 0 22
13 33 606 710 497 1 0 2230 1 10 45 63 0 0 57
1 8 418 291 167 0 0 0
20265826
1673163
184
41013
951 0 403 526 0 433 207 5 30000
0000
0000
0000
91
29423
21
593
0020
0000
Terminalgrade Passed
VIII boysV girlsV boys
VIII girls
363 with >60%
5.539067630
2083176
0.00.02.70.0
6.30.00.03.40.0
180782Hindi Others
30722246
590865925
2070070
% Schools recvd.
78.50.00.0
67.43.2
78.30.00.0
69.20.0
431120
46489
79680
2350
600690
47660
159570
3160
3.45.86.03.95.7
1.41.72.01.8
0.70.70.5
1.41.7
88.8
0.92
2005-062004-052003-04
UTTAR PRADESH
13.3
Upper PrimaryPrimary
Sex ratio Sex ratio 0-6
8 90
VIII0.0
Enrolment of children
VIII 7,253 16,179 17,596 19,869Total Pr. 117,983 171,889 176,121 183,666
1 - 5 6 - 8
1,337 7465 1710 0
5 25
%Teachers recvd.in-service training
Total schools* Rural schools* Total enrolment* Rural enrolment* Teachers*
12.4 20.9
99.9
54.3
84.6 81.9
51.6 43.8% SC enrolment% SC girls to SC enrolment% ST enrolment
47.1 47.1
60.0 82.4
50.6
48.3
47.7
48.0
Position of teachers by educational qualification (other than para teacher)
(Previous academic year)Incentives : Number of beneficiaries
% ST girls to ST enrolment
% Girls
Number of villages
% 0 - 6 population
% SC population % ST population
% Urban population
% Schools with blackboard
% Enrolment in single-teacher schools
% Enrolment in schools without building
Primary Upperprimary
OBC EnrolmentPrimary U. Primary
% OBCEnrolment% OBC girls toOBC Enrolment
Pupil-teacher ratio (PTR)Student-classroom ratio (SCR)% Schools with <= 50 students% Schools with PTR > 100% Female teachers
% Schools established since 1995
Regular teachers Para-teachers
% minorrepairs
% majorrepairs
# = not applicable na = not available * Some totals may not match due to no response in classificatory data items
1.2 97.4
5.6 92.43.6 94.79.8 88.83.6 94.8
3775
47.94646
5.33.3
37.841.8
42.14036
7.70.0
23.715.4
48.72828
22.11.1
19.759.2
43.93418
6.50.07.43.2
14.7 27.7 na 70.5 59.1
89485614.318.2
Category
PrivateGovt.PrivateGovtPrivateGovt.PrivateGovt.PrivateGovt.
Total population (in 000's)
Number of blocks/taluks
District
Decadal growth rate
Primary onlyPrimary with upper primaryPrimary with upper primary & sec/higher sec.Upper primary onlyUpper primary with sec./higher secondary
% Single classroom schools% Single teacher schools
P + UP P+sec/hs U.P. only UP+secP. only
No response in school category
Primary with upper primaryPrimary with U.P. & sec/higherUpper primary onlyUpper primary with sec./higher sec
Primary only
Primary onlyPrimary with upper primaryPrimary with Upper primary & sec/higherUpper primary only
Para-teachers
School category
Upper primary with sec./higher secondary
Primary onlyPrimary with upper prim.
P. onlyP + UPP+sec/hsU.P. onlyUP+sec
NER(U.Prim)GER(U.Prim)NER (Primary)GER (Primary)
Transition ratePrim. to U. Prim
SC/ST Enrolment
Indicators
Classrooms/Other rooms
Prim.with U.P.&Sec/H.SUpper Primary onlyU. Primary with Sec./H.S.
Basic Data, 2001
Data reported from
Performance indicators
99.0 52.299.0 48.298.6 52.399.0 56.6

508
Elementary Education in India - Where do we stand ?
0.1230.122
37.5 35.8
Key data: Elementary Education
3940
AZAMGARH
(Previous academic year)
(Previous year)
Gender and caste distribution of teachers*
No. of schools by type of building*
BoysWith disability
Flow rates
Primary Level
Enrolment*
Number of schools
Grade
GER / NER
School category
Primary Upper primaryBoys Boys GirlsGirls
IncentiveType
School categoryMultiple
TypeKuccha
PartiallyPucca
PuccaTotal % good condition
Otherrooms
TentNo
Building
Classrooms
Belowsecondary
Highersecondary
Postgraduate
M. Phil.GraduateSecondarySchool category OthersNo
response
ST teachers
Total Male Female No res Male Female No res Male Female Male FemaleSC teachers
Text booksUniformAttendanceStationery
% Passed
Avg. No. of Tchs.
%
Female literacyOverall literacy
dev. grant grantSchool T L M
Male Female
IVV
IIIIII
Grade R.R. D.O.R. P.R.
VIIVI
# #
I - V
Enrolment by medium of instructions
Examination results
Retention rate
GPI
Primary cycle U. primary cycleState
DISTRICT ELEMENTARY EDUCATION REPORT CARD : 2005-06
GirlsGrade
IIIIIIIVVVI
VIII
AllGirls
Total
VII
% TotalGrossness
School category
218
45715
63 1928 7
24561
4529
0 0 0
2,133 49945 8,39127 2,737
243 86,51060 4,939
0 0
2,100 467 488,493 122,13025,357 7,746 16,67411,109 2,301 10,65558,178 85,987 57,705
0 0 017,389 2,792 16,814
492,417 129,397 8,851110
2,033264
P + UP P+sec/hs U.P. only UP+sec
School categoryP. only
0.3 0.0 0.0 0.0 0.01.3
Number of Clusters 35302196
% Schools with SCR > 602.4 2.8 23.5 3.9
58.7 36.9 44.4 19.8 15.8% Schools with pre-primary sections 40.4 11.9 8.3 11.7 9.2% Schools with common toilets 57.9 85.7 77.8 81.1 81.6
% Schools with girls toilets 28.9 67.9 63.9 59.3 71.1% Schools with drinking water facility 96.8 98.8 97.2 92.3 97.4
% Enrolment in Govt. schools 79.2 24.9 19.8 59.8 22.199.7 98.8 100.0 98.4 100.0
% No female teacher schools (tch>=2) 28.3 48.8 41.7 42.6 73.70.7 1.4 0.9 8.4 5.2
0.3 0.0 0.0 0.0 0.0%Enrolment in schools without blackboard 0.2 0.5 0.0 0.9 0.0
2001-02 2002-03 2003-04 2004-05 2005-06IIIIIIIVV
VIVII
Total U.P
147,922135,770129,634124,550112,100
67,877
61,452
152,194134,980134,863119,509103,410
51,21946,788
148,569139,067126,698106,186
94,792
45,81843,574
132,801105,767
87,21272,09466,478
21,62618,327
129,15288,31174,32765,11559,852
17,17313,092
186,448141,982129,93955,42740,968
99.3
38.6
101.4
41.1
120.8
56.6
49.9
0.038.9
71,41467,25464,77062,01255,32033,33030,31328,289
412,702
293395412443391112121110
2,277
186258311283288103
9949
1,577
9,537
classrooms
704324
3,788794
69.570.363.977.378.1
19.521.4
11.0
24.115.516.1
8.212.0
7.25.8
12449
1,009150
2,688 2,498 59 17 5 32 2180 2 0 0 2 035 0 0 0 1 0
678 12 0 0 10 272 0 0 0 4 0
100 552 2,745 3,796 1,510 22 168 14 74 151 120 2 0 00 6 28 73 49 4 0 0
31 108 761 953 702 10 1 160 1 13 178 142 4 3 2
9 33 751 847 423 1 2 0
6647267112
1995288
10248
58755
2151 0 815 1271 0 1624 538 65 310000
31
110
2121
0000
3814
32321
104
1006
40
131
0282
Terminalgrade Passed
VIII boysV girlsV boys
VIII girls
57 with >60%
25.810884374162
2595344
6.70.0
20.40.3
27.415.4
0.014.4
0.0
619626Hindi Others Assamese
3344013846
14442722328
1276308
0261
0
2980000
% Schools recvd.
65.313.1
8.336.8
2.6
60.414.3
2.831.1
1.3
157710147
118329133
102180
127160
200182186
124896138
192850
127280
4.14.54.53.74.5
2.71.11.10.9
0.80.71.1
0.91.4
86.1
65.3
0.97
2005-062004-052003-04
UTTAR PRADESH
30.2
Upper PrimaryPrimary
Sex ratio Sex ratio 0-6
23 285
VIII25.0
Enrolment of children
10,703VIII 15,474 40,547 43,975 57,119Total Pr. 416,757 464,352 615,312 644,956 649,976
1 - 5 6 - 8
1,592 1,00379 265
0 0
30 132
%Teachers recvd.in-service training
Total schools* Rural schools* Total enrolment* Rural enrolment* Teachers*
3.3 7.7
100.0
52.2
97.6 97.3
36.3 37.2% SC enrolment% SC girls to SC enrolment% ST enrolment
48.7 49.4
49.1 83.0
48.2
50.1
45.3
49.7
Position of teachers by educational qualification (other than para teacher)
(Previous academic year)Incentives : Number of beneficiaries
% ST girls to ST enrolment
% Girls
Number of villages
% 0 - 6 population
% SC population % ST population
% Urban population
% Schools with blackboard
% Enrolment in single-teacher schools
% Enrolment in schools without building
Primary Upperprimary
OBC EnrolmentPrimary U. Primary
% OBCEnrolment% OBC girls toOBC Enrolment
Pupil-teacher ratio (PTR)Student-classroom ratio (SCR)% Schools with <= 50 students% Schools with PTR > 100% Female teachers
% Schools established since 1995
Regular teachers Para-teachers
% minorrepairs
% majorrepairs
# = not applicable na = not available * Some totals may not match due to no response in classificatory data items
9.1 88.24.0 94.97.3 91.56.0 93.1
33.9 65.311.1 87.5
4385
49.45765
1.59.7
31.435.3
49.69048
0.039.327.833.3
49.35638
14.214.722.746.7
46.86528
3.926.316.311.8
26.3 25.7 na 57.0 43.4
94910207.620.2
Category
PrivateGovt.PrivateGovtPrivateGovt.PrivateGovt.PrivateGovt.
Total population (in 000's)
Number of blocks/taluks
District
Decadal growth rate
Primary onlyPrimary with upper primaryPrimary with upper primary & sec/higher sec.Upper primary onlyUpper primary with sec./higher secondary
% Single classroom schools% Single teacher schools
P + UP P+sec/hs U.P. only UP+secP. only
No response in school category
Primary with upper primaryPrimary with U.P. & sec/higherUpper primary onlyUpper primary with sec./higher sec
Primary only
Primary onlyPrimary with upper primaryPrimary with Upper primary & sec/higherUpper primary only
Para-teachers
School category
Upper primary with sec./higher secondary
Primary onlyPrimary with upper prim.
P. onlyP + UPP+sec/hsU.P. onlyUP+sec
NER(U.Prim)GER(U.Prim)NER (Primary)GER (Primary)
Transition ratePrim. to U. Prim
SC/ST Enrolment
Indicators
Classrooms/Other rooms
Prim.with U.P.&Sec/H.SUpper Primary onlyU. Primary with Sec./H.S.
Basic Data, 2001
Data reported from
Performance indicators
99.5 29.999.0 27.899.6 21.699.6 22.9
Utt
ar P
rad
esh

509
Elementary Education: Report Card - BAGHPAT
Utt
ar P
rad
esh
0.0000.002
19.4 17.4
Key data: Elementary Education
1164
BAGHPAT
(Previous academic year)
(Previous year)
Gender and caste distribution of teachers*
No. of schools by type of building*
BoysWith disability
Flow rates
Primary Level
Enrolment*
Number of schools
Grade
GER / NER
School category
Primary Upper primaryBoys Boys GirlsGirls
IncentiveType
School categoryMultiple
TypeKuccha
PartiallyPucca
PuccaTotal % good condition
Otherrooms
TentNo
Building
Classrooms
Belowsecondary
Highersecondary
Postgraduate
M. Phil.GraduateSecondarySchool category OthersNo
response
ST teachers
Total Male Female No res Male Female No res Male Female Male FemaleSC teachers
Text booksUniformAttendanceStationery
% Passed
Avg. No. of Tchs.
%
Female literacyOverall literacy
dev. grant grantSchool T L M
Male Female
IVV
IIIIII
Grade R.R. D.O.R. P.R.
VIIVI
# #
I - V
Enrolment by medium of instructions
Examination results
Retention rate
GPI
Primary cycle U. primary cycleState
DISTRICT ELEMENTARY EDUCATION REPORT CARD : 2005-06
GirlsGrade
IIIIIIIVVVI
VIII
AllGirls
Total
VII
% TotalGrossness
School category
80
1529
12 84 0
5416
1489
0 0 0
499 1138 1,7683 0
37 19,86412 4,247
0 0
471 85 87,578 20,4724,637 1,768 4,1281,655 0 1,4479,505 19,159 6,970
0 0 05,003 4,247 3,922
93,869 25,358 1,53118
27830
P + UP P+sec/hs U.P. only UP+sec
School categoryP. only
0.0 0.0 0.0 0.0 0.01.0
Number of Clusters 867309
% Schools with SCR > 600.0 0.0 0.5 0.0
24.3 25.0 25.0 7.3 0.0% Schools with pre-primary sections 3.9 5.0 0.0 1.9 0.0% Schools with common toilets 89.9 95.0 100.0 89.3 100.0
% Schools with girls toilets 86.8 95.0 100.0 85.4 96.0% Schools with drinking water facility 98.4 95.0 100.0 97.1 100.0
% Enrolment in Govt. schools 78.7 27.6 0.0 67.6 45.9100.0 100.0 100.0 100.0 100.0
% No female teacher schools (tch>=2) 69.6 45.0 75.0 68.9 96.01.7 0.0 0.0 0.5 0.0
0.0 0.0 0.0 0.0 0.0%Enrolment in schools without blackboard 0.0 0.0 0.0 0.0 0.0
2001-02 2002-03 2003-04 2004-05 2005-06IIIIIIIVV
VIVII
Total U.P
34,32326,89023,74320,89218,25415,167
13,489
30,96521,48117,44614,55313,164
10,83310,366
35,58323,24219,15815,71114,729
11,66111,033
35,64922,40217,90914,73814,422
9,6328,889
34,71020,36316,78914,49814,432
10,0248,943
41,80430,63733,01026,48726,928
60.8
34.0
54.0
31.2
78.1
42.9
36.9
0.050.0
14,91611,88110,459
9,1127,5586,6255,8615,414
71,826
172165169115
69106
9258
946
12496
1066935796223
594
2,780
classrooms
15640
1,419551
99.596.2
100.099.993.6
0.53.8
0.0
0.00.16.4
0.00.00.00.0
0000
13 612 0 0 0 0 020 0 0 0 0 0
4 0 0 0 0 0206 0 0 0 0 0
25 0 0 0 0 0
156 414 387 226 353 2 10 6 7 10 22 1 0 00 0 2 5 6 0 0 0
28 66 140 91 160 2 0 60 7 9 9 40 2 0 0
31 107 72 33 15 0 0 0
13003111
39666
152
971
253 0 232 24 0 100 15 45 60000
2000
0000
0000
33
573
0050
00
183
0070
Terminalgrade Passed
VIII boysV girlsV boys
VIII girls
14 with >60%
0.118094813
49367
0.00.00.00.0
0.00.00.00.00.0
118691Hindi Urdu Sanskrit English Others
64051655
291309125
2100000
000
1380
0000
125
700000
% Schools recvd.
66.75.00.0
41.70.0
59.05.00.0
36.44.0
315522453
18169275
4161442
250948
337042172
16733266
3832395
254947
3.02.43.32.42.7
9.35.84.93.9
3.92.61.9
2.76.0
51.6
100.0
0.77
2005-062004-052003-04
UTTAR PRADESH
15.4
Upper PrimaryPrimary
Sex ratio Sex ratio 0-6
7 56
VIII25.0
Enrolment of children
7,961VIII 7,966 10,316 9,438 13,148Total Pr. 100,792 105,120 108,423 97,609 124,102
1 - 5 6 - 8
363 13028 39
0 0
0 13
%Teachers recvd.in-service training
Total schools* Rural schools* Total enrolment* Rural enrolment* Teachers*
20.3 25.3
62.2
32.1
40.8 46.1
24.5 23.7% SC enrolment% SC girls to SC enrolment% ST enrolment
43.3 42.4
0.0 0.0
53.9
44.1
50.1
42.7
Position of teachers by educational qualification (other than para teacher)
(Previous academic year)Incentives : Number of beneficiaries
% ST girls to ST enrolment
% Girls
Number of villages
% 0 - 6 population
% SC population % ST population
% Urban population
% Schools with blackboard
% Enrolment in single-teacher schools
% Enrolment in schools without building
Primary Upperprimary
OBC EnrolmentPrimary U. Primary
% OBCEnrolment% OBC girls toOBC Enrolment
Pupil-teacher ratio (PTR)Student-classroom ratio (SCR)% Schools with <= 50 students% Schools with PTR > 100% Female teachers
% Schools established since 1995
Regular teachers Para-teachers
% minorrepairs
% majorrepairs
# = not applicable na = not available * Some totals may not match due to no response in classificatory data items
7.9 82.8
41127
43.66643
3.623.415.321.4
41.4133
415.0
45.031.335.0
43.56021
17.017.019.749.5
41.1138
170.0
68.01.50.0
13.0 11.0 na 64.2 49.2
85084719.717.6
Category
PrivateGovt.PrivateGovtPrivateGovt.PrivateGovt.PrivateGovt.
Total population (in 000's)
Number of blocks/taluks
District
Decadal growth rate
Primary onlyPrimary with upper primaryPrimary with upper primary & sec/higher sec.Upper primary onlyUpper primary with sec./higher secondary
% Single classroom schools% Single teacher schools
P + UP P+sec/hs U.P. only UP+secP. only
No response in school category
Primary with upper primaryPrimary with U.P. & sec/higherUpper primary onlyUpper primary with sec./higher sec
Primary only
Primary onlyPrimary with upper primaryPrimary with Upper primary & sec/higherUpper primary only
Para-teachers
School category
Upper primary with sec./higher secondary
Primary onlyPrimary with upper prim.
P. onlyP + UPP+sec/hsU.P. onlyUP+sec
NER(U.Prim)GER(U.Prim)NER (Primary)GER (Primary)
Transition ratePrim. to U. Prim
SC/ST Enrolment
Indicators
Classrooms/Other rooms
Prim.with U.P.&Sec/H.SUpper Primary onlyU. Primary with Sec./H.S.
Basic Data, 2001
Data reported from
Performance indicators
99.4 63.098.8 62.894.0 52.396.0 52.7

510
Elementary Education in India - Where do we stand ?
0.1140.265
18.6 20.5
Key data: Elementary Education
2381
BAHRAICH
(Previous academic year)
(Previous year)
Gender and caste distribution of teachers*
No. of schools by type of building*
BoysWith disability
Flow rates
Primary Level
Enrolment*
Number of schools
Grade
GER / NER
School category
Primary Upper primaryBoys Boys GirlsGirls
IncentiveType
School categoryMultiple
TypeKuccha
PartiallyPucca
PuccaTotal % good condition
Otherrooms
TentNo
Building
Classrooms
Belowsecondary
Highersecondary
Postgraduate
M. Phil.GraduateSecondarySchool category OthersNo
response
ST teachers
Total Male Female No res Male Female No res Male Female Male FemaleSC teachers
Text booksUniformAttendanceStationery
% Passed
Avg. No. of Tchs.
%
Female literacyOverall literacy
dev. grant grantSchool T L M
Male Female
IVV
IIIIII
Grade R.R. D.O.R. P.R.
VIIVI
# #
I - V
Enrolment by medium of instructions
Examination results
Retention rate
GPI
Primary cycle U. primary cycleState
DISTRICT ELEMENTARY EDUCATION REPORT CARD : 2005-06
GirlsGrade
IIIIIIIVVVI
VIII
AllGirls
Total
VII
% TotalGrossness
School category
20
3250
9 20 0
371
3130
0 0 0
1,586 1058 5520 0
32 36,6251 00 0
1,545 73 329,950 14,5202,551 552 2,239
0 0 05,913 35,001 5,161
0 0 0140 0 140
339,499 20,282 3,7969
41554
P + UP P+sec/hs U.P. only UP+sec
School categoryP. only
0.6 0.0 0.0 0.0 0.016.9
Number of Clusters 20651340
% Schools with SCR > 600.0 0.0 38.1 0.0
67.3 9.1 0.0 4.1 0.0% Schools with pre-primary sections 52.4 27.3 0.0 6.4 100.0% Schools with common toilets 79.5 100.0 0.0 93.9 100.0
% Schools with girls toilets 75.3 81.8 0.0 88.4 100.0% Schools with drinking water facility 99.0 100.0 0.0 97.8 100.0
% Enrolment in Govt. schools 94.4 17.8 0.0 86.1 0.099.9 72.7 0.0 98.6 0.0
% No female teacher schools (tch>=2) 30.5 72.7 0.0 36.5 100.013.8 0.0 0.0 22.1 0.0
0.4 0.0 0.0 0.0 0.0%Enrolment in schools without blackboard 0.0 22.2 0.0 1.0 100.0
2001-02 2002-03 2003-04 2004-05 2005-06IIIIIIIVV
VIVII
Total U.P
72,90085,13677,05371,61755,03616,394
15,254
93,01281,76380,86263,70744,718
18,30313,770
82,94684,11271,21450,25939,201
14,45911,626
88,96073,91255,44543,33532,209
11,0087,371
81,92761,25153,18739,72527,547
8,1296,431
43,82043,31934,91524,40319,335
86.9
17.0
93.8
20.5
111.3
22.0
0.0
0.00.0
33,23239,41435,47932,67524,911
7,1676,7285,496
185,102
254505539523365120167147
2,620
340418455412187138187115
2,252
4,787
classrooms
1140
1,4679
94.884.2
0.094.8
100.0
4.34.4
0.9
0.05.20.0
11.40.00.00.0
120
5351
1,639 1,658 10 1 0 12 109 1 0 0 1 00 0 0 0 0 0
359 0 0 0 3 01 0 0 0 0 0
116 392 747 718 476 1 22 4 3 13 17 0 0 240 0 0 0 0 0 0 0
27 28 265 255 186 6 1 760 0 0 0 0 0 0 3
62 53 602 432 137 0 1 0
179054
0642
3
90
2020
805 0 929 685 2 388 119 14 50000
0020
0000
0000
40
850
00
150
0010
0020
Terminalgrade Passed
VIII boysV girlsV boys
VIII girls
143 with >60%
2.6421163
0846
3
0.00.01.20.0
3.80.00.03.5
354997Hindi Urdu Others Assamese Manipuri
31030
42216140
161400
2140
104600
500
2150000
1260000
% Schools recvd.
84.20.00.0
56.10.0
77.60.00.0
53.60.0
98645876
77863140608
43300
4852247
136411561
63151142304
115650
4547196
2.55.70.02.33.0
2.21.11.51.2
1.11.32.2
1.51.5
66.4
36.2
0.85
2005-062004-052003-04
UTTAR PRADESH
0.0
Upper PrimaryPrimary
Sex ratio Sex ratio 0-6
13 120
VIII0.0
Enrolment of children
4,775VIII 6,024 8,830 11,246 12,172Total Pr. 263,637 293,861 327,732 364,062 361,742
1 - 5 6 - 8
699 1470 30 0
0 0
%Teachers recvd.in-service training
Total schools* Rural schools* Total enrolment* Rural enrolment* Teachers*
6.4 13.1
100.0
19.1
71.0 84.0
13.0 15.4% SC enrolment% SC girls to SC enrolment% ST enrolment
46.9 43.5
60.4 46.0
54.0
44.5
45.2
39.9
Position of teachers by educational qualification (other than para teacher)
(Previous academic year)Incentives : Number of beneficiaries
% ST girls to ST enrolment
% Girls
Number of villages
% 0 - 6 population
% SC population % ST population
% Urban population
% Schools with blackboard
% Enrolment in single-teacher schools
% Enrolment in schools without building
Primary Upperprimary
OBC EnrolmentPrimary U. Primary
% OBCEnrolment% OBC girls toOBC Enrolment
Pupil-teacher ratio (PTR)Student-classroom ratio (SCR)% Schools with <= 50 students% Schools with PTR > 100% Female teachers
% Schools established since 1995
Regular teachers Para-teachers
% minorrepairs
% majorrepairs
# = not applicable na = not available * Some totals may not match due to no response in classificatory data items
7.2 90.66.2 92.8
10.9 87.613.4 85.362.3 36.215.7 82.816.5 82.412.1 86.6
00
45.88575
1.537.135.436.8
41.14927
0.018.214.345.5
44.45029
24.311.323.960.2
45.04716
0.00.00.0
100.0
29.5 14.4 0.4 35.2 22.8
97086710.020.5
Category
PrivateGovt.PrivateGovtPrivateGovt.PrivateGovt.PrivateGovt.
Total population (in 000's)
Number of blocks/taluks
District
Decadal growth rate
Primary onlyPrimary with upper primaryPrimary with upper primary & sec/higher sec.Upper primary onlyUpper primary with sec./higher secondary
% Single classroom schools% Single teacher schools
P + UP P+sec/hs U.P. only UP+secP. only
No response in school category
Primary with upper primaryPrimary with U.P. & sec/higherUpper primary onlyUpper primary with sec./higher sec
Primary only
Primary onlyPrimary with upper primaryPrimary with Upper primary & sec/higherUpper primary only
Para-teachers
School category
Upper primary with sec./higher secondary
Primary onlyPrimary with upper prim.
P. onlyP + UPP+sec/hsU.P. onlyUP+sec
NER(U.Prim)GER(U.Prim)NER (Primary)GER (Primary)
Transition ratePrim. to U. Prim
SC/ST Enrolment
Indicators
Classrooms/Other rooms
Prim.with U.P.&Sec/H.SUpper Primary onlyU. Primary with Sec./H.S.
Basic Data, 2001
Data reported from
Performance indicators
98.8 35.298.8 33.997.3 28.197.0 33.2
Utt
ar P
rad
esh

511
Elementary Education: Report Card - BALLIA
Utt
ar P
rad
esh
26.3 24.6
Key data: Elementary Education
2762
BALLIA
(Previous academic year)
(Previous year)
Gender and caste distribution of teachers*
No. of schools by type of building*
BoysWith disability
Flow rates
Primary Level
Enrolment*
Number of schools
Grade
GER / NER
School category
Primary Upper primaryBoys Boys GirlsGirls
IncentiveType
School categoryMultiple
TypeKuccha
PartiallyPucca
PuccaTotal % good condition
Otherrooms
TentNo
Building
Classrooms
Belowsecondary
Highersecondary
Postgraduate
M. Phil.GraduateSecondarySchool category OthersNo
response
ST teachers
Total Male Female No res Male Female No res Male Female Male FemaleSC teachers
Text booksUniformAttendanceStationery
% Passed
Avg. No. of Tchs.
%
Female literacyOverall literacy
dev. grant grantSchool T L M
Male Female
IVV
IIIIII
Grade R.R. D.O.R. P.R.
VIIVI
# #
I - V
Enrolment by medium of instructions
Examination results
Retention rate
GPI
Primary cycle U. primary cycleState
DISTRICT ELEMENTARY EDUCATION REPORT CARD : 2005-06
GirlsGrade
IIIIIIIVVVI
VIII
AllGirls
Total
VII
% TotalGrossness
School category
80
3025
50 012 0
17538
2863
0 0 0
1,731 28527 3,24110 0
161 56,45534 1,989
0 0
1,658 248 323,432 55,96515,042 0 8,265
3,634 0 2,76431,379 51,502 29,409
0 0 09,481 805 8,563
339,974 64,537 6,31449
1,638358
P + UP P+sec/hs U.P. only UP+sec
School categoryP. only
0.6 0.0 0.0 0.0 0.03.6
Number of Clusters 26061418
% Schools with SCR > 600.0 0.0 12.2 2.3
42.3 15.5 8.3 15.1 4.7% Schools with pre-primary sections 33.8 0.0 8.3 0.6 0.0% Schools with common toilets 58.7 93.1 91.7 72.1 86.0
% Schools with girls toilets 31.6 69.0 75.0 53.5 76.7% Schools with drinking water facility 93.9 100.0 100.0 88.9 100.0
% Enrolment in Govt. schools 84.0 17.7 0.0 64.3 17.399.1 100.0 100.0 97.5 100.0
% No female teacher schools (tch>=2) 36.5 34.5 25.0 48.0 76.72.3 0.0 0.0 3.2 1.6
0.9 0.0 0.0 0.3 0.0%Enrolment in schools without blackboard 0.6 0.0 0.0 1.8 0.0
2001-02 2002-03 2003-04 2004-05 2005-06IIIIIIIVV
VIVII
Total U.P
107,31391,53880,21774,52564,53139,518
35,283
99,86888,66888,19576,92166,200
36,16034,437
90,87190,56382,60469,90560,537
31,77031,258
98,75483,98172,96060,30854,437
25,16823,679
92,50472,94262,50854,85151,808
16,96114,833
107,608104,40193,25871,35645,435
91.6
39.8
95.4
43.7
110.9
46.6
44.9
0.08.3
52,17044,90239,65236,79331,33019,15717,02515,665
256,694
204276326262229
989580
1,570
137189215189178
705049
1,077
7,299
classrooms
561151
2,393542
50.341.429.162.359.8
33.349.2
16.4
70.228.134.5
9.40.79.65.7
8620
64690
2,047 1,840 52 13 0 89 2240 2 0 0 16 010 1 0 0 1 0
424 12 1 1 34 540 0 1 0 2 0
110 508 1,875 2,643 827 6 153 6 54 200 101 0 1 420 1 18 44 9 0 0 12
13 36 579 998 572 6 1 510 1 14 73 93 0 0 68
7 15 464 557 164 2 0 0
5207296
611729
229
11123
52720
1497 1 666 581 0 892 230 52 200000
0050
0020
0000
303
3536
50
790
10
310
0070
Terminalgrade Passed
VIII boysV girlsV boys
VIII girls
721 with >60%
13.67952407
842263
249
0.00.08.10.0
15.30.00.06.80.0
403434Hindi Urdu English Others
179682895
8773211470
906315371102
0
00
36800
1710000
% Schools recvd.
73.41.70.0
39.80.0
72.90.00.0
39.00.0
12237030
76067197
133330
1354842
13350826
78959201
195240
1306153
3.97.07.04.75.8
0.40.40.30.3
0.10.20.3
0.60.4
69.4
59.6
0.96
2005-062004-052003-04
UTTAR PRADESH
27.4
Upper PrimaryPrimary
Sex ratio Sex ratio 0-6
18 168
VIII16.7
Enrolment of children
13,641VIII 22,509 30,230 33,804 32,807Total Pr. 334,613 370,440 394,480 419,852 418,124
1 - 5 6 - 8
1,263 1,00022 227
0 0
0 84
%Teachers recvd.in-service training
Total schools* Rural schools* Total enrolment* Rural enrolment* Teachers*
2.2 5.6
100.0
44.0
88.8 93.5
36.1 41.5% SC enrolment% SC girls to SC enrolment% ST enrolment
48.3 46.62.9
49.9 46.5
53.7
49.4
49.1
47.6
Position of teachers by educational qualification (other than para teacher)
(Previous academic year)Incentives : Number of beneficiaries
% ST girls to ST enrolment
% Girls
Number of villages
% 0 - 6 population
% SC population % ST population
% Urban population
% Schools with blackboard
% Enrolment in single-teacher schools
% Enrolment in schools without building
Primary Upperprimary
OBC EnrolmentPrimary U. Primary
% OBCEnrolment% OBC girls toOBC Enrolment
Pupil-teacher ratio (PTR)Student-classroom ratio (SCR)% Schools with <= 50 students% Schools with PTR > 100% Female teachers
% Schools established since 1995
Regular teachers Para-teachers
% minorrepairs
% majorrepairs
# = not applicable na = not available * Some totals may not match due to no response in classificatory data items
8.2 91.39.5 90.1
15.5 84.216.2 83.439.8 59.616.5 83.1
2.5 97.44.8 95.0
2443
49.25155
2.98.7
26.128.5
44.54533
0.05.2
27.315.5
48.53937
13.44.4
23.436.1
47.24621
2.39.38.04.7
21.7 16.5 na 57.9 43.2
9429539.818.7
Category
PrivateGovt.PrivateGovtPrivateGovt.PrivateGovt.PrivateGovt.
Total population (in 000's)
Number of blocks/taluks
District
Decadal growth rate
Primary onlyPrimary with upper primaryPrimary with upper primary & sec/higher sec.Upper primary onlyUpper primary with sec./higher secondary
% Single classroom schools% Single teacher schools
P + UP P+sec/hs U.P. only UP+secP. only
No response in school category
Primary with upper primaryPrimary with U.P. & sec/higherUpper primary onlyUpper primary with sec./higher sec
Primary only
Primary onlyPrimary with upper primaryPrimary with Upper primary & sec/higherUpper primary only
Para-teachers
School category
Upper primary with sec./higher secondary
Primary onlyPrimary with upper prim.
P. onlyP + UPP+sec/hsU.P. onlyUP+sec
NER(U.Prim)GER(U.Prim)NER (Primary)GER (Primary)
Transition ratePrim. to U. Prim
2.8
SC/ST Enrolment
Indicators
Classrooms/Other rooms
Prim.with U.P.&Sec/H.SUpper Primary onlyU. Primary with Sec./H.S.
Basic Data, 2001
Data reported from
Performance indicators
99.5 57.899.5 54.499.7 50.999.9 50.6

512
Elementary Education in India - Where do we stand ?
17.9 15.7
Key data: Elementary Education
1682
BALRAMPUR
(Previous academic year)
(Previous year)
Gender and caste distribution of teachers*
No. of schools by type of building*
BoysWith disability
Flow rates
Primary Level
Enrolment*
Number of schools
Grade
GER / NER
School category
Primary Upper primaryBoys Boys GirlsGirls
IncentiveType
School categoryMultiple
TypeKuccha
PartiallyPucca
PuccaTotal % good condition
Otherrooms
TentNo
Building
Classrooms
Belowsecondary
Highersecondary
Postgraduate
M. Phil.GraduateSecondarySchool category OthersNo
response
ST teachers
Total Male Female No res Male Female No res Male Female Male FemaleSC teachers
Text booksUniformAttendanceStationery
% Passed
Avg. No. of Tchs.
%
Female literacyOverall literacy
dev. grant grantSchool T L M
Male Female
IVV
IIIIII
Grade R.R. D.O.R. P.R.
VIIVI
# #
I - V
Enrolment by medium of instructions
Examination results
Retention rate
GPI
Primary cycle U. primary cycleState
DISTRICT ELEMENTARY EDUCATION REPORT CARD : 2005-06
GirlsGrade
IIIIIIIVVVI
VIII
AllGirls
Total
VII
% TotalGrossness
School category
90
3288
63 61 0
397
3238
0 0 0
1,051 13641 943
1 031 24,612
5 3290 0
1,029 118 208,585 32,04121,660 422 13,102
308 0 3087,615 24,167 5,882
0 0 02,194 329 1,706
213,307 36,277 2,48728
502290
P + UP P+sec/hs U.P. only UP+sec
School categoryP. only
1.6 1.4 0.0 1.9 6.715.2
Number of Clusters 16421013
% Schools with SCR > 6012.5 0.0 59.1 26.7
58.7 22.2 0.0 5.7 13.3% Schools with pre-primary sections 6.1 8.3 0.0 2.5 6.7% Schools with common toilets 78.4 84.7 100.0 77.7 86.7
% Schools with girls toilets 46.8 73.6 100.0 43.3 80.0% Schools with drinking water facility 98.1 100.0 100.0 96.7 100.0
% Enrolment in Govt. schools 85.5 4.2 0.0 76.4 13.098.8 97.2 0.0 98.6 100.0
% No female teacher schools (tch>=2) 30.1 29.2 0.0 20.7 40.013.8 10.6 0.0 43.7 4.2
0.1 0.0 0.0 0.6 0.0%Enrolment in schools without blackboard 1.0 3.9 100.0 0.4 0.0
2001-02 2002-03 2003-04 2004-05 2005-06IIIIIIIVV
VIVII
Total U.P
60,46062,60056,10749,12436,99216,943
13,927
76,36161,00356,65240,63529,557
13,2689,897
69,13560,03844,73331,02322,920
10,4817,946
69,10645,10732,98523,11917,564
7,7085,645
58,72737,21227,92119,45416,042
5,6924,418
41,96230,96624,72717,95713,515
86.6
17.3
98.2
21.2
115.5
29.8
30.8
0.00.0
26,79928,29624,57921,20115,120
6,1504,8863,899
130,930
284344333367315134141142
2,060
255286299277146103118100
1,584
3,565
classrooms
63630
1,365112
40.364.9
100.047.184.8
53.931.3
5.8
0.048.612.5
3.80.04.32.7
18710
55033
1,375 1,174 3 1 0 6 363 1 0 0 8 0
1 0 0 0 0 0360 1 0 0 1 5
14 1 0 0 0 0
127 344 483 530 201 0 334 42 61 149 24 0 0 2
0 2 3 6 1 0 0 040 66 142 249 157 2 0 2
1 10 15 25 12 0 0 0
18 62 502 540 166 0 0 0
1340232
8504
53
774
15110
345 6 719 575 4 338 70 67 103030
5030
0020
1000
440
818
90
221
50
121
4030
Terminalgrade Passed
VIII boysV girlsV boys
VIII girls
3 with >60%
32.52989318
12663
63
2.10.0
40.20.0
21.61.30.0
28.80.0
235311Hindi Urdu Others
19674308
316692523
139182929
0294
0
35500
2640
% Schools recvd.
82.99.70.0
75.753.3
66.76.90.0
30.826.7
84351932
47544428
52100
454424
75341622
35135393
6445105
2287130
2.54.4
12.01.84.2
3.02.32.72.2
4.95.14.7
2.22.5
61.9
55.1
0.78
2005-062004-052003-04
UTTAR PRADESH
33.3
Upper PrimaryPrimary
Sex ratio Sex ratio 0-6
11 104
VIII0.0
Enrolment of children
3,405VIII 4,604 6,300 7,801 11,092Total Pr. 159,356 187,881 227,849 264,208 265,283
1 - 5 6 - 8
488 17517 46
0 0
0 12
%Teachers recvd.in-service training
Total schools* Rural schools* Total enrolment* Rural enrolment* Teachers*
8.1 37.4
100.0
18.7
80.3 92.9
15.4 18.9% SC enrolment% SC girls to SC enrolment% ST enrolment
45.2 34.71.7
44.9 40.3
44.1
41.9
36.6
32.2
Position of teachers by educational qualification (other than para teacher)
(Previous academic year)Incentives : Number of beneficiaries
% ST girls to ST enrolment
% Girls
Number of villages
% 0 - 6 population
% SC population % ST population
% Urban population
% Schools with blackboard
% Enrolment in single-teacher schools
% Enrolment in schools without building
Primary Upperprimary
OBC EnrolmentPrimary U. Primary
% OBCEnrolment% OBC girls toOBC Enrolment
Pupil-teacher ratio (PTR)Student-classroom ratio (SCR)% Schools with <= 50 students% Schools with PTR > 100% Female teachers
% Schools established since 1995
Regular teachers Para-teachers
% minorrepairs
% majorrepairs
# = not applicable na = not available * Some totals may not match due to no response in classificatory data items
16.9 80.28.2 89.5
12.2 85.18.3 89.5
42.7 55.115.5 82.0
1026
43.88470
2.634.930.823.1
42.17136
4.225.024.233.3
35.44924
42.514.723.163.8
24.54023
46.70.0
15.940.0
23.1 13.5 1.1 34.6 21.8
9618958.120.2
Category
PrivateGovt.PrivateGovtPrivateGovt.PrivateGovt.PrivateGovt.
Total population (in 000's)
Number of blocks/taluks
District
Decadal growth rate
Primary onlyPrimary with upper primaryPrimary with upper primary & sec/higher sec.Upper primary onlyUpper primary with sec./higher secondary
% Single classroom schools% Single teacher schools
P + UP P+sec/hs U.P. only UP+secP. only
No response in school category
Primary with upper primaryPrimary with U.P. & sec/higherUpper primary onlyUpper primary with sec./higher sec
Primary only
Primary onlyPrimary with upper primaryPrimary with Upper primary & sec/higherUpper primary only
Para-teachers
School category
Upper primary with sec./higher secondary
Primary onlyPrimary with upper prim.
P. onlyP + UPP+sec/hsU.P. onlyUP+sec
NER(U.Prim)GER(U.Prim)NER (Primary)GER (Primary)
Transition ratePrim. to U. Prim
1.9
SC/ST Enrolment
Indicators
Classrooms/Other rooms
Prim.with U.P.&Sec/H.SUpper Primary onlyU. Primary with Sec./H.S.
Basic Data, 2001
Data reported from
Performance indicators
96.7 30.796.4 28.297.0 28.997.1 32.9
Utt
ar P
rad
esh

513
Elementary Education: Report Card - BANDA
Utt
ar P
rad
esh
0.0200.091
24.3 23.3
Key data: Elementary Education
1537
BANDA
(Previous academic year)
(Previous year)
Gender and caste distribution of teachers*
No. of schools by type of building*
BoysWith disability
Flow rates
Primary Level
Enrolment*
Number of schools
Grade
GER / NER
School category
Primary Upper primaryBoys Boys GirlsGirls
IncentiveType
School categoryMultiple
TypeKuccha
PartiallyPucca
PuccaTotal % good condition
Otherrooms
TentNo
Building
Classrooms
Belowsecondary
Highersecondary
Postgraduate
M. Phil.GraduateSecondarySchool category OthersNo
response
ST teachers
Total Male Female No res Male Female No res Male Female Male FemaleSC teachers
Text booksUniformAttendanceStationery
% Passed
Avg. No. of Tchs.
%
Female literacyOverall literacy
dev. grant grantSchool T L M
Male Female
IVV
IIIIII
Grade R.R. D.O.R. P.R.
VIIVI
# #
I - V
Enrolment by medium of instructions
Examination results
Retention rate
GPI
Primary cycle U. primary cycleState
DISTRICT ELEMENTARY EDUCATION REPORT CARD : 2005-06
GirlsGrade
IIIIIIIVVVI
VIII
AllGirls
Total
VII
% TotalGrossness
School category
30
4488
51 12 0
5820
4315
0 0 0
1,207 18215 540
1 050 43,89918 528
0 0
1,151 116 215,064 20,32417,091 315 5,567
506 0 30210,479 42,899 8,284
0 0 04,308 485 3,440
224,366 30,846 3,60714
811271
P + UP P+sec/hs U.P. only UP+sec
School categoryP. only
2.7 0.0 0.0 1.2 3.63.5
Number of Clusters 1979485
% Schools with SCR > 600.0 0.0 16.4 0.0
42.5 24.1 50.0 5.5 0.0% Schools with pre-primary sections 27.8 1.9 0.0 1.4 0.0% Schools with common toilets 85.7 88.9 50.0 83.2 85.7
% Schools with girls toilets 78.5 85.2 50.0 74.5 64.3% Schools with drinking water facility 95.4 96.3 100.0 86.2 100.0
% Enrolment in Govt. schools 87.9 3.1 0.0 80.7 10.999.4 98.1 100.0 99.2 96.4
% No female teacher schools (tch>=2) 36.9 29.6 50.0 54.0 67.92.0 0.0 0.0 9.9 0.0
0.5 0.0 0.0 0.4 0.0%Enrolment in schools without blackboard 0.5 1.4 0.0 1.3 2.3
2001-02 2002-03 2003-04 2004-05 2005-06IIIIIIIVV
VIVII
Total U.P
69,56357,96553,53347,52938,01026,499
21,421
54,69351,54449,95539,13133,989
19,78316,616
53,20951,66742,13436,87628,749
16,55714,982
52,45741,52240,00430,65724,365
13,67911,340
65,96351,40744,39034,871
89.3
34.3
94.5
39.0
127.0
51.3
38.3
0.00.0
33,56827,22124,67522,00916,90211,509
8,9447,548
152,376
174261269232187
927079
1,364
124179183141100
615133
872
4,485
classrooms
37215
1,740298
67.593.3
100.074.888.9
22.94.8
9.7
0.019.6
7.0
1.90.05.64.0
797
77495
1,480 1,380 0 0 0 0 954 0 0 0 0 0
2 0 0 0 0 0501 0 0 1 0 4
28 0 0 0 0 0
59 350 634 1,260 641 0 62 5 17 121 104 0 1 340 0 0 6 4 0 0 1
15 23 451 521 534 0 7 240 2 4 41 62 0 1 17
0 37 419 569 257 0 0 0
2429183
61178
107
1015
39720
626 0 765 598 0 485 120 20 60000
1030
0000
0000
222
2349
20
532
3012
0020
Terminalgrade Passed
VIII boysV girlsV boys
VIII girls
105 with >60%
34.94418285
111578
127
0.00.0
20.60.0
33.00.00.0
24.70.0
254915Hindi Others
17631506
543544836
29700
240
% Schools recvd.
76.60.00.0
67.63.6
74.81.90.0
62.50.0
860200
84530189
69300
1612031
8779991
72640235
158160
1172391
3.25.35.53.14.5
78.0
0.87
2005-062004-052003-04
UTTAR PRADESH
45.5
Upper PrimaryPrimary
Sex ratio Sex ratio 0-6
9 74
VIII50.0
Enrolment of children
VIII 9,852 12,851 15,008 18,043Total Pr. 189,005 212,635 229,312 266,600
1 - 5 6 - 8
1,317 26134 93
0 0
0 11
%Teachers recvd.in-service training
Total schools* Rural schools* Total enrolment* Rural enrolment* Teachers*
12.0 23.4
100.0
39.3
81.3 85.4
27.3 30.6% SC enrolment% SC girls to SC enrolment% ST enrolment
45.2 40.2
46.5 100.0
53.7
46.7
48.5
40.1
Position of teachers by educational qualification (other than para teacher)
(Previous academic year)Incentives : Number of beneficiaries
% ST girls to ST enrolment
% Girls
Number of villages
% 0 - 6 population
% SC population % ST population
% Urban population
% Schools with blackboard
% Enrolment in single-teacher schools
% Enrolment in schools without building
Primary Upperprimary
OBC EnrolmentPrimary U. Primary
% OBCEnrolment% OBC girls toOBC Enrolment
Pupil-teacher ratio (PTR)Student-classroom ratio (SCR)% Schools with <= 50 students% Schools with PTR > 100% Female teachers
% Schools established since 1995
Regular teachers Para-teachers
% minorrepairs
% majorrepairs
# = not applicable na = not available * Some totals may not match due to no response in classificatory data items
4.9 95.12.9 97.1
22.0 78.02.5 97.5
3446
46.85857
4.110.627.733.9
42.16247
1.911.135.420.4
43.13431
20.04.2
25.259.7
35.93816
17.93.6
15.77.1
18.5 20.8 na 54.4 36.8
91786015.919.7
Category
PrivateGovt.PrivateGovtPrivateGovt.PrivateGovt.PrivateGovt.
Total population (in 000's)
Number of blocks/taluks
District
Decadal growth rate
Primary onlyPrimary with upper primaryPrimary with upper primary & sec/higher sec.Upper primary onlyUpper primary with sec./higher secondary
% Single classroom schools% Single teacher schools
P + UP P+sec/hs U.P. only UP+secP. only
No response in school category
Primary with upper primaryPrimary with U.P. & sec/higherUpper primary onlyUpper primary with sec./higher sec
Primary only
Primary onlyPrimary with upper primaryPrimary with Upper primary & sec/higherUpper primary only
Para-teachers
School category
Upper primary with sec./higher secondary
Primary onlyPrimary with upper prim.
P. onlyP + UPP+sec/hsU.P. onlyUP+sec
NER(U.Prim)GER(U.Prim)NER (Primary)GER (Primary)
Transition ratePrim. to U. Prim
SC/ST Enrolment
Indicators
Classrooms/Other rooms
Prim.with U.P.&Sec/H.SUpper Primary onlyU. Primary with Sec./H.S.
Basic Data, 2001
Data reported from
Performance indicators
98.7 39.998.9 34.898.6 40.998.4 43.6

514
Elementary Education in India - Where do we stand ?
0.0120.012
34.7 34.3
Key data: Elementary Education
2674
BARABANKI
(Previous academic year)
(Previous year)
Gender and caste distribution of teachers*
No. of schools by type of building*
BoysWith disability
Flow rates
Primary Level
Enrolment*
Number of schools
Grade
GER / NER
School category
Primary Upper primaryBoys Boys GirlsGirls
IncentiveType
School categoryMultiple
TypeKuccha
PartiallyPucca
PuccaTotal % good condition
Otherrooms
TentNo
Building
Classrooms
Belowsecondary
Highersecondary
Postgraduate
M. Phil.GraduateSecondarySchool category OthersNo
response
ST teachers
Total Male Female No res Male Female No res Male Female Male FemaleSC teachers
Text booksUniformAttendanceStationery
% Passed
Avg. No. of Tchs.
%
Female literacyOverall literacy
dev. grant grantSchool T L M
Male Female
IVV
IIIIII
Grade R.R. D.O.R. P.R.
VIIVI
# #
I - V
Enrolment by medium of instructions
Examination results
Retention rate
GPI
Primary cycle U. primary cycleState
DISTRICT ELEMENTARY EDUCATION REPORT CARD : 2005-06
GirlsGrade
IIIIIIIVVVI
VIII
AllGirls
Total
VII
% TotalGrossness
School category
221
5071
109 184 1
587
4891
1 0 0
1,991 27191 6,502
4 84444 66,319
7 3450 0
1,937 228 366,040 59,04244,177 4,489 39,093
1,766 844 1,76611,026 62,159 9,181
0 0 02,469 345 2,469
375,594 65,500 5,82292
998462
P + UP P+sec/hs U.P. only UP+sec
School categoryP. only
0.4 0.0 0.0 0.0 0.05.1
Number of Clusters 29721948
% Schools with SCR > 601.5 0.0 24.1 0.0
43.7 33.6 40.0 12.2 12.5% Schools with pre-primary sections 4.5 3.1 20.0 0.2 0.0% Schools with common toilets 94.2 93.1 100.0 73.3 87.5
% Schools with girls toilets 73.3 89.3 100.0 63.7 87.5% Schools with drinking water facility 96.5 98.5 80.0 78.4 87.5
% Enrolment in Govt. schools 85.2 12.8 32.3 85.7 12.399.8 100.0 100.0 98.4 100.0
% No female teacher schools (tch>=2) 24.8 35.1 80.0 46.0 75.03.1 0.8 0.0 10.4 0.0
0.6 0.0 0.0 0.3 0.0%Enrolment in schools without blackboard 0.1 0.0 0.0 0.3 0.0
2001-02 2002-03 2003-04 2004-05 2005-06IIIIIIIVV
VIVII
Total U.P
109,395103,235
96,86691,22172,90738,889
33,554
110,487101,215
99,48981,22769,513
29,85324,380
120,525112,465
89,90474,37965,825
52,13548,206
108,21577,67260,97447,15538,202
19,98514,566
83,11064,10357,88947,63541,725
15,29511,725
100,91876,381144,35446,12936,305
110.1
63.1
107.0
32.5
129.7
45.1
38.2
0.080.0
52,40850,12147,24744,43835,15618,15715,49813,022
276,047
298333350353292130117
731,946
185228271242211
837353
1,346
7,654
classrooms
1,12860
2,32298
60.585.3
100.075.195.9
29.412.9
10.1
0.020.6
4.1
1.80.04.30.0
2279
72230
2,085 2,228 13 1 0 6 13125 0 0 0 5 0
5 0 0 0 0 0554 0 0 0 2 9
8 0 0 0 0 0
111 446 1,288 1,752 602 8 23 6 93 349 81 1 0 190 0 5 7 3 0 0 0
10 27 503 703 359 3 1 190 0 3 12 12 0 0 0
5 37 928 1,195 380 1 1 0
2935374
121235
22
1703
3765
1295 30 1253 1295 12 792 306 12 780
140
2020
0000
0000
513
2394
130
400
1090
0050
Terminalgrade Passed
VIII boysV girlsV boys
VIII girls
51 with >60%
1.66820554
151627
27
1.10.01.90.0
1.03.50.01.9
20.0
438930Hindi Others Urdu Konkani Bengali
498052610
764962814
1019259
0443
0
454554
000
1910000
1840000
% Schools recvd.
68.60.80.0
32.90.0
55.71.50.0
28.70.0
13959783
65256109
165050
107053
163662125
6355777
266870
87160
3.04.23.02.93.4
0.50.40.40.3
0.10.10.1
0.20.4
87.6
55.9
0.94
2005-062004-052003-04
UTTAR PRADESH
20.0
Upper PrimaryPrimary
Sex ratio Sex ratio 0-6
18 166
VIII20.0
Enrolment of children
9,285VIII 11,578 44,013 22,148 28,475Total Pr. 294,462 332,218 463,098 461,931 473,624
1 - 5 6 - 8
1,432 1953 241 0
3 12
%Teachers recvd.in-service training
Total schools* Rural schools* Total enrolment* Rural enrolment* Teachers*
2.1 7.1
100.0
41.9
92.5
59.2 28.4% SC enrolment% SC girls to SC enrolment% ST enrolment
48.4 44.6
43.1 50.0
48.3
48.5
45.4
46.5
Position of teachers by educational qualification (other than para teacher)
(Previous academic year)Incentives : Number of beneficiaries
% ST girls to ST enrolment
% Girls
Number of villages
% 0 - 6 population
% SC population % ST population
% Urban population
% Schools with blackboard
% Enrolment in single-teacher schools
% Enrolment in schools without building
Primary Upperprimary
OBC EnrolmentPrimary U. Primary
% OBCEnrolment% OBC girls toOBC Enrolment
Pupil-teacher ratio (PTR)Student-classroom ratio (SCR)% Schools with <= 50 students% Schools with PTR > 100% Female teachers
% Schools established since 1995
Regular teachers Para-teachers
% minorrepairs
% majorrepairs
# = not applicable na = not available * Some totals may not match due to no response in classificatory data items
6.5 93.04.3 95.38.2 91.4
10.1 89.643.9 55.912.6 87.0
44174
48.86558
3.916.538.022.2
43.39145
3.142.030.731.3
47.44833
22.311.323.150.8
36.5104
290.0
62.518.5
0.0
26.4 26.9 na 47.4 34.3
9418879.319.3
Category
PrivateGovt.PrivateGovtPrivateGovt.PrivateGovt.PrivateGovt.
Total population (in 000's)
Number of blocks/taluks
District
Decadal growth rate
Primary onlyPrimary with upper primaryPrimary with upper primary & sec/higher sec.Upper primary onlyUpper primary with sec./higher secondary
% Single classroom schools% Single teacher schools
P + UP P+sec/hs U.P. only UP+secP. only
No response in school category
Primary with upper primaryPrimary with U.P. & sec/higherUpper primary onlyUpper primary with sec./higher sec
Primary only
Primary onlyPrimary with upper primaryPrimary with Upper primary & sec/higherUpper primary only
Para-teachers
School category
Upper primary with sec./higher secondary
Primary onlyPrimary with upper prim.
P. onlyP + UPP+sec/hsU.P. onlyUP+sec
NER(U.Prim)GER(U.Prim)NER (Primary)GER (Primary)
Transition ratePrim. to U. Prim
SC/ST Enrolment
Indicators
Classrooms/Other rooms
Prim.with U.P.&Sec/H.SUpper Primary onlyU. Primary with Sec./H.S.
Basic Data, 2001
Data reported from
Performance indicators
99.4 42.899.3 42.398.5 37.099.1 42.0
Utt
ar P
rad
esh

515
Elementary Education: Report Card - BAREILLY
Utt
ar P
rad
esh
0.1070.025
15.6 18.6
Key data: Elementary Education
3619
BAREILLY
(Previous academic year)
(Previous year)
Gender and caste distribution of teachers*
No. of schools by type of building*
BoysWith disability
Flow rates
Primary Level
Enrolment*
Number of schools
Grade
GER / NER
School category
Primary Upper primaryBoys Boys GirlsGirls
IncentiveType
School categoryMultiple
TypeKuccha
PartiallyPucca
PuccaTotal % good condition
Otherrooms
TentNo
Building
Classrooms
Belowsecondary
Highersecondary
Postgraduate
M. Phil.GraduateSecondarySchool category OthersNo
response
ST teachers
Total Male Female No res Male Female No res Male Female Male FemaleSC teachers
Text booksUniformAttendanceStationery
% Passed
Avg. No. of Tchs.
%
Female literacyOverall literacy
dev. grant grantSchool T L M
Male Female
IVV
IIIIII
Grade R.R. D.O.R. P.R.
VIIVI
# #
I - V
Enrolment by medium of instructions
Examination results
Retention rate
GPI
Primary cycle U. primary cycleState
DISTRICT ELEMENTARY EDUCATION REPORT CARD : 2005-06
GirlsGrade
IIIIIIIVVVI
VIII
AllGirls
Total
VII
% TotalGrossness
School category
90
4378
165 911 0
10635
4088
0 0 0
1,841 507132 2,448
11 088 49,28232 2,023
0 0
1,689 416 371,287 66,18350,105 2,448 40,884
4,940 0 4,94014,837 47,337 12,833
0 0 08,581 2,023 7,688
398,188 82,826 5,66359
2,6151,443
P + UP P+sec/hs U.P. only UP+sec
School categoryP. only
1.1 0.0 0.0 0.9 0.07.4
Number of Clusters 31191834
% Schools with SCR > 600.0 0.0 19.3 4.7
52.9 17.2 9.1 8.5 9.3% Schools with pre-primary sections 1.3 6.9 9.1 0.6 2.3% Schools with common toilets 74.6 94.3 100.0 80.7 97.7
% Schools with girls toilets 63.8 92.5 100.0 67.8 81.4% Schools with drinking water facility 95.4 98.9 100.0 85.5 100.0
% Enrolment in Govt. schools 82.8 4.7 0.0 76.9 19.198.9 94.8 100.0 99.4 93.0
% No female teacher schools (tch>=2) 29.5 24.1 27.3 49.5 62.85.9 0.0 0.0 10.9 3.6
0.5 0.0 0.0 3.0 0.0%Enrolment in schools without blackboard 0.4 2.3 0.0 0.1 6.4
2001-02 2002-03 2003-04 2004-05 2005-06IIIIIIIVV
VIVII
Total U.P
131,714127,427
98,63487,30571,72738,147
31,706
126,08297,54593,20674,36163,676
31,21824,898
105,720103,493
87,90974,05260,190
27,80124,268
117,37098,25988,58868,94452,819
24,90818,890
114,035100,039
83,44061,70353,215
20,04415,955
96,42378,26272,54059,34549,101
75.7
23.4
77.7
24.6
104.6
31.9
45.8
0.09.1
61,15959,88745,32840,56132,00514,94111,915
9,586275,382
577571521474482501216127
3,469
240268286309288197106
481,742
7,288
classrooms
1,368145
2,034505
68.091.089.774.595.8
26.78.7
5.3
10.320.3
4.2
0.30.05.20.0
22533
647111
2,195 2,270 36 0 0 13 29165 2 0 0 6 1
11 0 0 0 0 0507 5 1 0 1 29
43 0 0 0 0 0
48 849 1,912 2,263 1,380 12 53 25 301 559 450 2 1 1500 0 12 37 23 0 0 71 55 648 543 505 4 1 440 2 16 72 119 1 0 63
0 53 822 518 229 0 0 0
4099941
571400
249
55022
40124
2557 0 902 720 0 488 187 8 20000
8000
3020
0000
715
22919
300
770
4012
1020
Terminalgrade Passed
VIII boysV girlsV boys
VIII girls
187 with >60%
28.782781502
791803
273
0.30.0
30.90.0
21.10.40.0
19.90.0
480605Hindi
525534940
6411910604
% Schools recvd.
63.91.70.0
39.42.3
63.40.00.0
48.40.0
1333240
18889
105630
2244
1643607
10174
161860
960
3.58.67.23.36.3
0.70.91.01.0
0.71.11.2
1.51.0
62.1
59.6
0.86
2005-062004-052003-04
UTTAR PRADESH
27.8
Upper PrimaryPrimary
Sex ratio Sex ratio 0-6
19 153
VIII54.5
Enrolment of children
13,102VIII 15,547 20,471 22,146 26,570Total Pr. 412,432 425,980 431,364 454,870 516,807
1 - 5 6 - 8
1,290 51342 231
0 0
0 79
%Teachers recvd.in-service training
Total schools* Rural schools* Total enrolment* Rural enrolment* Teachers*
9.2 25.1
95.0
23.9
68.0 70.3
17.8 17.5% SC enrolment% SC girls to SC enrolment% ST enrolment
47.2 42.2
22.1 40.8
61.1
46.7
50.1
36.7
Position of teachers by educational qualification (other than para teacher)
(Previous academic year)Incentives : Number of beneficiaries
% ST girls to ST enrolment
% Girls
Number of villages
% 0 - 6 population
% SC population % ST population
% Urban population
% Schools with blackboard
% Enrolment in single-teacher schools
% Enrolment in schools without building
Primary Upperprimary
OBC EnrolmentPrimary U. Primary
% OBCEnrolment% OBC girls toOBC Enrolment
Pupil-teacher ratio (PTR)Student-classroom ratio (SCR)% Schools with <= 50 students% Schools with PTR > 100% Female teachers
% Schools established since 1995
Regular teachers Para-teachers
% minorrepairs
% majorrepairs
# = not applicable na = not available * Some totals may not match due to no response in classificatory data items
6.1 92.93.9 95.2
38.9 59.66.8 92.2
3463
47.05866
4.218.239.630.7
34.63538
2.31.1
36.846.0
40.63632
20.38.1
22.454.5
27.33921
2.34.78.89.3
27.0 12.7 na 47.8 35.2
90687132.919.9
Category
PrivateGovt.PrivateGovtPrivateGovt.PrivateGovt.PrivateGovt.
Total population (in 000's)
Number of blocks/taluks
District
Decadal growth rate
Primary onlyPrimary with upper primaryPrimary with upper primary & sec/higher sec.Upper primary onlyUpper primary with sec./higher secondary
% Single classroom schools% Single teacher schools
P + UP P+sec/hs U.P. only UP+secP. only
No response in school category
Primary with upper primaryPrimary with U.P. & sec/higherUpper primary onlyUpper primary with sec./higher sec
Primary only
Primary onlyPrimary with upper primaryPrimary with Upper primary & sec/higherUpper primary only
Para-teachers
School category
Upper primary with sec./higher secondary
Primary onlyPrimary with upper prim.
P. onlyP + UPP+sec/hsU.P. onlyUP+sec
NER(U.Prim)GER(U.Prim)NER (Primary)GER (Primary)
Transition ratePrim. to U. Prim
SC/ST Enrolment
Indicators
Classrooms/Other rooms
Prim.with U.P.&Sec/H.SUpper Primary onlyU. Primary with Sec./H.S.
Basic Data, 2001
Data reported from
Performance indicators
98.0 36.897.2 34.397.7 33.198.8 36.0

516
Elementary Education in India - Where do we stand ?
0.0240.466
26.0 24.1
Key data: Elementary Education
2085
BASTI
(Previous academic year)
(Previous year)
Gender and caste distribution of teachers*
No. of schools by type of building*
BoysWith disability
Flow rates
Primary Level
Enrolment*
Number of schools
Grade
GER / NER
School category
Primary Upper primaryBoys Boys GirlsGirls
IncentiveType
School categoryMultiple
TypeKuccha
PartiallyPucca
PuccaTotal % good condition
Otherrooms
TentNo
Building
Classrooms
Belowsecondary
Highersecondary
Postgraduate
M. Phil.GraduateSecondarySchool category OthersNo
response
ST teachers
Total Male Female No res Male Female No res Male Female Male FemaleSC teachers
Text booksUniformAttendanceStationery
% Passed
Avg. No. of Tchs.
%
Female literacyOverall literacy
dev. grant grantSchool T L M
Male Female
IVV
IIIIII
Grade R.R. D.O.R. P.R.
VIIVI
# #
I - V
Enrolment by medium of instructions
Examination results
Retention rate
GPI
Primary cycle U. primary cycleState
DISTRICT ELEMENTARY EDUCATION REPORT CARD : 2005-06
GirlsGrade
IIIIIIIVVVI
VIII
AllGirls
Total
VII
% TotalGrossness
School category
120
3441
72 1120 0
11218
3371
0 0 0
1,465 27265 2,41819 099 42,39918 413
0 0
1,432 229 263,289 48,57016,527 2,299 15,653
7,137 0 6,59321,901 41,339 19,993
0 0 05,096 413 5,096
267,509 56,202 4,24127
670157
P + UP P+sec/hs U.P. only UP+sec
School categoryP. only
1.0 2.4 0.0 0.4 0.06.3
Number of Clusters 23161631
% Schools with SCR > 604.8 0.0 25.0 5.3
37.1 17.9 20.0 10.3 0.0% Schools with pre-primary sections 19.2 0.0 5.0 0.9 0.0% Schools with common toilets 70.0 66.7 70.0 74.3 68.4
% Schools with girls toilets 59.4 63.1 70.0 64.9 78.9% Schools with drinking water facility 95.9 98.8 100.0 82.2 100.0
% Enrolment in Govt. schools 82.6 12.8 0.0 65.9 7.599.4 72.6 75.0 82.9 84.2
% No female teacher schools (tch>=2) 44.8 58.3 70.0 52.9 63.24.2 5.1 0.0 12.6 5.6
0.5 0.0 7.0 0.3 0.0%Enrolment in schools without blackboard 0.6 23.9 20.4 9.0 12.7
2001-02 2002-03 2003-04 2004-05 2005-06IIIIIIIVV
VIVII
Total U.P
90,86974,32564,51058,14048,07631,808
27,417
89,45265,38260,66448,22439,622
25,68222,852
85,21466,31952,64942,01135,920
23,66621,137
133,93684,90868,85755,31050,441
31,36228,080
68,81745,38038,62134,04731,065
16,28914,165
83,68269,06863,46883,97742,348
86.6
35.9
91.1
38.2
118.0
48.0
42.8
5.060.0
43,68136,76331,49828,68522,98114,51512,20810,827
201,158
162175198184157
585948
1,041
101125129115
94444133
682
6,260
classrooms
567167
2,009234
69.677.281.475.071.8
21.614.5
8.8
10.219.623.5
8.38.45.44.7
11836
65960
1,650 1,642 24 18 4 34 1465 3 5 0 10 113 0 2 0 4 1
424 2 1 0 21 814 1 0 0 4 0
455 391 945 939 377 6 143 12 17 57 41 2 0 3
9 2 9 15 11 0 0 0133 41 314 336 182 8 1 6
6 0 4 15 21 0 0 0
283 62 387 410 161 0 2 0
2912142
37862
41
339
1595
658 0 825 516 0 414 144 17 60000
9780
0000
0000
86
1560
10
230
3070
0010
Terminalgrade Passed
VIII boysV girlsV boys
VIII girls
456 with >60%
27.04911184
531029
46
3.30.0
22.82.4
29.06.10.0
17.60.0
309781Hindi Others Urdu Marathi Sanskrit
159886428
629584915
70372740
7091086
594
2286209
000
7570000
45480
220
% Schools recvd.
73.23.65.0
38.826.3
71.86.05.0
37.315.8
951260
21200147
43650
27150
1093990
22192133
64870
18720
2.82.22.72.32.4
2.40.90.70.6
1.00.80.8
0.51.2
69.6
79.6
0.95
2005-062004-052003-04
UTTAR PRADESH
17.0
Upper PrimaryPrimary
Sex ratio Sex ratio 0-6
14 150
VIII15.0
Enrolment of children
11,894VIII 24,535 18,665 20,534 24,457Total Pr. 217,930 393,452 282,113 303,344 335,920
1 - 5 6 - 8
736 2932 440 0
0 53
%Teachers recvd.in-service training
Total schools* Rural schools* Total enrolment* Rural enrolment* Teachers*
11.2 21.4
100.0
37.7
74.2 80.1
25.4 28.2% SC enrolment% SC girls to SC enrolment% ST enrolment
48.4 45.2
47.5 40.0
52.1
49.4
46.8
44.0
Position of teachers by educational qualification (other than para teacher)
(Previous academic year)Incentives : Number of beneficiaries
% ST girls to ST enrolment
% Girls
Number of villages
% 0 - 6 population
% SC population % ST population
% Urban population
% Schools with blackboard
% Enrolment in single-teacher schools
% Enrolment in schools without building
Primary Upperprimary
OBC EnrolmentPrimary U. Primary
% OBCEnrolment% OBC girls toOBC Enrolment
Pupil-teacher ratio (PTR)Student-classroom ratio (SCR)% Schools with <= 50 students% Schools with PTR > 100% Female teachers
% Schools established since 1995
Regular teachers Para-teachers
% minorrepairs
% majorrepairs
# = not applicable na = not available * Some totals may not match due to no response in classificatory data items
15.1 82.41.1 98.03.9 95.40.2 99.3
19.8 79.68.1 90.7
43135
49.06652
3.220.023.935.9
40.4103
332.4
36.917.938.1
46.36232
24.817.515.554.6
39.7120
240.0
47.410.910.5
22.7 20.9 na 52.5 36.9
9389385.619.5
Category
PrivateGovt.PrivateGovtPrivateGovt.PrivateGovt.PrivateGovt.
Total population (in 000's)
Number of blocks/taluks
District
Decadal growth rate
Primary onlyPrimary with upper primaryPrimary with upper primary & sec/higher sec.Upper primary onlyUpper primary with sec./higher secondary
% Single classroom schools% Single teacher schools
P + UP P+sec/hs U.P. only UP+secP. only
No response in school category
Primary with upper primaryPrimary with U.P. & sec/higherUpper primary onlyUpper primary with sec./higher sec
Primary only
Primary onlyPrimary with upper primaryPrimary with Upper primary & sec/higherUpper primary only
Para-teachers
School category
Upper primary with sec./higher secondary
Primary onlyPrimary with upper prim.
P. onlyP + UPP+sec/hsU.P. onlyUP+sec
NER(U.Prim)GER(U.Prim)NER (Primary)GER (Primary)
Transition ratePrim. to U. Prim
SC/ST Enrolment
Indicators
Classrooms/Other rooms
Prim.with U.P.&Sec/H.SUpper Primary onlyU. Primary with Sec./H.S.
Basic Data, 2001
Data reported from
Performance indicators
99.1 38.798.8 36.097.4 36.390.5 36.0
Utt
ar P
rad
esh

517
Elementary Education: Report Card - BHADOHI
Utt
ar P
rad
esh
0.4190.038
28.4 26.7
Key data: Elementary Education
na
BHADOHI
(Previous academic year)
(Previous year)
Gender and caste distribution of teachers*
No. of schools by type of building*
BoysWith disability
Flow rates
Primary Level
Enrolment*
Number of schools
Grade
GER / NER
School category
Primary Upper primaryBoys Boys GirlsGirls
IncentiveType
School categoryMultiple
TypeKuccha
PartiallyPucca
PuccaTotal % good condition
Otherrooms
TentNo
Building
Classrooms
Belowsecondary
Highersecondary
Postgraduate
M. Phil.GraduateSecondarySchool category OthersNo
response
ST teachers
Total Male Female No res Male Female No res Male Female Male FemaleSC teachers
Text booksUniformAttendanceStationery
% Passed
Avg. No. of Tchs.
%
Female literacyOverall literacy
dev. grant grantSchool T L M
Male Female
IVV
IIIIII
Grade R.R. D.O.R. P.R.
VIIVI
# #
I - V
Enrolment by medium of instructions
Examination results
Retention rate
GPI
Primary cycle U. primary cycleState
DISTRICT ELEMENTARY EDUCATION REPORT CARD : 2005-06
GirlsGrade
IIIIIIIVVVI
VIII
AllGirls
Total
VII
% TotalGrossness
School category
50
2584
28 40 0
9521
2554
52 0 5
538 16823 2,582
0 081 46,99518 1,168
0 0
525 139 184,475 37,1849,848 2,388 8,085
0 0 024,258 46,448 20,691
0 0 04,829 1,168 4,185
190,672 43,930 1,89026
724188
P + UP P+sec/hs U.P. only UP+sec
School categoryP. only
0.0 0.0 0.0 0.3 0.00.8
Number of Clusters 1169615
% Schools with SCR > 600.0 0.0 9.9 4.0
64.0 18.2 0.0 22.1 4.0% Schools with pre-primary sections 8.5 0.0 0.0 0.3 0.0% Schools with common toilets 86.1 87.9 0.0 86.1 96.0
% Schools with girls toilets 75.1 87.9 0.0 77.9 68.0% Schools with drinking water facility 99.2 97.0 0.0 96.0 100.0
% Enrolment in Govt. schools 81.3 20.8 0.0 66.0 19.597.9 100.0 0.0 96.6 100.0
% No female teacher schools (tch>=2) 21.8 45.5 0.0 61.2 72.00.1 0.0 0.0 3.1 5.3
0.1 0.0 0.0 0.0 0.0%Enrolment in schools without blackboard 1.1 0.0 0.0 1.3 0.0
2001-02 2002-03 2003-04 2004-05 2005-06IIIIIIIVV
VIVII
Total U.P
54,87949,24448,35049,06441,39030,957
26,129
43,80643,57747,17339,00837,716
25,53323,252
42,20447,52441,01237,67334,381
24,44422,467
46,42135,18734,97429,49928,526
20,05015,624
81,35570,16366,35949,467
96.9
59.2
0.0
0.00.0
26,45623,96823,38623,91619,35014,45512,00310,535
154,069
99110153203174
92101
891,021
7096
107134109
706337
686
3,145
classrooms
3550
1,653317
74.583.4
0.081.487.1
20.115.5
5.4
0.015.710.7
1.10.02.82.2
630
60086
875 676 5 2 0 17 429 1 0 0 3 0
0 0 0 0 0 0337 3 0 0 9 3
25 0 0 0 0 0
11 98 405 637 505 11 24 6 18 111 69 2 0 00 0 0 0 0 0 0 01 12 350 473 472 13 0 00 0 2 37 52 1 0 0
1 15 343 376 207 2 0 0
1348155
01125
80
550
19612
324 4 478 460 0 228 75 9 30000
3020
1010
0000
160
1674
20
203
00
100
0020
Terminalgrade Passed
VIII boysV girlsV boys
VIII girls
7 with >60%
16.32614214
01324
92
0.60.0
26.60.0
13.50.00.0
12.78.3
232662Hindi Others Urdu Gujarati
122360
701905997
95200
4210
338194
000
000
950
% Schools recvd.
72.83.00.0
56.90.0
71.56.10.0
55.20.0
70414148
673030
99040
142400
77950117
615670
167430
107270
3.76.50.03.83.7
0.10.10.10.2
0.00.00.0
0.40.2
82.1
0.93
2005-062004-052003-04
UTTAR PRADESH
0.0
Upper PrimaryPrimary
Sex ratio Sex ratio 0-6
6 82
VIII0.0
Enrolment of children
VIII 13,793 19,448 21,378 24,269Total Pr. 174,607 202,794 211,280 242,927
1 - 5 6 - 8
901 42319 73
4 0
0 0
%Teachers recvd.in-service training
Total schools* Rural schools* Total enrolment* Rural enrolment* Teachers*
6.6 12.3
91.5
31.5% SC enrolment% SC girls to SC enrolment% ST enrolment
47.3 43.6
40.2 73.9
46.4
48.5
43.2
44.5
Position of teachers by educational qualification (other than para teacher)
(Previous academic year)Incentives : Number of beneficiaries
% ST girls to ST enrolment
% Girls
Number of villages
% 0 - 6 population
% SC population % ST population
% Urban population
% Schools with blackboard
% Enrolment in single-teacher schools
% Enrolment in schools without building
Primary Upperprimary
OBC EnrolmentPrimary U. Primary
% OBCEnrolment% OBC girls toOBC Enrolment
Pupil-teacher ratio (PTR)Student-classroom ratio (SCR)% Schools with <= 50 students% Schools with PTR > 100% Female teachers
% Schools established since 1995
Regular teachers Para-teachers
% minorrepairs
% majorrepairs
# = not applicable na = not available * Some totals may not match due to no response in classificatory data items
17.5 82.100
48.19075
2.734.730.039.7
51.15835
0.09.1
26.260.6
45.05443
14.710.814.967.7
46.96519
0.012.013.028.0
na na na na na
nananana
Category
PrivateGovt.PrivateGovtPrivateGovt.PrivateGovt.PrivateGovt.
Total population (in 000's)
Number of blocks/taluks
District
Decadal growth rate
Primary onlyPrimary with upper primaryPrimary with upper primary & sec/higher sec.Upper primary onlyUpper primary with sec./higher secondary
% Single classroom schools% Single teacher schools
P + UP P+sec/hs U.P. only UP+secP. only
No response in school category
Primary with upper primaryPrimary with U.P. & sec/higherUpper primary onlyUpper primary with sec./higher sec
Primary only
Primary onlyPrimary with upper primaryPrimary with Upper primary & sec/higherUpper primary only
Para-teachers
School category
Upper primary with sec./higher secondary
Primary onlyPrimary with upper prim.
P. onlyP + UPP+sec/hsU.P. onlyUP+sec
NER(U.Prim)GER(U.Prim)NER (Primary)GER (Primary)
Transition ratePrim. to U. Prim
SC/ST Enrolment
Indicators
Classrooms/Other rooms
Prim.with U.P.&Sec/H.SUpper Primary onlyU. Primary with Sec./H.S.
Basic Data, 2001
Data reported from
Performance indicators
98.6 38.198.5 33.298.3 40.898.7 41.3

518
Elementary Education in India - Where do we stand ?
0.2790.331
27.2 30.3
Key data: Elementary Education
3132
BIJNOR
(Previous academic year)
(Previous year)
Gender and caste distribution of teachers*
No. of schools by type of building*
BoysWith disability
Flow rates
Primary Level
Enrolment*
Number of schools
Grade
GER / NER
School category
Primary Upper primaryBoys Boys GirlsGirls
IncentiveType
School categoryMultiple
TypeKuccha
PartiallyPucca
PuccaTotal % good condition
Otherrooms
TentNo
Building
Classrooms
Belowsecondary
Highersecondary
Postgraduate
M. Phil.GraduateSecondarySchool category OthersNo
response
ST teachers
Total Male Female No res Male Female No res Male Female Male FemaleSC teachers
Text booksUniformAttendanceStationery
% Passed
Avg. No. of Tchs.
%
Female literacyOverall literacy
dev. grant grantSchool T L M
Male Female
IVV
IIIIII
Grade R.R. D.O.R. P.R.
VIIVI
# #
I - V
Enrolment by medium of instructions
Examination results
Retention rate
GPI
Primary cycle U. primary cycleState
DISTRICT ELEMENTARY EDUCATION REPORT CARD : 2005-06
GirlsGrade
IIIIIIIVVVI
VIII
AllGirls
Total
VII
% TotalGrossness
School category
12
48818
153 15 2
29862
46010
29 0 0
1,675 1,31688 288
4 557241 52,713
35 6,9400 0
1,564 954 223,879 146,32449,847 288 27,928
2,578 557 1,93244,613 47,571 36,568
0 0 021,867 2,649 11,373
242,620 207,960 4,6454
5,507759
P + UP P+sec/hs U.P. only UP+sec
School categoryP. only
8.6 1.9 0.0 1.4 0.03.9
Number of Clusters 40471703
% Schools with SCR > 600.6 14.3 11.7 1.3
33.3 33.8 0.0 9.4 7.5% Schools with pre-primary sections 31.6 1.9 14.3 1.9 2.5% Schools with common toilets 83.4 92.2 100.0 83.0 97.5
% Schools with girls toilets 59.7 92.9 85.7 68.3 81.3% Schools with drinking water facility 97.4 99.4 100.0 89.2 98.8
% Enrolment in Govt. schools 53.8 0.6 17.8 54.2 24.198.2 98.7 100.0 95.2 93.8
% No female teacher schools (tch>=2) 25.7 31.2 28.6 43.5 66.32.2 0.2 6.4 4.6 0.7
0.5 0.0 0.0 0.1 0.0%Enrolment in schools without blackboard 1.6 0.8 0.0 2.6 6.5
2001-02 2002-03 2003-04 2004-05 2005-06IIIIIIIVV
VIVII
Total U.P
115,531107,269
98,56887,36179,39153,742
47,026
94,66884,95378,46969,38260,898
40,10433,293
91,52383,26076,19564,60956,009
29,48325,140
92,12881,45970,12557,00049,354
23,50918,587
105,77889,55671,12058,65951,397
18,34514,615
141,863102,23775,52557,49044,592
75.3
28.2
76.6
37.1
114.2
54.2
48.9
0.057.1
53,15351,35647,22042,02938,53025,64621,87919,058
298,871
429492560512519290235172
3,209
237329404343362180174139
2,168
9,621
classrooms
1,156107
3,1161,207
96.8100.0100.0
98.799.7
2.30.0
0.9
0.01.20.2
0.00.00.10.2
29922
1,174394
3,200 2,905 58 1 0 7 19146 6 1 0 1 0
7 0 0 0 0 0776 5 0 0 0 5
78 0 0 0 1 1
585 970 2,339 2,409 1,990 10 1217 36 90 287 281 5 0 39
4 1 6 5 13 0 0 091 80 508 854 1,071 5 0 2525 23 35 70 194 1 0 16
26 39 413 568 456 2 0 0
4676391
121877
290
36217
75674
3970 1 772 733 0 1030 402 54 522010
5074
3010
0000
710
39537
231
837
40
112
1022
Terminalgrade Passed
VIII boysV girlsV boys
VIII girls
332 with >60%
33.810152763
292642
368
0.00.0
41.60.7
27.40.00.0
40.00.0
48807Hindi Sanskrit Urdu Others
9290
7577928
796931
000
2730000
1560000
% Schools recvd.
51.52.6
14.335.1
3.8
46.10.00.0
15.96.3
113782288
23689507
17637124
6362161
127834372
22251475
38030115
5243188
3.45.04.13.44.6
3.43.33.43.2
6.86.05.1
2.63.2
73.6
83.8
0.91
2005-062004-052003-04
UTTAR PRADESH
58.6
Upper PrimaryPrimary
Sex ratio Sex ratio 0-6
16 153
VIII0.0
Enrolment of children
11,632VIII 15,394 20,902 28,840 41,095Total Pr. 376,510 350,066 371,596 388,370 488,120
1 - 5 6 - 8
1,337 1,30586 282
0 0
4 25
%Teachers recvd.in-service training
Total schools* Rural schools* Total enrolment* Rural enrolment* Teachers*
19.5 32.4
91.8
36.6
63.8 60.6
21.1 26.3% SC enrolment% SC girls to SC enrolment% ST enrolment
47.7 46.6
43.3 37.9
37.6
47.8
37.2
46.2
Position of teachers by educational qualification (other than para teacher)
(Previous academic year)Incentives : Number of beneficiaries
% ST girls to ST enrolment
% Girls
Number of villages
% 0 - 6 population
% SC population % ST population
% Urban population
% Schools with blackboard
% Enrolment in single-teacher schools
% Enrolment in schools without building
Primary Upperprimary
OBC EnrolmentPrimary U. Primary
% OBCEnrolment% OBC girls toOBC Enrolment
Pupil-teacher ratio (PTR)Student-classroom ratio (SCR)% Schools with <= 50 students% Schools with PTR > 100% Female teachers
% Schools established since 1995
Regular teachers Para-teachers
% minorrepairs
% majorrepairs
# = not applicable na = not available * Some totals may not match due to no response in classificatory data items
13.6 83.829108
47.84447
9.54.5
46.349.3
44.46643
3.916.947.849.4
48.73731
18.13.1
28.760.9
43.17824
2.525.020.1
6.3
27.2 20.9 0.1 58.1 46.1
90589624.319.7
Category
PrivateGovt.PrivateGovtPrivateGovt.PrivateGovt.PrivateGovt.
Total population (in 000's)
Number of blocks/taluks
District
Decadal growth rate
Primary onlyPrimary with upper primaryPrimary with upper primary & sec/higher sec.Upper primary onlyUpper primary with sec./higher secondary
% Single classroom schools% Single teacher schools
P + UP P+sec/hs U.P. only UP+secP. only
No response in school category
Primary with upper primaryPrimary with U.P. & sec/higherUpper primary onlyUpper primary with sec./higher sec
Primary only
Primary onlyPrimary with upper primaryPrimary with Upper primary & sec/higherUpper primary only
Para-teachers
School category
Upper primary with sec./higher secondary
Primary onlyPrimary with upper prim.
P. onlyP + UPP+sec/hsU.P. onlyUP+sec
NER(U.Prim)GER(U.Prim)NER (Primary)GER (Primary)
Transition ratePrim. to U. Prim
SC/ST Enrolment
Indicators
Classrooms/Other rooms
Prim.with U.P.&Sec/H.SUpper Primary onlyU. Primary with Sec./H.S.
Basic Data, 2001
Data reported from
Performance indicators
98.5 43.598.6 41.793.5 30.296.0 33.3
Utt
ar P
rad
esh

519
Elementary Education: Report Card - BUDAUN
Utt
ar P
rad
esh
0.6660.227
19.3 21.7
Key data: Elementary Education
3069
BUDAUN
(Previous academic year)
(Previous year)
Gender and caste distribution of teachers*
No. of schools by type of building*
BoysWith disability
Flow rates
Primary Level
Enrolment*
Number of schools
Grade
GER / NER
School category
Primary Upper primaryBoys Boys GirlsGirls
IncentiveType
School categoryMultiple
TypeKuccha
PartiallyPucca
PuccaTotal % good condition
Otherrooms
TentNo
Building
Classrooms
Belowsecondary
Highersecondary
Postgraduate
M. Phil.GraduateSecondarySchool category OthersNo
response
ST teachers
Total Male Female No res Male Female No res Male Female Male FemaleSC teachers
Text booksUniformAttendanceStationery
% Passed
Avg. No. of Tchs.
%
Female literacyOverall literacy
dev. grant grantSchool T L M
Male Female
IVV
IIIIII
Grade R.R. D.O.R. P.R.
VIIVI
# #
I - V
Enrolment by medium of instructions
Examination results
Retention rate
GPI
Primary cycle U. primary cycleState
DISTRICT ELEMENTARY EDUCATION REPORT CARD : 2005-06
GirlsGrade
IIIIIIIVVVI
VIII
AllGirls
Total
VII
% TotalGrossness
School category
52
48414
42 319 2
15145
4619
0 0 0
2,168 49521 537
8 32898 56,23233 3,580
0 0
2,044 312 413,920 36,3469,393 114 5,3836,145 328 1,924
18,505 52,610 12,424
0 0 011,577 2,723 7,440
434,250 62,943 6,18720
2,144296
P + UP P+sec/hs U.P. only UP+sec
School categoryP. only
0.5 0.0 0.0 0.0 0.04.2
Number of Clusters 34251942
% Schools with SCR > 604.3 0.0 15.3 3.4
50.7 8.5 4.8 8.0 11.9% Schools with pre-primary sections 10.8 4.3 4.8 0.8 1.7% Schools with common toilets 87.3 97.9 95.2 87.7 96.6
% Schools with girls toilets 87.8 95.7 90.5 85.8 74.6% Schools with drinking water facility 100.0 100.0 100.0 100.0 100.0
% Enrolment in Govt. schools 87.3 5.4 5.1 75.2 23.6100.0 100.0 100.0 100.0 100.0
% No female teacher schools (tch>=2) 33.3 29.8 28.6 50.2 61.03.1 1.1 0.0 6.4 5.3
0.3 0.0 0.0 1.1 0.0%Enrolment in schools without blackboard 0.0 0.0 0.0 0.0 0.0
2001-02 2002-03 2003-04 2004-05 2005-06IIIIIIIVV
VIVII
Total U.P
131,117125,987
96,60884,49967,98640,112
32,027
131,487100,749
94,75077,10465,744
31,65623,853
108,964102,294
87,75475,48061,929
23,48919,822
108,42389,36983,70867,74750,378
13,3288,988
111,96596,54384,63761,75151,075
8,1736,278
97,29376,17158,65829,22119,578
90.5
22.4
95.1
28.4
120.8
37.9
60.0
9.54.8
59,83256,21541,58335,88628,24314,76911,512
8,771256,811
367531517556491230207156
3,055
201301289264297113112
701,647
8,083
classrooms
372291
2,551614
72.682.395.577.382.2
22.316.7
5.1
3.117.810.3
1.11.44.97.5
5861
737228
2,303 2,448 34 1 0 17 16341 1 0 0 2 321 0 0 0 0 0
593 2 0 0 4 3652 0 0 0 0 7
69 706 1,962 1,891 1,279 8 71 2 46 154 112 0 0 01 0 9 56 77 1 0 0
10 40 466 689 578 3 0 30 0 13 79 199 3 0 0
12 40 1,118 839 373 0 2 0
4067206
631396
249
10981
39345
1868 0 1442 954 0 604 184 19 60000
1040
0010
0000
184
19226
33
573
1021
0000
Terminalgrade Passed
VIII boysV girlsV boys
VIII girls
13 with >60%
35.18331316144
1794294
0.50.0
33.50.4
26.52.80.0
23.90.0
495251Hindi Urdu English Others Sanskrit
97385991
7473715149
811192
000
00
48200
620000
00008
% Schools recvd.
66.14.34.8
51.03.4
63.04.39.5
47.210.2
1478617
37385239
111707
583745
15766575
29608135
1699211
274929
3.16.76.92.85.0
1.42.12.72.6
3.42.82.8
2.82.2
59.1
59.4
0.78
2005-062004-052003-04
UTTAR PRADESH
56.3
Upper PrimaryPrimary
Sex ratio Sex ratio 0-6
23 180
VIII23.8
Enrolment of children
5,127VIII 6,905 15,347 20,662 25,154Total Pr. 405,971 399,625 436,421 469,834 506,197
1 - 5 6 - 8
1,145 64979 215
0 0
6 138
%Teachers recvd.in-service training
Total schools* Rural schools* Total enrolment* Rural enrolment* Teachers*
8.0 23.3
100.0
29.1
82.3 86.1
17.6 20.7% SC enrolment% SC girls to SC enrolment% ST enrolment
45.0 36.9
43.4 8.5
55.6
42.7
45.8
30.7
Position of teachers by educational qualification (other than para teacher)
(Previous academic year)Incentives : Number of beneficiaries
% ST girls to ST enrolment
% Girls
Number of villages
% 0 - 6 population
% SC population % ST population
% Urban population
% Schools with blackboard
% Enrolment in single-teacher schools
% Enrolment in schools without building
Primary Upperprimary
OBC EnrolmentPrimary U. Primary
% OBCEnrolment% OBC girls toOBC Enrolment
Pupil-teacher ratio (PTR)Student-classroom ratio (SCR)% Schools with <= 50 students% Schools with PTR > 100% Female teachers
% Schools established since 1995
Regular teachers Para-teachers
% minorrepairs
% majorrepairs
# = not applicable na = not available * Some totals may not match due to no response in classificatory data items
4.4 94.24.5 93.3
10.2 87.111.6 85.837.9 59.411.5 86.3
2245
43.96062
8.216.633.936.3
30.73127
8.54.3
34.548.9
36.44229
24.38.0
22.053.2
29.75225
18.613.615.3
6.8
25.4 17.1 na 38.2 25.1
89084218.121.1
Category
PrivateGovt.PrivateGovtPrivateGovt.PrivateGovt.PrivateGovt.
Total population (in 000's)
Number of blocks/taluks
District
Decadal growth rate
Primary onlyPrimary with upper primaryPrimary with upper primary & sec/higher sec.Upper primary onlyUpper primary with sec./higher secondary
% Single classroom schools% Single teacher schools
P + UP P+sec/hs U.P. only UP+secP. only
No response in school category
Primary with upper primaryPrimary with U.P. & sec/higherUpper primary onlyUpper primary with sec./higher sec
Primary only
Primary onlyPrimary with upper primaryPrimary with Upper primary & sec/higherUpper primary only
Para-teachers
School category
Upper primary with sec./higher secondary
Primary onlyPrimary with upper prim.
P. onlyP + UPP+sec/hsU.P. onlyUP+sec
NER(U.Prim)GER(U.Prim)NER (Primary)GER (Primary)
Transition ratePrim. to U. Prim
SC/ST Enrolment
Indicators
Classrooms/Other rooms
Prim.with U.P.&Sec/H.SUpper Primary onlyU. Primary with Sec./H.S.
Basic Data, 2001
Data reported from
Performance indicators
72.9 28.370.9 26.276.5 25.478.7 28.3

520
Elementary Education in India - Where do we stand ?
0.2820.288
28.6 27.1
Key data: Elementary Education
2913
BULANDSHAHR
(Previous academic year)
(Previous year)
Gender and caste distribution of teachers*
No. of schools by type of building*
BoysWith disability
Flow rates
Primary Level
Enrolment*
Number of schools
Grade
GER / NER
School category
Primary Upper primaryBoys Boys GirlsGirls
IncentiveType
School categoryMultiple
TypeKuccha
PartiallyPucca
PuccaTotal % good condition
Otherrooms
TentNo
Building
Classrooms
Belowsecondary
Highersecondary
Postgraduate
M. Phil.GraduateSecondarySchool category OthersNo
response
ST teachers
Total Male Female No res Male Female No res Male Female Male FemaleSC teachers
Text booksUniformAttendanceStationery
% Passed
Avg. No. of Tchs.
%
Female literacyOverall literacy
dev. grant grantSchool T L M
Male Female
IVV
IIIIII
Grade R.R. D.O.R. P.R.
VIIVI
# #
I - V
Enrolment by medium of instructions
Examination results
Retention rate
GPI
Primary cycle U. primary cycleState
DISTRICT ELEMENTARY EDUCATION REPORT CARD : 2005-06
GirlsGrade
IIIIIIIVVVI
VIII
AllGirls
Total
VII
% TotalGrossness
School category
121
3483
86 76 1
9613
3303
26 0 0
1,562 53860 1,420
5 6069 27,99213 347
0 0
1,471 335 241,449 55,97419,308 596 13,394
1,126 60 98214,939 26,773 12,155
0 0 04,067 347 4,067
251,263 85,657 4,82357
2,755628
P + UP P+sec/hs U.P. only UP+sec
School categoryP. only
1.6 0.0 0.0 0.9 12.53.8
Number of Clusters 26911323
% Schools with SCR > 600.0 0.0 18.2 0.0
28.8 10.2 0.0 2.9 25.0% Schools with pre-primary sections 4.0 4.1 0.0 1.6 12.5% Schools with common toilets 67.9 88.8 85.7 73.9 87.5
% Schools with girls toilets 61.0 87.8 100.0 64.6 75.0% Schools with drinking water facility 99.7 99.0 85.7 97.7 87.5
% Enrolment in Govt. schools 74.6 6.9 5.1 65.2 7.998.7 91.8 100.0 95.9 93.8
% No female teacher schools (tch>=2) 38.3 32.7 57.1 51.1 75.02.2 0.0 0.0 9.6 0.0
0.3 0.0 0.0 0.7 0.0%Enrolment in schools without blackboard 0.9 9.2 0.0 2.3 0.0
2001-02 2002-03 2003-04 2004-05 2005-06IIIIIIIVV
VIVII
Total U.P
89,92978,31668,47360,31352,86222,379
18,506
86,01568,11361,11849,89342,778
13,43910,609
85,34573,78959,06546,31440,853
7,1695,895
89,81464,89951,60640,47037,811
6,3975,142
80,55357,95946,61338,09036,264
5,2934,198
56,28633,03317,96915,81112,868
67.2
7.3
66.3
13.1
88.0
23.1
62.6
0.014.3
42,18737,20632,63129,06524,92210,046
8,0906,641
190,788
280280309357291102
9890
1,807
173196192206168
785442
1,109
7,617
classrooms
69057
1,962175
98.199.4
100.098.7
100.0
1.40.6
0.4
0.01.10.0
0.00.00.20.0
1279
41644
1,053 2,064 1 0 0 0 3598 0 0 0 0 0
7 0 0 0 0 0435 0 0 0 0 9
16 0 0 0 0 0
393 999 1,495 1,929 1,338 3 1014 26 125 245 191 1 0 61
3 0 4 19 6 0 0 337 42 317 467 417 2 1 106
4 4 8 28 50 0 0 7
49 49 307 296 154 0 1 0
4436426
241069
99
2258
3162
2159 37 596 348 2 713 514 93 3612
340
150
154
7120
0001
432
1649
571
800
60
120
11010
Terminalgrade Passed
VIII boysV girlsV boys
VIII girls
465 with >60%
26.27578685
361406
106
2.38.3
30.41.0
16.34.30.0
27.00.0
321289Hindi Others
15391339
395561448
102394778
84731852966
% Schools recvd.
42.310.2
0.027.512.5
53.76.10.0
26.40.0
9442937
147526
71040
140
11383927
12548
140510
150
3.67.05.13.26.6
3.73.22.72.0
1.81.81.4
1.82.9
64.7
51.8
0.90
2005-062004-052003-04
UTTAR PRADESH
25.0
Upper PrimaryPrimary
Sex ratio Sex ratio 0-6
21 160
VIII42.9
Enrolment of children
3,377VIII 4,272 4,905 8,985 15,401Total Pr. 259,479 284,600 305,366 307,917 349,893
1 - 5 6 - 8
884 5228 980 0
3 33
%Teachers recvd.in-service training
Total schools* Rural schools* Total enrolment* Rural enrolment* Teachers*
17.3 28.1
72.7
16.6
48.5 49.9
4.5 8.4% SC enrolment% SC girls to SC enrolment% ST enrolment
47.0 44.4
42.3 45.3
39.3
47.8
41.1
43.7
Position of teachers by educational qualification (other than para teacher)
(Previous academic year)Incentives : Number of beneficiaries
% ST girls to ST enrolment
% Girls
Number of villages
% 0 - 6 population
% SC population % ST population
% Urban population
% Schools with blackboard
% Enrolment in single-teacher schools
% Enrolment in schools without building
Primary Upperprimary
OBC EnrolmentPrimary U. Primary
% OBCEnrolment% OBC girls toOBC Enrolment
Pupil-teacher ratio (PTR)Student-classroom ratio (SCR)% Schools with <= 50 students% Schools with PTR > 100% Female teachers
% Schools established since 1995
Regular teachers Para-teachers
% minorrepairs
% majorrepairs
# = not applicable na = not available * Some totals may not match due to no response in classificatory data items
7.8 88.5
0.3 97.0
46.4 51.87.3 89.8
2133
47.64444
7.26.2
33.132.5
44.93030
5.12.0
33.942.9
44.33122
29.13.4
22.663.5
31.24225
12.512.5
1.925.0
22.2 20.2 na 59.4 42.5
86787923.118.6
Category
PrivateGovt.PrivateGovtPrivateGovt.PrivateGovt.PrivateGovt.
Total population (in 000's)
Number of blocks/taluks
District
Decadal growth rate
Primary onlyPrimary with upper primaryPrimary with upper primary & sec/higher sec.Upper primary onlyUpper primary with sec./higher secondary
% Single classroom schools% Single teacher schools
P + UP P+sec/hs U.P. only UP+secP. only
No response in school category
Primary with upper primaryPrimary with U.P. & sec/higherUpper primary onlyUpper primary with sec./higher sec
Primary only
Primary onlyPrimary with upper primaryPrimary with Upper primary & sec/higherUpper primary only
Para-teachers
School category
Upper primary with sec./higher secondary
Primary onlyPrimary with upper prim.
P. onlyP + UPP+sec/hsU.P. onlyUP+sec
NER(U.Prim)GER(U.Prim)NER (Primary)GER (Primary)
Transition ratePrim. to U. Prim
SC/ST Enrolment
Indicators
Classrooms/Other rooms
Prim.with U.P.&Sec/H.SUpper Primary onlyU. Primary with Sec./H.S.
Basic Data, 2001
Data reported from
Performance indicators
98.7 44.298.6 43.296.4 38.897.7 42.5
Utt
ar P
rad
esh
521
Elementary Education: Report Card - CHANDAULI
Utt
ar P
rad
esh
0.3840.206
33.0 30.3
Key data: Elementary Education
1643
CHANDAULI
(Previous academic year)
(Previous year)
Gender and caste distribution of teachers*
No. of schools by type of building*
BoysWith disability

522
Elementary Education in India - Where do we stand ?
0.2190.124
30.3 30.5
Key data: Elementary Education
766
CHITRAKOOT
(Previous academic year)
(Previous year)
Gender and caste distribution of teachers*
No. of schools by type of building*
BoysWith disability
Flow rates
Primary Level
Enrolment*
Number of schools
Grade
GER / NER
School category
Primary Upper primaryBoys Boys GirlsGirls
IncentiveType
School categoryMultiple
TypeKuccha
PartiallyPucca
PuccaTotal % good condition
Otherrooms
TentNo
Building
Classrooms
Belowsecondary
Highersecondary
Postgraduate
M. Phil.GraduateSecondarySchool category OthersNo
response
ST teachers
Total Male Female No res Male Female No res Male Female Male FemaleSC teachers
Text booksUniformAttendanceStationery
% Passed
Avg. No. of Tchs.
%
Female literacyOverall literacy
dev. grant grantSchool T L M
Male Female
IVV
IIIIII
Grade R.R. D.O.R. P.R.
VIIVI
# #
I - V
Enrolment by medium of instructions
Examination results
Retention rate
GPI
Primary cycle U. primary cycleState
DISTRICT ELEMENTARY EDUCATION REPORT CARD : 2005-06
GirlsGrade
IIIIIIIVVVI
VIII
AllGirls
Total
VII
% TotalGrossness
School category
01
3024
25 01 1
103
2954
0 0 0
816 349 00 7
10 30,4933 5630 0
800 23 132,223 3,6576,898 0 2,045
242 7 01,664 30,065 1,664
0 0 0385 563 385
134,964 5,669 2,0980
161175
P + UP P+sec/hs U.P. only UP+sec
School categoryP. only
0.2 0.0 0.0 0.0 0.013.6
Number of Clusters 1196345
% Schools with SCR > 600.0 0.0 22.1 0.0
27.2 8.0 0.0 4.2 0.0% Schools with pre-primary sections 10.5 20.0 50.0 1.3 14.3% Schools with common toilets 95.4 96.0 50.0 94.9 100.0
% Schools with girls toilets 85.8 92.0 50.0 90.1 85.7% Schools with drinking water facility 89.1 100.0 100.0 82.1 100.0
% Enrolment in Govt. schools 96.0 0.0 2.8 94.8 59.499.8 96.0 100.0 100.0 85.7
% No female teacher schools (tch>=2) 36.5 32.0 50.0 55.4 71.410.0 0.0 0.0 18.2 0.0
0.0 0.0 0.0 0.0 0.0%Enrolment in schools without blackboard 0.2 3.7 0.0 0.0 12.0
2001-02 2002-03 2003-04 2004-05 2005-06IIIIIIIVV
VIVII
Total U.P
30,52130,87231,45529,55122,83815,008
11,452
29,25631,00931,45124,53521,082
11,3278,736
31,16532,59226,45623,77417,379
9,4318,031
30,44323,65322,53416,41512,257
6,9215,485
35,64827,78424,01816,631
107.3
36.1
108.4
40.4
138.8
55.6
29.3
50.00.0
14,97415,10415,50614,66410,701
6,8934,9913,940
86,773
79108135132118
727063
777
458378
10573364744
511
2,916
classrooms
18511
1,160101
74.863.2
100.074.171.3
21.535.1
3.7
0.022.628.7
1.60.03.30.0
472
44922
896 848 0 0 0 1 125 0 0 0 0 0
2 0 0 0 0 0312 0 0 0 0 0
7 0 0 0 0 0
32 155 344 295 144 1 10 0 10 17 8 0 0 1400 0 0 1 4 0 0 8
22 27 208 220 149 0 2 1930 0 0 0 0 0 0 49
9 18 266 305 128 0 0 0
1046134
12694
44
411
1275
182 0 665 366 0 306 47 21 70000
0180
0030
0000
82
922
60
142
90
155
4040
Terminalgrade Passed
VIII boysV girlsV boys
VIII girls
256 with >60%
1.12259175
14832
49
0.00.00.30.0
1.30.00.00.00.0
136946Hindi Others
6898249
31695948
1090000
% Schools recvd.
84.70.0
50.075.614.3
81.10.00.0
71.80.0
4775248
5911434
51540
103443
60854150
5037621
92450
73415
2.77.07.02.77.0
0.00.0
71.2
0.96
2005-062004-052003-04
UTTAR PRADESH
7.1
Upper PrimaryPrimary
Sex ratio Sex ratio 0-6
6 49
VIII50.0
Enrolment of children
VIII 4,225 6,556 7,721 9,188Total Pr. 105,302 131,366 137,333 145,237
1 - 5 6 - 8
778 5432 17
0 0
6 8
%Teachers recvd.in-service training
Total schools* Rural schools* Total enrolment* Rural enrolment* Teachers*
15.8 24.8
100.0
41.8
94.9
31.7 30.3% SC enrolment% SC girls to SC enrolment% ST enrolment
47.9 42.9
51.1 33.3
50.6
48.7
42.0
41.3
Position of teachers by educational qualification (other than para teacher)
(Previous academic year)Incentives : Number of beneficiaries
% ST girls to ST enrolment
% Girls
Number of villages
% 0 - 6 population
% SC population % ST population
% Urban population
% Schools with blackboard
% Enrolment in single-teacher schools
% Enrolment in schools without building
Primary Upperprimary
OBC EnrolmentPrimary U. Primary
% OBCEnrolment% OBC girls toOBC Enrolment
Pupil-teacher ratio (PTR)Student-classroom ratio (SCR)% Schools with <= 50 students% Schools with PTR > 100% Female teachers
% Schools established since 1995
Regular teachers Para-teachers
% minorrepairs
% majorrepairs
# = not applicable na = not available * Some totals may not match due to no response in classificatory data items
6.0 94.06.9 93.1
28.8 71.25.5 94.5
2318
49.16248
4.217.924.338.2
41.93937
0.04.0
23.448.0
44.83928
16.79.0
15.660.3
40.919
90.00.0
10.20.0
34.3 26.3 na 65.0 50.3
92887310.021.1
Category
PrivateGovt.PrivateGovtPrivateGovt.PrivateGovt.PrivateGovt.
Total population (in 000's)
Number of blocks/taluks
District
Decadal growth rate
Primary onlyPrimary with upper primaryPrimary with upper primary & sec/higher sec.Upper primary onlyUpper primary with sec./higher secondary
% Single classroom schools% Single teacher schools
P + UP P+sec/hs U.P. only UP+secP. only
No response in school category
Primary with upper primaryPrimary with U.P. & sec/higherUpper primary onlyUpper primary with sec./higher sec
Primary only
Primary onlyPrimary with upper primaryPrimary with Upper primary & sec/higherUpper primary only
Para-teachers
School category
Upper primary with sec./higher secondary
Primary onlyPrimary with upper prim.
P. onlyP + UPP+sec/hsU.P. onlyUP+sec
NER(U.Prim)GER(U.Prim)NER (Primary)GER (Primary)
Transition ratePrim. to U. Prim
SC/ST Enrolment
Indicators
Classrooms/Other rooms
Prim.with U.P.&Sec/H.SUpper Primary onlyU. Primary with Sec./H.S.
Basic Data, 2001
Data reported from
Performance indicators
98.6 30.398.2 25.897.6 48.697.4 48.7
Utt
ar P
rad
esh
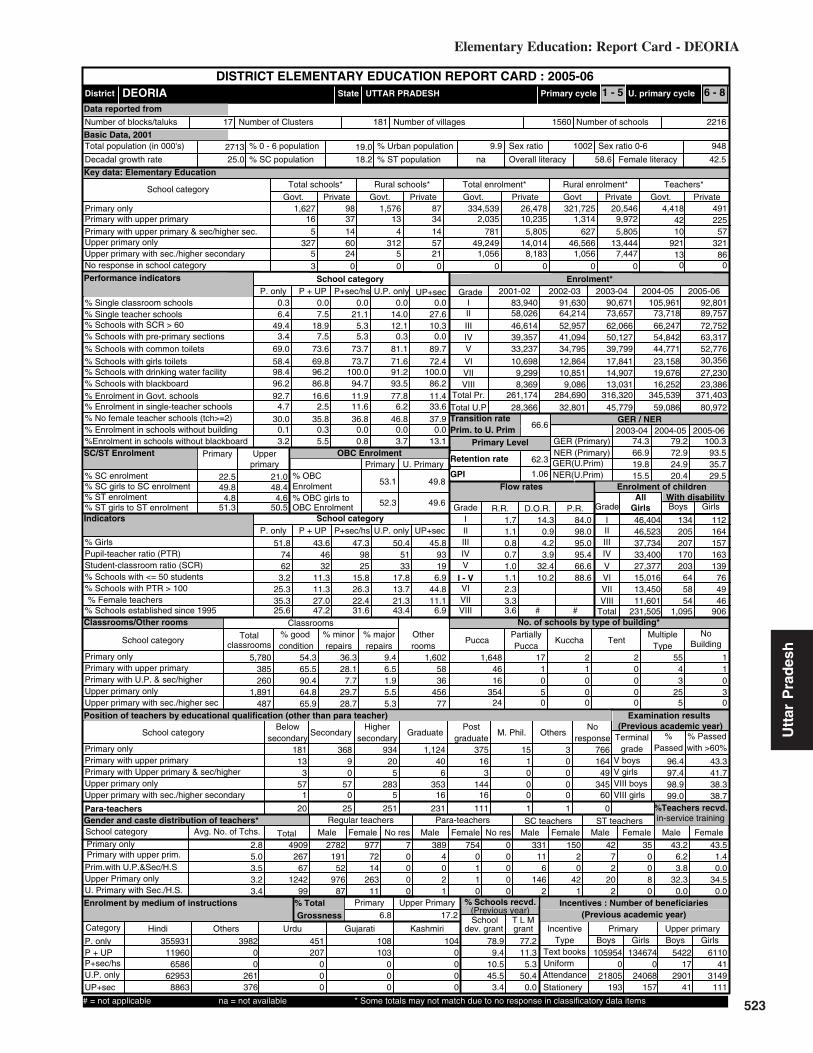
523
Elementary Education: Report Card - DEORIA
Utt
ar P
rad
esh
22.5 21.0
Key data: Elementary Education
2713
DEORIA
(Previous academic year)
(Previous year)
Gender and caste distribution of teachers*
No. of schools by type of building*
BoysWith disability
Flow rates
Primary Level
Enrolment*
Number of schools
Grade
GER / NER
School category
Primary Upper primaryBoys Boys GirlsGirls
IncentiveType
School categoryMultiple
TypeKuccha
PartiallyPucca
PuccaTotal % good condition
Otherrooms
TentNo
Building
Classrooms
Belowsecondary
Highersecondary
Postgraduate
M. Phil.GraduateSecondarySchool category OthersNo
response
ST teachers
Total Male Female No res Male Female No res Male Female Male FemaleSC teachers
Text booksUniformAttendanceStationery
% Passed
Avg. No. of Tchs.
%
Female literacyOverall literacy
dev. grant grantSchool T L M
Male Female
IVV
IIIIII
Grade R.R. D.O.R. P.R.
VIIVI
# #
I - V
Enrolment by medium of instructions
Examination results
Retention rate
GPI
Primary cycle U. primary cycleState
DISTRICT ELEMENTARY EDUCATION REPORT CARD : 2005-06
GirlsGrade
IIIIIIIVVVI
VIII
AllGirls
Total
VII
% TotalGrossness
School category
165
3275
37 1314 46024
3125
3 0 0
1,627 9834 2,03514 78157 49,24921 1,056
0 0
1,576 87 321,725 20,54610,235 1,314 9,972
5,805 627 5,80514,014 46,566 13,444
0 0 08,183 1,056 7,447
334,539 26,478 4,41842
491225
P + UP P+sec/hs U.P. only UP+sec
School categoryP. only
0.3 0.0 0.0 0.0 0.06.4
Number of Clusters 22161560
% Schools with SCR > 607.5 21.1 14.0 27.6
49.4 18.9 5.3 12.1 10.3% Schools with pre-primary sections 3.4 7.5 5.3 0.3 0.0% Schools with common toilets 69.0 73.6 73.7 81.1 89.7
% Schools with girls toilets 58.4 69.8 73.7 71.6 72.4% Schools with drinking water facility 98.4 96.2 100.0 91.2 100.0
% Enrolment in Govt. schools 92.7 16.6 11.9 77.8 11.496.2 86.8 94.7 93.5 86.2
% No female teacher schools (tch>=2) 30.0 35.8 36.8 46.8 37.94.7 2.5 11.6 6.2 33.6
0.1 0.3 0.0 0.0 0.0%Enrolment in schools without blackboard 3.2 5.5 0.8 3.7 13.1
2001-02 2002-03 2003-04 2004-05 2005-06IIIIIIIVV
VIVII
Total U.P
92,80189,75772,75263,31752,77630,356
27,230
105,96173,71866,24754,84244,771
23,15819,676
90,67173,65762,06650,12739,799
17,84114,907
91,63064,21452,95741,09434,795
12,86410,851
83,94058,02646,61439,35733,237
10,6989,299
80,97259,08645,77932,80128,366
74.3
19.8
79.2
24.9
100.3
35.7
47.3
15.826.3
46,40446,52337,73433,40027,37715,01613,45011,601
231,505
134205207170203
645854
1,095
112164157163139
764946
906
5,780
classrooms
385260
1,891487
54.365.590.464.865.9
36.328.1
9.4
7.729.728.7
6.51.95.55.3
5836
45677
1,602 1,648 17 2 2 55 146 1 1 0 4 116 0 0 0 3 0
354 5 0 0 25 324 0 0 0 5 0
181 368 934 1,124 375 15 313 9 20 40 16 1 0 164
3 0 5 6 3 0 0 4957 57 283 353 144 0 0 345
1 0 5 16 16 0 0 60
20 25 251 231 111 1 1 0
2782191
52976
87
7214
26311
977 7 389 754 0 331 150 42 350000
4021
0110
0000
116
1462
20
421
72
202
0080
Terminalgrade Passed
VIII boysV girlsV boys
VIII girls
766 with >60%
43.24909267
671242
99
6.23.8
32.30.0
43.51.40.0
34.50.0
355931Hindi Others Urdu Gujarati Kashmiri
119606586
629538863
398200
261376
451207
000
108103
000
1040000
% Schools recvd.
78.99.4
10.545.5
3.4
77.211.3
5.350.4
0.0
1059540
21805193
542217
290141
1346740
24068157
611041
3149111
2.85.03.53.23.4
1.71.10.80.7
2.33.33.6
1.01.1
62.3
66.6
1.06
2005-062004-052003-04
UTTAR PRADESH
22.4
Upper PrimaryPrimary
Sex ratio Sex ratio 0-6
17 181
VIII31.6
Enrolment of children
8,369VIII 9,086 13,031 16,252 23,386Total Pr. 261,174 284,690 316,320 345,539 371,403
1 - 5 6 - 8
921 32113 86
0 0
10 57
%Teachers recvd.in-service training
Total schools* Rural schools* Total enrolment* Rural enrolment* Teachers*
6.8 17.2
93.5
29.5
66.9 72.9
15.5 20.4% SC enrolment% SC girls to SC enrolment% ST enrolment
49.8 48.44.8
51.3 50.5
53.1
52.3
49.8
49.6
Position of teachers by educational qualification (other than para teacher)
(Previous academic year)Incentives : Number of beneficiaries
% ST girls to ST enrolment
% Girls
Number of villages
% 0 - 6 population
% SC population % ST population
% Urban population
% Schools with blackboard
% Enrolment in single-teacher schools
% Enrolment in schools without building
Primary Upperprimary
OBC EnrolmentPrimary U. Primary
% OBCEnrolment% OBC girls toOBC Enrolment
Pupil-teacher ratio (PTR)Student-classroom ratio (SCR)% Schools with <= 50 students% Schools with PTR > 100% Female teachers
% Schools established since 1995
Regular teachers Para-teachers
% minorrepairs
% majorrepairs
# = not applicable na = not available * Some totals may not match due to no response in classificatory data items
14.3 84.00.9 98.04.2 95.03.9 95.4
32.4 66.610.2 88.6
2598
51.87462
3.225.335.325.6
43.64632
11.311.327.047.2
50.45133
17.813.721.343.4
45.89319
6.944.811.1
6.9
25.0 18.2 na 58.6 42.5
94810029.919.0
Category
PrivateGovt.PrivateGovtPrivateGovt.PrivateGovt.PrivateGovt.
Total population (in 000's)
Number of blocks/taluks
District
Decadal growth rate
Primary onlyPrimary with upper primaryPrimary with upper primary & sec/higher sec.Upper primary onlyUpper primary with sec./higher secondary
% Single classroom schools% Single teacher schools
P + UP P+sec/hs U.P. only UP+secP. only
No response in school category
Primary with upper primaryPrimary with U.P. & sec/higherUpper primary onlyUpper primary with sec./higher sec
Primary only
Primary onlyPrimary with upper primaryPrimary with Upper primary & sec/higherUpper primary only
Para-teachers
School category
Upper primary with sec./higher secondary
Primary onlyPrimary with upper prim.
P. onlyP + UPP+sec/hsU.P. onlyUP+sec
NER(U.Prim)GER(U.Prim)NER (Primary)GER (Primary)
Transition ratePrim. to U. Prim
4.6
SC/ST Enrolment
Indicators
Classrooms/Other rooms
Prim.with U.P.&Sec/H.SUpper Primary onlyU. Primary with Sec./H.S.
Basic Data, 2001
Data reported from
Performance indicators
96.4 43.397.4 41.798.9 38.399.0 38.7

524
Elementary Education in India - Where do we stand ?
22.5 21.0
Key data: Elementary Education
2713
DEORIA
(Previous academic year)
(Previous year)
Gender and caste distribution of teachers*
No. of schools by type of building*
BoysWith disability
Flow rates
Primary Level
Enrolment*
Number of schools
Grade
GER / NER
School category
Primary Upper primaryBoys Boys GirlsGirls
IncentiveType
School categoryMultiple
TypeKuccha
PartiallyPucca
PuccaTotal % good condition
Otherrooms
TentNo
Building
Classrooms
Belowsecondary
Highersecondary
Postgraduate
M. Phil.GraduateSecondarySchool category OthersNo
response
ST teachers
Total Male Female No res Male Female No res Male Female Male FemaleSC teachers
Text booksUniformAttendanceStationery
% Passed
Avg. No. of Tchs.
%
Female literacyOverall literacy
dev. grant grantSchool T L M
Male Female
IVV
IIIIII
Grade R.R. D.O.R. P.R.
VIIVI
# #
I - V
Enrolment by medium of instructions
Examination results
Retention rate
GPI
Primary cycle U. primary cycleState
DISTRICT ELEMENTARY EDUCATION REPORT CARD : 2005-06
GirlsGrade
IIIIIIIVVVI
VIII
AllGirls
Total
VII
% TotalGrossness
School category
165
3275
37 1314 46024
3125
3 0 0
1,627 9834 2,03514 78157 49,24921 1,056
0 0
1,576 87 321,725 20,54610,235 1,314 9,972
5,805 627 5,80514,014 46,566 13,444
0 0 08,183 1,056 7,447
334,539 26,478 4,41842
491225
P + UP P+sec/hs U.P. only UP+sec
School categoryP. only
0.3 0.0 0.0 0.0 0.06.4
Number of Clusters 22161560
% Schools with SCR > 607.5 21.1 14.0 27.6
49.4 18.9 5.3 12.1 10.3% Schools with pre-primary sections 3.4 7.5 5.3 0.3 0.0% Schools with common toilets 69.0 73.6 73.7 81.1 89.7
% Schools with girls toilets 58.4 69.8 73.7 71.6 72.4% Schools with drinking water facility 98.4 96.2 100.0 91.2 100.0
% Enrolment in Govt. schools 92.7 16.6 11.9 77.8 11.496.2 86.8 94.7 93.5 86.2
% No female teacher schools (tch>=2) 30.0 35.8 36.8 46.8 37.94.7 2.5 11.6 6.2 33.6
0.1 0.3 0.0 0.0 0.0%Enrolment in schools without blackboard 3.2 5.5 0.8 3.7 13.1
2001-02 2002-03 2003-04 2004-05 2005-06IIIIIIIVV
VIVII
Total U.P
92,80189,75772,75263,31752,77630,356
27,230
105,96173,71866,24754,84244,771
23,15819,676
90,67173,65762,06650,12739,799
17,84114,907
91,63064,21452,95741,09434,795
12,86410,851
83,94058,02646,61439,35733,237
10,6989,299
80,97259,08645,77932,80128,366
74.3
19.8
79.2
24.9
100.3
35.7
47.3
15.826.3
46,40446,52337,73433,40027,37715,01613,45011,601
231,505
134205207170203
645854
1,095
112164157163139
764946
906
5,780
classrooms
385260
1,891487
54.365.590.464.865.9
36.328.1
9.4
7.729.728.7
6.51.95.55.3
5836
45677
1,602 1,648 17 2 2 55 146 1 1 0 4 116 0 0 0 3 0
354 5 0 0 25 324 0 0 0 5 0
181 368 934 1,124 375 15 313 9 20 40 16 1 0 164
3 0 5 6 3 0 0 4957 57 283 353 144 0 0 345
1 0 5 16 16 0 0 60
20 25 251 231 111 1 1 0
2782191
52976
87
7214
26311
977 7 389 754 0 331 150 42 350000
4021
0110
0000
116
1462
20
421
72
202
0080
Terminalgrade Passed
VIII boysV girlsV boys
VIII girls
766 with >60%
43.24909267
671242
99
6.23.8
32.30.0
43.51.40.0
34.50.0
355931Hindi Others Urdu Gujarati Kashmiri
119606586
629538863
398200
261376
451207
000
108103
000
1040000
% Schools recvd.
78.99.4
10.545.5
3.4
77.211.3
5.350.4
0.0
1059540
21805193
542217
290141
1346740
24068157
611041
3149111
2.85.03.53.23.4
1.71.10.80.7
2.33.33.6
1.01.1
62.3
66.6
1.06
2005-062004-052003-04
UTTAR PRADESH
22.4
Upper PrimaryPrimary
Sex ratio Sex ratio 0-6
17 181
VIII31.6
Enrolment of children
8,369VIII 9,086 13,031 16,252 23,386Total Pr. 261,174 284,690 316,320 345,539 371,403
1 - 5 6 - 8
921 32113 86
0 0
10 57
%Teachers recvd.in-service training
Total schools* Rural schools* Total enrolment* Rural enrolment* Teachers*
6.8 17.2
93.5
29.5
66.9 72.9
15.5 20.4% SC enrolment% SC girls to SC enrolment% ST enrolment
49.8 48.44.8
51.3 50.5
53.1
52.3
49.8
49.6
Position of teachers by educational qualification (other than para teacher)
(Previous academic year)Incentives : Number of beneficiaries
% ST girls to ST enrolment
% Girls
Number of villages
% 0 - 6 population
% SC population % ST population
% Urban population
% Schools with blackboard
% Enrolment in single-teacher schools
% Enrolment in schools without building
Primary Upperprimary
OBC EnrolmentPrimary U. Primary
% OBCEnrolment% OBC girls toOBC Enrolment
Pupil-teacher ratio (PTR)Student-classroom ratio (SCR)% Schools with <= 50 students% Schools with PTR > 100% Female teachers
% Schools established since 1995
Regular teachers Para-teachers
% minorrepairs
% majorrepairs
# = not applicable na = not available * Some totals may not match due to no response in classificatory data items
14.3 84.00.9 98.04.2 95.03.9 95.4
32.4 66.610.2 88.6
2598
51.87462
3.225.335.325.6
43.64632
11.311.327.047.2
50.45133
17.813.721.343.4
45.89319
6.944.811.1
6.9
25.0 18.2 na 58.6 42.5
94810029.919.0
Category
PrivateGovt.PrivateGovtPrivateGovt.PrivateGovt.PrivateGovt.
Total population (in 000's)
Number of blocks/taluks
District
Decadal growth rate
Primary onlyPrimary with upper primaryPrimary with upper primary & sec/higher sec.Upper primary onlyUpper primary with sec./higher secondary
% Single classroom schools% Single teacher schools
P + UP P+sec/hs U.P. only UP+secP. only
No response in school category
Primary with upper primaryPrimary with U.P. & sec/higherUpper primary onlyUpper primary with sec./higher sec
Primary only
Primary onlyPrimary with upper primaryPrimary with Upper primary & sec/higherUpper primary only
Para-teachers
School category
Upper primary with sec./higher secondary
Primary onlyPrimary with upper prim.
P. onlyP + UPP+sec/hsU.P. onlyUP+sec
NER(U.Prim)GER(U.Prim)NER (Primary)GER (Primary)
Transition ratePrim. to U. Prim
4.6
SC/ST Enrolment
Indicators
Classrooms/Other rooms
Prim.with U.P.&Sec/H.SUpper Primary onlyU. Primary with Sec./H.S.
Basic Data, 2001
Data reported from
Performance indicators
96.4 43.397.4 41.798.9 38.399.0 38.7
Utt
ar P
rad
esh

525
Elementary Education: Report Card - ETAWAH
Utt
ar P
rad
esh
0.2820.012
29.9 31.8
Key data: Elementary Education
1339
ETAWAH
(Previous academic year)
(Previous year)
Gender and caste distribution of teachers*
No. of schools by type of building*
BoysWith disability
Flow rates
Primary Level
Enrolment*
Number of schools
Grade
GER / NER
School category
Primary Upper primaryBoys Boys GirlsGirls
IncentiveType
School categoryMultiple
TypeKuccha
PartiallyPucca
PuccaTotal % good condition
Otherrooms
TentNo
Building
Classrooms
Belowsecondary
Highersecondary
Postgraduate
M. Phil.GraduateSecondarySchool category OthersNo
response
ST teachers
Total Male Female No res Male Female No res Male Female Male FemaleSC teachers
Text booksUniformAttendanceStationery
% Passed
Avg. No. of Tchs.
%
Female literacyOverall literacy
dev. grant grantSchool T L M
Male Female
IVV
IIIIII
Grade R.R. D.O.R. P.R.
VIIVI
# #
I - V
Enrolment by medium of instructions
Examination results
Retention rate
GPI
Primary cycle U. primary cycleState
DISTRICT ELEMENTARY EDUCATION REPORT CARD : 2005-06
GirlsGrade
IIIIIIIVVVI
VIII
AllGirls
Total
VII
% TotalGrossness
School category
83
4073
18 79 3
16142
3883
1 0 0
1,036 32012 1,453
7 325114 37,563
40 7740 0
996 240 137,777 46,7283,948 1,193 3,1091,831 325 1,409
24,377 35,680 18,524
0 0 09,166 774 8,930
143,705 63,624 3,11125
1,31184
P + UP P+sec/hs U.P. only UP+sec
School categoryP. only
0.4 0.0 0.0 0.0 0.01.2
Number of Clusters 20081118
% Schools with SCR > 607.7 16.7 15.8 0.0
19.9 26.9 16.7 3.0 13.3% Schools with pre-primary sections 0.3 0.0 0.0 0.2 0.0% Schools with common toilets 98.9 96.2 83.3 94.5 97.8
% Schools with girls toilets 97.2 96.2 75.0 89.6 93.3% Schools with drinking water facility 99.6 100.0 100.0 97.0 100.0
% Enrolment in Govt. schools 69.3 26.9 15.1 60.6 7.8100.0 100.0 100.0 100.0 100.0
% No female teacher schools (tch>=2) 25.3 30.8 25.0 46.1 68.90.6 1.4 5.8 7.5 0.0
0.1 0.0 0.0 0.1 0.0%Enrolment in schools without blackboard 0.0 0.0 0.0 0.0 0.0
2001-02 2002-03 2003-04 2004-05 2005-06IIIIIIIVV
VIVII
Total U.P
44,14246,57842,37241,14436,20027,905
24,999
48,08741,68242,05635,63732,918
24,57423,206
41,95343,21037,87033,01829,281
22,76020,399
37,75831,79828,73223,07720,483
13,24311,047
76,33068,92161,64534,219
88.8
54.3
94.0
59.5
115.1
68.2
47.5
0.00.0
20,55922,29720,69120,07317,35813,55012,16911,366
138,063
89138133149131
604162
803
506188
10199364339
517
4,768
classrooms
11460
2,382426
78.074.680.080.285.0
19.225.4
2.9
18.317.812.9
0.01.72.02.1
3613
670106
1,497 1,349 1 0 0 3 325 0 0 0 1 012 0 0 0 0 0
565 2 0 0 0 145 0 0 0 0 0
23 289 748 1,134 700 2 10 3 18 56 27 0 0 40 4 6 12 18 0 0 84 34 602 734 562 2 0 1192 0 10 56 94 0 0 45
0 10 257 299 213 0 2 0
20707632
1538177
3216
51930
1040 0 593 719 0 445 191 9 10000
0000
1000
0000
65
26122
00
680
0090
0000
Terminalgrade Passed
VIII boysV girlsV boys
VIII girls
213 with >60%
0.34422109
482057
207
0.00.01.10.0
0.20.00.00.00.0
206170Hindi Others Gujarati
54012156
613759940
6200
1810
1720000
% Schools recvd.
75.223.125.069.5
4.4
75.423.125.070.4
6.7
39804274
2560079
751761752846
5
65922204
2525774
1656353422196
6
3.34.24.03.64.6
2.52.52.41.8
1.00.80.8
1.22.1
84.1
0.92
2005-062004-052003-04
UTTAR PRADESH
33.3
Upper PrimaryPrimary
Sex ratio Sex ratio 0-6
9 81
VIII41.7
Enrolment of children
VIII 9,929 18,486 21,141 23,426Total Pr. 141,848 185,332 200,380 210,436
1 - 5 6 - 8
1,351 70612 195
0 0
7 41
%Teachers recvd.in-service training
Total schools* Rural schools* Total enrolment* Rural enrolment* Teachers*
13.0 24.0
100.0
51.8
74.0 78.2
44.0 48.6% SC enrolment% SC girls to SC enrolment% ST enrolment
47.2 48.1
36.0 44.7
56.3
48.1
52.3
47.8
Position of teachers by educational qualification (other than para teacher)
(Previous academic year)Incentives : Number of beneficiaries
% ST girls to ST enrolment
% Girls
Number of villages
% 0 - 6 population
% SC population % ST population
% Urban population
% Schools with blackboard
% Enrolment in single-teacher schools
% Enrolment in schools without building
Primary Upperprimary
OBC EnrolmentPrimary U. Primary
% OBCEnrolment% OBC girls toOBC Enrolment
Pupil-teacher ratio (PTR)Student-classroom ratio (SCR)% Schools with <= 50 students% Schools with PTR > 100% Female teachers
% Schools established since 1995
Regular teachers Para-teachers
% minorrepairs
% majorrepairs
# = not applicable na = not available * Some totals may not match due to no response in classificatory data items
2.8 94.7
1.3 96.3
14.8 84.12.6 95.3
3645
48.04743
6.64.1
39.840.6
42.15047
15.47.7
30.350.0
49.53026
19.42.8
25.252.8
45.34823
0.04.4
14.58.9
21.6 23.4 na 69.6 57.4
89585823.017.7
Category
PrivateGovt.PrivateGovtPrivateGovt.PrivateGovt.PrivateGovt.
Total population (in 000's)
Number of blocks/taluks
District
Decadal growth rate
Primary onlyPrimary with upper primaryPrimary with upper primary & sec/higher sec.Upper primary onlyUpper primary with sec./higher secondary
% Single classroom schools% Single teacher schools
P + UP P+sec/hs U.P. only UP+secP. only
No response in school category
Primary with upper primaryPrimary with U.P. & sec/higherUpper primary onlyUpper primary with sec./higher sec
Primary only
Primary onlyPrimary with upper primaryPrimary with Upper primary & sec/higherUpper primary only
Para-teachers
School category
Upper primary with sec./higher secondary
Primary onlyPrimary with upper prim.
P. onlyP + UPP+sec/hsU.P. onlyUP+sec
NER(U.Prim)GER(U.Prim)NER (Primary)GER (Primary)
Transition ratePrim. to U. Prim
SC/ST Enrolment
Indicators
Classrooms/Other rooms
Prim.with U.P.&Sec/H.SUpper Primary onlyU. Primary with Sec./H.S.
Basic Data, 2001
Data reported from
Performance indicators
98.3 52.198.6 48.598.0 54.498.2 54.1

526
Elementary Education in India - Where do we stand ?
0.0050.000
28.7 27.3
Key data: Elementary Education
2089
FAIZABAD
(Previous academic year)
(Previous year)
Gender and caste distribution of teachers*
No. of schools by type of building*
BoysWith disability
Flow rates
Primary Level
Enrolment*
Number of schools
Grade
GER / NER
School category
Primary Upper primaryBoys Boys GirlsGirls
IncentiveType
School categoryMultiple
TypeKuccha
PartiallyPucca
PuccaTotal % good condition
Otherrooms
TentNo
Building
Classrooms
Belowsecondary
Highersecondary
Postgraduate
M. Phil.GraduateSecondarySchool category OthersNo
response
ST teachers
Total Male Female No res Male Female No res Male Female Male FemaleSC teachers
Text booksUniformAttendanceStationery
% Passed
Avg. No. of Tchs.
%
Female literacyOverall literacy
dev. grant grantSchool T L M
Male Female
IVV
IIIIII
Grade R.R. D.O.R. P.R.
VIIVI
# #
I - V
Enrolment by medium of instructions
Examination results
Retention rate
GPI
Primary cycle U. primary cycleState
DISTRICT ELEMENTARY EDUCATION REPORT CARD : 2005-06
GirlsGrade
IIIIIIIVVVI
VIII
AllGirls
Total
VII
% TotalGrossness
School category
30
2863
68 22 0
16416
2691
5 0 0
1,012 23047 1,425
1 0136 39,352
8 1,4160 0
953 190 177,584 41,38730,124 986 22,327
1,450 0 64234,345 37,649 29,517
0 0 04,868 141 2,359
185,738 51,248 4,12237
1,054470
P + UP P+sec/hs U.P. only UP+sec
School categoryP. only
0.1 0.0 0.0 0.0 0.01.3
Number of Clusters 1789879
% Schools with SCR > 600.0 0.0 26.2 0.0
45.1 19.7 50.0 12.2 5.3% Schools with pre-primary sections 27.3 0.0 0.0 0.0 0.0% Schools with common toilets 89.9 85.9 100.0 92.7 89.5
% Schools with girls toilets 69.6 73.2 100.0 77.1 68.4% Schools with drinking water facility 100.0 100.0 100.0 99.6 100.0
% Enrolment in Govt. schools 78.4 4.5 0.0 53.4 22.5100.0 100.0 100.0 100.0 100.0
% No female teacher schools (tch>=2) 10.9 32.4 50.0 39.8 57.90.6 0.0 0.0 10.2 0.0
0.1 0.0 0.0 0.2 0.0%Enrolment in schools without blackboard 0.0 0.0 0.0 0.0 0.0
2001-02 2002-03 2003-04 2004-05 2005-06IIIIIIIVV
VIVII
Total U.P
65,92055,37349,28845,43440,19234,459
31,168
79,30363,25858,97949,30044,199
35,44730,387
74,76563,45952,17044,28741,018
29,37525,857
73,13948,90442,23235,54831,437
18,12214,728
62,48545,32039,79232,50628,486
12,25710,768
93,75992,92677,85845,54231,993
84.3
43.8
88.1
51.0
89.8
53.7
74.8
0.050.0
32,24827,36024,50122,90619,92517,07815,42713,803
173,248
168182152151125
656161
965
99117114110
65425043
640
4,429
classrooms
66628
2,145253
73.186.5
100.084.487.7
20.912.2
6.1
0.012.812.3
1.40.02.80.0
1223
65854
1,319 1,194 26 6 0 13 369 2 0 0 0 0
2 0 0 0 0 0426 10 0 0 12 2
19 0 0 0 0 0
26 302 718 1,287 1,132 10 30 7 70 254 174 1 0 00 0 3 5 8 0 0 04 21 369 530 551 3 0 150 3 8 24 67 0 0 18
3 33 588 664 395 1 0 0
2397369
81088
74
1378
40546
1093 0 603 1083 0 441 239 9 150000
1040
0010
0000
402
1456
160
526
1070
1010
Terminalgrade Passed
VIII boysV girlsV boys
VIII girls
12 with >60%
34.65176507
161498
120
0.00.0
28.80.0
33.20.00.0
36.22.2
235031Hindi Urdu Others
315491450
733176284
101700
3800
4480000
% Schools recvd.
70.40.00.0
41.65.3
72.81.40.0
34.95.3
59031121
72002216
711018
18161128
8780979
74814120
1785420
18265281
4.27.18.03.36.3
4.11.91.31.1
0.70.50.6
0.62.0
63.9
77.4
0.98
2005-062004-052003-04
UTTAR PRADESH
50.0
Upper PrimaryPrimary
Sex ratio Sex ratio 0-6
14 118
VIII50.0
Enrolment of children
8,968VIII 12,692 22,626 27,092 28,132Total Pr. 208,589 231,260 275,699 295,039 256,207
1 - 5 6 - 8
713 78525 95
0 0
0 16
%Teachers recvd.in-service training
Total schools* Rural schools* Total enrolment* Rural enrolment* Teachers*
10.9 16.1
80.0
45.0
73.4 80.7
35.1 45.0% SC enrolment% SC girls to SC enrolment% ST enrolment
49.2 48.8
0.0 100.0
49.3
49.7
45.5
48.9
Position of teachers by educational qualification (other than para teacher)
(Previous academic year)Incentives : Number of beneficiaries
% ST girls to ST enrolment
% Girls
Number of villages
% 0 - 6 population
% SC population % ST population
% Urban population
% Schools with blackboard
% Enrolment in single-teacher schools
% Enrolment in schools without building
Primary Upperprimary
OBC EnrolmentPrimary U. Primary
% OBCEnrolment% OBC girls toOBC Enrolment
Pupil-teacher ratio (PTR)Student-classroom ratio (SCR)% Schools with <= 50 students% Schools with PTR > 100% Female teachers
% Schools established since 1995
Regular teachers Para-teachers
% minorrepairs
% majorrepairs
# = not applicable na = not available * Some totals may not match due to no response in classificatory data items
27.6 68.321.4 76.722.6 76.117.9 80.921.9 77.422.8 75.111.9 87.5
7.5 92.0
5291
50.04654
2.73.0
42.032.3
44.16247
0.09.9
27.039.4
49.84934
20.212.727.159.8
50.25225
0.05.3
38.310.5
23.9 22.6 na 56.3 42.3
94593913.518.3
Category
PrivateGovt.PrivateGovtPrivateGovt.PrivateGovt.PrivateGovt.
Total population (in 000's)
Number of blocks/taluks
District
Decadal growth rate
Primary onlyPrimary with upper primaryPrimary with upper primary & sec/higher sec.Upper primary onlyUpper primary with sec./higher secondary
% Single classroom schools% Single teacher schools
P + UP P+sec/hs U.P. only UP+secP. only
No response in school category
Primary with upper primaryPrimary with U.P. & sec/higherUpper primary onlyUpper primary with sec./higher sec
Primary only
Primary onlyPrimary with upper primaryPrimary with Upper primary & sec/higherUpper primary only
Para-teachers
School category
Upper primary with sec./higher secondary
Primary onlyPrimary with upper prim.
P. onlyP + UPP+sec/hsU.P. onlyUP+sec
NER(U.Prim)GER(U.Prim)NER (Primary)GER (Primary)
Transition ratePrim. to U. Prim
SC/ST Enrolment
Indicators
Classrooms/Other rooms
Prim.with U.P.&Sec/H.SUpper Primary onlyU. Primary with Sec./H.S.
Basic Data, 2001
Data reported from
Performance indicators
99.4 44.999.2 44.998.3 42.499.1 42.0
Utt
ar P
rad
esh

527
Elementary Education: Report Card - FARRUKHABAD
Utt
ar P
rad
esh
0.2440.000
19.0 19.0
Key data: Elementary Education
1570
FARRUKHABAD
(Previous academic year)
(Previous year)
Gender and caste distribution of teachers*
No. of schools by type of building*
BoysWith disability
Flow rates
Primary Level
Enrolment*
Number of schools
Grade
GER / NER
School category
Primary Upper primaryBoys Boys GirlsGirls
IncentiveType
School categoryMultiple
TypeKuccha
PartiallyPucca
PuccaTotal % good condition
Otherrooms
TentNo
Building
Classrooms
Belowsecondary
Highersecondary
Postgraduate
M. Phil.GraduateSecondarySchool category OthersNo
response
ST teachers
Total Male Female No res Male Female No res Male Female Male FemaleSC teachers
Text booksUniformAttendanceStationery
% Passed
Avg. No. of Tchs.
%
Female literacyOverall literacy
dev. grant grantSchool T L M
Male Female
IVV
IIIIII
Grade R.R. D.O.R. P.R.
VIIVI
# #
I - V
Enrolment by medium of instructions
Examination results
Retention rate
GPI
Primary cycle U. primary cycleState
DISTRICT ELEMENTARY EDUCATION REPORT CARD : 2005-06
GirlsGrade
IIIIIIIVVVI
VIII
AllGirls
Total
VII
% TotalGrossness
School category
50
2721
26 45 0
936
2571
7 0 0
1,060 18319 877
5 051 28,942
6 2560 114
982 85 195,189 23,1366,429 639 4,9741,884 0 1,884
15,174 26,905 9,704
0 0 01,622 256 1,622
207,632 47,071 3,89512
751132
P + UP P+sec/hs U.P. only UP+sec
School categoryP. only
0.7 0.0 0.0 0.3 0.01.4
Number of Clusters 1658993
% Schools with SCR > 606.5 0.0 14.5 0.0
49.2 29.0 40.0 7.4 0.0% Schools with pre-primary sections 5.0 3.2 20.0 1.9 14.3% Schools with common toilets 88.6 100.0 100.0 95.3 100.0
% Schools with girls toilets 84.6 100.0 80.0 91.5 100.0% Schools with drinking water facility 98.6 100.0 100.0 97.5 100.0
% Enrolment in Govt. schools 81.5 12.0 0.0 65.6 13.6100.0 100.0 100.0 100.0 100.0
% No female teacher schools (tch>=2) 25.2 48.4 60.0 49.6 85.70.8 0.7 0.0 7.1 0.0
0.0 0.0 0.0 0.0 0.0%Enrolment in schools without blackboard 0.0 0.0 0.0 0.0 0.0
2001-02 2002-03 2003-04 2004-05 2005-06IIIIIIIVV
VIVII
Total U.P
65,27357,08651,28848,42138,74620,155
15,369
55,06847,48250,05740,21532,873
15,19512,915
49,14051,17244,21038,77829,552
12,17610,814
52,10141,19435,59727,97921,964
8,5246,963
44,57536,80331,24125,38719,629
5,9334,723
49,18739,55732,65321,50614,534
86.8
24.5
89.9
29.0
121.6
37.5
42.5
0.020.0
31,33727,69524,69923,70718,737
9,5977,1396,205
149,116
638455227184172
787664
1,894
490353177116105
825733
1,413
3,942
classrooms
16942
1,48168
68.375.781.070.282.4
29.523.7
2.3
19.028.610.3
0.60.01.27.4
339
43614
1,291 1,234 3 0 0 6 031 0 0 0 0 0
5 0 0 0 0 0363 0 0 0 1 0
7 0 0 0 0 0
38 370 848 1,272 683 8 01 0 19 62 60 0 0 20 1 6 15 13 0 0 06 44 386 479 250 0 0 100 0 4 10 24 0 0 0
4 20 350 331 132 0 0 0
2162106
28896
32
387
2796
1068 0 786 630 0 260 132 11 80000
0010
0010
0000
71
1342
50
530
10
100
0010
Terminalgrade Passed
VIII boysV girlsV boys
VIII girls
11 with >60%
10.04646144
351177
38
0.00.06.90.0
6.80.00.06.80.0
254212Hindi Others
73061884
441161878
1630000
% Schools recvd.
25.23.2
20.012.3
0.0
77.59.7
40.064.4
0.0
508940
254120
29790
18990
480260
239440
48450
1852110
3.74.67.03.25.4
0.30.50.60.5
0.10.20.2
0.50.5
86.6
61.3
0.94
2005-062004-052003-04
UTTAR PRADESH
20.0
Upper PrimaryPrimary
Sex ratio Sex ratio 0-6
9 94
VIII40.0
Enrolment of children
3,878VIII 6,019 9,663 11,447 13,663Total Pr. 157,635 178,835 212,852 225,695 260,814
1 - 5 6 - 8
781 3964 340 0
0 35
%Teachers recvd.in-service training
Total schools* Rural schools* Total enrolment* Rural enrolment* Teachers*
1.8 2.9
100.0
36.4
76.8 82.7
21.4 23.6% SC enrolment% SC girls to SC enrolment% ST enrolment
48.4 45.2
0.0 40.8
64.5
48.4
58.6
47.1
Position of teachers by educational qualification (other than para teacher)
(Previous academic year)Incentives : Number of beneficiaries
% ST girls to ST enrolment
% Girls
Number of villages
% 0 - 6 population
% SC population % ST population
% Urban population
% Schools with blackboard
% Enrolment in single-teacher schools
% Enrolment in schools without building
Primary Upperprimary
OBC EnrolmentPrimary U. Primary
% OBCEnrolment% OBC girls toOBC Enrolment
Pupil-teacher ratio (PTR)Student-classroom ratio (SCR)% Schools with <= 50 students% Schools with PTR > 100% Female teachers
% Schools established since 1995
Regular teachers Para-teachers
% minorrepairs
% majorrepairs
# = not applicable na = not available * Some totals may not match due to no response in classificatory data items
3.1 96.33.6 95.9
38.2 61.34.4 95.2
4554
48.55565
3.111.736.529.8
42.65143
9.79.7
26.454.8
46.93730
25.27.4
23.847.9
53.04928
0.00.0
15.80.0
22.8 16.4 0.1 60.9 48.7
89784821.818.3
Category
PrivateGovt.PrivateGovtPrivateGovt.PrivateGovt.PrivateGovt.
Total population (in 000's)
Number of blocks/taluks
District
Decadal growth rate
Primary onlyPrimary with upper primaryPrimary with upper primary & sec/higher sec.Upper primary onlyUpper primary with sec./higher secondary
% Single classroom schools% Single teacher schools
P + UP P+sec/hs U.P. only UP+secP. only
No response in school category
Primary with upper primaryPrimary with U.P. & sec/higherUpper primary onlyUpper primary with sec./higher sec
Primary only
Primary onlyPrimary with upper primaryPrimary with Upper primary & sec/higherUpper primary only
Para-teachers
School category
Upper primary with sec./higher secondary
Primary onlyPrimary with upper prim.
P. onlyP + UPP+sec/hsU.P. onlyUP+sec
NER(U.Prim)GER(U.Prim)NER (Primary)GER (Primary)
Transition ratePrim. to U. Prim
SC/ST Enrolment
Indicators
Classrooms/Other rooms
Prim.with U.P.&Sec/H.SUpper Primary onlyU. Primary with Sec./H.S.
Basic Data, 2001
Data reported from
Performance indicators
98.8 45.698.8 47.799.1 46.899.8 50.0

528
Elementary Education in India - Where do we stand ?
0.0810.140
30.7 26.6
Key data: Elementary Education
2308
FATEHPUR
(Previous academic year)
(Previous year)
Gender and caste distribution of teachers*
No. of schools by type of building*
BoysWith disability
Flow rates
Primary Level
Enrolment*
Number of schools
Grade
GER / NER
School category
Primary Upper primaryBoys Boys GirlsGirls
IncentiveType
School categoryMultiple
TypeKuccha
PartiallyPucca
PuccaTotal % good condition
Otherrooms
TentNo
Building
Classrooms
Belowsecondary
Highersecondary
Postgraduate
M. Phil.GraduateSecondarySchool category OthersNo
response
ST teachers
Total Male Female No res Male Female No res Male Female Male FemaleSC teachers
Text booksUniformAttendanceStationery
% Passed
Avg. No. of Tchs.
%
Female literacyOverall literacy
dev. grant grantSchool T L M
Male Female
IVV
IIIIII
Grade R.R. D.O.R. P.R.
VIIVI
# #
I - V
Enrolment by medium of instructions
Examination results
Retention rate
GPI
Primary cycle U. primary cycleState
DISTRICT ELEMENTARY EDUCATION REPORT CARD : 2005-06
GirlsGrade
IIIIIIIVVVI
VIII
AllGirls
Total
VII
% TotalGrossness
School category
91
2824
37 87 1
25223
2714
8 0 0
1,588 41237 2,350
7 109194 36,060
21 6760 0
1,542 289 268,561 58,22110,209 2,080 10,209
2,316 109 2,31644,769 35,187 34,600
0 0 05,169 676 4,979
276,119 79,512 4,52429
94888
P + UP P+sec/hs U.P. only UP+sec
School categoryP. only
0.2 0.0 0.0 0.0 0.02.4
Number of Clusters 26231428
% Schools with SCR > 600.0 0.0 5.2 0.0
46.1 26.1 12.5 13.3 3.7% Schools with pre-primary sections 2.0 0.0 0.0 0.7 0.0% Schools with common toilets 59.6 47.8 50.0 73.8 88.9
% Schools with girls toilets 39.8 41.3 62.5 58.8 74.1% Schools with drinking water facility 94.1 95.7 100.0 91.2 100.0
% Enrolment in Govt. schools 77.6 18.7 4.5 44.6 11.6100.0 100.0 100.0 100.0 100.0
% No female teacher schools (tch>=2) 43.8 78.3 87.5 63.9 88.91.8 0.0 0.0 1.8 0.0
0.0 0.0 0.0 0.0 0.0%Enrolment in schools without blackboard 0.0 0.0 0.0 0.0 0.0
2001-02 2002-03 2003-04 2004-05 2005-06IIIIIIIVV
VIVII
Total U.P
87,64183,56374,66964,51055,29234,024
29,442
79,97371,92571,06958,00347,234
26,37323,771
71,21373,83068,07953,05643,880
24,81622,096
75,11867,21958,74144,90541,344
21,60918,120
70,97257,16049,78642,30738,563
19,81715,337
91,61472,42666,65255,79449,031
86.2
34.1
89.3
36.3
116.0
47.5
43.2
0.075.0
41,80939,70335,35331,34026,39816,00513,66713,021
217,296
234270346318210
478734
1,546
192186252265174
404422
1,175
6,299
classrooms
28874
2,438301
81.497.6
100.088.784.7
13.31.4
5.3
0.09.2
15.3
1.00.02.10.0
7514
91280
2,022 1,970 18 3 0 8 145 0 0 0 1 0
8 0 0 0 0 0530 1 1 0 2 0
27 0 0 0 0 0
286 456 913 1,054 667 5 41 0 1 35 15 0 0 643 0 1 0 7 0 0 6
114 89 340 489 321 1 0 3233 1 0 14 17 0 0 52
50 36 389 391 173 1 0 0
33239916
134383
171
3344
1010 0 560 579 0 513 150 38 150000
10
100
0030
0000
42
2377
10
710
00
190
0020
Terminalgrade Passed
VIII boysV girlsV boys
VIII girls
948 with >60%
7.45472117
171690
87
2.00.03.60.0
11.00.00.01.80.0
350821Hindi Others Urdu Kannada Sanskrit
122442425
793025111
384500
1383734
82315
000
2790000
1060000
% Schools recvd.
61.52.20.0
30.90.0
14.00.00.0
11.00.0
857030
23651135
66180
750
1173780
22521070
160820
540
2.72.52.13.23.2
2.62.42.62.0
2.01.91.6
1.42.3
77.0
70.9
0.91
2005-062004-052003-04
UTTAR PRADESH
5.9
Upper PrimaryPrimary
Sex ratio Sex ratio 0-6
15 162
VIII62.5
Enrolment of children
13,877VIII 16,065 19,740 22,282 28,148Total Pr. 258,788 287,327 310,058 328,204 365,675
1 - 5 6 - 8
1,102 58820 67
0 0
2 15
%Teachers recvd.in-service training
Total schools* Rural schools* Total enrolment* Rural enrolment* Teachers*
6.9 27.4
100.0
34.5
84.8 88.9
22.6 25.0% SC enrolment% SC girls to SC enrolment% ST enrolment
47.8 45.5
50.2 33.8
50.2
47.7
46.4
46.6
Position of teachers by educational qualification (other than para teacher)
(Previous academic year)Incentives : Number of beneficiaries
% ST girls to ST enrolment
% Girls
Number of villages
% 0 - 6 population
% SC population % ST population
% Urban population
% Schools with blackboard
% Enrolment in single-teacher schools
% Enrolment in schools without building
Primary Upperprimary
OBC EnrolmentPrimary U. Primary
% OBCEnrolment% OBC girls toOBC Enrolment
Pupil-teacher ratio (PTR)Student-classroom ratio (SCR)% Schools with <= 50 students% Schools with PTR > 100% Female teachers
% Schools established since 1995
Regular teachers Para-teachers
% minorrepairs
% majorrepairs
# = not applicable na = not available * Some totals may not match due to no response in classificatory data items
8.3 89.13.7 94.2
27.7 70.94.4 93.3
33143
47.96556
3.317.429.039.6
42.9107
444.3
50.014.560.9
46.94833
10.513.519.944.8
43.66719
3.725.9
4.63.7
21.4 25.0 na 56.3 41.9
92789310.318.2
Category
PrivateGovt.PrivateGovtPrivateGovt.PrivateGovt.PrivateGovt.
Total population (in 000's)
Number of blocks/taluks
District
Decadal growth rate
Primary onlyPrimary with upper primaryPrimary with upper primary & sec/higher sec.Upper primary onlyUpper primary with sec./higher secondary
% Single classroom schools% Single teacher schools
P + UP P+sec/hs U.P. only UP+secP. only
No response in school category
Primary with upper primaryPrimary with U.P. & sec/higherUpper primary onlyUpper primary with sec./higher sec
Primary only
Primary onlyPrimary with upper primaryPrimary with Upper primary & sec/higherUpper primary only
Para-teachers
School category
Upper primary with sec./higher secondary
Primary onlyPrimary with upper prim.
P. onlyP + UPP+sec/hsU.P. onlyUP+sec
NER(U.Prim)GER(U.Prim)NER (Primary)GER (Primary)
Transition ratePrim. to U. Prim
SC/ST Enrolment
Indicators
Classrooms/Other rooms
Prim.with U.P.&Sec/H.SUpper Primary onlyU. Primary with Sec./H.S.
Basic Data, 2001
Data reported from
Performance indicators
98.9 56.898.9 54.296.2 49.898.5 53.1
Utt
ar P
rad
esh

529
Elementary Education: Report Card - FIROZABAD
Utt
ar P
rad
esh
0.1650.044
25.4 32.5
Key data: Elementary Education
2053
FIROZABAD
(Previous academic year)
(Previous year)
Gender and caste distribution of teachers*
No. of schools by type of building*
BoysWith disability
Flow rates
Primary Level
Enrolment*
Number of schools
Grade
GER / NER
School category
Primary Upper primaryBoys Boys GirlsGirls
IncentiveType
School categoryMultiple
TypeKuccha
PartiallyPucca
PuccaTotal % good condition
Otherrooms
TentNo
Building
Classrooms
Belowsecondary
Highersecondary
Postgraduate
M. Phil.GraduateSecondarySchool category OthersNo
response
ST teachers
Total Male Female No res Male Female No res Male Female Male FemaleSC teachers
Text booksUniformAttendanceStationery
% Passed
Avg. No. of Tchs.
%
Female literacyOverall literacy
dev. grant grantSchool T L M
Male Female
IVV
IIIIII
Grade R.R. D.O.R. P.R.
VIIVI
# #
I - V
Enrolment by medium of instructions
Examination results
Retention rate
GPI
Primary cycle U. primary cycleState
DISTRICT ELEMENTARY EDUCATION REPORT CARD : 2005-06
GirlsGrade
IIIIIIIVVVI
VIII
AllGirls
Total
VII
% TotalGrossness
School category
10
3180
54 12 0
981
3140
0 0 0
1,195 32321 208
2 087 37,703
0 00 0
1,154 252 200,413 47,84727,730 208 11,001
799 0 79915,857 36,966 14,495
0 0 0310 0 0
205,310 61,455 3,0674
1,124296
P + UP P+sec/hs U.P. only UP+sec
School categoryP. only
1.3 0.0 0.0 0.0 0.01.4
Number of Clusters 19921140
% Schools with SCR > 600.0 0.0 13.7 0.0
34.3 40.0 0.0 8.9 0.0% Schools with pre-primary sections 10.1 0.0 0.0 0.0 0.0% Schools with common toilets 96.0 98.2 100.0 86.8 100.0
% Schools with girls toilets 84.8 96.4 100.0 74.5 100.0% Schools with drinking water facility 96.5 100.0 100.0 85.8 100.0
% Enrolment in Govt. schools 77.0 0.7 0.0 70.4 0.0100.0 100.0 100.0 100.0 100.0
% No female teacher schools (tch>=2) 40.1 30.9 50.0 51.7 100.00.7 0.0 0.0 5.8 0.0
0.1 0.0 0.0 0.0 0.0%Enrolment in schools without blackboard 0.0 0.0 0.0 0.0 0.0
2001-02 2002-03 2003-04 2004-05 2005-06IIIIIIIVV
VIVII
Total U.P
74,76966,28854,94548,46840,62324,676
21,466
71,31656,53852,70743,81137,655
20,09717,205
70,38661,54153,12344,12138,162
18,31716,093
71,60754,39547,56038,51233,116
14,43812,685
66,19547,05740,10132,49228,320
13,98511,621
64,27953,33649,26538,41735,882
81.6
27.7
77.4
29.0
101.7
37.4
38.0
0.050.0
34,81531,51426,10322,72519,09011,588
9,8868,248
163,969
186217214238176
888953
1,261
102159139129114
545239
788
5,527
classrooms
49724
1,88716
87.9100.0100.0
89.1100.0
8.80.0
3.2
0.06.50.0
0.00.04.50.0
631
5390
979 1,512 0 0 1 4 154 0 0 0 1 0
2 0 0 0 0 0416 0 0 0 0 0
1 0 0 0 0 0
4 284 698 1,662 737 16 10 0 10 171 119 0 0 00 0 0 12 2 0 0 02 31 278 684 374 3 0 120 0 0 0 2 0 0 0
1 5 270 361 151 0 0 0
2357212
121133
2
882
2510
1047 0 453 334 0 397 140 8 40000
0010
0000
0000
332
1540
50
440
5010
0030
Terminalgrade Passed
VIII boysV girlsV boys
VIII girls
2 with >60%
10.44191300
141385
2
0.00.06.30.0
9.10.00.05.6
265930Hindi Others Sanskrit Assamese
27938799
52481310
34900
9970
4860000
000
820
% Schools recvd.
53.80.00.0
31.50.0
53.40.00.0
31.00.0
6982827
440320
760632
1126832
7297634
427820
1154649
1085649
2.85.57.03.32.0
2.41.91.20.5
1.50.70.5
0.21.4
61.2
64.7
0.89
2005-062004-052003-04
UTTAR PRADESH
14.3
Upper PrimaryPrimary
Sex ratio Sex ratio 0-6
11 130
VIII50.0
Enrolment of children
10,276VIII 11,294 14,855 16,034 18,137Total Pr. 214,165 245,190 267,333 262,027 285,093
1 - 5 6 - 8
1,011 3740 20 0
0 14
%Teachers recvd.in-service training
Total schools* Rural schools* Total enrolment* Rural enrolment* Teachers*
11.6 14.4
90.0
32.1
77.5 69.4
26.8 22.3% SC enrolment% SC girls to SC enrolment% ST enrolment
46.8 46.3
51.2 48.1
59.7
47.3
50.1
46.3
Position of teachers by educational qualification (other than para teacher)
(Previous academic year)Incentives : Number of beneficiaries
% ST girls to ST enrolment
% Girls
Number of villages
% 0 - 6 population
% SC population % ST population
% Urban population
% Schools with blackboard
% Enrolment in single-teacher schools
% Enrolment in schools without building
Primary Upperprimary
OBC EnrolmentPrimary U. Primary
% OBCEnrolment% OBC girls toOBC Enrolment
Pupil-teacher ratio (PTR)Student-classroom ratio (SCR)% Schools with <= 50 students% Schools with PTR > 100% Female teachers
% Schools established since 1995
Regular teachers Para-teachers
% minorrepairs
% majorrepairs
# = not applicable na = not available * Some totals may not match due to no response in classificatory data items
6.1 91.42.1 96.07.2 91.57.0 92.5
35.1 64.79.8 88.8
3357
47.56448
3.017.133.044.3
41.49356
0.047.329.334.5
47.23928
17.811.318.164.2
65.5155
190.0
100.00.00.0
33.4 18.9 na 64.5 51.0
88785230.319.5
Category
PrivateGovt.PrivateGovtPrivateGovt.PrivateGovt.PrivateGovt.
Total population (in 000's)
Number of blocks/taluks
District
Decadal growth rate
Primary onlyPrimary with upper primaryPrimary with upper primary & sec/higher sec.Upper primary onlyUpper primary with sec./higher secondary
% Single classroom schools% Single teacher schools
P + UP P+sec/hs U.P. only UP+secP. only
No response in school category
Primary with upper primaryPrimary with U.P. & sec/higherUpper primary onlyUpper primary with sec./higher sec
Primary only
Primary onlyPrimary with upper primaryPrimary with Upper primary & sec/higherUpper primary only
Para-teachers
School category
Upper primary with sec./higher secondary
Primary onlyPrimary with upper prim.
P. onlyP + UPP+sec/hsU.P. onlyUP+sec
NER(U.Prim)GER(U.Prim)NER (Primary)GER (Primary)
Transition ratePrim. to U. Prim
SC/ST Enrolment
Indicators
Classrooms/Other rooms
Prim.with U.P.&Sec/H.SUpper Primary onlyU. Primary with Sec./H.S.
Basic Data, 2001
Data reported from
Performance indicators
99.3 47.899.7 48.999.3 48.999.4 49.7

530
Elementary Education in India - Where do we stand ?
0.5990.262
23.9 20.1
Key data: Elementary Education
1202
GAUTAM BUDDHA NAGAR
(Previous academic year)
(Previous year)
Gender and caste distribution of teachers*
No. of schools by type of building*
BoysWith disability
Flow rates
Primary Level
Enrolment*
Number of schools
Grade
GER / NER
School category
Primary Upper primaryBoys Boys GirlsGirls
IncentiveType
School categoryMultiple
TypeKuccha
PartiallyPucca
PuccaTotal % good condition
Otherrooms
TentNo
Building
Classrooms
Belowsecondary
Highersecondary
Postgraduate
M. Phil.GraduateSecondarySchool category OthersNo
response
ST teachers
Total Male Female No res Male Female No res Male Female Male FemaleSC teachers
Text booksUniformAttendanceStationery
% Passed
Avg. No. of Tchs.
%
Female literacyOverall literacy
dev. grant grantSchool T L M
Male Female
IVV
IIIIII
Grade R.R. D.O.R. P.R.
VIIVI
# #
I - V
Enrolment by medium of instructions
Examination results
Retention rate
GPI
Primary cycle U. primary cycleState
DISTRICT ELEMENTARY EDUCATION REPORT CARD : 2005-06
GirlsGrade
IIIIIIIVVVI
VIII
AllGirls
Total
VII
% TotalGrossness
School category
166
1235
34 159 3
3423
1134
72 0 0
480 14526 4,924
8 2,27927 8,63421 964
0 0
458 118 75,472 26,45013,906 4,664 9,550
3,576 1,031 3,2316,701 7,436 5,463
0 0 07,443 799 6,887
81,415 33,086 1,565113
755256
P + UP P+sec/hs U.P. only UP+sec
School categoryP. only
0.3 0.0 0.0 2.5 0.09.4
Number of Clusters 947380
% Schools with SCR > 602.0 0.0 24.2 3.6
20.3 22.0 20.0 4.5 7.1% Schools with pre-primary sections 28.6 20.0 40.0 12.1 17.9% Schools with common toilets 91.8 92.0 100.0 83.4 100.0
% Schools with girls toilets 86.4 92.0 86.7 74.5 92.9% Schools with drinking water facility 99.5 98.0 100.0 85.4 100.0
% Enrolment in Govt. schools 71.1 26.1 38.9 56.3 11.599.4 98.0 100.0 100.0 100.0
% No female teacher schools (tch>=2) 27.5 12.0 26.7 31.2 60.76.0 0.1 0.0 10.2 2.6
0.0 0.0 0.0 0.2 0.0%Enrolment in schools without blackboard 0.7 0.7 0.0 0.0 0.0
2001-02 2002-03 2003-04 2004-05 2005-06IIIIIIIVV
VIVII
Total U.P
38,88728,06323,83920,63518,95912,381
10,581
37,84727,23123,13619,69817,978
11,0289,716
39,30628,15523,80020,10318,218
10,6839,431
29,89920,41016,60313,44612,616
4,8544,024
26,86618,45715,19312,69512,524
3,7383,332
32,54530,18129,20012,71410,099
67.3
27.9
63.1
27.8
79.4
32.4
42.5
0.033.3
17,83512,79711,115
9,5978,6075,4284,4723,830
73,681
190128138122
99169149
841,079
125123111
8255
151112
37796
2,863
classrooms
490170721452
77.592.491.283.583.0
18.17.6
4.4
8.813.513.7
0.00.03.13.3
7932
189109
516 610 9 0 0 5 149 0 0 0 1 013 2 0 0 0 0
156 0 0 0 0 128 0 0 0 0 0
68 253 444 662 418 3 313 4 26 132 93 1 0 85
0 1 5 21 24 0 0 486 5 109 150 112 1 1 996 0 13 39 57 0 0 55
1 8 23 114 69 0 0 0
1137193
57298135
15535
17129
987 4 111 75 6 158 63 10 867
146
12520
310
21
0000
104
387
130
243
8032
0010
Terminalgrade Passed
VIII boysV girlsV boys
VIII girls
277 with >60%
27.92320369114487171
3.40.0
25.00.7
20.72.50.0
30.60.0
113786Hindi English Others Sanskrit Urdu
181405855
147318407
240616
000
8874
0468
0
7500
1360
1820000
% Schools recvd.
36.26.00.0
19.77.1
29.32.00.0
14.00.0
29267160
16104108
169739
210115
28869202
12466105
273824
16846
3.77.47.63.16.1
4.03.12.52.1
4.13.83.0
1.62.9
69.5
66.4
0.85
2005-062004-052003-04
UTTAR PRADESH
39.5
Upper PrimaryPrimary
Sex ratio Sex ratio 0-6
4 43
VIII26.7
Enrolment of children
3,029VIII 3,836 9,086 9,437 9,583Total Pr. 85,735 92,974 129,582 125,890 130,383
1 - 5 6 - 8
338 14930 141
0 0
49 65
%Teachers recvd.in-service training
Total schools* Rural schools* Total enrolment* Rural enrolment* Teachers*
21.7 26.2
62.2
23.9
54.0 50.1
21.9 21.2% SC enrolment% SC girls to SC enrolment% ST enrolment
45.9 41.9
43.1 44.6
31.9
47.3
31.7
44.8
Position of teachers by educational qualification (other than para teacher)
(Previous academic year)Incentives : Number of beneficiaries
% ST girls to ST enrolment
% Girls
Number of villages
% 0 - 6 population
% SC population % ST population
% Urban population
% Schools with blackboard
% Enrolment in single-teacher schools
% Enrolment in schools without building
Primary Upperprimary
OBC EnrolmentPrimary U. Primary
% OBCEnrolment% OBC girls toOBC Enrolment
Pupil-teacher ratio (PTR)Student-classroom ratio (SCR)% Schools with <= 50 students% Schools with PTR > 100% Female teachers
% Schools established since 1995
Regular teachers Para-teachers
% minorrepairs
% majorrepairs
# = not applicable na = not available * Some totals may not match due to no response in classificatory data items
24.1 71.911.4 85.510.1 87.4
3.2 94.832.0 66.416.6 80.5
3.4 92.60.4 95.7
3451
46.64940
7.49.8
45.838.9
41.35138
4.04.0
42.854.0
46.63121
38.21.9
35.563.7
34.44919
0.017.917.514.3
35.7 16.3 na 68.7 53.7
85484137.418.2
Category
PrivateGovt.PrivateGovtPrivateGovt.PrivateGovt.PrivateGovt.
Total population (in 000's)
Number of blocks/taluks
District
Decadal growth rate
Primary onlyPrimary with upper primaryPrimary with upper primary & sec/higher sec.Upper primary onlyUpper primary with sec./higher secondary
% Single classroom schools% Single teacher schools
P + UP P+sec/hs U.P. only UP+secP. only
No response in school category
Primary with upper primaryPrimary with U.P. & sec/higherUpper primary onlyUpper primary with sec./higher sec
Primary only
Primary onlyPrimary with upper primaryPrimary with Upper primary & sec/higherUpper primary only
Para-teachers
School category
Upper primary with sec./higher secondary
Primary onlyPrimary with upper prim.
P. onlyP + UPP+sec/hsU.P. onlyUP+sec
NER(U.Prim)GER(U.Prim)NER (Primary)GER (Primary)
Transition ratePrim. to U. Prim
SC/ST Enrolment
Indicators
Classrooms/Other rooms
Prim.with U.P.&Sec/H.SUpper Primary onlyU. Primary with Sec./H.S.
Basic Data, 2001
Data reported from
Performance indicators
98.8 52.398.9 51.894.1 39.994.1 39.4
Utt
ar P
rad
esh

531
Elementary Education: Report Card - GHAZIABAD
Utt
ar P
rad
esh
0.3290.259
22.1 22.9
Key data: Elementary Education
3291
GHAZIABAD
(Previous academic year)
(Previous year)
Gender and caste distribution of teachers*
No. of schools by type of building*
BoysWith disability
Flow rates
Primary Level
Enrolment*
Number of schools
Grade
GER / NER
School category
Primary Upper primaryBoys Boys GirlsGirls
IncentiveType
School categoryMultiple
TypeKuccha
PartiallyPucca
PuccaTotal % good condition
Otherrooms
TentNo
Building
Classrooms
Belowsecondary
Highersecondary
Postgraduate
M. Phil.GraduateSecondarySchool category OthersNo
response
ST teachers
Total Male Female No res Male Female No res Male Female Male FemaleSC teachers
Text booksUniformAttendanceStationery
% Passed
Avg. No. of Tchs.
%
Female literacyOverall literacy
dev. grant grantSchool T L M
Male Female
IVV
IIIIII
Grade R.R. D.O.R. P.R.
VIIVI
# #
I - V
Enrolment by medium of instructions
Examination results
Retention rate
GPI
Primary cycle U. primary cycleState
DISTRICT ELEMENTARY EDUCATION REPORT CARD : 2005-06
GirlsGrade
IIIIIIIVVVI
VIII
AllGirls
Total
VII
% TotalGrossness
School category
382
2890
73 125 0
5211
2420
21 0 0
861 25334 25,064
3 45643 27,636
7 00 0
699 147 126,911 46,16335,032 3,668 13,667
2,797 0 1,3499,948 22,938 7,633
0 0 04,272 0 1,932
163,266 85,232 3,319276
1,226587
P + UP P+sec/hs U.P. only UP+sec
School categoryP. only
0.4 0.0 0.0 0.6 0.01.5
Number of Clusters 1605634
% Schools with SCR > 600.0 0.0 15.2 0.0
35.5 34.2 0.0 2.9 27.3% Schools with pre-primary sections 3.8 16.2 14.3 0.6 0.0% Schools with common toilets 94.0 95.5 100.0 80.6 90.9
% Schools with girls toilets 87.2 94.6 100.0 76.0 100.0% Schools with drinking water facility 98.6 100.0 100.0 97.1 100.0
% Enrolment in Govt. schools 65.7 41.7 14.0 73.5 0.099.5 100.0 100.0 98.8 100.0
% No female teacher schools (tch>=2) 22.7 8.1 14.3 39.3 54.50.5 0.0 0.0 6.0 0.0
0.3 0.0 0.0 0.2 0.0%Enrolment in schools without blackboard 0.1 0.0 0.0 0.2 0.0
2001-02 2002-03 2003-04 2004-05 2005-06IIIIIIIVV
VIVII
Total U.P
83,09863,90955,01447,23342,51223,044
20,349
88,01563,67152,61544,74239,491
24,11421,026
84,31263,12853,64145,30040,012
20,39117,711
56,27937,88929,65824,19621,615
8,6537,253
52,19032,12225,16521,14618,307
6,6745,494
61,93763,30154,38422,11116,668
53.1
18.6
51.1
20.6
64.9
22.5
48.5
0.00.0
39,54130,81326,39622,83120,27111,302
9,9059,091
170,150
189192211157158
865544
1,092
99102118128
85405028
650
4,554
classrooms
1,034105
1,516113
86.596.592.484.695.6
11.23.5
2.3
7.610.8
4.4
0.00.04.60.0
20423
43529
1,102 1,083 11 0 0 8 12110 0 0 0 0 0
7 0 0 0 0 0322 10 0 0 2 6
11 0 0 0 0 0
62 548 819 1,429 822 12 100 17 76 454 229 3 0 830 0 12 33 12 0 0 9
43 20 374 349 290 2 1 1040 5 5 9 28 0 0 22
1 17 232 190 103 0 1 0
2013290
28802
57
57237
37812
1967 13 242 306 4 337 224 20 260130
1120
0020
0000
392
1227
440
640
2140
0070
Terminalgrade Passed
VIII boysV girlsV boys
VIII girls
291 with >60%
28.64545863
671187
69
0.30.0
39.90.0
21.31.20.0
30.80.0
246734Hindi Others Urdu Assamese
596993253
369904272
1003397
0594
0
4290000
3320000
% Schools recvd.
65.70.00.0
76.20.0
64.60.00.0
74.80.0
539340
5479716
73100
71241
599230
5529613
1070716
62691
4.17.89.63.56.3
2.31.71.41.1
1.11.11.2
0.81.6
80.9
57.7
0.92
2005-062004-052003-04
UTTAR PRADESH
55.2
Upper PrimaryPrimary
Sex ratio Sex ratio 0-6
12 80
VIII28.6
Enrolment of children
4,500VIII 6,205 16,282 18,161 18,544Total Pr. 148,930 169,637 286,393 288,534 291,766
1 - 5 6 - 8
909 2780 697 0
16 51
%Teachers recvd.in-service training
Total schools* Rural schools* Total enrolment* Rural enrolment* Teachers*
15.4 24.1
54.9
17.1
45.7 43.1
15.0 16.9% SC enrolment% SC girls to SC enrolment% ST enrolment
47.1 48.9
49.7 64.2
20.8
48.4
22.9
49.3
Position of teachers by educational qualification (other than para teacher)
(Previous academic year)Incentives : Number of beneficiaries
% ST girls to ST enrolment
% Girls
Number of villages
% 0 - 6 population
% SC population % ST population
% Urban population
% Schools with blackboard
% Enrolment in single-teacher schools
% Enrolment in schools without building
Primary Upperprimary
OBC EnrolmentPrimary U. Primary
% OBCEnrolment% OBC girls toOBC Enrolment
Pupil-teacher ratio (PTR)Student-classroom ratio (SCR)% Schools with <= 50 students% Schools with PTR > 100% Female teachers
% Schools established since 1995
Regular teachers Para-teachers
% minorrepairs
% majorrepairs
# = not applicable na = not available * Some totals may not match due to no response in classificatory data items
26.3 71.413.1 85.2
9.7 88.94.6 94.3
41.5 57.719.1 79.315.5 83.411.8 87.1
3149
47.95555
5.39.1
50.031.0
48.27058
0.018.066.345.9
48.43225
24.91.8
32.063.6
56.26238
0.09.1
17.49.1
47.5 18.0 na 69.7 58.0
85486055.217.2
Category
PrivateGovt.PrivateGovtPrivateGovt.PrivateGovt.PrivateGovt.
Total population (in 000's)
Number of blocks/taluks
District
Decadal growth rate
Primary onlyPrimary with upper primaryPrimary with upper primary & sec/higher sec.Upper primary onlyUpper primary with sec./higher secondary
% Single classroom schools% Single teacher schools
P + UP P+sec/hs U.P. only UP+secP. only
No response in school category
Primary with upper primaryPrimary with U.P. & sec/higherUpper primary onlyUpper primary with sec./higher sec
Primary only
Primary onlyPrimary with upper primaryPrimary with Upper primary & sec/higherUpper primary only
Para-teachers
School category
Upper primary with sec./higher secondary
Primary onlyPrimary with upper prim.
P. onlyP + UPP+sec/hsU.P. onlyUP+sec
NER(U.Prim)GER(U.Prim)NER (Primary)GER (Primary)
Transition ratePrim. to U. Prim
SC/ST Enrolment
Indicators
Classrooms/Other rooms
Prim.with U.P.&Sec/H.SUpper Primary onlyU. Primary with Sec./H.S.
Basic Data, 2001
Data reported from
Performance indicators
99.1 57.699.2 57.598.2 47.397.6 51.7

532
Elementary Education in India - Where do we stand ?
29.3 31.2
Key data: Elementary Education
3038
GHAZIPUR
(Previous academic year)
(Previous year)
Gender and caste distribution of teachers*
No. of schools by type of building*
BoysWith disability
Flow rates
Primary Level
Enrolment*
Number of schools
Grade
GER / NER
School category
Primary Upper primaryBoys Boys GirlsGirls
IncentiveType
School categoryMultiple
TypeKuccha
PartiallyPucca
PuccaTotal % good condition
Otherrooms
TentNo
Building
Classrooms
Belowsecondary
Highersecondary
Postgraduate
M. Phil.GraduateSecondarySchool category OthersNo
response
ST teachers
Total Male Female No res Male Female No res Male Female Male FemaleSC teachers
Text booksUniformAttendanceStationery
% Passed
Avg. No. of Tchs.
%
Female literacyOverall literacy
dev. grant grantSchool T L M
Male Female
IVV
IIIIII
Grade R.R. D.O.R. P.R.
VIIVI
# #
I - V
Enrolment by medium of instructions
Examination results
Retention rate
GPI
Primary cycle U. primary cycleState
DISTRICT ELEMENTARY EDUCATION REPORT CARD : 2005-06
GirlsGrade
IIIIIIIVVVI
VIII
AllGirls
Total
VII
% TotalGrossness
School category
105
3050
8 91 4
482
3040
0 0 0
1,647 2658 2,0871 1,658
48 53,9802 00 0
1,632 246 371,467 52,1853,876 1,494 3,876
612 1,595 61210,014 53,909 10,014
0 0 0444 0 444
374,497 55,385 5,55325
57835
P + UP P+sec/hs U.P. only UP+sec
School categoryP. only
1.0 0.0 0.0 1.7 0.01.3
Number of Clusters 22911509
% Schools with SCR > 600.0 16.7 0.3 0.0
56.2 16.7 50.0 13.3 50.0% Schools with pre-primary sections 1.9 0.0 0.0 0.6 0.0% Schools with common toilets 83.2 77.8 100.0 88.4 50.0
% Schools with girls toilets 77.3 77.8 83.3 79.6 50.0% Schools with drinking water facility 98.2 100.0 100.0 94.3 100.0
% Enrolment in Govt. schools 87.1 35.0 73.0 84.4 0.0100.0 100.0 100.0 100.0 100.0
% No female teacher schools (tch>=2) 39.3 61.1 50.0 70.8 100.01.0 0.0 2.8 0.1 0.0
0.0 0.0 0.0 0.0 0.0%Enrolment in schools without blackboard 0.0 0.0 0.0 0.0 0.0
2001-02 2002-03 2003-04 2004-05 2005-06IIIIIIIVV
VIVII
Total U.P
109,87696,91887,18977,38663,65025,452
22,068
110,77991,11285,31270,16458,426
19,46017,198
100,68692,64377,54466,54256,900
18,25916,848
107,78082,04472,69761,96654,146
15,82313,664
95,56875,16865,86357,09651,685
11,7949,764
67,53452,02349,81241,27729,718
82.5
19.2
84.8
19.5
104.9
26.6
65.6
0.066.7
53,55447,69042,53937,96431,11412,26110,475
9,232244,829
105673521494155109117
792,253
383591510307
4175
12764
2,098
6,743
classrooms
11838
1,74315
40.053.465.840.420.0
49.537.3
10.5
34.252.160.0
9.30.07.5
20.0
3116
4750
1,885 1,733 40 7 0 123 49 3 0 0 3 26 0 0 0 0 0
323 9 0 0 19 11 1 0 0 0 0
1,269 703 754 1,256 341 4 030 6 5 11 5 0 0 2
9 1 1 0 2 0 0 0235 140 168 191 118 0 0 70
0 1 0 4 1 0 0 0
149 93 127 662 114 1 0 0
36344911
7596
102
1630
839 0 879 779 0 774 317 63 170000
1100
0110
0000
21
1361
01
130
20
150
0140
Terminalgrade Passed
VIII boysV girlsV boys
VIII girls
146 with >60%
11.561316015
9236
10.08.3
11.216.7
8.10.0
100.013.4
419468Hindi Others Konkani Urdu Assamese
52302270
62232444
294900
5550
76500
2310
227733
000
5890000
% Schools recvd.
64.15.6
33.344.8
0.0
60.45.6
33.343.1
0.0
13867259
1461252
166700
1027254
156132139
1538474
194840
1101353
3.23.32.52.63.0
1.30.20.10.10.10.4
66.6
43.6
0.96
2005-062004-052003-04
UTTAR PRADESH
20.0
Upper PrimaryPrimary
Sex ratio Sex ratio 0-6
17 207
VIII0.0
Enrolment of children
8,160VIII 11,790 14,705 15,365 20,014Total Pr. 345,380 378,633 394,315 415,793 435,019
1 - 5 6 - 8
783 1400 60 0
11 4
%Teachers recvd.in-service training
Total schools* Rural schools* Total enrolment* Rural enrolment* Teachers*
12.9 35.9
91.4
17.0
79.9 82.1
19.0 15.3% SC enrolment% SC girls to SC enrolment% ST enrolment
48.9 45.81.8
49.5 52.3
53.8
50.4
49.9
47.8
Position of teachers by educational qualification (other than para teacher)
(Previous academic year)Incentives : Number of beneficiaries
% ST girls to ST enrolment
% Girls
Number of villages
% 0 - 6 population
% SC population % ST population
% Urban population
% Schools with blackboard
% Enrolment in single-teacher schools
% Enrolment in schools without building
Primary Upperprimary
OBC EnrolmentPrimary U. Primary
% OBCEnrolment% OBC girls toOBC Enrolment
Pupil-teacher ratio (PTR)Student-classroom ratio (SCR)% Schools with <= 50 students% Schools with PTR > 100% Female teachers
% Schools established since 1995
Regular teachers Para-teachers
% minorrepairs
% majorrepairs
# = not applicable na = not available * Some totals may not match due to no response in classificatory data items
11.4 87.34.2 95.69.3 90.69.3 90.7
56.4 43.615.3 84.2
60151
49.07064
1.827.026.429.5
39.29951
11.138.916.733.3
47.36937
15.622.717.845.0
36.37430
0.00.00.00.0
26.2 21.4 na 59.6 44.0
9349767.720.1
Category
PrivateGovt.PrivateGovtPrivateGovt.PrivateGovt.PrivateGovt.
Total population (in 000's)
Number of blocks/taluks
District
Decadal growth rate
Primary onlyPrimary with upper primaryPrimary with upper primary & sec/higher sec.Upper primary onlyUpper primary with sec./higher secondary
% Single classroom schools% Single teacher schools
P + UP P+sec/hs U.P. only UP+secP. only
No response in school category
Primary with upper primaryPrimary with U.P. & sec/higherUpper primary onlyUpper primary with sec./higher sec
Primary only
Primary onlyPrimary with upper primaryPrimary with Upper primary & sec/higherUpper primary only
Para-teachers
School category
Upper primary with sec./higher secondary
Primary onlyPrimary with upper prim.
P. onlyP + UPP+sec/hsU.P. onlyUP+sec
NER(U.Prim)GER(U.Prim)NER (Primary)GER (Primary)
Transition ratePrim. to U. Prim
2.3
SC/ST Enrolment
Indicators
Classrooms/Other rooms
Prim.with U.P.&Sec/H.SUpper Primary onlyU. Primary with Sec./H.S.
Basic Data, 2001
Data reported from
Performance indicators
96.9 54.297.3 50.298.9 44.994.0 40.8
Utt
ar P
rad
esh

533
Elementary Education: Report Card - GONDA
Utt
ar P
rad
esh
0.0000.002
20.2 19.4
Key data: Elementary Education
2766
GONDA
(Previous academic year)
(Previous year)
Gender and caste distribution of teachers*
No. of schools by type of building*
BoysWith disability
Flow rates
Primary Level
Enrolment*
Number of schools
Grade
GER / NER
School category
Primary Upper primaryBoys Boys GirlsGirls
IncentiveType
School categoryMultiple
TypeKuccha
PartiallyPucca
PuccaTotal % good condition
Otherrooms
TentNo
Building
Classrooms
Belowsecondary
Highersecondary
Postgraduate
M. Phil.GraduateSecondarySchool category OthersNo
response
ST teachers
Total Male Female No res Male Female No res Male Female Male FemaleSC teachers
Text booksUniformAttendanceStationery
% Passed
Avg. No. of Tchs.
%
Female literacyOverall literacy
dev. grant grantSchool T L M
Male Female
IVV
IIIIII
Grade R.R. D.O.R. P.R.
VIIVI
# #
I - V
Enrolment by medium of instructions
Examination results
Retention rate
GPI
Primary cycle U. primary cycleState
DISTRICT ELEMENTARY EDUCATION REPORT CARD : 2005-06
GirlsGrade
IIIIIIIVVVI
VIII
AllGirls
Total
VII
% TotalGrossness
School category
32
3940
131 218 14820
3860
112 0 2
1,695 24399 87712 47346 40,09317 0
0 0
1,660 199 359,149 44,81453,534 696 44,432
8,919 245 5,41910,332 38,556 9,835
0 0 04,901 0 3,599
366,768 53,212 4,51823
1,3661,139
P + UP P+sec/hs U.P. only UP+sec
School categoryP. only
2.0 0.7 0.0 2.0 0.05.8
Number of Clusters 26661618
% Schools with SCR > 600.7 0.0 56.6 0.0
56.3 34.3 15.0 11.5 15.0% Schools with pre-primary sections 33.7 8.2 5.0 5.0 5.0% Schools with common toilets 76.8 82.1 85.0 79.0 75.0
% Schools with girls toilets 64.7 76.9 85.0 72.2 65.0% Schools with drinking water facility 96.1 96.3 100.0 84.8 100.0
% Enrolment in Govt. schools 87.3 1.6 5.0 79.5 0.099.3 98.5 100.0 98.6 100.0
% No female teacher schools (tch>=2) 36.9 39.6 35.0 30.5 90.03.7 1.6 0.0 30.6 0.0
1.2 0.3 0.0 1.1 0.0%Enrolment in schools without blackboard 0.5 1.7 0.0 0.7 0.0
2001-02 2002-03 2003-04 2004-05 2005-06IIIIIIIVV
VIVII
Total U.P
121,886102,404
91,58180,10861,57432,391
26,514
120,38899,77693,44169,86653,223
26,61321,969
120,512105,788
79,19858,77046,826
23,45920,110
137,72186,40965,34949,48239,867
18,36115,212
104,64571,13057,85443,98935,674
13,91111,553
81,55668,27161,21747,61535,359
94.6
25.9
98.0
28.2
121.2
35.3
43.0
0.020.0
56,76248,13943,14936,81526,79513,24710,714
8,665244,286
345316400357253
95101
681,935
189229248217161
493837
1,168
6,128
classrooms
1,078261
1,610216
62.584.278.271.588.0
26.712.1
10.8
20.319.3
9.3
3.71.59.22.8
21457
65369
1,874 1,832 22 7 0 35 4198 6 1 1 27 117 0 0 0 3 0
416 5 0 0 11 1017 0 0 0 3 0
78 480 958 789 461 10 66 5 26 61 37 0 0 1,0270 2 10 8 11 1 0 141
29 17 233 247 176 1 1 2340 0 0 1 7 0 0 156
34 46 658 597 279 0 0 0
2940857113787160
30460
1514
1005 2 1131 806 0 422 111 9 81000
0020
0000
0000
581
829
85
130
6031
1010
Terminalgrade Passed
VIII boysV girlsV boys
VIII girls
1,165 with >60%
37.658841162
173940164
0.00.0
47.50.0
33.60.00.0
53.00.0
410121Hindi Urdu Others Sanskrit English
509578842
495654898
54491150
55000
1992298
0490
3
6290000
145450
000
% Schools recvd.
74.43.70.0
35.75.0
64.00.00.0
29.05.0
155019571
28570404
94195
2560131
153303520
25402369
140275
1488112
3.08.78.72.18.2
7.94.43.42.2
0.90.91.1
1.44.4
58.1
60.4
0.86
2005-062004-052003-04
UTTAR PRADESH
34.7
Upper PrimaryPrimary
Sex ratio Sex ratio 0-6
19 172
VIII20.0
Enrolment of children
9,895VIII 14,042 17,648 19,689 22,651Total Pr. 313,292 378,828 411,094 436,694 457,553
1 - 5 6 - 8
661 2790 1646 0
20 153
%Teachers recvd.in-service training
Total schools* Rural schools* Total enrolment* Rural enrolment* Teachers*
11.2 21.1
100.0
27.8
82.8 87.1
20.9 22.2% SC enrolment% SC girls to SC enrolment% ST enrolment
46.6 38.7
11.1 0.0
41.0
46.1
34.1
37.5
Position of teachers by educational qualification (other than para teacher)
(Previous academic year)Incentives : Number of beneficiaries
% ST girls to ST enrolment
% Girls
Number of villages
% 0 - 6 population
% SC population % ST population
% Urban population
% Schools with blackboard
% Enrolment in single-teacher schools
% Enrolment in schools without building
Primary Upperprimary
OBC EnrolmentPrimary U. Primary
% OBCEnrolment% OBC girls toOBC Enrolment
Pupil-teacher ratio (PTR)Student-classroom ratio (SCR)% Schools with <= 50 students% Schools with PTR > 100% Female teachers
% Schools established since 1995
Regular teachers Para-teachers
% minorrepairs
% majorrepairs
# = not applicable na = not available * Some totals may not match due to no response in classificatory data items
10.7 81.47.0 88.6
12.5 84.110.7 87.138.2 60.413.6 82.0
0.2 98.9
3654
47.17169
1.827.330.822.4
35.04750
0.09.0
26.229.1
42.65431
36.216.516.157.5
36.53023
10.05.02.4
10.0
25.5 15.7 na 42.6 27.2
9529067.019.4
Category
PrivateGovt.PrivateGovtPrivateGovt.PrivateGovt.PrivateGovt.
Total population (in 000's)
Number of blocks/taluks
District
Decadal growth rate
Primary onlyPrimary with upper primaryPrimary with upper primary & sec/higher sec.Upper primary onlyUpper primary with sec./higher secondary
% Single classroom schools% Single teacher schools
P + UP P+sec/hs U.P. only UP+secP. only
No response in school category
Primary with upper primaryPrimary with U.P. & sec/higherUpper primary onlyUpper primary with sec./higher sec
Primary only
Primary onlyPrimary with upper primaryPrimary with Upper primary & sec/higherUpper primary only
Para-teachers
School category
Upper primary with sec./higher secondary
Primary onlyPrimary with upper prim.
P. onlyP + UPP+sec/hsU.P. onlyUP+sec
NER(U.Prim)GER(U.Prim)NER (Primary)GER (Primary)
Transition ratePrim. to U. Prim
SC/ST Enrolment
Indicators
Classrooms/Other rooms
Prim.with U.P.&Sec/H.SUpper Primary onlyU. Primary with Sec./H.S.
Basic Data, 2001
Data reported from
Performance indicators
99.2 41.999.3 40.599.1 38.399.2 45.0
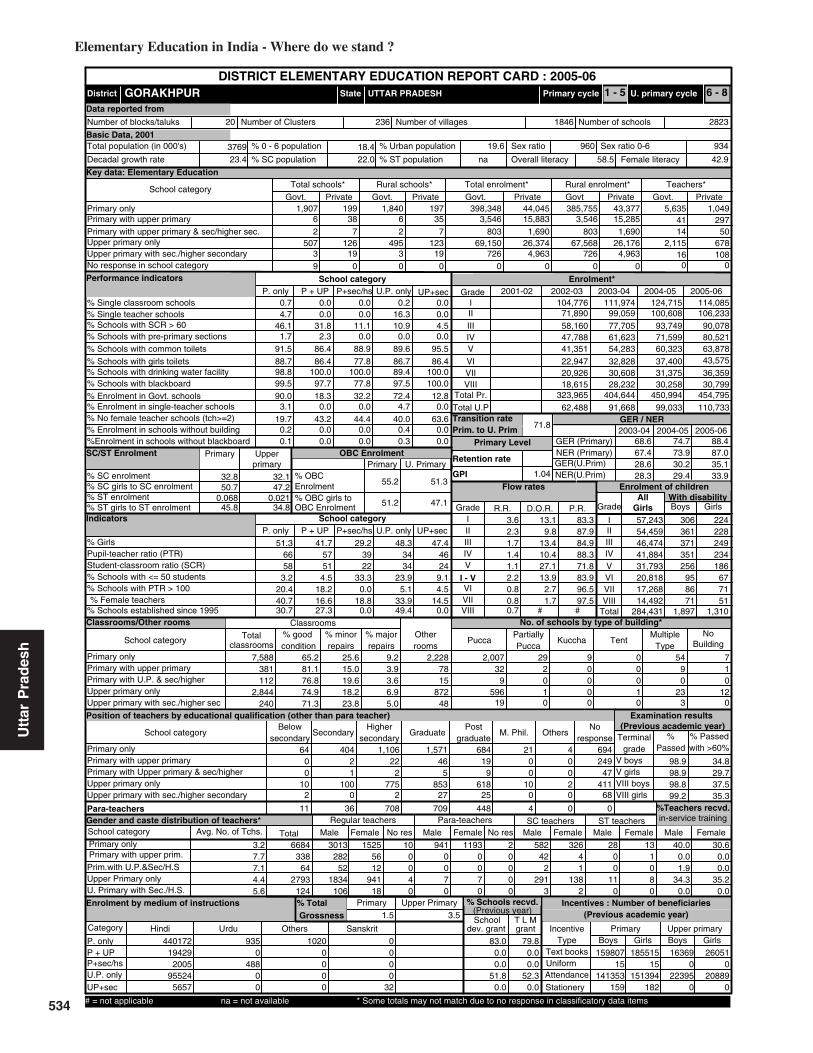
534
Elementary Education in India - Where do we stand ?
0.0210.068
32.8 32.1
Key data: Elementary Education
3769
GORAKHPUR
(Previous academic year)
(Previous year)
Gender and caste distribution of teachers*
No. of schools by type of building*
BoysWith disability
Flow rates
Primary Level
Enrolment*
Number of schools
Grade
GER / NER
School category
Primary Upper primaryBoys Boys GirlsGirls
IncentiveType
School categoryMultiple
TypeKuccha
PartiallyPucca
PuccaTotal % good condition
Otherrooms
TentNo
Building
Classrooms
Belowsecondary
Highersecondary
Postgraduate
M. Phil.GraduateSecondarySchool category OthersNo
response
ST teachers
Total Male Female No res Male Female No res Male Female Male FemaleSC teachers
Text booksUniformAttendanceStationery
% Passed
Avg. No. of Tchs.
%
Female literacyOverall literacy
dev. grant grantSchool T L M
Male Female
IVV
IIIIII
Grade R.R. D.O.R. P.R.
VIIVI
# #
I - V
Enrolment by medium of instructions
Examination results
Retention rate
GPI
Primary cycle U. primary cycleState
DISTRICT ELEMENTARY EDUCATION REPORT CARD : 2005-06
GirlsGrade
IIIIIIIVVVI
VIII
AllGirls
Total
VII
% TotalGrossness
School category
62
5073
38 67 2
12619
4953
9 0 0
1,907 19935 3,546
7 803123 69,150
19 7260 0
1,840 197 385,755 43,37715,883 3,546 15,285
1,690 803 1,69026,374 67,568 26,176
0 0 04,963 726 4,963
398,348 44,045 5,63541
1,049297
P + UP P+sec/hs U.P. only UP+sec
School categoryP. only
0.7 0.0 0.0 0.2 0.04.7
Number of Clusters 28231846
% Schools with SCR > 600.0 0.0 16.3 0.0
46.1 31.8 11.1 10.9 4.5% Schools with pre-primary sections 1.7 2.3 0.0 0.0 0.0% Schools with common toilets 91.5 86.4 88.9 89.6 95.5
% Schools with girls toilets 88.7 86.4 77.8 86.7 86.4% Schools with drinking water facility 98.8 100.0 100.0 89.4 100.0
% Enrolment in Govt. schools 90.0 18.3 32.2 72.4 12.899.5 97.7 77.8 97.5 100.0
% No female teacher schools (tch>=2) 19.7 43.2 44.4 40.0 63.63.1 0.0 0.0 4.7 0.0
0.2 0.0 0.0 0.4 0.0%Enrolment in schools without blackboard 0.1 0.0 0.0 0.3 0.0
2001-02 2002-03 2003-04 2004-05 2005-06IIIIIIIVV
VIVII
Total U.P
114,085106,233
90,07880,52163,87843,575
36,359
124,715100,608
93,74971,59960,323
37,40031,375
111,97499,05977,70561,62354,283
32,82830,608
104,77671,89058,16047,78841,351
22,94720,926
110,73399,03391,66862,488
68.6
28.6
74.7
30.2
88.4
35.1
29.2
33.30.0
57,24354,45946,47441,88431,79320,81817,26814,492
284,431
306361371351256
958671
1,897
224228249234186
677151
1,310
7,588
classrooms
381112
2,844240
65.281.176.874.971.3
25.615.0
9.2
19.618.223.8
3.93.66.95.0
7815
87248
2,228 2,007 29 9 0 54 732 2 0 0 9 1
9 0 0 0 0 0596 1 0 1 23 12
19 0 0 0 3 0
64 404 1,106 1,571 684 21 40 2 22 46 19 0 0 2490 1 2 5 9 0 0 47
10 100 775 853 618 10 2 4112 0 2 27 25 0 0 68
11 36 708 709 448 4 0 0
3013282
521834
106
5612
94118
1525 10 941 1193 2 582 326 28 130040
0070
0070
0000
422
2913
41
1382
00
110
1080
Terminalgrade Passed
VIII boysV girlsV boys
VIII girls
694 with >60%
40.06684338
642793
124
0.01.9
34.30.0
30.60.00.0
35.20.0
440172Hindi Urdu Others Sanskrit
194292005
955245657
9350
48800
10200000
0000
32
% Schools recvd.
83.00.00.0
51.80.0
79.80.00.0
52.30.0
15980715
141353159
163690
223950
18551515
151394182
260510
208890
3.27.77.14.45.6
3.62.31.71.4
0.80.80.7
1.12.2
71.8
1.04
2005-062004-052003-04
UTTAR PRADESH
18.8
Upper PrimaryPrimary
Sex ratio Sex ratio 0-6
20 236
VIII0.0
Enrolment of children
VIII 18,615 28,232 30,258 30,799Total Pr. 323,965 404,644 450,994 454,795
1 - 5 6 - 8
2,115 67816 108
0 0
14 50
%Teachers recvd.in-service training
Total schools* Rural schools* Total enrolment* Rural enrolment* Teachers*
1.5 3.5
87.0
33.9
67.4 73.9
28.3 29.4% SC enrolment% SC girls to SC enrolment% ST enrolment
50.7 47.2
45.8 34.8
55.2
51.2
51.3
47.1
Position of teachers by educational qualification (other than para teacher)
(Previous academic year)Incentives : Number of beneficiaries
% ST girls to ST enrolment
% Girls
Number of villages
% 0 - 6 population
% SC population % ST population
% Urban population
% Schools with blackboard
% Enrolment in single-teacher schools
% Enrolment in schools without building
Primary Upperprimary
OBC EnrolmentPrimary U. Primary
% OBCEnrolment% OBC girls toOBC Enrolment
Pupil-teacher ratio (PTR)Student-classroom ratio (SCR)% Schools with <= 50 students% Schools with PTR > 100% Female teachers
% Schools established since 1995
Regular teachers Para-teachers
% minorrepairs
% majorrepairs
# = not applicable na = not available * Some totals may not match due to no response in classificatory data items
13.1 83.39.8 87.9
13.4 84.910.4 88.327.1 71.813.9 83.9
2.7 96.51.7 97.5
2239
51.36658
3.220.440.730.7
41.75751
4.518.216.627.3
48.33434
23.95.1
33.949.4
47.44624
9.14.5
14.50.0
23.4 22.0 na 58.5 42.9
93496019.618.4
Category
PrivateGovt.PrivateGovtPrivateGovt.PrivateGovt.PrivateGovt.
Total population (in 000's)
Number of blocks/taluks
District
Decadal growth rate
Primary onlyPrimary with upper primaryPrimary with upper primary & sec/higher sec.Upper primary onlyUpper primary with sec./higher secondary
% Single classroom schools% Single teacher schools
P + UP P+sec/hs U.P. only UP+secP. only
No response in school category
Primary with upper primaryPrimary with U.P. & sec/higherUpper primary onlyUpper primary with sec./higher sec
Primary only
Primary onlyPrimary with upper primaryPrimary with Upper primary & sec/higherUpper primary only
Para-teachers
School category
Upper primary with sec./higher secondary
Primary onlyPrimary with upper prim.
P. onlyP + UPP+sec/hsU.P. onlyUP+sec
NER(U.Prim)GER(U.Prim)NER (Primary)GER (Primary)
Transition ratePrim. to U. Prim
SC/ST Enrolment
Indicators
Classrooms/Other rooms
Prim.with U.P.&Sec/H.SUpper Primary onlyU. Primary with Sec./H.S.
Basic Data, 2001
Data reported from
Performance indicators
98.9 34.898.9 29.798.8 37.599.2 35.3
Utt
ar P
rad
esh
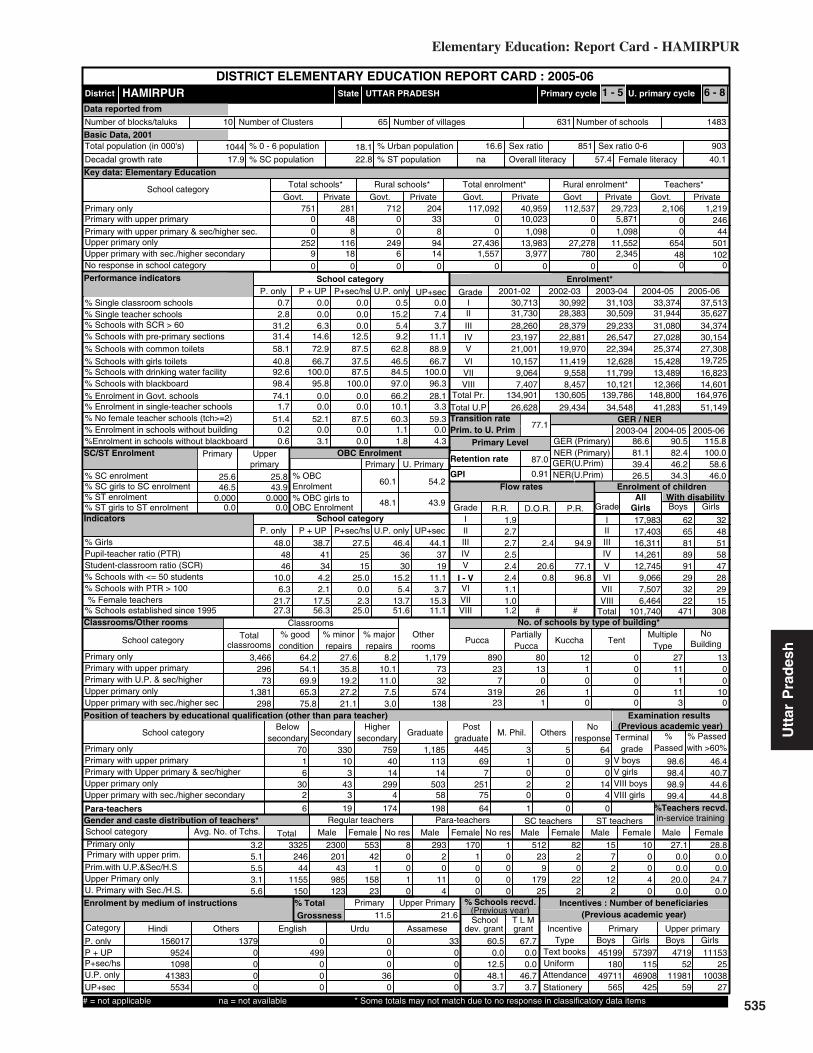
535
Elementary Education: Report Card - HAMIRPUR
Utt
ar P
rad
esh
0.0000.000
25.6 25.8
Key data: Elementary Education
1044
HAMIRPUR
(Previous academic year)
(Previous year)
Gender and caste distribution of teachers*
No. of schools by type of building*
BoysWith disability
Flow rates
Primary Level
Enrolment*
Number of schools
Grade
GER / NER
School category
Primary Upper primaryBoys Boys GirlsGirls
IncentiveType
School categoryMultiple
TypeKuccha
PartiallyPucca
PuccaTotal % good condition
Otherrooms
TentNo
Building
Classrooms
Belowsecondary
Highersecondary
Postgraduate
M. Phil.GraduateSecondarySchool category OthersNo
response
ST teachers
Total Male Female No res Male Female No res Male Female Male FemaleSC teachers
Text booksUniformAttendanceStationery
% Passed
Avg. No. of Tchs.
%
Female literacyOverall literacy
dev. grant grantSchool T L M
Male Female
IVV
IIIIII
Grade R.R. D.O.R. P.R.
VIIVI
# #
I - V
Enrolment by medium of instructions
Examination results
Retention rate
GPI
Primary cycle U. primary cycleState
DISTRICT ELEMENTARY EDUCATION REPORT CARD : 2005-06
GirlsGrade
IIIIIIIVVVI
VIII
AllGirls
Total
VII
% TotalGrossness
School category
00
2529
48 08 0
11618
2496
0 0 0
751 28133 0
8 094 27,43614 1,557
0 0
712 204 112,537 29,72310,023 0 5,871
1,098 0 1,09813,983 27,278 11,552
0 0 03,977 780 2,345
117,092 40,959 2,1060
1,219246
P + UP P+sec/hs U.P. only UP+sec
School categoryP. only
0.7 0.0 0.0 0.5 0.02.8
Number of Clusters 1483631
% Schools with SCR > 600.0 0.0 15.2 7.4
31.2 6.3 0.0 5.4 3.7% Schools with pre-primary sections 31.4 14.6 12.5 9.2 11.1% Schools with common toilets 58.1 72.9 87.5 62.8 88.9
% Schools with girls toilets 40.8 66.7 37.5 46.5 66.7% Schools with drinking water facility 92.6 100.0 87.5 84.5 100.0
% Enrolment in Govt. schools 74.1 0.0 0.0 66.2 28.198.4 95.8 100.0 97.0 96.3
% No female teacher schools (tch>=2) 51.4 52.1 87.5 60.3 59.31.7 0.0 0.0 10.1 3.3
0.2 0.0 0.0 1.1 0.0%Enrolment in schools without blackboard 0.6 3.1 0.0 1.8 4.3
2001-02 2002-03 2003-04 2004-05 2005-06IIIIIIIVV
VIVII
Total U.P
37,51335,62734,37430,15427,30819,725
16,823
33,37431,94431,08027,02825,374
15,42813,489
31,10330,50929,23326,54722,394
12,62811,799
30,99228,38328,37922,88119,970
11,4199,558
30,71331,73028,26023,19721,001
10,1579,064
51,14941,28334,54829,43426,628
86.6
39.4
90.5
46.2
115.8
58.6
27.5
25.00.0
17,98317,40316,31114,26112,745
9,0667,5076,464
101,740
6265818991293222
471
3248515847282915
308
3,466
classrooms
29673
1,381298
64.254.169.965.375.8
27.635.8
8.2
19.227.221.1
10.111.0
7.53.0
7332
574138
1,179 890 80 12 0 27 1323 13 1 0 11 0
7 0 0 0 1 0319 26 1 0 11 10
23 1 0 0 3 0
70 330 759 1,185 445 3 51 10 40 113 69 1 0 96 3 14 14 7 0 0 0
30 43 299 503 251 2 2 142 3 4 58 75 0 0 4
6 19 174 198 64 1 0 0
2300201
43985123
421
15823
553 8 293 170 1 512 82 15 100010
20
114
1000
0000
239
17925
20
222
72
122
0040
Terminalgrade Passed
VIII boysV girlsV boys
VIII girls
64 with >60%
27.13325246
441155
150
0.00.0
20.00.0
28.80.00.0
24.70.0
156017Hindi Others English Urdu Assamese
95241098
413835534
13790000
0499
000
000
360
330000
% Schools recvd.
60.50.0
12.548.1
3.7
67.70.00.0
46.73.7
45199180
49711565
471952
1198159
57397115
46908425
1115325
1003827
3.25.15.53.15.6
1.92.72.72.5
1.11.01.2
2.42.4
87.0
77.1
0.91
2005-062004-052003-04
UTTAR PRADESH
2.3
Upper PrimaryPrimary
Sex ratio Sex ratio 0-6
10 65
VIII25.0
Enrolment of children
7,407VIII 8,457 10,121 12,366 14,601Total Pr. 134,901 130,605 139,786 148,800 164,976
1 - 5 6 - 8
654 50148 102
0 0
0 44
%Teachers recvd.in-service training
Total schools* Rural schools* Total enrolment* Rural enrolment* Teachers*
11.5 21.6
100.0
46.0
81.1 82.4
26.5 34.3% SC enrolment% SC girls to SC enrolment% ST enrolment
46.5 43.9
0.0 0.0
60.1
48.1
54.2
43.9
Position of teachers by educational qualification (other than para teacher)
(Previous academic year)Incentives : Number of beneficiaries
% ST girls to ST enrolment
% Girls
Number of villages
% 0 - 6 population
% SC population % ST population
% Urban population
% Schools with blackboard
% Enrolment in single-teacher schools
% Enrolment in schools without building
Primary Upperprimary
OBC EnrolmentPrimary U. Primary
% OBCEnrolment% OBC girls toOBC Enrolment
Pupil-teacher ratio (PTR)Student-classroom ratio (SCR)% Schools with <= 50 students% Schools with PTR > 100% Female teachers
% Schools established since 1995
Regular teachers Para-teachers
% minorrepairs
% majorrepairs
# = not applicable na = not available * Some totals may not match due to no response in classificatory data items
2.4 94.9
20.6 77.10.8 96.8
1525
48.04846
10.06.3
21.727.3
38.74134
4.22.1
17.556.3
46.43630
15.25.4
13.751.6
44.13719
11.13.7
15.311.1
17.9 22.8 na 57.4 40.1
90385116.618.1
Category
PrivateGovt.PrivateGovtPrivateGovt.PrivateGovt.PrivateGovt.
Total population (in 000's)
Number of blocks/taluks
District
Decadal growth rate
Primary onlyPrimary with upper primaryPrimary with upper primary & sec/higher sec.Upper primary onlyUpper primary with sec./higher secondary
% Single classroom schools% Single teacher schools
P + UP P+sec/hs U.P. only UP+secP. only
No response in school category
Primary with upper primaryPrimary with U.P. & sec/higherUpper primary onlyUpper primary with sec./higher sec
Primary only
Primary onlyPrimary with upper primaryPrimary with Upper primary & sec/higherUpper primary only
Para-teachers
School category
Upper primary with sec./higher secondary
Primary onlyPrimary with upper prim.
P. onlyP + UPP+sec/hsU.P. onlyUP+sec
NER(U.Prim)GER(U.Prim)NER (Primary)GER (Primary)
Transition ratePrim. to U. Prim
SC/ST Enrolment
Indicators
Classrooms/Other rooms
Prim.with U.P.&Sec/H.SUpper Primary onlyU. Primary with Sec./H.S.
Basic Data, 2001
Data reported from
Performance indicators
98.6 46.498.4 40.798.9 44.699.4 44.8

536
Elementary Education in India - Where do we stand ?
0.0000.000
35.6 36.2
Key data: Elementary Education
3398
HARDOI
(Previous academic year)
(Previous year)
Gender and caste distribution of teachers*
No. of schools by type of building*
BoysWith disability
Flow rates
Primary Level
Enrolment*
Number of schools
Grade
GER / NER
School category
Primary Upper primaryBoys Boys GirlsGirls
IncentiveType
School categoryMultiple
TypeKuccha
PartiallyPucca
PuccaTotal % good condition
Otherrooms
TentNo
Building
Classrooms
Belowsecondary
Highersecondary
Postgraduate
M. Phil.GraduateSecondarySchool category OthersNo
response
ST teachers
Total Male Female No res Male Female No res Male Female Male FemaleSC teachers
Text booksUniformAttendanceStationery
% Passed
Avg. No. of Tchs.
%
Female literacyOverall literacy
dev. grant grantSchool T L M
Male Female
IVV
IIIIII
Grade R.R. D.O.R. P.R.
VIIVI
# #
I - V
Enrolment by medium of instructions
Examination results
Retention rate
GPI
Primary cycle U. primary cycleState
DISTRICT ELEMENTARY EDUCATION REPORT CARD : 2005-06
GirlsGrade
IIIIIIIVVVI
VIII
AllGirls
Total
VII
% TotalGrossness
School category
00
5585
45 07 0
12622
5422
2 0 0
2,398 74024 0
5 0112 83,744
22 1,4300 0
2,312 599 441,020 166,37619,187 0 9,210
3,922 0 2,03830,093 82,187 26,629
0 0 05,884 550 5,884
458,915 200,994 5,9550
3,230349
P + UP P+sec/hs U.P. only UP+sec
School categoryP. only
0.2 0.0 0.0 0.0 0.010.9
Number of Clusters 39032188
% Schools with SCR > 600.0 0.0 19.7 0.0
48.5 44.4 0.0 19.3 22.2% Schools with pre-primary sections 4.1 2.2 0.0 0.3 0.0% Schools with common toilets 74.0 84.4 85.7 80.7 92.6
% Schools with girls toilets 65.6 84.4 85.7 70.2 88.9% Schools with drinking water facility 98.8 100.0 100.0 93.6 100.0
% Enrolment in Govt. schools 69.5 0.0 0.0 73.6 19.6100.0 100.0 100.0 100.0 100.0
% No female teacher schools (tch>=2) 40.9 42.2 57.1 49.1 74.17.1 0.0 0.0 12.3 0.0
0.0 0.0 0.0 0.0 0.0%Enrolment in schools without blackboard 0.0 0.0 0.0 0.0 0.0
2001-02 2002-03 2003-04 2004-05 2005-06IIIIIIIVV
VIVII
Total U.P
146,566149,945139,185129,462108,823
49,810
44,643
153,054139,884134,338116,905100,558
37,22229,133
145,249140,930127,630110,631
99,566
37,04632,048
161,464126,503115,057
99,21883,510
34,23625,615
134,435110,349103,625
83,28175,304
25,14420,497
130,18892,03196,63281,59362,696
117.3
33.4
118.4
31.1
145.3
45.8
78.8
0.028.6
67,81669,77164,21859,82949,15421,26718,96914,750
365,774
238352361390412117100
772,047
178253291245242
728839
1,408
10,725
classrooms
378133
2,858256
58.740.791.764.875.8
36.755.6
4.6
8.329.523.4
3.70.05.70.8
10460
1,05785
3,413 3,127 3 0 4 3 143 2 0 0 0 0
7 0 0 0 0 0683 1 0 0 0 0
27 0 0 0 0 0
172 600 1,629 3,724 838 2 211 4 37 229 75 0 0 10 0 7 29 3 0 0 0
29 114 746 1,027 341 2 0 50 1 13 78 35 0 0 1
22 45 973 902 227 0 0 0
5331224
271818
111
12212
44617
1666 0 1328 860 0 2042 437 10 101000
2050
0000
0000
7615
51949
184
795
0070
1030
Terminalgrade Passed
VIII boysV girlsV boys
VIII girls
11 with >60%
33.79185349
392269
128
2.70.0
45.41.8
33.71.60.0
56.10.0
657640Hindi Others English Urdu Bengali
185823922
1133457314
12500
4920
5190000
1430000
1230000
% Schools recvd.
62.424.4
0.043.711.1
30.46.70.0
19.73.7
181782319
158345277
2018348
2326934
191884232
140168213
2735410
1678924
2.97.85.63.34.7
0.20.20.30.3
1.01.11.1
0.30.3
80.7
49.2
0.86
2005-062004-052003-04
UTTAR PRADESH
30.8
Upper PrimaryPrimary
Sex ratio Sex ratio 0-6
25 193
VIII14.3
Enrolment of children
17,055VIII 21,742 27,538 25,676 35,735Total Pr. 506,994 585,752 624,006 644,739 673,981
1 - 5 6 - 8
1,712 55722 106
0 0
0 39
%Teachers recvd.in-service training
Total schools* Rural schools* Total enrolment* Rural enrolment* Teachers*
3.1 24.1
100.0
34.831.6 25.0% SC enrolment% SC girls to SC enrolment% ST enrolment
46.3 42.0
0.0 0.0
42.2
45.6
37.0
40.7
Position of teachers by educational qualification (other than para teacher)
(Previous academic year)Incentives : Number of beneficiaries
% ST girls to ST enrolment
% Girls
Number of villages
% 0 - 6 population
% SC population % ST population
% Urban population
% Schools with blackboard
% Enrolment in single-teacher schools
% Enrolment in schools without building
Primary Upperprimary
OBC EnrolmentPrimary U. Primary
% OBCEnrolment% OBC girls toOBC Enrolment
Pupil-teacher ratio (PTR)Student-classroom ratio (SCR)% Schools with <= 50 students% Schools with PTR > 100% Female teachers
% Schools established since 1995
Regular teachers Para-teachers
% minorrepairs
% majorrepairs
# = not applicable na = not available * Some totals may not match due to no response in classificatory data items
2.0 97.80.6 99.23.6 96.16.9 92.8
50.5 49.210.5 89.3
29101
46.17262
5.125.727.530.7
42.45551
0.017.835.015.6
41.55040
13.012.719.740.4
40.85729
0.022.213.3
3.7
23.7 31.4 na 51.9 36.8
91484412.019.4
Category
PrivateGovt.PrivateGovtPrivateGovt.PrivateGovt.PrivateGovt.
Total population (in 000's)
Number of blocks/taluks
District
Decadal growth rate
Primary onlyPrimary with upper primaryPrimary with upper primary & sec/higher sec.Upper primary onlyUpper primary with sec./higher secondary
% Single classroom schools% Single teacher schools
P + UP P+sec/hs U.P. only UP+secP. only
No response in school category
Primary with upper primaryPrimary with U.P. & sec/higherUpper primary onlyUpper primary with sec./higher sec
Primary only
Primary onlyPrimary with upper primaryPrimary with Upper primary & sec/higherUpper primary only
Para-teachers
School category
Upper primary with sec./higher secondary
Primary onlyPrimary with upper prim.
P. onlyP + UPP+sec/hsU.P. onlyUP+sec
NER(U.Prim)GER(U.Prim)NER (Primary)GER (Primary)
Transition ratePrim. to U. Prim
SC/ST Enrolment
Indicators
Classrooms/Other rooms
Prim.with U.P.&Sec/H.SUpper Primary onlyU. Primary with Sec./H.S.
Basic Data, 2001
Data reported from
Performance indicators
98.7 16.898.7 15.298.0 16.798.1 17.2
Utt
ar P
rad
esh

537
Elementary Education: Report Card - HATHRAS
Utt
ar P
rad
esh
26.6 27.9
Key data: Elementary Education
1336
HATHRAS
(Previous academic year)
(Previous year)
Gender and caste distribution of teachers*
No. of schools by type of building*
BoysWith disability
Flow rates
Primary Level
Enrolment*
Number of schools
Grade
GER / NER
School category
Primary Upper primaryBoys Boys GirlsGirls
IncentiveType
School categoryMultiple
TypeKuccha
PartiallyPucca
PuccaTotal % good condition
Otherrooms
TentNo
Building
Classrooms
Belowsecondary
Highersecondary
Postgraduate
M. Phil.GraduateSecondarySchool category OthersNo
response
ST teachers
Total Male Female No res Male Female No res Male Female Male FemaleSC teachers
Text booksUniformAttendanceStationery
% Passed
Avg. No. of Tchs.
%
Female literacyOverall literacy
dev. grant grantSchool T L M
Male Female
IVV
IIIIII
Grade R.R. D.O.R. P.R.
VIIVI
# #
I - V
Enrolment by medium of instructions
Examination results
Retention rate
GPI
Primary cycle U. primary cycleState
DISTRICT ELEMENTARY EDUCATION REPORT CARD : 2005-06
GirlsGrade
IIIIIIIVVVI
VIII
AllGirls
Total
VII
% TotalGrossness
School category
4114
1941
84 3726 145421
1911
0 0 0
952 38479 5,56625 3,51752 23,72717 423
0 0
927 356 147,325 67,57722,722 4,942 21,969
6,161 3,517 6,1368,893 23,341 8,737
0 0 07,159 423 5,812
151,433 72,943 3,068132
919218
P + UP P+sec/hs U.P. only UP+sec
School categoryP. only
2.1 3.2 0.0 0.0 0.03.5
Number of Clusters 1771926
% Schools with SCR > 600.8 7.5 4.8 9.1
26.5 16.8 10.0 8.9 9.1% Schools with pre-primary sections 14.1 24.8 25.0 6.0 22.7% Schools with common toilets 93.4 91.2 90.0 93.5 95.5
% Schools with girls toilets 85.0 88.0 82.5 89.5 90.9% Schools with drinking water facility 99.9 100.0 100.0 100.0 100.0
% Enrolment in Govt. schools 67.5 19.7 36.3 72.7 5.6100.0 97.6 100.0 100.0 100.0
% No female teacher schools (tch>=2) 37.8 56.0 50.0 65.3 63.63.2 0.1 5.8 5.1 9.4
0.0 0.0 0.0 0.0 0.0%Enrolment in schools without blackboard 0.0 1.9 0.0 0.0 0.0
2001-02 2002-03 2003-04 2004-05 2005-06IIIIIIIVV
VIVII
Total U.P
60,64455,46349,89643,07236,64720,743
18,847
47,11438,25732,51825,60321,876
11,69710,262
43,02835,35129,85123,63420,115
10,1518,843
34,22924,04520,49316,63613,863
7,8925,796
56,82230,96626,76618,668
73.4
23.8
78.5
27.0
134.7
50.9
45.9
12.530.0
28,11726,32724,10020,43017,062
8,9238,0317,191
140,181
163221193171158
967162
1,135
90153128129
78514736
712
4,918
classrooms
645371892301
84.281.488.985.872.1
14.718.6
1.0
11.112.824.9
0.00.01.53.0
15284
32492
1,343 1,292 4 0 1 12 27113 0 0 0 1 11
37 0 0 0 1 2240 1 0 0 1 6
22 0 0 0 0 0
349 615 867 560 450 7 432 13 87 65 127 0 0 5
0 8 35 11 46 0 0 076 82 268 108 157 2 0 1
4 6 4 6 30 1 0 0
262 222 472 148 48 1 0 0
2098261
72581
40
6828
11311
765 0 608 516 0 417 252 33 160000
12320
9710
0000
328
1116
93
134
2030
0000
Terminalgrade Passed
VIII boysV girlsV boys
VIII girls
11 with >60%
22.73987350110697
51
13.212.034.3
2.5
22.410.417.139.5
0.0
212154Hindi Others Sanskrit Bengali English
255789564
303147130
101732465
1141884
211
495002
241
3800000
73206
020
% Schools recvd.
52.517.620.058.5
4.5
53.215.225.060.1
4.5
54638264
2483090
453047
561618
58511307
2294561
668856
39328
3.02.82.82.82.3
4.94.03.92.9
2.94.85.2
2.63.9
93.3
0.89
2005-062004-052003-04
UTTAR PRADESH
31.8
Upper PrimaryPrimary
Sex ratio Sex ratio 0-6
9 77
VIII37.5
Enrolment of children
VIII 4,980 7,772 9,007 17,232Total Pr. 109,266 151,979 165,368 245,722
1 - 5 6 - 8
577 1203 480 0
39 71
%Teachers recvd.in-service training
Total schools* Rural schools* Total enrolment* Rural enrolment* Teachers*
7.6 28.0
100.0
36.6
67.6 72.2
20.8 23.2% SC enrolment% SC girls to SC enrolment% ST enrolment
46.2 42.63.5
47.8 37.1
31.6
46.9
32.4
41.5
Position of teachers by educational qualification (other than para teacher)
(Previous academic year)Incentives : Number of beneficiaries
% ST girls to ST enrolment
% Girls
Number of villages
% 0 - 6 population
% SC population % ST population
% Urban population
% Schools with blackboard
% Enrolment in single-teacher schools
% Enrolment in schools without building
Primary Upperprimary
OBC EnrolmentPrimary U. Primary
% OBCEnrolment% OBC girls toOBC Enrolment
Pupil-teacher ratio (PTR)Student-classroom ratio (SCR)% Schools with <= 50 students% Schools with PTR > 100% Female teachers
% Schools established since 1995
Regular teachers Para-teachers
% minorrepairs
% majorrepairs
# = not applicable na = not available * Some totals may not match due to no response in classificatory data items
4.1 93.32688
47.65646
6.714.432.138.2
39.08144
5.626.422.042.4
44.14737
14.912.116.447.2
47.6149
250.0
54.521.613.6
18.3 25.2 na 62.5 46.3
88685819.819.1
Category
PrivateGovt.PrivateGovtPrivateGovt.PrivateGovt.PrivateGovt.
Total population (in 000's)
Number of blocks/taluks
District
Decadal growth rate
Primary onlyPrimary with upper primaryPrimary with upper primary & sec/higher sec.Upper primary onlyUpper primary with sec./higher secondary
% Single classroom schools% Single teacher schools
P + UP P+sec/hs U.P. only UP+secP. only
No response in school category
Primary with upper primaryPrimary with U.P. & sec/higherUpper primary onlyUpper primary with sec./higher sec
Primary only
Primary onlyPrimary with upper primaryPrimary with Upper primary & sec/higherUpper primary only
Para-teachers
School category
Upper primary with sec./higher secondary
Primary onlyPrimary with upper prim.
P. onlyP + UPP+sec/hsU.P. onlyUP+sec
NER(U.Prim)GER(U.Prim)NER (Primary)GER (Primary)
Transition ratePrim. to U. Prim
3.3
SC/ST Enrolment
Indicators
Classrooms/Other rooms
Prim.with U.P.&Sec/H.SUpper Primary onlyU. Primary with Sec./H.S.
Basic Data, 2001
Data reported from
Performance indicators
97.6 41.897.3 37.495.7 35.291.4 39.5
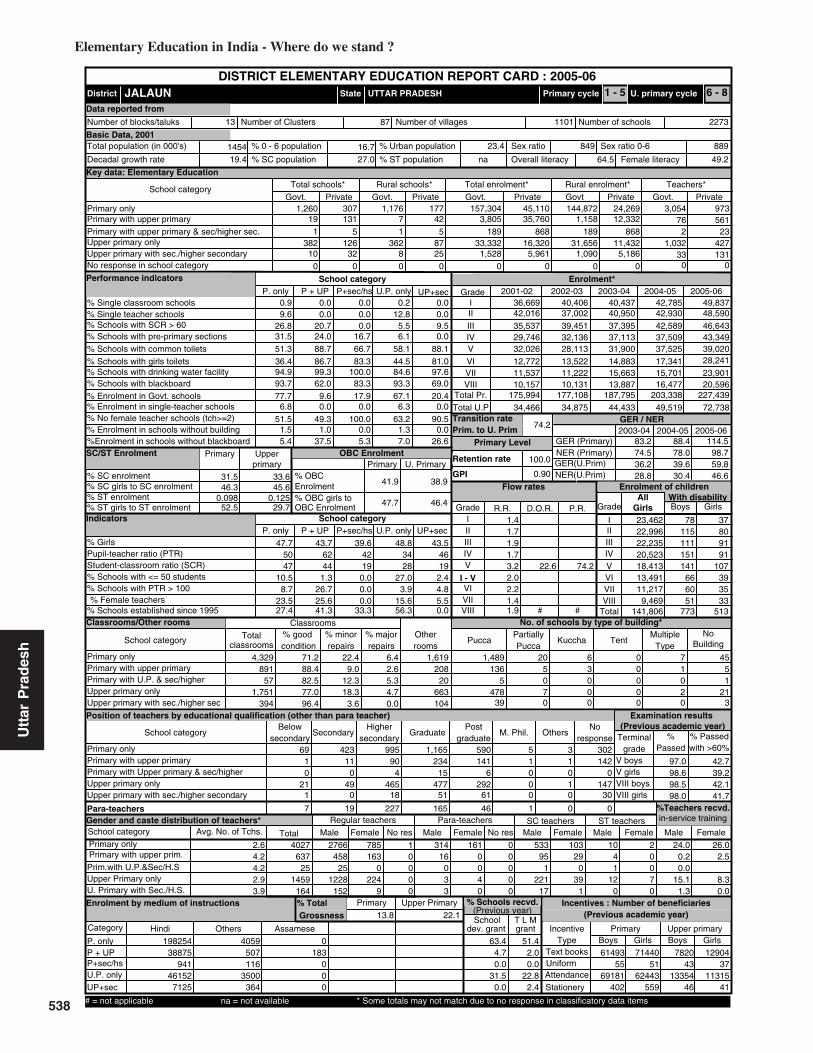
538
Elementary Education in India - Where do we stand ?
0.1250.098
31.5 33.6
Key data: Elementary Education
1454
JALAUN
(Previous academic year)
(Previous year)
Gender and caste distribution of teachers*
No. of schools by type of building*
BoysWith disability
Flow rates
Primary Level
Enrolment*
Number of schools
Grade
GER / NER
School category
Primary Upper primaryBoys Boys GirlsGirls
IncentiveType
School categoryMultiple
TypeKuccha
PartiallyPucca
PuccaTotal % good condition
Otherrooms
TentNo
Building
Classrooms
Belowsecondary
Highersecondary
Postgraduate
M. Phil.GraduateSecondarySchool category OthersNo
response
ST teachers
Total Male Female No res Male Female No res Male Female Male FemaleSC teachers
Text booksUniformAttendanceStationery
% Passed
Avg. No. of Tchs.
%
Female literacyOverall literacy
dev. grant grantSchool T L M
Male Female
IVV
IIIIII
Grade R.R. D.O.R. P.R.
VIIVI
# #
I - V
Enrolment by medium of instructions
Examination results
Retention rate
GPI
Primary cycle U. primary cycleState
DISTRICT ELEMENTARY EDUCATION REPORT CARD : 2005-06
GirlsGrade
IIIIIIIVVVI
VIII
AllGirls
Total
VII
% TotalGrossness
School category
191
38210
131 75 1
12632
3628
0 0 0
1,260 30742 3,805
5 18987 33,33225 1,528
0 0
1,176 177 144,872 24,26935,760 1,158 12,332
868 189 86816,320 31,656 11,432
0 0 05,961 1,090 5,186
157,304 45,110 3,05476
973561
P + UP P+sec/hs U.P. only UP+sec
School categoryP. only
0.9 0.0 0.0 0.2 0.09.6
Number of Clusters 22731101
% Schools with SCR > 600.0 0.0 12.8 0.0
26.8 20.7 0.0 5.5 9.5% Schools with pre-primary sections 31.5 24.0 16.7 6.1 0.0% Schools with common toilets 51.3 88.7 66.7 58.1 88.1
% Schools with girls toilets 36.4 86.7 83.3 44.5 81.0% Schools with drinking water facility 94.9 99.3 100.0 84.6 97.6
% Enrolment in Govt. schools 77.7 9.6 17.9 67.1 20.493.7 62.0 83.3 93.3 69.0
% No female teacher schools (tch>=2) 51.5 49.3 100.0 63.2 90.56.8 0.0 0.0 6.3 0.0
1.5 1.0 0.0 1.3 0.0%Enrolment in schools without blackboard 5.4 37.5 5.3 7.0 26.6
2001-02 2002-03 2003-04 2004-05 2005-06IIIIIIIVV
VIVII
Total U.P
49,83748,59046,64343,34939,02028,241
23,901
42,78542,93042,58937,50937,525
17,34115,701
40,43740,95037,39537,11331,900
14,88315,663
40,40637,00239,45132,13628,113
13,52211,222
36,66942,01635,53729,74632,026
12,77211,537
72,73849,51944,43334,87534,466
83.2
36.2
88.4
39.6
114.5
59.8
39.6
0.00.0
23,46222,99622,23520,52318,41313,49111,217
9,469141,806
78115111151141
666051
773
37809191
107393533
513
4,329
classrooms
89157
1,751394
71.288.482.577.096.4
22.49.0
6.4
12.318.3
3.6
2.65.34.70.0
20820
663104
1,619 1,489 20 6 0 7 45136 5 3 0 1 5
5 0 0 0 0 1478 7 0 0 2 21
39 0 0 0 0 3
69 423 995 1,165 590 5 31 11 90 234 141 1 1 1420 0 4 15 6 0 0 0
21 49 465 477 292 0 1 1471 0 18 51 61 0 0 30
7 19 227 165 46 1 0 0
2766458
251228
152
1630
2249
785 1 314 161 0 533 103 10 20000
16033
0040
0000
951
22117
290
391
41
120
0070
Terminalgrade Passed
VIII boysV girlsV boys
VIII girls
302 with >60%
24.04027637
251459
164
0.20.0
15.11.3
26.02.5
8.30.0
198254Hindi Others Assamese
38875941
461527125
4059507116
3500364
0183
000
% Schools recvd.
63.44.70.0
31.50.0
51.42.00.0
22.82.4
6149355
69181402
782043
1335446
7144051
62443559
1290437
1131541
2.64.24.22.93.9
1.41.71.91.7
2.21.41.9
3.22.0
100.0
74.2
0.90
2005-062004-052003-04
UTTAR PRADESH
0.0
Upper PrimaryPrimary
Sex ratio Sex ratio 0-6
13 87
VIII33.3
Enrolment of children
10,157VIII 10,131 13,887 16,477 20,596Total Pr. 175,994 177,108 187,795 203,338 227,439
1 - 5 6 - 8
1,032 42733 131
0 0
2 23
%Teachers recvd.in-service training
Total schools* Rural schools* Total enrolment* Rural enrolment* Teachers*
13.8 22.1
98.7
46.6
74.5 78.0
28.8 30.4% SC enrolment% SC girls to SC enrolment% ST enrolment
46.3 45.6
52.5 29.7
41.9
47.7
38.9
46.4
Position of teachers by educational qualification (other than para teacher)
(Previous academic year)Incentives : Number of beneficiaries
% ST girls to ST enrolment
% Girls
Number of villages
% 0 - 6 population
% SC population % ST population
% Urban population
% Schools with blackboard
% Enrolment in single-teacher schools
% Enrolment in schools without building
Primary Upperprimary
OBC EnrolmentPrimary U. Primary
% OBCEnrolment% OBC girls toOBC Enrolment
Pupil-teacher ratio (PTR)Student-classroom ratio (SCR)% Schools with <= 50 students% Schools with PTR > 100% Female teachers
% Schools established since 1995
Regular teachers Para-teachers
% minorrepairs
% majorrepairs
# = not applicable na = not available * Some totals may not match due to no response in classificatory data items
22.6 74.21942
47.75047
10.58.7
23.527.4
43.76244
1.326.725.641.3
48.83428
27.03.9
15.656.3
43.54619
2.44.85.50.0
19.4 27.0 na 64.5 49.2
88984923.416.7
Category
PrivateGovt.PrivateGovtPrivateGovt.PrivateGovt.PrivateGovt.
Total population (in 000's)
Number of blocks/taluks
District
Decadal growth rate
Primary onlyPrimary with upper primaryPrimary with upper primary & sec/higher sec.Upper primary onlyUpper primary with sec./higher secondary
% Single classroom schools% Single teacher schools
P + UP P+sec/hs U.P. only UP+secP. only
No response in school category
Primary with upper primaryPrimary with U.P. & sec/higherUpper primary onlyUpper primary with sec./higher sec
Primary only
Primary onlyPrimary with upper primaryPrimary with Upper primary & sec/higherUpper primary only
Para-teachers
School category
Upper primary with sec./higher secondary
Primary onlyPrimary with upper prim.
P. onlyP + UPP+sec/hsU.P. onlyUP+sec
NER(U.Prim)GER(U.Prim)NER (Primary)GER (Primary)
Transition ratePrim. to U. Prim
SC/ST Enrolment
Indicators
Classrooms/Other rooms
Prim.with U.P.&Sec/H.SUpper Primary onlyU. Primary with Sec./H.S.
Basic Data, 2001
Data reported from
Performance indicators
97.0 42.798.6 39.298.5 42.198.0 41.7
Utt
ar P
rad
esh

539
Elementary Education: Report Card - JAUNPUR
Utt
ar P
rad
esh
0.291
29.8 28.5
Key data: Elementary Education
3912
JAUNPUR
(Previous academic year)
(Previous year)
Gender and caste distribution of teachers*
No. of schools by type of building*
BoysWith disability
Flow rates
Primary Level
Enrolment*
Number of schools
Grade
GER / NER
School category
Primary Upper primaryBoys Boys GirlsGirls
IncentiveType
School categoryMultiple
TypeKuccha
PartiallyPucca
PuccaTotal % good condition
Otherrooms
TentNo
Building
Classrooms
Belowsecondary
Highersecondary
Postgraduate
M. Phil.GraduateSecondarySchool category OthersNo
response
ST teachers
Total Male Female No res Male Female No res Male Female Male FemaleSC teachers
Text booksUniformAttendanceStationery
% Passed
Avg. No. of Tchs.
%
Female literacyOverall literacy
dev. grant grantSchool T L M
Male Female
IVV
IIIIII
Grade R.R. D.O.R. P.R.
VIIVI
# #
I - V
Enrolment by medium of instructions
Examination results
Retention rate
GPI
Primary cycle U. primary cycleState
DISTRICT ELEMENTARY EDUCATION REPORT CARD : 2005-06
GirlsGrade
IIIIIIIVVVI
VIII
AllGirls
Total
VII
% TotalGrossness
School category
72
3722
36 65 1
11527
3581
147 0 4
1,892 28526 1,766
5 620111 68,683
25 1930 609
1,826 256 419,625 53,96913,602 1,370 10,664
2,820 431 2,82030,058 67,021 29,457
0 0 011,211 107 10,121
431,801 60,268 6,51931
1,241213
P + UP P+sec/hs U.P. only UP+sec
School categoryP. only
0.6 0.0 0.0 0.6 0.04.0
Number of Clusters 28901949
% Schools with SCR > 600.0 0.0 20.7 0.0
65.0 23.3 42.9 24.0 20.7% Schools with pre-primary sections 60.2 7.0 42.9 2.7 3.4% Schools with common toilets 55.5 74.4 42.9 58.1 89.7
% Schools with girls toilets 38.5 72.1 42.9 46.0 79.3% Schools with drinking water facility 98.9 97.7 100.0 93.4 93.1
% Enrolment in Govt. schools 87.8 11.5 18.0 69.6 1.799.5 97.7 100.0 99.8 93.1
% No female teacher schools (tch>=2) 36.7 27.9 28.6 52.0 72.42.8 0.0 0.0 7.6 0.0
0.3 0.0 0.0 0.3 0.0%Enrolment in schools without blackboard 0.1 0.0 0.0 0.0 2.4
2001-02 2002-03 2003-04 2004-05 2005-06IIIIIIIVV
VIVII
Total U.P
103,627110,639103,005
99,14487,57942,615
38,775
123,426117,942121,094106,734
98,395
35,72733,149
113,146116,797107,526
96,53789,702
31,25628,383
125,640109,134103,033
93,11286,979
30,76325,405
117,499107,550102,783
93,31689,482
22,73018,874
117,63798,77683,64877,50157,561
85.9
25.2
91.1
29.2
94.4
36.0
44.1
0.014.3
50,81355,55751,42549,91443,75020,46418,72417,123
307,770
204278284317252
726270
1,539
115173187171162
606042
970
6,649
classrooms
31364
2,137388
70.176.064.176.882.7
22.718.2
7.3
35.916.4
9.3
5.80.06.78.0
858
77186
2,598 2,030 44 8 1 71 2129 1 1 0 12 0
6 1 0 0 0 0454 7 1 0 19 6
23 0 0 0 4 2
151 967 2,171 1,711 1,107 44 07 5 30 100 79 2 0 210 0 3 27 23 0 0 4
26 45 488 584 382 3 1 9311 2 1 66 104 2 0 61
10 44 418 506 301 2 1 0
4928163
471331
173
8010
27922
1452 47 580 718 35 899 350 30 2110
1252
0140
0000
0000
264
2277
50
325
1081
0010
Terminalgrade Passed
VIII boysV girlsV boys
VIII girls
276 with >60%
44.97760244
581626
247
0.00.0
38.70.0
34.30.0
20.044.8
0.0
488757Hindi Urdu Others Assamese Sanskrit
145872870
9795911404
1284781
000
117100
5650
41800
2170
3340000
% Schools recvd.
78.27.0
14.344.1
0.0
77.02.30.0
37.40.0
1617520
16639
141800
41920
2039670
16835
284480
26615
3.65.78.33.38.5
1.40.80.80.7
0.50.71.0
0.80.9
73.9
43.1
1.00
2005-062004-052003-04
UTTAR PRADESH
17.2
Upper PrimaryPrimary
Sex ratio Sex ratio 0-6
22 251
VIII14.3
Enrolment of children
15,957VIII 21,333 24,009 29,900 36,247Total Pr. 510,630 517,898 523,708 567,591 503,994
1 - 5 6 - 8
1,065 56115 232
4 0
13 45
%Teachers recvd.in-service training
Total schools* Rural schools* Total enrolment* Rural enrolment* Teachers*
0.5 10.0
93.9
32.4
85.8 89.8
18.2 26.3% SC enrolment% SC girls to SC enrolment% ST enrolment
48.7 47.1
49.8 57.2
53.7
50.4
50.7
47.5
Position of teachers by educational qualification (other than para teacher)
(Previous academic year)Incentives : Number of beneficiaries
% ST girls to ST enrolment
% Girls
Number of villages
% 0 - 6 population
% SC population % ST population
% Urban population
% Schools with blackboard
% Enrolment in single-teacher schools
% Enrolment in schools without building
Primary Upperprimary
OBC EnrolmentPrimary U. Primary
% OBCEnrolment% OBC girls toOBC Enrolment
Pupil-teacher ratio (PTR)Student-classroom ratio (SCR)% Schools with <= 50 students% Schools with PTR > 100% Female teachers
% Schools established since 1995
Regular teachers Para-teachers
% minorrepairs
% majorrepairs
# = not applicable na = not available * Some totals may not match due to no response in classificatory data items
9.7 88.912.7 86.517.9 81.318.0 81.356.1 43.121.7 77.4
5459
50.06374
2.315.528.036.9
45.96349
4.718.632.834.9
48.16146
14.618.117.245.8
47.14629
6.93.48.93.4
21.7 21.9 na 59.8 44.1
93010147.420.0
Category
PrivateGovt.PrivateGovtPrivateGovt.PrivateGovt.PrivateGovt.
Total population (in 000's)
Number of blocks/taluks
District
Decadal growth rate
Primary onlyPrimary with upper primaryPrimary with upper primary & sec/higher sec.Upper primary onlyUpper primary with sec./higher secondary
% Single classroom schools% Single teacher schools
P + UP P+sec/hs U.P. only UP+secP. only
No response in school category
Primary with upper primaryPrimary with U.P. & sec/higherUpper primary onlyUpper primary with sec./higher sec
Primary only
Primary onlyPrimary with upper primaryPrimary with Upper primary & sec/higherUpper primary only
Para-teachers
School category
Upper primary with sec./higher secondary
Primary onlyPrimary with upper prim.
P. onlyP + UPP+sec/hsU.P. onlyUP+sec
NER(U.Prim)GER(U.Prim)NER (Primary)GER (Primary)
Transition ratePrim. to U. Prim
1.6
SC/ST Enrolment
Indicators
Classrooms/Other rooms
Prim.with U.P.&Sec/H.SUpper Primary onlyU. Primary with Sec./H.S.
Basic Data, 2001
Data reported from
Performance indicators
99.3 42.299.2 37.499.1 31.399.5 32.7

540
Elementary Education in India - Where do we stand ?
0.2130.054
33.2 34.5
Key data: Elementary Education
1745
JHANSI
(Previous academic year)
(Previous year)
Gender and caste distribution of teachers*
No. of schools by type of building*
BoysWith disability
Flow rates
Primary Level
Enrolment*
Number of schools
Grade
GER / NER
School category
Primary Upper primaryBoys Boys GirlsGirls
IncentiveType
School categoryMultiple
TypeKuccha
PartiallyPucca
PuccaTotal % good condition
Otherrooms
TentNo
Building
Classrooms
Belowsecondary
Highersecondary
Postgraduate
M. Phil.GraduateSecondarySchool category OthersNo
response
ST teachers
Total Male Female No res Male Female No res Male Female Male FemaleSC teachers
Text booksUniformAttendanceStationery
% Passed
Avg. No. of Tchs.
%
Female literacyOverall literacy
dev. grant grantSchool T L M
Male Female
IVV
IIIIII
Grade R.R. D.O.R. P.R.
VIIVI
# #
I - V
Enrolment by medium of instructions
Examination results
Retention rate
GPI
Primary cycle U. primary cycleState
DISTRICT ELEMENTARY EDUCATION REPORT CARD : 2005-06
GirlsGrade
IIIIIIIVVVI
VIII
AllGirls
Total
VII
% TotalGrossness
School category
132
3499
132 46 0
14816
3208
20 0 1
1,110 31553 2,870
1 3,19834 43,50014 1,301
0 0
989 115 152,714 14,19830,271 407 11,368
2,663 0 015,733 40,564 3,754
0 0 02,344 1,155 1,885
170,216 46,240 3,55559
1,322714
P + UP P+sec/hs U.P. only UP+sec
School categoryP. only
3.2 0.7 0.0 0.6 0.01.9
Number of Clusters 2120902
% Schools with SCR > 600.7 0.0 6.0 0.0
39.9 24.8 12.5 15.1 4.0% Schools with pre-primary sections 16.7 9.0 0.0 8.2 4.0% Schools with common toilets 74.5 92.4 100.0 80.5 84.0
% Schools with girls toilets 60.4 85.5 75.0 64.6 72.0% Schools with drinking water facility 92.2 92.4 100.0 86.9 92.0
% Enrolment in Govt. schools 78.6 8.7 54.6 73.4 35.7100.0 100.0 100.0 100.0 100.0
% No female teacher schools (tch>=2) 36.0 22.1 12.5 56.5 48.00.9 0.0 0.0 3.2 0.0
0.9 0.0 0.0 1.5 0.0%Enrolment in schools without blackboard 0.0 0.0 0.0 0.0 0.0
2001-02 2002-03 2003-04 2004-05 2005-06IIIIIIIVV
VIVII
Total U.P
52,73950,26849,59046,60942,60829,368
24,951
52,38449,94848,80944,24641,177
26,73122,804
47,13347,63344,71541,61034,881
20,12118,801
49,85844,03743,81436,14032,697
18,38215,154
47,72244,50838,07834,03831,869
14,00911,957
76,52270,75155,04447,52636,000
79.2
37.1
84.7
46.6
101.5
52.4
47.8
12.550.0
25,06224,16723,73822,31020,22613,07610,913
9,603149,095
282118164159172184103
831,265
8779
10694
102867042
666
4,088
classrooms
720118
1,753148
86.796.4
100.090.087.8
8.93.2
4.4
0.07.18.8
0.40.02.93.4
1309
60846
1,254 1,353 28 5 0 1 38113 4 0 0 1 27
7 0 0 0 0 1473 5 2 0 0 17
19 0 0 0 0 6
142 563 1,019 1,376 792 6 016 5 70 372 209 4 0 85
2 0 8 14 28 0 0 848 37 443 500 417 4 0 134
6 0 10 24 55 1 0 12
14 81 353 241 47 1 0 0
2423388
161127
79
37344
45629
1698 1 470 285 0 574 253 16 130000
7010
5050
0000
532
1978
400
290
80
111
4040
Terminalgrade Passed
VIII boysV girlsV boys
VIII girls
224 with >60%
17.24877773
601589
108
0.50.0
12.50.0
11.30.00.04.80.0
216335Hindi English Others
330392663
589253645
00
319800
121102
0308
0
% Schools recvd.
60.91.40.0
35.20.0
59.40.00.0
38.80.0
6497776
4442090
956229
1153949
7491565
45365132
14654221
6507112
3.45.37.53.24.3
1.61.62.12.0
1.20.81.3
2.92.0
86.8
70.5
0.91
2005-062004-052003-04
UTTAR PRADESH
73.3
Upper PrimaryPrimary
Sex ratio Sex ratio 0-6
10 72
VIII12.5
Enrolment of children
10,034VIII 13,990 16,122 21,216 22,203Total Pr. 196,215 206,546 215,972 236,564 241,814
1 - 5 6 - 8
1,004 58547 61
0 0
20 40
%Teachers recvd.in-service training
Total schools* Rural schools* Total enrolment* Rural enrolment* Teachers*
9.9 18.1
91.5
43.0
72.2 74.9
28.6 34.9% SC enrolment% SC girls to SC enrolment% ST enrolment
47.2 42.2
27.5 27.0
49.2
48.2
44.6
44.1
Position of teachers by educational qualification (other than para teacher)
(Previous academic year)Incentives : Number of beneficiaries
% ST girls to ST enrolment
% Girls
Number of villages
% 0 - 6 population
% SC population % ST population
% Urban population
% Schools with blackboard
% Enrolment in single-teacher schools
% Enrolment in schools without building
Primary Upperprimary
OBC EnrolmentPrimary U. Primary
% OBCEnrolment% OBC girls toOBC Enrolment
Pupil-teacher ratio (PTR)Student-classroom ratio (SCR)% Schools with <= 50 students% Schools with PTR > 100% Female teachers
% Schools established since 1995
Regular teachers Para-teachers
% minorrepairs
% majorrepairs
# = not applicable na = not available * Some totals may not match due to no response in classificatory data items
4.0 94.41.1 97.34.2 93.74.4 93.6
26.6 70.57.4 90.66.1 92.73.1 96.2
5098
48.14453
9.53.6
40.731.5
43.14346
18.65.5
48.955.9
43.73734
18.94.6
29.051.7
52.33425
24.04.0
26.98.0
23.2 28.1 0.1 65.5 50.2
88687140.816.1
Category
PrivateGovt.PrivateGovtPrivateGovt.PrivateGovt.PrivateGovt.
Total population (in 000's)
Number of blocks/taluks
District
Decadal growth rate
Primary onlyPrimary with upper primaryPrimary with upper primary & sec/higher sec.Upper primary onlyUpper primary with sec./higher secondary
% Single classroom schools% Single teacher schools
P + UP P+sec/hs U.P. only UP+secP. only
No response in school category
Primary with upper primaryPrimary with U.P. & sec/higherUpper primary onlyUpper primary with sec./higher sec
Primary only
Primary onlyPrimary with upper primaryPrimary with Upper primary & sec/higherUpper primary only
Para-teachers
School category
Upper primary with sec./higher secondary
Primary onlyPrimary with upper prim.
P. onlyP + UPP+sec/hsU.P. onlyUP+sec
NER(U.Prim)GER(U.Prim)NER (Primary)GER (Primary)
Transition ratePrim. to U. Prim
SC/ST Enrolment
Indicators
Classrooms/Other rooms
Prim.with U.P.&Sec/H.SUpper Primary onlyU. Primary with Sec./H.S.
Basic Data, 2001
Data reported from
Performance indicators
99.1 38.098.6 44.994.6 37.396.8 40.5
Utt
ar P
rad
esh

541
Elementary Education: Report Card - JYOTIBA PHULE NAGAR
Utt
ar P
rad
esh
0.0550.092
22.8 22.5
Key data: Elementary Education
1499
JYOTIBA PHULE NAGAR
(Previous academic year)
(Previous year)
Gender and caste distribution of teachers*
No. of schools by type of building*
BoysWith disability
Flow rates
Primary Level
Enrolment*
Number of schools
Grade
GER / NER
School category
Primary Upper primaryBoys Boys GirlsGirls
IncentiveType
School categoryMultiple
TypeKuccha
PartiallyPucca
PuccaTotal % good condition
Otherrooms
TentNo
Building
Classrooms
Belowsecondary
Highersecondary
Postgraduate
M. Phil.GraduateSecondarySchool category OthersNo
response
ST teachers
Total Male Female No res Male Female No res Male Female Male FemaleSC teachers
Text booksUniformAttendanceStationery
% Passed
Avg. No. of Tchs.
%
Female literacyOverall literacy
dev. grant grantSchool T L M
Male Female
IVV
IIIIII
Grade R.R. D.O.R. P.R.
VIIVI
# #
I - V
Enrolment by medium of instructions
Examination results
Retention rate
GPI
Primary cycle U. primary cycleState
DISTRICT ELEMENTARY EDUCATION REPORT CARD : 2005-06
GirlsGrade
IIIIIIIVVVI
VIII
AllGirls
Total
VII
% TotalGrossness
School category
173
2629
141 831 3
11635
2445
17 0 0
980 32981 7,33717 2,781
100 17,09518 2,343
0 0
898 219 142,803 45,77654,045 2,682 29,66015,724 2,781 7,89118,779 14,846 15,930
0 0 011,170 1,120 6,093
158,054 70,761 2,31777
1,081640
P + UP P+sec/hs U.P. only UP+sec
School categoryP. only
2.4 1.3 0.0 0.3 0.010.2
Number of Clusters 1940865
% Schools with SCR > 601.3 2.9 25.7 0.0
34.2 23.4 26.5 3.2 6.8% Schools with pre-primary sections 21.2 8.9 0.0 1.6 4.5% Schools with common toilets 75.9 94.3 97.1 76.2 100.0
% Schools with girls toilets 66.0 87.3 91.2 68.0 88.6% Schools with drinking water facility 99.3 100.0 100.0 93.4 97.7
% Enrolment in Govt. schools 69.1 12.0 15.0 47.7 17.399.2 99.4 100.0 99.5 100.0
% No female teacher schools (tch>=2) 44.0 39.2 41.2 50.5 75.06.3 0.0 10.1 5.7 0.0
0.5 0.0 0.0 0.2 0.0%Enrolment in schools without blackboard 0.1 0.0 0.0 0.0 0.0
2001-02 2002-03 2003-04 2004-05 2005-06IIIIIIIVV
VIVII
Total U.P
80,62761,41454,23646,09738,89228,348
25,316
64,09451,73145,19736,23728,272
13,73712,531
60,77946,19138,22427,95122,586
11,0619,838
65,72648,63935,88128,08323,501
12,01610,501
65,42341,04233,63225,99924,045
10,7069,015
76,82337,37229,76331,67828,024
82.4
23.1
92.3
28.1
137.4
61.3
41.5
2.967.6
36,83328,40825,69421,35817,50012,22010,677
9,697162,387
233220226189179
865355
1,241
135147151129
95463941
783
4,619
classrooms
1,369421
1,626614
75.591.795.590.393.5
16.77.3
7.7
4.59.06.2
1.00.00.70.3
27963
480125
1,175 1,289 4 0 0 2 13155 2 0 0 1 0
34 0 0 0 0 0375 0 0 0 0 3
43 0 0 0 1 0
76 410 619 833 599 6 814 19 72 314 268 1 0 15
0 8 9 57 64 0 1 023 43 259 395 330 4 2 5
2 0 6 61 109 0 0 10
24 61 225 371 144 0 1 0
1857431
90878144
27149
17739
722 6 504 308 1 395 77 21 161065
11020
3010
0000
7513
16111
306
180
15585
7213
Terminalgrade Passed
VIII boysV girlsV boys
VIII girls
34 with >60%
36.33398717139
1064188
0.20.0
22.00.0
23.30.48.2
15.20.0
228701Hindi Others
60880185053575513513
11400
1190
% Schools recvd.
64.03.82.9
28.60.0
60.00.02.9
27.20.0
587780
634311
47510
41618
632060
539612
60150
22622
2.64.54.12.84.3
3.32.11.51.3
1.10.60.8
1.02.1
59.0
99.7
0.86
2005-062004-052003-04
UTTAR PRADESH
35.3
Upper PrimaryPrimary
Sex ratio Sex ratio 0-6
8 89
VIII44.1
Enrolment of children
8,303VIII 9,161 8,864 11,104 23,159Total Pr. 190,141 201,830 195,731 225,531 281,266
1 - 5 6 - 8
690 37436 152
0 0
8 131
%Teachers recvd.in-service training
Total schools* Rural schools* Total enrolment* Rural enrolment* Teachers*
20.3 26.4
100.0
45.1
78.6 76.0
16.7 21.4% SC enrolment% SC girls to SC enrolment% ST enrolment
46.5 40.5
45.4 69.0
36.2
44.8
39.6
41.3
Position of teachers by educational qualification (other than para teacher)
(Previous academic year)Incentives : Number of beneficiaries
% ST girls to ST enrolment
% Girls
Number of villages
% 0 - 6 population
% SC population % ST population
% Urban population
% Schools with blackboard
% Enrolment in single-teacher schools
% Enrolment in schools without building
Primary Upperprimary
OBC EnrolmentPrimary U. Primary
% OBCEnrolment% OBC girls toOBC Enrolment
Pupil-teacher ratio (PTR)Student-classroom ratio (SCR)% Schools with <= 50 students% Schools with PTR > 100% Female teachers
% Schools established since 1995
Regular teachers Para-teachers
% minorrepairs
% majorrepairs
# = not applicable na = not available * Some totals may not match due to no response in classificatory data items
2.6 94.1
44133
47.16750
10.322.430.341.9
41.98645
1.339.938.258.2
41.43422
42.13.2
16.764.8
46.37222
2.325.020.718.2
29.7 17.3 na 49.5 34.6
91188524.620.2
Category
PrivateGovt.PrivateGovtPrivateGovt.PrivateGovt.PrivateGovt.
Total population (in 000's)
Number of blocks/taluks
District
Decadal growth rate
Primary onlyPrimary with upper primaryPrimary with upper primary & sec/higher sec.Upper primary onlyUpper primary with sec./higher secondary
% Single classroom schools% Single teacher schools
P + UP P+sec/hs U.P. only UP+secP. only
No response in school category
Primary with upper primaryPrimary with U.P. & sec/higherUpper primary onlyUpper primary with sec./higher sec
Primary only
Primary onlyPrimary with upper primaryPrimary with Upper primary & sec/higherUpper primary only
Para-teachers
School category
Upper primary with sec./higher secondary
Primary onlyPrimary with upper prim.
P. onlyP + UPP+sec/hsU.P. onlyUP+sec
NER(U.Prim)GER(U.Prim)NER (Primary)GER (Primary)
Transition ratePrim. to U. Prim
SC/ST Enrolment
Indicators
Classrooms/Other rooms
Prim.with U.P.&Sec/H.SUpper Primary onlyU. Primary with Sec./H.S.
Basic Data, 2001
Data reported from
Performance indicators
99.0 37.798.7 37.897.7 39.998.5 44.5

542
Elementary Education in India - Where do we stand ?
0.1030.059
20.5 22.1
Key data: Elementary Education
1389
KANNAUJ
(Previous academic year)
(Previous year)
Gender and caste distribution of teachers*
No. of schools by type of building*
BoysWith disability
Flow rates
Primary Level
Enrolment*
Number of schools
Grade
GER / NER
School category
Primary Upper primaryBoys Boys GirlsGirls
IncentiveType
School categoryMultiple
TypeKuccha
PartiallyPucca
PuccaTotal % good condition
Otherrooms
TentNo
Building
Classrooms
Belowsecondary
Highersecondary
Postgraduate
M. Phil.GraduateSecondarySchool category OthersNo
response
ST teachers
Total Male Female No res Male Female No res Male Female Male FemaleSC teachers
Text booksUniformAttendanceStationery
% Passed
Avg. No. of Tchs.
%
Female literacyOverall literacy
dev. grant grantSchool T L M
Male Female
IVV
IIIIII
Grade R.R. D.O.R. P.R.
VIIVI
# #
I - V
Enrolment by medium of instructions
Examination results
Retention rate
GPI
Primary cycle U. primary cycleState
DISTRICT ELEMENTARY EDUCATION REPORT CARD : 2005-06
GirlsGrade
IIIIIIIVVVI
VIII
AllGirls
Total
VII
% TotalGrossness
School category
120
2231
29 123 0
564
2181
0 0 0
860 11426 1,869
2 051 23,188
4 2110 0
840 106 163,308 14,1469,844 1,869 8,6231,430 0 5868,503 22,262 8,027
0 0 0986 211 986
167,531 15,434 3,21952
300154
P + UP P+sec/hs U.P. only UP+sec
School categoryP. only
1.4 0.0 0.0 0.0 0.04.2
Number of Clusters 1302739
% Schools with SCR > 600.0 0.0 7.5 0.0
58.8 34.1 0.0 5.4 20.0% Schools with pre-primary sections 4.4 2.4 0.0 0.4 0.0% Schools with common toilets 94.6 78.0 66.7 83.2 100.0
% Schools with girls toilets 79.8 70.7 66.7 61.6 100.0% Schools with drinking water facility 95.4 87.8 100.0 75.3 100.0
% Enrolment in Govt. schools 91.6 16.0 0.0 73.2 17.697.0 97.6 100.0 93.5 100.0
% No female teacher schools (tch>=2) 16.9 73.2 66.7 64.2 100.01.9 0.0 0.0 4.9 0.0
0.3 0.0 0.0 0.8 0.0%Enrolment in schools without blackboard 1.9 1.6 0.0 5.2 0.0
2001-02 2002-03 2003-04 2004-05 2005-06IIIIIIIVV
VIVII
Total U.P
43,47642,39438,59736,85629,87914,977
12,441
39,66936,05239,20032,40727,232
6,5616,081
36,25640,54034,33727,59321,917
10,3138,864
44,74634,67629,75522,78018,454
7,9976,013
34,04424,90420,95316,86213,352
5,5794,407
37,79418,17726,50419,11113,574
74.5
22.6
79.4
15.2
100.8
32.5
44.6
0.033.3
20,68321,12619,33318,73015,008
7,1175,7794,588
112,364
151123143167162
534326
868
6374
108121
88343116
535
2,596
classrooms
23236
1,05375
97.998.386.195.2
100.0
1.81.7
0.3
13.93.20.0
0.00.01.60.0
524
32714
847 968 0 0 1 1 441 0 0 0 0 0
3 0 0 0 0 0276 0 0 0 0 3
5 0 0 0 0 0
100 405 520 452 331 3 24 12 14 19 10 0 0 1470 0 0 0 8 0 0 9
22 69 274 260 160 1 1 1610 0 0 8 4 0 0 19
226 388 185 320 107 1 2 0
1520172
12804
31
235
1420
711 5 528 750 5 310 168 9 911
020
0020
0010
0000
100
1202
30
190
00
110
0020
Terminalgrade Passed
VIII boysV girlsV boys
VIII girls
423 with >60%
9.33519206
17951
31
2.30.0
25.90.0
6.70.00.0
26.6
181691Hindi Others Kannada
114811430
316911197
856232
000
2590000
% Schools recvd.
77.47.30.0
46.20.0
81.512.2
0.048.4
0.0
5497567
40696307
41680
817878
6835520
46136847
888374
981399
3.65.05.73.46.2
2.31.92.11.9
1.11.41.0
2.02.1
86.1
54.7
0.99
2005-062004-052003-04
UTTAR PRADESH
29.4
Upper PrimaryPrimary
Sex ratio Sex ratio 0-6
8 89
VIII66.7
Enrolment of children
3,588VIII 5,101 7,327 5,535 10,376Total Pr. 110,115 150,411 160,643 174,560 191,202
1 - 5 6 - 8
721 2309 220 0
0 17
%Teachers recvd.in-service training
Total schools* Rural schools* Total enrolment* Rural enrolment* Teachers*
14.6 24.4
86.1
24.6
63.9 65.9
16.9 11.3% SC enrolment% SC girls to SC enrolment% ST enrolment
48.1 45.0
55.8 61.5
61.1
50.6
60.3
46.9
Position of teachers by educational qualification (other than para teacher)
(Previous academic year)Incentives : Number of beneficiaries
% ST girls to ST enrolment
% Girls
Number of villages
% 0 - 6 population
% SC population % ST population
% Urban population
% Schools with blackboard
% Enrolment in single-teacher schools
% Enrolment in schools without building
Primary Upperprimary
OBC EnrolmentPrimary U. Primary
% OBCEnrolment% OBC girls toOBC Enrolment
Pupil-teacher ratio (PTR)Student-classroom ratio (SCR)% Schools with <= 50 students% Schools with PTR > 100% Female teachers
% Schools established since 1995
Regular teachers Para-teachers
% minorrepairs
% majorrepairs
# = not applicable na = not available * Some totals may not match due to no response in classificatory data items
5.4 92.47.6 90.5
43.2 54.76.3 91.6
4084
50.05270
2.07.4
41.529.6
39.85750
2.417.111.239.0
47.53330
20.83.2
15.048.7
40.03916
0.00.00.00.0
19.6 18.4 na 61.9 49.2
91286616.718.7
Category
PrivateGovt.PrivateGovtPrivateGovt.PrivateGovt.PrivateGovt.
Total population (in 000's)
Number of blocks/taluks
District
Decadal growth rate
Primary onlyPrimary with upper primaryPrimary with upper primary & sec/higher sec.Upper primary onlyUpper primary with sec./higher secondary
% Single classroom schools% Single teacher schools
P + UP P+sec/hs U.P. only UP+secP. only
No response in school category
Primary with upper primaryPrimary with U.P. & sec/higherUpper primary onlyUpper primary with sec./higher sec
Primary only
Primary onlyPrimary with upper primaryPrimary with Upper primary & sec/higherUpper primary only
Para-teachers
School category
Upper primary with sec./higher secondary
Primary onlyPrimary with upper prim.
P. onlyP + UPP+sec/hsU.P. onlyUP+sec
NER(U.Prim)GER(U.Prim)NER (Primary)GER (Primary)
Transition ratePrim. to U. Prim
SC/ST Enrolment
Indicators
Classrooms/Other rooms
Prim.with U.P.&Sec/H.SUpper Primary onlyU. Primary with Sec./H.S.
Basic Data, 2001
Data reported from
Performance indicators
92.9 41.792.4 38.195.9 42.394.6 45.8
Utt
ar P
rad
esh

543
Elementary Education: Report Card - KANPUR DEHAT
Utt
ar P
rad
esh
0.2380.240
31.2 33.7
Key data: Elementary Education
1563
KANPUR DEHAT
(Previous academic year)
(Previous year)
Gender and caste distribution of teachers*
No. of schools by type of building*
BoysWith disability
Flow rates
Primary Level
Enrolment*
Number of schools
Grade
GER / NER
School category
Primary Upper primaryBoys Boys GirlsGirls
IncentiveType
School categoryMultiple
TypeKuccha
PartiallyPucca
PuccaTotal % good condition
Otherrooms
TentNo
Building
Classrooms
Belowsecondary
Highersecondary
Postgraduate
M. Phil.GraduateSecondarySchool category OthersNo
response
ST teachers
Total Male Female No res Male Female No res Male Female Male FemaleSC teachers
Text booksUniformAttendanceStationery
% Passed
Avg. No. of Tchs.
%
Female literacyOverall literacy
dev. grant grantSchool T L M
Male Female
IVV
IIIIII
Grade R.R. D.O.R. P.R.
VIIVI
# #
I - V
Enrolment by medium of instructions
Examination results
Retention rate
GPI
Primary cycle U. primary cycleState
DISTRICT ELEMENTARY EDUCATION REPORT CARD : 2005-06
GirlsGrade
IIIIIIIVVVI
VIII
AllGirls
Total
VII
% TotalGrossness
School category
242
3071
32 249 2
7925
3051
5 0 1
1,530 15432 4,021
9 44179 40,04925 278
0 0
1,526 154 208,582 26,1158,021 4,021 8,0211,469 441 1,469
14,925 39,912 14,925
0 0 04,209 278 4,209
209,751 26,115 3,863101
526185
P + UP P+sec/hs U.P. only UP+sec
School categoryP. only
0.3 1.8 0.0 0.0 0.09.6
Number of Clusters 21681249
% Schools with SCR > 607.1 9.1 13.2 3.8
28.9 17.9 9.1 14.8 11.5% Schools with pre-primary sections 29.3 10.7 18.2 10.4 11.5% Schools with common toilets 77.9 89.3 90.9 87.8 92.3
% Schools with girls toilets 53.9 76.8 81.8 66.1 80.8% Schools with drinking water facility 94.3 94.6 100.0 89.1 100.0
% Enrolment in Govt. schools 88.9 33.4 23.1 72.9 6.298.2 100.0 100.0 99.5 96.2
% No female teacher schools (tch>=2) 44.1 48.2 81.8 60.1 76.98.1 2.3 8.6 7.6 3.6
0.1 0.0 0.0 0.0 0.0%Enrolment in schools without blackboard 1.6 0.0 0.0 0.4 5.1
2001-02 2002-03 2003-04 2004-05 2005-06IIIIIIIVV
VIVII
Total U.P
52,12052,53548,74147,69640,64724,762
21,644
49,81046,74148,99642,37139,713
20,51218,882
40,43743,89639,15135,32630,605
16,92415,391
46,60240,63639,52533,20831,548
13,93311,854
39,93638,00733,81131,26830,917
11,26710,372
67,54057,27445,54036,85630,297
77.7
34.4
91.4
42.3
113.2
51.7
44.4
9.118.2
24,56324,85323,03122,86719,45411,85010,31710,124
147,059
103130118177147
465224
797
578090
107107
262831
526
4,895
classrooms
316110
1,588307
77.584.595.586.088.9
19.114.2
3.4
4.512.511.1
1.30.01.50.0
8222
60180
1,709 1,673 4 0 0 2 554 2 0 0 0 011 0 0 0 0 0
381 0 0 0 5 026 0 0 0 0 0
149 316 657 1,279 677 3 43 5 38 131 60 1 0 432 0 10 14 12 0 0 20
21 40 257 581 322 2 0 1662 12 7 47 49 0 0 13
26 57 227 442 115 2 0 0
2625202
461199
121
531
1778
753 44 562 390 15 443 181 5 7261113
1
3233
1010
1000
188
17810
50
272
1040
0020
Terminalgrade Passed
VIII boysV girlsV boys
VIII girls
337 with >60%
22.44389286
601393
133
6.30.0
11.80.0
21.011.1
0.017.4
0.0
231659Hindi Others Assamese English Urdu
118611910
538984487
301800
4620
2530000
1420000
1300000
% Schools recvd.
67.425.0
9.151.0
3.8
57.010.7
0.022.8
7.7
5883584
65277145
74090
9158130
79022147
62954131
142304
931993
2.65.15.53.65.1
1.31.51.51.5
2.22.62.3
1.51.5
100.0
61.2
0.90
2005-062004-052003-04
UTTAR PRADESH
1.7
Upper PrimaryPrimary
Sex ratio Sex ratio 0-6
11 112
VIII18.2
Enrolment of children
8,658VIII 11,069 13,225 17,880 21,134Total Pr. 173,939 191,519 189,415 227,631 241,739
1 - 5 6 - 8
992 4016 1270 0
9 51
%Teachers recvd.in-service training
Total schools* Rural schools* Total enrolment* Rural enrolment* Teachers*
10.6 25.7
100.0
38.4
76.6 86.9
25.0 34.0% SC enrolment% SC girls to SC enrolment% ST enrolment
47.0 47.3
47.3 48.4
46.6
48.0
41.8
47.5
Position of teachers by educational qualification (other than para teacher)
(Previous academic year)Incentives : Number of beneficiaries
% ST girls to ST enrolment
% Girls
Number of villages
% 0 - 6 population
% SC population % ST population
% Urban population
% Schools with blackboard
% Enrolment in single-teacher schools
% Enrolment in schools without building
Primary Upperprimary
OBC EnrolmentPrimary U. Primary
% OBCEnrolment% OBC girls toOBC Enrolment
Pupil-teacher ratio (PTR)Student-classroom ratio (SCR)% Schools with <= 50 students% Schools with PTR > 100% Female teachers
% Schools established since 1995
Regular teachers Para-teachers
% minorrepairs
% majorrepairs
# = not applicable na = not available * Some totals may not match due to no response in classificatory data items
2.5 96.04.0 94.5
37.3 61.25.7 92.8
1732
47.65448
8.712.626.041.9
44.94238
7.18.9
18.935.7
48.03935
11.46.7
12.852.8
50.53415
15.415.4
6.03.8
21.5 24.8 na 66.4 54.6
8928526.917.9
Category
PrivateGovt.PrivateGovtPrivateGovt.PrivateGovt.PrivateGovt.
Total population (in 000's)
Number of blocks/taluks
District
Decadal growth rate
Primary onlyPrimary with upper primaryPrimary with upper primary & sec/higher sec.Upper primary onlyUpper primary with sec./higher secondary
% Single classroom schools% Single teacher schools
P + UP P+sec/hs U.P. only UP+secP. only
No response in school category
Primary with upper primaryPrimary with U.P. & sec/higherUpper primary onlyUpper primary with sec./higher sec
Primary only
Primary onlyPrimary with upper primaryPrimary with Upper primary & sec/higherUpper primary only
Para-teachers
School category
Upper primary with sec./higher secondary
Primary onlyPrimary with upper prim.
P. onlyP + UPP+sec/hsU.P. onlyUP+sec
NER(U.Prim)GER(U.Prim)NER (Primary)GER (Primary)
Transition ratePrim. to U. Prim
SC/ST Enrolment
Indicators
Classrooms/Other rooms
Prim.with U.P.&Sec/H.SUpper Primary onlyU. Primary with Sec./H.S.
Basic Data, 2001
Data reported from
Performance indicators
97.0 40.296.9 38.495.0 39.294.6 41.8

544
Elementary Education in India - Where do we stand ?
0.3510.245
26.8 25.6
Key data: Elementary Education
4168
KANPUR NAGAR
(Previous academic year)
(Previous year)
Gender and caste distribution of teachers*
No. of schools by type of building*
BoysWith disability
Flow rates
Primary Level
Enrolment*
Number of schools
Grade
GER / NER
School category
Primary Upper primaryBoys Boys GirlsGirls
IncentiveType
School categoryMultiple
TypeKuccha
PartiallyPucca
PuccaTotal % good condition
Otherrooms
TentNo
Building
Classrooms
Belowsecondary
Highersecondary
Postgraduate
M. Phil.GraduateSecondarySchool category OthersNo
response
ST teachers
Total Male Female No res Male Female No res Male Female Male FemaleSC teachers
Text booksUniformAttendanceStationery
% Passed
Avg. No. of Tchs.
%
Female literacyOverall literacy
dev. grant grantSchool T L M
Male Female
IVV
IIIIII
Grade R.R. D.O.R. P.R.
VIIVI
# #
I - V
Enrolment by medium of instructions
Examination results
Retention rate
GPI
Primary cycle U. primary cycleState
DISTRICT ELEMENTARY EDUCATION REPORT CARD : 2005-06
GirlsGrade
IIIIIIIVVVI
VIII
AllGirls
Total
VII
% TotalGrossness
School category
121
5081
104 110 0
45343
4411
238 0 0
1,567 96727 4,010
3 204145 48,952
26 1730 0
1,187 223 163,369 39,79131,893 42 9,791
2,452 0 97659,436 43,704 22,922
0 0 011,480 173 6,888
199,824 166,855 4,11264
4,576627
P + UP P+sec/hs U.P. only UP+sec
School categoryP. only
1.9 0.0 0.0 0.0 0.08.3
Number of Clusters 3904932
% Schools with SCR > 600.0 0.0 9.2 0.0
11.2 17.2 9.1 3.1 0.0% Schools with pre-primary sections 0.8 0.0 0.0 0.1 0.0% Schools with common toilets 89.4 100.0 100.0 95.2 100.0
% Schools with girls toilets 65.7 96.6 100.0 77.7 84.1% Schools with drinking water facility 97.2 99.1 100.0 94.5 100.0
% Enrolment in Govt. schools 54.5 11.2 7.7 45.2 1.5100.0 100.0 100.0 100.0 100.0
% No female teacher schools (tch>=2) 12.9 11.2 0.0 24.9 27.33.9 0.0 0.0 5.2 0.0
0.0 0.0 0.0 0.0 0.0%Enrolment in schools without blackboard 0.0 0.0 0.0 0.0 0.0
2001-02 2002-03 2003-04 2004-05 2005-06IIIIIIIVV
VIVII
Total U.P
87,92080,36978,52975,16768,39746,809
44,415
84,63077,00877,36366,43062,141
42,35639,616
80,97676,54867,34059,59557,729
39,18436,233
64,83850,49244,36740,67238,073
24,80021,410
134,897121,355110,88267,552
52.1
31.1
54.5
33.1
68.6
38.7
57.0
0.00.0
41,83438,69138,46836,87533,26022,86121,49221,170
254,651
491291313228131109233177
1,973
250307213121
76184282
811,514
10,715
classrooms
884126
4,698611
91.197.297.696.292.6
6.82.8
2.1
0.03.07.4
0.02.40.90.0
22125
1,388133
3,176 2,491 32 0 1 4 6114 2 0 0 0 0
11 0 0 0 0 0954 7 0 0 0 0
43 0 0 0 1 0
71 356 727 1,568 1,532 23 72 3 9 107 132 2 0 4322 1 5 13 14 0 0 34
31 48 453 801 908 7 4 1,5010 2 5 26 34 0 0 225
3 4 86 126 58 0 0 0
3368330
231978
198
35646
177594
4426 0 306 588 0 472 531 30 391000
0050
40
130
0000
408
25024
4310
20815
30
195
50
163
Terminalgrade Passed
VIII boysV girlsV boys
VIII girls
3,510 with >60%
12.48688691
693771
292
0.60.0
10.80.0
11.60.30.09.10.0
355850Hindi Others Urdu Sanskrit Garo
344932451
10602511016
96321191
02264
637
0219205
00
2630000
1270000
% Schools recvd.
47.53.40.0
35.90.0
50.60.00.0
37.12.3
47305103
4633424
1058995
100410
7280395
490050
2024976
101570
3.46.06.33.96.6
0.80.90.90.6
0.30.30.2
0.40.7
75.2
0.94
2005-062004-052003-04
UTTAR PRADESH
66.7
Upper PrimaryPrimary
Sex ratio Sex ratio 0-6
20 154
VIII9.1
Enrolment of children
VIII 21,342 35,465 39,383 43,673Total Pr. 238,442 342,188 367,572 390,382
1 - 5 6 - 8
1,662 2,1097 2850 0
9 60
%Teachers recvd.in-service training
Total schools* Rural schools* Total enrolment* Rural enrolment* Teachers*
9.8 23.2
61.9
29.7
46.8 52.3
27.0 27.1% SC enrolment% SC girls to SC enrolment% ST enrolment
48.8 49.7
47.2 46.9
38.7
48.5
39.7
48.6
Position of teachers by educational qualification (other than para teacher)
(Previous academic year)Incentives : Number of beneficiaries
% ST girls to ST enrolment
% Girls
Number of villages
% 0 - 6 population
% SC population % ST population
% Urban population
% Schools with blackboard
% Enrolment in single-teacher schools
% Enrolment in schools without building
Primary Upperprimary
OBC EnrolmentPrimary U. Primary
% OBCEnrolment% OBC girls toOBC Enrolment
Pupil-teacher ratio (PTR)Student-classroom ratio (SCR)% Schools with <= 50 students% Schools with PTR > 100% Female teachers
% Schools established since 1995
Regular teachers Para-teachers
% minorrepairs
% majorrepairs
# = not applicable na = not available * Some totals may not match due to no response in classificatory data items
5.0 94.2
2.5 96.6
24.4 75.24.8 94.4
2138
48.44234
12.05.1
57.730.3
47.75241
1.712.152.133.6
49.82923
18.22.3
47.446.4
39.24019
0.00.0
32.29.1
27.2 16.5 na 74.4 67.5
86985567.114.2
Category
PrivateGovt.PrivateGovtPrivateGovt.PrivateGovt.PrivateGovt.
Total population (in 000's)
Number of blocks/taluks
District
Decadal growth rate
Primary onlyPrimary with upper primaryPrimary with upper primary & sec/higher sec.Upper primary onlyUpper primary with sec./higher secondary
% Single classroom schools% Single teacher schools
P + UP P+sec/hs U.P. only UP+secP. only
No response in school category
Primary with upper primaryPrimary with U.P. & sec/higherUpper primary onlyUpper primary with sec./higher sec
Primary only
Primary onlyPrimary with upper primaryPrimary with Upper primary & sec/higherUpper primary only
Para-teachers
School category
Upper primary with sec./higher secondary
Primary onlyPrimary with upper prim.
P. onlyP + UPP+sec/hsU.P. onlyUP+sec
NER(U.Prim)GER(U.Prim)NER (Primary)GER (Primary)
Transition ratePrim. to U. Prim
SC/ST Enrolment
Indicators
Classrooms/Other rooms
Prim.with U.P.&Sec/H.SUpper Primary onlyU. Primary with Sec./H.S.
Basic Data, 2001
Data reported from
Performance indicators
98.8 44.798.9 43.997.9 49.198.1 49.3
Utt
ar P
rad
esh

545
Elementary Education: Report Card - KAUSHAMBI
Utt
ar P
rad
esh
0.4360.000
48.3 40.6
Key data: Elementary Education
1293
KAUSHAMBI
(Previous academic year)
(Previous year)
Gender and caste distribution of teachers*
No. of schools by type of building*
BoysWith disability
Flow rates
Primary Level
Enrolment*
Number of schools
Grade
GER / NER
School category
Primary Upper primaryBoys Boys GirlsGirls
IncentiveType
School categoryMultiple
TypeKuccha
PartiallyPucca
PuccaTotal % good condition
Otherrooms
TentNo
Building
Classrooms
Belowsecondary
Highersecondary
Postgraduate
M. Phil.GraduateSecondarySchool category OthersNo
response
ST teachers
Total Male Female No res Male Female No res Male Female Male FemaleSC teachers
Text booksUniformAttendanceStationery
% Passed
Avg. No. of Tchs.
%
Female literacyOverall literacy
dev. grant grantSchool T L M
Male Female
IVV
IIIIII
Grade R.R. D.O.R. P.R.
VIIVI
# #
I - V
Enrolment by medium of instructions
Examination results
Retention rate
GPI
Primary cycle U. primary cycleState
DISTRICT ELEMENTARY EDUCATION REPORT CARD : 2005-06
GirlsGrade
IIIIIIIVVVI
VIII
AllGirls
Total
VII
% TotalGrossness
School category
20
2540
5 21 0
660
2520
0 0 0
734 445 2641 0
66 25,4090 00 0
733 44 188,308 10,1172,294 264 2,294
300 0 30011,597 25,135 11,597
0 0 00 0 0
188,425 10,117 2,4626
12213
P + UP P+sec/hs U.P. only UP+sec
School categoryP. only
0.0 0.0 0.0 0.0 0.03.0
Number of Clusters 1106684
% Schools with SCR > 600.0 0.0 9.7 0.0
45.8 42.9 0.0 10.0 0.0% Schools with pre-primary sections 0.1 0.0 0.0 0.3 0.0% Schools with common toilets 94.7 85.7 100.0 97.2 0.0
% Schools with girls toilets 88.9 85.7 100.0 88.8 0.0% Schools with drinking water facility 92.8 100.0 100.0 82.8 0.0
% Enrolment in Govt. schools 94.9 10.3 0.0 68.7 0.0100.0 100.0 100.0 100.0 0.0
% No female teacher schools (tch>=2) 25.4 85.7 100.0 62.2 0.02.1 0.0 0.0 3.4 0.0
0.0 0.0 0.0 0.1 0.0%Enrolment in schools without blackboard 0.0 0.0 0.0 0.0 0.0
2001-02 2002-03 2003-04 2004-05 2005-06IIIIIIIVV
VIVII
Total U.P
48,65547,77342,26835,55026,29115,066
12,288
46,82244,23441,38030,68821,915
12,06510,494
48,69345,29235,55825,89819,647
11,3289,138
50,47035,39127,11619,89414,641
7,2415,119
37,86931,64328,71516,453
86.0
26.0
88.5
27.9
113.6
35.0
39.3
0.00.0
23,23422,94720,25917,07512,158
6,4485,0894,203
111,413
91109138
9370262115
563
5093957049242014
415
3,305
classrooms
488
1,2710
81.7100.0100.0
85.00.0
13.90.0
4.4
0.012.8
0.0
0.00.02.20.0
112
5230
1,007 774 1 0 0 3 07 0 0 0 0 01 0 0 0 0 0
312 1 0 0 5 20 0 0 0 0 0
13 158 500 695 225 1 00 0 2 15 2 0 0 00 0 0 1 3 0 0 0
28 27 396 358 149 3 0 10 0 0 0 0 0 0 0
9 285 335 258 85 2 0 0
124618
4800
0
10
1620
364 0 485 489 0 274 125 11 40000
0000
0000
0000
00
1450
00
300
0040
0010
Terminalgrade Passed
VIII boysV girlsV boys
VIII girls
18 with >60%
1.9258419
4962
0
0.00.02.10.0
1.90.0
1.20.0
197710Hindi Urdu Others
1771300
368050
326787
0100
0
50600
1010
% Schools recvd.
87.00.00.0
60.90.0
86.40.00.0
60.30.0
818210
1180
6651000
795690
860
6919000
3.32.74.03.00.0
0.00.00.10.0
0.50.50.3
0.00.0
68.5
0.91
2005-062004-052003-04
UTTAR PRADESH
0.0
Upper PrimaryPrimary
Sex ratio Sex ratio 0-6
8 104
VIII0.0
Enrolment of children
VIII 4,093 8,249 9,084 10,515Total Pr. 147,512 175,088 185,039 200,537
1 - 5 6 - 8
791 1710 00 0
0 4
%Teachers recvd.in-service training
Total schools* Rural schools* Total enrolment* Rural enrolment* Teachers*
8.1 27.5
100.0
25.4
81.8 84.8
20.2 25.7% SC enrolment% SC girls to SC enrolment% ST enrolment
47.0 36.2
0.0 60.6
34.7
48.1
30.6
46.6
Position of teachers by educational qualification (other than para teacher)
(Previous academic year)Incentives : Number of beneficiaries
% ST girls to ST enrolment
% Girls
Number of villages
% 0 - 6 population
% SC population % ST population
% Urban population
% Schools with blackboard
% Enrolment in single-teacher schools
% Enrolment in schools without building
Primary Upperprimary
OBC EnrolmentPrimary U. Primary
% OBCEnrolment% OBC girls toOBC Enrolment
Pupil-teacher ratio (PTR)Student-classroom ratio (SCR)% Schools with <= 50 students% Schools with PTR > 100% Female teachers
% Schools established since 1995
Regular teachers Para-teachers
% minorrepairs
% majorrepairs
# = not applicable na = not available * Some totals may not match due to no response in classificatory data items
4.5 95.514.0 85.914.3 85.731.5 68.5
9.8 90.23875
47.87760
2.125.833.037.8
41.8135
530.0
57.15.3
42.9
41.63829
28.45.6
16.860.6
0.000
0.00.00.00.0
26.7 36.1 na 46.9 29.8
9468957.120.5
Category
PrivateGovt.PrivateGovtPrivateGovt.PrivateGovt.PrivateGovt.
Total population (in 000's)
Number of blocks/taluks
District
Decadal growth rate
Primary onlyPrimary with upper primaryPrimary with upper primary & sec/higher sec.Upper primary onlyUpper primary with sec./higher secondary
% Single classroom schools% Single teacher schools
P + UP P+sec/hs U.P. only UP+secP. only
No response in school category
Primary with upper primaryPrimary with U.P. & sec/higherUpper primary onlyUpper primary with sec./higher sec
Primary only
Primary onlyPrimary with upper primaryPrimary with Upper primary & sec/higherUpper primary only
Para-teachers
School category
Upper primary with sec./higher secondary
Primary onlyPrimary with upper prim.
P. onlyP + UPP+sec/hsU.P. onlyUP+sec
NER(U.Prim)GER(U.Prim)NER (Primary)GER (Primary)
Transition ratePrim. to U. Prim
SC/ST Enrolment
Indicators
Classrooms/Other rooms
Prim.with U.P.&Sec/H.SUpper Primary onlyU. Primary with Sec./H.S.
Basic Data, 2001
Data reported from
Performance indicators
99.9 25.699.9 24.8
100.0 27.5100.0 31.4

546
Elementary Education in India - Where do we stand ?
32.1 33.3
Key data: Elementary Education
3207
KHERI
(Previous academic year)
(Previous year)
Gender and caste distribution of teachers*
No. of schools by type of building*
BoysWith disability
Flow rates
Primary Level
Enrolment*
Number of schools
Grade
GER / NER
School category
Primary Upper primaryBoys Boys GirlsGirls
IncentiveType
School categoryMultiple
TypeKuccha
PartiallyPucca
PuccaTotal % good condition
Otherrooms
TentNo
Building
Classrooms
Belowsecondary
Highersecondary
Postgraduate
M. Phil.GraduateSecondarySchool category OthersNo
response
ST teachers
Total Male Female No res Male Female No res Male Female Male FemaleSC teachers
Text booksUniformAttendanceStationery
% Passed
Avg. No. of Tchs.
%
Female literacyOverall literacy
dev. grant grantSchool T L M
Male Female
IVV
IIIIII
Grade R.R. D.O.R. P.R.
VIIVI
# #
I - V
Enrolment by medium of instructions
Examination results
Retention rate
GPI
Primary cycle U. primary cycleState
DISTRICT ELEMENTARY EDUCATION REPORT CARD : 2005-06
GirlsGrade
IIIIIIIVVVI
VIII
AllGirls
Total
VII
% TotalGrossness
School category
82
47617
49 510 07833
46614
53 2 0
2,075 25329 1,892
2 69959 76,95815 4,298
1 0
2,032 167 453,757 26,24516,137 1,099 10,155
4,143 0 51715,528 75,838 11,625
0 0 010,756 3,161 5,851
461,755 41,750 6,06331
860242
P + UP P+sec/hs U.P. only UP+sec
School categoryP. only
0.3 1.8 0.0 0.0 0.05.4
Number of Clusters 30562011
% Schools with SCR > 600.0 0.0 21.8 2.0
57.3 17.5 8.3 18.2 6.0% Schools with pre-primary sections 2.7 0.0 8.3 0.7 0.0% Schools with common toilets 98.2 96.5 83.3 97.3 94.0
% Schools with girls toilets 84.9 94.7 83.3 81.9 76.0% Schools with drinking water facility 99.8 100.0 100.0 100.0 100.0
% Enrolment in Govt. schools 91.7 10.5 14.4 83.2 28.698.7 91.2 91.7 98.7 98.0
% No female teacher schools (tch>=2) 25.6 43.9 16.7 47.7 74.04.3 0.0 0.0 11.5 0.3
0.2 0.0 0.0 0.0 0.0%Enrolment in schools without blackboard 0.6 6.8 5.5 1.0 3.5
2001-02 2002-03 2003-04 2004-05 2005-06IIIIIIIVV
VIVII
Total U.P
109,265114,604113,677101,146
78,96645,784
38,571
119,121115,830108,624
83,34772,849
37,53929,082
131,156108,399
86,31275,43367,838
29,70722,715
118,40389,49884,23675,15361,151
18,10212,419
89,46073,61869,97356,99645,941
2,3981,919
116,25891,30971,15140,5485,868
91.9
25.6
94.8
31.9
118.2
43.3
60.2
0.025.0
51,31855,27154,03347,22435,82019,01016,09012,828
291,594
456875
1,010950843410374286
5,204
619754820775423334295150
4,170
7,251
classrooms
515166
2,336733
67.290.394.073.289.1
26.58.5
6.3
6.021.3
4.6
1.20.05.66.3
8830
703168
2,429 2,277 28 1 1 9 1255 1 0 0 1 010 0 0 0 2 0
548 3 0 0 3 046 0 0 0 4 0
97 744 1,207 1,306 677 3 92 4 49 118 90 1 0 70 1 15 25 27 0 0 2
15 64 453 551 356 1 1 251 0 6 72 134 1 0 3
25 104 1,502 818 354 1 0 0
2937171
381135
190
10032
33127
1133 0 1487 1366 0 817 278 49 310000
2014
0000
0000
163
19911
41
450
10
230
2000
Terminalgrade Passed
VIII boysV girlsV boys
VIII girls
27 with >60%
13.16923273
701467
221
3.50.0
16.42.1
12.01.06.3
10.03.7
497188Hindi Others Urdu Gujarati Bengali
165434842
9108914665
2936358
0988389
13831128
067
0
7150000
000
3870
% Schools recvd.
88.015.8
0.080.0
4.0
83.510.5
0.071.7
4.0
180041323
104571226
1555820
1304494
1688171042
96254237
219060
10563113
3.04.85.82.64.4
2.11.61.71.6
2.42.02.7
2.31.8
86.4
61.6
0.89
2005-062004-052003-04
UTTAR PRADESH
45.7
Upper PrimaryPrimary
Sex ratio Sex ratio 0-6
19 162
VIII25.0
Enrolment of children
1,551VIII 10,027 18,729 24,688 31,903Total Pr. 335,988 428,441 469,138 499,771 517,658
1 - 5 6 - 8
1,176 29165 156
0 0
15 55
%Teachers recvd.in-service training
Total schools* Rural schools* Total enrolment* Rural enrolment* Teachers*
3.9 18.8
100.0
35.2
89.5 90.8
22.5 28.5% SC enrolment% SC girls to SC enrolment% ST enrolment
47.7 40.71.6
50.4 40.9
37.7
46.6
34.6
40.0
Position of teachers by educational qualification (other than para teacher)
(Previous academic year)Incentives : Number of beneficiaries
% ST girls to ST enrolment
% Girls
Number of villages
% 0 - 6 population
% SC population % ST population
% Urban population
% Schools with blackboard
% Enrolment in single-teacher schools
% Enrolment in schools without building
Primary Upperprimary
OBC EnrolmentPrimary U. Primary
% OBCEnrolment% OBC girls toOBC Enrolment
Pupil-teacher ratio (PTR)Student-classroom ratio (SCR)% Schools with <= 50 students% Schools with PTR > 100% Female teachers
% Schools established since 1995
Regular teachers Para-teachers
% minorrepairs
% majorrepairs
# = not applicable na = not available * Some totals may not match due to no response in classificatory data items
3.2 94.71.9 96.56.4 91.95.7 92.7
36.1 61.68.8 89.4
2969
47.27369
2.023.036.130.3
39.76635
1.826.336.633.3
42.56340
14.620.422.648.9
31.86821
2.028.012.214.0
32.3 25.6 1.2 48.4 35.4
94387110.819.8
Category
PrivateGovt.PrivateGovtPrivateGovt.PrivateGovt.PrivateGovt.
Total population (in 000's)
Number of blocks/taluks
District
Decadal growth rate
Primary onlyPrimary with upper primaryPrimary with upper primary & sec/higher sec.Upper primary onlyUpper primary with sec./higher secondary
% Single classroom schools% Single teacher schools
P + UP P+sec/hs U.P. only UP+secP. only
No response in school category
Primary with upper primaryPrimary with U.P. & sec/higherUpper primary onlyUpper primary with sec./higher sec
Primary only
Primary onlyPrimary with upper primaryPrimary with Upper primary & sec/higherUpper primary only
Para-teachers
School category
Upper primary with sec./higher secondary
Primary onlyPrimary with upper prim.
P. onlyP + UPP+sec/hsU.P. onlyUP+sec
NER(U.Prim)GER(U.Prim)NER (Primary)GER (Primary)
Transition ratePrim. to U. Prim
1.1
SC/ST Enrolment
Indicators
Classrooms/Other rooms
Prim.with U.P.&Sec/H.SUpper Primary onlyU. Primary with Sec./H.S.
Basic Data, 2001
Data reported from
Performance indicators
97.9 32.598.6 30.297.4 30.098.6 32.2
Utt
ar P
rad
esh

547
Elementary Education: Report Card - KUSHINAGAR
Utt
ar P
rad
esh
0.7500.090
25.5 24.5
Key data: Elementary Education
2893
KUSHINAGAR
(Previous academic year)
(Previous year)
Gender and caste distribution of teachers*
No. of schools by type of building*
BoysWith disability
Flow rates
Primary Level
Enrolment*
Number of schools
Grade
GER / NER
School category
Primary Upper primaryBoys Boys GirlsGirls
IncentiveType
School categoryMultiple
TypeKuccha
PartiallyPucca
PuccaTotal % good condition
Otherrooms
TentNo
Building
Classrooms
Belowsecondary
Highersecondary
Postgraduate
M. Phil.GraduateSecondarySchool category OthersNo
response
ST teachers
Total Male Female No res Male Female No res Male Female Male FemaleSC teachers
Text booksUniformAttendanceStationery
% Passed
Avg. No. of Tchs.
%
Female literacyOverall literacy
dev. grant grantSchool T L M
Male Female
IVV
IIIIII
Grade R.R. D.O.R. P.R.
VIIVI
# #
I - V
Enrolment by medium of instructions
Examination results
Retention rate
GPI
Primary cycle U. primary cycleState
DISTRICT ELEMENTARY EDUCATION REPORT CARD : 2005-06
GirlsGrade
IIIIIIIVVVI
VIII
AllGirls
Total
VII
% TotalGrossness
School category
61
3721
81 516 1
11847
3671
0 0 0
1,604 32673 2,62914 161
114 36,16146 399
0 0
1,586 310 382,587 83,02537,047 2,284 31,760
7,090 161 6,48028,074 35,708 27,328
0 0 018,093 399 17,754
386,799 86,784 3,69317
852252
P + UP P+sec/hs U.P. only UP+sec
School categoryP. only
0.4 0.0 0.0 0.0 0.012.0
Number of Clusters 25721404
% Schools with SCR > 600.0 5.9 42.7 2.1
63.6 31.0 17.6 7.6 20.8% Schools with pre-primary sections 11.7 1.1 5.9 1.2 2.1% Schools with common toilets 51.1 79.3 82.4 84.1 97.9
% Schools with girls toilets 27.9 58.6 76.5 58.2 93.8% Schools with drinking water facility 98.2 100.0 100.0 81.2 100.0
% Enrolment in Govt. schools 81.7 6.6 2.2 56.3 2.299.4 98.9 100.0 93.5 100.0
% No female teacher schools (tch>=2) 36.2 43.7 58.8 40.6 54.29.2 0.0 3.6 19.8 0.8
0.0 0.0 0.0 0.0 0.0%Enrolment in schools without blackboard 0.7 0.8 0.0 2.1 0.0
2001-02 2002-03 2003-04 2004-05 2005-06IIIIIIIVV
VIVII
Total U.P
151,924114,715
91,88481,74164,99337,150
32,600
149,511101,090
93,51873,60955,854
34,14128,903
135,245106,741
84,74063,95352,985
34,31529,453
124,85873,51351,96239,56033,410
15,40712,431
97,05347,11536,64429,77925,425
11,6739,773
97,98089,35890,28738,80629,977
97.1
36.4
100.8
35.0
127.9
40.5
44.4
0.017.6
72,95856,62845,61440,22830,97517,09914,87412,350
290,726
321272266290200
654335
1,492
170153203166128
504026
936
6,864
classrooms
714198
2,198555
69.859.479.876.293.0
20.325.1
10.0
18.717.7
6.5
15.51.56.10.5
11528
65885
1,981 1,825 32 5 2 64 155 10 6 4 11 013 0 0 0 4 0
461 5 0 0 23 144 0 0 0 4 0
41 334 917 1,205 457 13 40 2 45 152 69 0 0 00 1 14 40 30 0 3 5
20 26 259 476 248 0 0 262 0 11 52 72 0 1 0
9 29 687 507 221 1 0 0
2591222
80950124
4613
10514
434 0 761 759 0 540 132 8 60000
1160
0100
0000
303
1529
30
170
1270
0010
Terminalgrade Passed
VIII boysV girlsV boys
VIII girls
54 with >60%
36.14545269
951061
138
0.47.4
21.70.0
35.00.00.0
22.90.0
463994Hindi Others Assamese Sanskrit
389836956
6268218492
7604693295
14390
3130000
2080000
% Schools recvd.
66.72.30.0
34.96.3
66.81.15.9
32.96.3
11361763
31736256
91916
154930
14965695
32461251
132389
149137
2.43.15.62.22.9
2.61.10.80.6
1.21.01.0
0.61.4
66.6
65.8
0.95
2005-062004-052003-04
UTTAR PRADESH
14.7
Upper PrimaryPrimary
Sex ratio Sex ratio 0-6
15 145
VIII23.5
Enrolment of children
8,531VIII 10,968 26,519 26,314 28,230Total Pr. 236,016 323,303 443,664 473,582 505,257
1 - 5 6 - 8
653 4080 1380 0
4 91
%Teachers recvd.in-service training
Total schools* Rural schools* Total enrolment* Rural enrolment* Teachers*
7.4 11.5
100.0
35.8
92.3 94.3
34.4 31.5% SC enrolment% SC girls to SC enrolment% ST enrolment
48.1 46.1
52.3 50.3
65.1
49.1
58.1
44.5
Position of teachers by educational qualification (other than para teacher)
(Previous academic year)Incentives : Number of beneficiaries
% ST girls to ST enrolment
% Girls
Number of villages
% 0 - 6 population
% SC population % ST population
% Urban population
% Schools with blackboard
% Enrolment in single-teacher schools
% Enrolment in schools without building
Primary Upperprimary
OBC EnrolmentPrimary U. Primary
% OBCEnrolment% OBC girls toOBC Enrolment
Pupil-teacher ratio (PTR)Student-classroom ratio (SCR)% Schools with <= 50 students% Schools with PTR > 100% Female teachers
% Schools established since 1995
Regular teachers Para-teachers
% minorrepairs
% majorrepairs
# = not applicable na = not available * Some totals may not match due to no response in classificatory data items
21.4 76.08.7 90.2
12.3 86.911.6 87.833.6 65.816.8 81.8
4.2 94.62.3 96.7
3776
49.2104
692.1
43.326.235.4
42.1147
560.0
24.117.137.9
46.26129
32.914.1
9.956.7
43.1134
330.0
31.310.1
4.2
28.2 18.1 na 46.9 29.6
9559634.620.3
Category
PrivateGovt.PrivateGovtPrivateGovt.PrivateGovt.PrivateGovt.
Total population (in 000's)
Number of blocks/taluks
District
Decadal growth rate
Primary onlyPrimary with upper primaryPrimary with upper primary & sec/higher sec.Upper primary onlyUpper primary with sec./higher secondary
% Single classroom schools% Single teacher schools
P + UP P+sec/hs U.P. only UP+secP. only
No response in school category
Primary with upper primaryPrimary with U.P. & sec/higherUpper primary onlyUpper primary with sec./higher sec
Primary only
Primary onlyPrimary with upper primaryPrimary with Upper primary & sec/higherUpper primary only
Para-teachers
School category
Upper primary with sec./higher secondary
Primary onlyPrimary with upper prim.
P. onlyP + UPP+sec/hsU.P. onlyUP+sec
NER(U.Prim)GER(U.Prim)NER (Primary)GER (Primary)
Transition ratePrim. to U. Prim
SC/ST Enrolment
Indicators
Classrooms/Other rooms
Prim.with U.P.&Sec/H.SUpper Primary onlyU. Primary with Sec./H.S.
Basic Data, 2001
Data reported from
Performance indicators
99.0 45.099.2 40.799.1 37.698.8 39.4

548
Elementary Education in India - Where do we stand ?
21.1 23.4
Key data: Elementary Education
978
LALITPUR
(Previous academic year)
(Previous year)
Gender and caste distribution of teachers*
No. of schools by type of building*
BoysWith disability
Flow rates
Primary Level
Enrolment*
Number of schools
Grade
GER / NER
School category
Primary Upper primaryBoys Boys GirlsGirls
IncentiveType
School categoryMultiple
TypeKuccha
PartiallyPucca
PuccaTotal % good condition
Otherrooms
TentNo
Building
Classrooms
Belowsecondary
Highersecondary
Postgraduate
M. Phil.GraduateSecondarySchool category OthersNo
response
ST teachers
Total Male Female No res Male Female No res Male Female Male FemaleSC teachers
Text booksUniformAttendanceStationery
% Passed
Avg. No. of Tchs.
%
Female literacyOverall literacy
dev. grant grantSchool T L M
Male Female
IVV
IIIIII
Grade R.R. D.O.R. P.R.
VIIVI
# #
I - V
Enrolment by medium of instructions
Examination results
Retention rate
GPI
Primary cycle U. primary cycleState
DISTRICT ELEMENTARY EDUCATION REPORT CARD : 2005-06
GirlsGrade
IIIIIIIVVVI
VIII
AllGirls
Total
VII
% TotalGrossness
School category
42
3047
37 20 0
4214
2965
21 0 0
881 1844 2,0060 1,592
31 35,1807 1,4420 0
848 124 146,772 20,1299,709 400 649
0 0 06,146 34,596 4,522
0 0 02,869 1,035 1,796
151,854 28,092 2,49534
953306
P + UP P+sec/hs U.P. only UP+sec
School categoryP. only
0.8 0.0 0.0 0.0 0.04.3
Number of Clusters 1496704
% Schools with SCR > 600.0 0.0 34.1 0.0
39.4 0.0 50.0 7.5 9.5% Schools with pre-primary sections 23.3 14.6 50.0 1.7 4.8% Schools with common toilets 93.9 100.0 100.0 86.7 100.0
% Schools with girls toilets 85.1 97.6 100.0 75.7 52.4% Schools with drinking water facility 94.3 100.0 100.0 94.2 100.0
% Enrolment in Govt. schools 84.4 17.1 100.0 85.1 33.4100.0 100.0 100.0 100.0 100.0
% No female teacher schools (tch>=2) 37.3 4.9 0.0 29.5 81.02.3 0.0 0.0 25.2 0.0
0.9 0.0 0.0 1.5 0.0%Enrolment in schools without blackboard 0.0 0.0 0.0 0.0 0.0
2001-02 2002-03 2003-04 2004-05 2005-06IIIIIIIVV
VIVII
Total U.P
46,30840,74238,25134,01428,57621,171
16,298
40,18137,05536,44630,32125,795
17,89114,454
36,57535,39332,81828,38622,518
15,45612,577
37,29033,18933,03825,93521,120
13,26810,493
34,54935,05730,20324,78420,937
11,4279,963
50,99944,34638,63032,79229,647
100.5
45.9
106.4
51.1
140.7
62.4
100.0
0.050.0
22,18119,55718,00915,81012,632
8,3336,2554,791
107,568
123136152154110
865844
863
114133105
9160333126
593
3,417
classrooms
41324
1,240164
81.998.5
100.091.9
100.0
14.31.5
3.7
0.07.10.0
0.00.01.00.0
783
44738
1,046 1,029 14 0 0 7 1537 0 0 0 4 0
2 0 0 0 0 0336 2 0 0 0 8
21 0 0 0 0 0
35 354 761 1,111 285 3 00 2 49 207 79 2 0 10 0 1 4 9 0 0 0
18 40 296 385 164 1 0 00 2 11 53 53 1 0 0
5 30 513 266 68 0 0 0
1594125
0632106
21514
27214
965 0 584 305 0 384 130 26 80000
0000
0000
0000
150
7918
132
400
1061
0020
Terminalgrade Passed
VIII boysV girlsV boys
VIII girls
10 with >60%
12.93448340
14904120
0.00.0
17.60.0
10.50.00.0
19.50.0
179861Hindi English Others
101091592
411924311
01606
000
8500
1340
% Schools recvd.
72.30.00.0
62.44.8
81.22.40.0
82.719.0
62722157168157
87140
9370
626830
1070
97400
4320
3.28.37.02.65.7
4.55.26.86.0
5.43.55.7
5.15.5
78.9
78.3
0.88
2005-062004-052003-04
UTTAR PRADESH
100.0
Upper PrimaryPrimary
Sex ratio Sex ratio 0-6
7 50
VIII0.0
Enrolment of children
8,257VIII 9,031 10,597 12,001 13,530Total Pr. 145,530 150,572 155,690 169,798 187,891
1 - 5 6 - 8
698 20644 76
0 0
14 0
%Teachers recvd.in-service training
Total schools* Rural schools* Total enrolment* Rural enrolment* Teachers*
12.7 25.1
100.0
46.7
86.0 92.1
35.6 37.8% SC enrolment% SC girls to SC enrolment% ST enrolment
46.5 38.15.7
46.2 29.6
57.5
47.0
52.9
36.2
Position of teachers by educational qualification (other than para teacher)
(Previous academic year)Incentives : Number of beneficiaries
% ST girls to ST enrolment
% Girls
Number of villages
% 0 - 6 population
% SC population % ST population
% Urban population
% Schools with blackboard
% Enrolment in single-teacher schools
% Enrolment in schools without building
Primary Upperprimary
OBC EnrolmentPrimary U. Primary
% OBCEnrolment% OBC girls toOBC Enrolment
Pupil-teacher ratio (PTR)Student-classroom ratio (SCR)% Schools with <= 50 students% Schools with PTR > 100% Female teachers
% Schools established since 1995
Regular teachers Para-teachers
% minorrepairs
% majorrepairs
# = not applicable na = not available * Some totals may not match due to no response in classificatory data items
4.9 88.34.1 89.9
16.6 78.33.6 90.96.3 88.37.6 88.9
66114
47.05253
5.49.9
36.836.2
41.63428
0.00.0
63.243.9
37.44633
17.113.030.164.2
25.63626
0.00.0
11.74.8
30.0 24.9 na 49.5 33.0
93188214.520.5
Category
PrivateGovt.PrivateGovtPrivateGovt.PrivateGovt.PrivateGovt.
Total population (in 000's)
Number of blocks/taluks
District
Decadal growth rate
Primary onlyPrimary with upper primaryPrimary with upper primary & sec/higher sec.Upper primary onlyUpper primary with sec./higher secondary
% Single classroom schools% Single teacher schools
P + UP P+sec/hs U.P. only UP+secP. only
No response in school category
Primary with upper primaryPrimary with U.P. & sec/higherUpper primary onlyUpper primary with sec./higher sec
Primary only
Primary onlyPrimary with upper primaryPrimary with Upper primary & sec/higherUpper primary only
Para-teachers
School category
Upper primary with sec./higher secondary
Primary onlyPrimary with upper prim.
P. onlyP + UPP+sec/hsU.P. onlyUP+sec
NER(U.Prim)GER(U.Prim)NER (Primary)GER (Primary)
Transition ratePrim. to U. Prim
3.5
SC/ST Enrolment
Indicators
Classrooms/Other rooms
Prim.with U.P.&Sec/H.SUpper Primary onlyU. Primary with Sec./H.S.
Basic Data, 2001
Data reported from
Performance indicators
98.0 26.698.3 25.090.0 17.094.1 20.0
Utt
ar P
rad
esh

549
Elementary Education: Report Card - LUCKNOW
Utt
ar P
rad
esh
32.6 36.3
Key data: Elementary Education
3648
LUCKNOW
(Previous academic year)
(Previous year)
Gender and caste distribution of teachers*
No. of schools by type of building*
BoysWith disability
Flow rates
Primary Level
Enrolment*
Number of schools
Grade
GER / NER
School category
Primary Upper primaryBoys Boys GirlsGirls
IncentiveType
School categoryMultiple
TypeKuccha
PartiallyPucca
PuccaTotal % good condition
Otherrooms
TentNo
Building
Classrooms
Belowsecondary
Highersecondary
Postgraduate
M. Phil.GraduateSecondarySchool category OthersNo
response
ST teachers
Total Male Female No res Male Female No res Male Female Male FemaleSC teachers
Text booksUniformAttendanceStationery
% Passed
Avg. No. of Tchs.
%
Female literacyOverall literacy
dev. grant grantSchool T L M
Male Female
IVV
IIIIII
Grade R.R. D.O.R. P.R.
VIIVI
# #
I - V
Enrolment by medium of instructions
Examination results
Retention rate
GPI
Primary cycle U. primary cycleState
DISTRICT ELEMENTARY EDUCATION REPORT CARD : 2005-06
GirlsGrade
IIIIIIIVVVI
VIII
AllGirls
Total
VII
% TotalGrossness
School category
390
3230
287 2312 04612
2680
218 0 0
1,326 40491 9,260
7 034 40,42510 0
0 0
1,048 189 173,138 41,18388,252 5,768 31,262
2,978 0 1,3065,977 34,071 4,848
0 0 02,795 0 2,479
227,790 98,655 4,540155
1,008963
P + UP P+sec/hs U.P. only UP+sec
School categoryP. only
2.0 0.6 0.0 1.4 0.02.1
Number of Clusters 2667996
% Schools with SCR > 601.5 0.0 19.5 0.0
40.1 24.8 0.0 11.7 8.3% Schools with pre-primary sections 23.1 7.7 8.3 4.6 16.7% Schools with common toilets 75.0 95.1 91.7 73.4 100.0
% Schools with girls toilets 65.4 91.7 83.3 62.3 100.0% Schools with drinking water facility 96.2 99.4 100.0 87.5 100.0
% Enrolment in Govt. schools 69.8 9.5 0.0 87.1 0.0100.0 100.0 100.0 100.0 100.0
% No female teacher schools (tch>=2) 22.8 35.6 58.3 27.6 58.31.3 1.7 0.0 12.5 0.0
0.0 0.0 0.0 0.0 0.0%Enrolment in schools without blackboard 0.0 0.0 0.0 0.0 0.0
2001-02 2002-03 2003-04 2004-05 2005-06IIIIIIIVV
VIVII
Total U.P
89,43185,32383,60573,47262,08830,629
27,233
86,06781,68475,06358,28347,054
23,18618,671
90,82678,71266,81254,23245,044
22,82318,567
79,26060,85554,90645,44637,563
15,73011,985
82,21358,13857,21738,834
57.7
18.1
57.9
17.8
79.1
26.9
43.8
0.050.0
44,67942,87942,20837,46331,35615,68913,78812,214
240,276
109378906479284
608446
2,346
108534657352126
817949
1,986
5,662
classrooms
2,31089
1,441120
71.090.865.273.259.2
24.08.5
5.0
34.820.240.8
0.70.06.60.0
65324
41224
1,698 1,657 36 2 0 5 30311 6 0 0 6 3
10 1 0 0 0 1357 8 0 0 3 1
12 0 0 0 0 0
797 523 731 949 704 15 4245 506 57 162 81 2 1 34
9 4 2 7 2 1 0 460 106 227 349 234 3 1 4210 6 1 7 9 0 0 10
132 38 405 472 177 3 0 0
1957655
21605
33
4338
41710
2050 0 657 884 0 440 359 19 280000
11090
19030
0000
474
913
241
790
80
131
5123
Terminalgrade Passed
VIII boysV girlsV boys
VIII girls
284 with >60%
28.855481118
291034
43
0.50.0
30.30.0
35.90.40.0
26.40.0
310517Hindi Others English Sanskrit Urdu
886482829
445992479
1956189
0238
0
9330000
3850000
18448
000
% Schools recvd.
40.41.2
16.736.6
0.0
66.80.30.0
55.60.0
74015223
450282
29560
484103
83732316
459065
41820
346111
3.23.42.42.83.6
1.61.32.01.5
1.00.90.5
0.91.5
64.6
1.02
2005-062004-052003-04
UTTAR PRADESH
27.6
Upper PrimaryPrimary
Sex ratio Sex ratio 0-6
9 136
VIII33.3
Enrolment of children
VIII 11,119 15,827 16,281 24,351Total Pr. 278,030 335,626 348,151 393,919
1 - 5 6 - 8
882 1520 430 0
0 29
%Teachers recvd.in-service training
Total schools* Rural schools* Total enrolment* Rural enrolment* Teachers*
7.7 19.3
73.0
21.8
56.5 52.0
12.7 13.9% SC enrolment% SC girls to SC enrolment% ST enrolment
49.4 49.01.1
48.6 58.1
32.0
51.0
32.5
51.9
Position of teachers by educational qualification (other than para teacher)
(Previous academic year)Incentives : Number of beneficiaries
% ST girls to ST enrolment
% Girls
Number of villages
% 0 - 6 population
% SC population % ST population
% Urban population
% Schools with blackboard
% Enrolment in single-teacher schools
% Enrolment in schools without building
Primary Upperprimary
OBC EnrolmentPrimary U. Primary
% OBCEnrolment% OBC girls toOBC Enrolment
Pupil-teacher ratio (PTR)Student-classroom ratio (SCR)% Schools with <= 50 students% Schools with PTR > 100% Female teachers
% Schools established since 1995
Regular teachers Para-teachers
% minorrepairs
% majorrepairs
# = not applicable na = not available * Some totals may not match due to no response in classificatory data items
0.5 97.9
1.3 96.7
34.5 64.63.4 95.1
33103
50.65958
4.716.552.923.0
49.88742
1.839.640.417.2
51.64532
18.411.140.654.2
45.66523
0.08.3
23.316.7
33.3 21.3 0.1 68.7 60.5
91588863.615.0
Category
PrivateGovt.PrivateGovtPrivateGovt.PrivateGovt.PrivateGovt.
Total population (in 000's)
Number of blocks/taluks
District
Decadal growth rate
Primary onlyPrimary with upper primaryPrimary with upper primary & sec/higher sec.Upper primary onlyUpper primary with sec./higher secondary
% Single classroom schools% Single teacher schools
P + UP P+sec/hs U.P. only UP+secP. only
No response in school category
Primary with upper primaryPrimary with U.P. & sec/higherUpper primary onlyUpper primary with sec./higher sec
Primary only
Primary onlyPrimary with upper primaryPrimary with Upper primary & sec/higherUpper primary only
Para-teachers
School category
Upper primary with sec./higher secondary
Primary onlyPrimary with upper prim.
P. onlyP + UPP+sec/hsU.P. onlyUP+sec
NER(U.Prim)GER(U.Prim)NER (Primary)GER (Primary)
Transition ratePrim. to U. Prim
1.2
SC/ST Enrolment
Indicators
Classrooms/Other rooms
Prim.with U.P.&Sec/H.SUpper Primary onlyU. Primary with Sec./H.S.
Basic Data, 2001
Data reported from
Performance indicators
98.4 38.698.6 38.697.0 35.897.7 40.3

550
Elementary Education in India - Where do we stand ?
0.2280.286
25.5 25.2
Key data: Elementary Education
2174
MAHARAJGANJ
(Previous academic year)
(Previous year)
Gender and caste distribution of teachers*
No. of schools by type of building*
BoysWith disability
Flow rates
Primary Level
Enrolment*
Number of schools
Grade
GER / NER
School category
Primary Upper primaryBoys Boys GirlsGirls
IncentiveType
School categoryMultiple
TypeKuccha
PartiallyPucca
PuccaTotal % good condition
Otherrooms
TentNo
Building
Classrooms
Belowsecondary
Highersecondary
Postgraduate
M. Phil.GraduateSecondarySchool category OthersNo
response
ST teachers
Total Male Female No res Male Female No res Male Female Male FemaleSC teachers
Text booksUniformAttendanceStationery
% Passed
Avg. No. of Tchs.
%
Female literacyOverall literacy
dev. grant grantSchool T L M
Male Female
IVV
IIIIII
Grade R.R. D.O.R. P.R.
VIIVI
# #
I - V
Enrolment by medium of instructions
Examination results
Retention rate
GPI
Primary cycle U. primary cycleState
DISTRICT ELEMENTARY EDUCATION REPORT CARD : 2005-06
GirlsGrade
IIIIIIIVVVI
VIII
AllGirls
Total
VII
% TotalGrossness
School category
21
2701
82 219 170
5270
11 0 0
1,162 21682 38919 16470 28,543
5 1430 0
1,160 216 279,236 53,17734,851 389 34,85111,221 164 11,22116,981 28,543 16,981
0 0 01,498 143 1,498
279,688 53,177 3,35914
1,043612
P + UP P+sec/hs U.P. only UP+sec
School categoryP. only
0.2 0.0 0.0 0.0 16.72.6
Number of Clusters 18291039
% Schools with SCR > 600.0 0.0 37.1 0.0
61.8 21.4 45.0 14.7 33.3% Schools with pre-primary sections 31.6 4.8 5.0 2.6 0.0% Schools with common toilets 91.7 90.5 95.0 83.5 100.0
% Schools with girls toilets 86.9 83.3 95.0 79.4 100.0% Schools with drinking water facility 99.1 100.0 100.0 87.4 100.0
% Enrolment in Govt. schools 84.0 1.1 1.4 62.7 8.798.7 98.8 100.0 97.9 100.0
% No female teacher schools (tch>=2) 18.3 67.9 85.0 44.7 83.31.9 0.0 0.0 13.1 0.0
0.1 0.0 0.0 0.4 0.0%Enrolment in schools without blackboard 0.7 0.9 0.0 0.9 0.0
2001-02 2002-03 2003-04 2004-05 2005-06IIIIIIIVV
VIVII
Total U.P
96,76581,55370,35364,75850,04825,679
20,490
98,66077,14474,12655,34541,262
20,82117,165
99,46480,99960,81342,73235,758
16,18613,395
111,39263,97546,61336,82632,403
10,8098,538
83,75949,55341,54535,27130,247
7,2515,993
63,17852,80340,91326,99618,265
93.0
21.9
97.9
27.4
122.5
34.8
40.7
0.045.0
46,05640,30934,42731,37922,84210,752
8,2366,852
200,853
471513445479383136121
892,637
388422438394266105122
942,229
4,831
classrooms
768218
1,33045
66.072.961.083.377.8
27.922.5
6.2
28.412.422.2
4.610.6
4.30.0
14652
45216
1,543 1,291 35 5 0 39 858 10 1 0 15 013 2 0 0 5 0
324 5 1 0 8 25 0 0 0 1 0
26 285 788 869 295 6 41 20 157 315 133 0 0 00 4 54 49 13 0 0 22 5 201 427 234 3 0 10 0 0 14 10 0 0 4
2 5 954 769 394 3 0 0
1966573117747
26
535
1262
307 0 1025 1104 0 473 201 21 90000
0000
0000
0000
872
1560
60
210
0050
0010
Terminalgrade Passed
VIII boysV girlsV boys
VIII girls
0 with >60%
26.84402626122873
28
0.00.0
30.83.8
24.20.00.0
31.70.0
327256Hindi Urdu Others
315659292
454441641
560936302093
00
000
800
% Schools recvd.
73.97.10.0
41.216.7
76.63.60.0
46.233.3
1117380
81621551
704814
9089427
118697479
80803489
94006
7520437
3.27.56.12.64.7
4.72.01.81.4
0.30.50.7
1.32.5
59.1
62.1
0.93
2005-062004-052003-04
UTTAR PRADESH
4.1
Upper PrimaryPrimary
Sex ratio Sex ratio 0-6
17 108
VIII15.0
Enrolment of children
5,021VIII 7,649 11,332 14,817 17,009Total Pr. 240,375 291,209 319,766 346,537 363,477
1 - 5 6 - 8
521 3522 260 0
4 118
%Teachers recvd.in-service training
Total schools* Rural schools* Total enrolment* Rural enrolment* Teachers*
5.7 10.6
100.0
31.1
92.3 93.0
18.4 25.1% SC enrolment% SC girls to SC enrolment% ST enrolment
48.7 46.0
46.7 50.0
57.9
48.7
54.3
39.9
Position of teachers by educational qualification (other than para teacher)
(Previous academic year)Incentives : Number of beneficiaries
% ST girls to ST enrolment
% Girls
Number of villages
% 0 - 6 population
% SC population % ST population
% Urban population
% Schools with blackboard
% Enrolment in single-teacher schools
% Enrolment in schools without building
Primary Upperprimary
OBC EnrolmentPrimary U. Primary
% OBCEnrolment% OBC girls toOBC Enrolment
Pupil-teacher ratio (PTR)Student-classroom ratio (SCR)% Schools with <= 50 students% Schools with PTR > 100% Female teachers
% Schools established since 1995
Regular teachers Para-teachers
% minorrepairs
% majorrepairs
# = not applicable na = not available * Some totals may not match due to no response in classificatory data items
14.3 81.18.6 89.4
11.8 86.39.2 89.4
36.6 62.114.3 83.1
1.7 98.01.0 98.5
5293
49.07669
0.925.232.142.4
35.55646
0.09.58.5
27.4
43.85234
32.910.914.465.9
37.95936
0.00.07.1
16.7
29.3 19.5 0.1 46.6 27.9
9589345.121.1
Category
PrivateGovt.PrivateGovtPrivateGovt.PrivateGovt.PrivateGovt.
Total population (in 000's)
Number of blocks/taluks
District
Decadal growth rate
Primary onlyPrimary with upper primaryPrimary with upper primary & sec/higher sec.Upper primary onlyUpper primary with sec./higher secondary
% Single classroom schools% Single teacher schools
P + UP P+sec/hs U.P. only UP+secP. only
No response in school category
Primary with upper primaryPrimary with U.P. & sec/higherUpper primary onlyUpper primary with sec./higher sec
Primary only
Primary onlyPrimary with upper primaryPrimary with Upper primary & sec/higherUpper primary only
Para-teachers
School category
Upper primary with sec./higher secondary
Primary onlyPrimary with upper prim.
P. onlyP + UPP+sec/hsU.P. onlyUP+sec
NER(U.Prim)GER(U.Prim)NER (Primary)GER (Primary)
Transition ratePrim. to U. Prim
SC/ST Enrolment
Indicators
Classrooms/Other rooms
Prim.with U.P.&Sec/H.SUpper Primary onlyU. Primary with Sec./H.S.
Basic Data, 2001
Data reported from
Performance indicators
98.9 37.698.9 31.399.5 39.099.6 35.0
Utt
ar P
rad
esh

551
Elementary Education: Report Card - MAHOBA
Utt
ar P
rad
esh
0.0590.284
27.3 27.2
Key data: Elementary Education
708
MAHOBA
(Previous academic year)
(Previous year)
Gender and caste distribution of teachers*
No. of schools by type of building*
BoysWith disability
Flow rates
Primary Level
Enrolment*
Number of schools
Grade
GER / NER
School category
Primary Upper primaryBoys Boys GirlsGirls
IncentiveType
School categoryMultiple
TypeKuccha
PartiallyPucca
PuccaTotal % good condition
Otherrooms
TentNo
Building
Classrooms
Belowsecondary
Highersecondary
Postgraduate
M. Phil.GraduateSecondarySchool category OthersNo
response
ST teachers
Total Male Female No res Male Female No res Male Female Male FemaleSC teachers
Text booksUniformAttendanceStationery
% Passed
Avg. No. of Tchs.
%
Female literacyOverall literacy
dev. grant grantSchool T L M
Male Female
IVV
IIIIII
Grade R.R. D.O.R. P.R.
VIIVI
# #
I - V
Enrolment by medium of instructions
Examination results
Retention rate
GPI
Primary cycle U. primary cycleState
DISTRICT ELEMENTARY EDUCATION REPORT CARD : 2005-06
GirlsGrade
IIIIIIIVVVI
VIII
AllGirls
Total
VII
% TotalGrossness
School category
10
2107
57 18 0
379
2032
0 0 0
629 14426 480
4 034 18,803
6 1,6910 0
594 94 92,303 12,21613,261 480 6,267
3,566 0 1,1914,667 18,214 4,451
0 0 01,524 149 985
96,738 18,382 1,76410
602345
P + UP P+sec/hs U.P. only UP+sec
School categoryP. only
0.8 0.0 0.0 0.0 0.03.8
Number of Clusters 1102448
% Schools with SCR > 600.0 0.0 28.7 0.0
31.7 8.6 0.0 4.9 0.0% Schools with pre-primary sections 11.5 1.7 12.5 6.1 0.0% Schools with common toilets 75.0 98.3 100.0 72.9 100.0
% Schools with girls toilets 67.5 96.6 100.0 67.2 93.8% Schools with drinking water facility 92.6 100.0 100.0 81.0 100.0
% Enrolment in Govt. schools 84.0 3.5 0.0 80.1 52.6100.0 100.0 100.0 100.0 100.0
% No female teacher schools (tch>=2) 41.4 41.4 75.0 46.2 81.31.3 0.0 0.0 17.2 0.0
0.0 0.0 0.0 0.0 0.0%Enrolment in schools without blackboard 0.0 0.0 0.0 0.0 0.0
2001-02 2002-03 2003-04 2004-05 2005-06IIIIIIIVV
VIVII
Total U.P
32,64427,95326,09121,07917,68013,565
11,072
28,60127,30523,96519,40316,997
11,7259,670
27,85925,07322,09118,57015,237
9,9788,300
26,68523,26122,04816,96614,101
9,5778,067
22,54822,71618,88414,87512,263
7,8156,551
33,66529,69225,58524,43619,888
98.5
42.6
103.0
48.4
129.7
56.8
37.6
0.037.5
15,60613,07012,329
9,8348,1286,0774,7743,743
73,561
5580
10592
105364035
548
3459715849231719
330
2,456
classrooms
439118892231
75.688.698.376.196.5
19.99.6
4.5
1.718.8
1.7
1.80.05.01.7
10329
35565
758 760 6 4 0 2 154 2 1 0 1 0
8 0 0 0 0 0240 5 0 0 2 0
16 0 0 0 0 0
75 236 484 569 234 1 314 15 9 49 19 0 0 249
1 7 1 4 8 0 0 3238 26 138 195 104 2 0 78
0 1 9 23 18 0 0 39
10 18 190 180 41 0 0 0
1457282
39476
79
7314
10511
452 0 251 206 0 257 65 6 30000
0000
0000
0000
114
608
40
160
0050
0000
Terminalgrade Passed
VIII boysV girlsV boys
VIII girls
307 with >60%
8.22366355
53581
90
0.00.02.70.0
9.40.00.04.80.0
114594Hindi Others Bengali
137413176
229853215
1350
39083
0
1750000
% Schools recvd.
71.91.70.0
59.50.0
70.80.00.0
47.00.0
3757120
241648
25740
230
42250149
219944
54570
310
3.16.16.62.45.6
4.04.04.33.7
1.51.00.9
2.63.8
76.5
78.8
0.89
2005-062004-052003-04
UTTAR PRADESH
26.4
Upper PrimaryPrimary
Sex ratio Sex ratio 0-6
5 41
VIII25.0
Enrolment of children
5,522VIII 6,792 7,307 8,297 9,028Total Pr. 91,286 103,061 108,830 116,271 125,447
1 - 5 6 - 8
419 16242 48
0 0
0 53
%Teachers recvd.in-service training
Total schools* Rural schools* Total enrolment* Rural enrolment* Teachers*
5.3 32.4
100.0
38.4
97.0 96.9
27.0 37.4% SC enrolment% SC girls to SC enrolment% ST enrolment
46.2 40.1
47.5 30.0
55.9
47.0
50.9
41.7
Position of teachers by educational qualification (other than para teacher)
(Previous academic year)Incentives : Number of beneficiaries
% ST girls to ST enrolment
% Girls
Number of villages
% 0 - 6 population
% SC population % ST population
% Urban population
% Schools with blackboard
% Enrolment in single-teacher schools
% Enrolment in schools without building
Primary Upperprimary
OBC EnrolmentPrimary U. Primary
% OBCEnrolment% OBC girls toOBC Enrolment
Pupil-teacher ratio (PTR)Student-classroom ratio (SCR)% Schools with <= 50 students% Schools with PTR > 100% Female teachers
% Schools established since 1995
Regular teachers Para-teachers
% minorrepairs
% majorrepairs
# = not applicable na = not available * Some totals may not match due to no response in classificatory data items
2.1 93.94.2 91.8
10.7 85.07.5 88.9
18.6 78.87.7 88.54.9 93.66.4 92.6
3067
47.54947
10.34.5
27.832.6
40.23931
1.71.7
20.650.0
45.14026
23.94.0
18.160.7
44.23614
6.36.3
12.212.5
21.8 25.8 na 53.3 36.4
90186621.919.0
Category
PrivateGovt.PrivateGovtPrivateGovt.PrivateGovt.PrivateGovt.
Total population (in 000's)
Number of blocks/taluks
District
Decadal growth rate
Primary onlyPrimary with upper primaryPrimary with upper primary & sec/higher sec.Upper primary onlyUpper primary with sec./higher secondary
% Single classroom schools% Single teacher schools
P + UP P+sec/hs U.P. only UP+secP. only
No response in school category
Primary with upper primaryPrimary with U.P. & sec/higherUpper primary onlyUpper primary with sec./higher sec
Primary only
Primary onlyPrimary with upper primaryPrimary with Upper primary & sec/higherUpper primary only
Para-teachers
School category
Upper primary with sec./higher secondary
Primary onlyPrimary with upper prim.
P. onlyP + UPP+sec/hsU.P. onlyUP+sec
NER(U.Prim)GER(U.Prim)NER (Primary)GER (Primary)
Transition ratePrim. to U. Prim
SC/ST Enrolment
Indicators
Classrooms/Other rooms
Prim.with U.P.&Sec/H.SUpper Primary onlyU. Primary with Sec./H.S.
Basic Data, 2001
Data reported from
Performance indicators
99.1 51.698.7 48.298.5 51.698.6 59.1
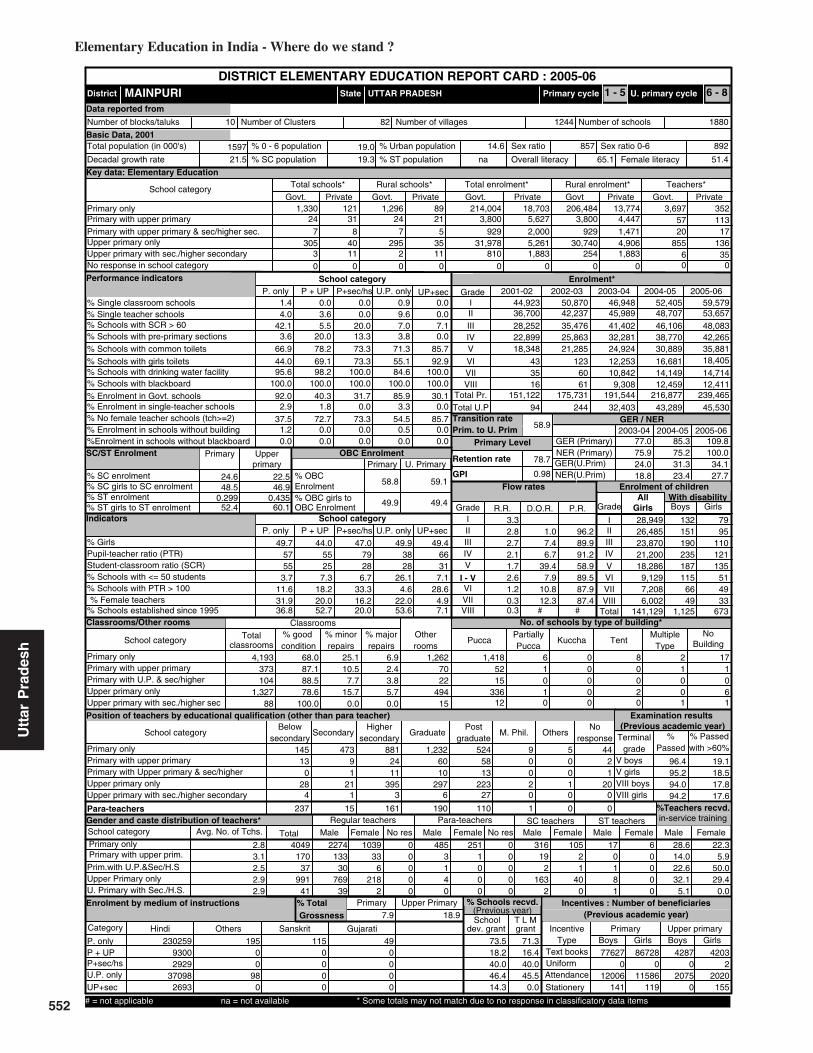
552
Elementary Education in India - Where do we stand ?
0.4350.299
24.6 22.5
Key data: Elementary Education
1597
MAINPURI
(Previous academic year)
(Previous year)
Gender and caste distribution of teachers*
No. of schools by type of building*
BoysWith disability
Flow rates
Primary Level
Enrolment*
Number of schools
Grade
GER / NER
School category
Primary Upper primaryBoys Boys GirlsGirls
IncentiveType
School categoryMultiple
TypeKuccha
PartiallyPucca
PuccaTotal % good condition
Otherrooms
TentNo
Building
Classrooms
Belowsecondary
Highersecondary
Postgraduate
M. Phil.GraduateSecondarySchool category OthersNo
response
ST teachers
Total Male Female No res Male Female No res Male Female Male FemaleSC teachers
Text booksUniformAttendanceStationery
% Passed
Avg. No. of Tchs.
%
Female literacyOverall literacy
dev. grant grantSchool T L M
Male Female
IVV
IIIIII
Grade R.R. D.O.R. P.R.
VIIVI
# #
I - V
Enrolment by medium of instructions
Examination results
Retention rate
GPI
Primary cycle U. primary cycleState
DISTRICT ELEMENTARY EDUCATION REPORT CARD : 2005-06
GirlsGrade
IIIIIIIVVVI
VIII
AllGirls
Total
VII
% TotalGrossness
School category
247
3053
31 248 7
4011
2952
0 0 0
1,330 12121 3,800
5 92935 31,97811 810
0 0
1,296 89 206,484 13,7745,627 3,800 4,4472,000 929 1,4715,261 30,740 4,906
0 0 01,883 254 1,883
214,004 18,703 3,69757
352113
P + UP P+sec/hs U.P. only UP+sec
School categoryP. only
1.4 0.0 0.0 0.9 0.04.0
Number of Clusters 18801244
% Schools with SCR > 603.6 0.0 9.6 0.0
42.1 5.5 20.0 7.0 7.1% Schools with pre-primary sections 3.6 20.0 13.3 3.8 0.0% Schools with common toilets 66.9 78.2 73.3 71.3 85.7
% Schools with girls toilets 44.0 69.1 73.3 55.1 92.9% Schools with drinking water facility 95.6 98.2 100.0 84.6 100.0
% Enrolment in Govt. schools 92.0 40.3 31.7 85.9 30.1100.0 100.0 100.0 100.0 100.0
% No female teacher schools (tch>=2) 37.5 72.7 73.3 54.5 85.72.9 1.8 0.0 3.3 0.0
1.2 0.0 0.0 0.5 0.0%Enrolment in schools without blackboard 0.0 0.0 0.0 0.0 0.0
2001-02 2002-03 2003-04 2004-05 2005-06IIIIIIIVV
VIVII
Total U.P
59,57953,65748,08342,26535,88118,405
14,714
52,40548,70746,10638,77030,889
16,68114,149
46,94845,98941,40232,28124,924
12,25310,842
50,87042,23735,47625,86321,285
12360
44,92336,70028,25222,89918,348
4335
45,53043,28932,40324494
77.0
24.0
85.3
31.3
109.8
34.1
47.0
6.733.3
28,94926,48523,87021,20018,286
9,1297,2086,002
141,129
132151190235187115
6649
1,125
7995
110121135
514933
673
4,193
classrooms
373104
1,32788
68.087.188.578.6
100.0
25.110.5
6.9
7.715.7
0.0
2.43.85.70.0
7022
49415
1,262 1,418 6 0 8 2 1752 1 0 0 1 115 0 0 0 0 0
336 1 0 2 0 612 0 0 0 1 1
145 473 881 1,232 524 9 513 9 24 60 58 0 0 2
0 1 11 10 13 0 0 128 21 395 297 223 2 1 20
4 1 3 6 27 0 0 0
237 15 161 190 110 1 0 0
2274133
30769
39
336
2182
1039 0 485 251 0 316 105 17 60000
3140
1000
0000
192
1632
21
400
0181
0000
Terminalgrade Passed
VIII boysV girlsV boys
VIII girls
44 with >60%
28.64049170
37991
41
14.022.632.1
5.1
22.35.9
50.029.4
0.0
230259Hindi Others Sanskrit Gujarati
93002929
370982693
19500
980
1150000
490000
% Schools recvd.
73.518.240.046.414.3
71.316.440.045.5
0.0
776270
12006141
42870
20750
867280
11586119
42032
2020155
2.83.12.52.92.9
3.32.82.72.1
1.20.30.3
1.72.6
78.7
58.9
0.98
2005-062004-052003-04
UTTAR PRADESH
16.2
Upper PrimaryPrimary
Sex ratio Sex ratio 0-6
10 82
VIII20.0
Enrolment of children
16VIII 61 9,308 12,459 12,411Total Pr. 151,122 175,731 191,544 216,877 239,465
1 - 5 6 - 8
855 1366 350 0
20 17
%Teachers recvd.in-service training
Total schools* Rural schools* Total enrolment* Rural enrolment* Teachers*
7.9 18.9
100.0
27.7
75.9 75.2
18.8 23.4% SC enrolment% SC girls to SC enrolment% ST enrolment
48.5 46.9
52.4 60.1
58.8
49.9
59.1
49.4
Position of teachers by educational qualification (other than para teacher)
(Previous academic year)Incentives : Number of beneficiaries
% ST girls to ST enrolment
% Girls
Number of villages
% 0 - 6 population
% SC population % ST population
% Urban population
% Schools with blackboard
% Enrolment in single-teacher schools
% Enrolment in schools without building
Primary Upperprimary
OBC EnrolmentPrimary U. Primary
% OBCEnrolment% OBC girls toOBC Enrolment
Pupil-teacher ratio (PTR)Student-classroom ratio (SCR)% Schools with <= 50 students% Schools with PTR > 100% Female teachers
% Schools established since 1995
Regular teachers Para-teachers
% minorrepairs
% majorrepairs
# = not applicable na = not available * Some totals may not match due to no response in classificatory data items
1.0 96.27.4 89.96.7 91.2
39.4 58.97.9 89.5
10.8 87.912.3 87.4
2879
49.75755
3.711.631.936.8
44.05525
7.318.220.052.7
49.93828
26.14.6
22.053.6
49.46631
7.128.6
4.97.1
21.5 19.3 na 65.1 51.4
89285714.619.0
Category
PrivateGovt.PrivateGovtPrivateGovt.PrivateGovt.PrivateGovt.
Total population (in 000's)
Number of blocks/taluks
District
Decadal growth rate
Primary onlyPrimary with upper primaryPrimary with upper primary & sec/higher sec.Upper primary onlyUpper primary with sec./higher secondary
% Single classroom schools% Single teacher schools
P + UP P+sec/hs U.P. only UP+secP. only
No response in school category
Primary with upper primaryPrimary with U.P. & sec/higherUpper primary onlyUpper primary with sec./higher sec
Primary only
Primary onlyPrimary with upper primaryPrimary with Upper primary & sec/higherUpper primary only
Para-teachers
School category
Upper primary with sec./higher secondary
Primary onlyPrimary with upper prim.
P. onlyP + UPP+sec/hsU.P. onlyUP+sec
NER(U.Prim)GER(U.Prim)NER (Primary)GER (Primary)
Transition ratePrim. to U. Prim
SC/ST Enrolment
Indicators
Classrooms/Other rooms
Prim.with U.P.&Sec/H.SUpper Primary onlyU. Primary with Sec./H.S.
Basic Data, 2001
Data reported from
Performance indicators
96.4 19.195.2 18.594.0 17.894.2 17.6
Utt
ar P
rad
esh

553
Elementary Education: Report Card - MATHURA
Utt
ar P
rad
esh
0.0000.053
27.3 26.2
Key data: Elementary Education
2075
MATHURA
(Previous academic year)
(Previous year)
Gender and caste distribution of teachers*
No. of schools by type of building*
BoysWith disability
Flow rates
Primary Level
Enrolment*
Number of schools
Grade
GER / NER
School category
Primary Upper primaryBoys Boys GirlsGirls
IncentiveType
School categoryMultiple
TypeKuccha
PartiallyPucca
PuccaTotal % good condition
Otherrooms
TentNo
Building
Classrooms
Belowsecondary
Highersecondary
Postgraduate
M. Phil.GraduateSecondarySchool category OthersNo
response
ST teachers
Total Male Female No res Male Female No res Male Female Male FemaleSC teachers
Text booksUniformAttendanceStationery
% Passed
Avg. No. of Tchs.
%
Female literacyOverall literacy
dev. grant grantSchool T L M
Male Female
IVV
IIIIII
Grade R.R. D.O.R. P.R.
VIIVI
# #
I - V
Enrolment by medium of instructions
Examination results
Retention rate
GPI
Primary cycle U. primary cycleState
DISTRICT ELEMENTARY EDUCATION REPORT CARD : 2005-06
GirlsGrade
IIIIIIIVVVI
VIII
AllGirls
Total
VII
% TotalGrossness
School category
111
3502
90 104 1
6714
3462
2 0 0
1,186 32972 2,950
4 31958 29,26314 533
0 0
1,077 252 185,401 47,70933,042 2,767 27,894
896 319 89612,660 29,032 11,155
0 0 03,754 533 3,754
195,457 60,323 4,29575
1,097512
P + UP P+sec/hs U.P. only UP+sec
School categoryP. only
3.2 0.0 0.0 0.2 0.01.7
Number of Clusters 2056987
% Schools with SCR > 600.0 0.0 10.3 0.0
31.4 36.6 20.0 5.8 0.0% Schools with pre-primary sections 18.9 0.0 0.0 1.0 0.0% Schools with common toilets 81.9 95.0 100.0 81.3 93.8
% Schools with girls toilets 77.2 94.1 80.0 74.1 81.3% Schools with drinking water facility 91.0 99.0 100.0 77.7 100.0
% Enrolment in Govt. schools 76.4 8.2 26.3 69.8 12.499.9 100.0 100.0 99.3 100.0
% No female teacher schools (tch>=2) 39.3 52.5 60.0 65.9 93.80.7 0.0 0.0 5.2 0.0
0.1 0.0 0.0 0.2 0.0%Enrolment in schools without blackboard 0.1 0.0 0.0 0.3 0.0
2001-02 2002-03 2003-04 2004-05 2005-06IIIIIIIVV
VIVII
Total U.P
72,65462,51356,03046,99840,61823,057
19,789
65,43857,68551,72542,72034,669
16,34313,753
66,39459,48451,39440,30233,695
15,70414,152
61,26052,65340,79532,54528,364
12,40410,597
64,54647,26839,73733,51928,788
10,4689,069
60,38442,68342,39932,40826,990
76.9
23.9
75.2
23.4
98.4
34.8
49.0
20.020.0
33,62329,78226,93422,33418,785
9,3967,8246,520
155,198
334552538456364135109110
2,598
338444400293192100
8168
1,916
5,306
classrooms
78964
1,720207
75.697.285.983.9
100.0
17.12.2
7.3
14.111.5
0.0
0.60.04.60.0
1249
78380
1,434 1,495 10 0 0 6 498 1 1 0 1 0
5 0 0 0 0 0411 1 0 0 1 4
16 0 0 0 0 0
60 652 1,162 1,646 1,034 9 62 18 87 305 170 3 0 10 0 1 7 13 1 0 0
18 32 483 475 288 1 0 71 1 4 35 18 0 0 0
3 48 374 245 107 0 0 0
3011439
141116
59
1478
1880
1586 0 430 365 0 470 260 21 130000
1010
0000
0000
332
2261
51
230
10
181
1010
Terminalgrade Passed
VIII boysV girlsV boys
VIII girls
28 with >60%
43.05392587
221305
59
0.90.0
45.90.0
31.95.40.0
44.1
255439Hindi Others
359921215
419234287
34100
290
% Schools recvd.
65.71.0
20.059.0
6.3
52.82.00.0
36.00.0
594120
6323128
42570
87300
861560
6251593
87360
58740
3.65.84.43.13.7
4.23.94.63.8
0.81.21.4
3.74.1
61.0
66.1
0.89
2005-062004-052003-04
UTTAR PRADESH
36.4
Upper PrimaryPrimary
Sex ratio Sex ratio 0-6
13 108
VIII0.0
Enrolment of children
7,453VIII 9,407 12,543 12,587 17,538Total Pr. 213,858 215,617 251,269 252,237 278,813
1 - 5 6 - 8
1,038 2677 520 0
5 17
%Teachers recvd.in-service training
Total schools* Rural schools* Total enrolment* Rural enrolment* Teachers*
12.6 19.2
86.1
28.1
67.0 66.2
17.6 17.8% SC enrolment% SC girls to SC enrolment% ST enrolment
45.8 38.8
55.0 0.0
44.4
48.3
42.9
39.2
Position of teachers by educational qualification (other than para teacher)
(Previous academic year)Incentives : Number of beneficiaries
% ST girls to ST enrolment
% Girls
Number of villages
% 0 - 6 population
% SC population % ST population
% Urban population
% Schools with blackboard
% Enrolment in single-teacher schools
% Enrolment in schools without building
Primary Upperprimary
OBC EnrolmentPrimary U. Primary
% OBCEnrolment% OBC girls toOBC Enrolment
Pupil-teacher ratio (PTR)Student-classroom ratio (SCR)% Schools with <= 50 students% Schools with PTR > 100% Female teachers
% Schools established since 1995
Regular teachers Para-teachers
% minorrepairs
% majorrepairs
# = not applicable na = not available * Some totals may not match due to no response in classificatory data items
3.7 92.13.1 93.07.7 87.74.1 92.1
30.2 66.18.1 87.8
1955
48.04748
4.83.3
36.231.8
35.86146
1.07.9
25.061.4
41.63224
32.11.9
14.466.2
34.07321
0.06.30.06.3
27.0 19.6 na 61.5 43.4
87284028.319.6
Category
PrivateGovt.PrivateGovtPrivateGovt.PrivateGovt.PrivateGovt.
Total population (in 000's)
Number of blocks/taluks
District
Decadal growth rate
Primary onlyPrimary with upper primaryPrimary with upper primary & sec/higher sec.Upper primary onlyUpper primary with sec./higher secondary
% Single classroom schools% Single teacher schools
P + UP P+sec/hs U.P. only UP+secP. only
No response in school category
Primary with upper primaryPrimary with U.P. & sec/higherUpper primary onlyUpper primary with sec./higher sec
Primary only
Primary onlyPrimary with upper primaryPrimary with Upper primary & sec/higherUpper primary only
Para-teachers
School category
Upper primary with sec./higher secondary
Primary onlyPrimary with upper prim.
P. onlyP + UPP+sec/hsU.P. onlyUP+sec
NER(U.Prim)GER(U.Prim)NER (Primary)GER (Primary)
Transition ratePrim. to U. Prim
SC/ST Enrolment
Indicators
Classrooms/Other rooms
Prim.with U.P.&Sec/H.SUpper Primary onlyU. Primary with Sec./H.S.
Basic Data, 2001
Data reported from
Performance indicators
98.8 42.899.0 38.499.0 39.498.6 42.5

554
Elementary Education in India - Where do we stand ?
33.2 33.7
Key data: Elementary Education
1854
MAU
(Previous academic year)
(Previous year)
Gender and caste distribution of teachers*
No. of schools by type of building*
BoysWith disability
Flow rates
Primary Level
Enrolment*
Number of schools
Grade
GER / NER
School category
Primary Upper primaryBoys Boys GirlsGirls
IncentiveType
School categoryMultiple
TypeKuccha
PartiallyPucca
PuccaTotal % good condition
Otherrooms
TentNo
Building
Classrooms
Belowsecondary
Highersecondary
Postgraduate
M. Phil.GraduateSecondarySchool category OthersNo
response
ST teachers
Total Male Female No res Male Female No res Male Female Male FemaleSC teachers
Text booksUniformAttendanceStationery
% Passed
Avg. No. of Tchs.
%
Female literacyOverall literacy
dev. grant grantSchool T L M
Male Female
IVV
IIIIII
Grade R.R. D.O.R. P.R.
VIIVI
# #
I - V
Enrolment by medium of instructions
Examination results
Retention rate
GPI
Primary cycle U. primary cycleState
DISTRICT ELEMENTARY EDUCATION REPORT CARD : 2005-06
GirlsGrade
IIIIIIIVVVI
VIII
AllGirls
Total
VII
% TotalGrossness
School category
172
2782
16 151 2
522
2722
1 0 0
1,114 11411 5,532
1 27446 34,597
2 1,0200 0
1,084 108 247,645 34,66310,350 4,045 5,862
886 274 88615,583 33,581 13,438
0 0 0693 1,020 693
252,684 36,331 4,71988
654132
P + UP P+sec/hs U.P. only UP+sec
School categoryP. only
0.6 0.0 0.0 0.0 0.01.5
Number of Clusters 1599690
% Schools with SCR > 603.0 33.3 18.5 0.0
53.0 45.5 33.3 11.5 0.0% Schools with pre-primary sections 20.6 0.0 33.3 2.7 0.0% Schools with common toilets 74.1 72.7 66.7 71.8 100.0
% Schools with girls toilets 45.7 69.7 66.7 49.4 100.0% Schools with drinking water facility 95.0 100.0 100.0 81.2 100.0
% Enrolment in Govt. schools 87.4 34.8 23.6 68.9 59.599.1 93.9 66.7 99.4 100.0
% No female teacher schools (tch>=2) 20.2 27.3 33.3 43.6 50.00.7 0.2 1.6 6.0 0.0
0.1 0.0 0.0 0.0 0.0%Enrolment in schools without blackboard 1.1 6.3 1.6 0.1 0.0
2001-02 2002-03 2003-04 2004-05 2005-06IIIIIIIVV
VIVII
Total U.P
80,46565,11458,81651,53744,24221,759
19,417
76,42762,53357,88550,39942,425
18,11015,928
76,83759,84053,48345,20338,035
15,34813,903
71,23252,05344,71138,02032,758
10,6429,470
66,54044,46638,56333,48329,158
9,3507,619
57,77648,49641,58028,79323,974
93.4
26.1
96.3
29.7
118.6
37.3
65.2
33.30.0
39,53832,86629,76626,23822,28911,052
9,8058,412
179,966
241231232215160
684528
1,220
163172196164107
493921
911
4,389
classrooms
27020
1,48058
77.385.685.083.091.4
15.910.7
6.8
10.010.1
8.6
3.75.06.90.0
526
42626
1,326 1,141 40 4 0 38 530 1 0 0 2 0
2 0 0 0 1 0321 3 0 0 5 1
4 0 0 0 0 0
78 309 1,845 1,471 667 3 17 8 59 104 28 0 9 22 0 5 3 2 0 0 5
34 40 486 412 214 0 0 190 0 2 7 6 0 0 0
10 20 269 353 195 1 0 0
3005135
11915
14
826
2901
1476 0 363 529 0 820 383 29 260000
1000
2000
0000
266
1871
111
590
0080
0050
Terminalgrade Passed
VIII boysV girlsV boys
VIII girls
107 with >60%
11.75373220
171205
15
0.70.0
13.80.0
18.40.00.09.70.0
284163Hindi Others Urdu Marathi Sanskrit
158821160
492391713
79800
1410
3180000
3060000
1620000
% Schools recvd.
62.118.233.333.6
0.0
69.818.233.334.5
0.0
72985139
59816177
86200
85790
91069185
65844189
118970
95820
4.46.75.73.73.8
2.01.31.00.9
0.30.30.5
0.71.3
66.0
51.2
1.01
2005-062004-052003-04
UTTAR PRADESH
35.3
Upper PrimaryPrimary
Sex ratio Sex ratio 0-6
10 96
VIII33.3
Enrolment of children
7,005VIII 8,681 12,329 14,458 16,600Total Pr. 212,210 238,774 273,398 289,669 300,174
1 - 5 6 - 8
923 28210 5
0 0
7 10
%Teachers recvd.in-service training
Total schools* Rural schools* Total enrolment* Rural enrolment* Teachers*
4.7 13.7
100.0
32.1
72.8 79.1
19.1 21.1% SC enrolment% SC girls to SC enrolment% ST enrolment
49.8 50.61.2
50.3 53.5
48.0
51.0
45.7
49.8
Position of teachers by educational qualification (other than para teacher)
(Previous academic year)Incentives : Number of beneficiaries
% ST girls to ST enrolment
% Girls
Number of villages
% 0 - 6 population
% SC population % ST population
% Urban population
% Schools with blackboard
% Enrolment in single-teacher schools
% Enrolment in schools without building
Primary Upperprimary
OBC EnrolmentPrimary U. Primary
% OBCEnrolment% OBC girls toOBC Enrolment
Pupil-teacher ratio (PTR)Student-classroom ratio (SCR)% Schools with <= 50 students% Schools with PTR > 100% Female teachers
% Schools established since 1995
Regular teachers Para-teachers
% minorrepairs
% majorrepairs
# = not applicable na = not available * Some totals may not match due to no response in classificatory data items
13.8 84.15.5 93.1
10.8 88.211.9 87.248.1 51.216.1 82.6
5868
50.25466
2.57.5
37.334.1
50.57259
12.124.238.212.1
50.04234
27.34.8
24.161.5
53.2114
300.0
25.06.70.0
27.9 22.7 na 62.2 48.7
94698619.420.2
Category
PrivateGovt.PrivateGovtPrivateGovt.PrivateGovt.PrivateGovt.
Total population (in 000's)
Number of blocks/taluks
District
Decadal growth rate
Primary onlyPrimary with upper primaryPrimary with upper primary & sec/higher sec.Upper primary onlyUpper primary with sec./higher secondary
% Single classroom schools% Single teacher schools
P + UP P+sec/hs U.P. only UP+secP. only
No response in school category
Primary with upper primaryPrimary with U.P. & sec/higherUpper primary onlyUpper primary with sec./higher sec
Primary only
Primary onlyPrimary with upper primaryPrimary with Upper primary & sec/higherUpper primary only
Para-teachers
School category
Upper primary with sec./higher secondary
Primary onlyPrimary with upper prim.
P. onlyP + UPP+sec/hsU.P. onlyUP+sec
NER(U.Prim)GER(U.Prim)NER (Primary)GER (Primary)
Transition ratePrim. to U. Prim
1.3
SC/ST Enrolment
Indicators
Classrooms/Other rooms
Prim.with U.P.&Sec/H.SUpper Primary onlyU. Primary with Sec./H.S.
Basic Data, 2001
Data reported from
Performance indicators
98.7 47.298.4 42.398.2 38.898.0 38.0
Utt
ar P
rad
esh

555
Elementary Education: Report Card - MEERUT
Utt
ar P
rad
esh
0.1950.044
28.8 28.3
Key data: Elementary Education
2997
MEERUT
(Previous academic year)
(Previous year)
Gender and caste distribution of teachers*
No. of schools by type of building*
BoysWith disability
Flow rates
Primary Level
Enrolment*
Number of schools
Grade
GER / NER
School category
Primary Upper primaryBoys Boys GirlsGirls
IncentiveType
School categoryMultiple
TypeKuccha
PartiallyPucca
PuccaTotal % good condition
Otherrooms
TentNo
Building
Classrooms
Belowsecondary
Highersecondary
Postgraduate
M. Phil.GraduateSecondarySchool category OthersNo
response
ST teachers
Total Male Female No res Male Female No res Male Female Male FemaleSC teachers
Text booksUniformAttendanceStationery
% Passed
Avg. No. of Tchs.
%
Female literacyOverall literacy
dev. grant grantSchool T L M
Male Female
IVV
IIIIII
Grade R.R. D.O.R. P.R.
VIIVI
# #
I - V
Enrolment by medium of instructions
Examination results
Retention rate
GPI
Primary cycle U. primary cycleState
DISTRICT ELEMENTARY EDUCATION REPORT CARD : 2005-06
GirlsGrade
IIIIIIIVVVI
VIII
AllGirls
Total
VII
% TotalGrossness
School category
171
4026
110 115 1
7750
3636
508 0 0
996 39046 3,734
4 44362 30,90145 1,243
0 0
807 240 126,316 41,79532,968 2,420 13,733
2,769 443 2,29214,000 28,142 11,714
0 0 011,904 1,243 10,022
151,116 67,325 3,880127
2,050839
P + UP P+sec/hs U.P. only UP+sec
School categoryP. only
1.0 0.0 0.0 0.2 0.01.4
Number of Clusters 2562791
% Schools with SCR > 600.0 0.0 20.5 1.8
22.7 7.9 16.7 1.9 3.6% Schools with pre-primary sections 0.2 0.0 0.0 0.0 0.0% Schools with common toilets 80.0 99.2 100.0 89.4 94.6
% Schools with girls toilets 70.6 92.1 100.0 79.5 85.7% Schools with drinking water facility 99.3 100.0 100.0 99.2 100.0
% Enrolment in Govt. schools 69.2 10.2 13.8 68.8 9.599.9 100.0 100.0 99.6 96.4
% No female teacher schools (tch>=2) 21.4 12.6 33.3 41.1 66.10.5 0.0 0.0 11.0 0.1
0.3 0.0 0.0 0.0 0.0%Enrolment in schools without blackboard 0.0 0.0 0.0 0.0 0.0
2001-02 2002-03 2003-04 2004-05 2005-06IIIIIIIVV
VIVII
Total U.P
67,81052,63746,41940,35736,74025,769
24,050
62,57947,78842,08035,03730,323
21,01419,496
61,52746,70438,91431,61428,052
18,64816,238
61,76843,90434,80428,63925,758
15,38012,961
58,52839,62132,12427,36024,285
9,5117,431
72,44057,81149,01239,70623,241
44.0
19.2
45.3
22.1
59.6
28.9
63.9
0.033.3
30,66824,77522,21919,34017,48011,89011,18310,606
148,161
226226227213187112106
821,379
120132149151116
927571
906
5,368
classrooms
1,20567
2,152827
70.685.474.675.880.8
24.613.7
4.8
25.420.717.7
0.90.03.51.6
29120
847298
1,408 1,370 1 0 0 1 14127 0 0 0 0 0
6 0 0 0 0 0477 0 0 0 1 1
56 0 0 0 0 0
178 713 1,142 1,475 999 28 1016 28 124 358 274 5 1 159
0 1 1 7 26 0 0 1047 97 377 444 400 5 2 8117 12 33 94 139 0 0 41
8 16 84 105 68 0 0 0
2758417
171034
295
54828
41941
2644 1 253 274 0 472 302 7 90000
1000
0000
0000
444
18823
363
457
2065
4000
Terminalgrade Passed
VIII boysV girlsV boys
VIII girls
858 with >60%
40.35930966
451453
336
0.50.0
33.20.0
24.70.70.0
23.40.0
203737Hindi Others Urdu English
286822524
3957611075
117688020
68848662072
12510000
1650000
% Schools recvd.
54.21.60.0
48.40.0
61.91.60.0
62.01.8
610250
440880
91120
63884
701073
436730
169310
60880
4.37.67.53.06.0
5.53.63.12.0
2.71.61.9
1.33.5
62.1
83.1
0.88
2005-062004-052003-04
UTTAR PRADESH
62.2
Upper PrimaryPrimary
Sex ratio Sex ratio 0-6
14 108
VIII0.0
Enrolment of children
6,299VIII 11,365 14,126 17,301 22,621Total Pr. 181,918 194,873 206,811 217,807 243,963
1 - 5 6 - 8
1,024 42936 300
0 0
8 37
%Teachers recvd.in-service training
Total schools* Rural schools* Total enrolment* Rural enrolment* Teachers*
18.9 23.4
48.4
22.1
36.0 37.3
13.9 16.9% SC enrolment% SC girls to SC enrolment% ST enrolment
47.4 46.8
46.7 44.7
28.0
47.7
34.9
47.5
Position of teachers by educational qualification (other than para teacher)
(Previous academic year)Incentives : Number of beneficiaries
% ST girls to ST enrolment
% Girls
Number of villages
% 0 - 6 population
% SC population % ST population
% Urban population
% Schools with blackboard
% Enrolment in single-teacher schools
% Enrolment in schools without building
Primary Upperprimary
OBC EnrolmentPrimary U. Primary
% OBCEnrolment% OBC girls toOBC Enrolment
Pupil-teacher ratio (PTR)Student-classroom ratio (SCR)% Schools with <= 50 students% Schools with PTR > 100% Female teachers
% Schools established since 1995
Regular teachers Para-teachers
% minorrepairs
% majorrepairs
# = not applicable na = not available * Some totals may not match due to no response in classificatory data items
13.2 81.42.0 94.42.7 94.2
15.6 83.16.0 90.6
4871
47.03741
9.21.2
49.227.1
46.23830
2.43.9
56.725.2
47.93121
29.02.1
28.862.4
37.83916
8.90.0
12.21.8
24.2 18.4 na 64.8 53.1
85787248.417.3
Category
PrivateGovt.PrivateGovtPrivateGovt.PrivateGovt.PrivateGovt.
Total population (in 000's)
Number of blocks/taluks
District
Decadal growth rate
Primary onlyPrimary with upper primaryPrimary with upper primary & sec/higher sec.Upper primary onlyUpper primary with sec./higher secondary
% Single classroom schools% Single teacher schools
P + UP P+sec/hs U.P. only UP+secP. only
No response in school category
Primary with upper primaryPrimary with U.P. & sec/higherUpper primary onlyUpper primary with sec./higher sec
Primary only
Primary onlyPrimary with upper primaryPrimary with Upper primary & sec/higherUpper primary only
Para-teachers
School category
Upper primary with sec./higher secondary
Primary onlyPrimary with upper prim.
P. onlyP + UPP+sec/hsU.P. onlyUP+sec
NER(U.Prim)GER(U.Prim)NER (Primary)GER (Primary)
Transition ratePrim. to U. Prim
SC/ST Enrolment
Indicators
Classrooms/Other rooms
Prim.with U.P.&Sec/H.SUpper Primary onlyU. Primary with Sec./H.S.
Basic Data, 2001
Data reported from
Performance indicators
97.9 52.797.2 52.895.9 38.297.1 41.3

556
Elementary Education in India - Where do we stand ?
0.0030.000
31.4 28.7
Key data: Elementary Education
2116
MIRZAPUR
(Previous academic year)
(Previous year)
Gender and caste distribution of teachers*
No. of schools by type of building*
BoysWith disability
Flow rates
Primary Level
Enrolment*
Number of schools
Grade
GER / NER
School category
Primary Upper primaryBoys Boys GirlsGirls
IncentiveType
School categoryMultiple
TypeKuccha
PartiallyPucca
PuccaTotal % good condition
Otherrooms
TentNo
Building
Classrooms
Belowsecondary
Highersecondary
Postgraduate
M. Phil.GraduateSecondarySchool category OthersNo
response
ST teachers
Total Male Female No res Male Female No res Male Female Male FemaleSC teachers
Text booksUniformAttendanceStationery
% Passed
Avg. No. of Tchs.
%
Female literacyOverall literacy
dev. grant grantSchool T L M
Male Female
IVV
IIIIII
Grade R.R. D.O.R. P.R.
VIIVI
# #
I - V
Enrolment by medium of instructions
Examination results
Retention rate
GPI
Primary cycle U. primary cycleState
DISTRICT ELEMENTARY EDUCATION REPORT CARD : 2005-06
GirlsGrade
IIIIIIIVVVI
VIII
AllGirls
Total
VII
% TotalGrossness
School category
04
3213
14 08 3
14669
3142
0 0 0
1,344 31612 0
6 1,06892 51,79064 669
0 0
1,296 189 280,090 33,2394,940 0 4,3541,438 674 787
32,601 51,098 20,595
0 0 019,636 662 17,756
289,052 57,521 4,5720
1,655120
P + UP P+sec/hs U.P. only UP+sec
School categoryP. only
1.3 0.0 0.0 0.4 1.40.4
Number of Clusters 22251306
% Schools with SCR > 600.0 0.0 25.3 4.2
57.5 21.4 0.0 22.3 15.3% Schools with pre-primary sections 31.1 28.6 16.7 3.6 5.6% Schools with common toilets 85.1 92.9 66.7 78.8 83.3
% Schools with girls toilets 74.2 78.6 66.7 66.0 76.4% Schools with drinking water facility 96.2 100.0 91.7 90.6 100.0
% Enrolment in Govt. schools 83.4 0.0 42.6 61.4 3.399.9 100.0 100.0 99.4 95.8
% No female teacher schools (tch>=2) 20.2 7.1 33.3 36.2 59.70.2 0.0 0.0 9.5 0.5
0.3 0.0 0.0 0.3 0.0%Enrolment in schools without blackboard 0.0 0.0 0.0 0.0 0.0
2001-02 2002-03 2003-04 2004-05 2005-06IIIIIIIVV
VIVII
Total U.P
72,69476,73672,97070,47958,29639,822
34,860
72,99470,57772,33159,59853,417
32,35730,195
68,81673,43762,27054,61847,846
30,47829,738
67,40055,27051,06443,49340,308
19,75816,949
58,66855,80950,48145,98944,928
23,17619,733
107,54092,47987,32251,06159,399
92.0
48.1
95.9
49.6
121.5
60.8
69.4
16.70.0
34,91836,80734,55633,49526,55817,59415,04214,237
213,207
174247279261238
91104
761,470
97184158181152
716150
954
5,089
classrooms
126106
1,993766
73.277.090.679.689.0
19.321.4
7.5
6.615.4
9.7
1.62.85.01.3
2823
713229
1,804 1,536 46 4 0 58 1610 0 0 0 4 011 0 0 0 1 0
416 4 0 0 38 964 1 0 0 4 3
106 544 1,093 1,619 1,047 20 45 3 21 54 32 0 0 50 1 10 25 27 0 0 1
18 35 430 532 430 6 0 448 2 18 117 240 2 0 20
3 33 599 706 238 8 2 0
30328134
1097341
3930
39866
1487 0 765 943 0 542 178 29 160000
0220
0000
0000
62
13211
24
321
006
12
0050
Terminalgrade Passed
VIII boysV girlsV boys
VIII girls
86 with >60%
38.76227120
661497
407
0.00.0
31.70.3
31.20.00.0
32.70.0
344757Hindi Urdu Sanskrit
45722506
8412620234
507368
0149
0
0000
71
% Schools recvd.
75.20.00.0
44.14.2
69.90.00.0
33.00.0
112920123
109716674
1514739
2102088
125959103
94261570
2194735
1661754
3.88.65.53.25.7
1.11.01.00.9
0.80.60.9
1.31.0
98.2
74.1
0.90
2005-062004-052003-04
UTTAR PRADESH
45.5
Upper PrimaryPrimary
Sex ratio Sex ratio 0-6
13 109
VIII33.3
Enrolment of children
16,490VIII 14,354 27,106 29,927 32,858Total Pr. 255,875 257,535 306,987 328,917 351,175
1 - 5 6 - 8
745 75226 381
0 0
30 36
%Teachers recvd.in-service training
Total schools* Rural schools* Total enrolment* Rural enrolment* Teachers*
1.5 10.2
100.0
54.6
83.4 93.5
26.8 45.1% SC enrolment% SC girls to SC enrolment% ST enrolment
46.8 40.8
0.0 33.3
54.7
47.7
51.9
44.5
Position of teachers by educational qualification (other than para teacher)
(Previous academic year)Incentives : Number of beneficiaries
% ST girls to ST enrolment
% Girls
Number of villages
% 0 - 6 population
% SC population % ST population
% Urban population
% Schools with blackboard
% Enrolment in single-teacher schools
% Enrolment in schools without building
Primary Upperprimary
OBC EnrolmentPrimary U. Primary
% OBCEnrolment% OBC girls toOBC Enrolment
Pupil-teacher ratio (PTR)Student-classroom ratio (SCR)% Schools with <= 50 students% Schools with PTR > 100% Female teachers
% Schools established since 1995
Regular teachers Para-teachers
% minorrepairs
% majorrepairs
# = not applicable na = not available * Some totals may not match due to no response in classificatory data items
2.3 96.72.4 96.7
24.7 74.13.1 95.9
2438
47.45668
3.08.7
39.032.7
38.54139
0.07.1
32.528.6
43.75642
21.616.926.653.1
41.75027
15.311.116.216.7
27.6 26.8 0.1 55.3 39.3
92989713.520.1
Category
PrivateGovt.PrivateGovtPrivateGovt.PrivateGovt.PrivateGovt.
Total population (in 000's)
Number of blocks/taluks
District
Decadal growth rate
Primary onlyPrimary with upper primaryPrimary with upper primary & sec/higher sec.Upper primary onlyUpper primary with sec./higher secondary
% Single classroom schools% Single teacher schools
P + UP P+sec/hs U.P. only UP+secP. only
No response in school category
Primary with upper primaryPrimary with U.P. & sec/higherUpper primary onlyUpper primary with sec./higher sec
Primary only
Primary onlyPrimary with upper primaryPrimary with Upper primary & sec/higherUpper primary only
Para-teachers
School category
Upper primary with sec./higher secondary
Primary onlyPrimary with upper prim.
P. onlyP + UPP+sec/hsU.P. onlyUP+sec
NER(U.Prim)GER(U.Prim)NER (Primary)GER (Primary)
Transition ratePrim. to U. Prim
SC/ST Enrolment
Indicators
Classrooms/Other rooms
Prim.with U.P.&Sec/H.SUpper Primary onlyU. Primary with Sec./H.S.
Basic Data, 2001
Data reported from
Performance indicators
99.6 45.599.6 41.898.5 38.198.9 39.4
Utt
ar P
rad
esh
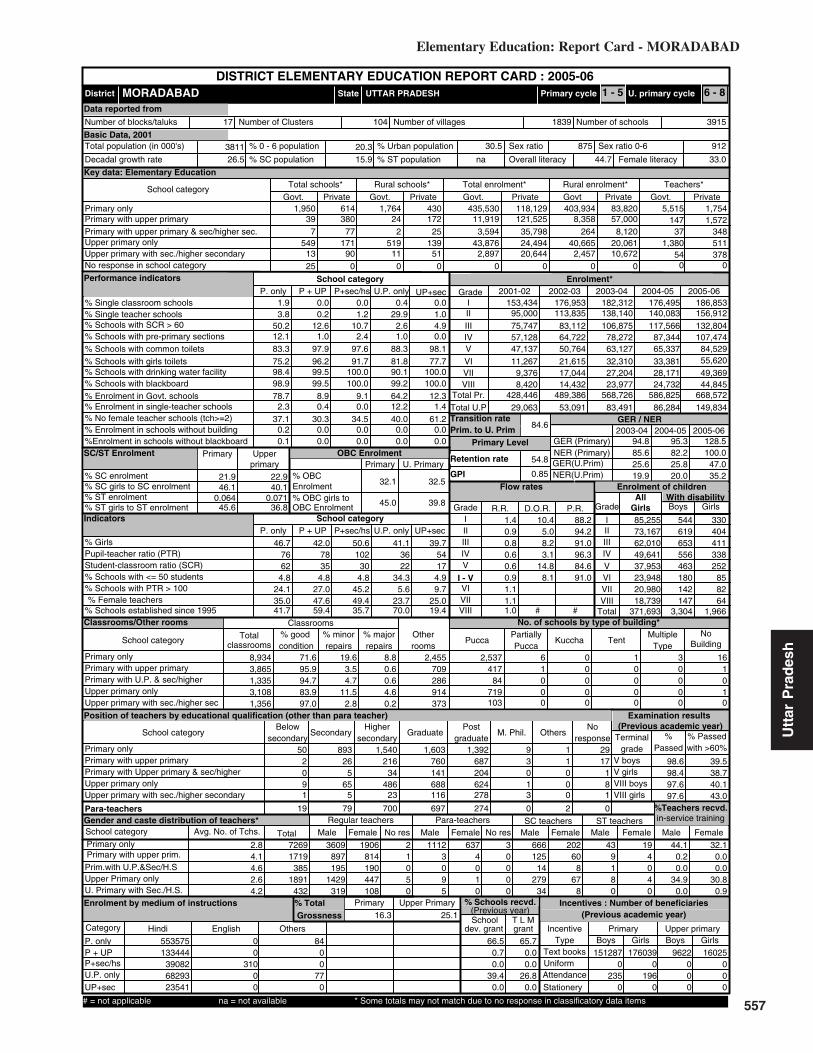
557
Elementary Education: Report Card - MORADABAD
Utt
ar P
rad
esh
0.0710.064
21.9 22.9
Key data: Elementary Education
3811
MORADABAD
(Previous academic year)
(Previous year)
Gender and caste distribution of teachers*
No. of schools by type of building*
BoysWith disability
Flow rates
Primary Level
Enrolment*
Number of schools
Grade
GER / NER
School category
Primary Upper primaryBoys Boys GirlsGirls
IncentiveType
School categoryMultiple
TypeKuccha
PartiallyPucca
PuccaTotal % good condition
Otherrooms
TentNo
Building
Classrooms
Belowsecondary
Highersecondary
Postgraduate
M. Phil.GraduateSecondarySchool category OthersNo
response
ST teachers
Total Male Female No res Male Female No res Male Female Male FemaleSC teachers
Text booksUniformAttendanceStationery
% Passed
Avg. No. of Tchs.
%
Female literacyOverall literacy
dev. grant grantSchool T L M
Male Female
IVV
IIIIII
Grade R.R. D.O.R. P.R.
VIIVI
# #
I - V
Enrolment by medium of instructions
Examination results
Retention rate
GPI
Primary cycle U. primary cycleState
DISTRICT ELEMENTARY EDUCATION REPORT CARD : 2005-06
GirlsGrade
IIIIIIIVVVI
VIII
AllGirls
Total
VII
% TotalGrossness
School category
397
54913
380 2477 2
17190
51911
25 0 0
1,950 614172 11,919
25 3,594139 43,876
51 2,8970 0
1,764 430 403,934 83,820121,525 8,358 57,000
35,798 264 8,12024,494 40,665 20,061
0 0 020,644 2,457 10,672
435,530 118,129 5,515147
1,7541,572
P + UP P+sec/hs U.P. only UP+sec
School categoryP. only
1.9 0.0 0.0 0.4 0.03.8
Number of Clusters 39151839
% Schools with SCR > 600.2 1.2 29.9 1.0
50.2 12.6 10.7 2.6 4.9% Schools with pre-primary sections 12.1 1.0 2.4 1.0 0.0% Schools with common toilets 83.3 97.9 97.6 88.3 98.1
% Schools with girls toilets 75.2 96.2 91.7 81.8 77.7% Schools with drinking water facility 98.4 99.5 100.0 90.1 100.0
% Enrolment in Govt. schools 78.7 8.9 9.1 64.2 12.398.9 99.5 100.0 99.2 100.0
% No female teacher schools (tch>=2) 37.1 30.3 34.5 40.0 61.22.3 0.4 0.0 12.2 1.4
0.2 0.0 0.0 0.0 0.0%Enrolment in schools without blackboard 0.1 0.0 0.0 0.0 0.0
2001-02 2002-03 2003-04 2004-05 2005-06IIIIIIIVV
VIVII
Total U.P
186,853156,912132,804107,474
84,52955,620
49,369
176,495140,083117,566
87,34465,337
33,38128,171
182,312138,140106,875
78,27263,127
32,31027,204
176,953113,835
83,11264,72250,764
21,61517,044
153,43495,00075,74757,12847,137
11,2679,376
149,83486,28483,49153,09129,063
94.8
25.6
95.3
25.8
128.5
47.0
50.6
4.845.2
85,25573,16762,01049,64137,95323,94820,98018,739
371,693
544619653556463180142147
3,304
330404411338252
858264
1,966
8,934
classrooms
3,8651,3353,1081,356
71.695.994.783.997.0
19.63.5
8.8
4.711.5
2.8
0.60.64.60.2
709286914373
2,455 2,537 6 0 1 3 16417 1 0 0 0 1
84 0 0 0 0 0719 0 0 0 0 1103 0 0 0 0 0
50 893 1,540 1,603 1,392 9 12 26 216 760 687 3 1 170 5 34 141 204 0 0 19 65 486 688 624 1 0 81 5 23 116 278 3 0 1
19 79 700 697 274 0 2 0
3609897195
1429319
814190447108
1906 2 1112 637 3 666 202 43 191050
3095
4010
0000
12514
27934
608
678
9180
4040
Terminalgrade Passed
VIII boysV girlsV boys
VIII girls
29 with >60%
44.172691719
3851891
432
0.20.0
34.90.0
32.10.00.0
30.80.9
553575Hindi English Others
133444390826829323541
00
31000
8400
770
% Schools recvd.
66.50.70.0
39.40.0
65.70.00.0
26.80.0
1512870
2350
9622000
1760390
1960
16025000
2.84.14.62.64.2
1.40.90.80.6
1.11.11.0
0.60.9
54.8
84.6
0.85
2005-062004-052003-04
UTTAR PRADESH
49.4
Upper PrimaryPrimary
Sex ratio Sex ratio 0-6
17 104
VIII35.7
Enrolment of children
8,420VIII 14,432 23,977 24,732 44,845Total Pr. 428,446 489,386 568,726 586,825 668,572
1 - 5 6 - 8
1,380 51154 378
0 0
37 348
%Teachers recvd.in-service training
Total schools* Rural schools* Total enrolment* Rural enrolment* Teachers*
16.3 25.1
100.0
35.2
85.6 82.2
19.9 20.0% SC enrolment% SC girls to SC enrolment% ST enrolment
46.1 40.1
45.6 36.8
32.1
45.0
32.5
39.8
Position of teachers by educational qualification (other than para teacher)
(Previous academic year)Incentives : Number of beneficiaries
% ST girls to ST enrolment
% Girls
Number of villages
% 0 - 6 population
% SC population % ST population
% Urban population
% Schools with blackboard
% Enrolment in single-teacher schools
% Enrolment in schools without building
Primary Upperprimary
OBC EnrolmentPrimary U. Primary
% OBCEnrolment% OBC girls toOBC Enrolment
Pupil-teacher ratio (PTR)Student-classroom ratio (SCR)% Schools with <= 50 students% Schools with PTR > 100% Female teachers
% Schools established since 1995
Regular teachers Para-teachers
% minorrepairs
% majorrepairs
# = not applicable na = not available * Some totals may not match due to no response in classificatory data items
10.4 88.25.0 94.28.2 91.03.1 96.3
14.8 84.68.1 91.0
30102
46.77662
4.824.135.041.7
42.07835
4.827.047.659.4
41.13622
34.35.6
23.770.0
39.75417
4.99.7
25.019.4
26.5 15.9 na 44.7 33.0
91287530.520.3
Category
PrivateGovt.PrivateGovtPrivateGovt.PrivateGovt.PrivateGovt.
Total population (in 000's)
Number of blocks/taluks
District
Decadal growth rate
Primary onlyPrimary with upper primaryPrimary with upper primary & sec/higher sec.Upper primary onlyUpper primary with sec./higher secondary
% Single classroom schools% Single teacher schools
P + UP P+sec/hs U.P. only UP+secP. only
No response in school category
Primary with upper primaryPrimary with U.P. & sec/higherUpper primary onlyUpper primary with sec./higher sec
Primary only
Primary onlyPrimary with upper primaryPrimary with Upper primary & sec/higherUpper primary only
Para-teachers
School category
Upper primary with sec./higher secondary
Primary onlyPrimary with upper prim.
P. onlyP + UPP+sec/hsU.P. onlyUP+sec
NER(U.Prim)GER(U.Prim)NER (Primary)GER (Primary)
Transition ratePrim. to U. Prim
SC/ST Enrolment
Indicators
Classrooms/Other rooms
Prim.with U.P.&Sec/H.SUpper Primary onlyU. Primary with Sec./H.S.
Basic Data, 2001
Data reported from
Performance indicators
98.6 39.598.4 38.797.6 40.197.6 43.0

558
Elementary Education in India - Where do we stand ?
23.3 24.4
Key data: Elementary Education
3543
MUZAFFARNAGAR
(Previous academic year)
(Previous year)
Gender and caste distribution of teachers*
No. of schools by type of building*
BoysWith disability
Flow rates
Primary Level
Enrolment*
Number of schools
Grade
GER / NER
School category
Primary Upper primaryBoys Boys GirlsGirls
IncentiveType
School categoryMultiple
TypeKuccha
PartiallyPucca
PuccaTotal % good condition
Otherrooms
TentNo
Building
Classrooms
Belowsecondary
Highersecondary
Postgraduate
M. Phil.GraduateSecondarySchool category OthersNo
response
ST teachers
Total Male Female No res Male Female No res Male Female Male FemaleSC teachers
Text booksUniformAttendanceStationery
% Passed
Avg. No. of Tchs.
%
Female literacyOverall literacy
dev. grant grantSchool T L M
Male Female
IVV
IIIIII
Grade R.R. D.O.R. P.R.
VIIVI
# #
I - V
Enrolment by medium of instructions
Examination results
Retention rate
GPI
Primary cycle U. primary cycleState
DISTRICT ELEMENTARY EDUCATION REPORT CARD : 2005-06
GirlsGrade
IIIIIIIVVVI
VIII
AllGirls
Total
VII
% TotalGrossness
School category
281
4680
25 257 1
869
4520
0 0 0
1,717 60023 5,178
4 9176 46,174
6 00 0
1,638 566 271,028 83,2464,338 4,814 3,7921,593 91 1,137
11,175 44,669 10,361
0 0 02,205 0 2,030
281,347 87,393 4,62977
1,46972
P + UP P+sec/hs U.P. only UP+sec
School categoryP. only
1.2 0.0 12.5 1.1 0.06.7
Number of Clusters 2941928
% Schools with SCR > 601.9 0.0 9.9 0.0
27.9 18.9 25.0 4.9 0.0% Schools with pre-primary sections 1.5 0.0 0.0 0.0 11.1% Schools with common toilets 88.5 96.2 100.0 93.5 100.0
% Schools with girls toilets 80.5 96.2 75.0 84.5 88.9% Schools with drinking water facility 98.7 100.0 100.0 98.0 100.0
% Enrolment in Govt. schools 76.3 54.4 5.4 80.5 0.099.4 96.2 100.0 99.5 88.9
% No female teacher schools (tch>=2) 49.9 52.8 50.0 58.5 77.84.9 0.1 0.0 6.7 0.0
0.3 0.0 0.0 0.2 0.0%Enrolment in schools without blackboard 0.4 1.3 0.0 0.3 3.5
2001-02 2002-03 2003-04 2004-05 2005-06IIIIIIIVV
VIVII
Total U.P
97,58479,82176,37865,42757,66924,322
19,972
90,23575,53963,61151,86943,001
25,69922,657
78,48060,97352,61940,99432,140
16,77114,344
66,89550,51342,90832,33525,802
11,3079,188
68,12251,85641,37430,82125,442
11,0057,975
62,61568,55643,53927,79925,542
47.7
14.4
57.0
22.2
77.9
21.1
56.2
12.525.0
45,57435,33334,63528,15226,84011,232
8,8538,379
198,998
3417242825
343
138
1823292410
101
106
8,622
classrooms
292107
2,432133
59.772.371.061.744.4
35.926.0
4.4
29.034.751.9
1.70.03.63.8
7031
74546
2,517 2,249 20 0 0 31 750 0 0 0 3 0
8 0 0 0 0 0543 3 0 0 5 3
9 0 0 0 0 0
822 959 686 1,777 466 6 735 16 10 55 28 1 0 2
7 4 0 8 4 0 0 0154 108 403 479 238 1 1 13
9 5 2 8 5 0 0 0
499 97 51 353 32 0 0 0
3992104
131105
26
4110
2812
1014 66 622 402 2 518 93 42 4820
111
1050
1010
0000
161
1854
62
230
3071
2090
Terminalgrade Passed
VIII boysV girlsV boys
VIII girls
349 with >60%
28.96098149
231403
29
13.315.436.2
3.8
19.64.80.0
35.10.0
358526Hindi Others Konkani Assamese Kannada
87581684
555401844
2419359
0108
77
5710000
310157
000
18300
820
% Schools recvd.
51.35.7
25.053.122.2
50.05.70.0
50.022.2
692915
3611493
68540
40353
95219192
3394955
150250
33626
2.62.82.92.53.2
1.00.40.30.3
0.00.00.0
0.20.5
84.5
56.6
0.83
2005-062004-052003-04
UTTAR PRADESH
43.5
Upper PrimaryPrimary
Sex ratio Sex ratio 0-6
19 121
VIII0.0
Enrolment of children
6,562VIII 7,304 12,424 20,200 18,321Total Pr. 217,615 218,453 265,206 324,255 376,879
1 - 5 6 - 8
1,166 2370 290 0
3 20
%Teachers recvd.in-service training
Total schools* Rural schools* Total enrolment* Rural enrolment* Teachers*
26.0 36.3
57.6
13.5
33.6 46.7
8.9 15.9% SC enrolment% SC girls to SC enrolment% ST enrolment
46.4 44.43.6
46.0 37.9
37.7
46.8
44.4
45.4
Position of teachers by educational qualification (other than para teacher)
(Previous academic year)Incentives : Number of beneficiaries
% ST girls to ST enrolment
% Girls
Number of villages
% 0 - 6 population
% SC population % ST population
% Urban population
% Schools with blackboard
% Enrolment in single-teacher schools
% Enrolment in schools without building
Primary Upperprimary
OBC EnrolmentPrimary U. Primary
% OBCEnrolment% OBC girls toOBC Enrolment
Pupil-teacher ratio (PTR)Student-classroom ratio (SCR)% Schools with <= 50 students% Schools with PTR > 100% Female teachers
% Schools established since 1995
Regular teachers Para-teachers
% minorrepairs
% majorrepairs
# = not applicable na = not available * Some totals may not match due to no response in classificatory data items
10.9 88.1
43.2 56.66.1 93.4
22.3 77.719.1 80.8
1673
45.36043
7.017.323.221.5
42.86433
9.415.128.230.2
45.74124
18.84.9
20.153.1
36.57617
11.122.2
6.90.0
24.6 13.5 na 60.7 47.8
85987125.519.1
Category
PrivateGovt.PrivateGovtPrivateGovt.PrivateGovt.PrivateGovt.
Total population (in 000's)
Number of blocks/taluks
District
Decadal growth rate
Primary onlyPrimary with upper primaryPrimary with upper primary & sec/higher sec.Upper primary onlyUpper primary with sec./higher secondary
% Single classroom schools% Single teacher schools
P + UP P+sec/hs U.P. only UP+secP. only
No response in school category
Primary with upper primaryPrimary with U.P. & sec/higherUpper primary onlyUpper primary with sec./higher sec
Primary only
Primary onlyPrimary with upper primaryPrimary with Upper primary & sec/higherUpper primary only
Para-teachers
School category
Upper primary with sec./higher secondary
Primary onlyPrimary with upper prim.
P. onlyP + UPP+sec/hsU.P. onlyUP+sec
NER(U.Prim)GER(U.Prim)NER (Primary)GER (Primary)
Transition ratePrim. to U. Prim
3.9
SC/ST Enrolment
Indicators
Classrooms/Other rooms
Prim.with U.P.&Sec/H.SUpper Primary onlyU. Primary with Sec./H.S.
Basic Data, 2001
Data reported from
Performance indicators
98.7 65.398.8 65.697.6 56.397.8 63.3
Utt
ar P
rad
esh

559
Elementary Education: Report Card - PILIBHIT
Utt
ar P
rad
esh
0.8270.917
22.0 25.8
Key data: Elementary Education
1645
PILIBHIT
(Previous academic year)
(Previous year)
Gender and caste distribution of teachers*
No. of schools by type of building*
BoysWith disability
Flow rates
Primary Level
Enrolment*
Number of schools
Grade
GER / NER
School category
Primary Upper primaryBoys Boys GirlsGirls
IncentiveType
School categoryMultiple
TypeKuccha
PartiallyPucca
PuccaTotal % good condition
Otherrooms
TentNo
Building
Classrooms
Belowsecondary
Highersecondary
Postgraduate
M. Phil.GraduateSecondarySchool category OthersNo
response
ST teachers
Total Male Female No res Male Female No res Male Female Male FemaleSC teachers
Text booksUniformAttendanceStationery
% Passed
Avg. No. of Tchs.
%
Female literacyOverall literacy
dev. grant grantSchool T L M
Male Female
IVV
IIIIII
Grade R.R. D.O.R. P.R.
VIIVI
# #
I - V
Enrolment by medium of instructions
Examination results
Retention rate
GPI
Primary cycle U. primary cycleState
DISTRICT ELEMENTARY EDUCATION REPORT CARD : 2005-06
GirlsGrade
IIIIIIIVVVI
VIII
AllGirls
Total
VII
% TotalGrossness
School category
170
3584
26 102 0
266
3424
2 0 0
1,064 11518 4,851
2 020 47,520
6 4740 0
1,010 78 205,702 15,2956,310 2,789 4,2241,019 0 1,0193,745 45,956 2,727
0 0 0441 474 441
215,287 21,303 2,93490
466143
P + UP P+sec/hs U.P. only UP+sec
School categoryP. only
0.9 0.0 0.0 0.8 0.03.6
Number of Clusters 16201032
% Schools with SCR > 600.0 0.0 21.4 0.0
47.8 16.3 0.0 9.6 0.0% Schools with pre-primary sections 25.1 16.3 0.0 3.1 0.0% Schools with common toilets 88.0 97.7 100.0 83.6 90.0
% Schools with girls toilets 78.2 97.7 100.0 74.0 80.0% Schools with drinking water facility 98.9 100.0 100.0 92.2 100.0
% Enrolment in Govt. schools 91.0 43.5 0.0 92.7 51.899.8 83.7 100.0 100.0 90.0
% No female teacher schools (tch>=2) 35.6 51.2 50.0 47.1 80.02.7 0.0 0.0 14.9 0.0
0.7 0.0 0.0 1.4 0.0%Enrolment in schools without blackboard 0.0 12.0 0.0 0.0 6.6
2001-02 2002-03 2003-04 2004-05 2005-06IIIIIIIVV
VIVII
Total U.P
51,86153,83950,75646,02341,61622,735
19,052
55,83152,85151,29245,85740,286
20,06315,139
56,44353,71650,62743,30636,720
16,40113,144
56,40452,66551,09142,09131,541
15,10911,354
54,51849,64446,26436,16930,925
11,7369,301
56,85548,23040,17235,84729,111
92.7
28.5
92.2
33.2
108.7
41.3
23.4
0.00.0
24,83626,13224,50322,12919,634
9,9908,3236,314
141,861
111172202213232140117116
1,303
64132117156151
838068
851
3,774
classrooms
29435
1,44561
75.080.360.083.490.2
21.419.0
3.7
28.612.9
3.3
0.711.4
3.76.6
733
47320
1,322 1,140 23 0 0 1 1541 2 0 0 0 0
2 0 0 0 0 0371 5 0 0 1 7
10 0 0 0 0 0
66 385 718 599 328 2 25 12 47 62 42 0 0 600 0 4 7 3 0 0 3
32 40 398 294 203 1 1 800 6 2 7 27 0 0 11
7 26 303 331 158 0 2 0
1667177
12783
42
472
2666
720 4 537 472 0 268 101 13 94305
4010
1000
0000
220
1323
70
460
10
141
0020
Terminalgrade Passed
VIII boysV girlsV boys
VIII girls
291 with >60%
45.93400233
171050
53
0.60.0
69.12.4
44.36.30.0
73.716.7
233399Hindi Others Urdu
108261019
50922915
1990136
0343
0
1027199
000
% Schools recvd.
80.92.30.0
62.80.0
78.62.30.0
57.310.0
693120
73225126
72990
144030
944710
69406107
155220
114660
2.95.48.52.75.3
1.31.52.11.9
1.81.92.2
3.21.9
74.0
55.6
0.92
2005-062004-052003-04
UTTAR PRADESH
11.8
Upper PrimaryPrimary
Sex ratio Sex ratio 0-6
9 91
VIII50.0
Enrolment of children
8,074VIII 9,384 10,627 13,028 15,068Total Pr. 217,520 233,792 240,812 246,117 244,095
1 - 5 6 - 8
947 10326 27
0 0
0 17
%Teachers recvd.in-service training
Total schools* Rural schools* Total enrolment* Rural enrolment* Teachers*
7.6 22.2
100.0
32.2
86.8 85.1
23.4 25.9% SC enrolment% SC girls to SC enrolment% ST enrolment
48.4 45.9
51.0 50.4
61.9
48.1
58.8
41.6
Position of teachers by educational qualification (other than para teacher)
(Previous academic year)Incentives : Number of beneficiaries
% ST girls to ST enrolment
% Girls
Number of villages
% 0 - 6 population
% SC population % ST population
% Urban population
% Schools with blackboard
% Enrolment in single-teacher schools
% Enrolment in schools without building
Primary Upperprimary
OBC EnrolmentPrimary U. Primary
% OBCEnrolment% OBC girls toOBC Enrolment
Pupil-teacher ratio (PTR)Student-classroom ratio (SCR)% Schools with <= 50 students% Schools with PTR > 100% Female teachers
% Schools established since 1995
Regular teachers Para-teachers
% minorrepairs
% majorrepairs
# = not applicable na = not available * Some totals may not match due to no response in classificatory data items
3.8 95.04.5 94.09.9 88.0
10.1 88.041.3 55.612.5 85.6
4.7 93.50.4 97.7
2960
48.27063
3.322.035.129.5
41.64838
7.07.0
20.644.2
43.84935
16.412.825.364.6
45.21715
30.00.0
11.320.0
28.1 15.2 0.1 49.8 35.1
94087717.919.7
Category
PrivateGovt.PrivateGovtPrivateGovt.PrivateGovt.PrivateGovt.
Total population (in 000's)
Number of blocks/taluks
District
Decadal growth rate
Primary onlyPrimary with upper primaryPrimary with upper primary & sec/higher sec.Upper primary onlyUpper primary with sec./higher secondary
% Single classroom schools% Single teacher schools
P + UP P+sec/hs U.P. only UP+secP. only
No response in school category
Primary with upper primaryPrimary with U.P. & sec/higherUpper primary onlyUpper primary with sec./higher sec
Primary only
Primary onlyPrimary with upper primaryPrimary with Upper primary & sec/higherUpper primary only
Para-teachers
School category
Upper primary with sec./higher secondary
Primary onlyPrimary with upper prim.
P. onlyP + UPP+sec/hsU.P. onlyUP+sec
NER(U.Prim)GER(U.Prim)NER (Primary)GER (Primary)
Transition ratePrim. to U. Prim
SC/ST Enrolment
Indicators
Classrooms/Other rooms
Prim.with U.P.&Sec/H.SUpper Primary onlyU. Primary with Sec./H.S.
Basic Data, 2001
Data reported from
Performance indicators
97.6 33.898.0 30.394.9 37.696.0 38.4

560
Elementary Education in India - Where do we stand ?
0.0000.000
28.6 25.6
Key data: Elementary Education
2731
PRATAPGARH
(Previous academic year)
(Previous year)
Gender and caste distribution of teachers*
No. of schools by type of building*
BoysWith disability
Flow rates
Primary Level
Enrolment*
Number of schools
Grade
GER / NER
School category
Primary Upper primaryBoys Boys GirlsGirls
IncentiveType
School categoryMultiple
TypeKuccha
PartiallyPucca
PuccaTotal % good condition
Otherrooms
TentNo
Building
Classrooms
Belowsecondary
Highersecondary
Postgraduate
M. Phil.GraduateSecondarySchool category OthersNo
response
ST teachers
Total Male Female No res Male Female No res Male Female Male FemaleSC teachers
Text booksUniformAttendanceStationery
% Passed
Avg. No. of Tchs.
%
Female literacyOverall literacy
dev. grant grantSchool T L M
Male Female
IVV
IIIIII
Grade R.R. D.O.R. P.R.
VIIVI
# #
I - V
Enrolment by medium of instructions
Examination results
Retention rate
GPI
Primary cycle U. primary cycleState
DISTRICT ELEMENTARY EDUCATION REPORT CARD : 2005-06
GirlsGrade
IIIIIIIVVVI
VIII
AllGirls
Total
VII
% TotalGrossness
School category
00
3310
0 00 0
2708
3230
0 0 0
1,618 4870 00 0
263 68,1158 00 0
1,583 438 345,465 127,0930 0 00 0 0
83,119 66,391 81,610
0 0 03,682 0 3,682
351,449 141,689 6,2980
1,3570
P + UP P+sec/hs U.P. only UP+sec
School categoryP. only
0.0 0.0 0.0 0.0 0.04.7
Number of Clusters 27141678
% Schools with SCR > 600.0 0.0 0.5 25.0
46.0 0.0 0.0 29.5 50.0% Schools with pre-primary sections 6.4 0.0 0.0 1.0 0.0% Schools with common toilets 66.4 0.0 0.0 81.9 87.5
% Schools with girls toilets 60.5 0.0 0.0 77.2 75.0% Schools with drinking water facility 99.4 0.0 0.0 95.7 100.0
% Enrolment in Govt. schools 71.3 0.0 0.0 45.0 0.0100.0 0.0 0.0 100.0 100.0
% No female teacher schools (tch>=2) 27.5 0.0 0.0 75.0 75.05.2 0.0 0.0 0.8 25.6
0.0 0.0 0.0 0.0 0.0%Enrolment in schools without blackboard 0.0 0.0 0.0 0.0 0.0
2001-02 2002-03 2003-04 2004-05 2005-06IIIIIIIVV
VIVII
Total U.P
120,050108,788
98,62088,05077,63055,381
51,246
112,03798,23994,40885,46377,565
42,01838,218
102,72589,81584,02873,16462,925
36,15031,779
93,90082,38474,91060,27554,005
19,95116,620
91,84373,23862,59454,22249,069
17,53715,544
154,916112,28096,47150,82046,727
96.6
41.5
107.0
47.3
132.2
67.8
0.0
0.00.0
58,00152,94248,04243,02538,24326,31324,42522,831
313,822
191208177184135
474650
1,038
120140152133
96343935
749
8,347
classrooms
00
3,29877
43.60.00.0
48.019.5
17.40.0
39.0
0.012.0
3.9
0.00.0
40.076.6
00
86222
2,130 2,058 12 1 2 29 20 0 0 0 0 00 0 0 0 0 0
581 6 0 0 14 07 0 0 0 1 0
162 552 1,631 2,243 837 16 10 0 0 0 0 0 0 00 0 0 0 0 0 0 0
26 71 492 737 410 4 1 1300 0 0 5 19 0 0 0
8 45 1,061 553 268 1 0 0
434100
162324
00
2480
1288 0 921 1105 0 684 266 8 20000
0000
0000
0000
00
3371
00
500
0000
0030
Terminalgrade Passed
VIII boysV girlsV boys
VIII girls
187 with >60%
9.8765500
187124
0.00.07.80.0
7.20.00.04.0
490789Hindi Urdu Others Sanskrit
00
1491583682
134400
7110
54100
9480
1450000
% Schools recvd.
70.30.00.0
45.112.5
67.20.00.0
37.912.5
118219144
0291
9933000
145326151
0270
21155000
3.60.00.03.13.0
1.50.90.70.6
1.61.41.2
0.50.9
84.1
70.5
0.95
2005-062004-052003-04
UTTAR PRADESH
0.0
Upper PrimaryPrimary
Sex ratio Sex ratio 0-6
17 174
VIII0.0
Enrolment of children
13,646VIII 14,249 28,542 32,044 48,289Total Pr. 330,966 365,474 412,657 467,712 493,138
1 - 5 6 - 8
1,059 8120 240 0
0 0
%Teachers recvd.in-service training
Total schools* Rural schools* Total enrolment* Rural enrolment* Teachers*
1.7 5.2
100.0
64.3
95.9
37.0 43.5% SC enrolment% SC girls to SC enrolment% ST enrolment
48.8 47.1
0.0 0.0
38.0
49.6
28.0
47.7
Position of teachers by educational qualification (other than para teacher)
(Previous academic year)Incentives : Number of beneficiaries
% ST girls to ST enrolment
% Girls
Number of villages
% 0 - 6 population
% SC population % ST population
% Urban population
% Schools with blackboard
% Enrolment in single-teacher schools
% Enrolment in schools without building
Primary Upperprimary
OBC EnrolmentPrimary U. Primary
% OBCEnrolment% OBC girls toOBC Enrolment
Pupil-teacher ratio (PTR)Student-classroom ratio (SCR)% Schools with <= 50 students% Schools with PTR > 100% Female teachers
% Schools established since 1995
Regular teachers Para-teachers
% minorrepairs
% majorrepairs
# = not applicable na = not available * Some totals may not match due to no response in classificatory data items
2.2 96.3
6.6 92.89.0 90.4
29.0 70.58.2 91.0
00
48.76459
1.518.831.331.2
0.000
0.00.00.00.0
47.88146
6.832.113.340.9
34.2153
480.0
75.00.00.0
23.4 22.0 na 57.6 41.5
93610045.318.8
Category
PrivateGovt.PrivateGovtPrivateGovt.PrivateGovt.PrivateGovt.
Total population (in 000's)
Number of blocks/taluks
District
Decadal growth rate
Primary onlyPrimary with upper primaryPrimary with upper primary & sec/higher sec.Upper primary onlyUpper primary with sec./higher secondary
% Single classroom schools% Single teacher schools
P + UP P+sec/hs U.P. only UP+secP. only
No response in school category
Primary with upper primaryPrimary with U.P. & sec/higherUpper primary onlyUpper primary with sec./higher sec
Primary only
Primary onlyPrimary with upper primaryPrimary with Upper primary & sec/higherUpper primary only
Para-teachers
School category
Upper primary with sec./higher secondary
Primary onlyPrimary with upper prim.
P. onlyP + UPP+sec/hsU.P. onlyUP+sec
NER(U.Prim)GER(U.Prim)NER (Primary)GER (Primary)
Transition ratePrim. to U. Prim
SC/ST Enrolment
Indicators
Classrooms/Other rooms
Prim.with U.P.&Sec/H.SUpper Primary onlyU. Primary with Sec./H.S.
Basic Data, 2001
Data reported from
Performance indicators
99.1 40.698.9 37.897.7 35.297.3 34.3
Utt
ar P
rad
esh

561
Elementary Education: Report Card - RAE BARELI
Utt
ar P
rad
esh
0.3340.088
35.7 33.0
Key data: Elementary Education
2872
RAE BARELI
(Previous academic year)
(Previous year)
Gender and caste distribution of teachers*
No. of schools by type of building*
BoysWith disability
Flow rates
Primary Level
Enrolment*
Number of schools
Grade
GER / NER
School category
Primary Upper primaryBoys Boys GirlsGirls
IncentiveType
School categoryMultiple
TypeKuccha
PartiallyPucca
PuccaTotal % good condition
Otherrooms
TentNo
Building
Classrooms
Belowsecondary
Highersecondary
Postgraduate
M. Phil.GraduateSecondarySchool category OthersNo
response
ST teachers
Total Male Female No res Male Female No res Male Female Male FemaleSC teachers
Text booksUniformAttendanceStationery
% Passed
Avg. No. of Tchs.
%
Female literacyOverall literacy
dev. grant grantSchool T L M
Male Female
IVV
IIIIII
Grade R.R. D.O.R. P.R.
VIIVI
# #
I - V
Enrolment by medium of instructions
Examination results
Retention rate
GPI
Primary cycle U. primary cycleState
DISTRICT ELEMENTARY EDUCATION REPORT CARD : 2005-06
GirlsGrade
IIIIIIIVVVI
VIII
AllGirls
Total
VII
% TotalGrossness
School category
41
39610
16 42 1
13520
3798
1 0 0
1,674 4269 5992 239
117 66,59119 1,517
0 0
1,632 365 320,821 66,1854,014 599 2,210
668 239 66826,591 62,715 23,914
0 0 05,840 1,078 5,668
329,209 75,510 5,5758
47831
P + UP P+sec/hs U.P. only UP+sec
School categoryP. only
1.6 0.0 0.0 0.6 0.024.0
Number of Clusters 26851698
% Schools with SCR > 6045.0 100.0 36.9 56.7
43.4 15.0 33.3 18.6 13.3% Schools with pre-primary sections 0.8 0.0 0.0 0.4 3.3% Schools with common toilets 61.7 95.0 100.0 79.5 93.3
% Schools with girls toilets 44.5 85.0 66.7 61.0 76.7% Schools with drinking water facility 98.5 95.0 100.0 94.7 96.7
% Enrolment in Govt. schools 81.3 13.0 26.4 71.5 20.699.9 100.0 100.0 99.4 100.0
% No female teacher schools (tch>=2) 17.9 30.0 0.0 37.5 33.320.8 42.9 100.0 31.4 51.2
0.2 0.0 0.0 0.1 1.1%Enrolment in schools without blackboard 0.0 0.0 0.0 0.1 0.0
2001-02 2002-03 2003-04 2004-05 2005-06IIIIIIIVV
VIVII
Total U.P
87,20287,49383,37480,90768,60539,552
33,994
82,94180,56787,03571,82359,056
31,17028,704
78,31189,60079,52162,96256,634
31,14528,143
87,41475,50264,57156,07349,623
26,34822,046
76,63865,61763,96655,92749,575
20,21115,878
103,19786,05183,96466,69448,819
81.6
34.4
82.9
34.4
103.9
43.0
39.7
0.066.7
42,34542,33240,71939,84533,05118,68816,13714,018
247,135
142185212197190
746972
1,141
90162137151139
574045
821
7,065
classrooms
14719
2,097212
63.770.7
100.073.784.4
28.227.2
8.1
0.021.313.7
2.00.05.01.9
326
78566
1,951 2,014 33 3 2 27 1620 0 0 0 0 0
3 0 0 0 0 0514 2 0 1 10 4
28 0 0 0 0 1
69 625 1,303 1,426 1,032 13 50 0 7 17 14 1 0 00 0 0 0 3 0 0 05 19 514 454 341 3 1 20 3 9 12 47 0 0 0
13 29 539 664 296 1 2 0
308527
11087
63
122
2528
1400 0 633 935 0 487 249 25 120000
0010
0010
0000
00
1987
00
502
0080
0020
Terminalgrade Passed
VIII boysV girlsV boys
VIII girls
12 with >60%
42.0605339
31341
71
14.80.0
52.114.3
31.60.00.0
41.50.0
403609Hindi Others Bodo Assamese Urdu
4325907
931827357
218288
000
2200000
2040000
270000
% Schools recvd.
69.910.0
0.044.610.0
65.65.0
33.337.7
3.3
133735923
1390811021
149270
248050
151735939
1527741041
295790
232020
2.92.01.02.52.4
3.03.24.03.0
2.32.11.9
1.83.1
88.1
65.8
0.95
2005-062004-052003-04
UTTAR PRADESH
66.7
Upper PrimaryPrimary
Sex ratio Sex ratio 0-6
22 188
VIII66.7
Enrolment of children
12,730VIII 18,300 24,676 26,177 29,651Total Pr. 311,723 333,183 367,028 381,422 407,581
1 - 5 6 - 8
1,189 15236 35
0 0
1 2
%Teachers recvd.in-service training
Total schools* Rural schools* Total enrolment* Rural enrolment* Teachers*
4.0 24.9
99.7
32.3
77.5 79.6
28.8 28.6% SC enrolment% SC girls to SC enrolment% ST enrolment
48.4 45.2
48.5 47.2
44.5
48.7
43.3
47.5
Position of teachers by educational qualification (other than para teacher)
(Previous academic year)Incentives : Number of beneficiaries
% ST girls to ST enrolment
% Girls
Number of villages
% 0 - 6 population
% SC population % ST population
% Urban population
% Schools with blackboard
% Enrolment in single-teacher schools
% Enrolment in schools without building
Primary Upperprimary
OBC EnrolmentPrimary U. Primary
% OBCEnrolment% OBC girls toOBC Enrolment
Pupil-teacher ratio (PTR)Student-classroom ratio (SCR)% Schools with <= 50 students% Schools with PTR > 100% Female teachers
% Schools established since 1995
Regular teachers Para-teachers
% minorrepairs
% majorrepairs
# = not applicable na = not available * Some totals may not match due to no response in classificatory data items
5.5 90.53.0 94.0
32.4 65.85.2 91.8
48302
48.76757
3.623.038.633.2
40.4118
315.0
70.030.825.0
47.56944
12.628.118.950.8
47.1104
356.7
53.311.320.0
23.7 29.8 0.1 53.8 39.3
9419519.518.5
Category
PrivateGovt.PrivateGovtPrivateGovt.PrivateGovt.PrivateGovt.
Total population (in 000's)
Number of blocks/taluks
District
Decadal growth rate
Primary onlyPrimary with upper primaryPrimary with upper primary & sec/higher sec.Upper primary onlyUpper primary with sec./higher secondary
% Single classroom schools% Single teacher schools
P + UP P+sec/hs U.P. only UP+secP. only
No response in school category
Primary with upper primaryPrimary with U.P. & sec/higherUpper primary onlyUpper primary with sec./higher sec
Primary only
Primary onlyPrimary with upper primaryPrimary with Upper primary & sec/higherUpper primary only
Para-teachers
School category
Upper primary with sec./higher secondary
Primary onlyPrimary with upper prim.
P. onlyP + UPP+sec/hsU.P. onlyUP+sec
NER(U.Prim)GER(U.Prim)NER (Primary)GER (Primary)
Transition ratePrim. to U. Prim
SC/ST Enrolment
Indicators
Classrooms/Other rooms
Prim.with U.P.&Sec/H.SUpper Primary onlyU. Primary with Sec./H.S.
Basic Data, 2001
Data reported from
Performance indicators
99.1 46.099.2 46.998.3 34.698.1 39.1

562
Elementary Education in India - Where do we stand ?
0.1840.113
18.5 24.3
Key data: Elementary Education
1924
RAMPUR
(Previous academic year)
(Previous year)
Gender and caste distribution of teachers*
No. of schools by type of building*
BoysWith disability
Flow rates
Primary Level
Enrolment*
Number of schools
Grade
GER / NER
School category
Primary Upper primaryBoys Boys GirlsGirls
IncentiveType
School categoryMultiple
TypeKuccha
PartiallyPucca
PuccaTotal % good condition
Otherrooms
TentNo
Building
Classrooms
Belowsecondary
Highersecondary
Postgraduate
M. Phil.GraduateSecondarySchool category OthersNo
response
ST teachers
Total Male Female No res Male Female No res Male Female Male FemaleSC teachers
Text booksUniformAttendanceStationery
% Passed
Avg. No. of Tchs.
%
Female literacyOverall literacy
dev. grant grantSchool T L M
Male Female
IVV
IIIIII
Grade R.R. D.O.R. P.R.
VIIVI
# #
I - V
Enrolment by medium of instructions
Examination results
Retention rate
GPI
Primary cycle U. primary cycleState
DISTRICT ELEMENTARY EDUCATION REPORT CARD : 2005-06
GirlsGrade
IIIIIIIVVVI
VIII
AllGirls
Total
VII
% TotalGrossness
School category
221
2770
53 182 1
511
2680
0 0 0
1,225 34843 2,459
2 13943 30,024
1 00 0
1,149 282 268,681 57,34216,746 1,789 15,436
251 139 2517,234 29,048 6,005
0 0 0300 0 300
278,822 68,991 3,22037
768123
P + UP P+sec/hs U.P. only UP+sec
School categoryP. only
0.8 1.3 0.0 0.3 100.08.1
Number of Clusters 19801660
% Schools with SCR > 6017.3 0.0 42.7 0.0
51.2 25.3 0.0 7.3 100.0% Schools with pre-primary sections 5.1 2.7 0.0 0.3 0.0% Schools with common toilets 99.9 100.0 100.0 99.7 100.0
% Schools with girls toilets 85.4 85.3 100.0 80.2 100.0% Schools with drinking water facility 100.0 100.0 100.0 100.0 100.0
% Enrolment in Govt. schools 80.2 12.8 35.6 80.6 0.0100.0 100.0 100.0 100.0 100.0
% No female teacher schools (tch>=2) 37.8 48.0 100.0 36.3 100.06.1 4.9 0.0 30.1 0.0
0.4 0.7 0.0 0.6 0.0%Enrolment in schools without blackboard 0.0 0.0 0.0 0.0 0.0
2001-02 2002-03 2003-04 2004-05 2005-06IIIIIIIVV
VIVII
Total U.P
85,67589,33571,99563,51549,89517,375
15,154
88,36873,78164,94846,86235,790
11,7679,346
94,44384,08263,82543,35330,065
13,4779,907
86,08162,20044,88131,21422,301
8,7056,294
74,84345,33834,36222,27715,686
4,5683,581
44,55129,15631,50320,30911,203
104.0
19.1
99.2
17.2
137.2
27.7
34.1
0.00.0
40,30643,14434,24730,78524,019
7,7786,7705,123
192,172
190241265231187
344028
1,216
110150195147127
322913
803
5,367
classrooms
49321
1,2901
84.691.3
100.080.9
100.0
13.18.7
2.3
0.014.4
0.0
0.00.04.70.0
1093
4030
1,744 1,542 3 0 2 6 2073 0 0 1 1 0
3 0 0 0 0 0319 0 0 1 1 6
1 0 0 0 0 0
112 354 743 786 499 10 84 6 26 64 53 0 0 30 0 0 5 1 0 0 0
28 51 147 197 127 4 1 250 0 0 2 1 0 0 0
50 105 536 455 215 1 2 0
1801106
6458
3
500
1220
824 0 831 532 0 535 210 28 290000
3030
1000
0000
210
1180
10
160
2040
1020
Terminalgrade Passed
VIII boysV girlsV boys
VIII girls
113 with >60%
18.53988160
6583
3
0.00.0
17.40.0
22.00.0
32.0
344787Hindi Others
18275251
37034300
2412930139224
0
% Schools recvd.
55.58.0
33.340.9
0.0
46.16.70.0
33.50.0
873522
7702942
39923
394214
986812
7644243
57715
348228
2.52.12.01.83.0
1.10.71.51.0
0.80.10.3
1.71.1
65.8
48.3
0.92
2005-062004-052003-04
UTTAR PRADESH
0.0
Upper PrimaryPrimary
Sex ratio Sex ratio 0-6
7 103
VIII66.7
Enrolment of children
3,054VIII 5,310 8,119 8,043 12,022Total Pr. 192,506 246,677 315,768 309,749 360,415
1 - 5 6 - 8
464 1190 30 0
2 4
%Teachers recvd.in-service training
Total schools* Rural schools* Total enrolment* Rural enrolment* Teachers*
3.8 25.9
100.0
20.5
92.7 85.5
11.7 10.9% SC enrolment% SC girls to SC enrolment% ST enrolment
48.0 43.6
43.5 42.7
52.1
47.4
45.4
41.5
Position of teachers by educational qualification (other than para teacher)
(Previous academic year)Incentives : Number of beneficiaries
% ST girls to ST enrolment
% Girls
Number of villages
% 0 - 6 population
% SC population % ST population
% Urban population
% Schools with blackboard
% Enrolment in single-teacher schools
% Enrolment in schools without building
Primary Upperprimary
OBC EnrolmentPrimary U. Primary
% OBCEnrolment% OBC girls toOBC Enrolment
Pupil-teacher ratio (PTR)Student-classroom ratio (SCR)% Schools with <= 50 students% Schools with PTR > 100% Female teachers
% Schools established since 1995
Regular teachers Para-teachers
% minorrepairs
% majorrepairs
# = not applicable na = not available * Some totals may not match due to no response in classificatory data items
3.0 96.31.4 97.1
50.0 48.35.4 93.4
1965
48.28765
2.436.334.038.8
37.5120
3910.752.031.970.7
45.76429
21.319.520.957.6
43.71003000.00.00.00.0
28.0 13.4 na 38.8 27.9
92287925.020.7
Category
PrivateGovt.PrivateGovtPrivateGovt.PrivateGovt.PrivateGovt.
Total population (in 000's)
Number of blocks/taluks
District
Decadal growth rate
Primary onlyPrimary with upper primaryPrimary with upper primary & sec/higher sec.Upper primary onlyUpper primary with sec./higher secondary
% Single classroom schools% Single teacher schools
P + UP P+sec/hs U.P. only UP+secP. only
No response in school category
Primary with upper primaryPrimary with U.P. & sec/higherUpper primary onlyUpper primary with sec./higher sec
Primary only
Primary onlyPrimary with upper primaryPrimary with Upper primary & sec/higherUpper primary only
Para-teachers
School category
Upper primary with sec./higher secondary
Primary onlyPrimary with upper prim.
P. onlyP + UPP+sec/hsU.P. onlyUP+sec
NER(U.Prim)GER(U.Prim)NER (Primary)GER (Primary)
Transition ratePrim. to U. Prim
SC/ST Enrolment
Indicators
Classrooms/Other rooms
Prim.with U.P.&Sec/H.SUpper Primary onlyU. Primary with Sec./H.S.
Basic Data, 2001
Data reported from
Performance indicators
97.3 35.693.9 32.196.3 26.796.6 30.3
Utt
ar P
rad
esh

563
Elementary Education: Report Card - SAHARANPUR
Utt
ar P
rad
esh
0.318
29.0 32.2
Key data: Elementary Education
2897
SAHARANPUR
(Previous academic year)
(Previous year)
Gender and caste distribution of teachers*
No. of schools by type of building*
BoysWith disability
Flow rates
Primary Level
Enrolment*
Number of schools
Grade
GER / NER
School category
Primary Upper primaryBoys Boys GirlsGirls
IncentiveType
School categoryMultiple
TypeKuccha
PartiallyPucca
PuccaTotal % good condition
Otherrooms
TentNo
Building
Classrooms
Belowsecondary
Highersecondary
Postgraduate
M. Phil.GraduateSecondarySchool category OthersNo
response
ST teachers
Total Male Female No res Male Female No res Male Female Male FemaleSC teachers
Text booksUniformAttendanceStationery
% Passed
Avg. No. of Tchs.
%
Female literacyOverall literacy
dev. grant grantSchool T L M
Male Female
IVV
IIIIII
Grade R.R. D.O.R. P.R.
VIIVI
# #
I - V
Enrolment by medium of instructions
Examination results
Retention rate
GPI
Primary cycle U. primary cycleState
DISTRICT ELEMENTARY EDUCATION REPORT CARD : 2005-06
GirlsGrade
IIIIIIIVVVI
VIII
AllGirls
Total
VII
% TotalGrossness
School category
52
4654
64 49 1
24747
4483
77 0 0
1,364 84529 2,179
6 906179 43,624
43 1,5600 0
1,240 670 203,534 90,08020,566 1,975 9,804
2,861 582 1,41927,563 41,849 21,280
0 0 013,325 934 12,057
220,626 116,725 4,05228
3,350496
P + UP P+sec/hs U.P. only UP+sec
School categoryP. only
0.5 0.0 0.0 0.1 0.01.9
Number of Clusters 31291302
% Schools with SCR > 602.9 0.0 11.4 2.0
16.2 13.0 9.1 2.4 15.7% Schools with pre-primary sections 49.4 8.7 45.5 7.6 2.0% Schools with common toilets 89.2 92.8 90.9 93.5 86.3
% Schools with girls toilets 81.3 92.8 90.9 84.7 84.3% Schools with drinking water facility 90.7 94.2 90.9 90.0 90.2
% Enrolment in Govt. schools 65.4 9.6 24.1 61.3 10.596.7 98.6 90.9 100.0 100.0
% No female teacher schools (tch>=2) 38.3 29.0 36.4 51.5 80.41.0 2.2 0.0 6.1 1.7
2.4 0.8 2.5 0.0 0.0%Enrolment in schools without blackboard 2.4 0.8 2.5 0.0 0.0
2001-02 2002-03 2003-04 2004-05 2005-06IIIIIIIVV
VIVII
Total U.P
94,70677,19470,70460,28652,62435,778
30,925
81,77273,60662,57552,94244,202
27,48523,982
82,27263,54854,61645,64539,120
25,13622,256
74,71359,48549,77841,07935,872
22,76219,274
94,42166,98466,38859,069
62.9
27.0
67.9
26.6
89.9
39.0
55.6
0.09.1
42,87535,37233,80028,62225,27616,67314,38012,732
209,730
345336345334256135121
871,959
179178225172191
897562
1,171
8,596
classrooms
608157
2,925671
91.896.7
100.094.396.3
6.22.8
2.0
0.04.43.1
0.50.01.30.6
13355
897203
2,072 2,067 24 3 1 43 7166 0 0 0 2 110 0 0 0 0 1
697 7 0 0 8 051 0 0 0 0 0
156 725 1,227 1,607 848 4 2115 26 93 165 98 1 13 80
0 2 11 3 18 0 3 3843 87 518 631 429 7 1 403
8 7 14 43 91 1 0 113
22 35 406 521 226 0 0 0
2873192
221334
160
24926
54117
2071 1141 580 691 46 557 272 17 155027
244100
40
104
295
180
0700
262
24935
82
663
1050
2040
Terminalgrade Passed
VIII boysV girlsV boys
VIII girls
1,497 with >60%
43.17402524
872147
281
0.00.0
48.74.3
26.50.00.0
29.90.0
310398Hindi Others Urdu English Assamese
190582194
6639311562
11144608693
31642931
59252789
000
4000
88000
760000
% Schools recvd.
52.80.09.1
46.82.0
51.50.00.0
42.80.0
835410
10139355
113470
19890
1046900
9686345
197940
14970
3.47.67.93.05.5
6.34.74.03.1
2.21.71.5
2.04.3
79.6
0.88
2005-062004-052003-04
UTTAR PRADESH
35.6
Upper PrimaryPrimary
Sex ratio Sex ratio 0-6
14 123
VIII9.1
Enrolment of children
VIII 17,033 18,996 15,517 27,718Total Pr. 260,927 285,201 315,097 355,514
1 - 5 6 - 8
1,189 95812 269
0 0
33 54
%Teachers recvd.in-service training
Total schools* Rural schools* Total enrolment* Rural enrolment* Teachers*
12.8 23.7
78.4
29.7
51.7 56.0
20.2 18.9% SC enrolment% SC girls to SC enrolment% ST enrolment
47.1 46.1
46.9 45.7
54.7
46.7
44.6
45.8
Position of teachers by educational qualification (other than para teacher)
(Previous academic year)Incentives : Number of beneficiaries
% ST girls to ST enrolment
% Girls
Number of villages
% 0 - 6 population
% SC population % ST population
% Urban population
% Schools with blackboard
% Enrolment in single-teacher schools
% Enrolment in schools without building
Primary Upperprimary
OBC EnrolmentPrimary U. Primary
% OBCEnrolment% OBC girls toOBC Enrolment
Pupil-teacher ratio (PTR)Student-classroom ratio (SCR)% Schools with <= 50 students% Schools with PTR > 100% Female teachers
% Schools established since 1995
Regular teachers Para-teachers
% minorrepairs
% majorrepairs
# = not applicable na = not available * Some totals may not match due to no response in classificatory data items
3.5 90.12.6 92.72.2 93.8
18.4 79.64.4 91.2
2443
46.84639
6.74.7
37.342.5
43.34337
1.413.053.140.6
46.83324
24.72.0
26.070.6
44.65322
0.021.6
6.03.9
23.4 21.7 na 61.2 50.0
87286525.818.6
Category
PrivateGovt.PrivateGovtPrivateGovt.PrivateGovt.PrivateGovt.
Total population (in 000's)
Number of blocks/taluks
District
Decadal growth rate
Primary onlyPrimary with upper primaryPrimary with upper primary & sec/higher sec.Upper primary onlyUpper primary with sec./higher secondary
% Single classroom schools% Single teacher schools
P + UP P+sec/hs U.P. only UP+secP. only
No response in school category
Primary with upper primaryPrimary with U.P. & sec/higherUpper primary onlyUpper primary with sec./higher sec
Primary only
Primary onlyPrimary with upper primaryPrimary with Upper primary & sec/higherUpper primary only
Para-teachers
School category
Upper primary with sec./higher secondary
Primary onlyPrimary with upper prim.
P. onlyP + UPP+sec/hsU.P. onlyUP+sec
NER(U.Prim)GER(U.Prim)NER (Primary)GER (Primary)
Transition ratePrim. to U. Prim
1.3
SC/ST Enrolment
Indicators
Classrooms/Other rooms
Prim.with U.P.&Sec/H.SUpper Primary onlyU. Primary with Sec./H.S.
Basic Data, 2001
Data reported from
Performance indicators
99.5 46.899.6 46.297.3 39.397.9 46.9

564
Elementary Education in India - Where do we stand ?
0.0040.000
31.4 31.2
Key data: Elementary Education
1420
SANT KABIR NAGAR
(Previous academic year)
(Previous year)
Gender and caste distribution of teachers*
No. of schools by type of building*
BoysWith disability
Flow rates
Primary Level
Enrolment*
Number of schools
Grade
GER / NER
School category
Primary Upper primaryBoys Boys GirlsGirls
IncentiveType
School categoryMultiple
TypeKuccha
PartiallyPucca
PuccaTotal % good condition
Otherrooms
TentNo
Building
Classrooms
Belowsecondary
Highersecondary
Postgraduate
M. Phil.GraduateSecondarySchool category OthersNo
response
ST teachers
Total Male Female No res Male Female No res Male Female Male FemaleSC teachers
Text booksUniformAttendanceStationery
% Passed
Avg. No. of Tchs.
%
Female literacyOverall literacy
dev. grant grantSchool T L M
Male Female
IVV
IIIIII
Grade R.R. D.O.R. P.R.
VIIVI
# #
I - V
Enrolment by medium of instructions
Examination results
Retention rate
GPI
Primary cycle U. primary cycleState
DISTRICT ELEMENTARY EDUCATION REPORT CARD : 2005-06
GirlsGrade
IIIIIIIVVVI
VIII
AllGirls
Total
VII
% TotalGrossness
School category
458
1760
9 454 8
4318
1730
1 0 0
797 1319 4,9874 1,309
42 24,08117 0
0 0
792 126 145,809 27,5182,377 4,987 2,3771,913 1,309 1,9138,491 23,294 8,224
0 0 03,955 0 3,825
147,152 28,546 1,68797
30929
P + UP P+sec/hs U.P. only UP+sec
School categoryP. only
0.8 0.0 0.0 0.0 0.020.0
Number of Clusters 1232833
% Schools with SCR > 6020.4 25.0 25.6 5.6
47.1 14.8 16.7 6.8 0.0% Schools with pre-primary sections 41.4 9.3 0.0 3.7 0.0% Schools with common toilets 72.7 75.9 100.0 90.9 88.9
% Schools with girls toilets 65.7 68.5 83.3 85.4 88.9% Schools with drinking water facility 96.7 94.4 91.7 86.8 100.0
% Enrolment in Govt. schools 83.8 67.7 40.6 73.9 0.099.6 98.1 91.7 100.0 100.0
% No female teacher schools (tch>=2) 41.5 63.0 66.7 59.4 72.215.4 6.6 3.7 11.5 7.5
0.3 0.0 0.0 0.0 0.0%Enrolment in schools without blackboard 0.7 0.3 7.6 0.0 0.0
2001-02 2002-03 2003-04 2004-05 2005-06IIIIIIIVV
VIVII
Total U.P
47,03740,44933,89731,26825,65217,843
14,435
49,17937,32935,30727,64623,551
14,22912,521
40,20734,25828,13622,11418,587
12,34610,357
45,12430,77625,40419,80018,253
11,83010,548
40,89426,70221,55318,58118,247
11,0919,811
44,50838,31932,11231,93328,811
64.5
26.6
76.0
31.0
91.9
37.5
42.5
25.025.0
23,17520,04916,81215,46812,498
8,2096,3305,240
107,781
92132133126
95413432
685
58100
907382302226
481
3,172
classrooms
230111
1,126199
85.278.365.884.591.5
10.315.7
4.5
26.112.0
8.5
6.18.13.60.0
5826
31359
849 897 12 5 0 12 245 3 1 0 4 111 0 0 0 1 0
209 1 0 0 7 216 0 0 1 1 0
44 229 447 479 179 4 52 1 53 42 27 0 0 01 0 11 3 11 0 0 08 12 206 214 125 0 0 10 0 0 16 29 0 0 0
18 11 254 236 92 0 0 0
1196109
26506
39
160
606
193 0 328 278 1 257 91 4 30000
1030
0002
0000
194
972
1060
3100
0000
Terminalgrade Passed
VIII boysV girlsV boys
VIII girls
2 with >60%
35.11996126
26569
47
20.930.830.5
0.0
31.218.8
36.70.0
171319Hindi Others Urdu Sanskrit Marathi
73643222
317553955
147600
8170
19790000
1110000
920000
% Schools recvd.
73.825.941.745.7
5.6
71.233.341.747.5
5.6
4616296
365070
620132
549138
5850899
324940
1107458
473647
2.22.32.22.62.6
1.50.70.61.3
1.30.81.0
0.51.0
62.4
75.0
0.97
2005-062004-052003-04
UTTAR PRADESH
0.0
Upper PrimaryPrimary
Sex ratio Sex ratio 0-6
8 84
VIII50.0
Enrolment of children
7,909VIII 9,555 9,409 11,569 12,230Total Pr. 125,977 139,357 143,302 173,012 178,303
1 - 5 6 - 8
446 1230 470 0
16 10
%Teachers recvd.in-service training
Total schools* Rural schools* Total enrolment* Rural enrolment* Teachers*
6.6 24.0
85.9
28.5
59.5 69.9
19.7 24.4% SC enrolment% SC girls to SC enrolment% ST enrolment
49.7 44.9
0.0 50.0
54.2
49.3
49.5
43.2
Position of teachers by educational qualification (other than para teacher)
(Previous academic year)Incentives : Number of beneficiaries
% ST girls to ST enrolment
% Girls
Number of villages
% 0 - 6 population
% SC population % ST population
% Urban population
% Schools with blackboard
% Enrolment in single-teacher schools
% Enrolment in schools without building
Primary Upperprimary
OBC EnrolmentPrimary U. Primary
% OBCEnrolment% OBC girls toOBC Enrolment
Pupil-teacher ratio (PTR)Student-classroom ratio (SCR)% Schools with <= 50 students% Schools with PTR > 100% Female teachers
% Schools established since 1995
Regular teachers Para-teachers
% minorrepairs
% majorrepairs
# = not applicable na = not available * Some totals may not match due to no response in classificatory data items
16.7 81.79.1 90.3
11.9 87.56.3 92.4
24.5 75.013.5 85.5
2.5 96.7
29124
49.48855
2.335.223.635.9
48.55832
37.020.412.768.5
43.95729
27.412.310.558.0
42.18420
5.622.217.016.7
23.6 21.2 na 50.9 34.9
9419747.120.7
Category
PrivateGovt.PrivateGovtPrivateGovt.PrivateGovt.PrivateGovt.
Total population (in 000's)
Number of blocks/taluks
District
Decadal growth rate
Primary onlyPrimary with upper primaryPrimary with upper primary & sec/higher sec.Upper primary onlyUpper primary with sec./higher secondary
% Single classroom schools% Single teacher schools
P + UP P+sec/hs U.P. only UP+secP. only
No response in school category
Primary with upper primaryPrimary with U.P. & sec/higherUpper primary onlyUpper primary with sec./higher sec
Primary only
Primary onlyPrimary with upper primaryPrimary with Upper primary & sec/higherUpper primary only
Para-teachers
School category
Upper primary with sec./higher secondary
Primary onlyPrimary with upper prim.
P. onlyP + UPP+sec/hsU.P. onlyUP+sec
NER(U.Prim)GER(U.Prim)NER (Primary)GER (Primary)
Transition ratePrim. to U. Prim
SC/ST Enrolment
Indicators
Classrooms/Other rooms
Prim.with U.P.&Sec/H.SUpper Primary onlyU. Primary with Sec./H.S.
Basic Data, 2001
Data reported from
Performance indicators
99.4 45.399.4 42.298.7 37.693.1 36.9
Utt
ar P
rad
esh

565
Elementary Education: Report Card - SHAHJAHANPUR
Utt
ar P
rad
esh
0.1460.200
19.8 23.3
Key data: Elementary Education
2548
SHAHJAHANPUR
(Previous academic year)
(Previous year)
Gender and caste distribution of teachers*
No. of schools by type of building*
BoysWith disability
Flow rates
Primary Level
Enrolment*
Number of schools
Grade
GER / NER
School category
Primary Upper primaryBoys Boys GirlsGirls
IncentiveType
School categoryMultiple
TypeKuccha
PartiallyPucca
PuccaTotal % good condition
Otherrooms
TentNo
Building
Classrooms
Belowsecondary
Highersecondary
Postgraduate
M. Phil.GraduateSecondarySchool category OthersNo
response
ST teachers
Total Male Female No res Male Female No res Male Female Male FemaleSC teachers
Text booksUniformAttendanceStationery
% Passed
Avg. No. of Tchs.
%
Female literacyOverall literacy
dev. grant grantSchool T L M
Male Female
IVV
IIIIII
Grade R.R. D.O.R. P.R.
VIIVI
# #
I - V
Enrolment by medium of instructions
Examination results
Retention rate
GPI
Primary cycle U. primary cycleState
DISTRICT ELEMENTARY EDUCATION REPORT CARD : 2005-06
GirlsGrade
IIIIIIIVVVI
VIII
AllGirls
Total
VII
% TotalGrossness
School category
131
4356
44 123 1
361
4315
0 0 0
2,079 24926 2,789
2 34132 57,476
1 6180 0
2,041 187 362,649 31,77812,732 2,469 7,879
643 341 3386,866 57,146 6,185
0 0 051 495 51
370,630 42,961 5,72749
859179
P + UP P+sec/hs U.P. only UP+sec
School categoryP. only
3.1 3.5 0.0 2.1 0.02.7
Number of Clusters 28672004
% Schools with SCR > 607.0 0.0 24.0 14.3
51.8 14.0 25.0 17.8 28.6% Schools with pre-primary sections 0.9 0.0 0.0 0.0 0.0% Schools with common toilets 92.0 93.0 100.0 84.9 71.4
% Schools with girls toilets 73.6 87.7 100.0 62.6 57.1% Schools with drinking water facility 99.5 100.0 100.0 97.7 100.0
% Enrolment in Govt. schools 89.6 18.0 34.7 89.3 92.4100.0 100.0 100.0 100.0 100.0
% No female teacher schools (tch>=2) 30.4 29.8 50.0 45.2 42.92.2 2.5 0.0 17.4 3.3
0.0 0.0 0.0 0.0 0.0%Enrolment in schools without blackboard 0.0 0.0 0.0 0.0 0.0
2001-02 2002-03 2003-04 2004-05 2005-06IIIIIIIVV
VIVII
Total U.P
101,49296,82581,92378,12265,57928,781
23,541
98,78481,74282,45370,09557,044
20,68816,313
87,46286,51977,50363,36350,722
18,91714,834
92,23779,16867,48655,12541,760
11,7308,460
85,70472,24363,59851,14640,836
6,7065,120
71,16650,93245,73527,22115,699
90.8
20.9
94.3
22.6
121.9
33.4
36.2
0.050.0
47,24245,92538,26536,61030,48912,010
9,7587,464
227,763
383819741682512148345250
3,880
434755583470292273337
703,214
6,467
classrooms
40527
1,70026
75.799.8
100.084.9
100.0
19.50.2
4.8
0.011.8
0.0
0.00.03.30.0
1254
6538
2,609 2,316 10 2 0 0 057 0 0 0 0 0
4 0 0 0 0 0470 1 0 0 0 0
7 0 0 0 0 0
152 581 1,124 1,103 571 8 35 3 36 85 85 0 4 80 1 2 9 2 0 0 0
50 36 431 456 329 3 2 692 2 6 4 4 0 0 1
41 72 1,237 551 240 0 0 0
2708117
121036
15
1092
3404
1242 0 1428 1208 0 545 215 29 100000
1070
1000
0000
130
1853
90
652
0090
1010
Terminalgrade Passed
VIII boysV girlsV boys
VIII girls
408 with >60%
11.96586228
141383
19
0.80.0
17.40.0
9.90.00.0
12.60.0
409694Hindi Others Kannada Urdu
15182758
63422669
37160
226476
0
000
4440
0339
000
% Schools recvd.
81.28.80.0
40.628.6
81.610.5
0.052.757.1
1223170
17916
11940000
1469530
1570
15156000
2.84.03.52.92.7
2.01.41.41.4
1.10.70.8
1.81.6
75.3
50.1
0.88
2005-062004-052003-04
UTTAR PRADESH
14.3
Upper PrimaryPrimary
Sex ratio Sex ratio 0-6
16 148
VIII75.0
Enrolment of children
3,873VIII 7,031 11,984 13,931 18,844Total Pr. 313,527 335,776 365,569 390,118 423,941
1 - 5 6 - 8
1,264 11917 2
0 0
3 11
%Teachers recvd.in-service training
Total schools* Rural schools* Total enrolment* Rural enrolment* Teachers*
4.0 35.0
100.0
21.7
82.7 89.0
15.4 19.5% SC enrolment% SC girls to SC enrolment% ST enrolment
47.2 40.9
45.6 40.4
48.2
46.6
38.2
37.6
Position of teachers by educational qualification (other than para teacher)
(Previous academic year)Incentives : Number of beneficiaries
% ST girls to ST enrolment
% Girls
Number of villages
% 0 - 6 population
% SC population % ST population
% Urban population
% Schools with blackboard
% Enrolment in single-teacher schools
% Enrolment in schools without building
Primary Upperprimary
OBC EnrolmentPrimary U. Primary
% OBCEnrolment% OBC girls toOBC Enrolment
Pupil-teacher ratio (PTR)Student-classroom ratio (SCR)% Schools with <= 50 students% Schools with PTR > 100% Female teachers
% Schools established since 1995
Regular teachers Para-teachers
% minorrepairs
% majorrepairs
# = not applicable na = not available * Some totals may not match due to no response in classificatory data items
1.2 96.8
5.0 93.66.6 92.1
48.1 50.19.5 88.9
3670
46.96364
1.815.637.234.5
42.76838
0.028.148.236.8
40.94738
13.811.724.653.7
49.03526
14.30.0
21.157.1
28.3 17.7 na 49.1 36.3
89784220.619.7
Category
PrivateGovt.PrivateGovtPrivateGovt.PrivateGovt.PrivateGovt.
Total population (in 000's)
Number of blocks/taluks
District
Decadal growth rate
Primary onlyPrimary with upper primaryPrimary with upper primary & sec/higher sec.Upper primary onlyUpper primary with sec./higher secondary
% Single classroom schools% Single teacher schools
P + UP P+sec/hs U.P. only UP+secP. only
No response in school category
Primary with upper primaryPrimary with U.P. & sec/higherUpper primary onlyUpper primary with sec./higher sec
Primary only
Primary onlyPrimary with upper primaryPrimary with Upper primary & sec/higherUpper primary only
Para-teachers
School category
Upper primary with sec./higher secondary
Primary onlyPrimary with upper prim.
P. onlyP + UPP+sec/hsU.P. onlyUP+sec
NER(U.Prim)GER(U.Prim)NER (Primary)GER (Primary)
Transition ratePrim. to U. Prim
SC/ST Enrolment
Indicators
Classrooms/Other rooms
Prim.with U.P.&Sec/H.SUpper Primary onlyU. Primary with Sec./H.S.
Basic Data, 2001
Data reported from
Performance indicators
98.7 26.498.4 25.197.7 26.497.3 27.8
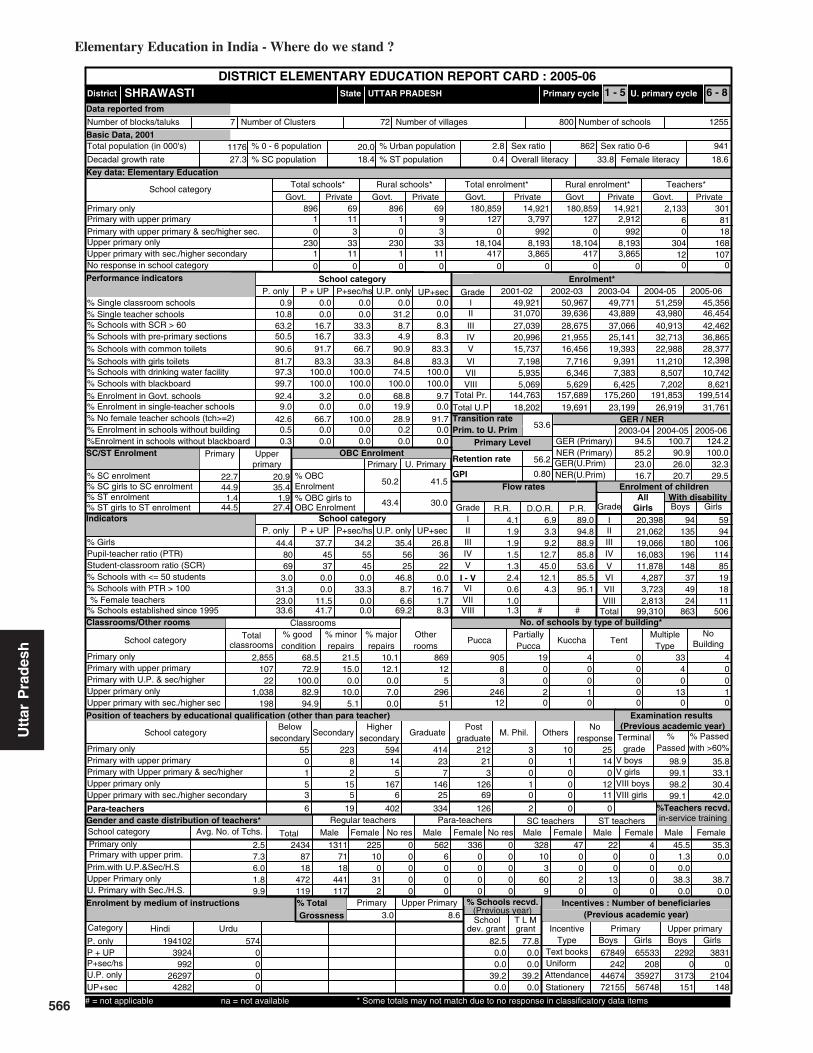
566
Elementary Education in India - Where do we stand ?
22.7 20.9
Key data: Elementary Education
1176
SHRAWASTI
(Previous academic year)
(Previous year)
Gender and caste distribution of teachers*
No. of schools by type of building*
BoysWith disability
Flow rates
Primary Level
Enrolment*
Number of schools
Grade
GER / NER
School category
Primary Upper primaryBoys Boys GirlsGirls
IncentiveType
School categoryMultiple
TypeKuccha
PartiallyPucca
PuccaTotal % good condition
Otherrooms
TentNo
Building
Classrooms
Belowsecondary
Highersecondary
Postgraduate
M. Phil.GraduateSecondarySchool category OthersNo
response
ST teachers
Total Male Female No res Male Female No res Male Female Male FemaleSC teachers
Text booksUniformAttendanceStationery
% Passed
Avg. No. of Tchs.
%
Female literacyOverall literacy
dev. grant grantSchool T L M
Male Female
IVV
IIIIII
Grade R.R. D.O.R. P.R.
VIIVI
# #
I - V
Enrolment by medium of instructions
Examination results
Retention rate
GPI
Primary cycle U. primary cycleState
DISTRICT ELEMENTARY EDUCATION REPORT CARD : 2005-06
GirlsGrade
IIIIIIIVVVI
VIII
AllGirls
Total
VII
% TotalGrossness
School category
10
2301
11 13 0
3311
2301
0 0 0
896 699 1273 0
33 18,10411 417
0 0
896 69 180,859 14,9213,797 127 2,912
992 0 9928,193 18,104 8,193
0 0 03,865 417 3,865
180,859 14,921 2,1336
30181
P + UP P+sec/hs U.P. only UP+sec
School categoryP. only
0.9 0.0 0.0 0.0 0.010.8
Number of Clusters 1255800
% Schools with SCR > 600.0 0.0 31.2 0.0
63.2 16.7 33.3 8.7 8.3% Schools with pre-primary sections 50.5 16.7 33.3 4.9 8.3% Schools with common toilets 90.6 91.7 66.7 90.9 83.3
% Schools with girls toilets 81.7 83.3 33.3 84.8 83.3% Schools with drinking water facility 97.3 100.0 100.0 74.5 100.0
% Enrolment in Govt. schools 92.4 3.2 0.0 68.8 9.799.7 100.0 100.0 100.0 100.0
% No female teacher schools (tch>=2) 42.6 66.7 100.0 28.9 91.79.0 0.0 0.0 19.9 0.0
0.5 0.0 0.0 0.2 0.0%Enrolment in schools without blackboard 0.3 0.0 0.0 0.0 0.0
2001-02 2002-03 2003-04 2004-05 2005-06IIIIIIIVV
VIVII
Total U.P
45,35646,45442,46236,86528,37712,398
10,742
51,25943,98040,91332,71322,988
11,2108,507
49,77143,88937,06625,14119,393
9,3917,383
50,96739,63628,67521,95516,456
7,7166,346
49,92131,07027,03920,99615,737
7,1985,935
31,76126,91923,19919,69118,202
94.5
23.0
100.7
26.0
124.2
32.3
34.2
0.033.3
20,39821,06219,06616,08311,878
4,2873,7232,813
99,310
94135180196148
374924
863
5994
106114
85191811
506
2,855
classrooms
10722
1,038198
68.572.9
100.082.994.9
21.515.0
10.1
0.010.0
5.1
12.10.07.00.0
125
29651
869 905 19 4 0 33 48 0 0 0 4 03 0 0 0 0 0
246 2 1 0 13 112 0 0 0 0 0
55 223 594 414 212 3 100 8 14 23 21 0 1 141 2 5 7 3 0 0 05 15 167 146 126 1 0 123 5 6 25 69 0 0 11
6 19 402 334 126 2 0 0
13117118
441117
100
312
225 0 562 336 0 328 47 22 40000
6000
0000
0000
103
609
0020
00
130
0000
Terminalgrade Passed
VIII boysV girlsV boys
VIII girls
25 with >60%
45.524348718
472119
1.30.0
38.30.0
35.30.0
38.70.0
194102Hindi Urdu
3924992
262974282
5740000
% Schools recvd.
82.50.00.0
39.20.0
77.80.00.0
39.20.0
67849242
4467472155
22920
3173151
65533208
3592756748
38310
2104148
2.57.36.01.89.9
4.11.91.91.5
0.61.01.3
1.32.4
56.2
53.6
0.80
2005-062004-052003-04
UTTAR PRADESH
0.0
Upper PrimaryPrimary
Sex ratio Sex ratio 0-6
7 72
VIII0.0
Enrolment of children
5,069VIII 5,629 6,425 7,202 8,621Total Pr. 144,763 157,689 175,260 191,853 199,514
1 - 5 6 - 8
304 16812 107
0 0
0 18
%Teachers recvd.in-service training
Total schools* Rural schools* Total enrolment* Rural enrolment* Teachers*
3.0 8.6
100.0
29.5
85.2 90.9
16.7 20.7% SC enrolment% SC girls to SC enrolment% ST enrolment
44.9 35.41.4
44.5 27.4
50.2
43.4
41.5
30.0
Position of teachers by educational qualification (other than para teacher)
(Previous academic year)Incentives : Number of beneficiaries
% ST girls to ST enrolment
% Girls
Number of villages
% 0 - 6 population
% SC population % ST population
% Urban population
% Schools with blackboard
% Enrolment in single-teacher schools
% Enrolment in schools without building
Primary Upperprimary
OBC EnrolmentPrimary U. Primary
% OBCEnrolment% OBC girls toOBC Enrolment
Pupil-teacher ratio (PTR)Student-classroom ratio (SCR)% Schools with <= 50 students% Schools with PTR > 100% Female teachers
% Schools established since 1995
Regular teachers Para-teachers
% minorrepairs
% majorrepairs
# = not applicable na = not available * Some totals may not match due to no response in classificatory data items
6.9 89.03.3 94.89.2 88.9
12.7 85.845.0 53.612.1 85.5
4.3 95.1
4555
44.48069
3.031.323.033.6
37.74537
0.00.0
11.541.7
35.45625
46.88.76.6
69.2
26.83622
0.016.7
1.78.3
27.3 18.4 0.4 33.8 18.6
9418622.820.0
Category
PrivateGovt.PrivateGovtPrivateGovt.PrivateGovt.PrivateGovt.
Total population (in 000's)
Number of blocks/taluks
District
Decadal growth rate
Primary onlyPrimary with upper primaryPrimary with upper primary & sec/higher sec.Upper primary onlyUpper primary with sec./higher secondary
% Single classroom schools% Single teacher schools
P + UP P+sec/hs U.P. only UP+secP. only
No response in school category
Primary with upper primaryPrimary with U.P. & sec/higherUpper primary onlyUpper primary with sec./higher sec
Primary only
Primary onlyPrimary with upper primaryPrimary with Upper primary & sec/higherUpper primary only
Para-teachers
School category
Upper primary with sec./higher secondary
Primary onlyPrimary with upper prim.
P. onlyP + UPP+sec/hsU.P. onlyUP+sec
NER(U.Prim)GER(U.Prim)NER (Primary)GER (Primary)
Transition ratePrim. to U. Prim
1.9
SC/ST Enrolment
Indicators
Classrooms/Other rooms
Prim.with U.P.&Sec/H.SUpper Primary onlyU. Primary with Sec./H.S.
Basic Data, 2001
Data reported from
Performance indicators
98.9 35.899.1 33.198.2 30.499.1 42.0
Utt
ar P
rad
esh

567
Elementary Education: Report Card - SIDDHARTHNAGAR
Utt
ar P
rad
esh
0.1590.303
25.7 23.7
Key data: Elementary Education
2040
SIDDHARTHNAGAR
(Previous academic year)
(Previous year)
Gender and caste distribution of teachers*
No. of schools by type of building*
BoysWith disability
Flow rates
Primary Level
Enrolment*
Number of schools
Grade
GER / NER
School category
Primary Upper primaryBoys Boys GirlsGirls
IncentiveType
School categoryMultiple
TypeKuccha
PartiallyPucca
PuccaTotal % good condition
Otherrooms
TentNo
Building
Classrooms
Belowsecondary
Highersecondary
Postgraduate
M. Phil.GraduateSecondarySchool category OthersNo
response
ST teachers
Total Male Female No res Male Female No res Male Female Male FemaleSC teachers
Text booksUniformAttendanceStationery
% Passed
Avg. No. of Tchs.
%
Female literacyOverall literacy
dev. grant grantSchool T L M
Male Female
IVV
IIIIII
Grade R.R. D.O.R. P.R.
VIIVI
# #
I - V
Enrolment by medium of instructions
Examination results
Retention rate
GPI
Primary cycle U. primary cycleState
DISTRICT ELEMENTARY EDUCATION REPORT CARD : 2005-06
GirlsGrade
IIIIIIIVVVI
VIII
AllGirls
Total
VII
% TotalGrossness
School category
00
5141
21 00 0
5724
5090
0 0 0
1,400 10220 0
0 053 33,89824 235
0 0
1,382 90 251,852 23,1846,004 0 5,936
0 0 09,800 33,133 9,290
0 0 05,496 0 5,496
255,741 25,566 3,9170
493127
P + UP P+sec/hs U.P. only UP+sec
School categoryP. only
0.0 0.0 0.0 0.0 0.07.0
Number of Clusters 21191453
% Schools with SCR > 600.0 0.0 53.2 4.0
46.9 19.0 0.0 3.5 4.0% Schools with pre-primary sections 2.9 4.8 0.0 0.5 0.0% Schools with common toilets 76.5 76.2 0.0 68.1 96.0
% Schools with girls toilets 61.6 61.9 0.0 49.6 92.0% Schools with drinking water facility 98.2 95.2 0.0 58.0 96.0
% Enrolment in Govt. schools 90.9 0.0 0.0 77.6 4.197.4 52.4 0.0 84.1 88.0
% No female teacher schools (tch>=2) 24.4 57.1 0.0 29.2 72.02.8 0.0 0.0 27.4 7.8
0.0 0.0 0.0 0.0 0.0%Enrolment in schools without blackboard 3.8 32.0 0.0 13.4 5.6
2001-02 2002-03 2003-04 2004-05 2005-06IIIIIIIVV
VIVII
Total U.P
82,28467,91854,58645,87535,13521,619
16,242
80,87760,08954,67042,98432,295
18,84116,538
73,61159,61248,28136,55129,315
17,60013,757
75,61953,66940,99333,49727,427
10,8718,494
67,21846,23439,06132,07525,606
8,6887,281
50,94248,22542,55426,52921,375
77.0
24.4
82.1
26.9
102.6
29.9
0.0
0.00.0
38,72031,83024,97320,26214,411
8,5286,1835,047
149,954
169175178174142
363646
956
89118113107
81352929
601
4,927
classrooms
1880
2,115352
67.480.3
0.082.394.0
25.312.8
7.3
0.013.9
4.8
6.90.03.81.1
300
72253
1,576 1,497 0 1 0 3 017 0 0 0 4 0
0 0 0 0 0 0569 0 0 0 2 0
24 0 0 0 1 0
63 347 829 643 195 4 22 5 34 59 22 0 0 30 0 0 0 0 0 0 0
10 33 440 449 186 2 0 30 0 17 85 55 0 0 0
6 50 1,523 500 188 0 0 0
1786105
0923140
200
20017
332 0 1274 1018 0 482 161 20 90000
2000
0000
0000
180
1286
10
214
0079
0070
Terminalgrade Passed
VIII boysV girlsV boys
VIII girls
35 with >60%
27.84410127
01123
157
7.50.0
12.60.7
26.10.00.0
13.50.0
273663Hindi Urdu Others Manipuri
52270
436575568
4590253
00
163
216900
410
3180000
% Schools recvd.
75.614.3
0.024.0
0.0
69.44.80.0
24.00.0
786451050
7756553
52140
81220
87218453
6211465
79800
46560
2.96.00.02.06.3
3.91.20.80.6
0.40.40.3
1.01.8
51.8
66.7
0.84
2005-062004-052003-04
UTTAR PRADESH
0.0
Upper PrimaryPrimary
Sex ratio Sex ratio 0-6
14 161
VIII0.0
Enrolment of children
5,406VIII 7,164 11,197 12,846 13,081Total Pr. 210,194 231,205 247,370 270,915 285,798
1 - 5 6 - 8
824 29911 146
0 0
0 0
%Teachers recvd.in-service training
Total schools* Rural schools* Total enrolment* Rural enrolment* Teachers*
8.2 22.8
94.2
23.1
71.6 76.8
19.8 21.6% SC enrolment% SC girls to SC enrolment% ST enrolment
46.5 40.5
50.6 30.9
57.9
44.9
48.1
36.2
Position of teachers by educational qualification (other than para teacher)
(Previous academic year)Incentives : Number of beneficiaries
% ST girls to ST enrolment
% Girls
Number of villages
% 0 - 6 population
% SC population % ST population
% Urban population
% Schools with blackboard
% Enrolment in single-teacher schools
% Enrolment in schools without building
Primary Upperprimary
OBC EnrolmentPrimary U. Primary
% OBCEnrolment% OBC girls toOBC Enrolment
Pupil-teacher ratio (PTR)Student-classroom ratio (SCR)% Schools with <= 50 students% Schools with PTR > 100% Female teachers
% Schools established since 1995
Regular teachers Para-teachers
% minorrepairs
% majorrepairs
# = not applicable na = not available * Some totals may not match due to no response in classificatory data items
13.0 83.18.7 90.1
15.7 83.518.5 81.032.3 66.715.8 82.413.7 85.920.8 78.8
00
45.76457
6.516.330.638.7
36.24732
4.89.5
15.719.0
39.43921
53.48.8
17.871.3
35.63716
4.08.0
10.84.0
26.8 16.5 na 42.3 27.1
9649483.821.3
Category
PrivateGovt.PrivateGovtPrivateGovt.PrivateGovt.PrivateGovt.
Total population (in 000's)
Number of blocks/taluks
District
Decadal growth rate
Primary onlyPrimary with upper primaryPrimary with upper primary & sec/higher sec.Upper primary onlyUpper primary with sec./higher secondary
% Single classroom schools% Single teacher schools
P + UP P+sec/hs U.P. only UP+secP. only
No response in school category
Primary with upper primaryPrimary with U.P. & sec/higherUpper primary onlyUpper primary with sec./higher sec
Primary only
Primary onlyPrimary with upper primaryPrimary with Upper primary & sec/higherUpper primary only
Para-teachers
School category
Upper primary with sec./higher secondary
Primary onlyPrimary with upper prim.
P. onlyP + UPP+sec/hsU.P. onlyUP+sec
NER(U.Prim)GER(U.Prim)NER (Primary)GER (Primary)
Transition ratePrim. to U. Prim
SC/ST Enrolment
Indicators
Classrooms/Other rooms
Prim.with U.P.&Sec/H.SUpper Primary onlyU. Primary with Sec./H.S.
Basic Data, 2001
Data reported from
Performance indicators
98.7 28.197.5 23.998.7 23.898.0 25.8

568
Elementary Education in India - Where do we stand ?
0.0120.165
34.2 36.8
Key data: Elementary Education
3620
SITAPUR
(Previous academic year)
(Previous year)
Gender and caste distribution of teachers*
No. of schools by type of building*
BoysWith disability
Flow rates
Primary Level
Enrolment*
Number of schools
Grade
GER / NER
School category
Primary Upper primaryBoys Boys GirlsGirls
IncentiveType
School categoryMultiple
TypeKuccha
PartiallyPucca
PuccaTotal % good condition
Otherrooms
TentNo
Building
Classrooms
Belowsecondary
Highersecondary
Postgraduate
M. Phil.GraduateSecondarySchool category OthersNo
response
ST teachers
Total Male Female No res Male Female No res Male Female Male FemaleSC teachers
Text booksUniformAttendanceStationery
% Passed
Avg. No. of Tchs.
%
Female literacyOverall literacy
dev. grant grantSchool T L M
Male Female
IVV
IIIIII
Grade R.R. D.O.R. P.R.
VIIVI
# #
I - V
Enrolment by medium of instructions
Examination results
Retention rate
GPI
Primary cycle U. primary cycleState
DISTRICT ELEMENTARY EDUCATION REPORT CARD : 2005-06
GirlsGrade
IIIIIIIVVVI
VIII
AllGirls
Total
VII
% TotalGrossness
School category
9118
6179
46 8717 16
1419
5979
0 0 0
2,499 48336 13,81813 2,988
112 85,2348 1,6670 0
2,431 386 504,644 88,71610,493 12,941 8,431
6,121 2,516 4,30525,044 82,353 19,800
0 0 01,856 1,667 1,650
516,697 106,478 6,360283
1,297163
P + UP P+sec/hs U.P. only UP+sec
School categoryP. only
1.2 0.7 0.0 0.3 0.05.3
Number of Clusters 39302400
% Schools with SCR > 607.3 5.7 13.7 11.1
46.9 21.2 34.3 16.9 11.1% Schools with pre-primary sections 25.3 27.7 14.3 9.4 22.2% Schools with common toilets 93.3 93.4 94.3 89.7 94.4
% Schools with girls toilets 86.2 86.9 88.6 82.3 77.8% Schools with drinking water facility 97.8 97.8 94.3 92.6 94.4
% Enrolment in Govt. schools 82.9 56.8 32.8 77.3 47.398.4 97.8 68.6 94.3 66.7
% No female teacher schools (tch>=2) 37.4 45.3 68.6 57.0 66.74.9 3.3 1.7 8.1 8.6
0.5 2.3 0.0 1.9 0.0%Enrolment in schools without blackboard 1.5 1.6 44.3 6.4 21.4
2001-02 2002-03 2003-04 2004-05 2005-06IIIIIIIVV
VIVII
Total U.P
141,660138,131132,139120,474106,913
49,475
43,980
126,913116,120107,700
90,09079,376
39,00231,982
117,433109,243
96,37283,70670,479
37,84532,835
117,87095,28891,71574,60362,110
33,14425,310
131,07999,58497,26079,917
83.8
31.4
88.9
31.3
129.4
43.3
47.6
5.734.3
68,25667,79963,41758,18251,52822,97220,68317,301
370,138
198268331279266103
9370
1,608
131175222152157
715157
1,016
10,422
classrooms
619222
2,740130
65.370.173.467.357.7
29.328.6
5.4
24.327.826.2
1.32.34.9
16.2
23158
1,23333
4,143 2,905 19 1 4 28 20125 1 0 0 6 5
33 1 0 0 1 0719 7 0 2 6 22
16 0 0 0 1 0
597 760 1,394 1,199 839 16 838 14 85 156 100 0 0 35
4 3 18 24 34 0 0 25203 202 480 660 430 4 0 104
6 4 14 15 18 0 0 2
472 210 649 956 365 1 5 0
3420276
941617
49
15213
46310
1581 8 1544 1102 2 919 435 28 130130
117
182
7030
0000
5422
2347
182
611
40
191
1080
Terminalgrade Passed
VIII boysV girlsV boys
VIII girls
196 with >60%
8.97657446115
210461
5.97.9
11.60.0
11.915.7
0.020.840.0
605507Hindi Others Urdu Gujarati Sanskrit
229469109
1069473347
6918285
01605
176
2238929
000
144600
2450
131600
2600
% Schools recvd.
46.320.417.129.022.2
48.824.820.032.211.1
145345113
88585410
108250
93600
158371450
79929392
154930
67820
2.63.33.32.83.4
1.81.71.51.4
1.00.91.0
2.01.7
61.8
0.94
2005-062004-052003-04
UTTAR PRADESH
11.3
Upper PrimaryPrimary
Sex ratio Sex ratio 0-6
23 238
VIII37.1
Enrolment of children
VIII 21,463 26,580 28,600 37,624Total Pr. 441,586 477,233 520,199 639,317
1 - 5 6 - 8
1,683 42131 30
0 0
55 60
%Teachers recvd.in-service training
Total schools* Rural schools* Total enrolment* Rural enrolment* Teachers*
8.9 31.3
100.0
29.8
79.8 83.3
21.8 24.1% SC enrolment% SC girls to SC enrolment% ST enrolment
48.2 45.8
47.9 50.0
36.5
48.1
32.9
45.0
Position of teachers by educational qualification (other than para teacher)
(Previous academic year)Incentives : Number of beneficiaries
% ST girls to ST enrolment
% Girls
Number of villages
% 0 - 6 population
% SC population % ST population
% Urban population
% Schools with blackboard
% Enrolment in single-teacher schools
% Enrolment in schools without building
Primary Upperprimary
OBC EnrolmentPrimary U. Primary
% OBCEnrolment% OBC girls toOBC Enrolment
Pupil-teacher ratio (PTR)Student-classroom ratio (SCR)% Schools with <= 50 students% Schools with PTR > 100% Female teachers
% Schools established since 1995
Regular teachers Para-teachers
% minorrepairs
% majorrepairs
# = not applicable na = not available * Some totals may not match due to no response in classificatory data items
36.1 61.84179
48.38160
2.730.635.032.6
45.95539
10.918.235.748.2
47.25240
13.315.222.152.6
41.25827
11.116.716.433.3
26.6 31.9 na 48.3 34.6
93686411.919.7
Category
PrivateGovt.PrivateGovtPrivateGovt.PrivateGovt.PrivateGovt.
Total population (in 000's)
Number of blocks/taluks
District
Decadal growth rate
Primary onlyPrimary with upper primaryPrimary with upper primary & sec/higher sec.Upper primary onlyUpper primary with sec./higher secondary
% Single classroom schools% Single teacher schools
P + UP P+sec/hs U.P. only UP+secP. only
No response in school category
Primary with upper primaryPrimary with U.P. & sec/higherUpper primary onlyUpper primary with sec./higher sec
Primary only
Primary onlyPrimary with upper primaryPrimary with Upper primary & sec/higherUpper primary only
Para-teachers
School category
Upper primary with sec./higher secondary
Primary onlyPrimary with upper prim.
P. onlyP + UPP+sec/hsU.P. onlyUP+sec
NER(U.Prim)GER(U.Prim)NER (Primary)GER (Primary)
Transition ratePrim. to U. Prim
SC/ST Enrolment
Indicators
Classrooms/Other rooms
Prim.with U.P.&Sec/H.SUpper Primary onlyU. Primary with Sec./H.S.
Basic Data, 2001
Data reported from
Performance indicators
96.0 30.495.0 30.496.6 32.095.5 32.7
Utt
ar P
rad
esh

569
Elementary Education: Report Card - SONBHADRA
Utt
ar P
rad
esh
26.5 26.4
Key data: Elementary Education
1464
SONBHADRA
(Previous academic year)
(Previous year)
Gender and caste distribution of teachers*
No. of schools by type of building*
BoysWith disability
Flow rates
Primary Level
Enrolment*
Number of schools
Grade
GER / NER
School category
Primary Upper primaryBoys Boys GirlsGirls
IncentiveType
School categoryMultiple
TypeKuccha
PartiallyPucca
PuccaTotal % good condition
Otherrooms
TentNo
Building
Classrooms
Belowsecondary
Highersecondary
Postgraduate
M. Phil.GraduateSecondarySchool category OthersNo
response
ST teachers
Total Male Female No res Male Female No res Male Female Male FemaleSC teachers
Text booksUniformAttendanceStationery
% Passed
Avg. No. of Tchs.
%
Female literacyOverall literacy
dev. grant grantSchool T L M
Male Female
IVV
IIIIII
Grade R.R. D.O.R. P.R.
VIIVI
# #
I - V
Enrolment by medium of instructions
Examination results
Retention rate
GPI
Primary cycle U. primary cycleState
DISTRICT ELEMENTARY EDUCATION REPORT CARD : 2005-06
GirlsGrade
IIIIIIIVVVI
VIII
AllGirls
Total
VII
% TotalGrossness
School category
54
3057
14 52 4
4911
3057
0 0 0
1,104 13914 2,222
2 1,74149 35,04811 2,458
0 0
1,104 139 197,823 32,3864,405 2,222 4,4051,861 1,741 1,861
12,809 35,048 12,809
0 0 03,571 2,458 3,571
197,823 32,386 2,63734
667103
P + UP P+sec/hs U.P. only UP+sec
School categoryP. only
0.2 0.0 0.0 0.0 0.012.0
Number of Clusters 16401000
% Schools with SCR > 600.0 0.0 41.8 0.0
37.2 15.8 33.3 7.9 5.6% Schools with pre-primary sections 21.4 0.0 0.0 0.0 0.0% Schools with common toilets 97.0 89.5 100.0 97.7 100.0
% Schools with girls toilets 78.0 94.7 83.3 87.9 94.4% Schools with drinking water facility 99.4 100.0 100.0 98.3 100.0
% Enrolment in Govt. schools 85.9 33.5 48.3 73.2 40.8100.0 100.0 100.0 100.0 100.0
% No female teacher schools (tch>=2) 35.6 15.8 0.0 31.4 66.78.6 0.0 0.0 25.3 0.0
0.0 0.0 0.0 0.0 0.0%Enrolment in schools without blackboard 0.0 0.0 0.0 0.0 0.0
2001-02 2002-03 2003-04 2004-05 2005-06IIIIIIIVV
VIVII
Total U.P
51,25453,66648,61847,13935,86822,513
19,338
52,60447,30448,32335,33830,099
18,49214,022
48,77350,02637,58931,28928,047
14,08211,540
53,91938,23134,01130,01625,368
13,57010,842
41,16235,06732,88227,21523,161
10,9789,839
57,77944,14135,06734,43528,956
83.4
27.5
87.9
33.4
118.4
47.2
44.1
0.033.3
24,23125,13122,15721,85015,278
9,4277,9136,380
132,367
190210181193134
565244
1,060
120148111127
89273115
668
4,519
classrooms
16880
1,614275
64.392.372.578.396.0
26.27.7
9.6
27.516.8
4.0
0.00.05.00.0
3941
43999
976 1,180 31 16 0 15 116 1 0 0 2 0
6 0 0 0 0 0338 9 1 0 6 0
17 0 0 0 1 0
63 196 443 757 453 1 09 2 12 56 47 0 0 00 0 2 20 30 0 0 16 4 242 275 252 5 2 00 0 12 19 58 2 0 1
5 14 544 654 184 0 0 0
12937335
57684
5318
2108
622 0 883 506 0 470 138 173 570000
7050
4030
0000
45
7110
61
261
63
140
1040
Terminalgrade Passed
VIII boysV girlsV boys
VIII girls
2 with >60%
36.83304137
53794
92
0.00.0
46.50.0
37.11.80.0
46.90.0
229772Hindi Others
66273602
476116029
000
530
% Schools recvd.
82.70.00.0
69.80.0
82.40.00.0
68.10.0
80650404
67909420
1092580
1229081
78325156
6018216
111014
81154
2.77.28.82.25.1
3.11.81.81.5
1.21.21.6
2.02.1
85.7
74.1
0.85
2005-062004-052003-04
UTTAR PRADESH
34.0
Upper PrimaryPrimary
Sex ratio Sex ratio 0-6
8 66
VIII0.0
Enrolment of children
8,139VIII 10,023 9,445 11,627 15,928Total Pr. 159,487 181,545 195,724 213,668 236,545
1 - 5 6 - 8
574 22035 57
0 0
33 20
%Teachers recvd.in-service training
Total schools* Rural schools* Total enrolment* Rural enrolment* Teachers*
3.8 15.2
100.0
40.0
91.0 86.5
47.5 31.3% SC enrolment% SC girls to SC enrolment% ST enrolment
46.4 40.020.642.3 30.6
38.8
46.9
38.8
42.6
Position of teachers by educational qualification (other than para teacher)
(Previous academic year)Incentives : Number of beneficiaries
% ST girls to ST enrolment
% Girls
Number of villages
% 0 - 6 population
% SC population % ST population
% Urban population
% Schools with blackboard
% Enrolment in single-teacher schools
% Enrolment in schools without building
Primary Upperprimary
OBC EnrolmentPrimary U. Primary
% OBCEnrolment% OBC girls toOBC Enrolment
Pupil-teacher ratio (PTR)Student-classroom ratio (SCR)% Schools with <= 50 students% Schools with PTR > 100% Female teachers
% Schools established since 1995
Regular teachers Para-teachers
% minorrepairs
% majorrepairs
# = not applicable na = not available * Some totals may not match due to no response in classificatory data items
1.8 96.5
23.9 74.12.1 95.8
4568
46.07051
2.423.234.138.5
42.24839
0.00.0
41.631.6
41.36030
29.117.526.864.7
38.26622
0.016.7
8.70.0
36.1 41.9 na 49.2 33.7
95689818.820.7
Category
PrivateGovt.PrivateGovtPrivateGovt.PrivateGovt.PrivateGovt.
Total population (in 000's)
Number of blocks/taluks
District
Decadal growth rate
Primary onlyPrimary with upper primaryPrimary with upper primary & sec/higher sec.Upper primary onlyUpper primary with sec./higher secondary
% Single classroom schools% Single teacher schools
P + UP P+sec/hs U.P. only UP+secP. only
No response in school category
Primary with upper primaryPrimary with U.P. & sec/higherUpper primary onlyUpper primary with sec./higher sec
Primary only
Primary onlyPrimary with upper primaryPrimary with Upper primary & sec/higherUpper primary only
Para-teachers
School category
Upper primary with sec./higher secondary
Primary onlyPrimary with upper prim.
P. onlyP + UPP+sec/hsU.P. onlyUP+sec
NER(U.Prim)GER(U.Prim)NER (Primary)GER (Primary)
Transition ratePrim. to U. Prim
13.4
SC/ST Enrolment
Indicators
Classrooms/Other rooms
Prim.with U.P.&Sec/H.SUpper Primary onlyU. Primary with Sec./H.S.
Basic Data, 2001
Data reported from
Performance indicators
99.3 39.899.4 37.997.2 35.198.0 38.2