SARC 2014-15 SCHOOL ACCOUNTABILITY REPORT CARD PUBLISHED DURING 2015-16 Ashley Falls Elementary Address: Principal: Phone: Email: Web Site: CDS Code: 13030 Ashley Falls Dr. San Diego, CA 92130-3717 Ms. Abby Farricker, Principal (858) 259-7812 [email protected]www.dmusd.org/af 37680566115620 Del Mar Union Elementary Superintendent: Phone: Email: Holly McClurg (858) 755-9301 [email protected]Web Site: www.dmusd.org
By February 1 of each year, every school in California is required by state law to publish a School Accountability Report Card (SARC). The SARC contains information about the condition and performance of each California public school. Under the Local Control Funding Formula (LCFF) all local educational agencies (LEAs) are required to prepare a Local Control Accountability Plan (LCAP), which describes how they intend to meet annual school-specific goals for all pupils, with specific activities to address state and local priorities. Additionally, data reported in an LCAP is to be consistent with data reported in the SARC.
For more information about SARC requirements, see the California Department of Education (CDE) SARC Web page athttp://www.cde.ca.gov/ta/ac/sa/.
For more information about the LCFF or LCAP, see the CDE LCFF Web page at http://www.cde.ca.gov/fg/aa/lc/.
For additional information about the school, parents and community members should contact the school principal or the district office.
DataQuest
DataQuest is an online data tool located on the CDE DataQuest Web page at http://dq.cde.ca.gov/dataquest/ that contains additional information about this school and comparisons of the school to the district, the county, and the state. Specifically, DataQuest is a dynamic system that provides reports for accountability (e.g., state Academic Performance Index [API], federal Adequate Yearly Progress [AYP]), test data, enrollment, high school graduates, dropouts, course enrollments, staffing, and data regarding English learners.
Internet Access
Internet access is available at public libraries and other locations that are publicly accessible (e.g., the California State Library). Access to the Internet at libraries and public locations is generally provided on a first-come, first-served basis. Other use restrictions may include the hours of operation, the length of time that a workstation may be used (depending on availability), the types of software programs available on a workstation, and the ability to print documents.
Ashley Falls Elementary 2015-2016 School Accountability Report Card
1/13/2016 Powered by SchoolCity, Inc. Page 2 of 24
School Description and Mission Statement – Most Recent Year
Ashley Falls Elementary opened its doors for students in August 1997. The beautiful campus is located amidst expansive new home development and is adjacent to a community park. The student and staff population has now stabilized after several years of growth in the area and subsequent boundary changes, staffing shifts, and administrative changes. The student population of 419 represents eight different ethnic groups and 10 different languages. The culturally and linguistically diverse setting yields exemplary students who feel welcome and valued.
The Ashley Falls community of educators is united in its purpose of meeting the needs of every child, every day. The majority of Ashley Falls students enter school ready to learn and prepared for academic rigor, and the entire staff demonstrates a strong commitment to academic excellence. Student success is ensured through rigorous academic standards, standards-based curriculum, and highly effective professional learning communities. The continuous improvement in student performance is the result of ongoing professional development and high-quality instruction.
The Ashley Falls’ Soaring to Success theme represents much more than academic proficiency. The entire school community is also committed to providing an enriched, balanced educational experience for our students. While our efforts are focused on preparing students in reading, writing, and mathematics, opportunities for student learning extend beyond the basics. Students also participate in STEAM+ education through specialized classes in science, technology, art, music, and physical education; as well as engineering woven throughout their classroom instruction. These weekly opportunities provide students with the chance to discover and develop strengths and talents in many areas.
The Ashley Falls community is highly involved in the direction of the school. Expectations for success are clearly established in the school setting and supported by parents. Parent involvement is present daily in classrooms and through work on site leadership committees, financial support of the Del Mar Schools Education Foundation, and participation in many events and activities.
Ashley Falls is a dynamic, fun, student-centered school. Staff, students, parents, and community members are committed toexcellence and work to ensure a setting where students will thrive and develop socially, emotionally, and academically.
Major Achievements – Most Recent Year
Our multifaceted program provides opportunities for students to experience art, music, technology, science, and physical education as extensions of the classroom. In addition to the STEAM+ classes, students have the opportunity to participate in a variety of lunch clubs including math club, running club, zoo crew, guitar club, open mic, junior librarians, board game club, and many more. Students also participate in academic competitions such as Continental Math League, Science Field Day, WordMasters Analogy Competition, Math 24 Challenge, and the National Geographic Geo Bee. Several students are successful locally and continue on to participate in state or regional competitions.
We are particularly proud of our ability to develop unique programs to address current educational issues in order to provide students with the skills needed to become productive citizens in today’s rapidly changing society. Our focus on developing and maintaining effective professional learning communities is the vehicle by which collaboration occurs and data-based program decisions are made.
A school-wide commitment to understanding and implementing the teaching methodology of Cognitively Guided Instruction (CGI) led to an increased focus on math problem solving. This, in turn, has increased the school’s focus on conceptual understanding of mathematics, and enhanced our knowledge and competency in the implementation of Common Core State Standards. With many of our teachers completing their fourth year of CGI training, Ashley Falls has been a leader in math instructional innovation and improvement.
In spring of 2008, Ashley Falls was recognized by the state of California as a California Distinguished School. The application was awarded a perfect score (8) and was the result of a team that included school staff and parents.
Ashley Falls Elementary 2015-2016 School Accountability Report Card
1/13/2016 Powered by SchoolCity, Inc. Page 3 of 24
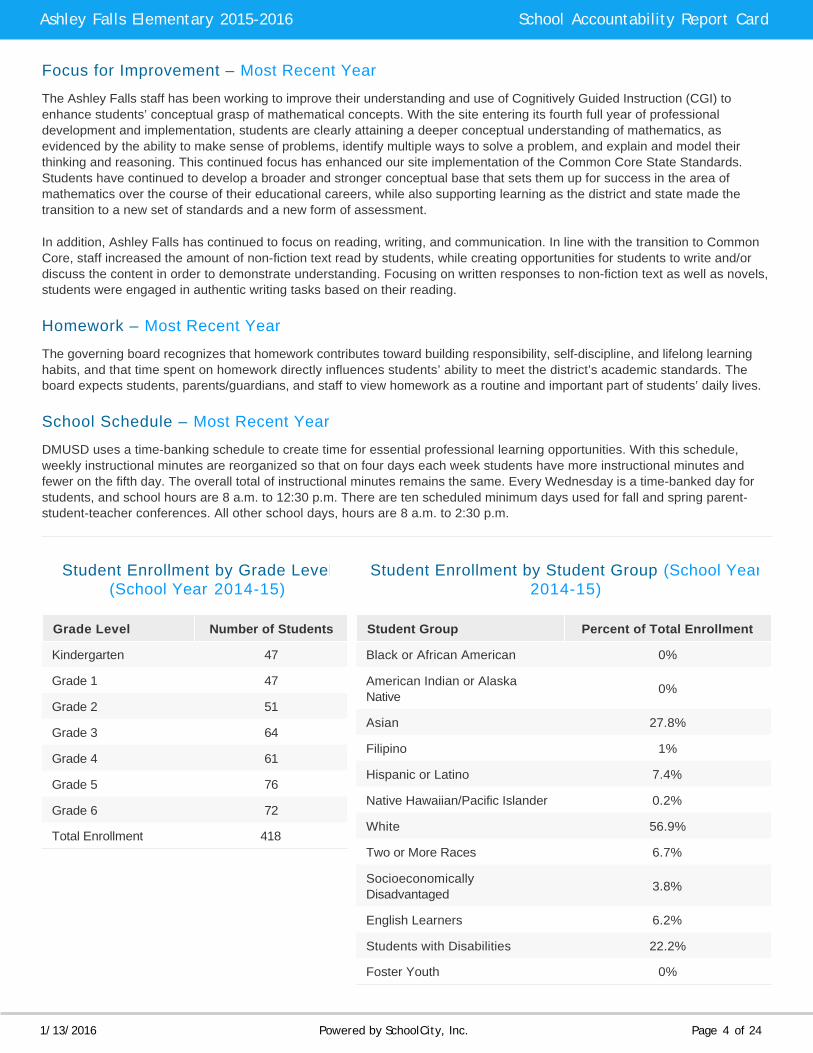
Student Enrollment by Grade Level(School Year 2014-15)
Grade Level Number of Students
Kindergarten 47
Grade 1 47
Grade 2 51
Grade 3 64
Grade 4 61
Grade 5 76
Grade 6 72
Total Enrollment 418
Student Enrollment by Student Group (School Year2014-15)
Student Group Percent of Total Enrollment
Black or African American 0%
American Indian or AlaskaNative 0%
Asian 27.8%
Filipino 1%
Hispanic or Latino 7.4%
Native Hawaiian/Pacific Islander 0.2%
White 56.9%
Two or More Races 6.7%
SocioeconomicallyDisadvantaged 3.8%
English Learners 6.2%
Students with Disabilities 22.2%
Foster Youth 0%
Focus for Improvement – Most Recent Year
The Ashley Falls staff has been working to improve their understanding and use of Cognitively Guided Instruction (CGI) to enhance students’ conceptual grasp of mathematical concepts. With the site entering its fourth full year of professional development and implementation, students are clearly attaining a deeper conceptual understanding of mathematics, as evidenced by the ability to make sense of problems, identify multiple ways to solve a problem, and explain and model their thinking and reasoning. This continued focus has enhanced our site implementation of the Common Core State Standards. Students have continued to develop a broader and stronger conceptual base that sets them up for success in the area of mathematics over the course of their educational careers, while also supporting learning as the district and state made the transition to a new set of standards and a new form of assessment.
In addition, Ashley Falls has continued to focus on reading, writing, and communication. In line with the transition to Common Core, staff increased the amount of non-fiction text read by students, while creating opportunities for students to write and/or discuss the content in order to demonstrate understanding. Focusing on written responses to non-fiction text as well as novels, students were engaged in authentic writing tasks based on their reading.
Homework – Most Recent Year
The governing board recognizes that homework contributes toward building responsibility, self-discipline, and lifelong learning habits, and that time spent on homework directly influences students’ ability to meet the district’s academic standards. The board expects students, parents/guardians, and staff to view homework as a routine and important part of students’ daily lives.
School Schedule – Most Recent Year
DMUSD uses a time-banking schedule to create time for essential professional learning opportunities. With this schedule, weekly instructional minutes are reorganized so that on four days each week students have more instructional minutes and fewer on the fifth day. The overall total of instructional minutes remains the same. Every Wednesday is a time-banked day for students, and school hours are 8 a.m. to 12:30 p.m. There are ten scheduled minimum days used for fall and spring parent-student-teacher conferences. All other school days, hours are 8 a.m. to 2:30 p.m.
Ashley Falls Elementary 2015-2016 School Accountability Report Card
1/13/2016 Powered by SchoolCity, Inc. Page 4 of 24
A. CONDITIONS OF LEARNING
STATE PRIORITY: BASIC
The SARC provides the following information relevant to the State priority: Basic (Priority 1):
Degree to which teachers are appropriately assigned and fully credentialed in the subject area and for the pupils they are teaching;
Pupils have access to standards-aligned instructional materials; and
School facilities are maintained in good repair.
Teacher Credentials
Teachers School2013-14
School 2014-15
School2015-16
District2015-16
With Full Credential 23 25 26 241
Without Full Credential 0 0 0 0
Teaching Outside Subject Area of Competence (with full credential) 0 0 0 0
Teacher Misassignments and Vacant Teacher Positions
Indicator 2013-14 2014-15 2015-16
Misassignments of Teachers of English Learners 0 0 0
Total Teacher Misassignments* 0 0 0
Vacant Teacher Positions 0 0 0
Leadership – Most Recent Year
The quality of instruction and leadership at Ashley Falls School is excellent due to the cooperative efforts of the entire staff. Our principal has thirteen years of educational experience. 2015-2016 was her first year as principal of Ashley Falls and her second year as a school administrator. Before becoming an administrator, she was a teacher for ten years and an instructional aide.
Shared decision-making takes place through the work of several site leadership teams. The School Site Council consists of staff and parents and meets at least four times each year. It establishes the budget in accordance with the Single Plan for Student Achievement and approves expenditures. Site staff leadership teams meet every month to make decisions regarding school issues. This group acts as a liaison between administration and grade level teams.
NOTE: “Misassignments” refers to the number of positions filled by teachers who lack legal authorization to teach that grade level, subject area, student group, etc.
* Total Teacher Misassignments includes the number of Misassignments of Teachers of English Learners.
Ashley Falls Elementary 2015-2016 School Accountability Report Card
1/13/2016 Powered by SchoolCity, Inc. Page 5 of 24
Core Academic Classes Taught by Highly Qualified Teachers (School Year 2014-15)
Location of Classes
Percent of Classes In Core Academic Subjects
Taught by Highly Qualified Teachers
Percent of Classes In Core Academic Subjects Not
Taught by Highly Qualified Teachers
This School 100% 0%
All Schools in District 100% 0%
High-Poverty Schools in District 0% 0%
Low-Poverty Schools in District 100% 0%
Quality, Currency, Availability of Textbooks and Instructional Materials – Most Recent Year
This section describes whether the textbooks and instructional materials used at the school are from the most recent adoption; whether there are sufficient textbooks and instruction materials for each student; and information about the school's use of any supplemental curriculum or non-adopted textbooks or instructional materials.
Month and year in which data were collected: January 2016
Subject Textbooks and instructional materials/year of adoption
From most
recent adoption
?
Percent students
lacking own assigned copy
Reading/Language Arts Houghton Mifflin Reading/Language Arts 2003 Yes 0%
Mathematics Macmillan/McGraw-Hill California Mathematics 2008 Yes 0%
History-Social Science Harcourt Brace Social Studies 2000 Yes 0%
Foreign Language N/A N/A 0%
Health Macmillan/McGraw-Hill Health & Wellness, 2005 Yes 0%
Visual and Performing Arts McGraw-Hill Share the Music, 2005 site-based Yes 0%
Science Laboratory Equipment (grades 9-12)
N/A N/A 0%
NOTE: High-poverty schools are defined as those schools with student eligibility of approximately 40 percent or more in the free and reduced price meals program. Low-poverty schools are those with student eligibility of approximately 39 percent or less in the free and reduced price meals program.
Ashley Falls Elementary 2015-2016 School Accountability Report Card
1/13/2016 Powered by SchoolCity, Inc. Page 6 of 24
GATE – Most Recent Year
DMUSD's educational program is a child-centered program based on the unique needs of each student. To ensure that the needs of our students are met, a goal of the DMUSD program is to provide meaningful, rigorous learning opportunities commensurate with the qualities and potential of each student. We know that all high-achieving students need an experience that challenges them and takes into consideration individual learning styles and special abilities. We do not formally identify and potentially limit students based on aptitude test scores; instead, we are committed to providing differentiated learning experiences for all high-achieving students enabling them to reach their potential. Those experiences include, but are not limited to, curriculum compacting, tiered assignments, high-level questioning, and flexible skills grouping.
Special Education – Most Recent Year
The district is proactive in evaluating students and providing a full range of special education services. Approximately ten percent of our district’s students receive special education services. Students are in Special Day Classes, mainstreamed (placed) into the regular classroom with support, and/or meet individually or in small groups during the school day with site resource teachers.
English Learners – Most Recent Year
Students who are English Learners are provided with learning activities consistent with local, state, and federal mandates. All teachers at this school are Cross-cultural Language and Academic Development (CLAD) certified. English language acquisition of all English Learners is continually assessed and monitored by the classroom teacher and supporting staff.
School Facility Conditions and Planned Improvements – Most Recent Year
Our school was designed to create an optimal learning environment that accommodates the educational needs of all our students. Daytime and evening custodians clean the school according to an established cleaning schedule. District personnel provide maintenance and landscaping upkeep. Maintenance of school rest room facilities for students and staff are a high priority for the maintenance and custodial staff. The goal is to keep all facilities in 100 percent working order. The school custodial staff works cooperatively with the district maintenance staff to ensure timely handling of needed facility repairs and immediate response to safety or health needs that arise.
Ashley Falls Elementary 2015-2016 School Accountability Report Card
1/13/2016 Powered by SchoolCity, Inc. Page 7 of 24
School Facility Good Repair Status – Most Recent Year
Using the most recent FIT data (or equivalent), provide the following:
Determination of repair status for systems listed
Description of any needed maintenance to ensure good repair
The year and month in which the data were collected
The Overall Rating
Month and year in which data were collected: October 2015
Repair Needed and Action Taken or PlannedSystem Inspected
Month and year in which data were collected: October 2015
Exemplary Good Fair Poor
Overall Rating ✓ - - -
Library – Most Recent Year
Our school library is accessible to all students. Each class visits the library on a regular basis. Students share literature and receive instruction in library skills, including research skills, to reinforce classroom learning.
Computers – Most Recent Year
Ashley Falls has a Technology Lab which all students visit at least once a week and work with our Technology Specialist. Inaddition, K-3 students have access to iPads and desktop computers in their classrooms. Students in grades 4, 5, and 6 all have access to their own Chromebook and a Google Drive account. Chromebooks are used with the primary purpose of enhancing and extending our writing curriculum in all three genres and across all curricular areas. Students also learn to synthesize and evaluate digital resources, as well as, how to show their understanding of standards through technology.
Ashley Falls Elementary 2015-2016 School Accountability Report Card
1/13/2016 Powered by SchoolCity, Inc. Page 8 of 24
B. PUPIL OUTCOMES
STATE PRIORITY: PUPIL ACHIEVEMENT
The SARC provides the following information relevant to the State priority: Pupil Achievement (Priority 4):
Statewide assessments (i.e., California Assessment of Student Performance and Progress [CAASPP], ScienceCalifornia Standards Tests); and
The percentage of pupils who have successfully completed courses that satisfy the requirements for entrance to theUniversity of California and the California State University, or career technical education sequences or programs of study.
California Assessment of Student Performance and Progress Results for All Students –(School Year 2014–15)
Percent of Students Meeting or Exceeding the State StandardsSubject
School District State
English Language Arts/ Literacy (grades 3-8 and 11) 81% 87% 44%
Mathematics (grades 3-8 and 11) 79% 84% 33%
NOTE: Scores are not shown when the number of students tested is ten or less, either because the number of students inthis category is too small for statistical accuracy or to protect student privacy.
Ashley Falls Elementary 2015-2016 School Accountability Report Card
1/13/2016 Powered by SchoolCity, Inc. Page 9 of 24
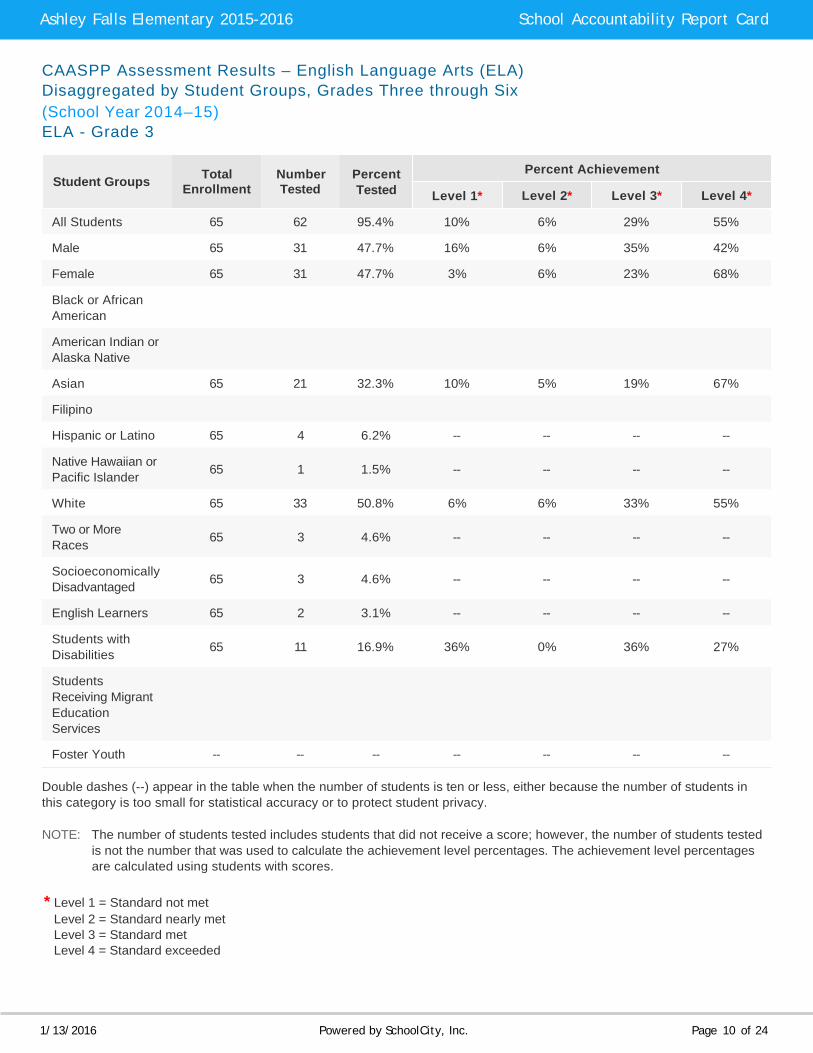
CAASPP Assessment Results – English Language Arts (ELA) Disaggregated by Student Groups, Grades Three through Six (School Year 2014–15) ELA - Grade 3
Students with Disabilities 65 11 16.9% 36% 0% 36% 27%
Students Receiving Migrant Education Services
Foster Youth -- -- -- -- -- -- --
Double dashes (--) appear in the table when the number of students is ten or less, either because the number of students in this category is too small for statistical accuracy or to protect student privacy.
NOTE: The number of students tested includes students that did not receive a score; however, the number of students tested is not the number that was used to calculate the achievement level percentages. The achievement level percentages are calculated using students with scores.
* Level 1 = Standard not met Level 2 = Standard nearly met Level 3 = Standard met Level 4 = Standard exceeded
Ashley Falls Elementary 2015-2016 School Accountability Report Card
1/13/2016 Powered by SchoolCity, Inc. Page 10 of 24
Students with Disabilities 63 18 28.6% 33% 17% 17% 33%
Students Receiving Migrant Education Services
Foster Youth -- -- -- -- -- -- --
Double dashes (--) appear in the table when the number of students is ten or less, either because the number of students in this category is too small for statistical accuracy or to protect student privacy.
NOTE: The number of students tested includes students that did not receive a score; however, the number of students tested is not the number that was used to calculate the achievement level percentages. The achievement level percentages are calculated using students with scores.
* Level 1 = Standard not met Level 2 = Standard nearly met Level 3 = Standard met Level 4 = Standard exceeded
Ashley Falls Elementary 2015-2016 School Accountability Report Card
1/13/2016 Powered by SchoolCity, Inc. Page 11 of 24
Students with Disabilities 79 20 25.3% 30% 15% 30% 25%
Students Receiving Migrant Education Services
Foster Youth -- -- -- -- -- -- --
Double dashes (--) appear in the table when the number of students is ten or less, either because the number of students in this category is too small for statistical accuracy or to protect student privacy.
NOTE: The number of students tested includes students that did not receive a score; however, the number of students tested is not the number that was used to calculate the achievement level percentages. The achievement level percentages are calculated using students with scores.
* Level 1 = Standard not met Level 2 = Standard nearly met Level 3 = Standard met Level 4 = Standard exceeded
Ashley Falls Elementary 2015-2016 School Accountability Report Card
1/13/2016 Powered by SchoolCity, Inc. Page 12 of 24
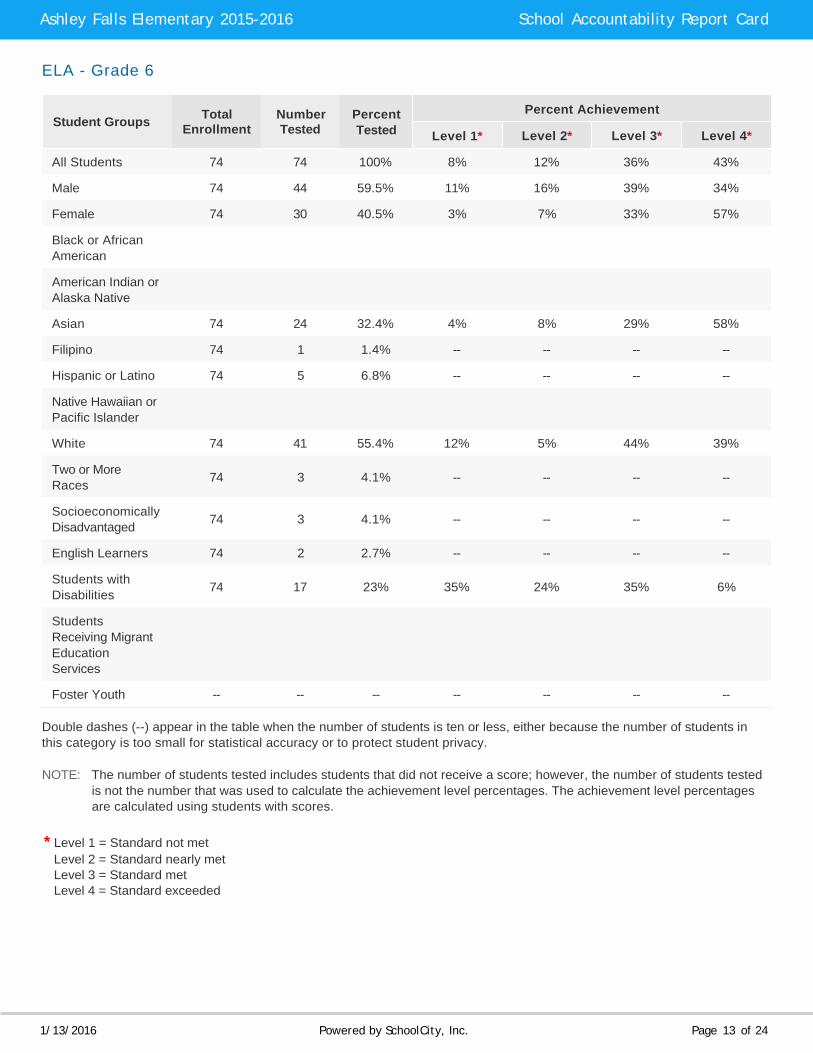
Students with Disabilities 74 17 23% 35% 24% 35% 6%
Students Receiving Migrant Education Services
Foster Youth -- -- -- -- -- -- --
Double dashes (--) appear in the table when the number of students is ten or less, either because the number of students in this category is too small for statistical accuracy or to protect student privacy.
NOTE: The number of students tested includes students that did not receive a score; however, the number of students tested is not the number that was used to calculate the achievement level percentages. The achievement level percentages are calculated using students with scores.
* Level 1 = Standard not met Level 2 = Standard nearly met Level 3 = Standard met Level 4 = Standard exceeded
Ashley Falls Elementary 2015-2016 School Accountability Report Card
1/13/2016 Powered by SchoolCity, Inc. Page 13 of 24
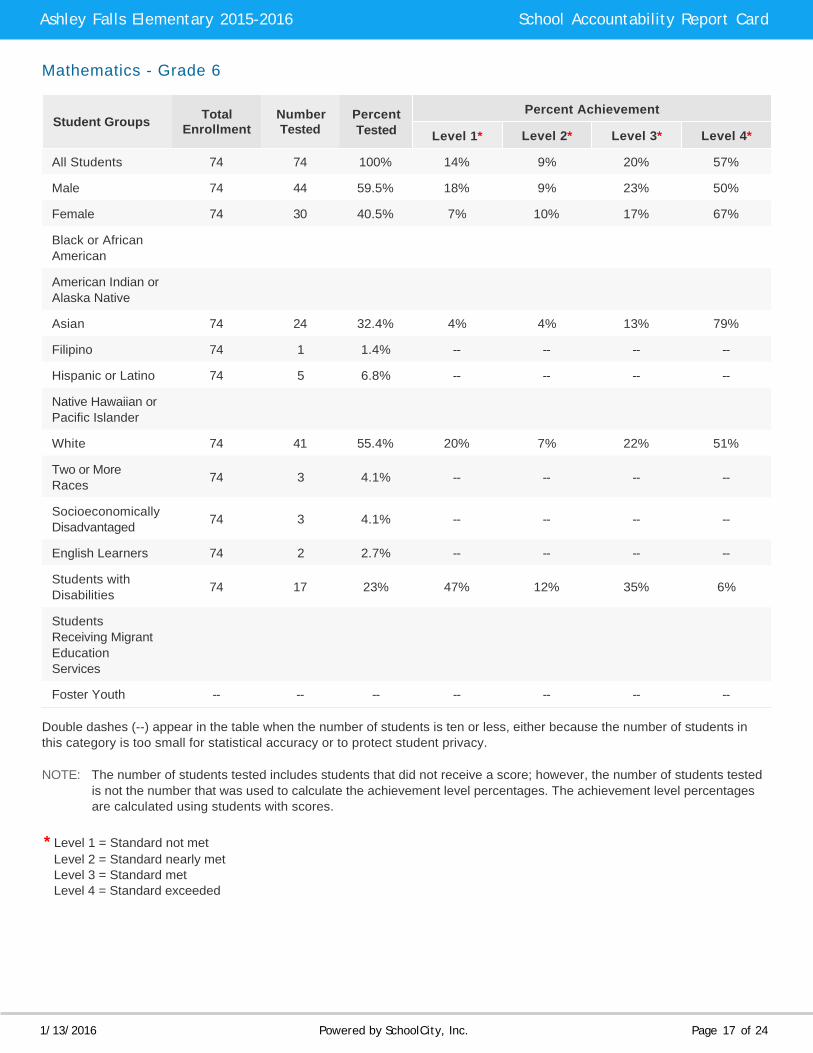
CAASPP Assessment Results –Mathematics Disaggregated by Student Groups, Grades Three through Six (School Year 2014–15) Mathematics - Grade 3
Students with Disabilities 65 11 16.9% 18% 18% 18% 45%
Students Receiving Migrant Education Services
Foster Youth -- -- -- -- -- -- --
Double dashes (--) appear in the table when the number of students is ten or less, either because the number of students in this category is too small for statistical accuracy or to protect student privacy.
NOTE: The number of students tested includes students that did not receive a score; however, the number of students tested is not the number that was used to calculate the achievement level percentages. The achievement level percentages are calculated using students with scores.
* Level 1 = Standard not met Level 2 = Standard nearly met Level 3 = Standard met Level 4 = Standard exceeded
Ashley Falls Elementary 2015-2016 School Accountability Report Card
1/13/2016 Powered by SchoolCity, Inc. Page 14 of 24
Students with Disabilities 63 18 28.6% 22% 11% 22% 44%
Students Receiving Migrant Education Services
Foster Youth -- -- -- -- -- -- --
Double dashes (--) appear in the table when the number of students is ten or less, either because the number of students in this category is too small for statistical accuracy or to protect student privacy.
NOTE: The number of students tested includes students that did not receive a score; however, the number of students tested is not the number that was used to calculate the achievement level percentages. The achievement level percentages are calculated using students with scores.
* Level 1 = Standard not met Level 2 = Standard nearly met Level 3 = Standard met Level 4 = Standard exceeded
Ashley Falls Elementary 2015-2016 School Accountability Report Card
1/13/2016 Powered by SchoolCity, Inc. Page 15 of 24
Students with Disabilities 79 20 25.3% 30% 30% 15% 25%
Students Receiving Migrant Education Services
Foster Youth -- -- -- -- -- -- --
Double dashes (--) appear in the table when the number of students is ten or less, either because the number of students in this category is too small for statistical accuracy or to protect student privacy.
NOTE: The number of students tested includes students that did not receive a score; however, the number of students tested is not the number that was used to calculate the achievement level percentages. The achievement level percentages are calculated using students with scores.
* Level 1 = Standard not met Level 2 = Standard nearly met Level 3 = Standard met Level 4 = Standard exceeded
Ashley Falls Elementary 2015-2016 School Accountability Report Card
1/13/2016 Powered by SchoolCity, Inc. Page 16 of 24
Students with Disabilities 74 17 23% 47% 12% 35% 6%
Students Receiving Migrant Education Services
Foster Youth -- -- -- -- -- -- --
Double dashes (--) appear in the table when the number of students is ten or less, either because the number of students in this category is too small for statistical accuracy or to protect student privacy.
NOTE: The number of students tested includes students that did not receive a score; however, the number of students tested is not the number that was used to calculate the achievement level percentages. The achievement level percentages are calculated using students with scores.
* Level 1 = Standard not met Level 2 = Standard nearly met Level 3 = Standard met Level 4 = Standard exceeded
Ashley Falls Elementary 2015-2016 School Accountability Report Card
1/13/2016 Powered by SchoolCity, Inc. Page 17 of 24
Student Group
Percent of Students Scoringat Proficient or
Advanced
All Students in the LEA 94%
All Students at the School 82%
Male 88%
Female 75%
Black or African American
American Indian or Alaska Native
Asian 73%
Filipino --
Hispanic or Latino --
Student Group
Percent of Students Scoringat Proficient or
Advanced
Native Hawaiian or Pacific Islander
White 88%
Two or More Races --
SocioeconomicallyDisadvantaged --
English Learners --
Students with Disabilities 57%
Students Receiving Migrant Education Services
Foster Youth --
California Standards Tests for All Students in Science – Three-Year Comparison
Subject
Percent of Students Scoring at Proficient or Advanced (meeting or exceeding the state standards)
California Standards Tests Results by Student Group in Science (School Year 2014-15)
Other Measures of Student Achievement – Most Recent Year
The information gained from carefully monitoring student learning helps to ensure every child attending school in DMUSD is provided with high-quality instruction. As no single assessment gives the whole picture of any child, our teachers are skilled at analyzing results of a variety of assessments alongside information gained from carefully observing each student as a learner in the classroom. This information provides a comprehensive profile of each child and is used to determine the best manner to support learning. While much of the assessment used by our teachers is classroom based, the following assessments are used districtwide:
• Educational Software for Guiding Instruction (ESGI): Kindergarten• Developmental Reading Assessment (DRA): Kindergarten – Third Grade• Writing and Math Performance Tasks: Kindergarten – Sixth Grade
NOTE: Scores are not shown when the number of students tested is ten or less, either because the number of students inthis category is too small for statistical accuracy or to protect student privacy.
NOTE: Scores are not shown when the number of students tested is ten or less, either because the number of students inthis category is too small for statistical accuracy or to protect student privacy.
Ashley Falls Elementary 2015-2016 School Accountability Report Card
1/13/2016 Powered by SchoolCity, Inc. Page 18 of 24
STATE PRIORITY: OTHER PUPIL OUTCOME
The SARC provides the following information relevant to the State priority: Other Pupil Outcomes (Priority 8):
Pupil outcomes in the subject areas of English, mathematics, and physical education.
California Physical Fitness Test Results (School Year 2014-15)
Grade Level Percent of Students Meeting
Four of Six Fitness Standards
Percent of Students MeetingFive of Six
Fitness Standards
Percent of Students MeetingSix of Six
Fitness Standards
5 10.1% 24.1% 58.2%
7
9
C. ENGAGEMENT
STATE PRIORITY: PARENTAL INVOLVEMENT
The SARC provides the following information relevant to the State priority: Parental Involvement (Priority 3):
Efforts the school district makes to seek parent input in making decisions for the school district and each school site.
Opportunities for Parental Involvement - Most Recent YearWe strongly support community involvement through multiple venues. The School Site Council is an elected group of parents and staff who meet regularly to study the effectiveness of curriculum and instruction. The PTA meets monthly and provides support for many school programs and activities. Our Dad’s Club encourages and facilitates the participation of students’ fathers on campus, but welcomes any family members to events. Parents are welcome to participate in their children’s education by serving as volunteers in classrooms or for schoolwide events. For more information on additional involvement opportunities, please contact the school.
STATE PRIORITY: SCHOOL CLIMATE
The SARC provides the following information relevant to the State priority: School Climate (Priority 6):
Pupil suspension rates;
Pupil expulsion rates; and
Other local measures on the sense of safety.
NOTE: Percentages are not calculated when the number of students tested is ten or less, either because the number of students in this category is too small for statistical accuracy or to protect student privacy.
Ashley Falls Elementary 2015-2016 School Accountability Report Card
1/13/2016 Powered by SchoolCity, Inc. Page 19 of 24
A friendly, positive, and enthusiastic attitude toward people and learning is evident upon entering our school. Our discipline policy is based on the belief that the best way to eliminate behavior problems is to maintain programs that challenge students’ academic interests and emphasize the development of character and citizenship.
Classroom teachers focus on teaching students to demonstrate initiative, leadership, self-discipline, and respect. Our school participates in the PeaceBuilders program. PeaceBuilders operates on six principles, which state that as a community we will praise people, give up put-downs, seek wise people, notice hurts, right wrongs, and help others. We reward positive behavior and maintain a positive, safe, active playground environment.
We have implemented school-wide playground game rules and maintain adult supervision, including parent volunteers, during recess and lunch. Children are rewarded for good behavior with Praise Notes and Eagle Tender which can be exchanged for rewards in our “Eagle’s Nest” store. In addition, classes are recognized as PeaceBuilders of the Month and awarded for outstanding citizenship. We hold monthly assemblies to honor these classes, as well as to discuss rules and expectations and positive reinforcement measures that reinforce and refresh students’ understanding of school rules.
School Safety Plan – Most Recent Year
Our school is a modern, state-of-the-art complex with a safe, clean environment that is conducive to productive learning. A comprehensive safety plan incorporates policies and procedures for injury and illness prevention for students and staff. Site safety representatives work with the district safety committee to practice, revise, and update the safety plan as needed. We conduct regular safety inspections of all buildings. District safety plans and procedures are in place to ensure students’ safety as well as to prepare for emergencies. We conduct regularly scheduled fire and disaster drills, and each classroom is equipped with a backpack containing emergency supplies.
Our school complies with district safety and security procedures. The school custodian makes a visual inspection of the campus every morning before students arrive. Our adult crossing guards enable students to cross streets safely. Staff members supervise students 15 minutes prior to the start of school at each recess and lunch period, and for 15 minutes after school. All visitors to the campus must check in at the school office and wear a visitor badge while on campus. All school district personnel, including district office staff, wear picture identification badges for security purposes.
Ashley Falls' comprehensive school safety plan was reviewed and updated in the winter of 2014-2015. The plan was shared with, and approved by, the School Site Council on February 3, 2015. Goals in the safety plan included identification of safe rooms and planning and practicing of procedures for quick, orderly lock down from recess/free play time.
D. OTHER SARC INFORMATION
The information in this section is required to be in the SARC but is not included in the state priorities for LCFF.
Ashley Falls Elementary 2015-2016 School Accountability Report Card
1/13/2016 Powered by SchoolCity, Inc. Page 20 of 24
Adequate Yearly Progress Overall and by Criteria (School Year 2014-15)
AYP Criteria School District State
Made AYP Overall Yes Yes Yes
Met Participation Rate - English-Language Arts Yes Yes Yes
Met Participation Rate - Mathematics Yes Yes Yes
Met Percent Proficient - English-Language Arts N/A N/A N/A
Met Percent Proficient - Mathematics N/A N/A N/A
Met Attendance Rate Yes Yes Yes
Met Graduation Rate N/A N/A Yes
Federal Intervention Program (School Year 2015-16)
Indicator School District
Program Improvement Status 0 0
First Year of Program Improvement 0 0
Year in Program Improvement* 0 0
Number of Schools Currently in Program Improvement N/A 0
Percent of Schools Currently in Program Improvement N/A 0%
Average Class Size and Class Size Distribution (Elementary)
GradeLevel
Avg. ClassSize
2012-13 Number of Classes*
Avg.ClassSize
2013-14 Number of Classes*
Avg. ClassSize
2014-15 Number of Classes*
1-20 21-32 33+ 1-20 21-32 33+ 1-20 21-32 33+
K 17 1 2 17 2 1 18 1 2
1 20 2 22 2 23 2
2 18 3 22 2 24 2
3 21 3 21 1 2 21 1 2
4 28 2 24 3 25 1 2
5 27 3 20 2 1 24 3
6 26 3 23 1 3 20 1 3
Other 11 1
NOTE: Cells with NA values do not require data.
* Number of classes indicates how many classes fall into each size category (a range of total students per class).
Ashley Falls Elementary 2015-2016 School Accountability Report Card
1/13/2016 Powered by SchoolCity, Inc. Page 21 of 24
-
Average Class Size and Class Size Distribution (Secondary)—NOT APPLICABLE
Academic Counselors and Other Support Staff (School Year 2014-15)
Title Number of FTE* Assigned to School
Average Number of Studentsper
Academic Counselor
Academic Counselor 0 0
Counselor (Social/Behavioral or Career Development 0 N/A
Library Media Teacher (Librarian) 0 N/A
Library Media Services Staff (Paraprofessional) .4 N/A
Psychologist .6 N/A
Social Worker 0 N/A
Nurse .25 N/A
Speech/Language/Hearing Specialist 1.4 N/A
Resource Specialist (non - teaching) 1 N/A
Other 0 N/A
* Number of classes indicates how many classrooms fall into each size category (a range of total students per classroom). At the secondary school level, this information is reported by subject area rather than grade level.
NOTE: Cells with N/A values do not require data.
* One Full Time Equivalent (FTE) equals one staff member working full time; one FTE could also represent two staff memberswho each work 50 percent of full time.
Ashley Falls Elementary 2015-2016 School Accountability Report Card
1/13/2016 Powered by SchoolCity, Inc. Page 22 of 24
Specialized Program/Staff – Most Recent Year
The Del Mar Union School District takes an aggressive role in providing a variety of prevention and intervention programs to ensure the success of every student. These programs include crisis prevention; parent education; effective classroom instruction; and continuous training for teachers, aides, parents, and community. It provides a variety of support services, including a school psychologist who consults with school personnel concerning student welfare. The Ashley Falls Student Success Team also supports students, teachers, and families to ensure that every child is getting all the resources they need to be successful at school. A full-time registered nurse is available for students in the district, and the health office is staffed with a health technician.
Our school also supports special programs in art, physical education, library, technology, music and science through our STEAM+ program. Parent volunteers assist our teachers in providing classroom support where needed, including through our Everyone A Reader (EAR) program, which is coordinated by a paid staff member with the bulk of intervention being done by trained parent volunteers. This exemplary program was awarded the Everyone A Reader Diamond Award for its excellence thanks to our exceptional coordinator and has been expanded to support English Learners with language and vocabulary acquisition.
Expenditures Per Pupil and School Site Teacher Salaries (Fiscal Year 2013-14)
Level Total
ExpendituresPer Pupil
Expenditures Per Pupil
(Supplemental/ Restricted)
ExpendituresPer Pupil (Basic /
Unrestricted)
AverageTeacherSalary
School Site $10,123 $2,032 $8,091 $75,089
District N/A N/A $7,816 $77,305
Percent Difference – School Site and District N/A N/A 3.52% -2.87%
State N/A N/A $5,348 $69,086
Percent Difference – School Site and State N/A N/A 51.29% 8.69%
Types of Services Funded (Fiscal Year 2014-15)
Our school receives funding from the state and federal government for various programs, which are reviewed by the School Site Council. All programs support improved learning for our students through goals set in our Single Plan for Student Achievement. In addition, many local businesses support our district’s students and programs, and the Del Mar Schools Education Foundation supports STEAM+ learning, which includes content specialists in the areas of science, technology, art, music, and physical education.
NOTE: Cells with N/A values do not require data.
Ashley Falls Elementary 2015-2016 School Accountability Report Card
1/13/2016 Powered by SchoolCity, Inc. Page 23 of 24
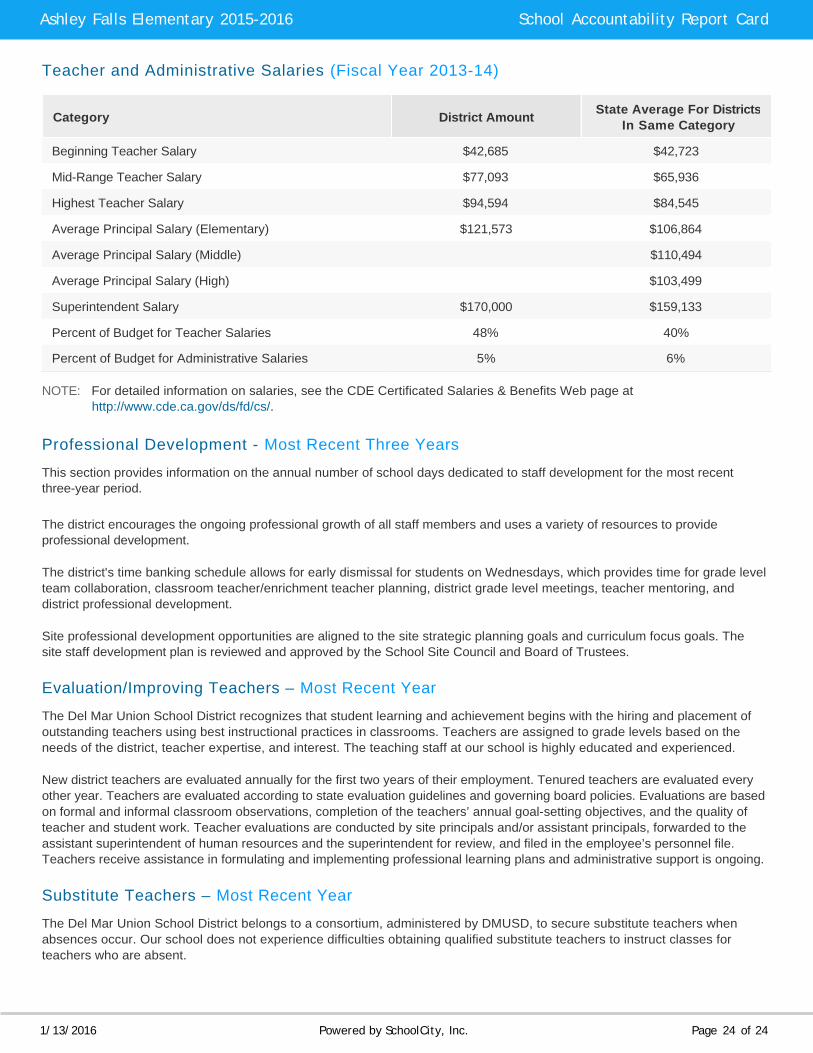
Teacher and Administrative Salaries (Fiscal Year 2013-14)
Category District AmountState Average For Districts
In Same Category
Beginning Teacher Salary $42,685 $42,723
Mid-Range Teacher Salary $77,093 $65,936
Highest Teacher Salary $94,594 $84,545
Average Principal Salary (Elementary) $121,573 $106,864
Average Principal Salary (Middle) $110,494
Average Principal Salary (High) $103,499
Superintendent Salary $170,000 $159,133
Percent of Budget for Teacher Salaries 48% 40%
Percent of Budget for Administrative Salaries 5% 6%
Professional Development - Most Recent Three Years
This section provides information on the annual number of school days dedicated to staff development for the most recent three-year period.
The district encourages the ongoing professional growth of all staff members and uses a variety of resources to provideprofessional development.
The district's time banking schedule allows for early dismissal for students on Wednesdays, which provides time for grade level team collaboration, classroom teacher/enrichment teacher planning, district grade level meetings, teacher mentoring, and district professional development.
Site professional development opportunities are aligned to the site strategic planning goals and curriculum focus goals. The site staff development plan is reviewed and approved by the School Site Council and Board of Trustees.
Evaluation/Improving Teachers – Most Recent Year
The Del Mar Union School District recognizes that student learning and achievement begins with the hiring and placement of outstanding teachers using best instructional practices in classrooms. Teachers are assigned to grade levels based on the needs of the district, teacher expertise, and interest. The teaching staff at our school is highly educated and experienced.
New district teachers are evaluated annually for the first two years of their employment. Tenured teachers are evaluated every other year. Teachers are evaluated according to state evaluation guidelines and governing board policies. Evaluations are based on formal and informal classroom observations, completion of the teachers’ annual goal-setting objectives, and the quality of teacher and student work. Teacher evaluations are conducted by site principals and/or assistant principals, forwarded to the assistant superintendent of human resources and the superintendent for review, and filed in the employee’s personnel file. Teachers receive assistance in formulating and implementing professional learning plans and administrative support is ongoing.
Substitute Teachers – Most Recent Year
The Del Mar Union School District belongs to a consortium, administered by DMUSD, to secure substitute teachers when absences occur. Our school does not experience difficulties obtaining qualified substitute teachers to instruct classes for teachers who are absent.
NOTE: For detailed information on salaries, see the CDE Certificated Salaries & Benefits Web page at http://www.cde.ca.gov/ds/fd/cs/.
Ashley Falls Elementary 2015-2016 School Accountability Report Card
1/13/2016 Powered by SchoolCity, Inc. Page 24 of 24