BASIN ORIENTED STRATEGIES FOR CO 2 ENHANCED OIL RECOVERY: CALIFORNIA April 2005 Prepared for U.S. Department of Energy Office of Fossil Energy – Office of Oil and Natural Gas Prepared by Advanced Resources International
Transcript
BASIN ORIENTED STRATEGIES FOR CO2
ENHANCED OIL RECOVERY:
CALIFORNIA
April 2005
Prepared for
U.S. Department of Energy
Office of Fossil Energy – Office of Oil and Natural Gas
Prepared by
Advanced Resources International
Disclaimer This report was prepared as an account of work sponsored by an agency of the United States Government. Neither the United States nor the United States Department of Energy, nor any of their employees, makes any warranty, express or implied, or assumes any legal liability or responsibility of the accuracy, completeness, or usefulness of any information, apparatus, product, or process disclosed, or represents that its use would not infringe privately owned rights. The findings and conclusions in this report are those of the authors and do not necessarily represent the views of the Department of Energy.
BASIN ORIENTED STRATEGIES FOR CO2 ENHANCED OIL RECOVERY: ONSHORE CALIFORNIA OIL BASINS Prepared for U.S. Department of Energy Prepared by Advanced Resources International April 2005
i April 2005
TABLE OF CONTENTS
1. SUMMARY OF FINDINGS 1.1 OPPORTUNITIES AND BARRIERS 1.2 BASIN ORIENTED STRATEGIES FOR OVERCOMING BARRIERS 1.3 OVERVIEW OF FINDINGS 2. INTRODUCTION 2.1 CURRENT SITUATION 2.2 BACKGROUND 2.3 PURPOSE 2.4 KEY ASSUMPTIONS 2.5 TECHNICAL OBJECTIVES 2.6 OTHER ISSUES 3. OVERVIEW OF ALASKA OIL PRODUCTION 3.1 HISTORY OF OIL PRODUCTION 3.2 EXPERIENCE WITH IMPROVED OIL RECOVERY 3.3 THE “STRANDED OIL” PRIZE 3.4 REVIEW OF PRIOR STUDIES 4. MECHANISMS OF CO2-EOR 4.1 MECHANISMS OF MISCIBLE CO2-EOR 4.2 MECHANISMS OF IMMISCIBLE CO2-EOR 4.3 INTERACTIONS BETWEEN INJECTED CO2 AND RESERVOIR OIL 5. STUDY METHODOLOGY 5.1 OVERVIEW 5.2 ASSEMBLING THE MAJOR OIL RESERVOIRS DATA BASE 5.3 SCREENING RESERVOIRS FOR CO2-EOR 5.4 CALCULATING MINIMUM MISCIBILITY PRESSURE 5.5 CALCULATING OIL RECOVERY 5.6 ASSEMBLING THE COST MODEL 5.7 CONSTRUCTING AN ECONOMICS MODEL 5.8 PERFORMING SENSITIVITY ANALYSES 6. RESULTS BY BASIN 6.1 SAN JOAQUIN BASIN 6.2 LOS ANGELES BASIN 6.3 COASTAL BASIN
ii April 2005
LIST OF FIGURES
Figure 1 Impact of Technology and Financial Conditions on Economically Recoverable Oil from California’s Major Reservoirs Using CO2-EOR (Million Barrels)
Figure 2 Major California Oil Basins Figure 3 Major Pipeline System Connecting CO2 Sources With Oil Fields of
California Figure 4 One Option for Transporting CO2 Supplies to California’s Oil Fields Figure 5 History of California Oil Production Figure 6 One-Dimensional Schematic Showing the CO2 Miscible Process Figure 7A Carbon Dioxide, CH4 and N2 densities at 1050F Figure 7B Carbon Dioxide, CH4 and N2 viscosities at 1050F Figure 8A Relative Oil Volume vs. Pressure for a Light West Texas Reservoir Fluid Figure 8B Oil Swelling Factor vs. Pressure for a Heavy Oil in Turkey Figure 9 Viscosity Reduction Versus Saturation Pressure Figure 10 Estimating CO2 Minimum Miscibility Pressure Figure 11 Correlation of MW C5+ to Tank Oil Gravity Figure 12 California Oil Districts Containing the San Joaquin Basin Figure 13 California Oil District Containing the Los Angeles Basin Figure 14 California Oil Districts Containing the Coastal Basin
LIST OF TABLES
Table 1 Size and Distribution of California’s “Stranded Oil” Resource Base Table 2 California’s “Stranded Oil” Amenable to CO2-EOR Table 3 Technically Recoverable Resource Using Miscible and Immiscible CO2-
EOR Table 4 Economically Recoverable Resources with “Traditional Practices” Miscible
CO2-EOR Table 5 Economically Recoverable Resources Under Alternative Scenarios Table 6 Matching of CO2-EOR Technology With California’s Oil Reservoirs Table 7 Annual Production (MMBbl) from the Ten Largest California Oil Fields,
2000-2003 Table 8 Incremental Oil Production from Improved Oil Recovery Projects (2002) Table 9 California's Giant Oil Fields Table 10 Reservoir Data Format: Major Oil Reservoirs Data Base Table 11 California Oil Reservoirs Screened Acceptable for CO2-EOR Table 12 Economic Model Established by the Study Table 13 San Joaquin Basin Oil Production Table 14 Status of San Joaquin Basin “Anchor” Fields/Reservoirs, 2001 Table 15 Reservoir Properties and Improved Oil Recovery Activity, “Anchor” Oil
Target” Oil Fields/Reservoirs Table 17 Reservoir Simulation of Oil Recovery vs. CO2 Injection, N. Coles Levee
iii April 2005
Table 18 Economic Oil Recovery Potential Under Base Case Financial Conditions, San Joaquin Basin
Table 19 Economic Oil Recovery Potential with More Favorable Financial Conditions, San Joaquin Basin
Table 20 Los Angeles Basin Oil Production Table 21 Status of Los Angeles Basin “Anchor” Fields/Reservoirs, 2001 Table 22 Reservoir Properties and Improved Oil Recovery Activity, “Anchor” Oil
Fields/Reservoirs Table 23 Reservoir Properties and Improved Oil Recovery Activity, Los Angeles
Basin “Secondary Target” Oil Fields/Reservoirs Table 24 Oil Recovery vs. Volume of CO2 Injection Table 25 Economic Oil Recovery Potential Under Base Case Financial Conditions,
Los Angeles Basin Table 26 Economic Oil Recovery Potential with More Favorable Financial Conditions,
Los Angeles Basin Table 27 Coastal Basin Oil Production Table 28 Status of Coastal Basin “Anchor” Fields/Reservoirs, 2001 Table 29 Reservoir Properties and Improved Oil Recovery Activity, “Anchor” Oil
Fields/Reservoirs Table 30 Economic Oil Recovery Potential Under Current Conditions, Coastal Basin Table 31 Economic Oil Recovery Potential More Favorable Financial Conditions,
Coastal Basin
1-1 April 2005
1. SUMMARY OF FINDINGS
1.1 OPPORTUNITIES AND BARRIERS. Onshore California holds large
volumes of “stranded oil”, 57 billion barrels, which will be left in the ground following the
use of today’s oil recovery practices. A significant portion of this “stranded oil” is in
reservoirs technically amenable to enhanced oil recovery (EOR) using carbon dioxide
(CO2) injection. Prudent application of CO2-EOR would enable a significant portion of
this “stranded oil” to be economically produced.
This report evaluates the future oil recovery potential in the major oil basins and
large oil fields of California and the barriers that stand in the way. It then examines how
a concerted set of “basin oriented strategies” could help California’s oil production
industry overcome these barriers.
1.2 BASIN ORIENTED STRATEGIES FOR OVERCOMING BARRIERS. A
number of actions could be taken to lift the barriers that currently constrain increased
recovery of California’s “stranded oil”. Four of these actions are set forth below:
First, bringing “State-of-the-art” CO2-EOR technology, being tested and used in
other oil basins, to California’s oil fields.
Second, lowering the risks inherent in applying new technology to complex oil
reservoirs, by conducting research, pilot tests and field demonstrations of CO2-EOR
in California’s geologically challenging oil fields.
Third, providing a package of “risk mitigating” actions such as state production tax
reductions, federal investment tax credits and royalty relief to reduce potential oil
price and market risks and to improve the economic attractiveness of pursuing this
otherwise “stranded oil.”
Fourth, establishing low-cost, reliable “EOR-ready” CO2 supplies from various
natural and industrial sources. In the near-term, this would include high-
concentration CO2 emissions from refinery hydrogen plants, gas processing facilities
and other industrial sources. In the longer-term, this would involve capturing low
CO2 concentration emissions from electric power generation plants and other
1-2 April 2005
sources. The capture and productive use of industrial CO2 emissions would help
reduce greenhouse gas emissions.
Together, this four part set of “basin oriented strategies” would help revitalize
California’s economy, increase state tax revenues, and enable additional domestic oil to
be recovered and produced.
1.3 OVERVIEW OF FINDINGS. Ten major findings emerge from the study of
“Basin Oriented Strategies for CO2 Enhanced Oil Recovery: Onshore California Oil
Basins.”
1. California has a large “stranded oil” resource base that will be left in the ground following the use of today’s oil recovery practices. The oil resource in
California’s reservoirs was originally 83 billion barrels. To date, 26 billion barrels of this
original oil in-place (OOIP) has been recovered or proved. Thus, without further oil
recovery actions, 57 billion barrels of California’s oil resource will become “stranded”,
much of it in the state’s 172 major onshore oil reservoirs, Table 1.
Table 1. Size and Distribution of California’s “Stranded Oil” Resource Base
Basin No. of
Reservoirs OOIP
(Billion Bbls)
Cumulative Recovery/ Reserves
(Billion Bbls) ROIP
(Billion Bbls)
A. Major Oil Reservoirs
San Joaquin 67 39.5 14.1 25.4
Los Angeles 64 22.9 6.3 16.6
Coastal 41 12.4 3.1 9.3
Data Base Total 172 74.8 23.5 51.3
B. State Total n/a 83.3 26.0 57.3 *Estimated from State of California onhsore data on cumulative oil recovery and proved reserves, as of the end of 2001.
1-3 April 2005
2. Much of California’s large “stranded oil” resource base is amenable to CO2 enhanced oil recovery. To address the “stranded oil” issue, Advanced Resources
assembled a data base that contains 172 major onshore California oil reservoirs,
accounting for 90% of California’s oil production. Of these, 88 reservoirs, with 31.9
billion barrels of OOIP and 22.1 billion barrels of “stranded oil” (remaining oil in-place
(ROIP)), were found to be favorable for CO2-EOR, as shown below by basin, Table 2.
Table 2. California’s “Stranded Oil” Amenable to CO2-EOR
Basin No. of
Reservoirs OOIP
(Billion Bbls)
Cumulative Recovery/ Reserves
(Billion Bbls) ROIP
(Billion Bbls)
San Joaquin 29 11.9 3.8 8.1
Los Angeles 36 14.1 4.2 9.9
Coastal 23 5.9 1.8 4.1
TOTAL 88 31.9 9.8 22.1
3. Application of miscible and immiscible CO2-EOR would enable a
significant portion of California’s “stranded oil” to be recovered. Of the 88 large
California oil reservoirs favorable for CO2-EOR, 59 reservoirs (with 21.4 billion barrels
OOIP) screen as being favorable for miscible CO2-EOR. The remaining 29 oil
reservoirs (with 10.5 billion barrels OOIP) screen as being favorable for immiscible CO2-
EOR. The technically recoverable resource from applying CO2-EOR in these 88 large
oil reservoirs, ranges from 1,780 million barrels to 4,620 million barrels, depending on
the type of CO2-EOR technology that is applied — “Traditional Practices” or “State-of-
the-art”, Table 3.
1-4 April 2005
Table 3. Technically Recoverable Resource Using Miscible and Immiscible CO2-EOR
Miscible Immiscible
Basin No. of
Reservoirs
Technically Recoverable*
(MMBbls) No. of
Reservoirs
Technically Recoverable*
(MMBbls)
San Joaquin 24 860-1,800 5 0-240
Los Angeles 15 470-970 21 0-520
Coastal 20 450-1,010 3 0-80
TOTAL 59 1,780-3,780 29 0-840 *Range in technically recoverable oil reflects the performance of “Traditional Practices” and “State-of-the-art” CO2-EOR technology.
4. With “Traditional Practices” CO2 flooding technology, high CO2 costs and high risks, very little of California’s “stranded oil” will be economically recoverable. “Traditional” application of CO2-EOR technology to the 88 large
reservoirs would enable 1,780 million barrels of this “stranded oil” to become technically
recoverable. However, with the current high costs for CO2 and uncertainties about
future oil prices, only a very modest portion, 50 million barrels, of this “stranded oil”
would become economically recoverable, all of it from the San Joaquin Basin, Table 4.
Table 4. Economically Recoverable Resources with “Traditional Practices” Miscible CO2-EOR
Basin No. of
Reservoirs OOIP
(MMBbls)
Technically Recoverable
(MMBbls)
Economically* Recoverable
(MMBbls)
San Joaquin 24 8,900 860 50
Los Angeles 15 7,830 470 -
Coastal 20 4,690 450 -
TOTAL 59 21,420 1,780 50
*This case assumes an oil price of $25 per barrel, a CO2 cost of 5% of the oil price, and a ROR hurdle rate of 25% (before tax).
1-5 April 2005
5. Successful implementation of “basin oriented strategies”, including “State-of-the-art” CO2-EOR technology, “risk mitigation” actions and lower CO2 costs would enable 1.8 to 4.0 billion barrels of additional oil to be economically recovered from California’s large oil reservoirs. Using “State-of-the-art” CO2-EOR
technology and a $25 per barrel oil price, Scenario #2 below, 1.8 billion barrels of the oil
remaining in California’s reservoirs to become economically recoverable.
A series of “risk mitigation” actions, involving an increased EOR investment tax
credit, reduced state production taxes and federal and state royalty relief (for projects on
federal and state lands) that together provide an equivalent of a $10 per barrel increase
in the oil price, would enable a much larger portion of California’s “stranded oil” to be
produced. Under Scenario #3, called “Risk Mitigation”, 3.5 billion barrels would become
economically recoverable.
With ample supplies of lower cost CO2, Scenario #4, the economic potential
increases to 4.0 billion barrels from California’s large onshore oil reservoirs, shown in
Figure 1 and Table 5.
Table 5. Economically Recoverable Resources Under Alternative Scenarios
Scenario #2:
“State-of-the-art” Scenario #3:
“Risk Mitigation” Scenario #4:
“Ample Supplies of CO2”
Basin
Moderate Oil Price/ High CO2 Cost*
(MMBbls)
High Equivalent Oil Price/ High CO2 Cost**
(MMBbls)
High Equivalent Oil Price/ Low CO2 Cost***
(MMBbls)
San Joaquin 1,060 1,380 1,780
Los Angeles 700 1,290 1,370
Coastal 70 830 830
TOTAL 1,830 3,500 3,980 *This case assumes an oil price of $25 per barrel, a CO2 cost of 5% of the oil price and a ROR hurdle rate of 15% (before tax). **This case assumes an equivalent oil price of $35 per barrel, a CO2 cost of 5% of the oil price and a ROR hurdle rate of 15% (before tax). ***This case assumes an equivalent oil price of $35 per barrel, a CO2 cost of 2% of the oil price and a ROR hurdle rate of 15% (before tax).
1-6 April 2005
Figure 1. Impact of Technology and Financial Conditions on Economically Recoverable Oil from California’s Major Reservoirs Using CO2-EOR (Million Barrels)
High Risk/High Cost CO2/Mod. Oil Price
Low Risk/High Cost CO2/Mod. Oil Price
Low Risk/Low Cost CO2/
High EquivalentOil Price
Low Risk/Low Cost CO2/
High EquivalentOil Price
50
1,830
3,500
3,980
0
500
1,000
1,500
2,000
2,500
3,000
3,500
4,000
4,500
Improved Financial Conditions
CurrentFinancial
Conditions
“TraditionalPractices” “State of the Art” Technology
Millio
n Ba
rrels
of A
dditi
onal,
Ec
onom
ically
Rec
over
able
Oil
JAF02320.PPT 6. Once the results from the study’s large oil reservoirs data base are
extrapolated to the state as a whole, the technically recoverable CO2-EOR potential for onshore California is over 5 billion barrels. The large California oil
reservoirs examined by the study account for 90% of the state’s oil resource.
Extrapolating the 4,620 million barrels of technically recoverable EOR potential in these
88 oil reservoirs to total California oil resources provides an estimate of 5.2 billion
barrels of technical CO2-EOR potential. (However, no extrapolation of total economic
potential has been estimated, as the development costs of the smaller California oil
fields may not reflect the development costs for the 88 large oil reservoirs in the data
set.)
7. The ultimate additional oil recovery potential from applying CO2-EOR in
California will, most likely, prove to be higher than defined by this study. Introduction of
1-7 April 2005
more “advanced” CO2-EOR technologies still in the research or field demonstration
stage, such as gravity stable CO2 injection, extensive use of horizontal well
technologies, CO2 miscibility control agents and next-generation immiscible CO2-EOR,
could significantly increase recoverable oil volumes while greatly expanding the state’s
geologic storage capacity for CO2 emissions. The benefits and impacts of using
“advanced” CO2-EOR technology on California’s oil reservoir need to be examined in a
subsequent study.
8. Large volumes of new CO2 supplies will be required in California to achieve the CO2-EOR potential defined by this study. The overall market for
purchased CO2 could be up to 18 Tcf, plus another 40+ Tcf of recycled CO2. Assuming
that the volume of CO2 stored equals the volume of CO2 purchased and that the bulk of
purchased CO2 is from industrial sources, applying CO2-EOR to California’s oil
reservoirs would enable over 1 billion tons of CO2 emissions to be stored, greatly
reducing greenhouse gas emissions. Advanced CO2-EOR flooding and CO2 storage
concepts (plus incentives for storing CO2) could double this amount.
9. A public-private partnership will be required to overcome the many barriers facing large scale use of CO2-EOR in California’s oil fields. The
challenging nature of the current barriers — lack of sufficient, reliable, low-cost CO2
supplies, uncertainties as to how the technology will perform in California’s complex oil
fields, the considerable market and oil price risks, and the public perception of oil
extraction — all argue that a partnership involving the oil production industry, potential
CO2 suppliers and transporters, the State of California and the federal government will
be needed to address the barriers.
10. Many entities will share in the benefits of increased CO2-EOR based oil
production in California. Successful introduction and wide-scale use of CO2-EOR in
California will stimulate increased economic activity, provide new higher paying jobs,
and lead to higher tax revenues for the state. It will help revive a declining domestic oil
production and service industry. And, it will provide energy security for the nation and
lower greenhouse gas emissions for all.
2-1 April 2005
2. INTRODUCTION
2.1 CURRENT SITUATION. California’s oil basins are mature and in decline.
Stemming the decline in oil production will be a major challenge, requiring a coordinated
set of actions by numerous parties who have a stake in this problem — state of
California revenue and economic development officials; private, state and federal
royalty owners; the California oil production and refining industry; the public, and the
federal government.
The main purpose of this report is to provide information to these “stakeholders”
on the potential for pursuing CO2 enhanced oil recovery (CO2-EOR) as one option for
stopping and potentially reversing the decline in California’s oil production.
This report, “Basin Oriented Strategies for CO2 Enhanced Oil Recovery:
California Oil Basins,” provides information on the size of the technical and economic
potential for CO2-EOR in California. It also identifies the many barriers — insufficient
and costly CO2 supplies, high market and economic risks, and concerns over
technology performance — that currently impede the cost-effective application of CO2-
EOR in California’s large oil basins.
2.2 BACKGROUND. California is the fourth largest domestic oil producing state,
behind Louisiana, Texas and Alaska, providing 760 thousands barrels of oil per day, at
the end of 2003. California’s oil is produced from three main basins, San Joaquin, Los
Angeles and Coastal (that combines the Santa Maria and Ventura basins). While
known for its heavy oil resources and successful application of steam-based enhanced
oil recovery (Steam-EOR), California also has a considerable number of light oil
reservoirs that are amenable to miscible carbon-dioxide based enhanced oil recovery
(CO2-EOR). In addition, the state has a large number of deep, moderately heavy oil
reservoirs, particularly in the Los Angeles Basin that could benefit from the application
of immiscible CO2-EOR. The oil basins and selected major oil fields of California are
shown in Figure 2.
2-2 April 2005
Figure 2. Major California Oil Basins
SAN JOAQUIN
LOS ANGELES
SANTA MARIA
VENTURA
P a c i f i c O c e a n
Ventura
Lost Hills
Belridge SouthElk Hills
Coles Levee North
InglewoodSanta FeSprings
Long BeachWilmington
JAF01969.CDR
Orcutt
COASTALBASIN
2.3 PURPOSE. This report, “Basin Oriented Strategies for CO2 Enhanced Oil
Recovery: Onshore California Oil Basins” is part of a larger effort to examine the
enhanced oil recovery and CO2 storage potential in key U.S. oil basins. Subsequent
reports will address the oil fields along the Gulf Coast, the Mid-Continent and Alaska.
The work involves examining the geological characteristics of major oil fields; examining
the available CO2 sources, volumes and costs; calculating oil recovery and CO2 storage
capacity; and, estimating economic feasibility.
2-3 April 2005
Future studies will also examine alternative public-private partnership strategies
for developing lower-cost CO2 capture technology; for launching R&D/pilot projects of
advanced CO2 flooding technology; and, for structuring royalty/tax incentives and
policies that would help accelerate the application of CO2-EOR and CO2 storage in the
major oil basins of the U.S.
An important purpose of the larger study is to develop a desktop modeling and
analytical capability for “basin oriented strategies” that enable DOE/FE to formulate
policies and research programs that would support increased recovery of domestic oil
resources. As such, this desktop model complements, but does not duplicate, the more
extensive TORIS modeling system maintained by DOE/FE’s National Energy
Technology Laboratory.
2.4 KEY ASSUMPTIONS. For purposes of the study, it is assumed that
sufficient supplies of CO2 will become available, either by pipeline from natural sources
such as St. John’s or McElmo Dome, from industrial sources such as the hydrogen
plants at the oil refinery complex at Wilmington, or from power plants in the San Joaquin
or Coastal basins.
Figure 3 provides a conceptual illustration of a CO2 pipeline system that would
transport captured CO2 emissions from California’s refinery complex at Wilmington to
the oil basins of California. Figure 4 illustrates one option for bringing CO2 supply from
the natural CO2 reservoirs in New Mexico to the oil basins of California.
2-4 April 2005
Figure 3. Major Pipeline System Connecting CO2 Sources With Oil Fields of California
SAN JOAQUIN
LOS ANGELES
SANTA MARIA
VENTURA
P a c i f i c O c e a n
Ventura
Lost Hills
Belridge SouthElk Hills
Coles Levee North
InglewoodSanta FeSprings
Long BeachWilmington
JAF01914.CDR
Future CO Pipeline2Orcutt
2-5 April 2005
Figure 4. One Option for Transporting CO2 Supplies to California’s Oil Fields
Source;: Kinder Morgan (2001)
Phoenix
Gallup
Farmington
Durango
Barstow
Los Angeles
San Diego
C a l i f o r n i a
U t a h C o l o r a d o
A r i z o n a
N e wM e x i c o
Las VegasLas Vegas
N e v a d a
P a c i f i c
O c e a n
Bakersfield
Ventura
Long Beach
St. JohnsSt. JohnsAdelanto
PalmdaleJct
North Route
South Route
St. Johns
2-6 April 2005
2.5 TECHNICAL OBJECTIVES. The detailed objectives of this study are to
examine the technical and economic potential of applying CO2-EOR in California’s oil
basins, under two technology options:
1. “Traditional Practices” Technology. This involves the continued use of past CO2
flooding and reservoir selection practices. It is distinguished by using miscible
CO2-EOR technology in light oil reservoirs attempting to minimize injection
volumes of CO2 per recovered oil barrel. Typical volumes are 0.4 to 0.5 HCPV.
2. “State-of-the-art” Technology. This involves bringing to California the benefits of
recent gains in understanding of the CO2-EOR process and how best to custom
its application to the many different types of oil reservoirs in the state. Light oil
reservoirs are selected for miscible CO2-EOR and the challenging heavier oil
reservoirs (that are too deep for steam-based enhanced oil recovery) are
targeted for immiscible CO2-EOR. “State-of-the-art” technology also entails
injecting much larger volumes of CO2, on the order of 1 HCPV, with considerably
higher CO2 recycling. Under “State-of-the-art” technology, with CO2 injection
volumes more than twice as large, oil recovery will also be higher than reported
for past field projects using “Traditional Practices”. The CO2 injection/oil recovery
ratio may also be higher under this technology option, calling for increased, lower
cost CO2 supplies.
The set of oil reservoirs to which CO2-EOR would be applied fall into two groups,
(after excluding certain of California’s oil reservoirs, such as the shallow, heavy oil
reservoir being produced with thermal oil recovery methods), as set forth below:
1. Favorable Light Oil Reservoirs Meeting Stringent CO2 Miscible Flooding
Criteria. These are the deeper, higher gravity oil reservoirs where CO2
becomes miscible (after extraction of light hydrocarbon components into the
CO2 phase) with the oil remaining in the reservoir. Typically, reservoirs at
depths greater than 3,000 feet and with oil gravities greater than 25 °API
would be selected for miscible CO2-EOR. Major California light oil fields such
2-7 April 2005
as Elk Hills, Santa Fe Springs and Ventura fit into this category. The great
bulk of past CO2-EOR floods have been conducted in these “favorable
reservoirs”.
2. Challenging Reservoirs Involving Immiscible Application of CO2-EOR. These
are the deeper, moderately heavy oil reservoirs (as well as shallower light oil
reservoirs) that do not meet the stringent requirements for miscibility. This
reservoir set includes the large California oil fields, such as Torrance, South
Mountain and Wilmington that still hold a significant portion of their original oil.
California reservoirs at depths greater than 3,000 feet with oil gravities
between 17.5º and 25 °API (or higher) would generally be included in this
category. The reliability of projecting oil recovery from these “challenging
reservoirs” is subject to considerable uncertainty, although pilot projects of
this technology show promise. Therefore, these reservoirs will be considered
only in the “State-of-the-art” technology.
Combining the technology and oil reservoir options, the following oil reservoir
and CO2 flooding technology matching is applied to California’s reservoirs amenable to
CO2-EOR, Table 6.
Table 6. Matching of CO2-EOR Technology With California’s Oil Reservoirs
“State-of-the-art”; Miscible and Immiscible CO2-EOR
Deep, Light Oil Reservoirs Deep, Moderately Heavy Oil Reservoirs
2-8 April 2005
2.6 OTHER ISSUES. This study draws on a series of sources for basic data on
the reservoir properties and the expected technical and economic performance of CO2-
EOR in California’s major oil reservoirs. Because of confidentiality and proprietary
issues, the results of the study have been aggregated at the basin level for the three
major California oil basins. As such, reservoir-level data and results are not provided
and are not available for general distribution. However, selected non-confidential and
non-proprietary information at the field and reservoir level is provided in the report and
would be made available for review, on a case by case basis, to provide an improved
context for the basin level reporting of results.
3-1 April 2005
3. OVERVIEW OF CALIFORNIA OIL PRODUCTION
3.1 HISTORY OF OIL PRODUCTION. Oil production in California has steadily
declined for the past twenty years, since reaching a peak of 420 million barrels per year
(1.15 million barrels per day) in 1985, Figure 5. The steep production decline between
1985 and 1990 was arrested in 1990 and remained flat for five years. Aggressive
application of steam-based enhanced oil recovery and development of oil fields in the
federal offshore waters stemmed the decline. In 1995, oil production resumed its
decline reaching a recent low of 280 million barrels (770,000 barrels per day) in 2003.
The prolific San Joaquin Basin (Districts 4 and 5) remains the state’s largest oil
producing basin, providing 200 million barrels in 2003.
The Los Angeles Basin (District 1) is a distant second with 31 million barrels of oil
produced in 2003.
The Coastal Basin, which contains the Ventura (District 2) and Santa Maria (District
3) basins, provided 19 million barrels of oil in 2003.
The remaining 30 million barrels of California oil production is from the federal
offshore and northern California (District 6), which has not been considered in this
report.
However, onshore California still holds a rich resource base of oil in the ground.
With 83 billion barrels of original oil in-place (OOIP) and 26 billion barrels expected to
be recovered, 57 billion barrels is “stranded” due to lack of technology, lack of sufficient,
affordable CO2 supplies and high economic risk. A major portion of this “stranded oil” is
in world-class size fields that offer potential for enhanced oil recovery.
Table 7 presents the status and annual oil production for the ten largest
California oil fields. The table shows that seven of the ten largest fields are in steep
production decline. Arresting this decline in California’s oil production could be attained
by applying enhanced oil recovery technology, particularly CO2-EOR.
3-2 April 2005
Annu
al Oi
l Pro
duct
ion
(milli
on b
arre
ls)
Years
California Department of Conservation, Division of Oil, Gas and Geothermal Resources (2003).
Figure 5. History of California Oil Production
Total
Onshore
State Tidelands
Federal OCS
JAF02318.PPT
3-3 April 2005
Table 7. Annual Production (MMBbl) from the Ten Largest California Oil Fields, 2000-2003
Oil Fields 2000 2001 2002 2003 Production
Status
Midway-Sunset 58.0 51.7 50.2 48.4 Declining
Belridge, South 41.6 38.8 40.1 41.0 Stable
Kern River 45.0 41.3 38.7 37.3 Declining
Cymric 20.4 21.1 20.0 18.6 Declining
Elk Hills 17.5 18.6 19.7 18.6 Stable
Wilmington 16.8 15.9 15.1 14.9 Declining
Lost Hills 11.1 10.9 11.3 11.1 Stable
Hondo Offshore 11.0 9.9 8.9 7.7 Declining
Coalinga 7.9 7.2 6.9 6.5 Declining
Pescado Offshore 7.1 5.8 6.7 6.3 Declining
3.2 EXPERIENCE WITH IMPROVED OIL RECOVERY. California’s oil
producers are familiar with using technology for improving oil recovery. For example,
more than half of California’s oil production is from application of secondary and
enhanced oil recovery. In 2002:
Use of thermal EOR, primarily steam drive, provided 108 million barrels, Waterflooding accounted for 46 million barrels, and Gas injection provided 4 million barrels.
Notable is the absence of oil production from CO2-EOR, even though numerous
small CO2-EOR pilots have been conducted in the past. The lack of secure, low-cost
CO2 supplies is one of the primary reasons for the noted absence of CO2-EOR in
California’s oil fields.
3-4 April 2005
Table 8 presents data on incremental oil production in California from current
waterflooding and gas injection improved oil recovery projects. The successful
applications of these “secondary” types of improved oil recovery methods (particularly in
the moderately heavy oil reservoirs) help give confidence that the “tertiary” application
of CO2-EOR would be successful.
3.3 THE “STRANDED OIL” PRIZE. Even though California’s oil production is
declining, this does not mean that the resource base is exhausted. California is blessed
with a large number of giant oil fields with large remaining oil in-place (ROIP). Table 9
provides information (as of year 2002) on the maturity and oil production history of 14
giant California oil fields, each with estimated ultimate recovery of 500 million barrels or
more. Of particular note are the giant light oil fields that may be attractive for miscible
CO2-EOR including: Elk Hills (San Joaquin Basin) with 2,780 million barrels of ROIP,
Ventura (Ventura Basin) with 2,310 million barrels of ROIP, and Santa Fe Springs (Los
Angeles Basin) with 1,980 million barrels of ROIP. Equally notable are the large
moderately deep, moderately heavy oil reservoirs that are candidates for immiscible
CO2-EOR, such as: Huntington Beach onshore and Wilmington onshore, both in the Los
Angeles Basin.
3.4 REVIEW OF PRIOR STUDIES. Past studies of the potential for CO2
enhanced oil recovery in California’s oil reservoirs provide a mixed outlook.
A recent study, “Coal-Based Power Generation for California with CO2 Removed
for Use in Enhanced Oil Recovery” (Parsons, December 2002), identified only two small
California oil fields that were economically favorable for miscible CO2-EOR. Eight
additional reservoirs, with 470 million barrels of CO2-EOR potential, screened
technically acceptable for CO2-EOR but were judged to be uneconomic. The study did
not consider EOR from oil reservoirs with API gravities less than 22º, and did not
examine the applicability of immiscible CO2 flooding.
3-5 April 2005
Table 8. Incremental Oil Production from Improved Oil Recovery Projects (2002)
Field Waterflooding (Bbls) Gas Injection (Bbls)
Los Angeles Basin Belmont Offshore 36,000 - Beverly Hills 776,000 - Brea-Olinda 104,000 - Coyote, East 123,000 - Huntington Beach Offshore 2,056,000 - Huntington Beach Onshore 362,000 - Inglewood 2,201,000 - Las Cienegas 307,000 - Long Beach 919,000 - Los Angeles Downtown 89,000 - Montebello 540,000 - Newport West, Onshore 8,000 - Richfield 157,000 - Rosecrans 26,000 - San Vincente 711,000 - Sansinena 105,000 - Santa Fe Springs 510,000 - Sawtelle 195,000 - Seal Beach 35,000 - Torrance Onshore 227,000 - Wilmington Offshore 11,787,000 - Wilmington Onshore 3,256,000 - Total 24,530,000 - Ventura Basin Oak Ridge 45,000 - Rincon 135,000 - San Miguelito 645,000 - Ventura 4,400,000 - Total 5,225,000 - Santa Maria Basin Cat Canyon 131,000 - Cuyama, South 283,000 - Orcutt 488,000 - Russell Ranch 10,000 - Santa Maria Valley 40,000 - Total 952,000 - San Joaquin Basin Belridge, North 1,181,000 - Belridge, South 9,505,000 - Coles Levee, North 176,000 - Coles Levee, South 25,000 - Elk Hills 2,040,000 4,178,000 Lost Hills 2,254,000 - Tejon Hills 4,000 - Tejon, North 6,000 - Wheeler Ridge 14,000 - Yowlumme 580,000 - Total 15,785,000 4,178,000 State Total 46,492,000 4,178,000
3-6 April 2005
Table 9. California’s Giant Oil Fields (Fields with cumulative recovery of 500 million barrels or more, 2002)
Field Year
Discovered
Cumulative Production
(Mbbl)
Estimated Reserves
(Mbbl)
Remaining Oil In-Place
(Mbbl)
1 Midway-Sunset 1894 2,697,814 759,060 4,030
2 Wilmington 1932 2,598,498 385,895 6,464
3 Kern River 1899 1,839,893 611,407 1,824
4 Belridge, South 1911 1,315,700 585,240 4,694
5 Elk Hills 1911 1,212,578 132,780 2,776
6 Huntington Beach 1920 1,116,621 47,787 2,334
7 Ventura 1919 968,597 43,449 2,414
8 Long Beach 1921 933,769 11,872 2,004
9 Coalinga 1890 888,089 81,801 2,240
10 Buena Vista 1909 663,795 8,012 1,348
11 Santa Fe Springs 1919 624,317 9,437 1,976
12 Coalinga, E. Extension 1938 504,038 4,354 464
An even more pessimistic outlook was provided in an earlier study of California
CO2-EOR potential, reported in Volume II, “An Evaluation of Known Remaining Oil
Resources in the State of California”, (1994), prepared by the Interstate Oil Compact
Commission for the Bartlesville Project Office of DOE. This study stated:
“While there may be some limited potential for CO2-miscible flooding in California, it
is not apparent from this analysis.”
“Immiscible carbon dioxide injection as an alternative to cyclic steam injection in
California reservoirs appears to hold some promise according to recent reports. . .
The potential for this type of carbon dioxide stimulation was not modeled in this
analysis.”
3-7 April 2005
A distinctly different outlook was provided in the Society of Petroleum
Engineering paper SPE 63305 “CO2 Flood Potential of California Oil Reservoirs and
Possible CO2 Sources” by Jeschke, Schoeling and Hemmings (June, 2000). The
authors examined the “oil recoverable under both miscible and immiscible CO2 floods
from nine representative California oil reservoirs.” The incremental oil recoverable under
CO2-EOR from this nine field data base (that included the giant light oil fields of Elk
Hills, Santa Fe Springs and Ventura, as well as the large, heavier oil fields of Huntington
Beach and Inglewood) was estimated at 1,424 to 2,848 million barrels.
The first two studies are consistent with the rather pessimistic “Traditional
Practices” outlook for the CO2-EOR potential in California. The third study supports the
application of “State-of-the-art” technology, for both miscible and immiscible CO2
flooding, and gives a much more optimistic outlook for using CO2-EOR in California’s oil
reservoirs. The availability of low cost CO2 supplies and a lower risk premium would
further improve the outlook, as is set forth in this study.
4-1 April 2005
4. MECHANISMS OF CO2-EOR
4.1 MECHANISMS OF MISCIBLE CO2-EOR. Miscible CO2-EOR is a multiple
contact process, involving the injected CO2 and the reservoir’s oil. During this multiple
contact process, CO2 will vaporize the lighter oil fractions into the injected CO2 phase
and CO2 will condense into the reservoir’s oil phase. This leads to two reservoir fluids
that become miscible (mixing in all parts), with favorable properties of low viscosity, a
mobile fluid and low interfacial tension.
The primary objective of miscible CO2-EOR is to remobilize and dramatically
reduce the after waterflooding residual oil saturation in the reservoir’s pore space.
Figure 6 provides an one-dimensional schematic showing the various fluid phases
existing in the reservoir and the dynamics of the CO2 miscible process.
4.2 MECHANISMS OF IMMISCIBLE CO2-EOR. When insufficient reservoir
pressure is available or the reservoir’s oil composition is less favorable (heavier), the
injected CO2 is immiscible with the reservoir’s oil. As such, another oil displacement
mechanism, immiscible CO2 flooding, occurs. The main mechanisms involved in
immiscible CO2 flooding are: (1) oil phase swelling, as the oil becomes saturated with
CO2; (2) viscosity reduction of the swollen oil and CO2 mixture; (3) extraction of lighter
hydrocarbon into the CO2 phase; and, (4) fluid drive plus pressure. This combination of
mechanisms enable a portion of the reservoir’s remaining oil to be mobilized and
produced. In general, immiscible CO2-EOR is less efficient than miscible CO2-EOR in
recovering the oil remaining in the reservoir.
4.3 INTERACTIONS BETWEEN INJECTED CO2 AND RESERVOIR OIL. The
properties of CO2 (as is the case for most gases) change with the application of
pressure and temperature. Figures 7A and 7B provide basic information on the change
in CO2 density and viscosity, two important oil recovery mechanisms, as a function of
pressure.
4-2 April 2005
Figure 6. One-Dimensional Schematic Showing the CO2 Miscible Process.
PureCO2
CO2 VaporizingOil Components
CO2Condensing
Into Oil
Original Oil
Miscibility is Developed in This Region(CO2 and Oil Form Single Phase)
Direction of Displacement
4-3 April 2005
Figure 7A. Carbon Dioxide, CH4 and N2 densities at 1050F. At high pressures, CO2 has a density close to that of a liquid and much greater than that of either
methane or nitrogen. Densities were calculated with an equation of state (EOS).
Figure 7B. Carbon Dioxide, CH4 and N2 viscosities at 1050F. At high pressures, the viscosity of CO2 is also greater then that of methane or nitrogen, although it remains
low in comparison to that of liquids. Viscosities were calculated with an EOS.
4-4 April 2005
Swelling is an important oil recovery mechanism, for both miscible and immiscible CO2-
EOR. Figures 8A and 8B show the oil swelling (and implied residue oil mobilization)
that occurs from: (1) CO2 injection into a West Texas light reservoir oil; and, (2) CO2
injection into a very heavy (12 °API) oil reservoir in Turkey. Laboratory work on the
Bradford Field (Pennsylvania) oil reservoir showed that the injection of CO2, at 800 psig,
increased the volume of the reservoir’s oil by 50%. Similar laboratory work on Mannville
“D” Pool (Canada) reservoir oil showed that the injection of 872 scf of CO2 per barrel of
oil (at 1,450 psig) increased the oil volume by 28%, for crude oil already saturated with
methane.
Viscosity reduction is a second important oil recovery mechanism, particularly for
immiscible CO2-EOR. Figure 9 shows the dramatic viscosity reduction of one to two
orders of magnitude (10 to 100 fold) that occur for a reservoir’s oil with the injection of
CO2 at high pressure.
4-5 April 2005
1.24
0 500 1000 1500 2000
Pressure, PSIG
2500
1.22
1.2
1.18
1.16
1.14
1.12
1.1
1.08
1.06
1.04Oi
l Swe
lling
Fact
or
Figure 8A. Relative Oil Volume vs. Pressure for a Light West Texas Reservoir Fluid. (Holm and Josendal)
CO2 SaturatedSeparator Oil
1.6
1.7
1.5
1.4
1.3
1.2
1.1
1.0 0 500 1000 1500 2000
Relat
ive O
il Vol
ume,
BBL.
Oil/B
BL. R
esid
ual O
il at 6
0o F
Pressure, PSIG
RecombinedReservoir Fluid
CO2 SaturatedReservoir Fluid
Figure 8B. Oil Swelling Factor vs. Pressure for a Heavy Oil in Turkey (Issever and Topkoya).
4-6 April 2005
Figure 9. Viscosity Reduction Versus Saturation Pressure. (Simon and Graue)
.7
.8
.6
.5
.4
.3
.2
.1
0 1000 30002000
Saturation Pressure, PSIG
0
.9
1.0
51050
100500
1000
Ratio
of A
ltere
d Vi
scos
ity to
Orig
inal
Visc
osity
Original Oil
Viscosity
JAF02318.PPT
5-1 April 2005
5. STUDY METHODOLOGY
5.1 OVERVIEW. A seven part methodology was used to assess the CO2-EOR
potential of California’s oil reservoirs. The seven steps were: (1) assembling the
California Major Oil Reservoirs Data Base; (2) screening reservoirs for CO2-EOR; (3)
the cost model; (6) constructing an economics model; and, (7) performing sensitivity
analyses.
An important objective of the study was the development of a desktop model with
analytic capability for “basin oriented strategies” that would enable DOE/FE to develop
policies and research programs leading to increased recovery and production of
domestic oil resources. As such, this desktop model complements, but does not
duplicate, the more extensive TORIS modeling system maintained by DOE/FE’s
National Energy Technology Laboratory.
5.2 ASSEMBLING THE MAJOR OIL RESERVOIRS DATA BASE. The study
started with the National Petroleum Council (NPC) Public Data Base, maintained by
DOE Fossil Energy. The study updated and modified this publicly accessible data base
to develop the California Major Oil Reservoirs Data Base for the San Joaquin, Los
Angeles, and Ventura and Santa Maria oil basins. The latter two basins were combined
into the Coastal Basin.
Table 10 illustrates the oil reservoir data recording format developed by the
study. The data format readily integrates with the input data required by the CO2-EOR
screening and oil recovery models, discussed below. Overall, the California Major Oil
Reservoirs Data Base contains 172 reservoirs, accounting for 90% of the oil expected to
be ultimately produced in California by primary, secondary and thermal injection
processes. Considerable work was required to develop an up-to-date, volumetrically
consistent Major Oil Reservoirs Data Base, as further discussed below.
5-2 April 2005
Table 10. Reservoir Data Format: Major Oil Reservoirs Data Base.
Basin Name
Field Name
Reservoir
Reservoir Parameters: Oil Production VolumesArea (A) Producing Wells (active) OOIP (MMbl)Net Pay (ft) Producing Wells (shut-in) Cum Oil (MMbl)Depth (ft) 2001 Production (Mbbl) EOY 2001 Reserves (MMbl)Porosity Daily Prod - Field (Bbl/d) Ultimate Recovery (MMbl)Reservoir Temp (deg F) Cum Oil Production (MMbbl) Remaining (MMbbl)Initial Pressure (psi) EOY 2001 Oil Reserves (MMbbl) Ultimate Recovered (%)Pressure (psi) Water Cut
OOIP Volume CheckBoi Water Production Reservoir Volume (AF)Bo @ So, swept 2001 Water Production (Mbbl) Bbl/AFSoi Daily Water (Mbbl/d) OOIP Check (MMbl)Sor
Swept Zone So Injection SROIP Volume CheckSwi Injection Wells (active) Reservoir Volume (AF)Sw Injection Wells (shut-in) Swept Zone Bbl/AF
2001 Water Injection (MMbbl) SROIP Check (MMbbl)API Gravity Daily Injection - Field (Mbbl/d)Viscosity (cp) Cum Injection (MMbbl)
Daily Inj per Well (Bbl/d) ROIP Volume CheckDykstra-Parsons ROIP Check (MMbl)JAF2004005.XLS
5-3 April 2005
A “test bed” data set was assembled for San Joaquin Basin oil reservoirs from
the National Petroleum Council (NPC) Public Data Base maintained by DOE/FE. This
“test bed” data set, incorporating a representative sample of 20 oil reservoirs in the San
Joaquin Basin, was used to seek answers to four questions:
1. How much effort would be required to provide an up-to-date, quality reservoir
data base? The reservoir properties, oil production and reserves data for California, in
the above cited publicly available data base, has not been updated since 1982. As
such, considerable work was required to develop an up-to-date and quality controlled
data base for this study.
2. Are all of the data items essential for calculating CO2-EOR using CO2-
PROPHET in the data base? Considerable effort was placed on developing updated
values for key reservoir properties, such as the Dykstra-Parsons coefficient, residual oil
in the water swept zone, latest formation volume factor, relative permeability curves and
other variables that significantly control oil recovery in CO2-PROPHET.
3. How readily do the reservoir data formats integrate with the data input format
of CO2-PROPHET? The data interface between the publicly available data base and
CO2-PROPHET was inadequate. To correct this problem, a new data format and user
interface was developed to enable CO2-PROPHET to efficiently link the reservoir data
set with the model’s input requirements.
4. How rigorously do existing screening tools enable the reservoirs in the San
Joaquin Basin to be assessed as candidates for miscible or immiscible flooding? An
updated methodology was developed by the study for establishing minimum miscibility
pressure, for selecting reservoirs eligible for miscible CO2 flooding, and for screening
reservoirs eligible for immiscible CO2 flooding.
In summary, considerable effort was required to construct an up-to-date,
volumetrically consistent data base that contained all of the essential data, formats and
interfaces to enable the study to: (1) develop an accurate estimate of the size of the
original and remaining oil in-place in California; (2) reliably screen the reservoirs as to
their amenability for miscible and immiscible CO2-EOR; and, (3) provide the CO2-
5-4 April 2005
PROPHET Model (developed by Texaco for the DOE Class I cost-share program) the
essential input data for calculating CO2 injection requirements and oil recovery.
5.3 SCREENING RESERVOIRS FOR CO2-EOR. The data base was screened
for reservoirs that would be applicable for CO2-EOR. Five prominent screening criteria
were used to identify favorable reservoirs. These were: reservoir depth, oil gravity,
reservoir pressure, and reservoir temperature and oil composition. These values were
used to establish the minimum miscibility pressure for conducting miscible CO2-EOR
and for selecting reservoirs that would be amenable to this oil recovery process.
Reservoirs not meeting the miscibility pressure standard were considered for immiscible
CO2-EOR.
The preliminary screening steps involved selecting the deeper oil reservoirs that
had sufficiently high oil gravity. A minimum reservoir depth of 3,000 feet, at the mid-
point of the reservoir, was used to ensure the reservoir could accommodate high
pressure CO2 injection. A minimum oil gravity of 17.5 °API was used to ensure the
reservoir’s oil had sufficient mobility, without requiring thermal injection. Table 11
tabulates the oil reservoirs that passed the preliminary screening step.
5-5 April 2005
Table 11. California Oil Reservoirs Screened Acceptable for CO2-EOR
Basin Field Formation A. Los Angeles Los Angeles Beverly Hills Miocene, East Area Los Angeles Beverly Hills Pliocene, East Area Los Angeles Beverly Hills Miocene, West Area Los Angeles Brea Olinda Pliocene-Miocene Los Angeles Dominguez Pliocene-Miocene Los Angeles Coyote East Anaheim Los Angeles Coyote East Stern Los Angeles Coyote West Main 99W Los Angeles Coyote West Main 99E Los Angeles Coyote West Emery West Los Angeles Coyote West Emery East Los Angeles Huntington Beach Jones Los Angeles Huntington Beach Onshore Los Angeles Huntington Beach S. Ashton-Jones Los Angeles Inglewood Moynier Los Angeles Inglewood Rubel Los Angeles Inglewood Sentous Los Angeles Las Cienegas Jefferson Los Angeles Long Beach Upper Los Angeles Los Angeles Miocene Los Angeles Montebello Baldwin Los Angeles Playa Del Ray Del Ray Hills Los Angeles Playa Del Ray Venice Area Los Angeles Richfield East Area Kraemer Los Angeles Richfield East Area Chapman Los Angeles Richfield West Area W. Chapman Los Angeles Santa Fe Springs Main Los Angeles Seal Beach McGrath North Los Angeles Seal Beach Wasem/McGrath Los Angeles Seal Beach McGrath South Los Angeles Seal Beach Bixby-Selover Los Angeles Seal Beach Wasem Los Angeles Torrance Del Amo Los Angeles Torrance Main Los Angeles Wilmington Fault Block I Terminal B. San Joaquin San Joaquin Asphalto Stevens San Joaquin Belridge North 64 Zone San Joaquin Buena Vista B27 San Joaquin Buena Vista Stevens San Joaquin Buena Vista Antelope San Joaquin Coalinga Nose Area San Joaquin Coles Levee North Richfield San Joaquin Coles Levee South Stevens
5-6 April 2005
Table 11. California Oil Reservoirs Screened Acceptable for CO2-EOR
Basin Field Formation San Joaquin Cuyama South Homan San Joaquin Cymric Oceanic San Joaquin Cymric Phacoides San Joaquin Edison Vedder-Freeman San Joaquin Edison West Area Chanac San Joaquin Elk Hills Upper San Joaquin Elk Hills Stevens San Joaquin Fruitvale Etchegoin-Chanac San Joaquin Russell Ranch Dibblee Sands San Joaquin Greeley Stevens San Joaquin Greeley Vedder San Joaquin Guijarral Hills Main Area San Joaquin Kettleman Dome North Temblor San Joaquin McKittrick Phacoides & Point of Rocks San Joaquin Paloma Paloma Sands San Joaquin Raisin City Zilch Sand San Joaquin Tejon Grapevine Central Area San Joaquin Ten Section Stevens San Joaquin Wheeler Ridge L-36 Reserve San Joaquin Yowlumne Yowlumne Sand San Joaquin Kettleman Hills (N. Dome) Vaqueros C. Coastal Coastal Aliso Canyon Porter Coastal Montalvo West McGrath Coastal Newhall-Potrero 7th Zone Coastal Newhall-Potrero 3rd Zone Coastal Newhall-Potrero 6th Zone Coastal Newhall-Potrero 5th Zone Coastal Oxnard McInnes Coastal Ramona Kern-Del Valley Coastal Rincon Rincon, Oak Grove Coastal Rincon Oak Grove, Others Coastal San Miguelito First Grubb Coastal San Miguelito Second Grubb Coastal San Miguelito Third Grubb Coastal Santa Susana Sespe Second & Third Coastal Saticoy Pico Coastal Shiells Canyon Eocene Coastal South Mountain Bridge-Pliocene Coastal South Mountain Sespe Coastal Ventura C Block Coastal Ventura D 3,4, 5, 6 Blocks Coastal Ventura D 7, 8 Blocks Coastal Ventura B Sands Coastal Orcutt Monterey, Pt Sal
5-7 April 2005
5.4 CALCULATING MINIMUM MISCIBILITY PRESSURE. The miscibility of a
reservoir’s oil with injected CO2 is a function of pressure, temperature and the
composition of the reservoir’s oil. The study’s approach to estimating whether a
reservoir’s oil will be miscible with CO2, given fixed temperature and oil composition,
was to determine whether the reservoir would hold sufficient pressure to attain
miscibility. Where oil composition data was missing, a correlation was used for
translating the reservoir’s oil gravity to oil composition.
To determine the minimum miscibility pressure (MMP) for any given reservoir,
the study used the Cronquist correlation, Figure 10. This formulation determines MMP
based on reservoir temperature and the molecular weight (MW) of the pentanes and
heavier fractions of the reservoir oil, without considering the mole percent of methane.
(Most California oil reservoirs have produced the bulk of their methane during primary
and secondary recovery.) The Cronquist correlation is set forth below:
MMP = 15.988*T (0.744206+0.0011038*MW C5+)
Where: T is Temperature in ºF, and MW C5+ is the molecular weight of pentanes
and heavier fractions in the reservoir’s oil.
The temperature of the reservoir was taken from the data base or estimated from the
thermal gradient in the basin. The molecular weight of the pentanes and heavier
fraction of the oil was obtained from the data base or was estimated from a correlative
plot of MW C5+ and oil gravity, shown in Figure 11.
The next step was calculating the minimum miscibility pressure (MMP) for a
given reservoir and comparing it to the maximum allowable pressure. The maximum
pressure was determined using a pressure gradient of 0.6 psi/foot. If the minimum
miscibility pressure was below the maximum injection pressure, the reservoir was
classified as a miscible flood candidate. Oil reservoirs that did not screen positively for
miscible CO2-EOR were selected for immiscible CO2-EOR.
5-8 April 2005
Figure 10. Estimating CO2 Minimum Miscibility Pressure
y = 4247.98641x-0.87022
R2 = 0.99763
0
100
200
300
400
500
0 20 40 60 80 100
Tank Oil Gravity, oAPI
Mol
ecul
ar W
T C
5+
Figure 11. Correlation of MW C5+ to Tank Oil Gravity
5-9 April 2005
5.5 CALCULATING OIL RECOVERY. The study utilized CO2-PROPHET to
calculate incremental oil produced using CO2-EOR. CO2-PROPHET was developed by
the Texaco Exploration and Production Technology Department (EPTD) as part of the
DOE Class I cost share program. The specific project was “Post Waterflood CO2 Flood
in a Light Oil, Fluvial Dominated Deltaic Reservoir” (DOE Contract No. DE-FC22-
93BC14960). CO2-PROPHET was developed as an alternative to the DOE’s CO2
miscible flood predictive model, CO2PM. According to the developers of the model,
CO2-PROPHET has more capabilities and fewer limitations than CO2PM. For example,
according to the above cited report, CO2-PROPHET performs two main operations that
provide a more robust calculation of oil recovery than available from CO2PM:
CO2-PROPHET generates streamlines for fluid flow between injection and
production wells, and
The model performs oil displacement and recovery calculations along the
established streamlines. (A finite difference routine is used for oil
displacement calculations.)
Appendix A discusses, in more detail, the CO2-PROPHET model and the
calibration of this model with an industry standard reservoir simulator.
Even with these improvements, it is important to note the CO2-PROPHET is still
primarily a “screening-type” model, and lacks some of the key features, such as gravity
override and compositional changes to fluid phases, available in more sophisticated
reservoir simulators.
5.6 ASSEMBLING THE COST MODEL. A detailed, up-to-date CO2-EOR Cost
Model was developed by the study. The model includes costs for: (1) drilling new wells
or reworking existing wells; (2) providing surface equipment for new wells; (3) installing
the CO2 recycle plant; (4) constructing a CO2 spur-line from the main CO2 trunkline to
the oil field; and, (5) various miscellaneous costs.
The cost model also accounts for normal well operation and maintenance (O&M),
for lifting costs of the produced fluids, and for costs of capturing, separating and
5-10 April 2005
reinjecting the produced CO2. A variety of CO2 purchase and reinjection costs options
are available to the model user. (Appendix B provides additional details on the Cost
Model for CO2-EOR prepared by this study.)
5.7 CONSTRUCTING AN ECONOMICS MODEL. The economic model used by
the study is an industry standard cash flow model that can be run on a either a pattern
or a field-wide basis. The economic model accounts for royalties, severance and ad
valorem taxes, as well as any oil gravity and market location discounts (or premiums)
from the “marker” oil price. A variety of oil prices are available to the model user. Table
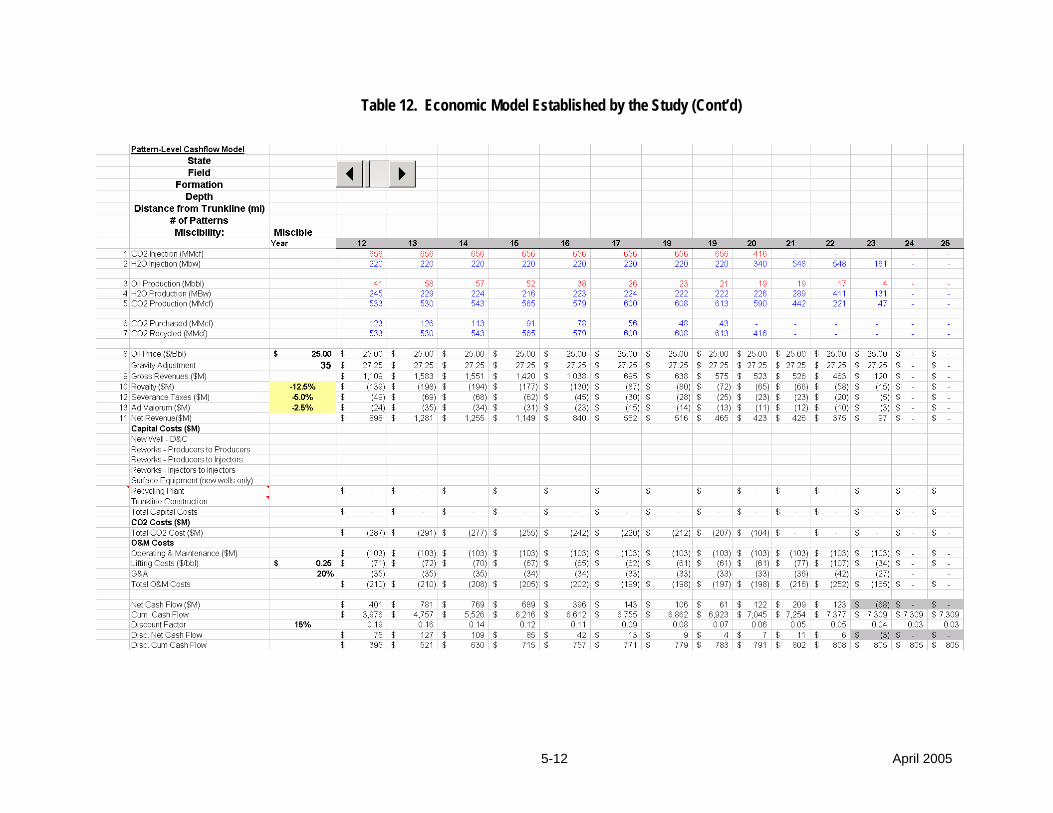
12 provides an example of the Economic Model for CO2-EOR used by the study.
5.8 PERFORMING SENSITIVITY ANALYSES. A series of sensitivity analyses
were prepared to better understand how differences in oil prices, CO2 supply costs and
financial risk hurdles could impact the volumes of oil that would be economically
produced by CO2-EOR from California’s oil basins and major oil reservoirs.
Two technology cases were examined. As discussed in more detail in Chapter 2, the study examined the application of two CO2-EOR options — “Traditional Practices” and “State-of-the-art” Technology.
Two oil prices were considered. A $25 per barrel oil price was used to represent the moderate oil price case; a $35 per barrel oil price was used to represent the availability of a variety of economic incentives and/or the continuation of the current high oil price situation.
Two CO2 supply costs were considered. The high CO2 cost was set at $1.25 per Mcf (5% of the oil price) to represent the costs of a new transportation system bringing natural CO2 to California’s oil basins. A lower CO2 supply cost equal to $0.50 per Mcf (2% of the oil price) was included to represent the potential future availability of low-cost CO2 from industrial and power plants as part of CO2 storage.
5-11 April 2005
Table 12. Economic Model Established by the Study
5-12 April 2005
Table 12. Economic Model Established by the Study (Cont’d)
5-13 April 2005
Table 12. Economic Model Established by the Study (Cont’d)
5-14 April 2005
Two minimum rate of return (ROR) hurdles were considered, a high ROR of 25%, before tax, and a lower 15% ROR, before tax. The high ROR hurdle incorporates a premium for the market, reservoir and technology risks inherent in using CO2-EOR in a new reservoir setting. The lower ROR hurdle represents application of CO2-EOR after the geologic and technical risks have been mitigated with a robust program of field pilots and demonstrations.
These various technology, oil price, CO2 supply cost and rate of return hurdles were combined into four scenarios, as set forth below: The first scenario captures how CO2-EOR technology has been applied and has
performed in the past. In this low technology, high risk scenario, called “Traditional
Practices”, there is little economically feasible potential in this oil producing region for
using CO2-EOR.
The second scenario, entitled “State-of-the-art”, assumes that the technology
progress in CO2-EOR, achieved in other areas, is successfully applied to the
geologically complex oil reservoirs of California. In addition, a comprehensive set of
research, pilot tests and field demonstrations help lower the risk inherent in applying
new technology to these complex oil reservoirs. However, because of limited
sources of CO2, these supply costs are high, equal to a per Mcf cost of 5% of the oil
price) and significantly hamper economic feasibility of using CO2-EOR.
The third scenario, entitled “Risk Mitigation,” examines how the economic potential of
CO2-EOR could be increased through a combination of state production tax
reductions, improved federal investment tax credits and federal/state royalty relief
that together would provide an equivalent of a $10 per barrel increase in the marker
price (WTI) of crude oil.
In the fourth scenario, entitled “Ample Supplies of CO2,” low-cost “EOR-ready” CO2
supplies (equal to a per Mcf cost of 2% of the oil price) are aggregated from various
high concentration CO2 vents and sources. These would be augmented, in the
longer-term, from low CO2 concentration industrial sources including combustion and
electric generation plants. Capture of industrial CO2 emissions would be part of
national efforts for reducing greenhouse gas emissions.
6-1 April 2005
6. RESULTS BY BASIN
6.1 SAN JOAQUIN BASIN. The San Joaquin Basin within Districts 4 and 5 is
located in central California, Figure 12. It is the dominant oil producing basin in
California, having produced or proven nearly 16 billion barrels of crude oil. Oil
production from this basin has steadily declined in recent years, Table 13.
Table 13. San Joaquin Basin Oil Production
Annual Oil Production
(MMBbls/Yr) (MBbls/D)
2000 217 596
2001 209 572
2002 206 564
2003(e) 200 548
Improved recovery projects provided the great bulk (123 million barrels) of the
basin’s oil production in 2002. Of this, 20 million barrels was from waterflooding and
gas injection. Two expansion waterflood projects (at Lost Hills and Elk Hills) were
approved in 2002.
San Joaquin Basin Oil Fields. While best known for its massive heavy oil
fields, such as Kern River and Midway-Sunset, the San Joaquin Basin also contains
large light oil fields that may be amenable to miscible CO2-EOR, such as:
Elk Hills, Stevens Coalinga, E. Extension, Nose Area Kettleman, N. Dome, Temblor Cuyama South, Homan
6-2 April 2005
Figure 12. California Oil Districts Containing the San Joaquin Basin
California Department of Conservation, Division of Oil, Gas and Geothermal Resources (2002).
JAF02318.PPT
SAN JOAQUINBASIN
6-3 April 2005
Assuming adequate oil prices and availability of low-cost CO2 supplies, these
four fields could serve as “anchors” for the initial CO2–EOR activity in the basin that
then could extend to other fields. The cumulative oil production, proved reserves and
remaining oil in-place (ROIP) in these four major “anchor” light oil reservoirs are
provided in Table 14.
Table 14. Status of San Joaquin Basin “Anchor” Fields/Reservoirs, 2001
Anchor Fields/Reservoirs
Cumulative Production (MMBbls)
Proved Reserves (MMBbls)
Remaining Oil In-Place (MMBbls)
1 Elk Hills (Stevens) 691 117 1,557
2 Coalinga, E. Extension (Nose Area) 468 4 464
3 Kettleman Dome, N. (Temblor) 407 2 891
4 Cuyama S. (Homan) 223 2 605
These four large “anchor” reservoirs, each with about 500 million (or more)
barrels of ROIP, are technically amenable for miscible CO2-EOR. Table 15 provides the
reservoir and oil properties for these reservoirs and their current secondary oil recovery
1 Elk Hills (Main Area/Upper) 3,000 22.5 Injecting 16 MMcf/d of gas annually
2 Fruitvale (Etchegoin-Chanac) 3,730 19 Injecting 12 MM barrels of water annually
3 Cymric (Phacoides/Carneros) 3,800 23 No appreciable activity
Past CO2-EOR Projects. Two CO2-EOR projects have been conducted in the
San Joaquin Basin, at North Coles Levee and at Lost Hills.
North Coles Levee. ARCO (now BP) initiated CO2 injection in the Stevens Sand
of the North Coles Levee field in 1981 through 1984. CO2 injection involved two
adjacent 10 acre patterns and one 10 acre line drive pattern:
6-5 April 2005
The CO2 was from a hydrogen plant at ARCO’s refinery. A total of 1.7 Bcf of CO2
was injected before loss of CO2 supply due to refinery closure.
The pilot was reported to have successfully mobilized oil in the CO2 swept area, in
the range of 15% to 20% HCPV.
However, problems with pattern balance and CO2 injection design led to high CO2 to
oil ratios, of 7 to 32 Mcf/barrel of oil produced.
Reservoir simulation indicated that a larger, more balanced CO2 slug of 62%
to 82% HCPV would have provided a considerably higher oil recovery, as shown in
Table 17.
Table 17. Reservoir Simulation of Oil Recovery vs. CO2 Injection, N. Coles Levee
CO2 Injection (% HCPV)
Oil Recovery (% OOIP)
Oil Recovery Efficiency (Mcf CO2/Bbl)
41% 13.2-15.4% 5.5-6.4
62% 16.7-18.5% 6.9-7.5
82% 19.9-20.7% 7.6-8.6
Lost Hills. In 2000, ChevronTexaco initiated a pilot water alternating gas (WAG)
CO2 injection project in the Lost Hills field. During its life, 1.9 Bcf of CO2 was injected
into the Etchegoin oil reservoir. The project was suspended in 2002, after a two year
assessment period.
Future CO2-EOR Potential. The San Joaquin Basin contains 24 large deep
light oil reservoirs that are candidates for miscible CO2-EOR technology. In addition,
the basin has 5 large moderately deep, moderately heavy oil reservoirs that could
benefit from immiscible CO2–EOR. The potential for economically developing these oil
reservoirs is examined first under Base Case financial criteria that combine an oil price
6-6 April 2005
of $25 per barrel, CO2 supply costs of 5% of oil price ($1.25/Mcf), and a high risk rate of
return (ROR) hurdle (25% before tax).
Under “Traditional Practices”, involving miscible EOR with a modest volume CO2
injection, the technical and economic potential for CO2-EOR in the San Joaquin Basin is
low. With Base Case financial conditions, only 3 of the 24 light oil reservoirs are
economic, providing 50 million barrels of additional oil recovery from the San Joaquin
Basin.
Applying “State-of-the-art” technology, involving miscible EOR, with high volume
CO2 injection and immiscible CO2-EOR, the technically recoverable potential for CO2-
EOR increases to over 2 billion barrels. The use of “State-of-the-art” CO2 miscible EOR
technology and immiscible CO2 in heavy oil fields (with a lower investment rate of return
hurdle of 15% before tax), enables over 1 billion barrels to become economically
recoverable. The number of economically favorable oil reservoirs increase to 15 (out of
29), Table 18.
Table 18. Economic Oil Recovery Potential Under Base Case Financial Conditions, San Joaquin Basin.
Economic Potential
CO2-EOR Technology
No. of Reservoirs
Studied
Original Oil In-Place (MMBbls)
Technical Potential (MMBbls)
(No. of Reservoirs) (MMBbls)
“Traditional Practices” 24 8,906 860 3 50
“State of Art Technology” 29 11,909 2,040 15 1,060
Improved financial conditions consisting of “risk mitigation” and lower-cost CO2
supplies would significantly increase the economically recoverable oil volumes from the
San Joaquin Basin, particularly when applied with “State-of-the-art” CO2-EOR
Technology. With the benefit of these more favorable financial conditions, up to 1,780
million barrels of additional oil (in 24 major oil reservoirs) would become economically
recoverable from the San Joaquin Basin, Table 19.
6-7 April 2005
Table 19. Economic Oil Recovery Potential with More Favorable Financial Conditions, San Joaquin Basin
More Favorable Conditions No. of
Economic Reservoirs Economic Potential
(MMBbls)
Plus: “Risk Mitigation”* 21 1,380
Plus: Low Cost CO2** 24 1,780 *Assumes an equivalent of $10 per barrel is added to the oil price, adjusted for market factors **Assumes reduced CO2 supply costs of 2% of oil price or $0.70 per Mcf
6.2 LOS ANGELES BASIN. The Los Angeles Basin within District 1
encompasses the southern portion of California, Figure 13. Oil production in this basin
has remained steady due to waterflooding, Table 20.
Table 20. Los Angels Basin Oil Production
Annual Oil Production
(MMBbls/Yr) (MBbls/D)
2000 16.9 46
2001 16.8 46
2002 16.9 46
2003(e) 16.7 46
The great bulk of the oil currently produced in the Los Angeles Basin is
incremental oil from the application of improved recovery. For example, of the 16.9
million barrels of total oil produced in 2002, about 13 million barrels was due to
waterflooding. The two largest waterfloods are in the Wilmington Field with 372 million
barrels of annual water injection and in the Inglewood Field with 90 million barrels of
annual water injection. Two new waterflooding expansions were approved in year
2002, both for the Inglewood Field.
6-8 April 2005
Figure 13. California Oil District Containing the Los Angeles Basin
California Department of Conservation, Division of Oil, Gas and Geothermal Resources (2002).
JAF02318.PPT
LOS ANGELESBASIN
6-9 April 2005
Los Angeles Basin Oil Fields. The Los Angeles Basin contains a number of
world scale light oil fields that may be amenable to miscible CO2- EOR, such as:
Santa Fe Springs Dominguez
These two major oil fields could serve as the “anchor” sites for the initial CO2
projects that could later extend to other fields in the basin. The cumulative oil
production, proved reserves and remaining oil in-place (ROIP) for these two major
“anchor” light oil reservoirs are set forth in Table 21.
Table 21. Status of Los Angeles Basin “Anchor” Fields/Reservoirs, 2001
Anchor Fields/Reservoirs
Cumulative Production (MMBbls)
Proved Reserves (MMBbls)
Remaining Oil In-Place (MMBbls)
1 Santa Fe Springs (Main Area) 624 10 1,976
2 Dominquez (Plio-Miocene) 274 5 403
These two large “anchor” reservoirs, one with nearly 2,000 million barrels of
ROIP, are amenable to CO2-EOR. Table 22 provides the reservoir and oil properties for
these two reservoirs and their current secondary oil recovery activities.
Table 22. Reservoir Properties and Improved Oil Recovery Activity,
“Anchor” Oil Fields/Reservoirs
Depth Oil
Gravity
Anchor Fields/Reservoirs (ft) (°API) Active Waterflood or Gas Injection
1 Santa Fe Springs (Main Area) 5,400 33 Injecting 27 MM barrels of water annually.
2 Dominquez (Pliocene-Miocene) 4,000 30 No appreciable activity
6-10 April 2005
In addition to the two “anchor” light oil reservoirs, numerous relatively deep and
moderately heavy oil fields exist in the Los Angeles Basin. Prior experience with CO2
injection in certain of these fields, using immiscible CO2-EOR, indicates that these fields
could become “secondary target” fields for immiscible CO2-EOR.
Two such “secondary target” fields, each with 500 million barrels or more of
OOIP, are shown on Table 23. These two fields may be amenable to immiscible CO2-
EOR based on their reservoir properties and their positive response to waterflooding.
Table 23. Reservoir Properties and Improved Oil Recovery Activity, Los Angeles Basin
“Secondary Target” Oil Fields/Reservoirs
Depth
Secondary Fields/Reservoirs (ft)
Oil Gravity (°API) Active Waterflood or Gas Injection
1 Brea Olinda (Pliocene-Miocene) 3,240 18.4 Injecting 3.0 MM barrels of water annually
2 Torrance (Main) 3,740 19 Injecting 0.4 MM barrels of water annually
Access and environmental issues would need to be fully examined to establish
how much of the potential in the “anchor” or “secondary target” oil fields could be
developed with CO2-EOR in the Los Angeles Basin.
Past CO2-EOR Projects. The Los Angeles Basin has also seen an active
history of CO2 based enhanced oil recovery.
Wilmington. The Long Beach Oil Development company initiated an immiscible
CO2 project in the Fault Block Tar Zone (14 °API reservoir oil at 2,300 feet) of the
Wilmington field, in 1982 through 1987. The CO2 flood was a 330 acre project involving
42 producing wells and 8 injection wells in a line drive pattern.
The CO2 was from the stack gas of the hydrogen units at Texaco’s Wilmington
refinery.
The injected gas contained 85% CO2 and 15% N2.
6-11 April 2005
A total of 8.2 Bcf of gas (7 Bcf of CO2) was injected in 4 years; recycling of produced
gas continued through 1987.
The project recovered an estimated 488,000 barrels of oil through August 1987.
According to the technical report, this immiscible CO2-EOR project injected only
about one third of the “ideal” volume of CO2. Reservoir analysis by the company
indicated that a larger volume of CO2, additional injection wells, and a modified WAG
ratio would have significantly improved results, Table 24.
Table 24. Oil Recovery vs. Volume of CO2 Injection
CO2 Injection Oil Recovery Oil Recovery
Efficiency (Bcf) (MBbls) (Mcf CO2/Bbl)
Actual: 7 488 14.3
Ideal: 23 6,660* 3.5 *Equal to 9.8% 00IP
Other CO2 Injection Projects. Four additional CO2 injection projects are reported
by the State of California and briefly discussed in the technical literature:
East Coyote, Huadle Dome Unit: this CO2 WAG project started in 1982 and stopped
in 1984, with 183 MMcf CO2 injected.
Huntington Beach, Onshore Area A-37: this cyclic CO2 project started in 1981 and
stopped in 1982, with 183 MMcf CO2 injected.
Wilmington, Fault Block I Ranger: this CO2 WAG project started in 1983 and stopped
in 1986, with 2,330 MMcf CO2 injected.
Wilmington, Fault Block III Tar: this CO2 WAG project started in 1981 and stopped in
1996, with 3,490 MMcf CO2 injected.
6-12 April 2005
Future CO2-EOR Potential. The Los Angeles Basin contains 15 large light oil
reservoirs, such as Dominquez (Pliocene) and Santa Fe Springs (Main Area) that are
candidates for miscible CO2-EOR. In addition, the basin has 21 large moderately deep,
moderately heavy oil fields, such as Huntington Beach and Torrance that have low oil
recoveries and could benefit from enhanced oil recovery.
Under “Traditional Practices” (and Base Case financial conditions, defined
above), there are no economically attractive oil reservoirs for miscible CO2 flooding in
the Los Angeles Basin. Applying “State-of-the-art Technology” (involving higher volume
CO2 injection and immiscible EOR) (and a lower investment rate of return hurdle of
15%, before tax), the number of economically favorable oil reservoirs the Los Angeles
Basin increases to 14, providing 700 million barrels of additional oil recovery, Table 25.
Table 25. Economic Oil Recovery Potential Under
Base Case Financial Conditions, Los Angeles Basin.
Economic Potential
CO2-EOR Technology
No. of Reservoirs
Studied
Original Oil In-Place (MMBbls)
Technical Potential (MMBbls)
(No. of Reservoirs) (MMBbls)
“Traditional Practices” 15 7,828 470 - -
“State of Art Technology” 36 14,072 1,490 14 700
Improved financial conditions, consisting of “risk mitigation” and of lower-cost
CO2 supplies, would significantly increase the economical volumes of oil that could be
produced by CO2-EOR from the Los Angeles Basin (when combined with “State-of-the-
art” CO2-EOR technology). With the benefit of more favorable financial conditions, up to
1,370 million barrels of additional economic oil recovery (from 28 major oil reservoirs)
would be possible in the Los Angeles Basin, Table 26.
6-13 April 2005
Table 26. Economic Oil Recovery Potential with More Favorable Financial Conditions, Los Angeles Basin
More Favorable Financial Conditions No. of Reservoirs (Million Bbls)
Plus: “Risk Mitigation”* 22 1,290
Plus: Low Cost CO2** 28 1,370 *Assumes an equivalent of $10 per barrel is added to the oil price, adjusted for market factors **Assumes reduced CO2 supply costs of 2% of oil price or $0.70 per Mcf
6.3 COASTAL BASIN. The Coastal Basin within Districts 2 and 3 is on the
western coastline of California, stretching from the northern border of Los Angeles to
the southern border of the San Francisco Bay area, Figure 14. Oil and gas production
in this basin has steadily declined during recent years, Table 27.
Table 27. Coastal Basin Oil Production
Annual Oil Production
(MMBls/Yr) (MBbls/D)
2000 14.1 39
2001 13.5 37
2002 13.3 36
2003(e) 13.0 36
The Coastal Basin has seen a moderately active program of secondary oil
recovery. Of the 13.3 million barrels of oil produced in 2002, about 4 million barrels was
due to waterflooding. The largest current waterflood project in the basin is in the
Ventura oil field, with 45.6 million barrels of water injected in 2002. No new improved oil
recovery projects were approved in year 2002.
6-14 April 2005
Figure 14. California Oil Districts Containing the Coastal Basin
California Department of Conservation, Division of Oil, Gas and Geothermal Resources (2002).
JAF02318.PPT
COASTAL BASIN
COASTAL BASIN
6-15 April 2005
Coastal Basin Oil Fields. The Coastal Basin contains two large mature light oil
fields that are being produced by waterflooding, and thus may be amenable to miscible
CO2-EOR:
Ventura San Miguelito
These two fields could serve as the “anchor” sites for the initial CO2–EOR
projects in the basin that could later be extended to other fields. The cumulative oil
production, proved reserves and remaining oil in place (ROIP) for these two “anchor”
light oil fields are set forth in Table 28.
Table 28. Status of Coastal Basin “Anchor” Fields/Reservoirs, 2001
Anchor Fields/Reservoirs
Cumulative Production (MMBbls)
Proved Reserves (MMBbls)
Remaining Oil In Place (MMBbls)
1 Ventura (All reservoirs) 964 48 2,310
2 San Miguelito (All reservoirs) 113 25 169
These two large “anchor” fields, one with over 2,000 million barrels of ROIP, may
be favorable for miscible CO2 -EOR, based on their reservoir properties, Table 29.
2 San Miguelito (all) 5,000-8,410 30-31 Injecting 5 MMB annually
6-16 April 2005
Past CO2-EOR Projects. A pilot CO2 injection project was initiated in the
Ventura field, D-6 (c) reservoir in 1988, with 215 MMcf of CO2 injected. No further
results are publicly reported.
Future CO2-EOR Potential. The Coastal Basin (Santa Maria and Ventura
basins) contains 20 large deep light oil reservoirs that are candidates for miscible CO2-
EOR. In addition, the basin has 3 large moderately deep, moderately heavy oil
reservoirs that are candidates for immiscible CO2-EOR.
Using “Traditional Practices” would not enable the “stranded oil” in the Coastal
Basin to become economic. Using “State-of-the-art” technology (and a lower
investment rate of return hurdle of 15%, before tax) would enable 3 reservoirs in the
Coastal Basin to become economically favorable for CO2 flooding, Table 30.
Table 30. Economic Oil Recovery Potential Under Current Conditions, Coastal Basin.
Economic Potential
CO2-EOR Technology
No. of Reservoirs
Studied
Original Oil In-Place (MMBbls)
Technical Potential (MMBbls)
(No. of Reservoirs) (MMBbls)
“Traditional Practices” 20 4,692 450 - -
“State of Art Technology” 23 5,883 1,090 3 70
Improved financial conditions of “risk mitigation” and lower cost CO2 supplies
would enable CO2-EOR in the Coastal Basin to recover up to 830 million barrels of oil
(from 16 major reservoirs), Table 31.
Table 31. Economic Oil Recovery Potential with More Favorable Financial Conditions, Coastal Basin
More Favorable Financial Conditions No. of
Economic Reservoirs Economic Potential
(MMBbls)
Plus: “Risk Mitigation”* 16 830
Plus: Low Cost CO2** 16 830 *Assumes an equivalent of $10 per barrel is added to the oil price, adjusted for market factors **Assumes reduced CO2 supply costs of 2% of oil price or $0.70 per Mcf
Appendix A
Using CO2-PROPHET for Estimating Oil Recovery
A-1 April 2005
Model Development
The study utilized the CO2-PROPHET model to calculate the incremental oil
produced by CO2-EOR from the large California oil reservoirs. CO2-PROPHET was
developed by the Texaco Exploration and Production Technology Department (EPTD)
as part of the DOE Class I cost share program. The specific project was “Post
Waterflood CO2 Flood in a Light Oil, Fluvial Dominated Deltaic Reservoir” (DOE
Contract No. DE-FC22-93BC14960). CO2-PROPHET was developed as an alternative
to the DOE’s CO2 miscible flood predictive model, CO2PM.
Input Data Requirements
The input reservoir data for operating CO2-PROPHET are from the Major Oil
Reservoirs Data Base. Default values exist for input fields lacking data. Key reservoir
properties that directly influence oil recovery are:
Residual oil saturation, Dykstra-Parsons coefficient, Oil and water viscosity, Reservoir pressure and temperature, and Minimum miscibility pressure.
A set of three relative permeability curves for water, CO2 and oil are provided (or
can be modified) to ensure proper operation of the model.
Calibrating CO2-PROPHET
The CO2-PROPHET model was calibrated by Advanced Resources with an
industry standard reservoir simulator, GEM. The primary reason for the calibration was
to determine the impact on oil recovery of alternative permeability distributions within a
multi-layer reservoir. A second reason was to better understand how the absence of a
gravity override function in CO2-PROPHET might influence the calculation of oil
recovery. CO2-PROPHET assumes a fining upward permeability structure.
A-2 April 2005
The San Joaquin Basin‘s Elk Hills (Stevens) reservoir data set was used for the
calibration. The model was run in the miscible CO2-EOR model using one hydrocarbon
pore volume of CO2 injection.
The initial comparison of CO2-PROPHET with GEM was with fining upward and
coarsening upward (opposite of fining upward) permeability cases in GEM. All other
reservoir, fluid and operational specifications were kept the same. As Figure A-1
depicts, the CO2-PROPHET output is bounded by the two GEM reservoir simulation
cases of alternative reservoir permeability structures in an oil reservoir.
A second comparison of CO2-PROPHET and GEM was for randomized
permeability (within the reservoir modeled with multiple layers). The two GEM cases
are High Random, where the highest permeability value is at the top of the reservoir,
and Low Random, where the lowest permeability is at the top of the reservoir. The
permeability values for the other reservoir layers are randomly distributed among the
remaining layers. As Figure A-2 shows, the CO2-PROPHET results are within the
envelope of the two GEM reservoir simulation cases of random reservoir permeability
structures in an oil reservoir.
Based on the calibration, the CO2-PROPHET model seems to internally
compensate for the lack of a gravity override feature and appears to provide an average
calculation of oil recovery, neither overly pessimistic nor overly optimistic. As such,
CO2-PROPHET seems well suited for what it was designed — providing project scoping
and preliminary results to be verified with more advanced evaluation and simulation
models.
Comparison of CO2-PROPHET and CO2PM
According to the CO2-PROPHET developers, the model performs two main
operations that provide a more robust calculation of oil recovery than available from
Figure A-2. CO2-PROPHET and GEM: Comparison to Random Permeability Cases of GEM
JAF0
2318
.PPT
A-4 April 2005
CO2-PROPHET generates streamlines for fluid flow between injection and production wells, and
The model then performs oil displacement and recovery calculations along the streamlines. (A finite difference routine is used for the oil displacement calculations.)
Other key features of CO2-PROPHET and its comparison with the technical
capability of CO2PM are also set forth below: Areal sweep efficiency in CO2-PROPHET is handled by incorporating
streamlines that are a function of well spacing, mobility ratio and reservoir heterogeneity, thus eliminating the need for using empirical correlations, as incorporated into CO2PM.
Mixing parameters, as defined by Todd and Longstaff, are used in CO2-PROPHET for simulation of the miscible CO2 process, particularly CO2/oil mixing and the viscous fingering of CO2.
A series of reservoir patterns, including 5 spot, line drive, and inverted 9 spot, among others, are available in CO2-PROPHET, expanding on the 5 spot only reservoir pattern option available in CO2PM.
CO2-PROPHET can simulate a variety of recovery processes, including continuous miscible CO2, WAG miscible CO2 and immiscible CO2, as well as waterflooding. CO2PM is limited to miscible CO2.
Appendix B
California CO2-EOR Cost Model
B-1 April 2005
Cost Model for CO2-Based Enhanced Oil Recovery (CO2-EOR) This appendix provides documentation for the cost module of the desktop CO2-EOR policy and analytical model (COTWO) developed by Advanced Resources for DOE/FE-HQ. The sections of this cost documentation report are organized according to the normal sequence of estimating the capital and operating expenditures for a CO2-EOR project: 1. Well Drilling and Completion Costs. The costs for well drilling and completion (D&C) are based on the 2001 JAS cost study recently published by API for California. The well D&C cost equation has a fixed cost constant for site preparation and other fixed cost items and a variable cost equation that increases exponentially with depth. The total equation is: Well D&C Costs = a0 + a1Da2 Where: a0 = $20,000 (fixed) a1 ranges from 0.07 to 0.10, depending on depth a2 ranges from 1.81 to 1.84, depending on depth D is well depth Figure B-1 provides the details for the cost equation and illustrates the “goodness of fit” for the well D&C cost equation for California.
2. Lease Equipment Costs for New Producing Wells. The costs for equipping a new oil production well are based on data reported by the EIA in their 2002 EIA “Cost and Indices for Domestic Oil and Gas Field Equipment and Production Operations” report. This survey provides estimated lease equipment costs for 10 wells producing with artificial lift, from depths ranging from 2,000 to 12,000 feet, into a central tank battery.
The equation contains a fixed cost constant for common cost items, such as free water knock-out, water disposal and electrification, and a variable cost component to capture depth-related costs such as for pumping equipment. The total equation is:
Production Well Equipping Costs = c0 + c1D Where: co = $111,126 (fixed) c1 = $3.22 per foot D is well depth Figure B-2 illustrates the application of the lease equipping cost equation for a
new oil production well as a function of depth.
Figure B-2 – Lease Equipping Cost for a New Oil Production Well in California vs. Depth
y = 3.2198x + 111126R2 = 0.873
0
20,000
40,000
60,000
80,000
100,000
120,000
140,000
160,000
180,000
200,000
0 2,000 4,000 6,000 8,000 10,000 12,000 14,000
Depth, ft
Tota
l Cos
ts, U
S$
B-3 April 2005
3. Lease Equipment Costs for New Injection Wells. The costs for equipping a new injection well in California include gathering lines, a header, electrical service as well as a water pumping system. The costs are estimated from the EIA Cost and Indices Report.
Equipment costs include a fixed cost component and a depth-related cost component, which varies based on surface pressure requirements. The equation for California is:
Injection Well Equipping Costs = c0 + c1D Where: co = $7,002 (fixed)
c1 = $27.50 per foot D is well depth
Figure B-3 illustrates the application of the lease equipping cost equation for a new injection well as a function of depth for West Texas. The West Texas cost data for lease equipment provides the foundation for the California cost equation.
Figure B-3 – Lease Equipping Costs for a New Injection Well in West Texas vs. Depth
W TX 1.00 1.00 8,246 14.19 CA 0.85 1.94 7,002 27.50 RM 1.24 0.95 10,189 13.49 S TX 1.48 1.23 12,194 17.42 LA 1.70 1.15 14,036 16.35 OK 1.13 1.16 9,357 16.44
Ratio to W. TX
B-4 April 2005
4. Converting Existing Production Wells into Injection Wells. The conversion of existing oil production wells into CO2 and water injection wells requires replacing the tubing string and adding distribution lines and headers. The costs assume that all surface equipment necessary for water injection are already in place on the lease.
The existing well conversion costs include a fixed cost component and a depth-related cost component, which varies based on the required surface pressure and tubing length. The equation for California is:
Well Conversion Costs = c0 + c1D Where: co = $8,307 (fixed)
c1 = $7.05 per foot D is well depth
Figure B-4 illustrates the average cost of converting an existing producer into an injection well for West Texas. The West Texas cost data for converting wells provide the foundation for the California cost equation.
Figure B-4 – Cost of Converting Existing Production Wells into Injection Wells in West Texas vs. Depth
US$ US$/ftW TX 1.00 1.00 9,782 3.64 CA 0.85 1.94 8,307 7.05 RM 1.24 0.95 12,088 3.46 S TX 1.48 1.23 14,466 4.46 LA 1.70 1.15 16,651 4.19 OK 1.13 1.16 11,101 4.21
Ratio to W. TX
B-5 April 2005
5. Costs of Reworking an Existing Waterflood Production or Injection Well for CO2-EOR (First Rework). The reworking of existing oil production or CO2-EOR injection wells requires pulling and replacing the tubing string and pumping equipment. The well reworking costs are depth-dependent. The equation for California is:
Well Rework Costs = c1D Where: c1 = $28.20 per foot)
D is well depth Figure B-5 illustrates the average cost of well conversion as a function of depth for West Texas. The West Texas cost data for reworking wells provides the foundation for the California cost equation.
y = 14.549xR2 = 0.9607
0
20,000
40,000
60,000
80,000
100,000
120,000
140,000
0 1000 2000 3000 4000 5000 6000 7000 8000 9000
Depth, ft
Cos
ts, U
S$
ReworkLinear (Rework)
Figure B-5 – Cost of Reworking an Existing Waterflood Production or Injection Well for CO2-EOR in West Texas vs. Depth
Basin co c1 co c1US$ US$/ft
W TX 1.00 1.00 0 14.55 CA 0.85 1.94 0 28.20 RM 1.24 0.95 0 13.84 S TX 1.48 1.23 0 17.87 LA 1.70 1.15 0 16.77 OK 1.13 1.16 0 16.87
Ratio to W. TX
B-6 April 2005
6. Annual O&M Costs, Including Periodic Well Workovers. The EIA Cost and Indices report provides secondary operating and maintenance (O&M) costs only for West Texas. As such, West Texas and California primary oil production O&M costs (Figure B-6) are used to estimate California secondary recovery O&M costs. Linear trends are used to identify fixed cost constants and variable cost constants for each region, Table B-1.
Table B-1 – Regional Lease O&M Costs and Their Relationship to West Texas
California OklahomaSouth Louisiana South TexasWest Texas Rocky MountainsLinear (California) Linear (South Louisiana)Linear (West Texas) Linear (Oklahoma)Linear (South Texas) Linear (Rocky Mountains)
Figure B-6 – Annual Lease O&M Costs for Primary Oil Production by Area
B-7 April 2005
To account for the O&M cost differences between waterflooding and CO2-EOR, two adjustments are made to the EIA’s reported O&M costs for secondary recovery. Workover costs, reported as surface and subsurface maintenance, are doubled to reflect the need for more frequent remedial well work in CO2-EOR projects. Liquid lifting are subtracted from annual waterflood O&M costs to allow for the more rigorous accounting of liquid lifting volumes and costs for CO2-EOR. (Liquid lifting costs for CO2-EOR are discussed in a later section of this appendix.) Figure B-7 shows the depth-relationship for CO2-EOR O&M costs in West Texas. These costs were adjusted to develop O&M for California, shown in the inset of Figure B-7. The equation for California is:
W TX 1.00 1.00 18,700 7.39 CA 0.85 1.94 15,880 14.33 RM 1.24 0.95 23,108 7.03 S TX 1.48 1.23 27,655 9.08 LA 1.70 1.15 31,833 8.52 OK 1.13 1.16 21,221 8.57
Ratio to W. TX
B-8 April 2005
7. CO2 Recycle Plant Investment Cost. Operation of CO2-EOR requires a recycling plant to capture and reinject the produced CO2. The size of the recycle plant is based on peak CO2 production and recycles requirements.
The cost of the recycling plant is set at $700,000 per MMcf/d of CO2 capacity. As such, small CO2-EOR project in the Stevens formation of the Asphalto field, with 20 MMcf/d of CO2 reinjection, will require a recycling plant costing $14.3 million. A large project in the Stevens formation of the Elk Hills field, with 810 MMcf/d of CO2 reinjection and 502 injectors, requires a recycling plant costing $567 million.
The model has three options for installing a CO2 recycling plant. The default
setting costs the entire plant one year prior to CO2 breakthrough. The second option places the full CO2 recycle plant cost at the beginning of the project (Year 0). The third option installs the CO2 recycle plant in stages. In this case, half the plant is built (and half the cost is incurred) in the year of CO2 breakthrough. The second half of the plant is built when maximum recycle capacity requirements are reached. 8. Other COTWO Model Costs. a. CO2 Recycle O&M Costs. The O&M costs of CO2 recycling are indexed to energy costs and set at 1% of the oil price ($0.25 per Mcf @ $25 Bbl oil). b. Lifting Costs. Liquid (oil and water) lifting costs are calculated on total liquid production and costed at $0.25 per barrel. This cost includes liquid lifting, transportation and re-injection. c. CO2 Distribution Costs. The CO2 distribution system is similar to the gathering systems used for natural gas. A distribution “hub” is constructed with smaller pipelines delivering purchased CO2 to the project site.
The distribution pipeline cost is dependent on the injection requirements for the project. The fixed component is $150,000. The variable cost component accounts for increasing piping diameters associated with increasing CO2 injection requirements. These range from $80,000 per mile for 4” pipe (CO2 rate less than 15MMcf/d), $120,000 per mile for 6” pipe (CO2 rate of 15 to 35 MMcf/d), $160,000 per mile for 8” pipe (CO2 rate of 35 to 60 MMcf/d), and $200,000 per mile for pipe greater than 8” diameter (CO2 rate greater than 60 MMcf/d). Aside from the injection volume, cost also depends on the distance from the CO2 “hub” (transfer point) to the oil field. Currently, the distance is set at 10 miles.
The CO2 distribution cost equation for California is: Pipeline Construction Costs = $150,000 + CD*Distance Where: CD is the cost per mile of the necessary pipe diameter (from the CO2
injection rate) Distance = 10.0 miles
B-9 April 2005
d. G&A Costs. General and administrative (G&A) costs of 20% are added to well O&M and lifting costs.
e. Royalties. Royalty payments are assumed to be 12.5%.
f. Production Taxes. Severance and ad valorum taxes are set at 5.0% and 2.5%, respectively, for a total production tax of 7.5% on the oil production stream. Production taxes are taken following royalty payments.
g. Crude Oil Price Differential. To account for market and oil quality (gravity) differences on the realized oil price, the cost model incorporated the current basis differential for California ($1 per barrel) and the current gravity differential (-$0.25 per °API, from a basis of 30 °API) into the average wellhead oil price realized by each oil reservoir. The equation for California is:
Wellhead Oil Price = Oil Price + $1.00 – [$0.25*(30 -°API)] Where: Oil Price is the marker oil price (West Texas intermediate)
°API is oil gravity If the oil gravity is less than 30 °API, the wellhead oil price is reduced; if the oil gravity is greater than 30 °API, the wellhead oil price is increased.