Page 1
In Reply Refer To: WTR-7
Andra Samoa, CEO
American Samoa Power Authority
P.O. Box PPB
Pago Pago, AS 96799
Re: September 28-29, 2010 Clean Water Act Inspections
Dear Ms. Samoa:
Enclosed is the June 10, 2011 report for our September 28-29 diagnostic inspection of the
American Samoa Power Authority (“ASPA”), Tutuila Island sewage treatment works.
We found that in 2010 the ASPA wastewater utility functioned largely as designed and
up to capability just as it did in the year before, however with two significant improvements.
First, a first-time assessment of sewer rates now links funding for utility operations to sewer
service. Second, ASPA has an increased engineering capability to better execute capital
improvement projects. Overall, the sewage treatment plants and their sewer collections systems
continue to be well run and maintained; the staff is trained, largely experienced, and fully
capable to successfully operate and maintain plant and equipment. The only detrimental
difference from the year before was the tsunami-related damage sustained at three lift stations.
Future compliance largely depends on (1) whether the NPDES permits are reissued with
their 301(h) waivers intact, (2) how the water quality standards will be measured, and (3) future
installation of disinfection. Tentative waiver denials were issued last year but the final decisions
have not yet been reached. Without the waivers, compliance with future NPDES permits would
depend on extensive capital outlays to upgrade treatment to full secondary.
The main requirements and recommendations of this inspection are summarized below:
ASPA must complete the rehabilitation of the Malaloloa, Satala, and Korea House
lift station, and of the Utulei Clarigester #1.
ASPA should consider reinstating formal staff training through courses in the
operation and maintenance of plant and equipment.
Sewage sludges must be self-monitored and the results reported at least once per year.
Sewage spills must be reported as bypasses of treatment necessary to comply.
The water quality standards for nutrients would better apply to the sewage treatment
plant outfall discharges as NPDES permit effluent limits.
UNITED STATES ENVIRONMENTAL PROTECTION AGENCY REGION IX
75 Hawthorne Street San Francisco, CA 94105
June 10, 2011
Page 2
ASPA should install disinfection at both sewage treatment plants and consider non-
chlorine methods such as on-site bleach generation from salt brine reduction.
Self-monitoring for both sewage treatment plants should also include total nitrogen,
total phosphorus, ammonia, enterococci, and eventually chlorine residual.
The critical initial dilution factors for both ocean outfalls and the expected peak flows
through the outfalls should be verified.
I appreciate the helpfulness extended to me by the ASPA staff during this inspection.
Please do not hesitate to call me at (415) 972-3504, or e-mail [email protected] .
Sincerely,
Greg V. Arthur
cc: Fai Mareko, Wastewater Operations Manager, ASPA
LT Matt Vojic, USPHS, American Samoa EPA
Original signed by:
Greg V. Arthur
Page 3
NPDES DIAGNOSTIC EVALUATION INSPECTION
NPDES Permittee: American Samoa Power Authority
Fogagogo-Tafuna Sewage Treatment Plant and Ocean Outfall
Serving the Southwestern Tutuila Island Sewer Collection System
(NPDES Permit No. AS0020010)
Utulei Sewage Treatment Plant and Harbor Outfall
Serving the Pago Pago Harbor Sewer Collection System
(NPDES Permit No. AS0020001)
Dates of Inspection: 09/28/2010 Utulei Sewage Treatment Plant Inspection
09/28/2010 Sewer Collection System Inspection
09/29/2010 Fogagogo-Tafuna Sewage Treatment Plant Inspection
Inspection Participants:
US EPA: Greg V. Arthur, CWA Compliance Office, (415) 972-3504
American Samoa EPA: LT Lyle Setwyn, Technical Services Representative (684) 731-1326
ASPA: Fai Mareko, Wastewater Mgr, (684) 733-6132
Lino Ameperosa, Mechanic and Electrician Foreman, (684) 770-1613
Naseri Fiso, WW Services Dept, Lab Technician, (684) 633-5753
Report Prepared By: Greg V. Arthur, Environmental Engineer, USEPA Region 9
June 10, 2011
U.S. ENVIRONMENTAL PROTECTION AGENCY
REGION 9
CLEAN WATER ACT COMPLIANCE OFFICE
Page 4
American Samoa Power Authority - Wastewater Services Division
Page 2 of 32
Table of Contents
1.0 Scope and Purpose . . . . . . . . . . . . . . . . . . . . . . . . . . . . . . . . . . . . . . . . . . . . . . . .
1.1 Wastewater Facilities Plan
1.2 Description of the Sewer Service Area
1.3 NPDES Permits
2.0 Description of Wastewater Treatment Plant and Equipment . . . . . . . . . . . . . . . . . .
Summary, Requirements and Recommendation
2.1 Tafuna Sewage Treatment Plant
2.2 Utulei Sewage Treatment Plant
2.3 Sewer Collection Systems
2.4 Point(s) of Compliance
2.5 Photo Documentation
3.0 Description of Wastewater Operations and Maintenance . . . . . . . . . . . . . . . . . . . . . . .
Summary, Requirements and Recommendations
3.1 Operation and Maintenance Procedures
3.2 Training and Staffing
3.3 Budgeting
4.0 Wastewater Treatment Performance . . . . . . . . . . . . . . . . . . . . . . . . . . . . . . .
Summary, Requirements and Recommendations
4.1 NPDES Permit Limits for Tafuna
4.2 NPDES Permit Limits for Utulei
4.3 Collection Systems Spills
4.4 Federal Sewage Sludge Disposal Limits
4.5 Critical Initial Dilution Factors
Appendices . . . . . . . . . . . . . . . . . . . . . . . . . . . . . . . . . . . . . . . . . . . . . . . . . . . . . . . . . . . . .
Table 1 - NPDES Permit and Sludge Limits for Tafuna WWTP
Table 2 - NPDES Permit Limits for Utulei WWTP
Table 3 - Compliance with NPDES Permit and Sludge Limits at Tafuna
Table 4 - Compliance with NPDES Permit Limits at Utulei
Table 5 - Priority Pollutants and General Constituents for Tafuna
Table 6 - Priority Pollutants and General Constituents for Utulei
Table 7 - Six-Year Receiving Water Monitoring for Tafuna
Table 8 - Six-Year Receiving Water Monitoring for Utulei
page 3
3
4
5
page 6
6
6
7
8
9
11
page 16
16
16
17
18
page 19
19
20
21
22
23
24
page 25
25
26
27
28
29
30
31
32
Page 5
American Samoa Power Authority - Wastewater Services Division
Page 3 of 32
1.0 Scope and Purpose
On September 28-29, 2010, EPA conducted an NPDES diagnostic evaluation inspection of
the American Samoa Power Authority (“ASPA”), Tutuila Island sewage treatment works.
The purpose of this evaluation inspection was to ensure compliance with the two controlling
NPDES permits and to reassess the operational capability of the public utility to provide
sewage collection and treatment now and in the future.
This report covers the two principal publicly-owned treatment works on Tutuila Island
owned and operated by ASPA, one serving the Pago Pago harbor area, and the other serving
the airport, the business park, community college, and domestic structures in the Tafuna
plains. This report covers the findings and assessments pertaining to the Utulei and Tafuna
sewage treatment plants, their outfalls to the harbor and ocean, and their separate sewer
collection systems. This inspection does not cover the other sewage related utility work
performed by ASPA in the villages outside of the sewer service areas and on other islands.
This NPDES diagnostic evaluation inspection of the ASPA Tutuila Island sewage treatment
works consisted of the following:
On-site inspection of the Tafuna sewage treatment plant;
On-site inspection of the Utulei sewage treatment plant,
On-site inspections of 14 of 24 on-island sewage lift stations (Atu’u, Satala, Fatumafuti,
Korea House, Malaloloa Main, Coconut 1, Coconut 2, Coconut 3, Andy, Sagamea, Papa
Stream, Vaitele, Skill Center, and Airport);
Review of equipment maintenance, data management, and operator training procedures;
Review of the ASPA FY2011 budget and the five-year capital improvement plan;
Review of 2010 daily operations data for the Tafuna and Utulei sewage treatment plants;
Review of 2010 effluent data for the Tafuna and Utulei sewage treatment plants;
Review of 2010 receiving water data for both outfalls and reference stations;
Review of 2010 spill reports for the sewage collection systems.
The inspection participants are listed on the title page. Arthur conducted the inspections on
September 28 and 29.
1.1 Wastewater Facilities Plan
The 1985 wastewater facilities plan prepared by CH2MHill for the American Samoa
Environmental Protection Agency (“ASEPA”) established the course of action now followed
of expanding the two existing primary sewage treatment plants to accommodate expanded
sewer service areas throughout the built-up areas. ASEPA revised the wastewater facilities
plan in 2003 to specifically direct funding toward the public health issues posed by raw
sewage discharges. Capital improvement projects are funded through outside grants from the
US Department of the Interior and the US Environmental Protection Agency. Funding for
capital improvement projects is projected to be $2.755 million per year over the next five
years, with water and solid waste projects averaging $1.3 million per year, and wastewater
projects averaging $1.5 million per year.
Page 6
American Samoa Power Authority - Wastewater Services Division
Page 4 of 32
The current capital improvement projects identified for future 2011-2015 funding include
sewer service into Aua with upgrades of the Malaloloa pump station and one of the Utulei
clarigesters ($5.4 million), furthering sewer service in Taulauta ($655k), and sewer system
rehabilitation ($600k). The capital improvement projects identified for funding also included
the island-wide and off-island installation of satellite septic systems ($805k).
Five-Year Wastewater CIP Plan FY2011 FY2012 FY2013 FY2014 FY2015
Aua Sewers / Utulei Clarigester #1 Rehab $1,755,000 $850,000 $1,500,000 $700,000 $600,000
Tualauta Sewers - $400,000 - - $255,000
Lift Station Upgrades and Sewers Rehab - - - $200,000 $400,000
Tutuila On-Island Satellite Installations - - - $500,000 -
Outer Island Satellite Installations - $305,000 - - -
1.2 Description of the Sewer Service Area
The facilities comprise two sewer service areas, independent from each other, and each
handling the sewage through primary sewage treatment plants for discharge through outfalls
to the ocean. See sections 2.1, 2.2, 2.3, 3.1, 3.2 and 3.3 of this report for configuration,
operational, and capacity details.
Utulei STP NPDES Permit AS0020001
Tafuna STP NPDES Permit AS0020010
ASPA Sewer Collection Service Areas
Future Sewer Service Areas Under Project
Page 7
American Samoa Power Authority - Wastewater Services Division
Page 5 of 32
1.3 NPDES Permits
EPA reissued the NPDES permits on September 30, 1999 for the Tafuna sewage treatment
plant and on October 5, 2001 for the Utulei sewage treatment plant. Both permits advance
less-than-secondary technology-based limits based on 1999 EPA 301(h) ocean waiver vari-
ance final decisions. The less-than-secondary limits for BOD and TSS removal rates are
based on a Federal minimum of 30% for primary treatment. The BOD and TSS concentra-
tion and loading limits reflect past performance data. Both permits also establish limits to
apply at and beyond the Zone of Initial Dilution based on the American Samoa water quality
standards, which differ for Utulei into Pago Pago Harbor and Tafuna into Vai Cove. The
receiving water permit limits are water column averages of discrete samples taken at three
depths (top, mid, bottom) from defined water column sampling stations. Both reissued
permits also establish additional monitoring requirements of the sediment, benthic communi-
ties, and sludge. See Tables 1 and 2 on pages 25 and 26 of this report for summaries of the
permit requirements.
The 301(h) waiver of secondary standards for sewage treatment works requires the nine
conditions in addition to those in the NPDES permit to be met through the life of the permit:
Applicable water quality standards specific to the pollutants modified by the waiver;
No interference with the attainment or maintenance of receiving water quality (public
water supply, balanced aquatic life, recreational activities)
Establish a system for monitoring the impacts in the receiving waters;
No resulting additional requirements on any other point or non-point source;
Enforcement of applicable pretreatment requirements for non-domestic sources;
A pretreatment program for treatment works serving a population over 50,000;
Controls for toxic pollutants from domestic sources into the treatment works;
No substantial increases in the permitted discharge volume;
The discharge of primary or equivalent treated wastewater that also meets the water
quality standards in the receiving waters after initial mixing.
ASPA submitted NPDES permit renewal applications on May 4, 2004 for Tafuna, and on
May 1, 2006 for Utulei. Both renewal applications included requests to extend the section
301(h) variance waivers. On January 14, 2009, EPA issued Tentative Decision Documents
denying the 301(h) variances from secondary treatment requirements in the NPDES permits
to be reissued for both treatment plants. No Final Decisions have not been issued as of yet.
Page 8
American Samoa Power Authority - Wastewater Services Division
Page 6 of 32
2.0 Description of Wastewater Treatment
Plant and Equipment
Summary
Both the Tafuna and Utulei sewage treatment plants provide primary sedimentation, anaer-
obic sludge digestion, and ocean outfall discharge. Both plants currently operate below their
design capacities. The Tafuna sewage treatment plant accepts all septage and some collected
grease generated island-wide and provides covered sludge drying beds for all digested
sludge. The Tafuna plant discharges a quarter mile off-shore into the Pacific Ocean. The
Utulei sewage treatment plant discharges 400 feet into the Pago Pago outer harbor with its
digested sludge trucked to the Tafuna plant for sludge drying. Eight lift stations pump to
Utulei. Eleven pump to Tafuna. Two plant lift stations serve as treatment plant intakes.
Three out-of-service-area lift stations discharge through unpermitted outfalls to the ocean.
Requirements
None.
Recommendations
ASPA should complete the repair or replacement of Utulei Clarigester No.1, the tsunami-
damaged Satala and Korea House lift stations, and the Malaloloa main lift station.
ASPA should complete the lift station installations of SCADA remote sensing telemetry.
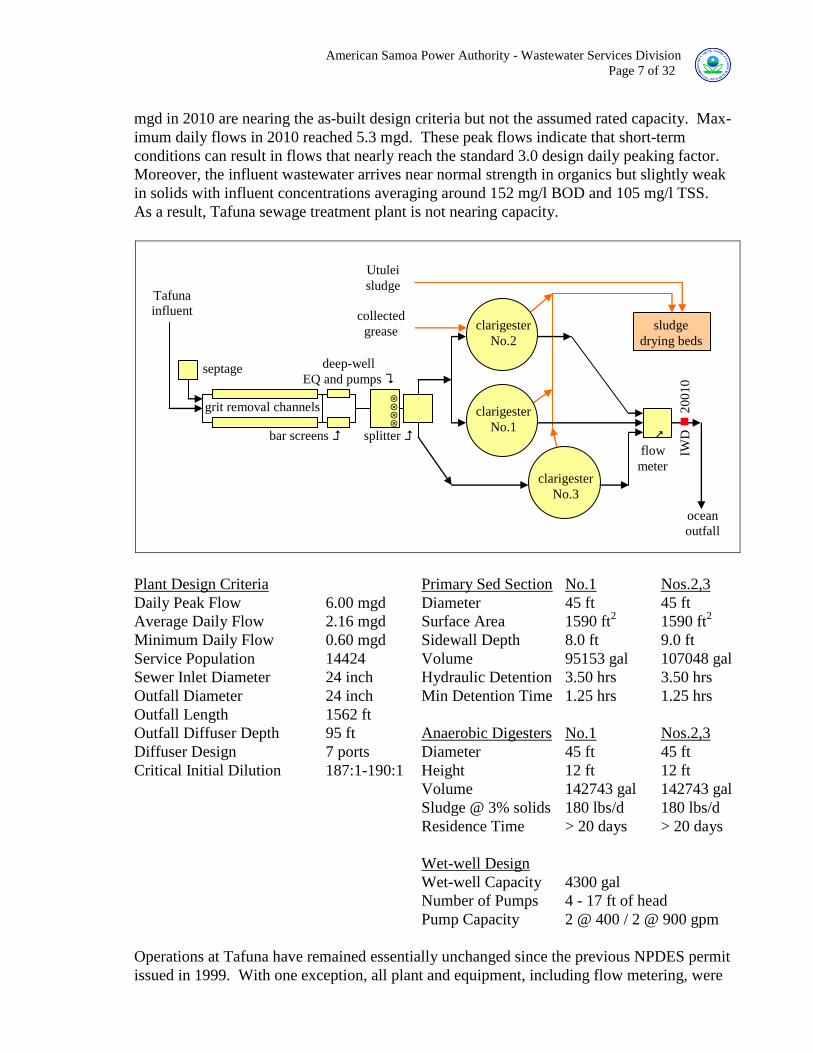
2.1 Tafuna Sewage Treatment Plant
The condition of the Tafuna sewage treatment plant was found in this inspection to be essen-
tially the same as it was in the July 2007 and April 2009 inspections, before the tsunami. The
destruction of the back fence and gate appeared to be the only unrepaired damage from the
tsunami. The tsunami also scoured away shoreline riprap leaving the ocean outfall terminal
box exposed. See Photos #1 through #7 in Section 2.5 on pages 11 and 12 of this report.
The Tafuna sewage treatment plant provides primary treatment and undisinfected discharge
through an ocean outfall. The unit processes consist of long-channel grit removal, manual
bar screens, a deep-well influent pump station, three clarigesters, and an ocean outfall.
Outfall studies have listed the critical initial dilution from the Tafuna outfall to be 187:1.
Clarigesters are primary sedimentation basins with a clear well section above an anaerobic
digester section. Like primary sedimentation basins, clarigesters are outfitted with a rotating
arm to scrape off scum. Unlike primary sedimentation basins, clarigester sludge drains
directly to the underlying digester section through a portal in the conical-shaped partition.
ASPA operates the Tafuna sewage treatment plant under the assumption that each clarigester
has a rated capacity of 1.0 mgd, for a total rated plant capacity of 3.0 mgd. However, the as-
built drawings list a smaller design criterion of 2.16 mgd. The average daily flows of 1.94
Page 9
American Samoa Power Authority - Wastewater Services Division
Page 7 of 32
mgd in 2010 are nearing the as-built design criteria but not the assumed rated capacity. Max-
imum daily flows in 2010 reached 5.3 mgd. These peak flows indicate that short-term
conditions can result in flows that nearly reach the standard 3.0 design daily peaking factor.
Moreover, the influent wastewater arrives near normal strength in organics but slightly weak
in solids with influent concentrations averaging around 152 mg/l BOD and 105 mg/l TSS.
As a result, Tafuna sewage treatment plant is not nearing capacity.
Plant Design Criteria Primary Sed Section No.1 Nos.2,3
Daily Peak Flow 6.00 mgd Diameter 45 ft 45 ft
Average Daily Flow 2.16 mgd Surface Area 1590 ft2
1590 ft2
Minimum Daily Flow 0.60 mgd Sidewall Depth 8.0 ft 9.0 ft
Service Population 14424 Volume 95153 gal 107048 gal
Sewer Inlet Diameter 24 inch Hydraulic Detention 3.50 hrs 3.50 hrs
Outfall Diameter 24 inch Min Detention Time 1.25 hrs 1.25 hrs Outfall Length 1562 ft
Outfall Diffuser Depth 95 ft Anaerobic Digesters No.1 Nos.2,3
Diffuser Design 7 ports Diameter 45 ft 45 ft
Critical Initial Dilution 187:1-190:1 Height 12 ft 12 ft
Volume 142743 gal 142743 gal
Sludge @ 3% solids 180 lbs/d 180 lbs/d
Residence Time > 20 days > 20 days
Wet-well Design
Wet-well Capacity 4300 gal
Number of Pumps 4 - 17 ft of head
Pump Capacity 2 @ 400 / 2 @ 900 gpm
Operations at Tafuna have remained essentially unchanged since the previous NPDES permit
issued in 1999. With one exception, all plant and equipment, including flow metering, were
Utulei
sludge
collected
grease sludge
drying beds
clarigester
No.2
Tafuna
influent
deep-well
EQ and pumps septage
IWD
2
00
10
clarigester
No.1
grit removal channels
bar screens
flow
meter
splitter
clarigester
No.3
ocean
outfall
Page 10
American Samoa Power Authority - Wastewater Services Division
Page 8 of 32
observed to be in working order. The one exception, Clarigester No.2, had bulking sludge.
According to ASPA representatives, the bulking sludge is caused by the introduction of
restaurant grease, collected island-wide from the school lunch program, and delivered by
pumper truck for disposal into only the Clarigester No.2. See Table 3 on page 27 of this
report for the statistical summaries of the influent and effluent sampling at Tafuna.
2.2 Utulei Sewage Treatment Plant
The condition of the Utulei sewage treatment plant was found during this inspection to be
essentially the same as it was in the July 2007 and April 2009 inspections, with no evident
tsunami damage. See Photos #8 through #10 in Section 2.5 on page 12 of this report.
The Utulei sewage treatment plant provides primary treatment and undisinfected discharge
through an outfall to the outer Pago Pago harbor. The unit processes consist of a manual bar
screen dropped into a deep-well influent pump station, a flow splitter box, four clarigesters, a
decommissioned chlorine contact outlet structure, and an ocean outfall. The unit processes
do not include grit removal or sludge drying. Outfall studies have listed the critical initial
dilution from the Utulei outfall to be between 90:1 to 202:1. The Utulei plant occupies a
fully-developed site without room for expansion, between cliffs, a highway along the
waterfront, and a tank farm.
The Utulei as-built drawings list a design dry-weather capacity of 2.21 mgd. The average
daily flows of 1.21 mgd in 2010 not only are not nearing the as-built design criterion but also
and have dropped in two years by 40%. Maximum daily flows of 4.4 mgd did not exceed the
standard 3.0 design daily peaking factor. The influent wastewater also arrives less than half
strength in organics and solids with influent concentrations averaging around 115 mg/l BOD
and 73 mg/l TSS.
clarigester
No.2
clarigester
No.4
clarigester
No.3
Utulei
influent
sludge by truck
to Tafuna ocean
outfall
IW
D
20
00
1
bar screens
drop-in
bar screen
deep-well
EQ and pumps
inoperable
clarigester
No.1
Page 11
American Samoa Power Authority - Wastewater Services Division
Page 9 of 32
Plant Design Criteria Primary Sed Section Nos.1,2 Nos.3,4
Daily Peak Flow 6.13 mgd Diameter 35 ft 40 ft
Average Daily Flow 2.21 mgd Surface Area 962 ft2
1257 ft2
Minimum Daily Flow 0.80 mgd Sidewall Depth 6.5 ft 9.0 ft
Service Population 14734 Volume 47000 gal 85000 gal
Sewer Inlet Diameter 24 inch Hydraulic Detention 2.90 hrs 2.90 hrs
Outfall Diameter 24 inch Min Detention Time 1.00 hrs 1.00 hrs Outfall Length 954 ft
Outfall Diffuser Depth 150 ft Anaerobic Digesters Nos.1,2 Nos.3,4
Diffuser Design 6 ports Diameter 35 ft 40 ft
Critical Initial Dilution 90:1-202:1 Height 12 ft 12 ft
Volume 86342 gal 112776 gal
Sludge @ 3% solids 180 lbs/d 180 lbs/d
Residence Time > 20 days > 20 days
Wet-well Design
Wet-well Capacity 21000 gal
Number of Pumps 4 - 55 ft of head
Pump Capacity 2 @ 900 / 2 @ 1600 gpd
Operations at Utulei have remained essentially unchanged since the previous NPDES permit
issued in 2001. Clarigester No.1 and the chlorine contact chamber were observed to be
inoperative. Everything else, including flow metering, was observed to be fully operational.
See Table 4 on page 28 of this report for the statistical summaries of the influent and effluent
sampling at Utulei.
2.3 Sewage Collection Systems
ASPA owns and operates two independent sewer systems. The Utulei sewer system has one
main and seven satellite lift stations. The Tafuna sewer system has one main and ten satellite
lift stations. The plant inlet lift stations each have four pumps. The main sewer system lift
stations each have three pumps. Fifteen satellite lift stations are dual pump stations. Five are
single pump stations. ASPA has installed but not begun the operation of SCADA telemetry
at the lift stations. The lift stations are listed on the next page.
Most portions of both sewer systems were found to be in good condition although there was
unrepaired damaged from the tsunami on the sewer line west of Atu’u. Listed below are the
inspection findings of collection system integrity (+) and collection system disrepair (-).
+ All lift stations were functioning.
- Three lift stations had tsunami damage to their electrical controls and perimeter fencing.
- One low lying lift station showed evidence from silt of high inflow from a nearby road.
- The Malaloloa lift station control panel bypass was observed in 2007, 2009, and 2010.
+ All pumps except one were found operational and in working condition.
+ There was little evidence of concrete spalling around and within any of the lift stations.
+ Metal frames, covers, and hardware were painted and functioning.
Page 12
American Samoa Power Authority - Wastewater Services Division
Page 10 of 32
+ There was some corrosion but little evident metal disintegration.
+ There were no signs of groundwater seepage into any of the lift stations.
+ All 49 pumps of differing capacities and sizes are manufactured by Flygt as a sole source.
+ ASPA maintains spare stand-by pumps of different sizes.
ASPA Lift Stations Discharge Capacity (gpd) Condition on September 28-29, 2010 Atu’u Utulei STP 2 @ 200 good fully operational as designed
Satala Utulei STP 2 @ 200 poor tsunami damaged electrical controls
Korea House Utulei STP 2 @ 300 poor tsunami damaged electrical controls
Fatumafuti Utulei STP 2 @ 200 good fully operational as designed
Matafao School Utulei STP not assessed n/a not assessed during this inspection
Fagaalu Utulei STP not assessed n/a not assessed during this inspection
Special Ed Utulei STP 2 @ 200 good fully operational as designed
Malaloloa Main Utulei STP 3 @ 900 poor prior damaged electrical controls
Utulei STP Inlet Utulei Ocean Outfall 2@900 / 2@1600 good fully operational as designed Coconut No.1 Tafuna STP 2 @ 200 good fully operational - high inflow
Coconut No.2 Tafuna STP 2 @ 200 good fully operational as designed
Coconut No.3 Tafuna STP 2 @ 200 fair one pump inoperable
Andy Tafuna STP 2 @ 200 fair pump outlet not seated
Sagamea Tafuna STP 2 @ 200 fair flange connections not tightened
Papa Stream Tafuna STP 2 @ 450 good fully operational as designed
Skill Center Tafuna STP 2 @ 300 good fully operational as designed
Airport Tafuna STP 2 @ 300 good fully operational as designed
Lavatai Tafuna STP not assessed n/a not assessed during this inspection
Fogagogo Tafuna STP not assessed n/a not assessed during this inspection
Vaitele Main Tafuna STP 3 @ 900 good fully operational as designed
Tafuna STP Inlet Tafuna Ocean Outfall 2@400 / 2@900 good fully operational as designed
Three remote lift stations to unpermitted outfalls at Aunu’u Island, Leone High School, Fagaitua High School.
See Photos #11 through #28 in Section 2.5 on pages 12 through 15 of this report. Also see
Section 3.0 on page 16 for a discussion of the operation and maintenance system-wide.
2.4 Point(s) of Compliance
Sewage Treatment Standards - Federal secondary sewage treatment standards as modified by
the 301(h) waivers and the American Samoa water quality standards for pH apply end-of-
process-after-treatment to the discharge into the ocean outfall effluent discharge points,
designated in this report by NPDES permit numbers (NPDES-0020001 and 0020010).
Receiving Water Standards - The NPDES permit also sets zone-of-initial-dilution limits for
turbiditiy, nutrients (total phosphorus, total nitrogen), dissolved oxygen, pH, change in pH,
and indicator parameters (enterococci, chlorophyll-a, light penetration). These zone-of-
initial-dilution limits are water column averages of discrete samples taken at three depths
(top, mid, bottom) from defined water column sampling stations.
Page 13
American Samoa Power Authority - Wastewater Services Division
Page 11 of 32
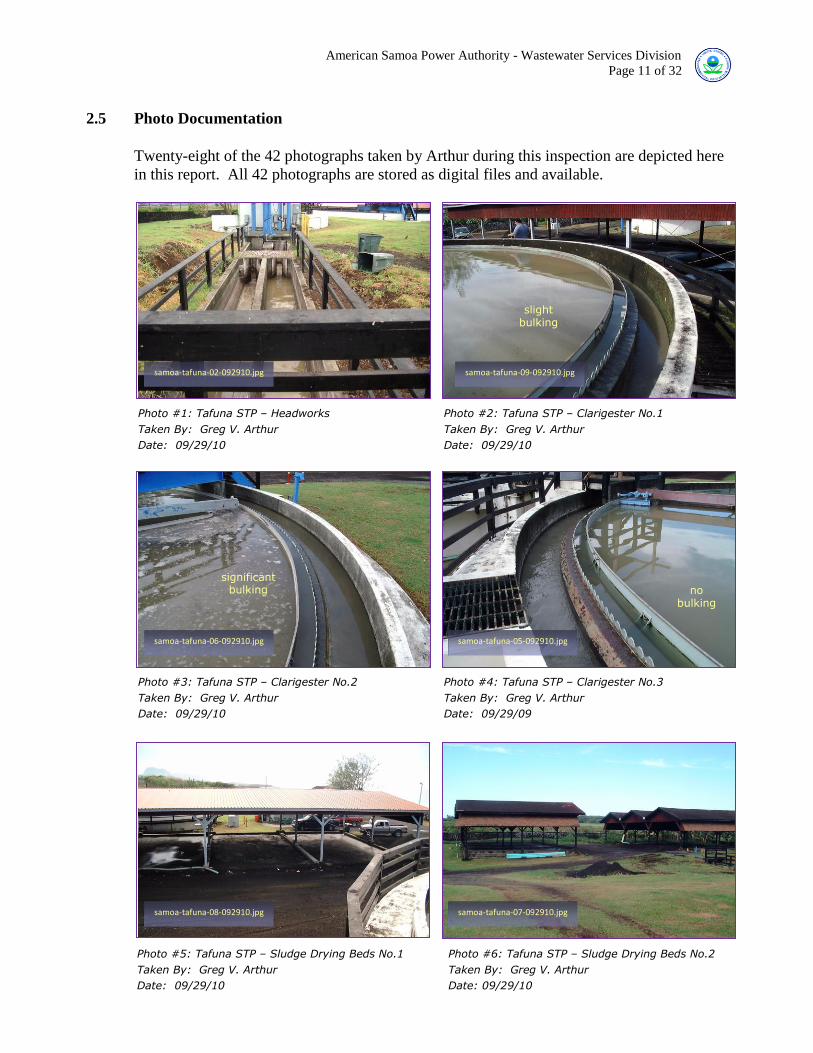
2.5 Photo Documentation
Twenty-eight of the 42 photographs taken by Arthur during this inspection are depicted here
in this report. All 42 photographs are stored as digital files and available.
Photo #1: Tafuna STP – Headworks
Taken By: Greg V. Arthur
Date: 09/29/10
Photo #2: Tafuna STP – Clarigester No.1
Taken By: Greg V. Arthur
Date: 09/29/10
Photo #5: Tafuna STP – Sludge Drying Beds No.1
Taken By: Greg V. Arthur
Date: 09/29/10
Photo #6: Tafuna STP – Sludge Drying Beds No.2
Taken By: Greg V. Arthur
Date: 09/29/10
samoa-tafuna-07-092910.jpg
samoa-tafuna-08-092910.jpg
samoa-tafuna-02-092910.jpg
samoa-tafuna-09-092910.jpg
Photo #3: Tafuna STP – Clarigester No.2
Taken By: Greg V. Arthur
Date: 09/29/10
Photo #4: Tafuna STP – Clarigester No.3
Taken By: Greg V. Arthur
Date: 09/29/09
no bulking
significant bulking
samoa-tafuna-06-092910.jpg
samoa-tafuna-05-092910.jpg
slight bulking
Page 14
American Samoa Power Authority - Wastewater Services Division
Page 12 of 32
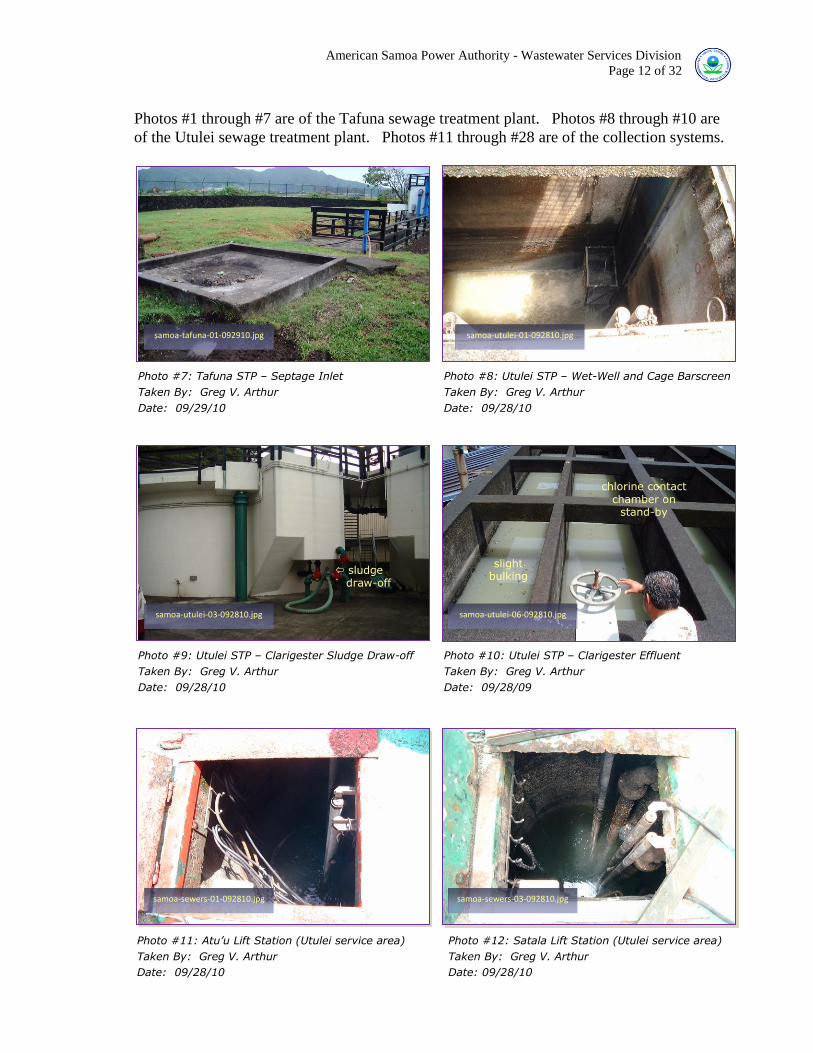
Photos #1 through #7 are of the Tafuna sewage treatment plant. Photos #8 through #10 are
of the Utulei sewage treatment plant. Photos #11 through #28 are of the collection systems.
Photo #7: Tafuna STP – Septage Inlet
Taken By: Greg V. Arthur
Date: 09/29/10
Photo #8: Utulei STP – Wet-Well and Cage Barscreen
Taken By: Greg V. Arthur
Date: 09/28/10
Photo #11: Atu’u Lift Station (Utulei service area)
Taken By: Greg V. Arthur
Date: 09/28/10
Photo #12: Satala Lift Station (Utulei service area)
Taken By: Greg V. Arthur
Date: 09/28/10
samoa-sewers-03-092810.jpg
samoa-sewers-01-092810.jpg
samoa-tafuna-01-092910.jpg
samoa-utulei-01-092810.jpg
Photo #9: Utulei STP – Clarigester Sludge Draw-off
Taken By: Greg V. Arthur
Date: 09/28/10
Photo #10: Utulei STP – Clarigester Effluent
Taken By: Greg V. Arthur
Date: 09/28/09
slight bulking
sludge draw-off
samoa-utulei-03-092810.jpg
samoa-utulei-06-092810.jpg
chlorine contact chamber on
stand-by
Page 15
American Samoa Power Authority - Wastewater Services Division
Page 13 of 32
Photos #1 through #7 are of the Tafuna sewage treatment plant. Photos #8 through #10 are
of the Utulei sewage treatment plant. Photos #11 through #28 are of the collection systems.
Photo #13: Satala Lift Station (Utulei service area)
Taken By: Greg V. Arthur
Date: 09/28/10
Photo #14: Satala Lift Station (Utulei service area)
Taken By: Greg V. Arthur
Date: 09/28/10
Photo #17: Korea House Lift Station (To Utulei)
Taken By: Greg V. Arthur
Date: 09/28/10
Photo #18: Fatumafuti Lift Station (To Utulei)
Taken By: Greg V. Arthur
Date: 09/28/10
samoa-sewers-11-092810.jpg
samoa-sewers-06-092810.jpg
samoa-sewers-04-092810.jpg
samoa-sewers-05-092810.jpg
Photo #15: Malaloloa Main Lift Station (To Utulei)
Taken By: Greg V. Arthur
Date: 09/28/10
Photo #16: Malaloloa Main Lift Station (To Utulei)
Taken By: Greg V. Arthur
Date: 09/28/09
samoa-sewers-08-092810.jpg
samoa-utulei-09-092810.jpg
external damage
jury-rigged electrical
jury-rigged electrical
Page 16
American Samoa Power Authority - Wastewater Services Division
Page 14 of 32
Photos #1 through #7 are of the Tafuna sewage treatment plant. Photos #8 through #10 are
of the Utulei sewage treatment plant. Photos #11 through #28 are of the collection systems.
Photo #19: Fatumafuti Lift Station (To Utulei)
Taken By: Greg V. Arthur
Date: 09/28/10
Photo #20: Coconut No.3 Lift Station (To Tafuna)
Taken By: Greg V. Arthur
Date: 09/28/10
samoa-sewers-13-092810.jpg
samoa-sewers-14-092810.jpg
Photo #21: Coconut No.2 Lift Station (To Tafuna)
Taken By: Greg V. Arthur
Date: 09/28/10
Photo #22: Coconut No.1 Lift Station (To Tafuna)
Taken By: Greg V. Arthur
Date: 09/28/10
samoa-sewers-15-092810.jpg
samoa-utulei-17-092810.jpg
separate dry well
quick connect pumper
inlet/outlet
one inoperable
pump
low lying drainage
swale
Photo #23: Andy Lift Station (Tafuna service area)
Taken By: Greg V. Arthur
Date: 09/28/10
Photo #24: Sagamea Lift Station (To Tafuna)
Taken By: Greg V. Arthur
Date: 09/28/10
samoa-sewers-19-092810.jpg
samoa-sewers-18-092810.jpg
Page 17
American Samoa Power Authority - Wastewater Services Division
Page 15 of 32
Photos #1 through #7 are of the Tafuna sewage treatment plant. Photos #8 through #10 are
of the Utulei sewage treatment plant. Photos #11 through #28 are of the collection systems.
All 42 photographs taken during this inspection are stored as digital files named Samoa-Tafuna-
01-092910.jpg to Samoa-Tafuna-11-092910.jpg for the Tafuna sewage treatment plant, Samoa-Utulei-
01-092810.jpg to Samoa-Utulei-07-092810.jpg for the Utulei sewage treatment plant, and Samoa-
Sewers-01-092810.jpg to Samoa-Sewers-24-092810.jpg for the two independent sewer systems
feeding into the Utulei and Tafuna sewage treatment plants.
Photo #25: Papa Stream Lift Station (To Tafuna)
Taken By: Greg V. Arthur
Date: 09/28/10
Photo #26: Vaitele Main Lift Station (To Tafuna)
Taken By: Greg V. Arthur
Date: 09/28/10
samoa-sewers-20-092810.jpg
samoa-sewers-22-092810.jpg
Photo #27 Skill Center Lift Station (To Tafuna)
Taken By: Greg V. Arthur
Date: 09/28/10
Photo #28: Airport Lift Station (Tafuna service area)
Taken By: Greg V. Arthur
Date: 09/28/10
samoa-sewers-23-092810.jpg
samoa-utulei-24-092810.jpg
Page 18
American Samoa Power Authority - Wastewater Services Division
Page 16 of 32
3.0 Description of Wastewater Operations and Maintenance
Summary
The ASPA wastewater utility functions as designed and up to capability. Both sewage
treatment plants and their sewer collections systems are well run and maintained. Nearly all
aspects of the sewerage works were found to be in working order, although three tsunami-
damaged lift stations in need of capital improvement did not operate as designed, and one
clarigester remains inoperable. Both sewage treatment plants have standby power genera-
tors. The staff was trained, largely experienced, and capable to successfully operate and
maintain plant and equipment. Operating revenue is now generated by sewer use rates. The
budgeting for capital improvement continues to rely on grants and not involve bonding or
capitalizing new construction. The engineering capability to manage capital improvement
projects has increased although there is no engineer dedicated to wastewater.
Requirements
None.
Recommendations
ASPA should reinstating formal staff training through courses in the operation and
maintenance of plant and equipment.
3.1 Operation and Maintenance Procedures
The sewage treatment plants and contributing sewer collection systems continue to be well
run and maintained as they were found to be in the July 2007 and April 2009 inspections.
All aspects of the sewerage works were observed to be functioning. One clarigester remains
inoperable, and the tsunami-damaged lift stations need repair or replacement. ASPA has the
in-house abilities and procedures to properly operate and maintain the sewerage works but
capital improvements for wastewater lag. ASPA uses computer calendar scheduling. All
operational steps, routine maintenance tasks, and the manufacturers’ maintenance tasks for
every piece of equipment are entered into a database which generates a daily punch list. All
work orders and trouble calls are entered into the scheduling database upon completion to
ensure staff accountability. ASPA staff has radio and cell phone communication throughout
the service area, and has begun the installation of SCADA remote sensing telemetry in all 24
pump stations. There is lab capability for BOD, TSS, pH, temperature, and meter calibration
at both sewage treatment plants.
Tafuna Sewage Treatment Plant - ASPA mans the Tafuna sewage treatment plant around the
clock. The staff isolates the grit channels in order to pump and manually shovel them out
one channel at a time. The headworks also include manually-cleaned bar screens. All four
influent pumps in the wet-well were observed to be in working order. The influent pumps
Page 19
American Samoa Power Authority - Wastewater Services Division
Page 17 of 32
feed up to a small surge tank and flow splitter to provide gravity feed to the three clarigesters.
The Tafuna plant includes a standby generator.
Utulei Sewage Treatment Plant - ASPA mans the Utulei sewage treatment plant around the
clock. The Wastewater Services Department is headquartered at the Utulei sewage treatment
plant, which includes the main office, a small lab, and maintenance shop and stores. A
course screen cage is dropped into the influent wet-well by a hoist. There is no grit removal.
The wet-well pumps, which turn on and off in response to float-level switches, pulse feed
incoming sewage to a surge tank above the clarigesters. All four influent pumps in the wet-
well were observed to be in working order. The flows split by gravity through hand gates to
the clarigesters. The Utulei plant has a standby generator. Digested sewage from Utulei is
trucked to the sludge drying beds at the Tafuna sewage treatment plant.
Sewer Collection Systems - ASPA has instituted effective procedures to ensure the continu-
ous operation of the sewers. A collection crew visits all lift stations daily for inspection,
recordings of electrical and pump readings, painting, clean-up, routine maintenance, and
work order requests. There is no vandalism so the fences around the lift stations are gated
but left unlocked. ASPA keeps an inventory of spare pumps of each model, and repair kits
for in-house repacking. ASPA contracts out rewinding. The ASPA Power Generation
machine shop has the capability to repair worn shafts. The Wastewater Division of ASPA
has instituted a computerized inventory of the all plant and equipment parts for automatic
reordering. The use of ITT Flygt as the sole source pump supplier has allowed ASPA to
standardize procedures.
3.2 Training and Staffing
Staffing - ASPA has 28 positions dedicated to wastewater operations. Four wastewater
branches function within the Wastewater Services Department of ASPA (Treatment Plants,
Collections, Maintenance, Line Maintenance). A fifth wastewater branch functions in the
Engineering Services Department (Construction).
Wastewater Services Department Staffing (September 2010) Supervisor’s Office
4 staff
wastewater operations and maintenance supervision, office
administration, self-monitoring, laboratory analyses
Utulei Treatment Plant 5 staff routine sewage treatment plant operations, self-monitoring,
sampling, work order requests Tafuna Treatment Plant 4 staff
Utulei Collections 3 staff routine collection system and lift station operations, FOG
inspections of grease traps, work order requests Tafuna Collections 2 staff
Mechanical and Electrical
4 staff
pump inventory and maintenance with surplus assistance
from ASPA Power Generation Division
Line Maintenance 6 staff
sewer line pressure flushing, connections smoke testing, facility
inventory, sewer connections, heavy equipment operations
Engineering Services Department Staffing (September 2010)
Construction 0+ staff capital improvement projects for ASPA wastewater
Page 20
American Samoa Power Authority - Wastewater Services Division
Page 18 of 32
Experience - The Wastewater Services Division has experienced personnel, with 30 years of
service in one position and between 10-15 years in four positions. More than half of the
positions are staffed by workers with more than four years of experience. The engineering
and construction positions are in the Engineering Services Division. Engineering capabilities
have remained under serviced because the old engineering position transferred as vacant to
the Engineering Services Division, and the staff engineer handles all utility functions. ASPA
indicated that it intends to hire two engineers for wastewater.
Training - ASPA started the plant and equipment maintenance program in 1994. The initial
program involved skills packages by position which ASPA implemented as the basis of its
wastewater training program. ASPA has funded cross training in wastewater and electrical
power distribution with other utilities, in particular with the Rotorua District Council in New
Zealand. The Wastewater Services Division also has cross trained staff members from other
branches to do the critical function of pump repair. ASPA maintains good records of the
training offered and who completed the training. The training has included courses in Flygt
pump, confined space entry, electrical fundamentals, collection system operations, treatment
plant operations, installation of electrical metering, utility and office software, as well as a
Wastewater Level 1 Certification. ASPA has de-invested from technical training courses,
and instead now relies upon in-house training. The Wastewater Services Department last
held technical training courses for plant and equipment in April 2006.
3.3 Budgeting
ASPA has a wastewater operating budget for FY2011 of nearly $6.7 million, an increase of
60% over FY2010 and 95% over FY2009. For FY2011, ASPA funds wastewater operations
through wastewater rates ($3,568,500), new connection fees ($50,000), and Federal capital
improvement project grants from EPA ($2,550,000), from FWMA ($207,500), and from the
Department of Interior ($861,500). This FY2011 budget for the first time incorporates
revenue from wastewater rates based on a usage fee of $12.50 per month per water meter,
and a volume charge of $1.00 per 1000 gallons. The FY2011 budget also for the first time
returns a subsidy to the electrical department from wastewater billing receipts (-$771,500).
In years past the wastewater department received a 13% subsidy from electrical billing.
All of this now means that operational funding is linked to sewer services. Capital improve-
ment projects are still funded strictly through Federal grants. Bonding for future capital
improvements very unlikely and may still prove difficult but not impossible now that there is
a rate structure linked to sewer services.
Page 21
American Samoa Power Authority - Wastewater Services Division
Page 19 of 32
4.0 Wastewater Treatment Plant Performance
The sewage treatment plants must meet discharge effluent limits for conventional pollutants,
removal rates, pH, and nuisance conditions. [NPDES Permit AS0020010 for Tafuna §A(1,2)
and NPDES Permit AS0020001 for Utulei §A(1,2)]
The receiving waters near the sewage treatment plants must meet zone-of-initial-dilution
limits for nutrients, pH, enterococci, and other indicators of ambient conditions. [Tafuna
Permit §A(3) and Utulei Permit §A(3)]
Sewage entering the collection systems may only discharge from the ocean outfalls of the
sewage treatment plants. [Tafuna Permit §A(1) and Utulei Permit §A(1)]
Sewage sludges must meet the Federal sludge standards in 40 CFR 503. [Tafuna Permit
§D(1-8) and Utulei Permit §D(1-8)]
Summary
The sewage treatment plants consistently comply with their NPDES permit effluent limits.
ASPA identified no sewer system spills due to equipment failure. Both plants provisionally
can be considered to have the capacity and capability to handle the domestic contributions
into their collection systems. However, neither plant provides disinfection and the impacts
upon their receiving waters through water column sampling are not clear. In particular,
although the receiving waters have not consistently met the water quality standards at the
zones-of-initial-dilution around both outfalls, the water quality at the reference stations does
not significantly differ for most parameters, except enterococci and perhaps turbidity. More-
over, both plants might meet the water quality standards for nutrients, if they were applied as
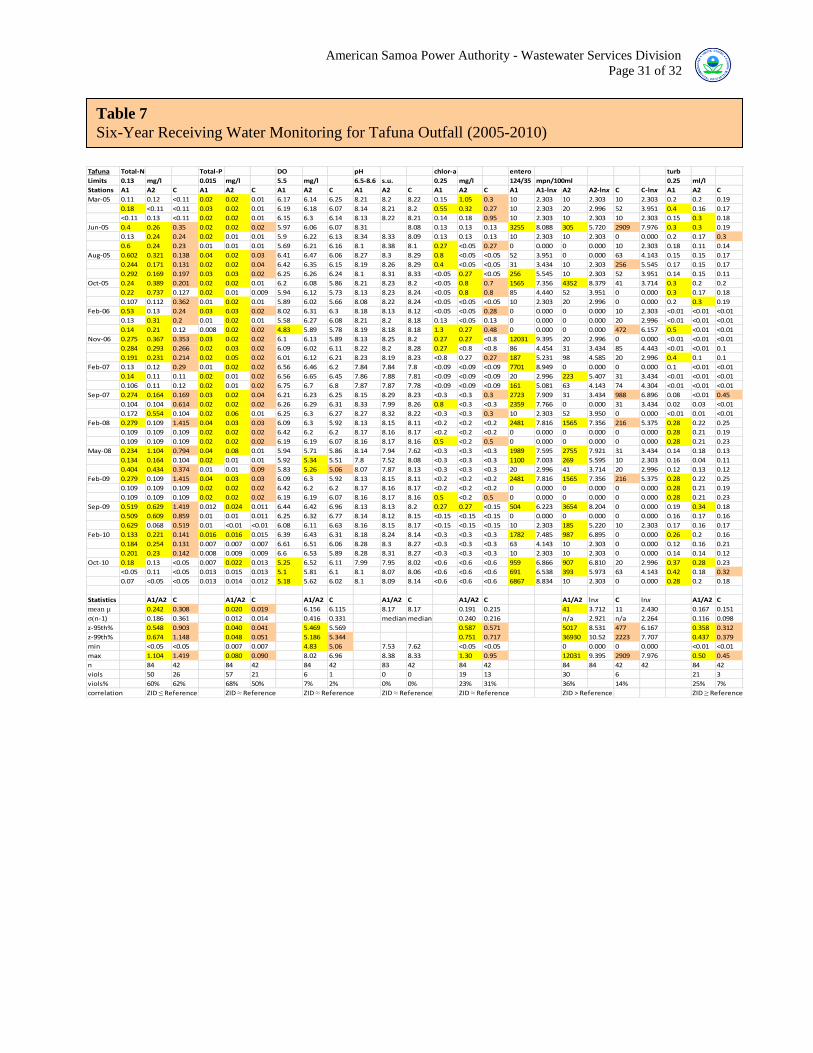
effluent discharge limits. See Tables 3, 4, 7, and 8 on pages 27, 28, 31, and 32 of this report.
Requirements
Sewage sludges must be self-monitored and the results reported at least once per year.
Sewage spills must be reported as bypasses of treatment necessary to comply.
Recommendations
The water quality standards for total nitrogen and phosphorus would better apply to the
sewage treatment plant discharges as NPDES permit effluent limits.
ASPA should install disinfection at both sewage treatment plants and consider the use of
non-chlorine methods such as on-site hypochlorite generation from salt brine reduction.
Both sewage treatment plant discharges should be self-monitored for ammonia, total
nitrogen, total phosphorus, enterococci, and eventually for residual chlorine.
The critical initial dilution factors for both ocean outfalls and the expected peak flows
through the outfalls should be verified.
Page 22
American Samoa Power Authority - Wastewater Services Division
Page 20 of 32
4.1 NPDES Permit Limits for Tafuna
4.1.1 - Conventional Pollutants
Tafuna produces primary-treated wastewater that consistently complies with the NPDES
permit effluent discharge limits for conventional pollutants. The effluent average and cal-
culated 99th% peaks are 84 and 126 mg/l BOD and 37 and 66 mg/l TSS. The Tafuna
influent is essentially equivalent in strength to typical domestic sewage, with influent average
and calculated 99th% peaks of 153 and 212 mg/l BOD and 105 and 190 mg/l TSS. Consis-
tent operation of the primary treatment results in BOD and TSS removals rates that average
44% and 58%, respectively, above the 30% NPDES permit requirements but nowhere near
the 85% secondary treatment standards. All daily pH measurements and settleable solids
samples complied with NPDES permit effluent limits.
4.1.2 - Nutrients
The NPDES permit sets zone-of-initial-dilution (“ZID”) receiving water limits for total
nitrogen and phosphorus. The water column sampling for the Tafuna outfall indicates that
the receiving waters usually exceed the water quality standards for nutrients. However, the
water column sampling for total phosphorus at the ZID stations did not statistically differ
from the samples at the reference station sited away from the outfall’s influence. For total
nitrogen, the water column samples at the ZID stations statistically were slightly less
contaminated than those at the reference station.
Total Nitrogen - The average and calculated 99th% peaks were 242 and 674 g/l at the
ZID stations, and 308 and 1148 g/l at the reference station.
Total Phosphorus - The average and calculated 99th% peaks were 20 and 48 g/l at the
ZID stations, and 19 and 51 g/l at the reference station.
The water quality standards, if applied upstream as effluent discharge limits, would translate
upward by a factor proportional to the critical initial dilution, which is 187:1. The resulting
water quality standards for the discharge would calculate out to 24.3 mg/l total nitrogen and
2.8 mg/l phosphorus. Typical weak-strength sewage has ~15 mg/l total nitrogen and ~4 mg/l
total phosphorus. Typical primary treatment removes 20% and 30% of the nitrogen and
phosphorus. As a result, although there is no sampling of the Tafuna discharges for nutrients,
the effluent is expected to be ~12 mg/l nitrogen and ~3 mg/l phosphorus and thus should
meet the calculated limits consistently for nitrogen and most of the time for phosphorus. See
Section 4.5 on page 24 of this report for a discussion of the critical initial dilution factors.
4.1.3 - Indicator Parameters
Turbidity and dissolved oxygen are indicators of suspended solids and biological growth.
Chlorophyll-a is an indicator parameter of nutrient-induced algal growth. Water column
sampling for these indicator parameters at the ZID stations did not statistically differ to any
significant degree from the samples at the reference station sited away from the outfall’s
influence.
Page 23
American Samoa Power Authority - Wastewater Services Division
Page 21 of 32
Turbidity - The average and calculated 99th% peaks were 0.17 and 0.44 NTUs at the ZID
stations, and 0.15 and 0.38 NTUs at the reference station.
Dissolved Oxygen - The average and calculated 1% minimum were 6.16 and 5.19 mg/l at
the ZID stations, and 6.12 and 5.34 mg/l at the reference station.
Chlorophyll-a - The average and calculated 99th% peaks were 191 and 751 g/l at the ZID
stations, and 215 and 717 g/l at the reference station.
4.1.4 - Pathogens
The NPDES permit sets zone-of-initial-dilution receiving water limits for enterococci as an
indicator of pathogenic hazard. Water column sampling for enterococci at the ZID stations
statistically exceeds the samples at the reference station sited away from the influence of the
outfall. Since the Tafuna sewage treatment plant does not disinfect, the plant is a likely
contributing source of enterococci detected in the receiving waters. See section 4.2.4 on
page 22 of this report.
Enterococci - The geometric mean and calculated 95th% peaks were 41 and 5017
MPN/100ml at the ZID stations, and 11 and 477 MPN/100 ml at the reference station.
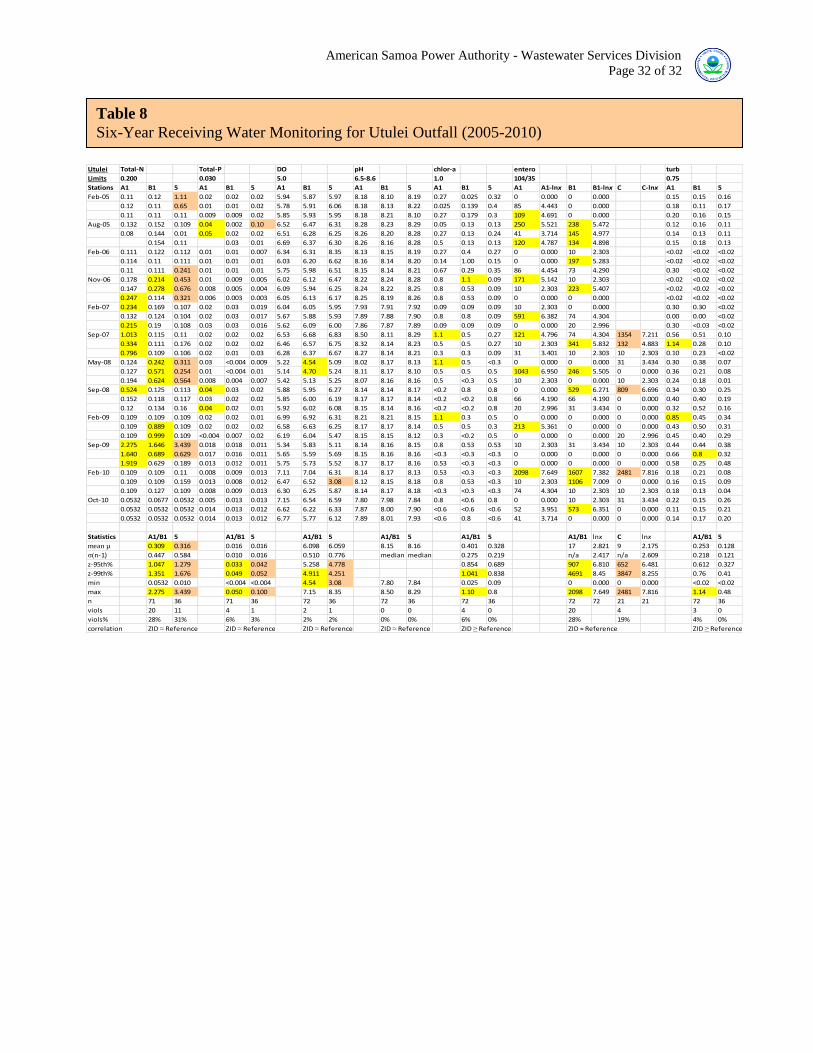
4.2 NPDES Permit Limits for Utulei
4.2.1 - Conventional Pollutants
The Utulei sewage treatment plant produces primary-treated wastewater that consistently
complies with the NPDES permit effluent discharge limits for conventional pollutants. The
effluent average and calculated 99th% peaks are 65 and 109 mg/l BOD and 28 and 45 mg/l
TSS. The Utulei influent arrives weaker than typical domestic sewage, with influent average
and calculated 99th% peaks of 115 and 177 mg/l BOD and 73 and 133 mg/l TSS. Neverthe-
less, consistent operation of the primary treatment results in BOD and TSS removals rates
that average 44% and 58%, respectively, above the 30% NPDES permit requirements but
nowhere near the 85% secondary treatment standards. All daily pH measurement and
settleable solids samples complied with NPDES permit effluent limits.
4.2.2 - Nutrients
The NPDES permit sets zone-of-initial-dilution (“ZID”) receiving water limits for total
nitrogen and phosphorus. The water column sampling for the Utulei outfall indicates that the
receiving waters sometimes exceed the water quality standards for nutrients. However, the
water column sampling at the ZID stations also did not significantly differ from the samples
at the reference station sited away from the outfall’s influence.
Total Nitrogen - The average and calculated 99th% peaks were 309 and 1351 g/l at the
ZID stations, and 316 and 1676 g/l at the reference station.
Page 24
American Samoa Power Authority - Wastewater Services Division
Page 22 of 32
Total Phosphorus - The average and calculated 99th% peaks were 16 and 49 g/l at the
ZID stations, and 16 and 52 g/l at the reference station.
The water quality standards, if applied upstream as effluent discharge limits, would translate
upward by a factor proportional to the critical initial dilution, which was calculated for Utulei
to be 202:1 in 1999 and 90:1 in 2006. The resulting water quality standards for the Utulei
discharge would calculate out to 40.4 mg/l total nitrogen and 6.1 mg/l phosphorus at a critical
initial dilution factor of 202:1, and 18.0 mg/l total nitrogen and 2.7 mg/l phosphorus at a
factor of 90:1. The weak sewage strength and primary treatment removals would result in
effluent discharges expected to be ~12 mg/l nitrogen and ~3 mg/l phosphorus. As a result,
the Utulei discharges should meet the calculated 202:1 limits for nitrogen consistently and
for phosphorus most of the time, but the calculated 90:1 limits for nitrogen and phosphorus
most of the time. See Section 4.5 on page 24 of this report for a discussion of the critical
initial dilution factors.
4.2.3 - Indicator Parameters
Turbidity and dissolved oxygen are indicators of suspended solids and biological growth.
Chlorophyll-a is an indicator parameter of nutrient-induced algal growth. Water column
sampling for these indicator parameters at the ZID stations did not significantly differ from
the samples at the reference station sited away from the outfall’s influence.
Turbidity - The average and calculated 99th% peaks were 0.25 and 0.76 NTUs at the ZID
stations, and 0.13 and 0.41 NTUs at the reference station.
Dissolved Oxygen - The average and calculated 1% minimum were 6.1 and 4.9 mg/l at the
ZID stations, and 6.1 and 4.3 mg/l at the reference station.
Chlorophyll-a - The average and calculated 99th% peaks were 401 and 1041 g/l at the
ZID stations, and 328 and 838 g/l at the reference station.
4.2.4 - Pathogens
The NPDES permit sets zone-of-initial-dilution receiving water limits for enterococci as an
indicator of pathogenic hazard. Since the Utulei sewage treatment plant does not disinfect, it
may be a source of enterococci detected in the receiving waters. Utulei had the capability to
chlorinate. Chlorination was decommissioned because of the hazards involved in the trans-
portaion of chlorine to the island, its delivery to the treatment plants, and its use at the plants.
Therefore, chlorination may not be an available option on American Samoa. However, there
are disinfection methods that do not use gas cylinder chlorine, such as on-site systems that
generate hypochlorite bleach through salt brine reduction.
4.3 Collection Systems Spills
The NPDES permits requires all domestic sewage contributions into the sewage collection
systems to be discharged only through the ocean outfalls [§A(1a) of the permits]. The
Page 25
American Samoa Power Authority - Wastewater Services Division
Page 23 of 32
NPDES permits also prohibit the bypassing of treatment necessary to comply with standards
[Attachment 4 (14d) of the permits]. Sewage spills would violate both provisions. The
NPDES permits do not require explicitly the reporting of sewage spills, although they do
require notice of bypassing [Attachment 4 (14c) of the permits].
ASPA records the occurrence of spills on a daily work history by account. A 2010 work
history summary recorded 15 spills from sewer line back-ups and line breaks, at times from
unrelated construction and excavation work by contractors or ASPA Water. The work
history summary does not include the volume or duration of the spills or whether the spills
reached the harbor or streams.
Spill Date Spill Cause Volume Duration Sewage Spills in 2010
01/07/2010 Sewer Back-up unk unk Tafuna WWTP influent lift station wet well overflow
01/27/2010 Sewer Back-up unk unk ASTCA manhole overflow
02/13/2010 Sewer Back-up unk unk ASTCA manhole overflow
02/25/2010 Sewer Back-up unk unk ASTCA manhole overflow
03/27/2010 Sewerline Break unk unk Malaloloa lift station force main broken by construction crew
05/10/2010 Sewer Back-up unk unk Matafao lift station wet well overflow
06/28/2010 Sewerline Break unk unk AS Community College 8” main line
07/07/2010 Sewer Back-up unk unk Petesa 4” line broken by construction company
07/29/2010 Sewer Back-up unk unk Fagaalu manhole overflow
08/06/2010 Sewerline Break unk unk Nuuuli 4” line broken by ASPA Water crew
09/17/2010 Sewer Back-up unk unk Temporary Market manhole overflow
09/23/2010 Sewerline Break unk unk KS Mart 4” line broken by construction company
10/04/2010 Sewer Back-up unk unk Fagatogo manhole overflow
12/05/2010 Sewerline Break unk unk Utulei 4” line broken by ASPA Water crew
12/07/2010 Sewer Back-up unk unk Tafuna WWTP influent lift station wet well overflow
These spills were identified through ASPA’s daily inspection of each lift station and through
extensive customer use of an ASPA tip line. There were no reports submitted by ASPA to
EPA or ASEPA listing these sewage spills in 2010.
4.4 Federal Sewage Sludge Disposal Limits
The sewage sludges from both Tafuna and Utulei are mixed together for combined handling
and drying at the Tafuna sewage treatment plant prior to disposal. A single sample from
2004 of combined Tafuna and Utulei sludges complied with the Federal ceiling sludge metals
limits for disposal as landfill cover in Table 1 of 40 CFR 503.13, and the more stringent
Federal clean sludge metals limits suitable for any reuse in Table 3 of 40 CFR 503.13. No
PCBs were detected. No other pesticides and toxic organics except a DDT derivative were
detected at levels above quantification.
The Federal standards set requirements for only metals content, PCBs content, vector
attraction, and pathogenic destruction. Compliance with the vector attraction and pathogenic
destruction requirements would be expected because the treatment plants provide more than
Page 26
American Samoa Power Authority - Wastewater Services Division
Page 24 of 32
enough anaerobic digestion time in the clarigesters. Compliance with the metals and PCBs
content requirements also would be expected since there are no identified sources of
industrial wastewaters into the sewer systems. The industrial wastewaters from the tuna
canneries discharge through an independent outfall owned by the canneries.
4.5 Critical Initial Dilution Factors
The 1999 final decision extending the 301(h) waivers and the 2009 tentative decision
denying the waivers cited differing critical initial dilution factors for the zones-of-initial-
dilutions established for both treatment plant outfalls. The critical initial dilution factors
were calculated to be 190:1 in 1999 and 187:1 in 2009 for Tafuna and 202:1 in 1999 and 90:1
in 2009 for Utulei. The calculations depend on a number of fixed constants, in particular, the
outfall diffuser depth, diffuser length, the number of diffuser ports, density differences, and
the receiving water currents. The calculations are also dependent on the independent variable
of the expected peak outfall discharge flow rates.
Critical Initial Analysis Year Diffuser Design WWTP Design Capacity 2010 Flow Statistics (mgd)
Dilution Factors 2009 1999 depth ports dry-mean wet-peak mean 99th% d-max hr-max
Tafuna Outfall 187:1 190:1 95 ft 7 2.1 mgd 6.0 mgd 1.94 3.77 5.3 5.6
Utulei Outfall 90:1 202:1 150 ft 6 2.1 mgd 6.1 mgd 1.20 2.71 4.4 5.9
Two capital improvement projects could increase the receiving water dilution for these
outfalls. First, extensions of the diffusers and the subsequent increases in the number of
diffuser ports would reduce peak exit flow rates and increase the calculated critical initial
dilution factors. Second, the installation of surge capacity within the sewer systems or at the
treatment plants would reduce the peak flow rates, which also would reduce peak exit flow
rates and also increase the calculated critical initial dilution factor.
Page 27
American Samoa Power Authority - Wastewater Services Division
Page 25 of 32
Table 1
NPDES Permit and Sludge Limits and Monitoring Requirements for Tafuna WWTP Tafuna Effluent Limits mo-avg 7d-avg d-max discreet geo- sample freq sample type
flow (mgd) - - - - - continuous continuous
BOD (mg/l) 100 150 200 - - once/week
inf and eff 8-hr comp BOD (lbs/day) 1669 2504 3338 - -
BOD (%removal) >30% - - - -
TSS (mg/l) 75 113 150 - - once/week
inf and eff 8-hr comp TSS (lbs/day) 1252 1878 2504 - -
TSS (%removal) >30% - - - -
settleable solids (ml/l) 1.0 - 2.0 - - once/day grab
pH (s.u.) - - - 6.5-8.6 - once/week grab
oil and grease (mg/l) - - - - - quarterly grab
toxicity (TUc) - - - - - quarterly 24-hr comp
Tafuna Water Column Limits mo-avg 7d-avg d-max discreet geo- sample freq sample type
turbidity (NTU) - - - 0.25 - quarterly metering
total phosphorus ( g/l) - - - 15 - quarterly grab
total nitrogen ( g/l) - - - 130 - quarterly grab
chlorophyll-a ( g/l) - - - 0.25 - quarterly grab
light penetrate (ft-50%) - - - <130 - quarterly secchi disk
dissolved oxygen (mg/l) - - - 5.5 - quarterly grab
pH (s.u.) - - - 6.5-8.6 - quarterly grab
ΔpH (s.u.) - - - ≤ 0.2 -
enterococci (cfu/100ml) - - - 124 35 quarterly grab Fed Sewage Sludge Limits Table 1 Table 3 sample freq sample type
arsenic (mg/kg-dry) 75 41 - - - annually grab
cadmium (mg/kg-dry) 85 39 - - - annually grab
copper (mg/kg-dry) 4300 1500 - - - annually grab
lead (mg/kg-dry) 840 300 - - - annually grab
mercury (mg/kg-dry) 57 17 - - - annually grab
molybdenum (mg/kg-dry) 75 - - - - annually grab
nickel (mg/kg-dry) 420 420 - - - annually grab
selenium (mg/kg-dry) 100 100 - - - annually grab
zinc (mg/kg-dry) 7500 2800 - - - annually grab
Page 28
American Samoa Power Authority - Wastewater Services Division
Page 26 of 32
Table 2
NPDES Permit Limits and Monitoring Requirements for Utulei WWTP Utulei Effluent Limits mo-avg 7d-avg d-max discreet geo- sample freq sample type
flow (mgd) - - - - - continuous continuous
BOD (mg/l) 78.3 117 157 - - once/week
inf and eff 8-hr comp BOD (lbs/day) 1085 1628 2170 - -
BOD (%removal) >30% - - - -
TSS (mg/l) 75 113 150 - - once/week
inf and eff 8-hr comp TSS (lbs/day) 1377 2065 2754 - -
TSS (%removal) >30% - -
settleable solids (ml/l) 1.0 - 2.0 - - once/day grab
pH (s.u.) - - - 6.5-8.6 - once/week grab
oil and grease (mg/l) - - - - - quarterly grab
toxicity (TUc) - - - - - quarterly 24-hr comp Utulei Water Column Limits mo-avg 7d-avg d-max discreet geo- sample freq sample type
turbidity (NTU) - - - 0.75 - quarterly metering
total phosphorus ( g/l) - - - 30 - quarterly grab
total nitrogen ( g/l) - - - 200 - quarterly grab
chlorophyll a ( g/l) - - - 1.0 - quarterly grab
light penetrate (ft-50%) - - - <65 - quarterly secchi disk
dissolved oxygen (mg/l) - - - 5.0 - quarterly grab
pH (s.u.) - - - 6.5-8.6 - quarterly grab
ΔpH (s.u.) - - - ≤ 0.2 -
enterococci (cfu/100ml) - - - 104 35 quarterly grab
Page 29
American Samoa Power Authority - Wastewater Services Division
Page 27 of 32
Table 3
Compliance with NPDES Permit and Sludge Limits at the Tafuna WWTP Tafuna WWTP Influent
(Jan 2010 – Dec 2010)
2010 sampling statistics viols
sample
events mean min 5th% 95th% 99th% d-max
flow (mgd) 1.94 0.00 - 3.24 3.77 5.3 - 365
BOD daily-max (mg/l) 152.5 103 - 194.4 211.7 236 - 51
TSS daily-max (mg/l) 105.3 48 - 165.5 190.3 200 - 51
settleable solids (ml/l) 5.09 4.5 - 6.23 6.69 10.0 - 246 Tafuna WWTP Effluent
(Jan 2010 – Dec 2010)
2010 sampling statistics viols
sample
events mean min 5th% 95th% 99th% d-max
BOD daily-max (mg/l) 84.4 44 - 113.8 125.8 122 0/51 51
TSS daily-max (mg/l) 36.9 18 - 57.5 66.0 71 0/51 51
settleable solids (ml/l) 0.16 0.10 - 0.26 0.30 0.50 0/245 245
BOD removal rates (%) 44.4 27.2 28.7 60.1 66.6 61.7 0/12 51
TSS removal rates (%) 63.5 44.5 48.5 78.5 84.8 85.0 0/12 51
pH min/max (s.u.) 7.0 med 6.8 - - - 7.8 0/245 245 Tafuna Outfall
Receiving Water Columns
(Jan 2005 - Dec 2010)
2005-2010 sampling statistics ²
viols ² sample
events² ZID¹ stations A1 /A2 reference¹ station C
mean 95th% 99th% mean 95th% 99th%
total nitrogen (μg/l) 242 548 674 308 903 1148 50/84 84
total phosphorus (μg/l) 20 40 48 19 41 51 57/84 84
turbidity (NTU) 0.167 0.358 0.437 0.151 0.312 0.379 21/84 84
chlorophyll-a (μg/l) 191 587 751 215 571 717 19/84 84
dissolved oxygen (mg/l) 6.156 5.469 5.186 6.115 5.569 5.344 6/84 84
pH min/max (s.u.) ³ 8.17 7.53 min - 8.38 max 8.17 7.62 min - 8.33 max 0/83 83
enterococci (CFR/100ml) ³ 41 5017 12031 11 477 2909 30/84 84
¹ zone-of-initial-dilution and reference stations defined in §E(1a) of the NPDES permit for Tafuna
² stations sampled at the surface, mid-depth, and bottom. See Table 7 on page 31 of this report for all sample results.
³ pH statistics are reported as median and min/max - enterococci as geometric-mean, geo-95th%, and max. Tafuna/Utulei Sewage Sludge
(jan 2001 - Dec 2010)
2001-2010 sludge sampling statistics ¹ viols
sample
events mean min 5th% 95th% 99th% d-max
arsenic (mg/kg-dry) - - - - - 4.8 0/1 1
cadmium (mg/kg-dry) - - - - - 2.8 0/1 1
copper (mg/kg-dry) - - - - - 168.9 0/1 1
lead (mg/kg-dry) - - - - - 32.3 0/1 1
mercury (mg/kg-dry) - - - - - 0.18 0/1 1
molybdenum (mg/kg-dry) - - - - - - - 1
nickel (mg/kg-dry) - - - - - 210.0 0/1 1
selenium (mg/kg-dry) - - - - - 4.3 0/1 1
zinc (mg/kg-dry) - - - - - 894.3 0/1 1
¹ Tafuna and Utulei sludge sampling results adjusted to dry weight basis - solids content of 68.1%
Page 30
American Samoa Power Authority - Wastewater Services Division
Page 28 of 32
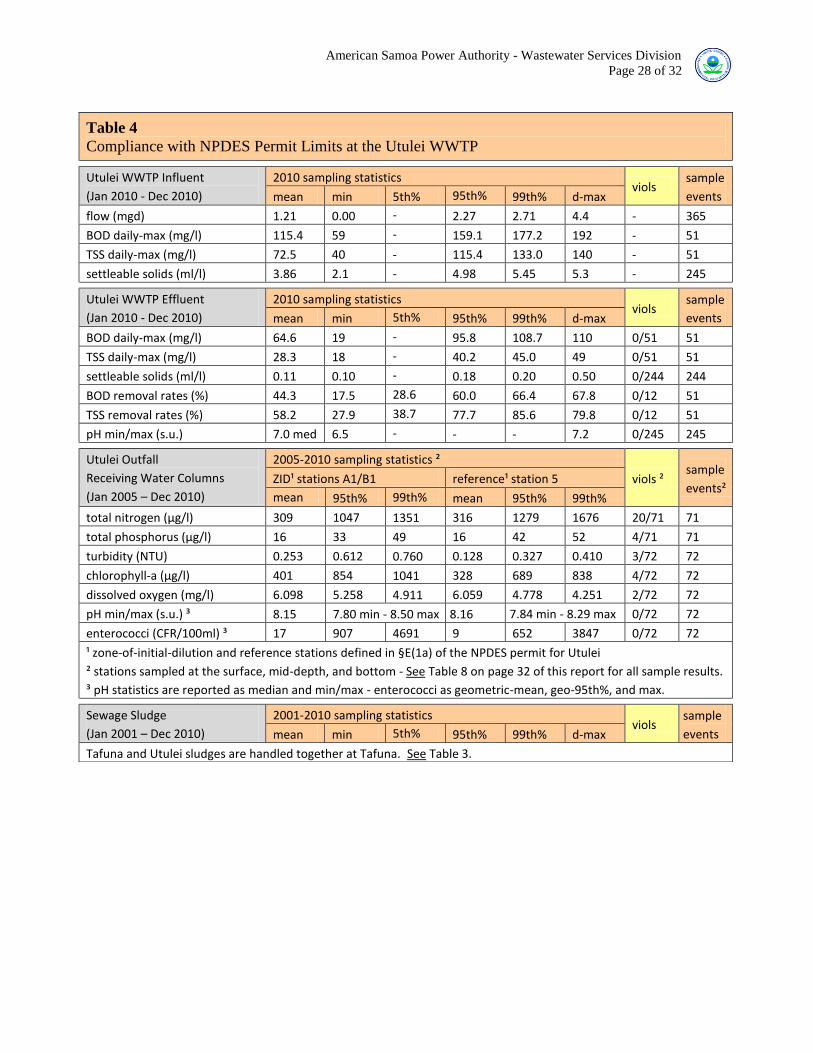
Table 4
Compliance with NPDES Permit Limits at the Utulei WWTP Utulei WWTP Influent
(Jan 2010 - Dec 2010)
2010 sampling statistics viols
sample
events mean min 5th% 95th% 99th% d-max
flow (mgd) 1.21 0.00 - 2.27 2.71 4.4 - 365
BOD daily-max (mg/l) 115.4 59 - 159.1 177.2 192 - 51
TSS daily-max (mg/l) 72.5 40 - 115.4 133.0 140 - 51
settleable solids (ml/l) 3.86 2.1 - 4.98 5.45 5.3 - 245
Utulei WWTP Effluent
(Jan 2010 - Dec 2010)
2010 sampling statistics viols
sample
events mean min 5th% 95th% 99th% d-max
BOD daily-max (mg/l) 64.6 19 - 95.8 108.7 110 0/51 51
TSS daily-max (mg/l) 28.3 18 - 40.2 45.0 49 0/51 51
settleable solids (ml/l) 0.11 0.10 - 0.18 0.20 0.50 0/244 244
BOD removal rates (%) 44.3 17.5 28.6 60.0 66.4 67.8 0/12 51
TSS removal rates (%) 58.2 27.9 38.7 77.7 85.6 79.8 0/12 51
pH min/max (s.u.) 7.0 med 6.5 - - - 7.2 0/245 245 Utulei Outfall
Receiving Water Columns
(Jan 2005 – Dec 2010)
2005-2010 sampling statistics ²
viols ² sample
events² ZID¹ stations A1/B1 reference¹ station 5
mean 95th% 99th% mean 95th% 99th%
total nitrogen (μg/l) 309 1047 1351 316 1279 1676 20/71 71
total phosphorus (μg/l) 16 33 49 16 42 52 4/71 71
turbidity (NTU) 0.253 0.612 0.760 0.128 0.327 0.410 3/72 72
chlorophyll-a (μg/l) 401 854 1041 328 689 838 4/72 72
dissolved oxygen (mg/l) 6.098 5.258 4.911 6.059 4.778 4.251 2/72 72
pH min/max (s.u.) ³ 8.15 7.80 min - 8.50 max 8.16 7.84 min - 8.29 max 0/72 72
enterococci (CFR/100ml) ³ 17 907 4691 9 652 3847 0/72 72
¹ zone-of-initial-dilution and reference stations defined in §E(1a) of the NPDES permit for Utulei
² stations sampled at the surface, mid-depth, and bottom - See Table 8 on page 32 of this report for all sample results.
³ pH statistics are reported as median and min/max - enterococci as geometric-mean, geo-95th%, and max. Sewage Sludge
(Jan 2001 – Dec 2010)
2001-2010 sampling statistics viols
sample
events mean min 5th% 95th% 99th% d-max
Tafuna and Utulei sludges are handled together at Tafuna. See Table 3.
Page 31
American Samoa Power Authority - Wastewater Services Division
Page 29 of 32
Table 5
Priority Pollutants and General Constituents for Tafuna Tafuna WWTP Effluent Mar05 Sep04
ammonia-N (mg/l) 26.6 32.0
total kjeldahl nitrogen (mg/l) 39.3 41.4
total phosphorus (mg/l) 3.6 4.2
oil and grease (mg/l) 26 13
total sulfides (mg/l) 0.33 0.10
sulfite (mg/l) 16 5
sulfate (mg/l) 10.9 17.7
MBAS (mg/l) 1.7 0.7
total phenolics (mg/l) 0.14 0.08
cyanide (mg/l) <0.003 <0.003
aluminum (µg/l) 484 711
arsenic (µg/l) <1.0 <5.0
barium (µg/l) 6.9 9.8
boron (µg/l) 106 127
cadmium (µg/l) <2.0 <5.0
chromium (µg/l) 3.1 <3.0
copper (µg/l) 7.4 7.2
iron (µg/l) 252 293
lead (µg/l) <1.0 2.5
manganese (µg/l) 24.0 28.9
mercury (µg/l) 0.0464 0.07
molybdenum (µg/l) <5.0 <9.0
nickel (µg/l) <3.0 <20.0
selenium (µg/l) <1.0 <1.0
silver (µg/l) <9.0 <5.0
zinc (µg/l) 38.6 50.6
4,4’-DDT (µg/l) <0.029 0.018
other pesticides (µg/l) <0.010 <0.010
1,4-dichlorobenzene (µg/l) 4.8 6.0
toluene (µg/l) <0.25 4.7
phenol (µg/l) 82 84
diethyl phthalate (µg/l) 6.2 7.5
bis(2-ethylhexyl)phthalate (µg/l) 22 16
4-nitrophenol (µg/l) <2.7 6.6
chloroform (µg/l) <0.21 0.45
methylene chloride (µg/l) <0.21 0.64
4-chloro-3-methylphenol (µg/l) <0.69 1.1
butyl benzyl phthalate (µg/l) <0.26 1.2
other volatiles/semi-voas (µg/l) <0.40 <0.40
dioxins (µg/l) 116(10-6
) 88 (10-6
)
Page 32
American Samoa Power Authority - Wastewater Services Division
Page 30 of 32
Table 6
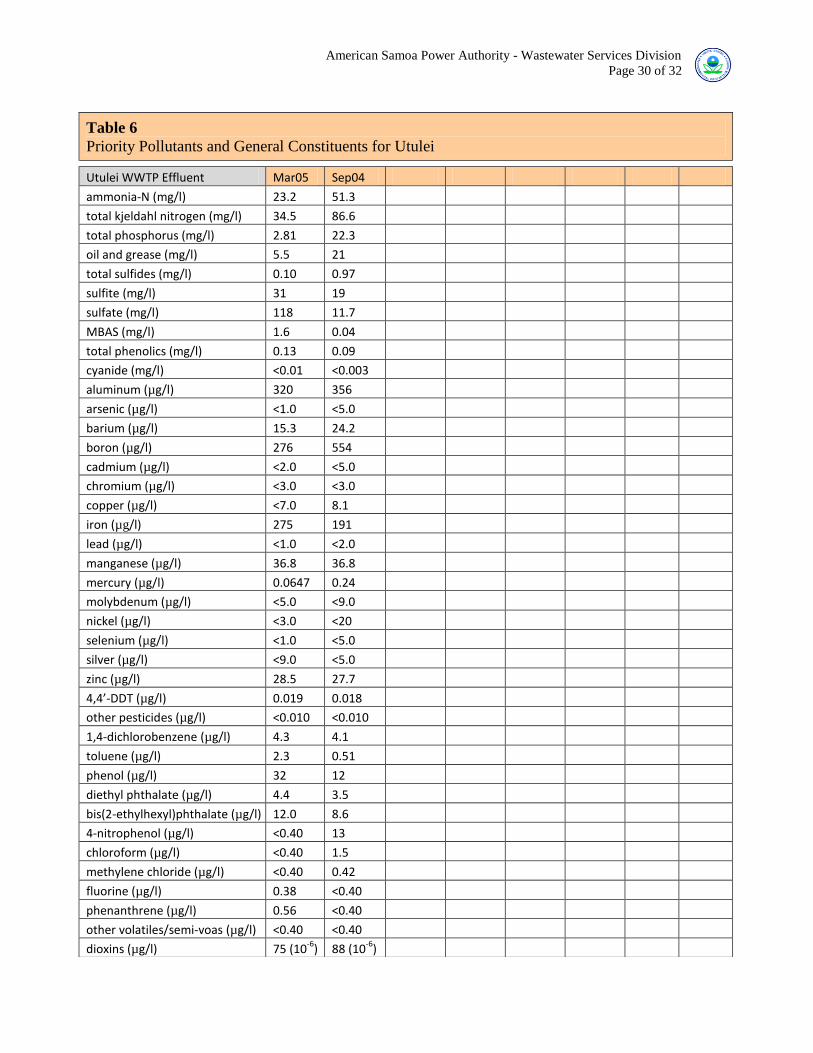
Priority Pollutants and General Constituents for Utulei Utulei WWTP Effluent Mar05 Sep04
ammonia-N (mg/l) 23.2 51.3
total kjeldahl nitrogen (mg/l) 34.5 86.6
total phosphorus (mg/l) 2.81 22.3
oil and grease (mg/l) 5.5 21
total sulfides (mg/l) 0.10 0.97
sulfite (mg/l) 31 19
sulfate (mg/l) 118 11.7
MBAS (mg/l) 1.6 0.04
total phenolics (mg/l) 0.13 0.09
cyanide (mg/l) <0.01 <0.003
aluminum (µg/l) 320 356
arsenic (µg/l) <1.0 <5.0
barium (µg/l) 15.3 24.2
boron (µg/l) 276 554
cadmium (µg/l) <2.0 <5.0
chromium (µg/l) <3.0 <3.0
copper (µg/l) <7.0 8.1
iron (µg/l) 275 191
lead (µg/l) <1.0 <2.0
manganese (µg/l) 36.8 36.8
mercury (µg/l) 0.0647 0.24
molybdenum (µg/l) <5.0 <9.0
nickel (µg/l) <3.0 <20
selenium (µg/l) <1.0 <5.0
silver (µg/l) <9.0 <5.0
zinc (µg/l) 28.5 27.7
4,4’-DDT (µg/l) 0.019 0.018
other pesticides (µg/l) <0.010 <0.010
1,4-dichlorobenzene (µg/l) 4.3 4.1
toluene (µg/l) 2.3 0.51
phenol (µg/l) 32 12
diethyl phthalate (µg/l) 4.4 3.5
bis(2-ethylhexyl)phthalate (µg/l) 12.0 8.6
4-nitrophenol (µg/l) <0.40 13
chloroform (µg/l) <0.40 1.5
methylene chloride (µg/l) <0.40 0.42
fluorine (µg/l) 0.38 <0.40
phenanthrene (µg/l) 0.56 <0.40
other volatiles/semi-voas (µg/l) <0.40 <0.40
dioxins (µg/l) 75 (10-6
) 88 (10-6
)
Page 33
American Samoa Power Authority - Wastewater Services Division
Page 31 of 32
Table 7
Six-Year Receiving Water Monitoring for Tafuna Outfall (2005-2010)
Tafuna Total-N Total-P DO pH chlor-a entero turb
Limits 0.13 mg/l 0.015 mg/l 5.5 mg/l 6.5-8.6 s.u. 0.25 mg/l 124/35 mpn/100ml 0.25 ml/l
Stations A1 A2 C A1 A2 C A1 A2 C A1 A2 C A1 A2 C A1 A1-lnx A2 A2-lnx C C-lnx A1 A2 C
Mar-05 0.11 0.12 <0.11 0.02 0.02 0.01 6.17 6.14 6.25 8.21 8.2 8.22 0.15 1.05 0.3 10 2.303 10 2.303 10 2.303 0.2 0.2 0.19
0.18 <0.11 <0.11 0.03 0.02 0.01 6.19 6.18 6.07 8.14 8.21 8.2 0.55 0.32 0.27 10 2.303 20 2.996 52 3.951 0.4 0.16 0.17
<0.11 0.13 <0.11 0.02 0.02 0.01 6.15 6.3 6.14 8.13 8.22 8.21 0.14 0.18 0.95 10 2.303 10 2.303 10 2.303 0.15 0.3 0.18
Jun-05 0.4 0.26 0.35 0.02 0.02 0.02 5.97 6.06 6.07 8.31 8.08 0.13 0.13 0.13 3255 8.088 305 5.720 2909 7.976 0.3 0.3 0.19
0.13 0.24 0.24 0.02 0.01 0.01 5.9 6.22 6.13 8.34 8.33 8.09 0.13 0.13 0.13 10 2.303 10 2.303 0 0.000 0.2 0.17 0.3
0.6 0.24 0.23 0.01 0.01 0.01 5.69 6.21 6.16 8.1 8.38 8.1 0.27 <0.05 0.27 0 0.000 0 0.000 10 2.303 0.18 0.11 0.14
Aug-05 0.602 0.321 0.138 0.04 0.02 0.03 6.41 6.47 6.06 8.27 8.3 8.29 0.8 <0.05 <0.05 52 3.951 0 0.000 63 4.143 0.15 0.15 0.17
0.244 0.171 0.131 0.02 0.02 0.04 6.42 6.35 6.15 8.19 8.26 8.29 0.4 <0.05 <0.05 31 3.434 10 2.303 256 5.545 0.17 0.15 0.17
0.292 0.169 0.197 0.03 0.03 0.02 6.25 6.26 6.24 8.1 8.31 8.33 <0.05 0.27 <0.05 256 5.545 10 2.303 52 3.951 0.14 0.15 0.11
Oct-05 0.24 0.389 0.201 0.02 0.02 0.01 6.2 6.08 5.86 8.21 8.23 8.2 <0.05 0.8 0.7 1565 7.356 4352 8.379 41 3.714 0.3 0.2 0.2
0.22 0.737 0.127 0.02 0.01 0.009 5.94 6.12 5.73 8.13 8.23 8.24 <0.05 0.8 0.8 85 4.440 52 3.951 0 0.000 0.3 0.17 0.18
0.107 0.112 0.362 0.01 0.02 0.01 5.89 6.02 5.66 8.08 8.22 8.24 <0.05 <0.05 <0.05 10 2.303 20 2.996 0 0.000 0.2 0.3 0.19
Feb-06 0.53 0.13 0.24 0.03 0.03 0.02 8.02 6.31 6.3 8.18 8.13 8.12 <0.05 <0.05 0.28 0 0.000 0 0.000 10 2.303 <0.01 <0.01 <0.01
0.13 0.31 0.2 0.01 0.02 0.01 5.58 6.27 6.08 8.21 8.2 8.18 0.13 <0.05 0.13 0 0.000 0 0.000 20 2.996 <0.01 <0.01 <0.01
0.14 0.21 0.12 0.008 0.02 0.02 4.83 5.89 5.78 8.19 8.18 8.18 1.3 0.27 0.48 0 0.000 0 0.000 472 6.157 0.5 <0.01 <0.01
Nov-06 0.275 0.367 0.353 0.03 0.02 0.02 6.1 6.13 5.89 8.13 8.25 8.2 0.27 0.27 <0.8 12031 9.395 20 2.996 0 0.000 <0.01 <0.01 <0.01
0.284 0.293 0.266 0.02 0.03 0.02 6.09 6.02 6.11 8.22 8.2 8.28 0.27 <0.8 <0.8 86 4.454 31 3.434 85 4.443 <0.01 <0.01 0.1
0.191 0.231 0.214 0.02 0.05 0.02 6.01 6.12 6.21 8.23 8.19 8.23 <0.8 0.27 0.27 187 5.231 98 4.585 20 2.996 0.4 0.1 0.1
Feb-07 0.13 0.12 0.29 0.01 0.02 0.02 6.56 6.46 6.2 7.84 7.84 7.8 <0.09 <0.09 <0.09 7701 8.949 0 0.000 0 0.000 0.1 <0.01 <0.01
0.14 0.11 0.11 0.02 0.01 0.02 6.56 6.65 6.45 7.86 7.88 7.81 <0.09 <0.09 <0.09 20 2.996 223 5.407 31 3.434 <0.01 <0.01 <0.01
0.106 0.11 0.12 0.02 0.01 0.02 6.75 6.7 6.8 7.87 7.87 7.78 <0.09 <0.09 <0.09 161 5.081 63 4.143 74 4.304 <0.01 <0.01 <0.01
Sep-07 0.274 0.164 0.169 0.03 0.02 0.04 6.21 6.23 6.25 8.15 8.29 8.23 <0.3 <0.3 0.3 2723 7.909 31 3.434 988 6.896 0.08 <0.01 0.45
0.104 0.104 0.614 0.02 0.02 0.02 6.26 6.29 6.31 8.33 7.99 8.26 0.8 <0.3 <0.3 2359 7.766 0 0.000 31 3.434 0.02 0.03 <0.01
0.172 0.554 0.104 0.02 0.06 0.01 6.25 6.3 6.27 8.27 8.32 8.22 <0.3 <0.3 0.3 10 2.303 52 3.950 0 0.000 <0.01 0.01 <0.01
Feb-08 0.279 0.109 1.415 0.04 0.03 0.03 6.09 6.3 5.92 8.13 8.15 8.11 <0.2 <0.2 <0.2 2481 7.816 1565 7.356 216 5.375 0.28 0.22 0.25
0.109 0.109 0.109 0.02 0.02 0.02 6.42 6.2 6.2 8.17 8.16 8.17 <0.2 <0.2 <0.2 0 0.000 0 0.000 0 0.000 0.28 0.21 0.19
0.109 0.109 0.109 0.02 0.02 0.02 6.19 6.19 6.07 8.16 8.17 8.16 0.5 <0.2 0.5 0 0.000 0 0.000 0 0.000 0.28 0.21 0.23
May-08 0.234 1.104 0.794 0.04 0.08 0.01 5.94 5.71 5.86 8.14 7.94 7.62 <0.3 <0.3 <0.3 1989 7.595 2755 7.921 31 3.434 0.14 0.18 0.13
0.134 0.164 0.104 0.02 0.01 0.01 5.92 5.34 5.51 7.8 7.52 8.08 <0.3 <0.3 <0.3 1100 7.003 269 5.595 10 2.303 0.16 0.04 0.11
0.404 0.434 0.374 0.01 0.01 0.09 5.83 5.26 5.06 8.07 7.87 8.13 <0.3 <0.3 <0.3 20 2.996 41 3.714 20 2.996 0.12 0.13 0.12
Feb-09 0.279 0.109 1.415 0.04 0.03 0.03 6.09 6.3 5.92 8.13 8.15 8.11 <0.2 <0.2 <0.2 2481 7.816 1565 7.356 216 5.375 0.28 0.22 0.25
0.109 0.109 0.109 0.02 0.02 0.02 6.42 6.2 6.2 8.17 8.16 8.17 <0.2 <0.2 <0.2 0 0.000 0 0.000 0 0.000 0.28 0.21 0.19
0.109 0.109 0.109 0.02 0.02 0.02 6.19 6.19 6.07 8.16 8.17 8.16 0.5 <0.2 0.5 0 0.000 0 0.000 0 0.000 0.28 0.21 0.23
Sep-09 0.519 0.629 1.419 0.012 0.024 0.011 6.44 6.42 6.96 8.13 8.13 8.2 0.27 0.27 <0.15 504 6.223 3654 8.204 0 0.000 0.19 0.34 0.18
0.509 0.609 0.859 0.01 0.01 0.011 6.25 6.32 6.77 8.14 8.12 8.15 <0.15 <0.15 <0.15 0 0.000 0 0.000 0 0.000 0.16 0.17 0.16
0.629 0.068 0.519 0.01 <0.01 <0.01 6.08 6.11 6.63 8.16 8.15 8.17 <0.15 <0.15 <0.15 10 2.303 185 5.220 10 2.303 0.17 0.16 0.17
Feb-10 0.133 0.221 0.141 0.016 0.016 0.015 6.39 6.43 6.31 8.18 8.24 8.14 <0.3 <0.3 <0.3 1782 7.485 987 6.895 0 0.000 0.26 0.2 0.16
0.184 0.254 0.131 0.007 0.007 0.007 6.61 6.51 6.06 8.28 8.3 8.27 <0.3 <0.3 <0.3 63 4.143 10 2.303 0 0.000 0.12 0.16 0.21
0.201 0.23 0.142 0.008 0.009 0.009 6.6 6.53 5.89 8.28 8.31 8.27 <0.3 <0.3 <0.3 10 2.303 10 2.303 0 0.000 0.14 0.14 0.12
Oct-10 0.18 0.13 <0.05 0.007 0.022 0.013 5.25 6.52 6.11 7.99 7.95 8.02 <0.6 <0.6 <0.6 959 6.866 907 6.810 20 2.996 0.37 0.28 0.23
<0.05 0.11 <0.05 0.013 0.015 0.013 5.1 5.81 6.1 8.1 8.07 8.06 <0.6 <0.6 <0.6 691 6.538 393 5.973 63 4.143 0.42 0.18 0.32
0.07 <0.05 <0.05 0.013 0.014 0.012 5.18 5.62 6.02 8.1 8.09 8.14 <0.6 <0.6 <0.6 6867 8.834 10 2.303 0 0.000 0.28 0.2 0.18
Statistics A1/A2 C A1/A2 C A1/A2 C A1/A2 C A1/A2 C A1/A2 lnx C lnx A1/A2 C
mean µ 0.242 0.308 0.020 0.019 6.156 6.115 8.17 8.17 0.191 0.215 41 3.712 11 2.430 0.167 0.151
σ(n-1) 0.186 0.361 0.012 0.014 0.416 0.331 median median 0.240 0.216 n/a 2.921 n/a 2.264 0.116 0.098
z-95th% 0.548 0.903 0.040 0.041 5.469 5.569 0.587 0.571 5017 8.531 477 6.167 0.358 0.312
z-99th% 0.674 1.148 0.048 0.051 5.186 5.344 0.751 0.717 36930 10.52 2223 7.707 0.437 0.379
min <0.05 <0.05 0.007 0.007 4.83 5.06 7.53 7.62 <0.05 <0.05 0 0.000 0 0.000 <0.01 <0.01
max 1.104 1.419 0.080 0.090 8.02 6.96 8.38 8.33 1.30 0.95 12031 9.395 2909 7.976 0.50 0.45
n 84 42 84 42 84 42 83 42 84 42 84 84 42 42 84 42
viols 50 26 57 21 6 1 0 0 19 13 30 6 21 3
viols% 60% 62% 68% 50% 7% 2% 0% 0% 23% 31% 36% 14% 25% 7%
correlation ZID ≤ Reference ZID ≈ Reference ZID ≈ Reference ZID ≈ Reference ZID ≈ Reference ZID > Reference ZID ≥ Reference
Page 34
American Samoa Power Authority - Wastewater Services Division
Page 32 of 32
Table 8
Six-Year Receiving Water Monitoring for Utulei Outfall (2005-2010)
Utulei Total-N Total-P DO pH chlor-a entero turb
Limits 0.200 0.030 5.0 6.5-8.6 1.0 104/35 0.75
Stations A1 B1 5 A1 B1 5 A1 B1 5 A1 B1 5 A1 B1 5 A1 A1-lnx B1 B1-lnx C C-lnx A1 B1 5
Feb-05 0.11 0.12 1.11 0.02 0.02 0.02 5.94 5.87 5.97 8.18 8.10 8.19 0.27 0.025 0.32 0 0.000 0 0.000 0.15 0.15 0.16
0.12 0.11 0.65 0.01 0.01 0.02 5.78 5.91 6.06 8.18 8.13 8.22 0.025 0.139 0.4 85 4.443 0 0.000 0.18 0.11 0.17
0.11 0.11 0.11 0.009 0.009 0.02 5.85 5.93 5.95 8.18 8.21 8.10 0.27 0.179 0.3 109 4.691 0 0.000 0.20 0.16 0.15
Aug-05 0.132 0.152 0.109 0.04 0.002 0.10 6.52 6.47 6.31 8.28 8.23 8.29 0.05 0.13 0.13 250 5.521 238 5.472 0.12 0.16 0.11
0.08 0.144 0.01 0.05 0.02 0.02 6.51 6.28 6.25 8.26 8.20 8.28 0.27 0.13 0.24 41 3.714 145 4.977 0.14 0.13 0.11
0.154 0.11 0.03 0.01 6.69 6.37 6.30 8.26 8.16 8.28 0.5 0.13 0.13 120 4.787 134 4.898 0.15 0.18 0.13
Feb-06 0.111 0.122 0.112 0.01 0.01 0.007 6.34 6.31 8.35 8.13 8.15 8.19 0.27 0.4 0.27 0 0.000 10 2.303 <0.02 <0.02 <0.02
0.114 0.11 0.111 0.01 0.01 0.01 6.03 6.20 6.62 8.16 8.14 8.20 0.14 1.00 0.15 0 0.000 197 5.283 <0.02 <0.02 <0.02
0.11 0.111 0.241 0.01 0.01 0.01 5.75 5.98 6.51 8.15 8.14 8.21 0.67 0.29 0.35 86 4.454 73 4.290 0.30 <0.02 <0.02
Nov-06 0.178 0.214 0.453 0.01 0.009 0.005 6.02 6.12 6.47 8.22 8.24 8.28 0.8 1.1 0.09 171 5.142 10 2.303 <0.02 <0.02 <0.02
0.147 0.278 0.676 0.008 0.005 0.004 6.09 5.94 6.25 8.24 8.22 8.25 0.8 0.53 0.09 10 2.303 223 5.407 <0.02 <0.02 <0.02
0.247 0.114 0.321 0.006 0.003 0.003 6.05 6.13 6.17 8.25 8.19 8.26 0.8 0.53 0.09 0 0.000 0 0.000 <0.02 <0.02 <0.02
Feb-07 0.234 0.169 0.107 0.02 0.03 0.019 6.04 6.05 5.95 7.93 7.91 7.92 0.09 0.09 0.09 10 2.303 0 0.000 0.30 0.30 <0.02
0.132 0.124 0.104 0.02 0.03 0.017 5.67 5.88 5.93 7.89 7.88 7.90 0.8 0.8 0.09 591 6.382 74 4.304 0.00 0.00 <0.02
0.215 0.19 0.108 0.03 0.03 0.016 5.62 6.09 6.00 7.86 7.87 7.89 0.09 0.09 0.09 0 0.000 20 2.996 0.30 <0.03 <0.02
Sep-07 1.013 0.115 0.11 0.02 0.02 0.02 6.53 6.68 6.83 8.50 8.11 8.29 1.1 0.5 0.27 121 4.796 74 4.304 1354 7.211 0.56 0.51 0.10
0.334 0.111 0.176 0.02 0.02 0.02 6.46 6.57 6.75 8.32 8.14 8.23 0.5 0.5 0.27 10 2.303 341 5.832 132 4.883 1.14 0.28 0.10
0.796 0.109 0.106 0.02 0.01 0.03 6.28 6.37 6.67 8.27 8.14 8.21 0.3 0.3 0.09 31 3.401 10 2.303 10 2.303 0.10 0.23 <0.02
May-08 0.124 0.242 0.311 0.03 <0.004 0.009 5.22 4.54 5.09 8.02 8.17 8.13 1.1 0.5 <0.3 0 0.000 0 0.000 31 3.434 0.30 0.38 0.07
0.127 0.571 0.254 0.01 <0.004 0.01 5.14 4.70 5.24 8.11 8.17 8.10 0.5 0.5 0.5 1043 6.950 246 5.505 0 0.000 0.36 0.21 0.08
0.194 0.624 0.564 0.008 0.004 0.007 5.42 5.13 5.25 8.07 8.16 8.16 0.5 <0.3 0.5 10 2.303 0 0.000 10 2.303 0.24 0.18 0.01
Sep-08 0.524 0.125 0.113 0.04 0.03 0.02 5.88 5.95 6.27 8.14 8.14 8.17 <0.2 0.8 0.8 0 0.000 529 6.271 809 6.696 0.34 0.30 0.25
0.152 0.118 0.117 0.03 0.02 0.02 5.85 6.00 6.19 8.17 8.17 8.14 <0.2 <0.2 0.8 66 4.190 66 4.190 0 0.000 0.40 0.40 0.19
0.12 0.134 0.16 0.04 0.02 0.01 5.92 6.02 6.08 8.15 8.14 8.16 <0.2 <0.2 0.8 20 2.996 31 3.434 0 0.000 0.32 0.52 0.16
Feb-09 0.109 0.109 0.109 0.02 0.02 0.01 6.99 6.92 6.31 8.21 8.21 8.15 1.1 0.3 0.5 0 0.000 0 0.000 0 0.000 0.85 0.45 0.34
0.109 0.889 0.109 0.02 0.02 0.02 6.58 6.63 6.25 8.17 8.17 8.14 0.5 0.5 0.3 213 5.361 0 0.000 0 0.000 0.43 0.50 0.31
0.109 0.999 0.109 <0.004 0.007 0.02 6.19 6.04 5.47 8.15 8.15 8.12 0.3 <0.2 0.5 0 0.000 0 0.000 20 2.996 0.45 0.40 0.29
Sep-09 2.275 1.646 3.439 0.018 0.018 0.011 5.34 5.83 5.11 8.14 8.16 8.15 0.8 0.53 0.53 10 2.303 31 3.434 10 2.303 0.44 0.44 0.38
1.640 0.689 0.629 0.017 0.016 0.011 5.65 5.59 5.69 8.15 8.16 8.16 <0.3 <0.3 <0.3 0 0.000 0 0.000 0 0.000 0.66 0.8 0.32
1.919 0.629 0.189 0.013 0.012 0.011 5.75 5.73 5.52 8.17 8.17 8.16 0.53 <0.3 <0.3 0 0.000 0 0.000 0 0.000 0.58 0.25 0.48
Feb-10 0.109 0.109 0.11 0.008 0.009 0.013 7.11 7.04 6.31 8.14 8.17 8.13 0.53 <0.3 <0.3 2098 7.649 1607 7.382 2481 7.816 0.18 0.21 0.08
0.109 0.109 0.159 0.013 0.008 0.012 6.47 6.52 3.08 8.12 8.15 8.18 0.8 0.53 <0.3 10 2.303 1106 7.009 0 0.000 0.16 0.15 0.09
0.109 0.127 0.109 0.008 0.009 0.013 6.30 6.25 5.87 8.14 8.17 8.18 <0.3 <0.3 <0.3 74 4.304 10 2.303 10 2.303 0.18 0.13 0.04
Oct-10 0.0532 0.0677 0.0532 0.005 0.013 0.013 7.15 6.54 6.59 7.80 7.98 7.84 0.8 <0.6 0.8 0 0.000 10 2.303 31 3.434 0.22 0.15 0.26
0.0532 0.0532 0.0532 0.014 0.013 0.012 6.62 6.22 6.33 7.87 8.00 7.90 <0.6 <0.6 <0.6 52 3.951 573 6.351 0 0.000 0.11 0.15 0.21
0.0532 0.0532 0.0532 0.014 0.013 0.012 6.77 5.77 6.12 7.89 8.01 7.93 <0.6 0.8 <0.6 41 3.714 0 0.000 0 0.000 0.14 0.17 0.20
Statistics A1/B1 5 A1/B1 5 A1/B1 5 A1/B1 5 A1/B1 5 A1/B1 lnx C lnx A1/B1 5
mean µ 0.309 0.316 0.016 0.016 6.098 6.059 8.15 8.16 0.401 0.328 17 2.821 9 2.175 0.253 0.128
σ(n-1) 0.447 0.584 0.010 0.016 0.510 0.776 median median 0.275 0.219 n/a 2.417 n/a 2.609 0.218 0.121
z-95th% 1.047 1.279 0.033 0.042 5.258 4.778 0.854 0.689 907 6.810 652 6.481 0.612 0.327
z-99th% 1.351 1.676 0.049 0.052 4.911 4.251 1.041 0.838 4691 8.45 3847 8.255 0.76 0.41
min 0.0532 0.010 <0.004 <0.004 4.54 3.08 7.80 7.84 0.025 0.09 0 0.000 0 0.000 <0.02 <0.02
max 2.275 3.439 0.050 0.100 7.15 8.35 8.50 8.29 1.10 0.8 2098 7.649 2481 7.816 1.14 0.48
n 71 36 71 36 72 36 72 36 72 36 72 72 21 21 72 36
viols 20 11 4 1 2 1 0 0 4 0 20 4 3 0
viols% 28% 31% 6% 3% 2% 2% 0% 0% 6% 0% 28% 19% 4% 0%
correlation ZID ≈ Reference ZID ≈ Reference ZID ≈ Reference ZID ≈ Reference ZID ≥ Reference ZID ≈ Reference ZID ≥ Reference