+ All Categories
Home > Documents > Asphalt Binder Lubricity, Impacts of WMA on Energy and Emissions · 2016-04-26 · ARC Project...

Asphalt Binder Lubricity, Impacts of WMA on Energy and Emissions · 2016-04-26 · ARC Project...

Date post: 20-Apr-2020
Category:
Upload: others
View: 3 times
Download: 0 times
Share this document with a friend
53
ARC Project Update Asphalt Binder Lubricity, Impacts of WMA on Energy and Emissions Hussain U. Bahia , Andrew Hanz, and Scott Schwandt Warm Mix Technical Working Group Meeting May 18, 2010 Auburn, AL
Transcript

ARC Project Update

Asphalt Binder Lubricity,

Impacts of WMA on Energy and Emissions

Hussain U. Bahia , Andrew Hanz, and Scott Schwandt

Warm Mix Technical Working Group Meeting May 18, 2010Auburn, AL

Outline of Talk

•Asphalt Binder Lubricity

– New Procedure for Higher Temperatures

– Preliminary Results

– Relationship with Mixture Workability Parameters

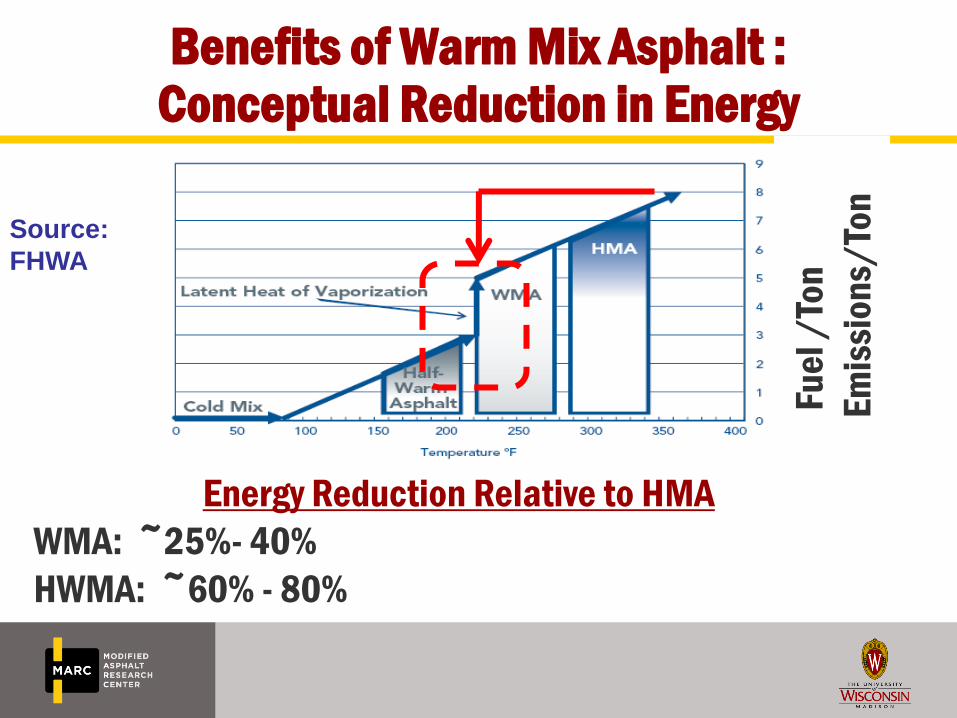
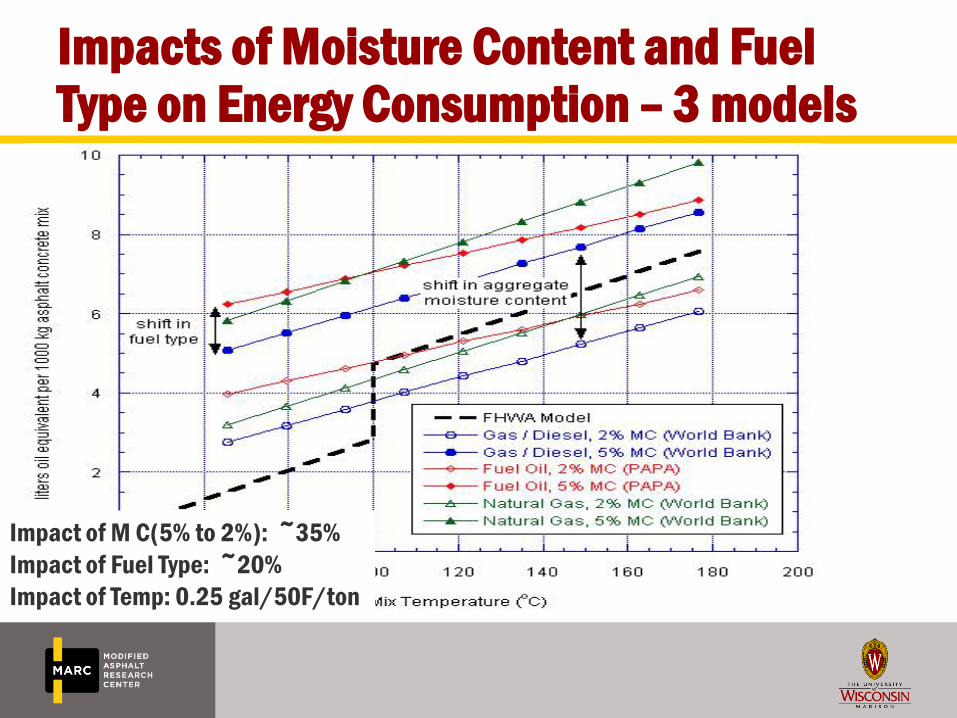
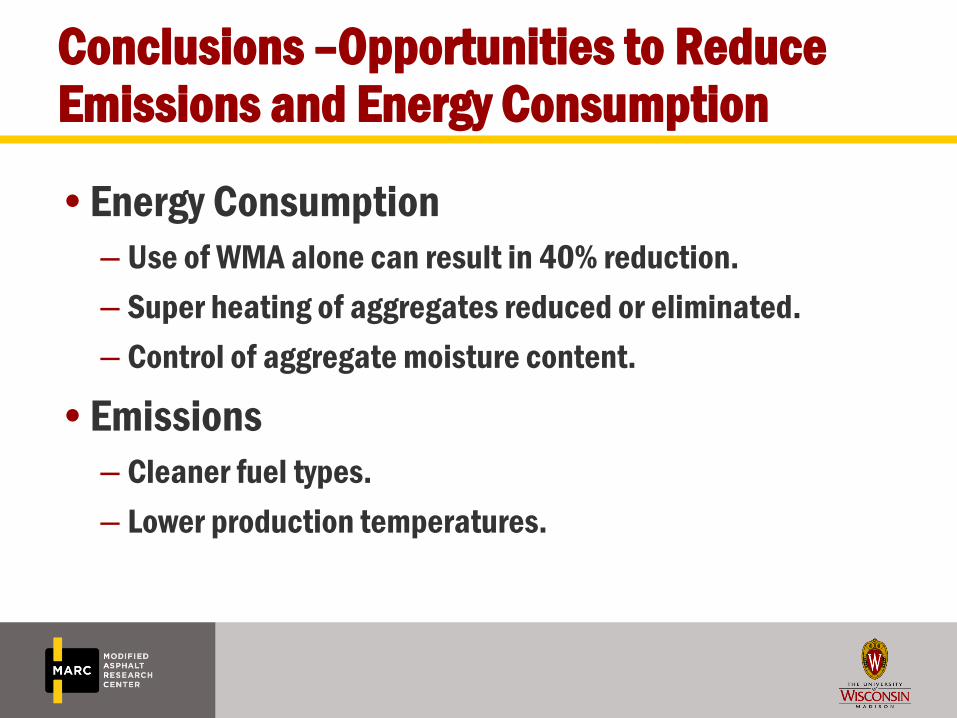
• Impact of Reduced Production Temperatures

– Energy Consumption

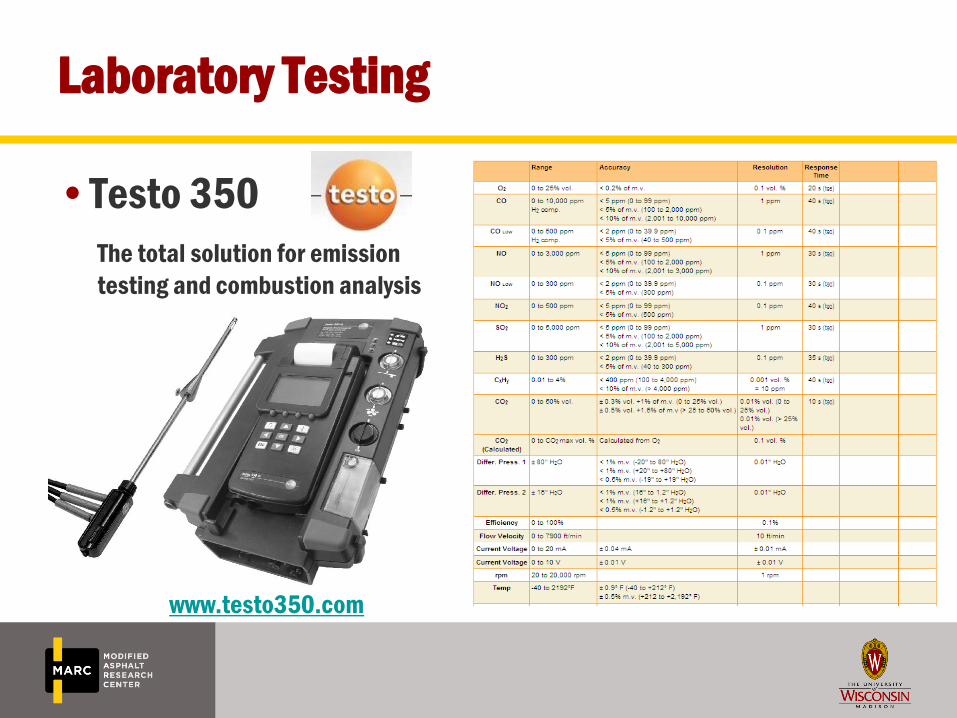
– Emissions: Laboratory Measurements and Field

Study Main Objectives

•Verfify Warm Mix Additives (WMA) Effects

Reducing viscosity

Lubrication

•Determine how much is needed.

WMA content versus temperature reduction

Cost is based on content, justify use by saving heat

energy and recuing emissions

Asphalt Binder Lubricity –Previous Results

• Presented procedure to

measure Coefficient of

Friction for Asphalt Binders.

• Results showed potential to

differentiate between binder

grades and WMA Additives

• Due to machine limitations

testing was limited to

<100oC

Asphalt Binder Lubricity – New Efforts

• Modify Testing Fixture

– Allow for testing at higher temperatures.

– Requires use of different DSR in UW Madison Laboratories

• Modify Test Procedure

– Control Gap, Speed, and Temperature During Testing.

– Increase thermal equilibration time.

– Monitor Normal Force and Torque.

• Test at temperatures consistent with lab mixture

compaction

– 90, 110, and 135oC

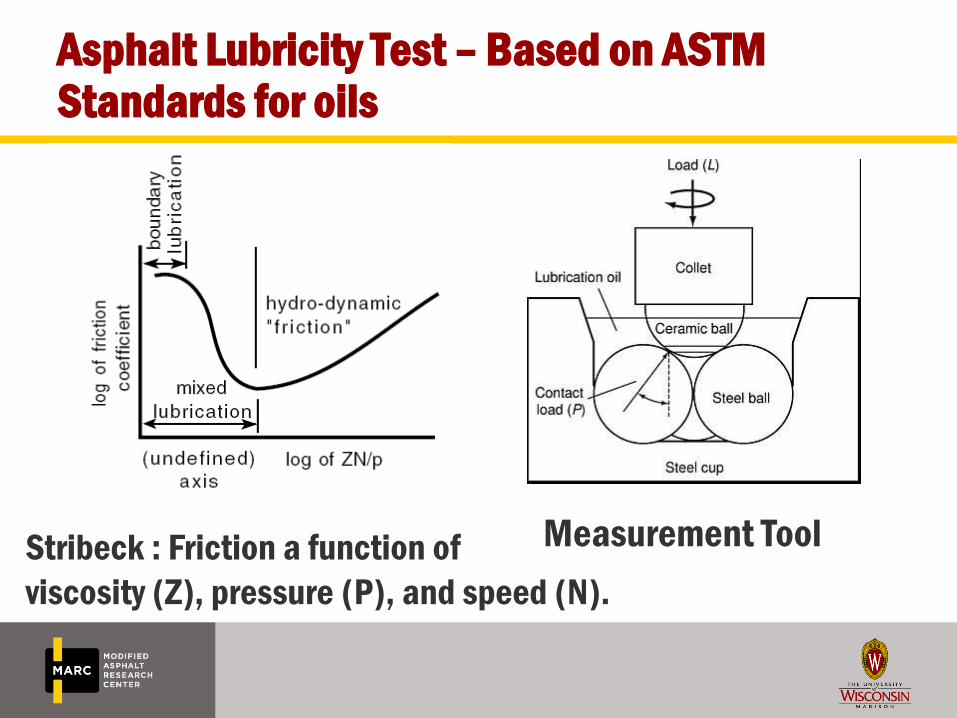
Asphalt Lubricity Test – Based on ASTM Standards for oils

Measurement ToolStribeck : Friction a function of

viscosity (Z), pressure (P), and speed (N).

Asphalt Binder Lubricity – New Fixture

Cup machined for torsion bar

geometry in TA DSR.

Balls are fixed by lid that screws

into cup.

Asphalt Binder Lubricity – New Fixture

Torque and normal force

applied by chuck from top of

machine.

Before testing zero gap is

established using cup and

chuck.

Asphalt Binder Lubricity – Test Procedure

• After gap is zeroed, a sample of asphalt ( 4 gm) is placed in the

cup and melted at 90oC.

• Chuck is lowered until a normal force of ~15N is established.

• Thermal equilibration for 45 minutes – 1 hour.

• Test is conducted at speeds of 10, 20, and 40 RPM.

• Procedure is repeated for 110oC and 135oC

Asphalt Lubricity Test - Calculations

• Torque and normal force are monitored under constant

speed and gap.

• The coefficient of friction (μ) is obtained from the normal

force and torque measured

– Where:

– C = 2.842 – Value of constant for the four ball testing fixture

geometry, T = Torque (N), P = Normal Force (N), d = diameter (m)

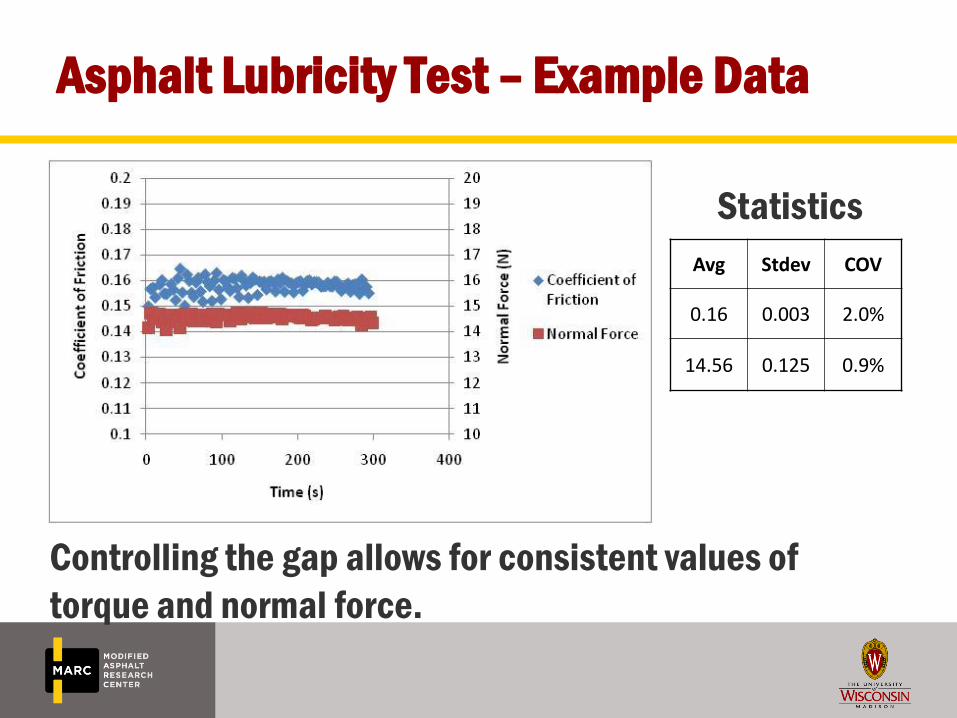
Asphalt Lubricity Test – Example Data

Avg Stdev COV

0.16 0.003 2.0%

14.56 0.125 0.9%

Statistics

Controlling the gap allows for consistent values of

torque and normal force.

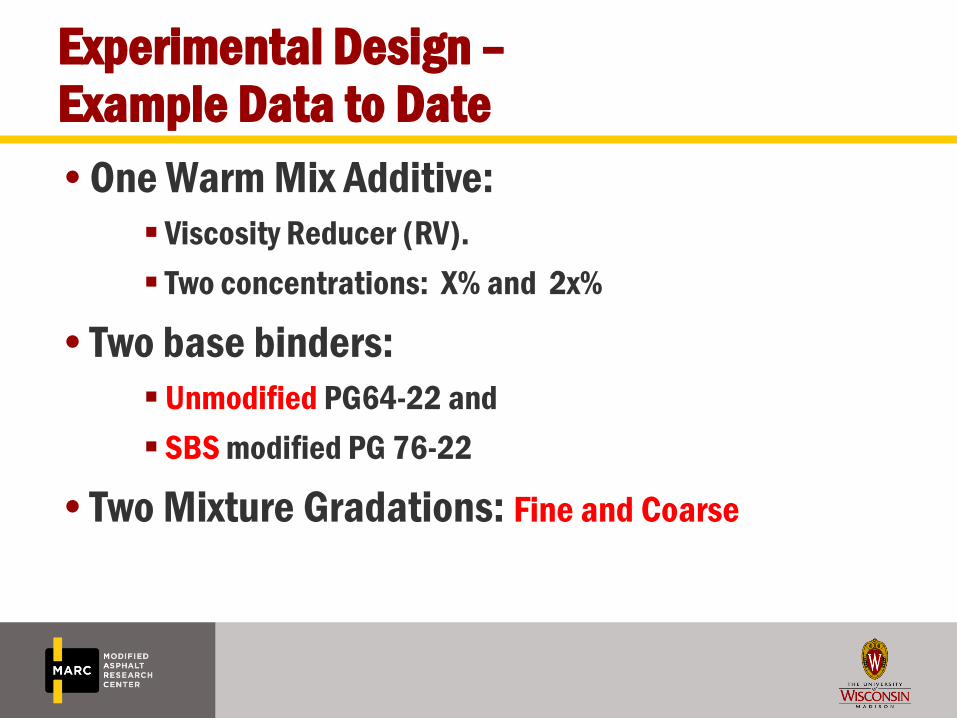
Experimental Design –Example Data to Date

•One Warm Mix Additive:

Viscosity Reducer (RV).

Two concentrations: X% and 2x%

•Two base binders:

Unmodified PG64-22 and

SBS modified PG 76-22

•Two Mixture Gradations: Fine and Coarse

Experimental Plan - Testing

•Binder Workability:

Asphalt Binder Viscosity – Rotational Viscometer

Asphalt Binder Lubricity – New DSR test

•Mixture Workability:

Gyratory Compaction Indices:

> Construction Force Index using the GPDA - (CFI)

> Number of Gyrations to 92 % Gmm- N92

Effect of WMA Additive on Viscosity

VR-2 results in a PG 76-22, with similar viscosity to

unmodified PG 64-22.

PG 76-22

PG 76+ x % VR

PG 76 + 2x % VR

PG 64-22

Viscosity and Compaction Effort

y = 0.0004x + 12.656

R² = 0.3585

0.0

5.0

10.0

15.0

20.0

25.0

30.0

35.0

40.0

45.0

100 1000 10000 100000

N9

2

Log Viscosity (cPs)

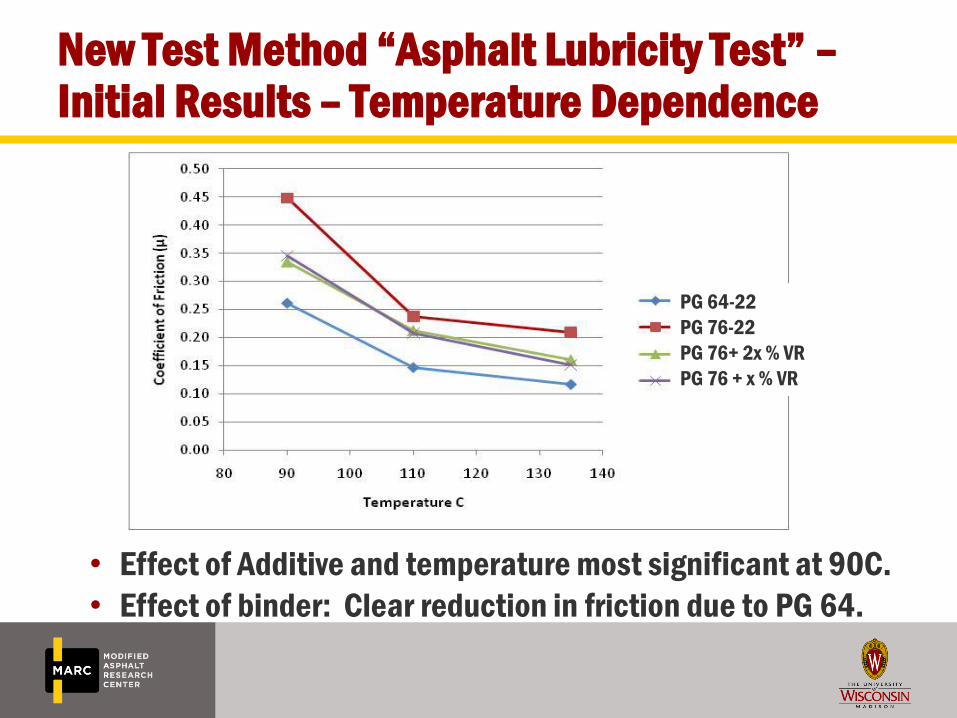
New Test Method “Asphalt Lubricity Test” –Initial Results – Temperature Dependence

• Effect of Additive and temperature most significant at 90C.

• Effect of binder: Clear reduction in friction due to PG 64.

PG 64-22

PG 76-22

PG 76+ 2x % VR

PG 76 + x % VR

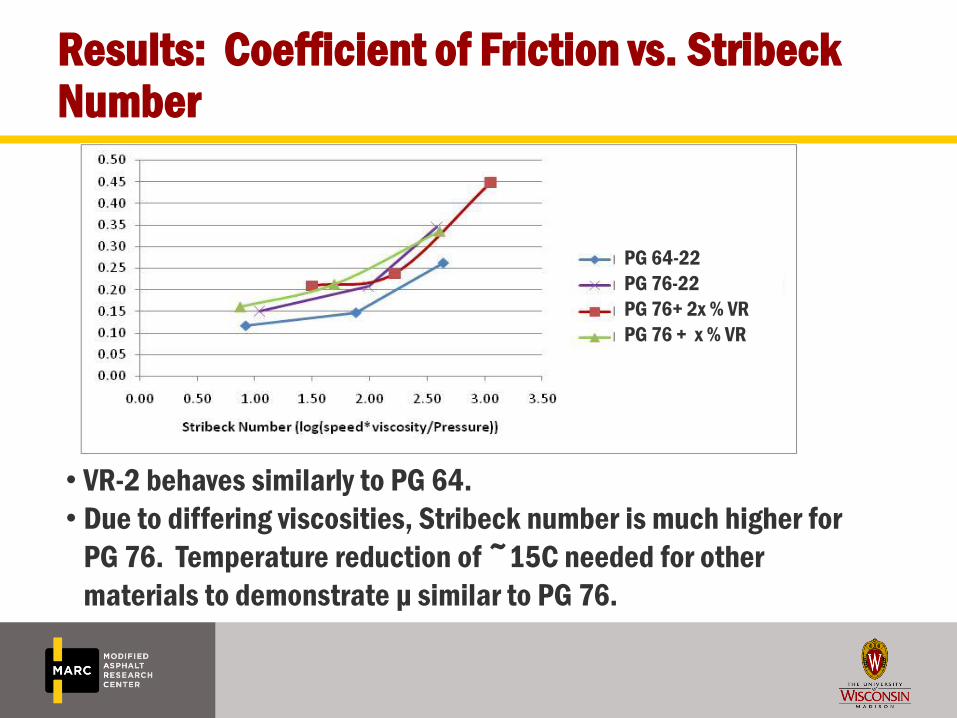
Results: Coefficient of Friction vs. StribeckNumber

• VR-2 behaves similarly to PG 64.

• Due to differing viscosities, Stribeck number is much higher for

PG 76. Temperature reduction of ~15C needed for other

materials to demonstrate μ similar to PG 76.

PG 64-22

PG 76-22

PG 76+ 2x % VR

PG 76 + x % VR

Mixture Workability

–Evaluation Criteria

Gyratory Compaction indices

> Gyrations to 92% Gmm

> Construction Force Index (CFI) using the

GPDA

18

Effects of WMAs on CFI (Mixture Workability) –

Fine Gradation

HMA

PG 64-22

PG 76-22

PG 76+ 2x % VR

PG 76 + x % VR

• Major WMA effects

at 90οC.

• VR-2 at 2x% show

more effects at all

temperatures.

Effect of WMA on CFI –Coarse Gradation

• WMA Effects –

similar to fine

gradation.

• Effect of gradation

on workability.

– CFI (FINE)Range:

150-500

– CFI (COARSE)

Range: 300-800

HMA

PG 64-22

PG 76-22

PG 76+ 2x % VR

PG 76 + x % VR

Regression Analysis

•Model Parameters

– Asphalt Binder Workability

Viscosity: Estimated at 90C,

tested at 110C and 135C

Lubricity: Tested at 90, 110,

and 135C. Avg of three speeds.

– Gradation

Quantified using Beta

> Fine: 4.29

> Coarse: 6.34

•Response

– Mixture Workability –

CFI and N92

Gradation Analysis and Modeling

Higher β

Weibull distribution

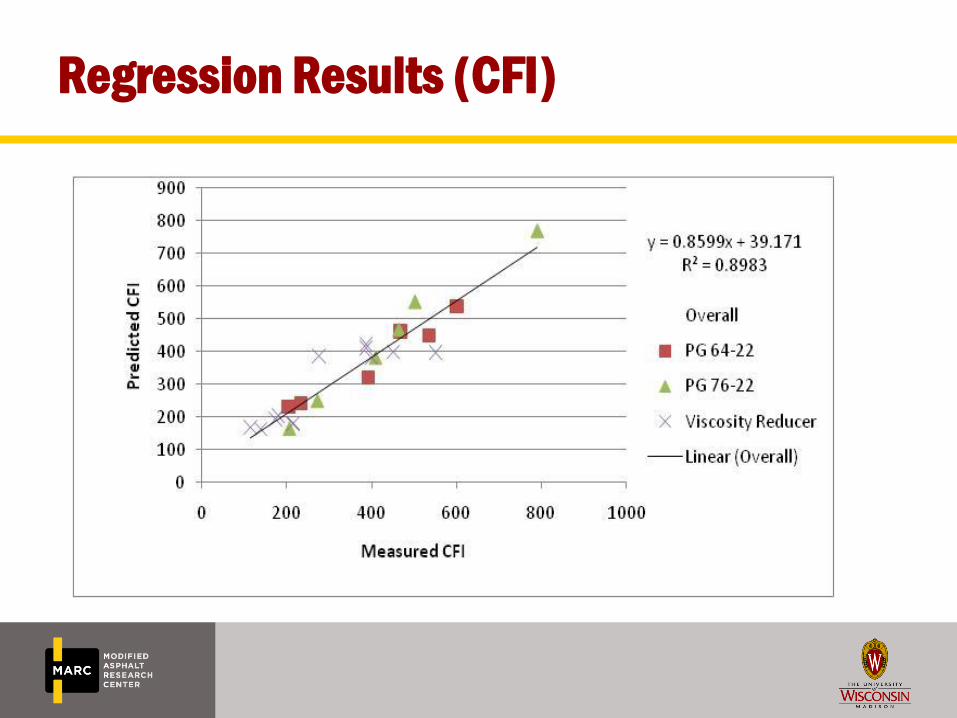
Regression Results (Compaction Force Index)

• Regression Analysis: CFI = F(Coef Fric, Visc, Bet a)

• CFI = - 108+ 106 Beta -1036 Coef Fric. + 0.0202 Visc

Predictor Coef SE Coef T P

Constant -108 89.66 -1.2 0.224

Beta 106 13.24 8.03 0.000

Coef.

Friction-1036 302.2 -3.43 0.003

Visc 0.02 0.004 6.34 0.000

Regression Results (CFI)

Regression Results (N92)

•N92 = - 5.55 + 8.455 Beta – 89.8 Coef. Friction -

0.00167 Visc

Predictor Coef SE Coef T P

Constant -5.55 7.504 -0.74 0.468

Beta 8.455 1.108 7.63 0.000

Coef. Friction -89.81 25.3 -3.55 0.002

Visc 0.00163 0.00026 6.24 0.000

Regression Results (N92)

Summary of Interim Findings

•Warm Mix Additive affect laboratory compaction.

– Main affect at lower temperatures (<100 C).

– Reduction in viscosity and coefficient of friction both

identified as significant.

•Results were consistent with classification of WMA

additive as a viscosity reducer.

•Cost need to be justified by energy savings &

environmental impact.

Next Steps

• More Lubricity Testing is needed

– Establish repeatability of procedure.

– More WMA additives.

– Wider range of temperatures?

• Potential to use lubricity and viscosity to classify

WMA additives

– Confirm findings with other viscosity reducers

(Sasobit)

– Establish similar relationship for other WMA

mechanisms

Impacts of WMA Additives on Energy Consumption

29

Energy Consumption in Production of HMA

30

Opportunities for Energy

Reduction

• Reduce production

temperature: Warm

Mix, Half Warm Mix,

Cold Mix.

• Reduce/control

moisture content of

aggregates prior to

production.

Benefits of Warm Mix Asphalt : Conceptual Reduction in Energy

Source:

FHWA

Fue

l /To

n

Em

issi

on

s/To

n

Energy Reduction Relative to HMA

WMA: ~25%- 40%

HWMA: ~60% - 80%

Tools Available to Quantify Environmental Impacts of WMA

•Plant Diagnostic Tool

–Pennsylvania Asphalt Pavement Association

(PAPA)

•Estimation Tool

–Models Developed by the World Bank

PAPA Plant Diagnostic Tool

• Generalize plant operations: Focused on drying costs

and exhaust gases in a web-based interface.

World Bank Estimation Tools

•Estimate Emissions and Energy Consumption

as a function of:

–Aggregate Moisture Content

–Fuel Type

–Production Temperature

•Tool to quantify importance and relative

impacts of production related factors.

Impacts of Moisture Content and Fuel Type on Energy Consumption – 3 models

Impact of M C(5% to 2%): ~35%

Impact of Fuel Type: ~20%

Impact of Temp: 0.25 gal/50F/ton

Reduction in Fuel ConsumptionBased on Three Existing Models

0

0.5

1

1.5

2

2.5

100 150 200 250 300 350 400 450

Mix Temp (F)

Fu

el

(gal

/ to

n m

ix) 5% Moisture

2% Moisture

O.25 gallon per 50 F

Impacts of Moisture Content and Fuel Type on Emissions– 3 Models

Impact of Moisture Content (5% to 2%): ~40%

Impact of Fuel Type: ~20%

Impact of Temp: 5 lbs/50F/ton

Conclusions –Opportunities to Reduce Emissions and Energy Consumption

•Energy Consumption

– Use of WMA alone can result in 40% reduction.

– Super heating of aggregates reduced or eliminated.

– Control of aggregate moisture content.

•Emissions

– Cleaner fuel types.

– Lower production temperatures.

Next Steps

•Life-cycle perspective.

– Performance of WMA must be similar to HMA for

environmental benefits to be realized.

•Field Projects with WisDOT (4-6 this summer)

– Laboratory Performance: Binder and Mixture

– Fuel Consumption

– Estimate of Emissions

– Monitoring of Pavement Performance

Laboratory Measurement of Emissions and Impacts

of Reduced Temperatures

40

Study Objective / Scope

• Laboratory & Field (asphalt

plant stack) Testing

– Corroborate WMA usage benefits

regarding emissions

– Corroborate Jullien (LCPC) results

– Corroborate EPA emission factors

– Quantify asphalt and burner fuel

emission fractions

• Laboratory Testing

– Model asphalt fume PAH

emission vs. temperature

Temperature

PA

H E

mis

sio

n

Study Objective / Scope

• Asphalt Plant Emissions

– CO

– CO2

– SO2

– NOx

– CH4

• Occupational Health Emissions– Polycyclic Aromatic Hydrocarbons (PAH)

Anthracene

Benzo(a)anthracene

Benzo(a)Pyrene

Chrysene

Coronene*

Fluoranthene*

Methyl Cholanthrene (3-)

Naphthalene

Perylene

Phenanthrene

Pyrene

*Testing resulted in no measurable quantity

Emissions of Interest

Experimental Design (Laboratory)

•Testing

– 40 Extended OSHA 58 Method tests by Wisconsin

Occupational Health Laboratory (WOHL)

•Two Phase Analysis (20 tests each)

– Phase I: Design of Experiment (DOE)

Factorial Design: 24 (2 Level, 4 Factors)

> 24 = 16

> 4 “Blanks” (contamination check)

– Phase II: PAH/Temperature Modeling

4 sample types @ 5 temperatures

Experimental Design (Laboratory)

• Experimental Factors • Experimental Design

Level

Factors -1 1

Asphalt Source Flint Hills CitgoFlask Rotation (ω/min) 40 90

Test Duration (min) 15 45

Test Temperature ( C) 130 180

StdOrder RunOrder AC Source Rotation Test Duration Test Temp

1 13 -1 -1 -1 -1

2 7 1 -1 -1 -1

3 14 -1 1 -1 -1

4 3 1 1 -1 -1

5 12 -1 -1 1 -1

6 16 1 -1 1 -1

7 1 -1 1 1 -1

8 11 1 1 1 -1

9 15 -1 -1 -1 1

10 5 1 -1 -1 1

11 6 -1 1 -1 1

12 10 1 1 -1 1

13 8 -1 -1 1 1

14 4 1 -1 1 1

15 2 -1 1 1 1

16 9 1 1 1 1

Blank samples were run prior to runs: 1, 5, 9, 13

Laboratory Testing

•UW-Madison Test Setup

Overall Setup

Laboratory Testing

•UW-Madison Test Setup

Laboratory Testing

•UW-Madison Test Setup

Laboratory Testing

•Testo 350

The total solution for emission

testing and combustion analysis

www.testo350.com

Laboratory Testing

•OSHA Versatile Sampler Tubes (OVS Tube)

• Designed to trap aerosols and

adsorb vapors

• Typical Flow Rate of 1.0 L/min

• Tubes analyzed for PAHs by high

performance liquid

chromatography (HPLC)* with a

fluorescene (FL) detector

*Performed by WOHL

Data Analysis

• Preliminary Models developed

– Emission Gas = Constant + a[Source] + d[Temperature]

– PAH = Constant + d[Temperature]

DOE Results

Conclusions

• Laboratory process evaluation

– “Blank” sample analysis

Possible residual contamination from previous test

> Affected measurements: NO, SO2, NOx, Naphthalene

Incorporate a “cleaning cycle” between tests

– Lab setup components

System air flow control

Heated rotating flask

Testo 350 collection/measurement

OVS Tube collection / analysis

All worked well

Conclusions

•DOE Results

–Significant Factors: Asphalt Source, Test Temperature

Future Testing: use slow flask rotation speed and 15 min

test duration

• Phase I of the study complete

Study Continuation

•Begin Phase II

–Create Asphalt emission development vs

temperature models

– Conduct field stack testing

Corroborate WMA benefits

Corroborate Jullien results

Corroborate EPA emission factors

Quantify asphalt/burner fuel emission fractions


Recommended