The assignment of tasks to work stations along an assembly line in such a way as
to achieve the same or close to sameworking times at each work station.
THE GOAL IS TO CREATE A SMOOTH,THE GOAL IS TO CREATE A SMOOTH,CONTINUOUS FLOW OF PRODUCT THROUGHCONTINUOUS FLOW OF PRODUCT THROUGH
THE ASSEMBLY LINE FOR MAXIMUMTHE ASSEMBLY LINE FOR MAXIMUMPRODUCTIVITY AND MINIMUM IDLE TIMEPRODUCTIVITY AND MINIMUM IDLE TIME
AT EACH WORK STATIONAT EACH WORK STATION
Assembly Line BalancingAssembly Line BalancingAPPLICATIONS
Cafeteria line
Carwash line
Appliance manufacturing line
Automobile manufacturing line
Registry of Motor Vehicles office line
Disassembly line
Fabrication line
Physical exams for military recruits
- POULTRY SLAUGHTER- AUTOMOBILE RECYCLING
- PRODUCTION OF PARTS VIA SERIES OF MACHINES
Assembly Line BalancingCafeteria Line
Station 1Station 1Trays, Plates, Utensils
Station 2Station 2Appetizers
Station 3Station 3Entrees
Station 4Station 4Desserts
Station 5Station 5Cashier
Assembly Line BalancingAssembly Line BalancingPoultry Dissassembly Line
Station 1
Station 2
Station 3
Station 4
Station 5
Station 6
Assembly Line BalancingRaw Recruit Physical Examinations
14 Stations includingReception
Eye ExaminationChest X-ray
Weight + Height MeasurementPsychological
Heart Rate
Assembly Line BalancingAssembly Line BalancingWHEN IT IS DONEWHEN IT IS DONE
BEFORE ACTUAL PRODUCTIONIN WESTERN MANUFACTURING
SYSTEMS
DURING ACTUAL PRODUCTIONIN ASIAN MANUFACTURING
SYSTEMS
Individual Task TimesIndividual Task Times
These are set well in advance by industrial engineers and time & motion specialists
They are called standard task times and consist of normal time to perform a particular task and extra time allowances for fatigue, personal needs, and unavoidable, but recurring delays.
The Assembly Line BalancingThe Assembly Line Balancing Concept Concept
Station1
Station2
Station3
The Assembly Line
towarehouse
orretailer
At the end of every cycle, each station hands itsAt the end of every cycle, each station hands its work-in-process unit to the next station.work-in-process unit to the next station.
A cycle is the amount of time that a work-in-process unit canstay in a work station before it must move onto the next.
The Assembly Line BalancingThe Assembly Line Balancing Concept Concept
Station1
Station2
Station3
The Assembly Line
towarehouse
orretailer
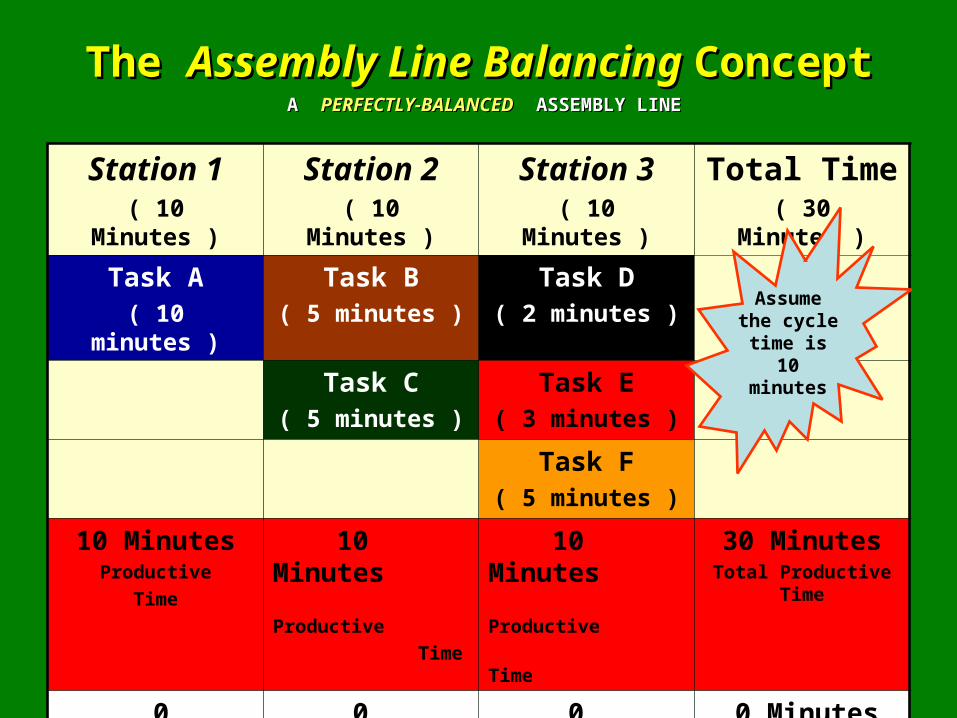
The effective production rate for the assembly line The effective production rate for the assembly line equals one completed product every equals one completed product every 1010 minutes, minutes,
even though each unit requires 30 minutes to build!even though each unit requires 30 minutes to build!
If the cycle time were 10 minutes, each station would hand its work-in-processunit over to the next station at the end of 10 minutes.
The The Assembly Line Balancing Assembly Line Balancing ConceptConcept
Station 1( 10 Minutes )
Station 2( 10 Minutes )
Station 3( 10 Minutes )
Total Time( 30 Minutes )
Task A( 10 minutes )
Task B( 5 minutes )
Task D( 2 minutes )
Task C( 5 minutes )
Task E( 3 minutes )
Task F( 5 minutes )
10 Minutes Productive
Time
10 Minutes Productive
Time
10 Minutes Productive
Time
30 MinutesTotal Productive Time
0 Minutes Idle Time
0 Minutes Idle Time
0 Minutes Idle Time
0 MinutesTotal Idle Time
Assumethe cycletime is
10minutes
A A PERFECTLY-BALANCEDPERFECTLY-BALANCED ASSEMBLY LINE ASSEMBLY LINE
The The Assembly Line BalancingAssembly Line Balancing ConceptConcept
Tasks are measured in seconds and vary widely.
It is impossible to as- sign tasks to all work stations so as to get exact work times at each station per cycle. Therefore, a perfectly balanced assembly line does not exist !
The The Assembly Line Balancing Assembly Line Balancing ConceptConcept
Station 1( 10 Minutes )
Station 2( 10 Minutes )
Station 3( 10 Minutes )
Total Time( 30 Minutes )
Task A ( 9 minutes )
Task B( 4 minutes )
Task D( 2 minutes )
Task C( 4 minutes )
Task E( 2 minutes )
Task F( 5 minutes )
9 Minutes Productive
Time
8 Minutes Productive
Time
9 Minutes Productive
Time
26 MinutesTotal Productive Time
1 Minute Idle Time
2 Minutes Idle Time
1 Minute Idle Time
4 MinutesTotal Idle Time
Assumethe cycletime is
10minutes
A A NOTNOT PERFECTLY-BALANCEDPERFECTLY-BALANCED ASSEMBLY LINE ASSEMBLY LINE
Assembly Line Balancing Assembly Line Balancing StepsSteps
Provide the tools, equipment, and work methodsProvide the tools, equipment, and work methods to be used in producing a product or service at ato be used in producing a product or service at a desired volume.desired volume.
Assembly Line Balancing Assembly Line Balancing StepsSteps
Provide the tools, equipment, and work methodsProvide the tools, equipment, and work methods to be used in producing a product or service at ato be used in producing a product or service at a desired volume.desired volume.
Identify the Identify the standard time standard time for each assembly or for each assembly or service task involved in the creation of the productservice task involved in the creation of the product or service.or service.
Identify the Identify the precedence relationships.precedence relationships.THE ORDER IN WHICH THE TASKS MUST BE PERFORMED
Practical Problem StatementPractical Problem Statement
Develop the Assembly Line !
A firm wants to produce160 units of a producteach 8-hour day on an
assembly line.
Nine ( 9 ) separatetasks are neededto complete eachunit of product.
Assume no break timeand no paid lunch time
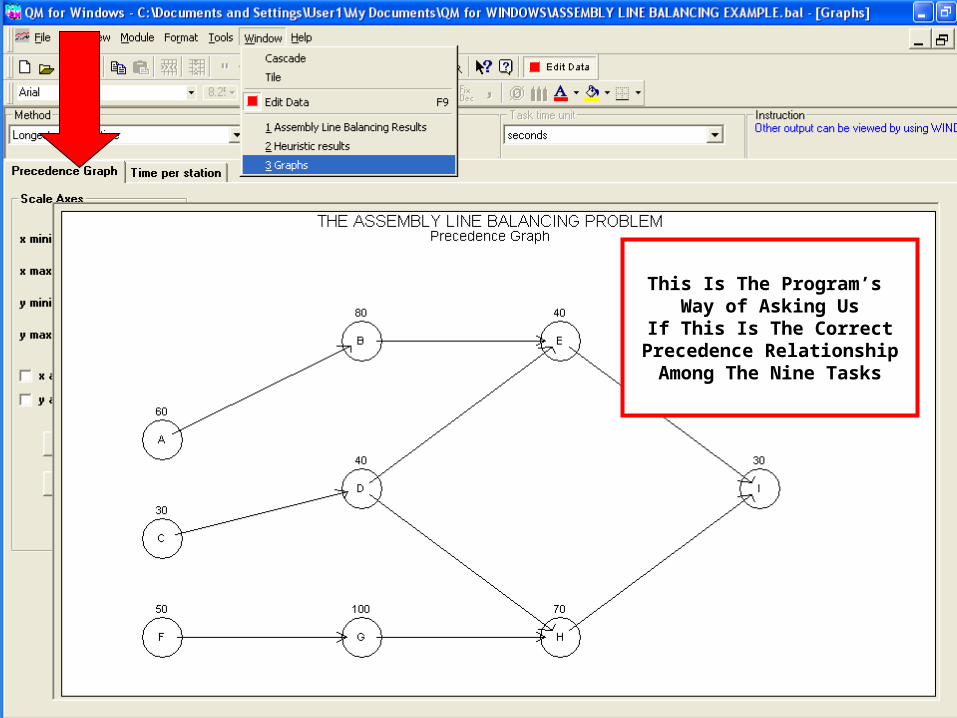
Task Predecessor Standard TimeTask Predecessor Standard Time
A none 60
B A 80
C none 30
D C 40
E B,D 40
F none 50
G F 100
H D,G 70
I E,H 30
ΣΣ = = 500 seconds500 seconds
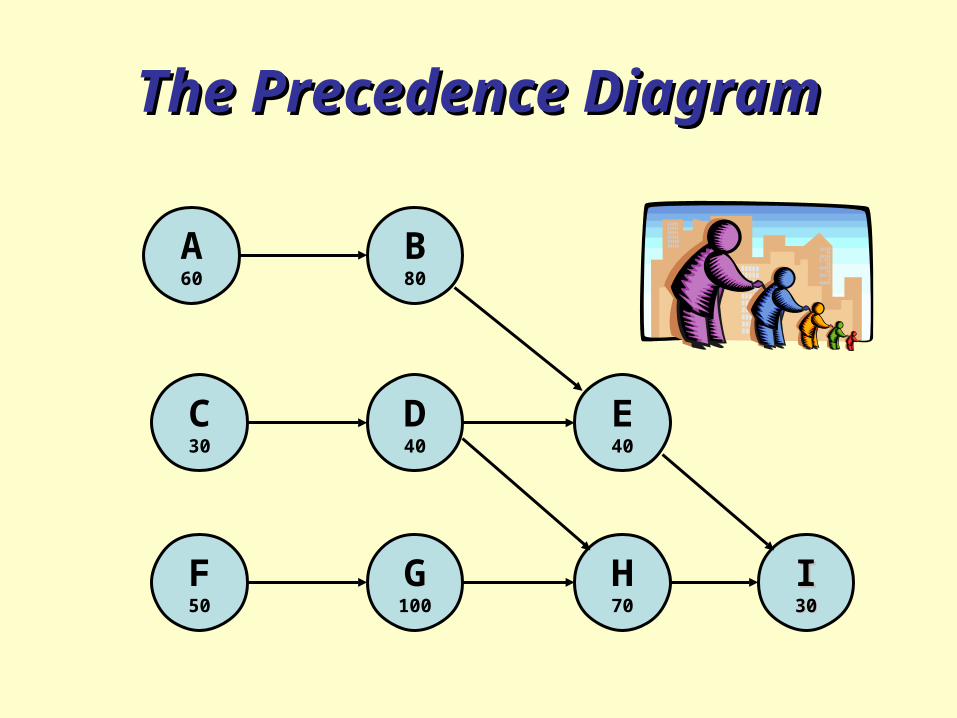
The Precedence DiagramThe Precedence Diagram
A network showing the sequential relationships among all tasks to be performed on the assembly line, together with their respective standard times.
An optional, useful tool for avoiding precedence relationship violations when assigning tasks to work stations, without benefit of the computer.
The Precedence DiagramThe Precedence DiagramTHE ORDER IN WHICH TASKS MUST BE PERFORMED
A60
C30
F50
B80
D40
G100
E40
H70
I30
The Cycle TimeThe Cycle Time
SHOWN IN SECONDSSHOWN IN SECONDS
The maximum period of time that a work-in-process
unit can stay in any givenwork station before it mustmove on to the next work
station.
The Cycle Time FormulaThe Cycle Time Formula
Total Available Daily Production Time
Daily Production Quota
28,800 Seconds
160 Units( FROM THE PROBLEM )
= 180 Seconds
The Minimum Number of Work StationsThe Minimum Number of Work Stations
The minimum number of work stations that theThe minimum number of work stations that the new assembly line, when balanced, will contain.new assembly line, when balanced, will contain.
The Minimum Number of Work StationsThe Minimum Number of Work Stations
The minimum number of work stations that theThe minimum number of work stations that the new assembly line, when balanced, will contain.new assembly line, when balanced, will contain.
The actual number of work stations may well The actual number of work stations may well exceed the minimum number by one or more. exceed the minimum number by one or more.
Also known as the Also known as the theoretical minimumtheoretical minimum number of work stations.number of work stations.
The FormulaThe Formula
Total Task Time Per Unit of Product
The Cycle Time
500 Seconds
180 Seconds= 2.77 ≈ 3.00
FRACTIONS ARE ALWAYS ROUNDED UP( i.e. “2.01” becomes “3.00” )
MINIMUM NUMBER OF WORK STATIONS
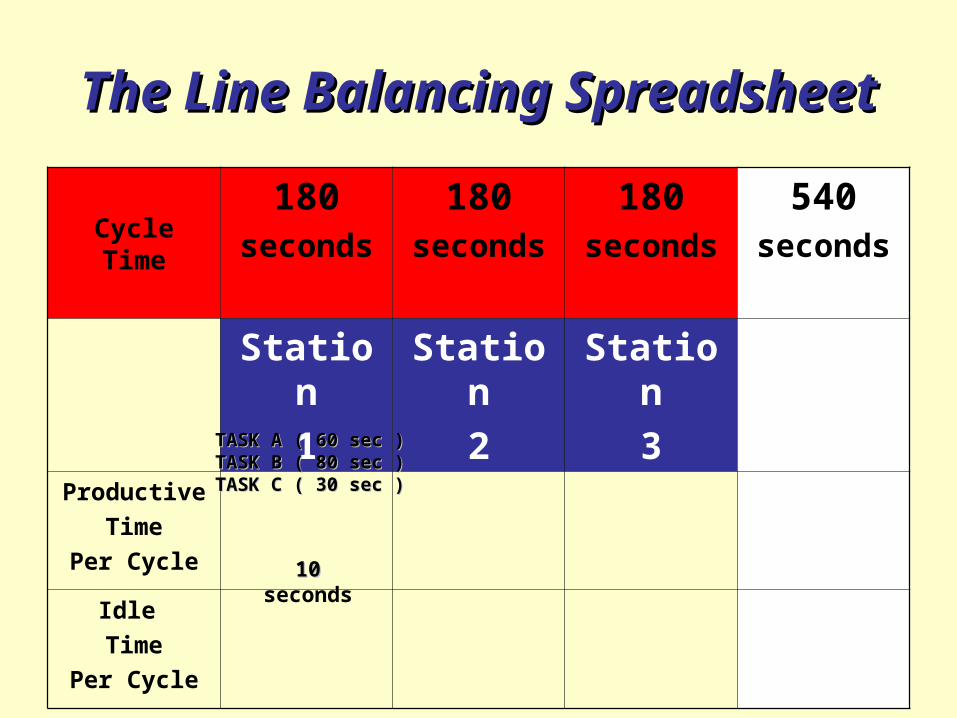
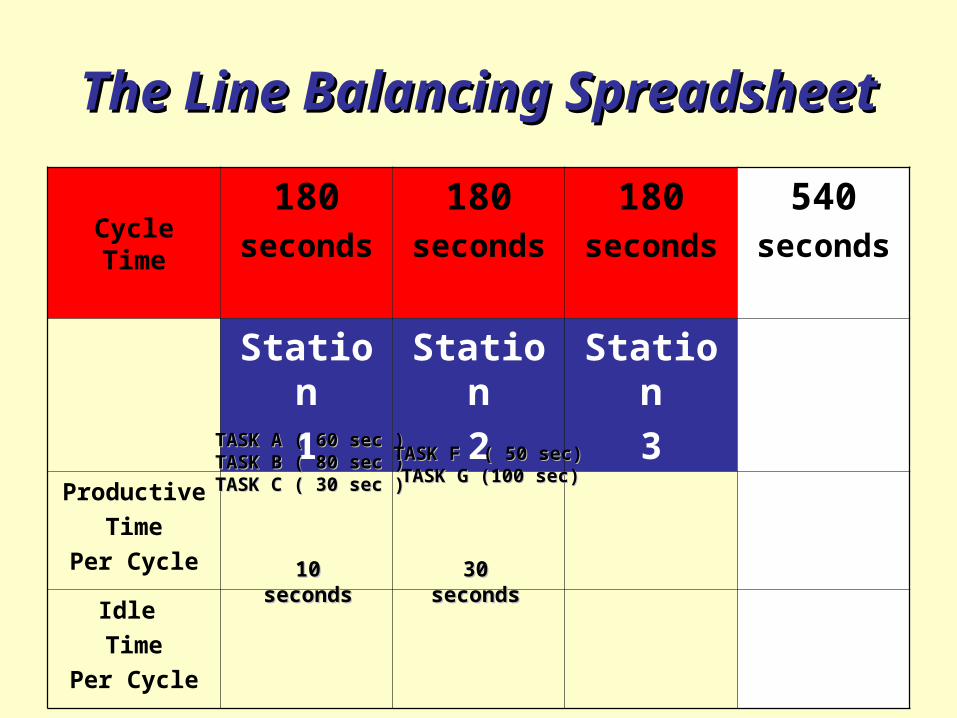
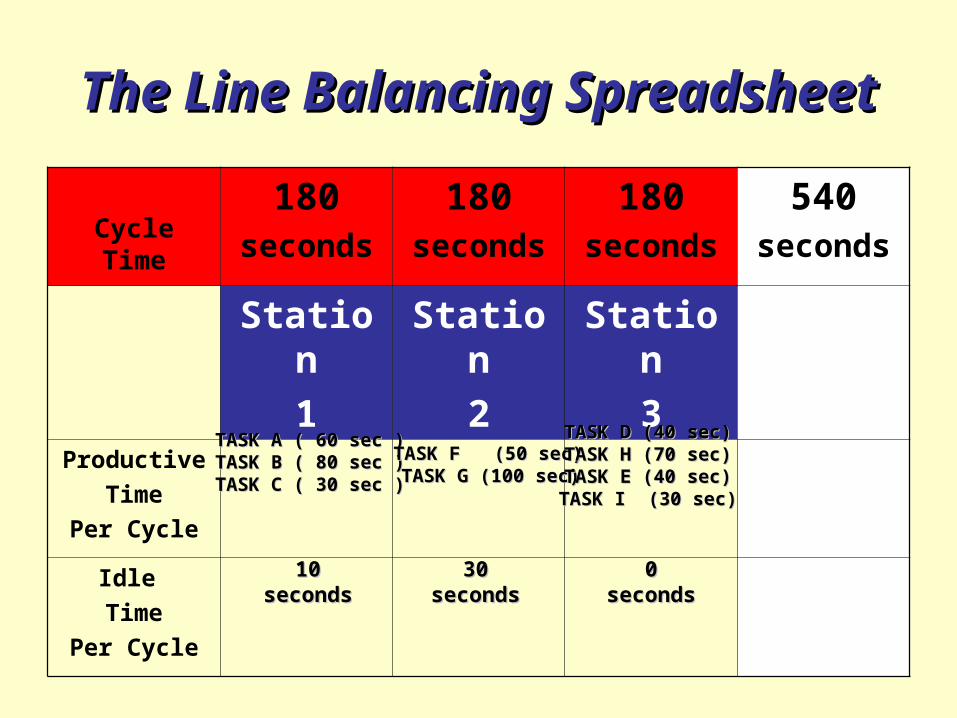
The Line-Balancing SpreadsheetThe Line-Balancing Spreadsheet To assign individual tasks to each work station.
The theoretical minimum number of work stations. The cycle time for each work station. The cycle time for the entire assembly line. The productive time per cycle at each work station. The idle time per cycle at each work station.
SHOWS
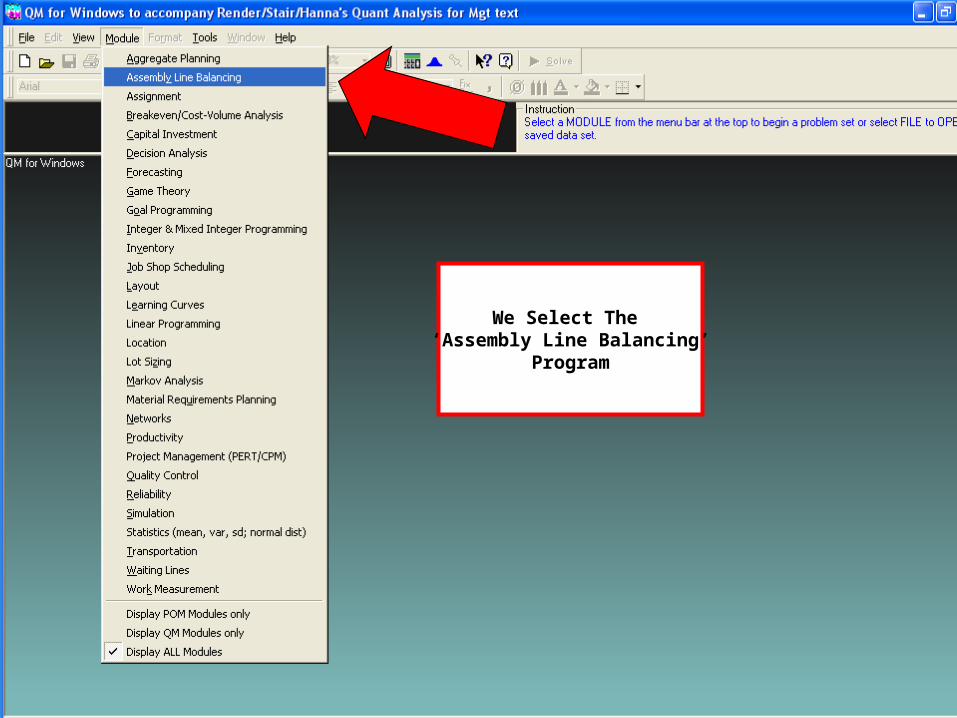
The Line Balancing SpreadsheetThe Line Balancing Spreadsheet
From the Greek From the Greek έύρϊσκεινέύρϊσκειν ( heuriskein ) ( heuriskein ) meaning “to discover” or “to guide”.meaning “to discover” or “to guide”.
From the Greek From the Greek έύρϊσκεινέύρϊσκειν ( heuriskein ) ( heuriskein ) meaning “to discover” or “to guide”.meaning “to discover” or “to guide”.
A A rule of thumb rule of thumb or guideline for finding or guideline for finding a solution in general.a solution in general.
From the Greek From the Greek έύρϊσκεινέύρϊσκειν ( heuriskein ) ( heuriskein ) meaning “to discover” or “to guide”.meaning “to discover” or “to guide”.
A A rule of thumb rule of thumb or guideline for finding or guideline for finding a solution in general.a solution in general.
Here, a particular Here, a particular rationale rationale for assigning for assigning tasks to work stations in line balancing.tasks to work stations in line balancing.
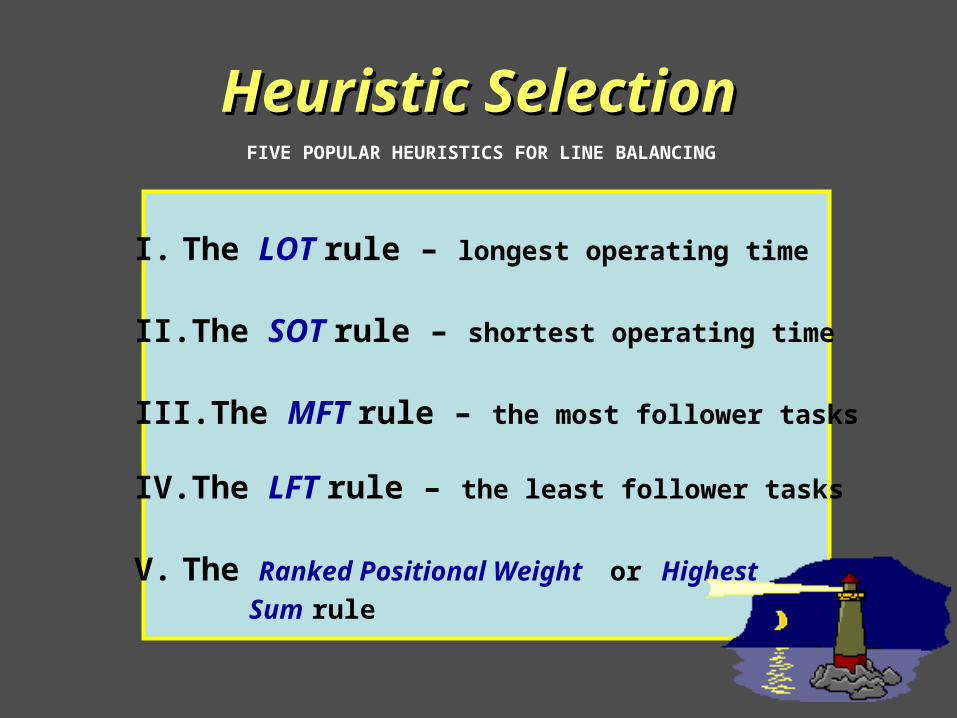
Heuristic SelectionHeuristic Selection
I. The LOT rule – longest operating time
II. The SOT rule – shortest operating time
III. The MFT rule – the most follower tasks
IV. The LFT rule – the least follower tasks
V. The Ranked Positional Weight or Highest
Sum rule
FIVE POPULAR HEURISTICS FOR LINE BALANCING
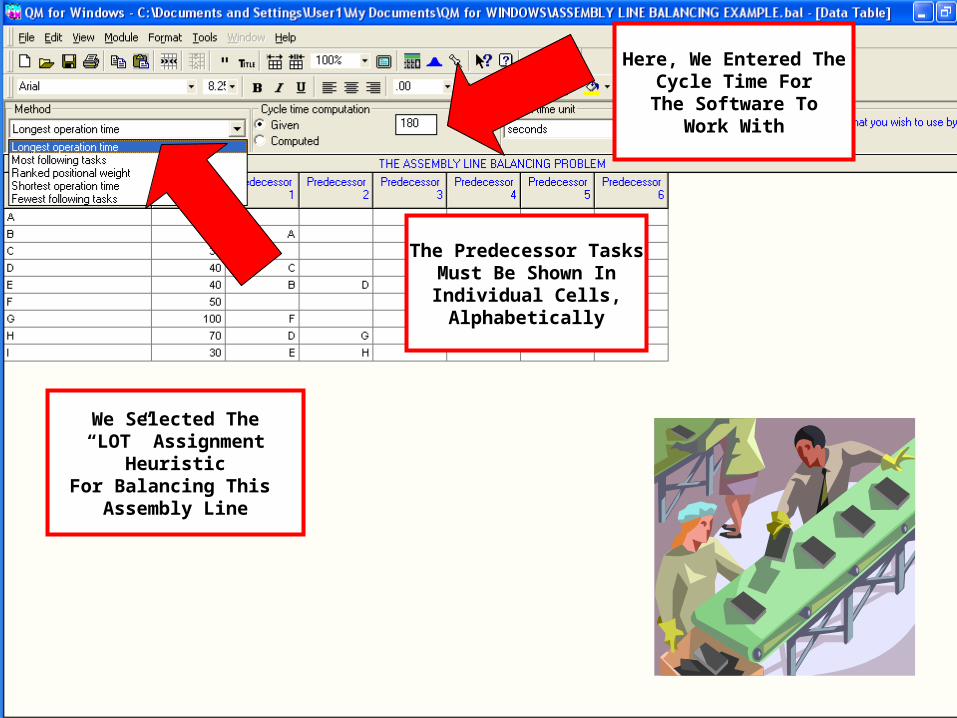
The LOT Assignment HeuristicThe LOT Assignment Heuristic
Also known as the longest operating time rule.
Assigns the longest tasks to the work stations first.
SUBJECT TO MAINTAINING THE PRECEDENCERELATIONSHIPS AMONG THE WORK TASKS
The overall efficiency of the assembly line cannot be changed by employing a different task assign- ment heuristic. This would merely reshuffle the tasks among the work stations.
MFTSO
T
LFT
A FINAL WORDA FINAL WORD
Fairness in Line BalancingFairness in Line Balancing
Experimenting with different task assignment heuristics may prove useful if management is seeking a more equitable distribution of work among all of its work station employees.
Per Cycle STATION 1 STATION 2 STATION 3PRODUCTIVE TIME 167 seconds 167 seconds 167 seconds
IDLE TIME 13 seconds 13 seconds 13 secondsAVAILABLE TIME 180 seconds 180 seconds 180 seconds


![pH - Hanna Instruments · What is pH? 0 2 4 6 8 10 12 14 1e-14 1e-13 1e-12 1e-11 1e-10 1e-09 1e-08 1e-07 1e-06 1e-05 1e-04 0.001 0.01 0.1 1. pH Hydrogen Ion Concentration [H+] Pure](https://static.documents.pub/doc/80x56/5fffb191970a7d07ff50bec3/ph-hanna-instruments-what-is-ph-0-2-4-6-8-10-12-14-1e-14-1e-13-1e-12-1e-11-1e-10.jpg)


