34
Assessing Benefits for Environmental Decision Making Chapter 8 © 2007 Thomson Learning/South- Western Thomas and Callan, Environmental Economics
| Date post: | 18-Dec-2015 |
| Category: |
Documents |
| Upload: | warren-merritt |
| View: | 215 times |
| Download: | 0 times |
Assessing Benefits for Environmental Decision Making
Chapter 8
© 2007 Thomson Learning/South-Western Thomas and Callan, Environmental Economics
2
Environmental Benefits Conceptual Issues
Environmental benefits measure damage reductions Policy brings about changes in these damage
reductions, and these changes are referred to as incremental benefits Incremental benefits are the reduction in health,
ecological, and property damages associated with an environmental policy initiative
3
Types of Incremental Benefits
Primary environmental benefits Damage-reducing effects that are a direct consequence
of implementing environmental policy Secondary environmental benefits
Indirect gains to society that may arise from a stimulative effect of primary benefits or from a demand-induced effect to implement policy
4
Assign Value to Incremental Benefits
Since environmental quality is a public, nonmarketed good, its D cannot be identified because of nonrevelation of preferences
But if we could infer society’s D (or MSB) for environmental quality, we could measure incremental benefits as follows: Area under MSB is TSB Changes in TSB would be incremental benefits
5
Modeling Incremental Benefits
Find baseline TSB before policy Find new TSB after policy is implemented Subtract baseline from new TSB
6
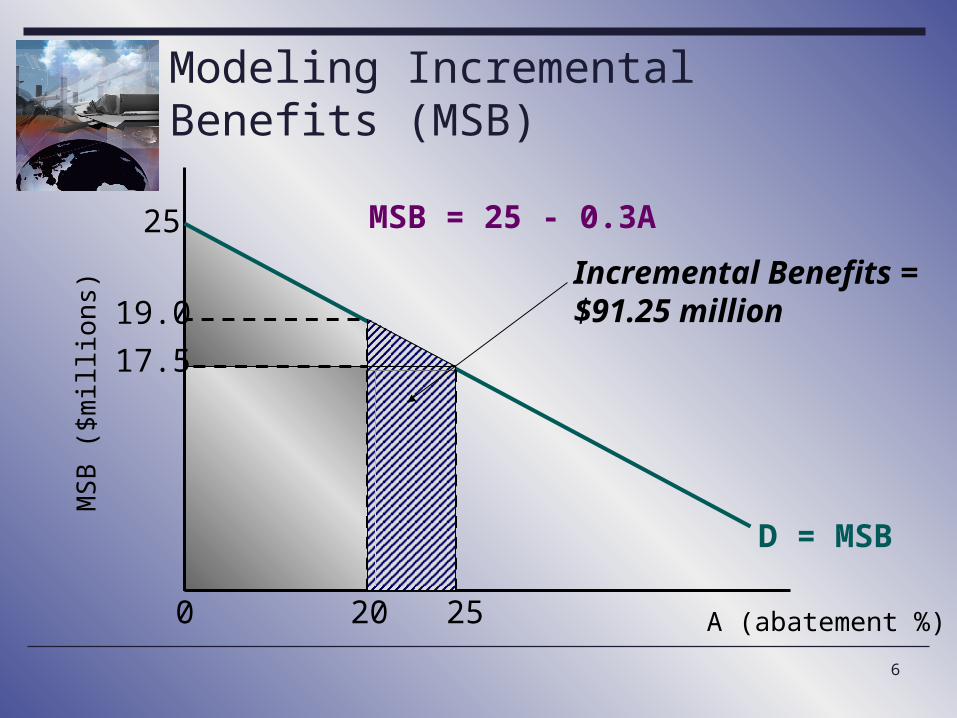
Modeling Incremental Benefits (MSB)M
SB
($
mill
ion
s)
A (abatement %)
D = MSB
250
25
17.5
20
19.0Incremental Benefits = $91.25 million
MSB = 25 - 0.3A

7
Modeling Incremental Benefits (TSB)
A (abatement %)
TS
B (
$m
illio
ns)
TSB
25
531.25
20
440.0
Incremental Benefits = $91.25 million
0
TSB = 25A - 0.15A2
8
Valuing Environmental QualityTwo Sources of Value
Total value = User value + Existence value User value is the benefit derived from physical use or
access to an environmental good Direct user value is the benefit derived from directly
consuming services provided by an environmental good Indirect user value is the benefit derived from indirect
consumption of an environmental good Existence value is the benefit received from the
continuance of an environmental good Motivated by vicarious consumption and stewardship
Approaches to Measuring Benefits
10
Two Major Approaches
Physical linkage approach Estimates benefits based upon a technical
relationship between environmental resource and user of resource
Behavioral linkage approach Estimates benefits using observations of
behavior in actual markets or survey responses about hypothetical markets

11
Overview (see Table 7.2)
Physical Linkage Damage Function Method
Behavioral Linkage Direct Methods
Political Referendum Method Contingent Valuation Method
Indirect Methods Averting Expenditure Method Travel Cost Method Hedonic Price Method

Damage Function Method
A Physical Linkage Approach

13
Damage Function Method
Specifies a relationship between a contaminant (C) and some observed total damage (TD)
Estimates benefits as TD declines from the policy-induced change in C Note: Dose-response function is one type of
damage function
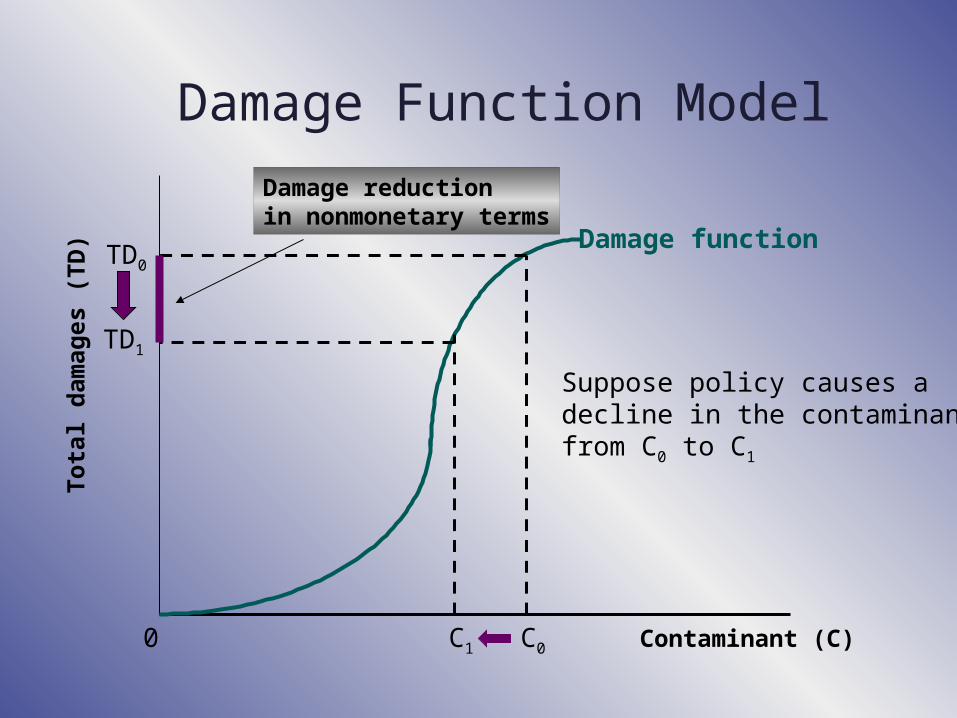
Damage Function Model T
ot a
l d
ama g
es (
TD
)
Contaminant (C)
Damage function
C0
TD0
C1
TD1
Damage reduction in nonmonetary terms
0
Suppose policy causes adecline in the contaminantfrom C0 to C1

15
Assessing the Damage Function Method
Estimates only one type of incremental benefit at a time
Represents only a first step, since it is not capable of simultaneously monetizing the damage reduction that it identifies

16
Example
Suppose a U.S. policy reduces pollution damage to crops, resulting in a higher crop yield as an incremental benefit Model as an increase in supply (S)
Measure the incremental benefit as: (consumer surplus (CS) + producer surplus (PS))

Incremental Benefits
$
D
aS0
S1
e
b
Q0Q of corn
P0c
P1
Q10
Incremental benefit = ebc
Contingent Valuation Method (CVM)
Direct Method under Behavioral Linkage Approach
19
CVM
Estimates benefits from survey responses about WTP for environmental quality contingent upon hypothetical market
Tries to finesse nonrevelation problem Steps:
Construct model of hypothetical market Design survey Assess honesty of respondents
20
Assessing the CVM
Broad applicability Can capture existence as well as user value Inherent biases due to survey approach
Averting Expenditure Method (AEM)
Indirect Method under Behavioral Linkage Approach
22
AEM
Estimates benefits as the reduction in spending on goods that are substitutes for a cleaner environment As pollution damages the environment, people incur
“averting” expenditures to improve their personal environment
This spending is reduced as policy improves the overall environment
This spending reduction is an estimate of the WTP for associated incremental benefits
23
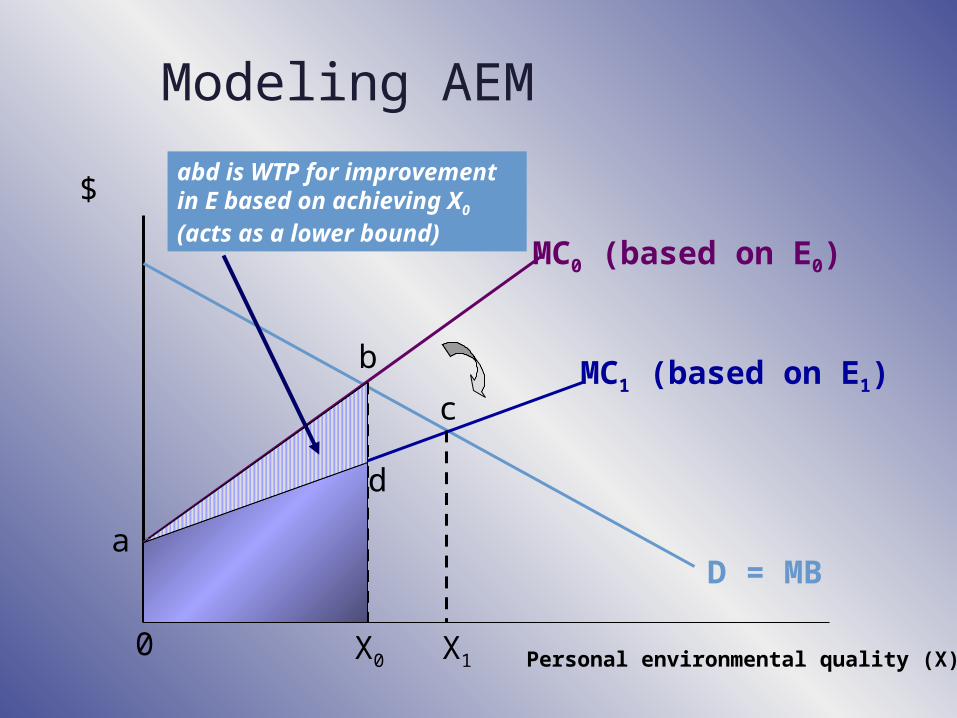
Modeling AEM
Define overall environmental quality (E) The relevant market for study is personal
environmental quality (X) D is MB; S is MC or averting expenditures MC0 of X0 is linked to a given level of E0
As the overall environment improves, or as E increases from say, E0 to E1, the individual incurs lower costs, so MC shifts right from MC0 to MC1 and X0 improves to X1
Change in spending for the same level of X is an estimate of incremental benefits

Modeling AEM
$
D = MBa
MC0 (based on E0)
MC1 (based on E1)b
X00
d
c
X1
abc is WTP for improvement in E based on achieving X1
Personal environmental quality (X)
E rises to E1
Modeling AEM
$
D = MBa
MC0 (based on E0)
MC1 (based on E1)b
X00
d
c
X1 Personal environmental quality (X)
abd is WTP for improvement in E based on achieving X0 (acts as a lower bound)
26
Assessing the AEM
Problem of jointness of production Some AE yield benefits other than
those from improving environmental quality
e.g., air conditioning provides comfort as well as filters the air
Hence, the benefit estimate can be biased

Travel Cost Method
Indirect Method under Behavioral Linkage Approach
28
TCM
Estimates benefits as an increase in consumer surplus (CS) in the market for a complement to environmental quality (i.e., recreational use), as policy improves that quality
As policy improves the environment, the D for recreational use of the environment increases, causing an increase in CS
This CS increase is the benefit estimate
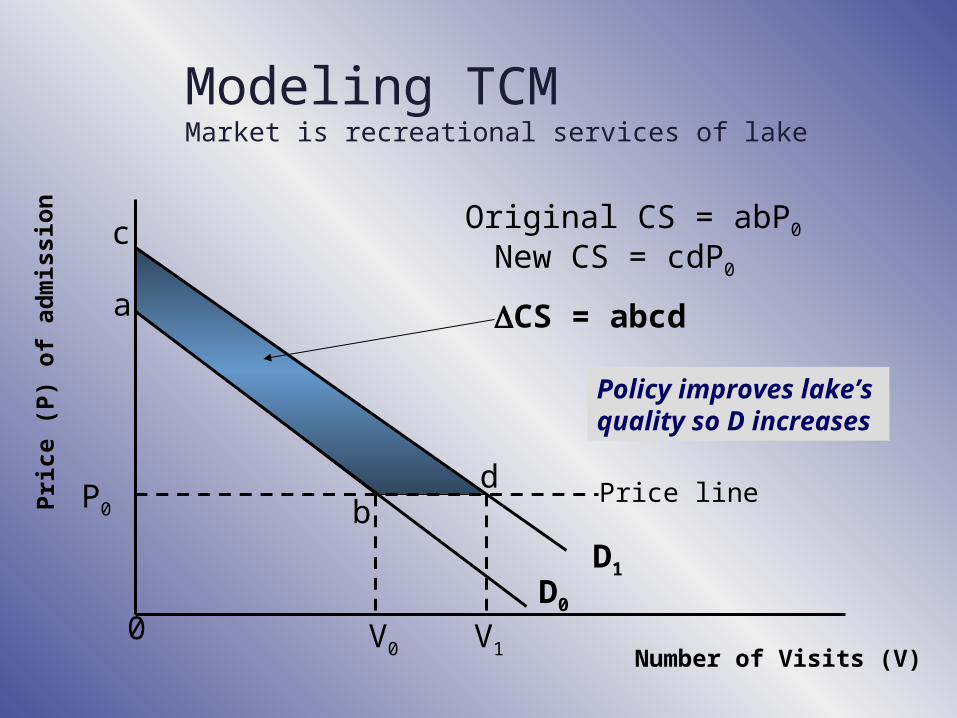
Modeling TCMMarket is recreational services of lake
Pri
ce (
P)
of
adm
issi
on
Number of Visits (V)
D0
P0Price line
V00
a
b
Original CS = abP0
D1
d
c
V1
New CS = cdP0
CS = abcd
Policy improves lake’s quality so D increases
30
Assessing the TCM
Estimates only user value Addresses only recreational use (i.e., not
useful for estimating commercial benefits Estimates are biased downward if access to
site is congested

Hedonic Price Method (HPM)
Indirect Method under Behavioral Linkage Approach
32
HPM
Uses estimated hedonic, or implicit, price of an environmental attribute to value a policy-driven improvement e.g., PHOUSE = f(X1, X2, ….Xn, E), where:
each Xi is an attribute of the house, and E is the environmental quality in the area
Hedonics uses regression analysis, which provides estimates of the prices of the individual attributes, including E

33
HPM (continued)
This price could be used to estimate the D for environmental quality, which in turn could be used to measure the incremental benefit of improving that quality
Recall that incremental benefit can be measured as an area under the D curve
34
Assessing the HPM
Logical, intuitive Difficult to employ
Requires complex empirical modeling Requires extensive data


