Assessing future environmental, livelihood & poverty changes in coastal Bangladesh: an integrated framework Social Simulation of Fisheries and Coastal Management Manchester Metropolitan University 6-7 June 2016 Attila Lazar ([email protected]) University of Southampton on behalf of the ESPA Deltas consortium http://www.espadelta.net/
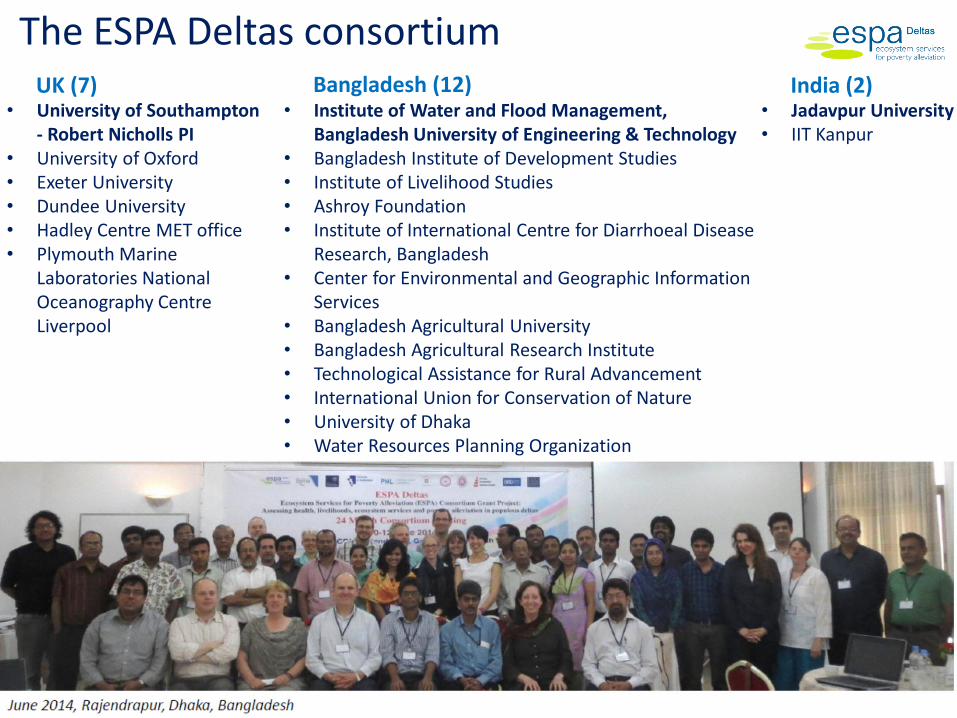
• University of Oxford• Exeter University • Dundee University • Hadley Centre MET office • Plymouth Marine
Laboratories National Oceanography Centre Liverpool
• Jadavpur University• IIT Kanpur
• Institute of Water and Flood Management, Bangladesh University of Engineering & Technology
• Bangladesh Institute of Development Studies • Institute of Livelihood Studies • Ashroy Foundation• Institute of International Centre for Diarrhoeal Disease
Research, Bangladesh • Center for Environmental and Geographic Information
Services • Bangladesh Agricultural University• Bangladesh Agricultural Research Institute • Technological Assistance for Rural Advancement • International Union for Conservation of Nature • University of Dhaka• Water Resources Planning Organization
UK (7) Bangladesh (12) India (2)
3
• Why Deltas
• Introduce ESPA Deltas
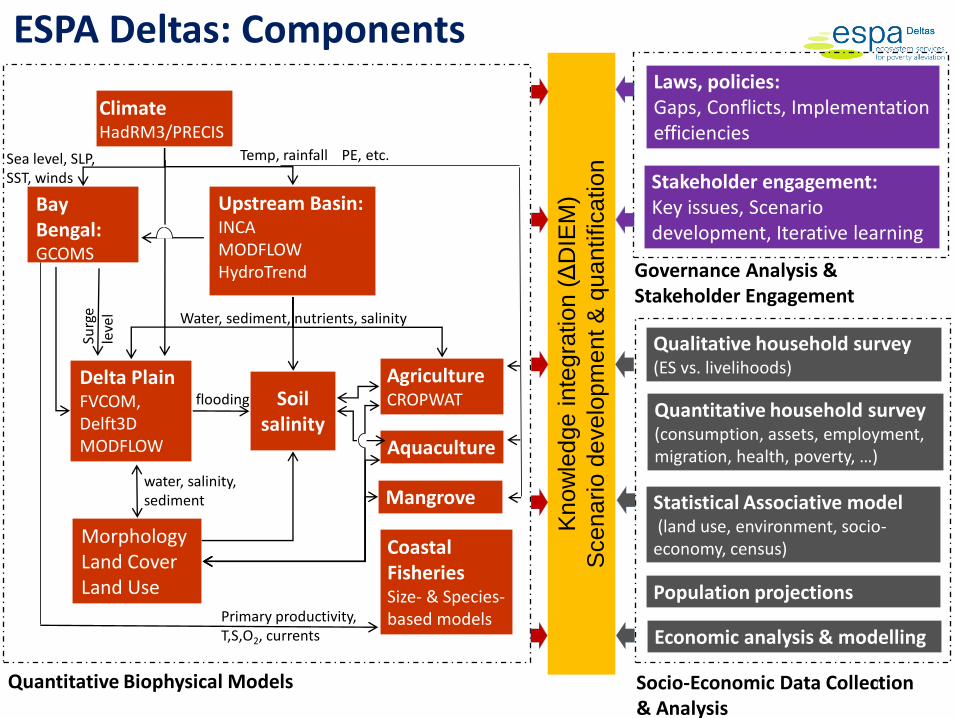
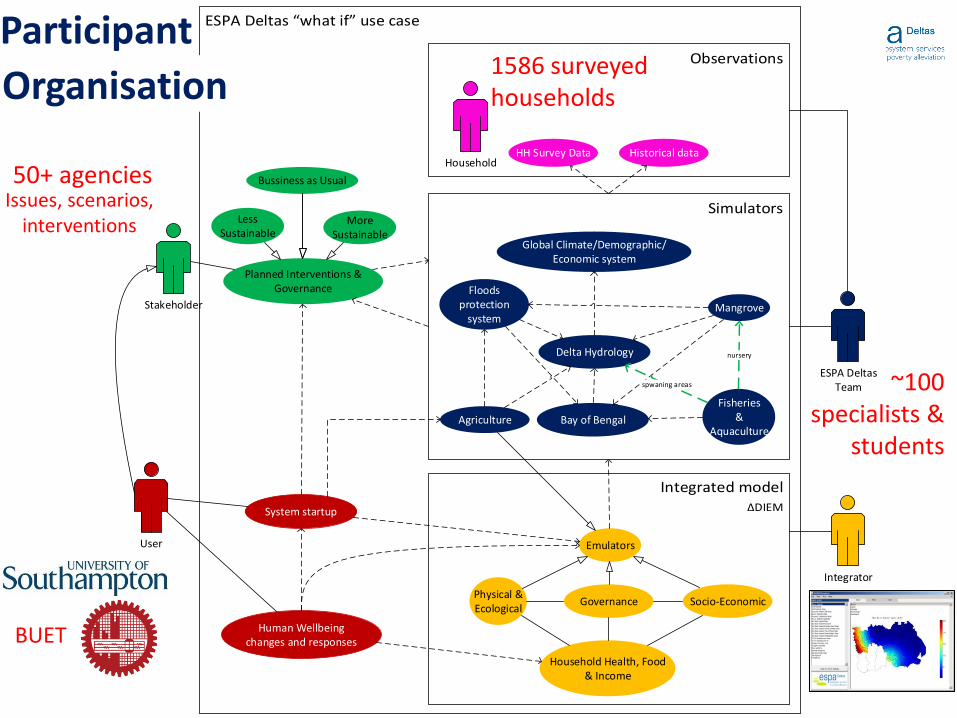
• Introduce ΔDIEM
• Some plausible futures of coastal Bangladesh
Outline
Home to over half a billion (>7%) people (occupy only1% of the world’s land)
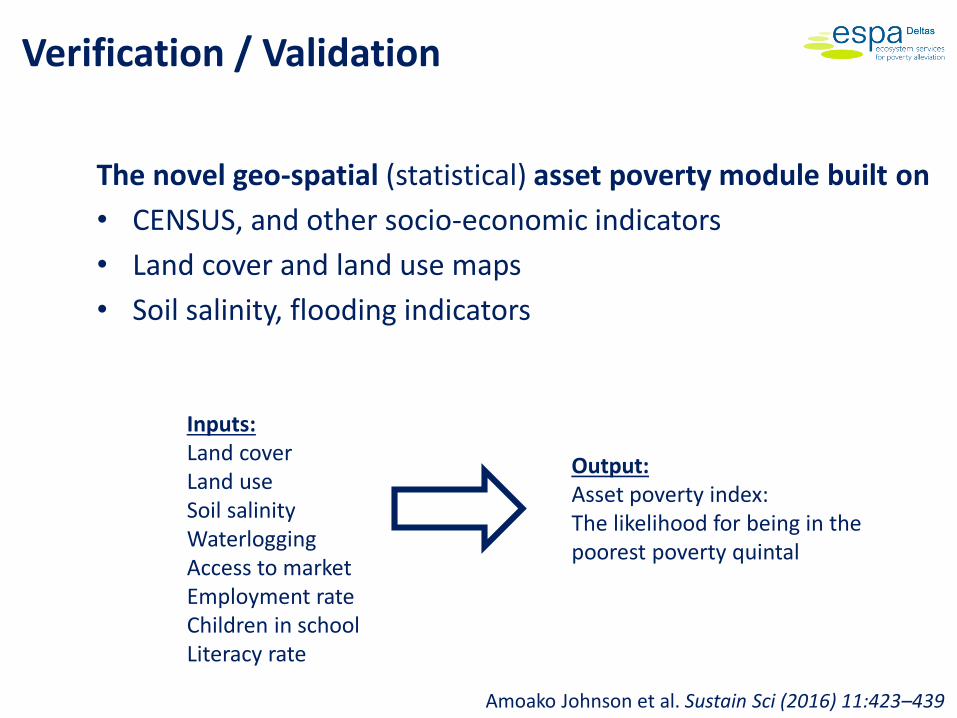
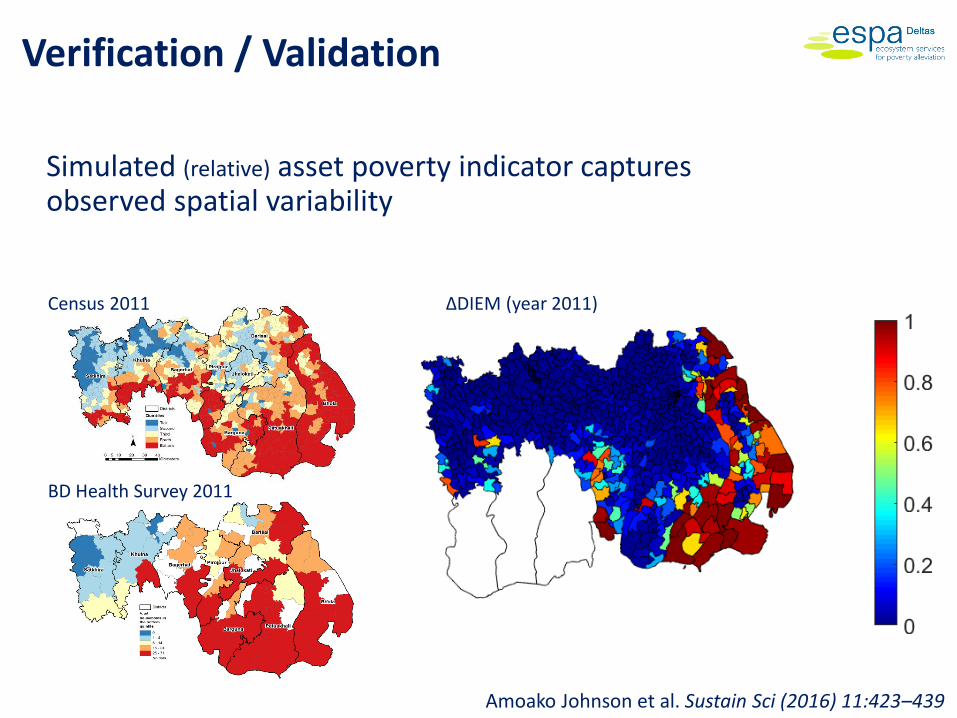
Amoako Johnson et al. Sustain Sci (2016) 11:423–439
Stakeholder Engagement
An ongoing process from the beginning
of the project:
• Issue Identification
• Scenario development
• Policy exploration
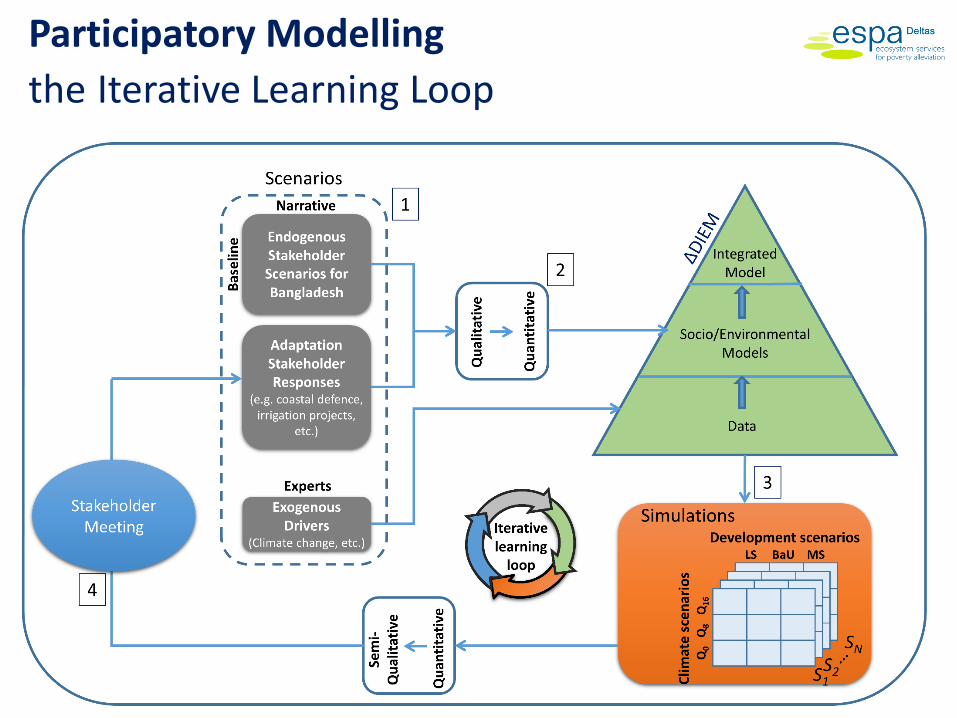
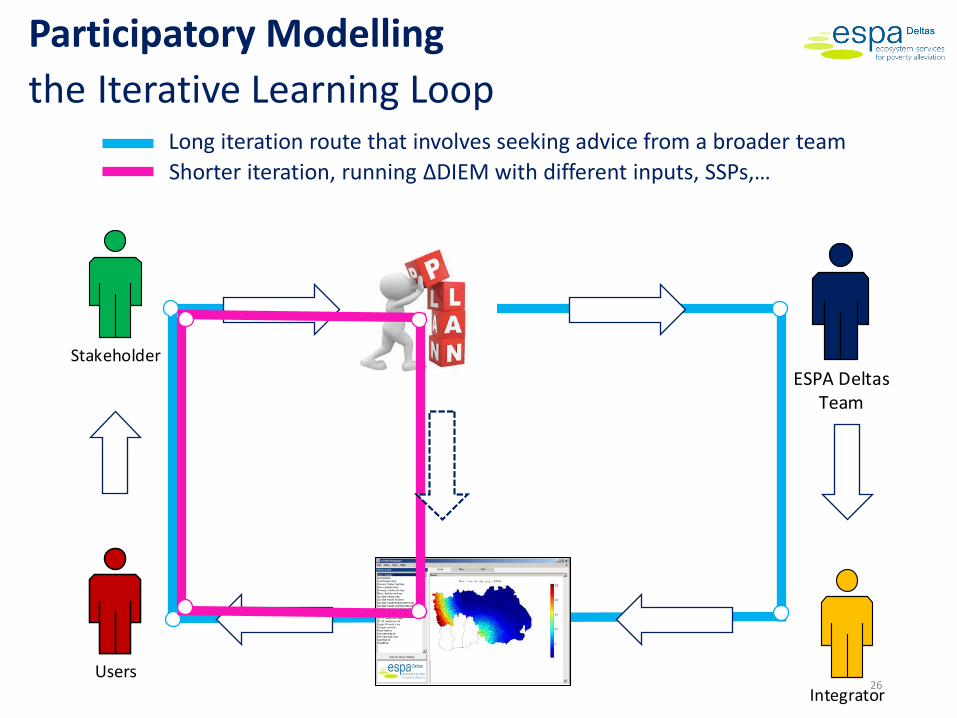
Participatory Modelling
the Iterative Learning Loop
Long iteration route that involves seeking advice from a broader team
v
26
Stakeholder
Integrator
ESPA Deltas Team
Shorter iteration, running ΔDIEM with different inputs, SSPs,…
Users
Participatory Modelling
the Iterative Learning Loop
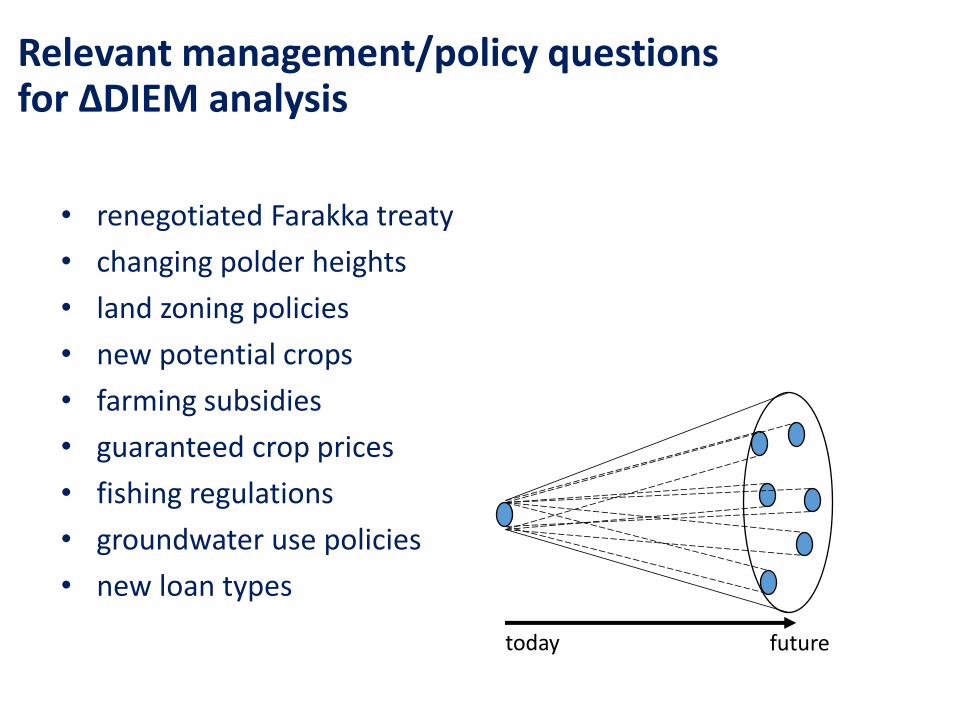
Relevant management/policy questions for ΔDIEM analysis
today future
• renegotiated Farakka treaty
• changing polder heights
• land zoning policies
• new potential crops
• farming subsidies
• guaranteed crop prices
• fishing regulations
• groundwater use policies
• new loan types
28
ESPA Deltas’ scenario frameworkSR
ES A
1B
(RC
P 6
.0 -
8.5
)
By
20
50
Development Scenarios
Less Sustainable(LS)
Business As Usual(BAU)
More Sustainable(MS)
moderately warmer& wetter
(Q0)
warmer& wetter, but variable
(Q8)
much warmer& drier
(Q16)
Sea Level scenariosMean sea level rise (compared to 2000)
2050 2099
Q0 +0.25 m +0.73 m
Q8 +0.21 m +0.58 m
Q16 +0.23 m +0.56 m
Subsidence (2000 to 2100): 0.3 m
Kay et al 2015. Environ. Sci.: Processes Impacts, 2015, 17, 1311
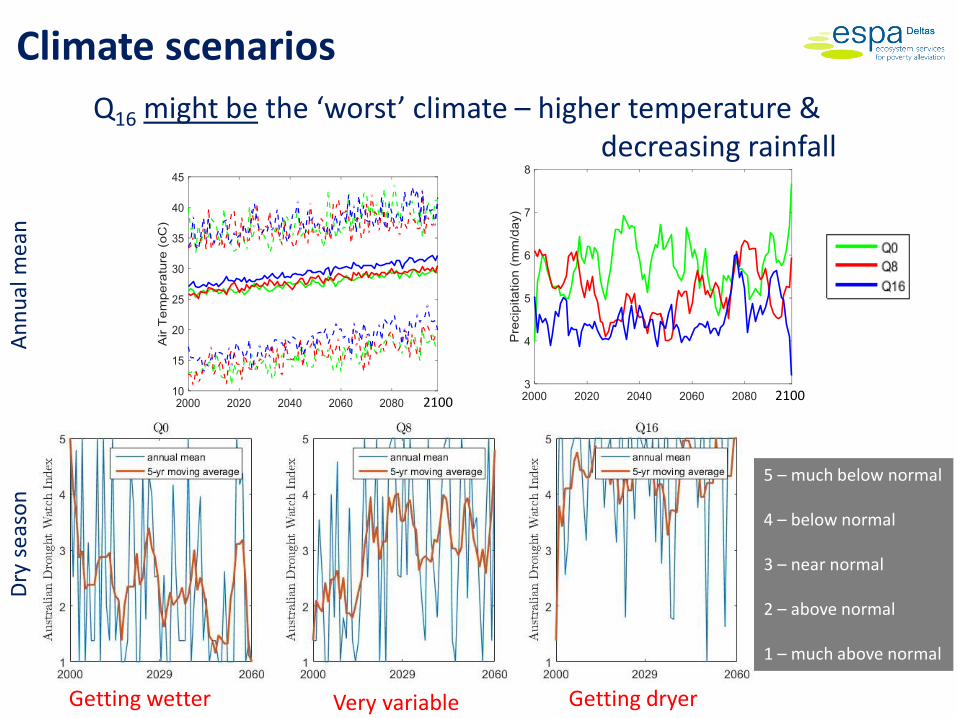
Q16 might be the ‘worst’ climate – higher temperature &decreasing rainfall
Climate scenarios
2100 2100
5 – much below normal
4 – below normal
3 – near normal
2 – above normal
1 – much above normal
Getting wetter Getting dryerVery variable
An
nu
al m
ean
Dry
sea
son
• The number of days with low flows and high flows seem to gradually increase in most scenarios
• More extremes and large inter-annual valriabilityare likely
River flow scenariosDrought / Flood indices
32
Fishery scenariosBay of Bengal total catches and values
• Current rates of catches are not sustainable.
Fernandez et al 2015. ICES Journal of Marine Science; doi:10.1093/icesjms/fsv217
33
Demography scenarios
• Population is expected to decrease even under the MS scenario
Szabo et al 2015. ESRC Centre for Population Change; Working Paper 61; March 2015; ISSN 2042-4116
Economic scenariosPercentage change in ΔDIEM Economic Input Variables by 2030No further change after 2030
Economic input variable LS BAU MSCost of agriculture (seed, pesticide, fertiliser types) 0 10 20Cost of aquaculture (feed, post larvae, fishling) 20 10 0Cost to keep livestock/poultry, fishing, Forest collection 0 10 20Land rent cost (farming) 0 10 20Cost to do Services & Manufacturing business 20 0 -20Market (selling) price of agriculture crops 0 10 20Market (selling) price of fish 30 10 20Market (selling) price of aquaculture crops (shrimp) 0 10 20Income from forest goods (honey, fruits, timber, etc) -20 -10 0Income from Manufacturing, Services and Livestock/Poultry 65 110 165Remittances (BDT/month) 20 30 40Household expenses 0 10 20Daily wage (without food) (BDT/day) 0 10 30Cost of diesel (BDT/gallon) 0 10 20Employment rate (% population) 0 10 30Literacy rate (% population) 2 4 8Children in school (% population) 2 5 10Travel time to major cities -10 -30 -50USD/BDT exchange rate & PPP exchange rate 0 0 0 H
un
t, A
. 201
5. E
SPA
Del
tas:
Eco
no
mic
Po
licy
Dim
ensi
on
s. P
roje
ct R
epo
rt
35
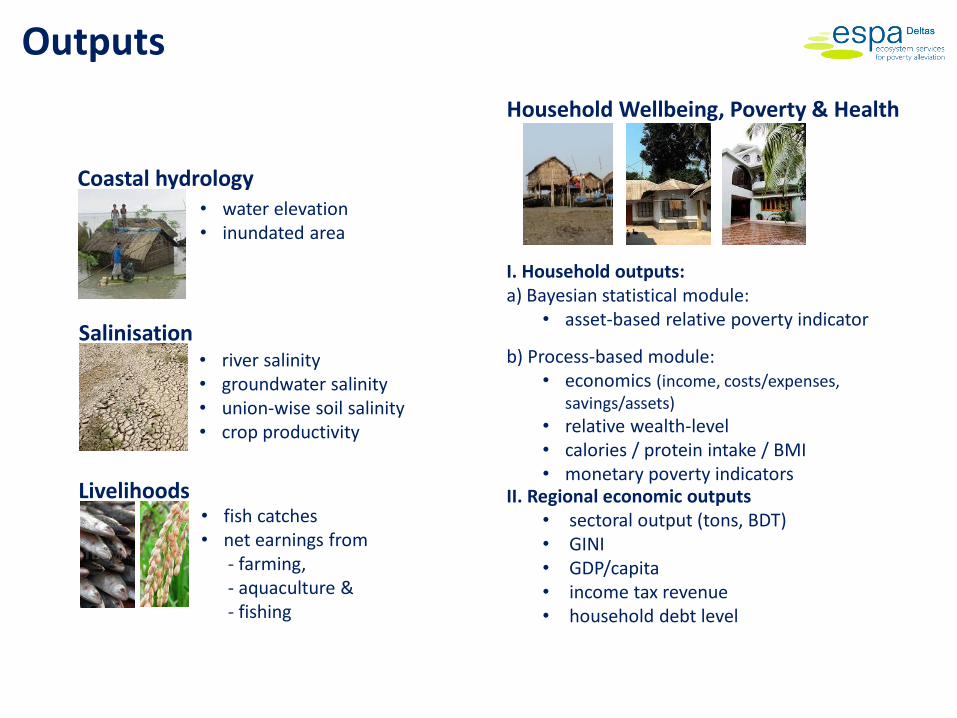
Composite indicatorsNormalised to the minimum/maximum range.
Farming & fishing income:
• weighted average income from farming and fishing
Welfare:
• process-based poverty index
• statistical asset poverty likelihood
Food security:
• calorie intake,
• protein intake
• BMI
GINI:
• Income inequality in union
36
Composite indicatorsNormalised to the minimum/maximum range.
Drought:
• number of day below 20 percentile total inflow
• number of days with no precipitation (March-June)
• Australian drought watch index (March-June)
Flood:
• Number of days above 90 percentile total inflow
• Number of days with >25cm inundation depth
Soil salinity:
• Area averaged soil salinity (March-June)
37
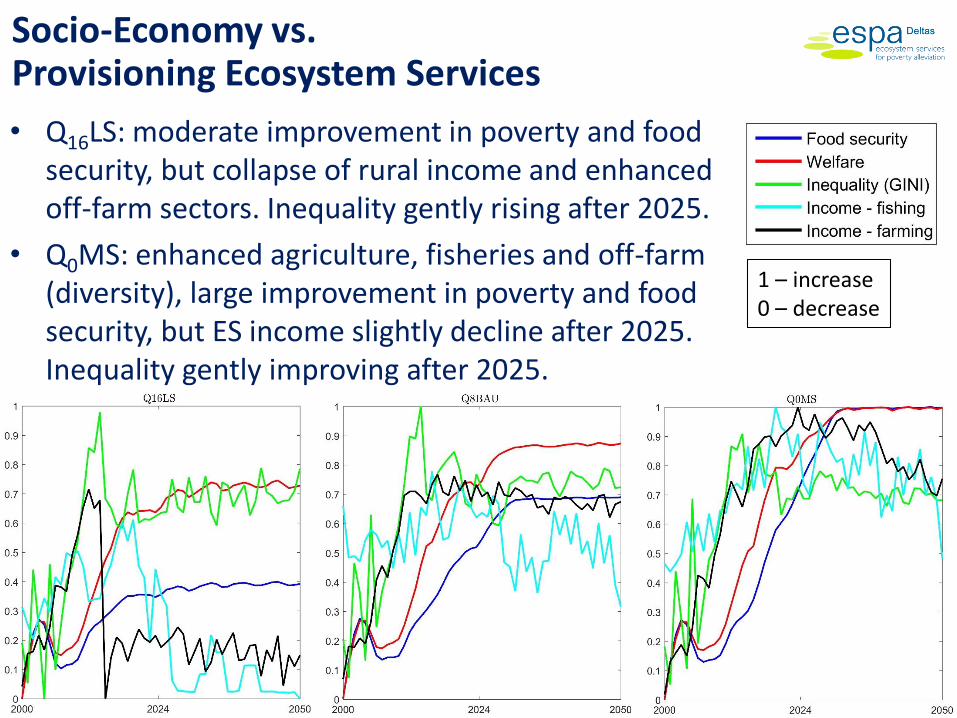
Socio-Economy vs. Provisioning Ecosystem Services
• Q16LS: moderate improvement in poverty and food security, but collapse of rural income and enhanced off-farm sectors. Inequality gently rising after 2025.
• Q0MS: enhanced agriculture, fisheries and off-farm (diversity), large improvement in poverty and food security, but ES income slightly decline after 2025. Inequality gently improving after 2025.
1 – increase0 – decrease
38
Hazards vs. Provisioning Ecosystem Services
• Q16LS: drought with collapse of income and less flooding.
• Q0MS: increase in flood and water availability with rise in income.
• High inter-annual variability for many indicators.
1 – increase0 – decrease
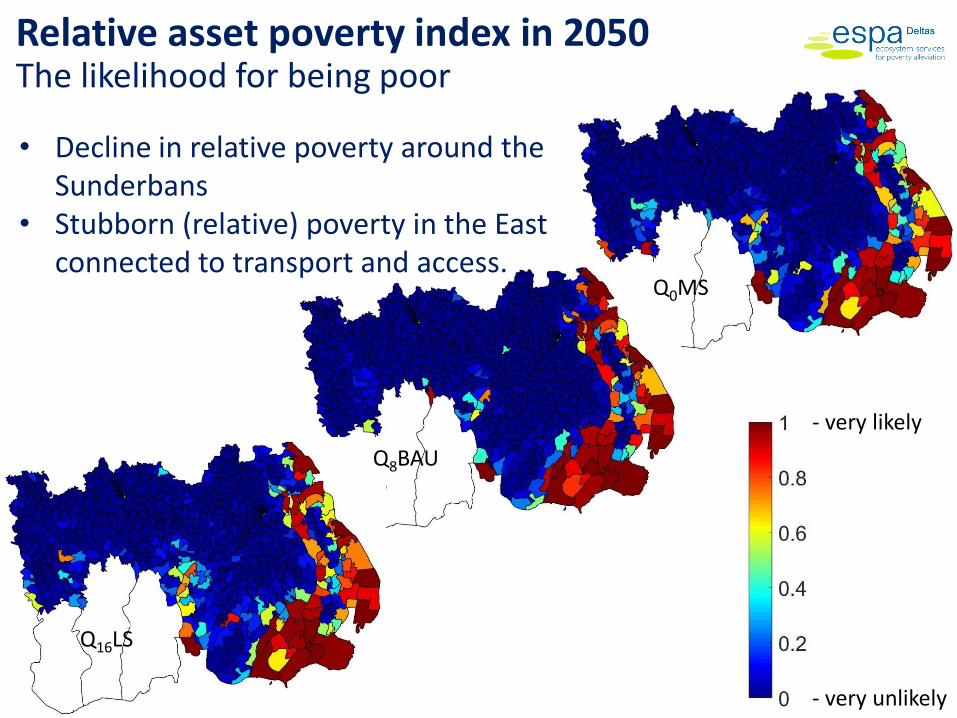
Relative asset poverty index in 2050The likelihood for being poor
- very likely
- very unlikely
• Decline in relative poverty around the Sunderbans
• Stubborn (relative) poverty in the East connected to transport and access.
Q16LS
Q8BAU
Q0MS
40
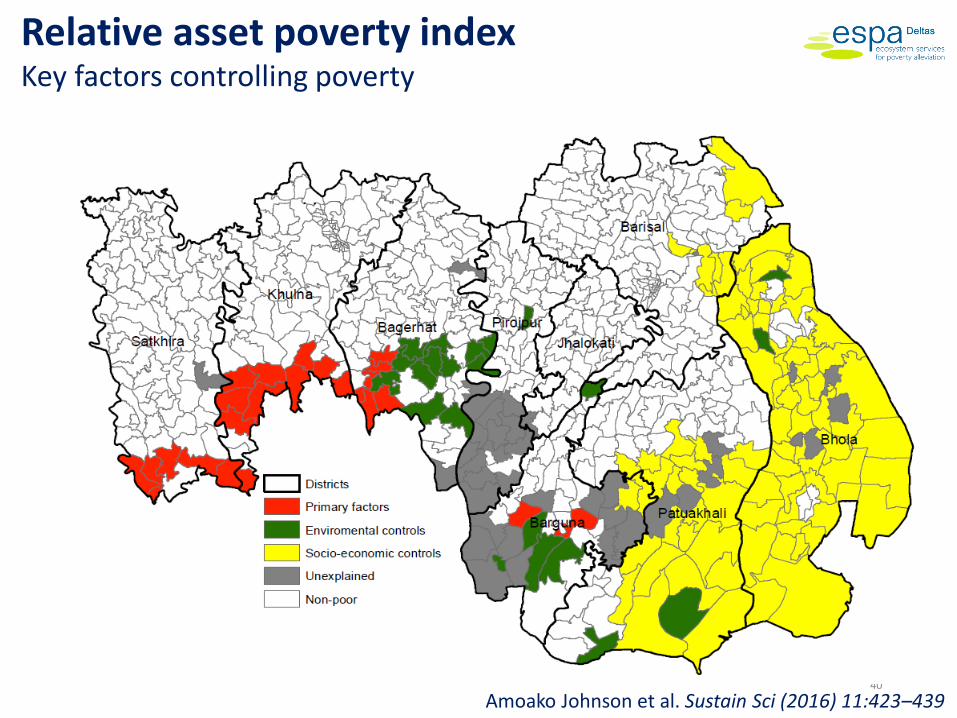
Relative asset poverty index Key factors controlling poverty
Amoako Johnson et al. Sustain Sci (2016) 11:423–439
41
Dominance of livelihoods (Q0BAU)
• Importance of business and manufacturing incomes increases.
• Small farm owners and fishers rely less on Ecosystem Services.
42
Mean calorie Intake in 2050 (kcal/cap/day)
• Calorie intake, protein intake and BMI are mainly affected by the socio-economic scenarios.
• Magnitude depends on governance
Q16LS
Q8BAU
Q0MS
Crop yield in 2050 (fraction)Mean of all crops throughout the year
• Higher yield and more salt tolerant crops perform better.
• Crop variety depends on the development scenario.
- potential yield
- no yield
Q16LS
Q8BAU
Q0MS
Farming income in 2050 (BDT/month)
Q16LS
Q8BAU
Q0MS
• Most farmers are poor• Better varieties improve livelihood,
not enough for a step change in wellbeing
Intervention examples
• Increased Ganges baseflow
• Agriculture subsidies
46
Intervention: increased dry season flowDaily river salinity (ppt)
Riv
er s
alin
ity
(pp
t)
Q0MSQ8BAUQ16LS
Dry season Dry season Dry season Dry season
47
Intervention: better price for grains (rice, wheat, maize)Relative wealth of farmers in 2050
baseline after intervention
Q0MSQ0MS
Q16LS Q16LS
- least poor
- poorest
Key Conclusions
•Key Findings of relevance to policy
• Future is substantially impacted by policy interventions –more so than climate impacts (until 2050)
• Strong signal of off-farm economics exists within all scenarios
• Diversity of livelihoods is significant with substantial benefits from access to diverse range of economic inputs (agriculture, aquiculture, off farm)
• These are early findings based on the current data, models and assumptions. This needs to be owned and further developed in Bangladesh. This is the beginning of the process.
ESPA Deltas Legacy(Post-December 2016)
• Data at BUET, WARPO and the ESPA Deltas web sites
• Downloadable ΔDIEM from BUET and ESPA Deltas web sites
• Trained and experienced staff at BUET
• Journal papers (27+ journals published to date, with many more to come)
• Newsletters and Policy Briefs
• Established interest and collaboration with the Dutch-funded Delta Plan 2100 project and with the General Economic Division of the Planning Commission in Bangladesh.
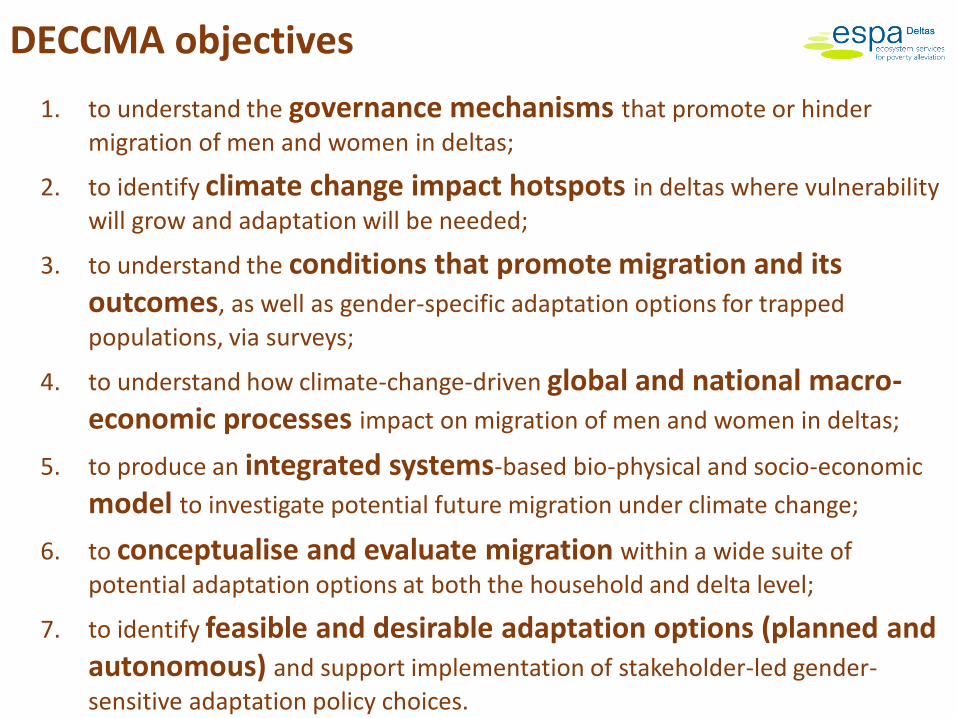
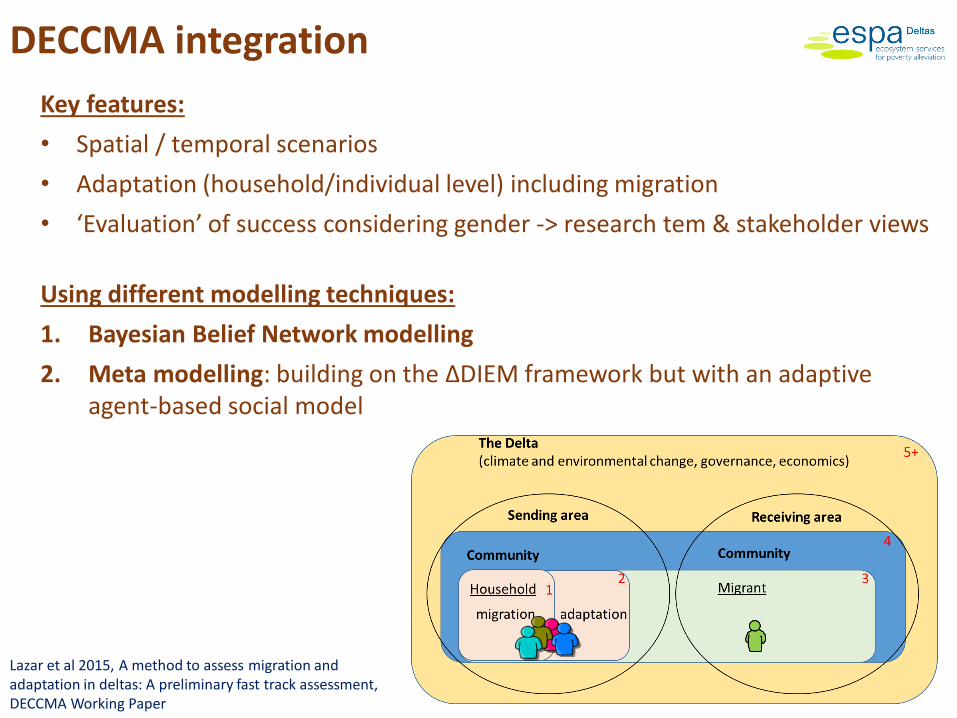
DECCMA project (2014-18)
(DEltas, Vulnerability and Climate Change: Migration and Adaptation)
Overarching aims:
1. to assess migration as an adaptation option in deltaic environments under a changing climate;
2. to deliver policy support on sustainable gender-sensitive adaptation in deltaic areas.