U.S. Department of the Interior U.S. Geological Survey Scientific Investigations Report 2014–5207 Prepared for the Nuclear Regulatory Commission Assessing Inundation Hazards to Nuclear Powerplant Sites Using Geologically Extended Histories of Riverine Floods, Tsunamis, and Storm Surges Surface of marshy swale, trampled during digging of pit. Shovel handle 0.5 meter long Sand 10 centimeters thick deposited by 2004 tsunami Sand interpreted as tsunami deposit and dated to 14th or 15th century A.D. Two earlier sand sheets, each ascribed to a tsunami less than 2,500–2,800 years old Peaty marsh soil buried by 2004 tsunami deposit
Transcript
U.S. Department of the InteriorU.S. Geological Survey
Scientific Investigations Report 2014–5207
Prepared for the Nuclear Regulatory Commission
Assessing Inundation Hazards to Nuclear Powerplant Sites Using Geologically Extended Histories of Riverine Floods, Tsunamis, and Storm Surges
Surface of marshy swale,trampled during digging of pit.Shovel handle 0.5 meter long
Sand interpreted as tsunami deposit and dated to 14th or15th century A.D.
Two earlier sand sheets, eachascribed to a tsunami lessthan 2,500–2,800 years old
Peaty marsh soil buried by2004 tsunami deposit
Cover: A pit dug midway across the marshy swale showing tsunami deposit layers at Phra Thong Island, Thailand. Photograph taken by B.F. Atwater, U.S. Geological Survey, February 2007.
Assessing Inundation Hazards to Nuclear Powerplant Sites Using Geologically Extended Histories of Riverine Floods, Tsunamis, and Storm Surges
By J.E. O’Connor, B.F. Atwater, T.A. Cohn, T.M. Cronin, M.K. Keith, C.G. Smith, and R.R. Mason
Prepared for the Nuclear Regulatory Commission
Scientific Investigations Report 2014–5207
U.S. Department of the InteriorU.S. Geological Survey
U.S. Department of the InteriorSALLY JEWELL, Secretary
U.S. Geological SurveySuzette M. Kimball, Acting Director
U.S. Geological Survey, Reston, Virginia: 2014
For more information on the USGS—the Federal source for science about the Earth, its natural and living resources, natural hazards, and the environment, visit http://www.usgs.gov or call 1–888–ASK–USGS.
For an overview of USGS information products, including maps, imagery, and publications, visit http://www.usgs.gov/pubprod
To order this and other USGS information products, visit http://store.usgs.gov
Any use of trade, firm, or product names is for descriptive purposes only and does not imply endorsement by the U.S. Government.
Although this information product, for the most part, is in the public domain, it also may contain copyrighted materials as noted in the text. Permission to reproduce copyrighted items must be secured from the copyright owner.
Suggested citation:O’Connor, J.E., Atwater, B.F., Cohn, T.A., Cronin, T.M., Keith, M.K., Smith, C.G., and Mason, R.R., 2014, Assessing inundation hazards to nuclear powerplant sites using geologically extended histories of riverine floods, tsunamis, and storm surges: U.S. Geological Survey Scientific Investigations Report 2014–5207, 66 p., http://dx.doi.org/10.3133/sir20145207.
Executive Summary .......................................................................................................................................1Introduction ....................................................................................................................................................2Review of Inundation Hazards and Approaches for Geologic Assessment .......................................3
Paleoflood Records ............................................................................................................4Slackwater Flood Records ................................................................................................4Paleoflood Chronology .......................................................................................................6Paleoflood Discharge Estimation .....................................................................................7Incorporating Paleoflood Information in Flood-Frequency Analysis .........................8
Examples of Paleoflood Studies ................................................................................................8Deschutes River, Oregon ...................................................................................................8Eastern Black Hills, South Dakota .................................................................................11
Statistical Approaches for Incorporating Non-Standard Data in Flood Risk Estimation .....................................................................................................................14
Statistical Issues Related to Use of Paleoflood Information ..............................................14Summary Points and Special Considerations—Riverine Floods ......................................15
Distinguishing Between Tsunami and Storm Deposits...............................................19Prospects for Confirming that Submarine Slides Produced Atlantic Coast
Tsunamis ...............................................................................................................21Geologic Estimates of Tsunami Frequency and Size ...........................................................21
Clues From Earthquake Geology ....................................................................................21Interplay of Earthquake and Tsunami Geology ............................................................21Hydrodynamic Reconstructions From Tsunami Geology ...........................................22
Summary Points and Special Considerations—Tsunamis..................................................22Storm Surges ......................................................................................................................................22
General Approaches and Techniques for Assessing Storm Frequency...........................23Geologic Proxies for Storm Surges ...............................................................................23Suitable Environments .....................................................................................................26Geochronology ..................................................................................................................26
Geologic Assessment of Storm-Surge Frequency—Challenges, Limitations and Opportunities .................................................................................................................27
Relevance of Sea Level ............................................................................................................28Summary Points and Special Considerations—Storm Surges .........................................28
Coarse Screening for Tsunami and Storm Surge ..........................................................................45Paleoflood Scoping and Feasibility Analysis .................................................................................45
Summary........................................................................................................................................................45Author Roles and Acknowledgments .......................................................................................................46References Cited..........................................................................................................................................46Appendix A. Supplementary and Supporting Data ...............................................................................61
Contents
Figures 1. Stream cross-section diagram showing types of geologic and biological evidence
left by floods ..................................................................................................................................5 2. Photograph and diagram showing d eposits and interpreted flood stratigraphy
along valley margin, Spring Creek, South Dakota ...................................................................5 3. Map and graph showing location and annual peak discharge record, U.S.
Geological Survey (USGS) streamgage at Deschutes River at Moody, near Biggs, Oregon ................................................................................................................................9
4. Diagrams showing setting and stratigraphy of the paleoflood site at Deschutes River near Dant, Oregon ............................................................................................................10
5. Graphs showing results of flood-frequency analysis for measured floods and paleofloods on Deschutes River, Oregon, calculated using Bureau of Reclamation FLDFRQ3 program ................................................................................................11
6. Graph showing annual peak discharge at U.S. Geological Survey streamgage Rapid Creek above Canyon Lake near Rapid City, South Dakota .......................................12
7. Graphs showing results of flood-frequency analyses for lower Rapid Creek, South Dakota, calculated using only measured observations, and measured observations supplemented by historical records and geologic evidence of paleofloods ..................................................................................................................................13
v
Figures—Continued 8. Graph showing the gain in flood-frequency information from a paleoflood
stratigraphic record of 1,000 years, as measured in years of annual peak flow records for specific flood quantiles as a function of the number of events recorded by stratigraphy ............................................................................................................................15
9. Photographs showing evidence of recurrent tsunamis at Phra Thong Island, Thailand ........................................................................................................................................16
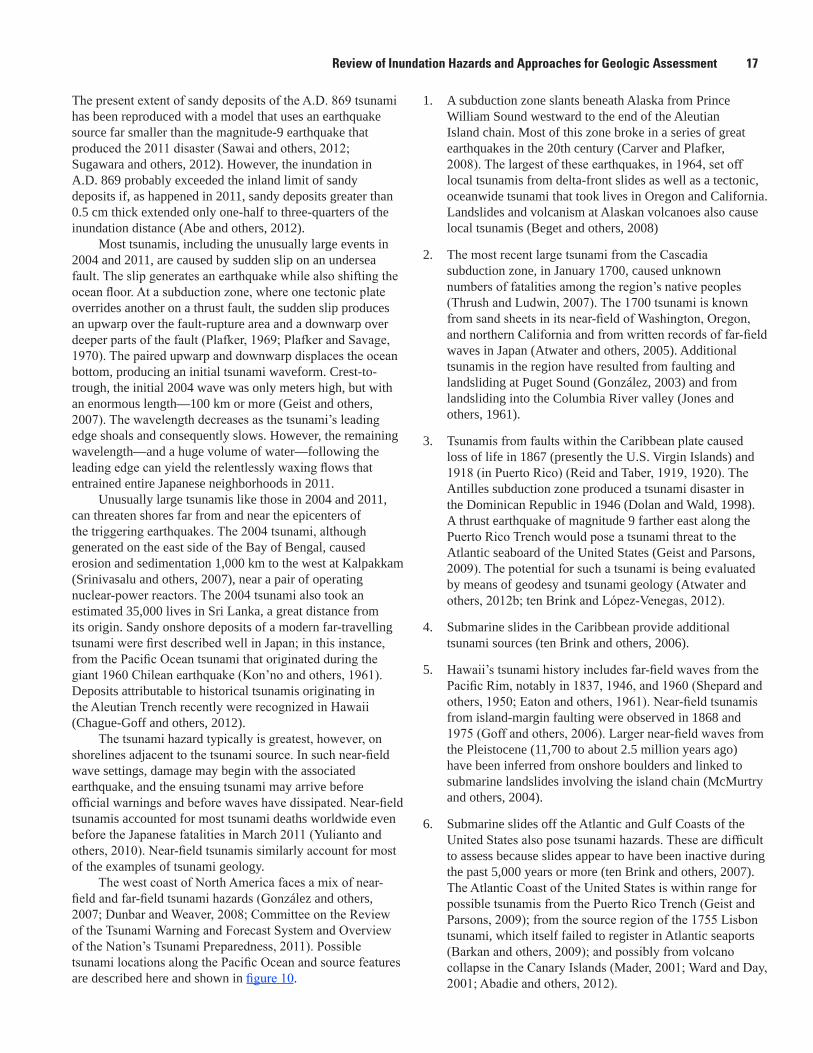
10. Map showing possible tsunami locations and source features relevant to North America ........................................................................................................................................18
11. Photographs showing a simple contextual way of distinguishing between tsunami deposits and storm deposits, as indicated by evidence of the January 1700 Cascadia tsunami at Willapa Bay, Washington .....................................................................20
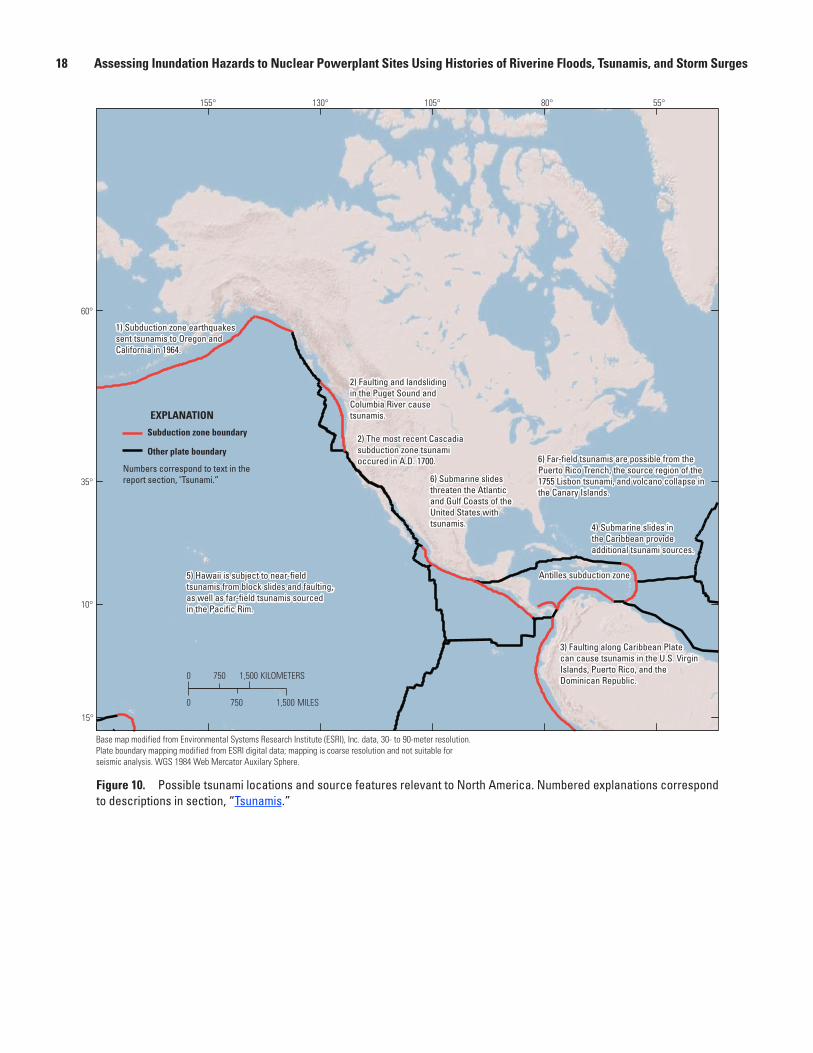
12. Photographs showing examples of modern overwash and associated effects of Hurricane Isabel storm surge along the Outer Banks of North Carolina, 2003 ................24
13. Photographs showingsediment core with two depositional sequences commonly associated with storm surge on barrier islands collected from back-barrier marshes in the Pea Island National Wildlife Refuge, Outer Banks, North Carolina, and representative foraminiferal assemblages for each sedimentary environment ..........................................................................................................25
14. Graphs showing i ndividual records of hurricane landfalls based on analysis of overwash deposits along the western north Atlantic Ocean margin, A.D. 500–2000 ...............................................................................................................................27
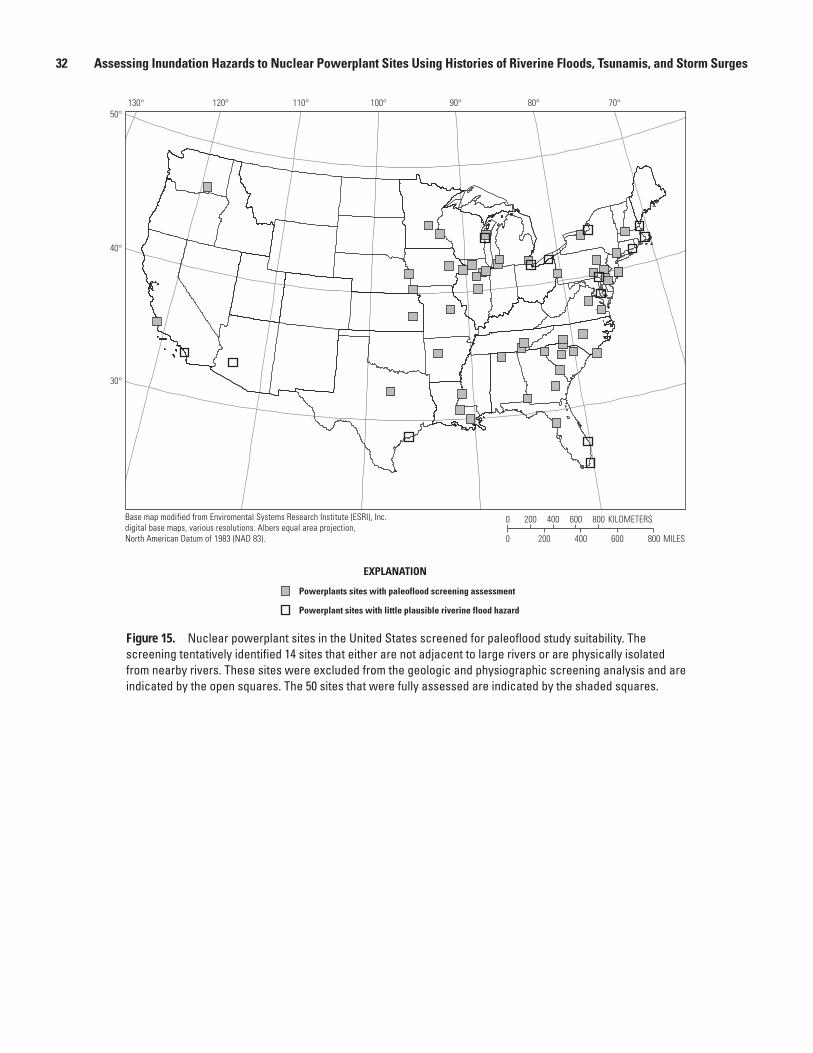
15. Map showing nuclear powerplant sites in the United States screened for paleoflood study suitability .......................................................................................................32
16. Maps showing example of watershed analysis domains enabling targeted paleoflood suitability assessments ..........................................................................................36
17. Maps showing example of site assessment for Quad Cities nuclear powerplant site, Illinois ...................................................................................................................................38
18. Graph and map showing summed rankings for and spatial distribution of each nuclear powerplant site analyzed for suitability as paleoflood study site ........................41
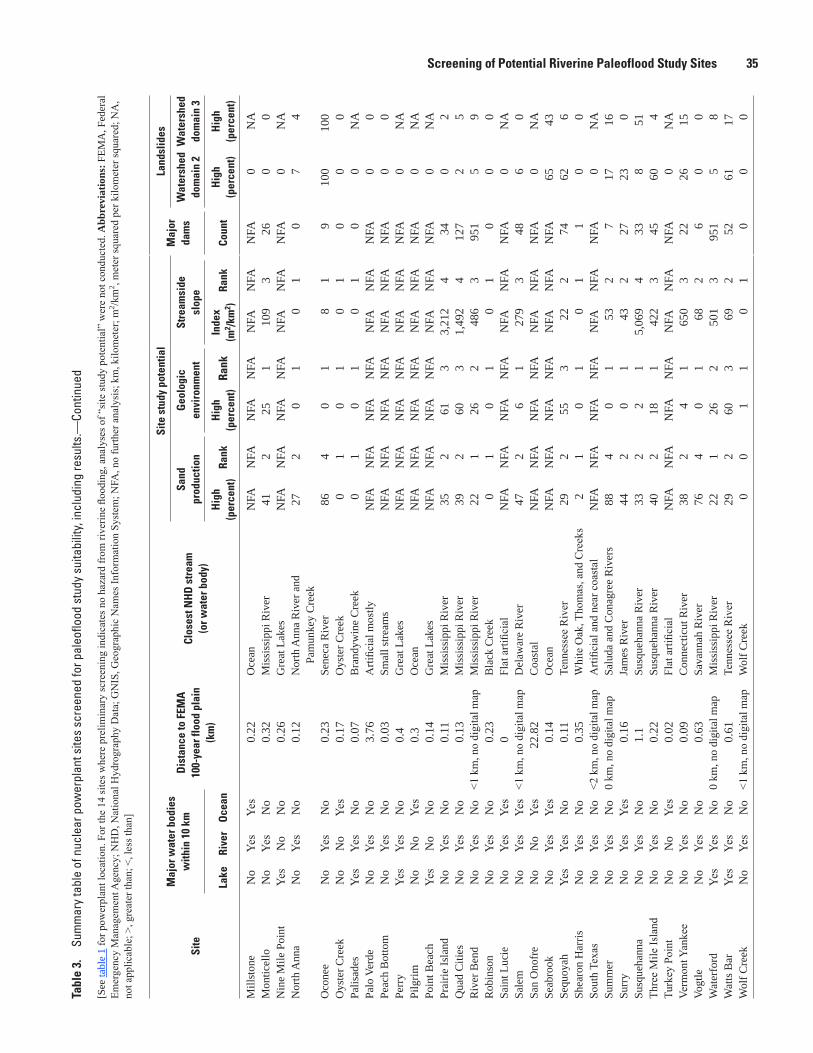
Tables 1. Nuclear powerplants in the United States analyzed for this study ....................................30 2. Information sources for paleoflood suitability screening ....................................................33 3. Summary table of nuclear powerplant sites screened for paleoflood study
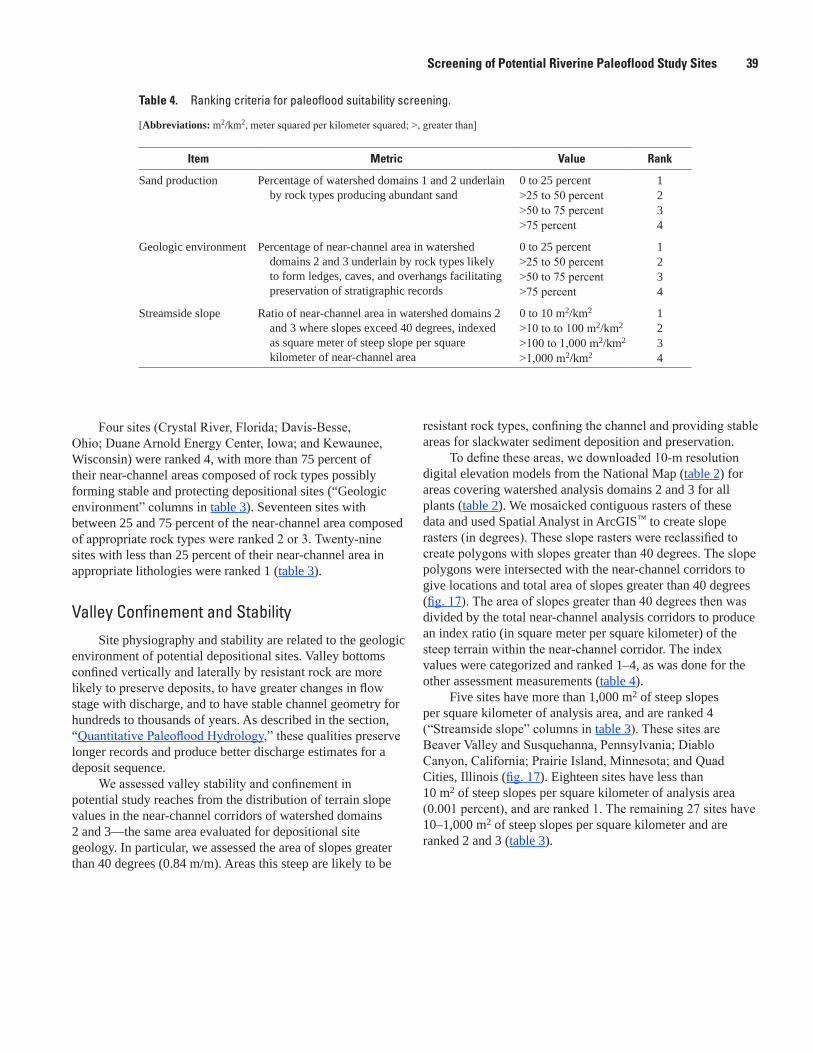
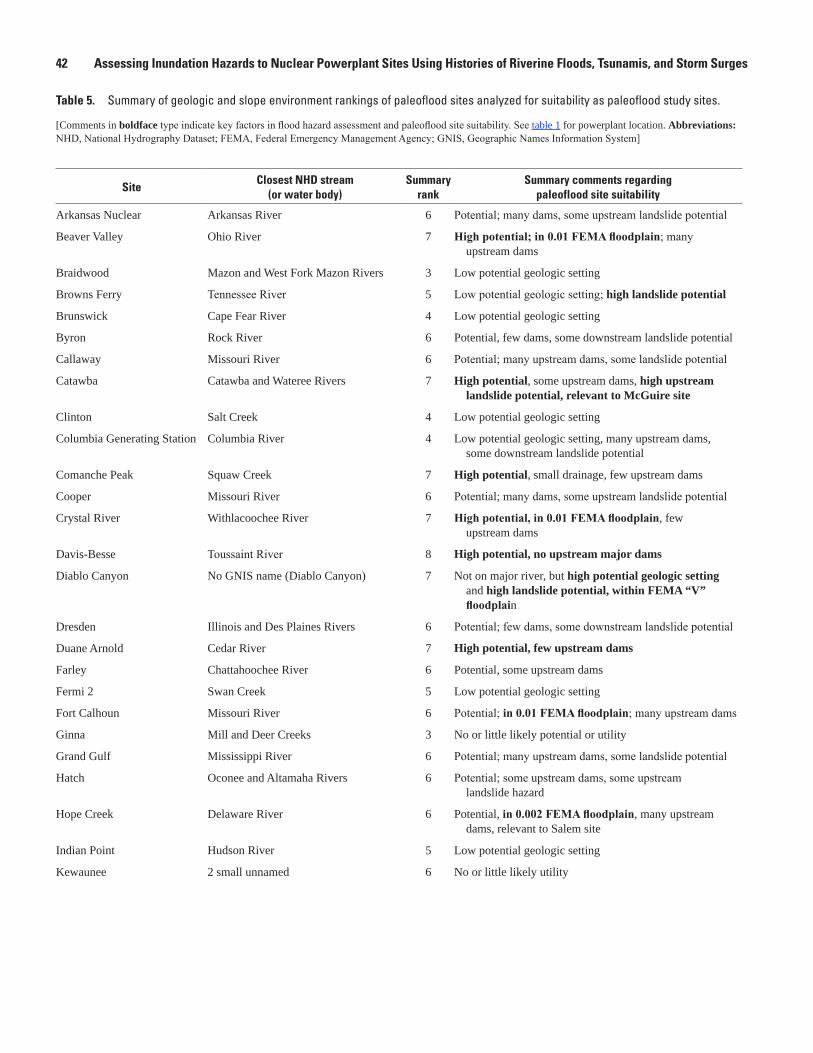
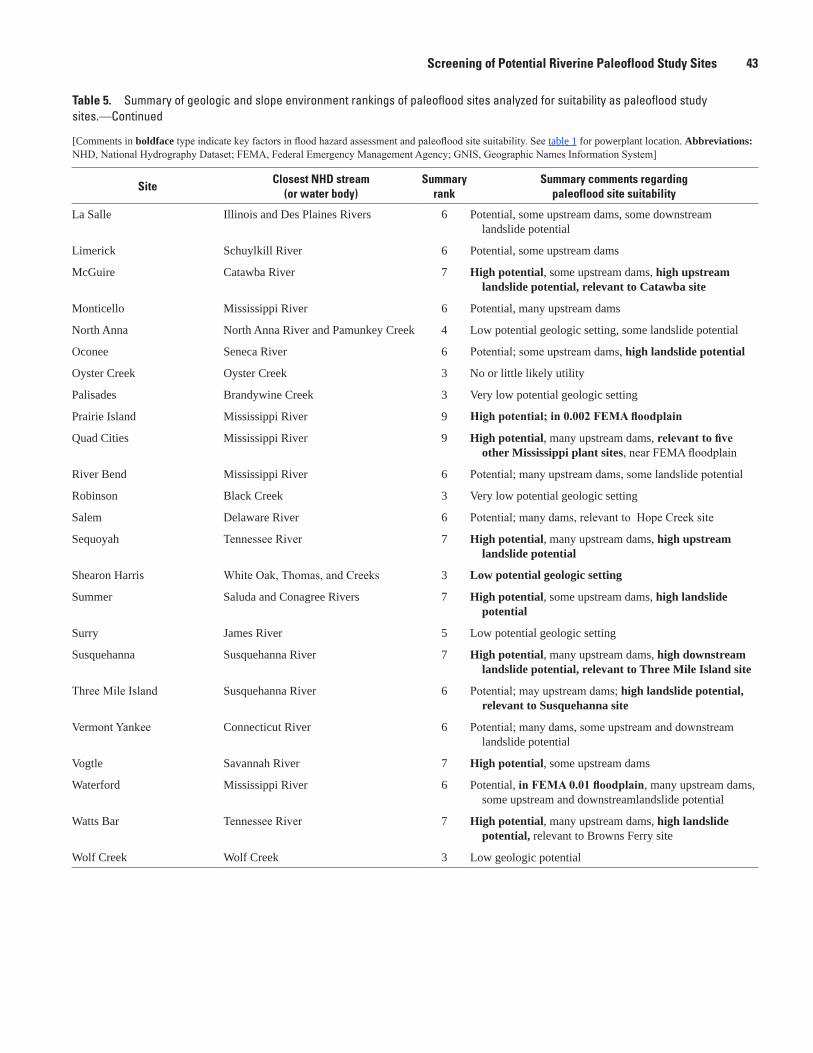
suitability, including results .......................................................................................................34 4. Ranking criteria for paleoflood suitability screening............................................................39 5. Summary of geologic and slope environment rankings of paleoflood sites
analyzed for suitability as paleoflood study sites ..................................................................42
vi
Conversion Factors, Datums, and Abbreviations and Acronyms
Conversion Factors
SI to Inch/Pound
Multiply By To obtain
Length
centimeter (cm) 0.3937 inch (in.)meter (m) 3.281 foot (ft) kilometer (km) 0.6214 mile (mi)meter (m) 1.094 yard (yd)
Area
square meter (m2) 0.0002471 acre square kilometer (km2) 247.1 acresquare meter (m2) 10.76 square foot (ft2) square kilometer (km2) 0.3861 square mile (mi2)
Volume
cubic meter (m3) 264.2 gallon (gal) cubic meter (m3) 35.31 cubic foot (ft3)cubic meter (m3) 1.308 cubic yard (yd3) cubic kilometer (km3) 0.2399 cubic mile (mi3)
Flow rate
millimeter per year (mm/yr) 0.03937 inch per year (in/yr)meter per second (m/s) 3.281 foot per second (ft/s) cubic meter per second (m3/s) 35.31 cubic foot per second (ft3/s)
Datums
Vertical coordinate information is referenced to North American Vertical Datum of 1988 (NAVD 88).
Horizontal coordinate information is referenced to the North American Datum of 1983 (NAD 83).
Elevation, as used in this report, refers to distance above the vertical datum.
Abbreviations and Acronyms
EMA Expected Moments AlgorithmFEMA Federal Emergency Management AgencyOSL Optically stimulated luminescenceUSGS U.S. Geological Survey
Assessing Inundation Hazards to Nuclear Powerplant Sites Using Geologically Extended Histories of Riverine Floods, Tsunamis, and Storm Surges
By J.E. O’Connor, B.F. Atwater, T.A. Cohn, T.M. Cronin, M.K. Keith, C.G. Smith, and R.R. Mason
Executive SummaryMost nuclear powerplants in the United States are near
rivers, large lakes, or oceans. As evident from the Fukushima Daiichi, Japan, disaster of 2011, these water bodies pose inundation threats. Geologic records can extend knowledge of rare hazards from flooding, storm surges, and tsunamis. This knowledge can aid in assessing the safety of critical structures such as dams and energy plants, for which even remotely possible hazards are pertinent. Quantitative analysis of inundation from geologic records perhaps is most developed for and applied to riverine flood hazards, but because of recent natural disasters, geologic investigations also are now used widely for understanding tsunami hazards and coastal storm surges.
Layered sedimentary deposits commonly give the most complete geologic record of large floods, storm surges, and tsunamis. Sedimentary layers may be preserved for hundreds or thousands of years in suitable depositional environments, thereby providing an archive of rare, high-magnitude events. All inundation hazards discussed in this report—riverine floods, tsunamis, and storm surges—have had long records extracted from sedimentary sequences, many specifically for hazard assessment.
Geologic records commonly are imprecise, so most hazard assessments benefit from evaluation of many sites and rigorous uncertainty assessment. Despite uncertainties, geologic records commonly can improve knowledge of the types and magnitudes of hazards threatening specific sites or regions. New statistical tools and approaches can efficiently incorporate geologic information into frequency assessments.
These tools are most developed for riverine flood hazards, but are to some degree transferable to other episodic natural phenomena such as tsunamis and storm surges.
Even with these efficient statistical approaches for examining geologic records, systematic landscape changes may reduce the applicability of retrospective assessments. These non-stationarity issues (such as climate change, sea-level rise, land-use, dams and flow regulation) may all affect the validity of using past experience—no matter how complete the record—to assess future likelihoods. These issues require site-specific consideration for nearly all hazard assessments drawn from geologic evidence.
A screening of the 104 nuclear powerplants in the United States licensed by the Nuclear Regulatory Commission (at 64 sites) indicates several sites for which paleoflood studies likely would provide additional flood-frequency information. Two sites—Duane Arnold, Iowa, on the Cedar River; and Davis-Besse, Ohio, on the Toussaint River—have geologic conditions suitable for creating and preserving stratigraphic records of flooding and few upstream dams that may complicate flood-frequency analysis. One site—Crystal River, Florida1, on the Withlacoochee River and only 4 kilometers from the coast—has high potential as a candidate for assessing riverine and marine inundation hazards. Several sites on the Mississippi River have high geologic potential, but upstream dams almost certainly now regulate peak flows. Nevertheless, studies on the Mississippi River to evaluate long-term flood frequency may provide results applicable to a wide spectrum of regional hazard issues. Several sites in the southeastern United States have high geologic potential, and studies at these sites also may be helpful in evaluating hazards from outburst floods from landslide dams (river blockages formed by mass movements), which may be a regional hazard. For all these sites, closer investigation and field reconnaissance would be needed to confirm suitable deposits and settings for a complete paleoflood analysis. Similar screenings may help identify high-potential sites for geologic investigations of tsunami and storm-surge hazards.
1The Crystal River plant was shut down permanently in 2013 while this study was in progress. However, a license application for a proposed new plant in the same general vicinity is currently under review.
2 Assessing Inundation Hazards to Nuclear Powerplant Sites Using Histories of Riverine Floods, Tsunamis, and Storm Surges
Introduction As of 2013, most of the 104 operating nuclear
powerplants in the United States were located close to large rivers or coastlines because of cooling-water requirements. This proximity to large water bodies increases the risk of plant flooding. In the Fukushima Daiichi, Japan, disaster of 2011, tsunami inundation was a leading cause of the release of radioactive materials (Kurokawa and others, 2012). Flooding of the River Geronde in 1999 disrupted power supplies and damaged the Le Blayais nuclear power plant in southwestern France, and a flood on the Rhone River in 2009 compromised the cooling system of the Cruas nuclear plant in southeastern France (Autorité de Sûreté Nucléaire, 2010; Kopytko and Perkins, 20112). Worldwide, nearly two dozen nuclear powerplants may be at risk of inundation by tsunamis, according to a tally that includes no site in the United States (Rodriguez-Vidal and others, 2012).
Assessing inundation risks for nuclear powerplants is challenging, particularly when considering events of extreme magnitude and low frequency. On most coasts, tsunamis are infrequent hazards, and understanding their recurrence and site-specific consequences means relying on fragmentary records or predictive modeling. Riverine and storm-surge hazard assessments are more common for coastline or flood-plain management, but standard approaches relying on historical records may be deficient when considering events with recurrence intervals of hundreds or thousands of years.
Approaches common for consideration of rare hazards include deterministic modeling of plausible worst-case scenarios, such as the “probable maximum flood,” and probabilistic empirical analysis of past events, such as flood-frequency analysis (Prasad and others, 2011). Geologic records are helpful in both approaches—they indicate the types and magnitudes of processes that may pose hazards (such as landslides and earthquakes) and they chronicle past large events, thereby extending records useful for quantitative site-specific hazard analysis.
Geologic records can efficiently extend observational records, particularly where the events of interest are large and affect landscapes. Large floods, storm surges, and tsunamis as a consequence of entraining and depositing sediment, commonly leave stratigraphic records. From such records, the recurrence and magnitude of all these phenomena have been
studied for various reasons and at multiple locations. Geologic histories of tsunamis have been inferred on many shores in the past 30 years to help define the magnitude and frequency of tsunamis and of the faulting, volcanic eruptions, and landslides that trigger them (Bourgeois, 2009). Similarly, paleoflood studies are being conducted worldwide to address local and regional issues of flood frequency—particularly for rare and large floods (Benito and O’Connor, 2013). Additionally, analyzing the frequency and magnitude of coastal storm surges is a developing field with many studies along coastlines and areas flanking large water bodies (Donnelly and Woodruff, 2007; Liu, 2007; Woodruff and others, 2008; Hippensteel and others, 2013).
New statistical tools and approaches can efficiently and robustly incorporate geologic information into frequency assessments. These approaches can accommodate generalized and imprecise forms of flood information, permitting direct use of interval data and complicated types of information, such as non-exceedance of specified thresholds, which cannot be characterized using traditional statistical methods. The new techniques most commonly have been applied to riverine flood-frequency assessments (for example, Stedinger and Cohn, 1986; Stedinger and Baker, 1987; O’Connell and others, 2002), but the concepts, and in many cases the techniques, apply to other episodic natural phenomena such as storm surges or tsunamis.
This report summarizes geologic approaches for extending histories, hundreds or thousands of years into the past, of flooding near nuclear powerplants. These approaches are directly relevant to a key finding in the National Research Council (2014, p. S-3) assessment of the Fukushima nuclear accident:
“The overarching lesson learned from the Fukushima Daiichi accident is that nuclear plant licensees and their regulators must actively seek out and act on new information about hazards that have the potential to affect the safety of nuclear plants.”In this report, the most detailed description of methods
and application is for riverine flooding. Because the geologic approaches are similar for all inundation hazards, current practices for identifying and interpreting ancient tsunamis and storm surges are reviewed and described more briefly. Primarily in reference to riverine flooding, statistical issues in estimating the recurrence of events that are extremely rare (annual probability of 10-4 or less) are addressed as well as systematic landscape and climate factors, including sea-level rise, which are relevant to any backward-looking analysis. By means of a screening assessment, we identify existing nuclear powerplants in the United States that may be suitable for geologic analysis of susceptibility to riverine floods.
2Although Kopytko and Perkins (2011) report that the Cruas flood damage was in December 2003, the closure was in December 2009 (Joseph Kanney, Nuclear Regulatory Commission, written commun., January 31, 2014).
Review of Inundation Hazards and Approaches for Geologic Assessment 3
Review of Inundation Hazards and Approaches for Geologic Assessment
This section summarizes approaches to and examples of developing geologic records of inundations. Riverine flooding, tsunamis, and storm surges are each described separately, but the many common aspects of stratigraphic records and the approaches to interpreting them for all these inundation processes are treated most thoroughly in section, “Riverine Floods.” The sections, “Tsunamis” and “Storm Surges,” contain more focused review and discussion of methods, approaches, and limitations specific to those hazards.
Riverine Floods
Riverine floods are a chronic, lethal, and costly natural hazard in the United States, causing an average of 140 fatalities and $5 billion damage each year (1999 dollars; Schildgen, 1999). Despite advances in flood science and implementation of Federal hazard-reduction policies, damage from flooding continues to escalate (Pielke and Downton, 2000). In the United States, about 3,800 towns and cities of more than 2,500 inhabitants occupy flood plains (Miller and Miller, 2000). Many of the 104 nuclear powerplants licensed by the Nuclear Regulatory Commission have facilities on or near flood plains.
Although nearly all streams and rivers are subject to flooding, the potential for damage varies with climate and physiography (Wohl, 2000; O’Connor and others, 2002). Physiographic effects are apparent for streams running through steep, confined channels, with high velocities and coarse bedloads. High velocities can impart substantial forces to inundated structures, and coarse materials can damage or bury in-channel and flood plain structures. For low-gradient rivers, flood damage generally results from inundation or flows exceeding capacity of water diversion or storage facilities, such as levee breaching or dam overtopping, although in some cases, high sediment and debris loads impart substantial damage. For nuclear facilities, flood inundation, clogged water-intake structures, and flood damage to critical off-site structures can lead to hazardous conditions (Kopytko and Perkins, 2011).
Frequency and Magnitude Assessment Challenges
A key component of flood hazard assessment is determination of flood frequency and magnitude. For nearly 100 years (Dawdy and others, 2012), probabilistic approaches typically have involved statistical analysis of observed peak flows to estimate flood quantiles, such as the 0.01 annual exceedance probability flow (the so-called 100-year flood), defined as the peak flow having a discharge equaled or
exceeded with an annual probability of 0.01 (1 percent). This approach—embodied in widespread implementation in the United States of Bulletin 17B, Guidelines for Determining Flood Flow Frequency (Interagency Advisory Committee on Water Data, 1982)—provides for systematic flood-frequency analysis of gaged flood measurements.
In addition to some general problems with the flood frequency analysis approach specified by Bulletin 17B (Stedinger and Griffis, 2008), additional complications arise when assessing the hazard associated with rare and large floods. A fundamental limitation is that instrumental records typically are of short duration, especially in the United States, where few streamgages have been operated for more than 100 years. In particular, such limited records challenge reliable determination of flood-quantile estimates for peak flows with annual exceedance probabilities of less than 0.01 (England and others, 2006). For critical structures such as dam spillways, nuclear power plants, and hazardous waste repositories, reliable estimates of rare floods may be required, potentially including floods with annual exceedance probabilities of 10-6. Other common challenges associated with flood-frequency analysis, particularly for floods of low recurrence probabilities, include (1) regionalizing or otherwise transferring observations at a measurement location to provide meaningful flood quantile estimates at a site of interest; and (2) accounting for past and future non-stationarity effects such as changes in climate, land-use, and channel conditions.
Quantitative Paleoflood HydrologyPaleoflood hydrology (Kochel and Baker, 1982), or flood
geology, is the reconstruction of the magnitude and frequency of past floods using geologic or botanical evidence (Baker and others, 2002). The following synopsis of paleoflood hydrology is derived from Benito and O’Connor (2013). Over the last 30 years, paleoflood hydrology has achieved recognition as a new branch of geomorphology and hydrology (Baker and others, 2002; Benito and Thorndycraft, 2005; Baker, 2008), using principles of geology, hydrology, and fluid mechanics to infer quantitative and qualitative aspects of unobserved or unmeasured floods on the basis of physical flood evidence (House and others, 2002a, Saint Laurent, 2004). Flood evidence includes various geologic indicators (flood deposits and geomorphic features) and flotsam deposits, as well as physical effects on vegetation such as tree scars. Resulting inferences can include timing, magnitude, and frequency of individual floods at specific sites or for specific rivers, as well as conclusions regarding the magnitude and frequency of channel-forming floods. The benefit of paleoflood studies is being able to obtain information on floods from times or locations where direct measurements and observations are sparse or absent. Findings from paleoflood studies support flood hazard assessments and improve the understanding of the linkages between climate, land use, flood frequency, and channel morphology.
4 Assessing Inundation Hazards to Nuclear Powerplant Sites Using Histories of Riverine Floods, Tsunamis, and Storm Surges
Paleoflood studies typically take one of two forms: (1) analyses focused on determining quantitative information for specific events, such as the timing, peak discharge, and maximum stage of an individual flood or floods; and (2) studies investigating more general spatial and temporal patterns of flooding, commonly to assess relations among climate, land use, flood frequency and magnitude, and geomorphic response (such as channel morphology or flood plain sedimentation and erosion processes). Although individual paleofloods most typically are studied for rivers confined by bedrock or other resistant materials that favor preservation of their stratigraphic and geomorphic records (Kochel and Baker, 1982), valuable paleoflood information also has been obtained from alluvial rivers (Knox, 1999; Knox and Daniels, 2002). Studies relating channel form or flood plain morphology to past flood characteristics typically are done for alluvial river corridors, and follow from the classic studies of Schumm (1968) and Dury (1973). Quantitative information of specific flood levels that have been exceeded (or not exceeded) generally is likely to be most helpful for assessing risk to nuclear facilities; consequently, the emphasis of this section is on studies that can provide specific information on the timing, magnitude, and frequency of individual floods.
Quantitative paleoflood hydrology relies on identification of evidence of flooding, in conjunction with application of hydrodynamic principles, to determine flow magnitude. These two aspects of investigation typically lead to four phases of analysis: (1) documentation and assessment of flood evidence; (2) determination of paleoflood ages; (3) estimation of flow magnitude, typically peak discharge, associated with flood evidence; and (4) incorporation of paleoflood data in flood-frequency analysis. The first phase involves study of historical documents, landforms, stratigraphy, and sedimentology, whereas the second phase involves geochronology in order to identify and date physical evidence of flooding. The third phase requires hydraulic analysis to assign a flow magnitude to paleoflood evidence. A common final phase incorporates paleoflood discharge and chronology information in a flood-frequency analysis. Paleoflood studies generally are more successful and have fewer uncertainties in fluvial systems with resistant boundaries, such as bedrock or semi-alluvial channels. These environments, because of stable depositional sites, tend to have longer and clearer stratigraphic records of past floods—sometimes exceeding several thousand years—and have stable boundary conditions, leading to greater confidence in using present topography to determine past hydraulic conditions.
Most paleoflood studies have focused on semiarid and arid regions, although recent studies have successfully extended flood records in humid environments as well (for example, Fanok and Wohl, 1997; Springer and Kite, 1997; Kidson and others, 2006). Paleoflood studies that extend flood records hundreds or thousands of years into the past can
provide compelling evidence of flood discharges exceeding those in instrumental or written records (Enzel and others, 1993; O’Connor and others, 1994; Hosman and others, 2003; Harden and others, 2011). These studies also can provide evidence that large floods cluster on time scales of decades and centuries—a clustering that can be attributed to variability in climate (Ely and others, 1993; Knox 2000; Benito and others, 2003; Harden, 2012).
Paleoflood RecordsPaleoflood records are derived from physical evidence of
paleoflood stage (fig. 1). The best high-water marks include mud, silt, seed lines, and flotsam (such as fine organic debris, grass, and woody debris) that closely mark peak flood stage. This type of evidence typically only persists for weeks in humid climates, but possibly for several years or decades, in semiarid and arid climates (Williams and Costa, 1988). More lasting evidence is also commonly preserved, including sand- and silt-sized slackwater flood deposits, gravel and boulder bars, silt lines, and erosion features (Baker, 1987; Kochel and Baker, 1988; Webb and Jarrett, 2002), as well as botanical evidence such as scars on riparian trees (Sigafoos, 1964; Ruiz-Villenueva and others, 2010). Depending on the environment, such evidence can persist for millennia.
Slackwater Flood RecordsThe most complete paleoflood records generally result
from analysis of stratigraphic sequences of fine-grained flood deposits found in slackwater and eddy environments (fig. 2). Slackwater flood deposits are fine-grained (sand and finer) sedimentary deposits that accumulate from suspension during floods (Baker and others, 2002). Slackwater sedimentation areas include flooded valley margins subject to eddies, back-flooding, flow separation, and water stagnation during high stages. Slower streamflow velocities in these areas promote rapid deposition of the suspended load. The resulting slackwater flood deposits commonly contain sedimentary structures and textures indicative of flow energy, direction, and velocities.
Slackwater depositional environments can be any location of relative slower flow, but commonly are present in (1) areas of channel widening, (2) severe channel bends, (3) obstacle hydraulic shadows where flow separation causes eddies, (4) alcoves and caves in bedrock walls, (5) back-flooded tributary mouths and valleys, and (6) on top of high alluvial or bedrock surfaces that flank the channel (Kochel and others, 1982; Ely and Baker, 1985; Baker and Kochel, 1988; Benito and others, 2003; Sheffer and others, 2003; Benito and Thorndycraft, 2005; Thorndycraft and others, 2005a). In narrow reaches, preservation of slackwater flood deposits is enhanced when those deposits are deposited in caves, alcoves, or under rock overhangs that protect the deposits from disturbances such as precipitation and vegetation growth.
Review of Inundation Hazards and Approaches for Geologic Assessment 5
tac14-0961_fig01
Rock alcove with sequencesof slackwater deposits
Scar ontree
Paleoflood stageErosionalscar
Low-waterchannel
Soil
Gravel bar
BedrockBedrock
Figure 1. Types of geologic and biological evidence left by floods. After Baker (1987) and Jarrett (1991).
tac14-0961_fig02
A B
June 9, 19720
10
20
30
40
50Depth, in centimeters (cm)
A.D. 1300–1400
400–200 B.C.
Flood deposits
Rockfall and colluvium
Bedrock
Slackwater deposits inter-bedded with colluvium androckfall
Sand and flotsam0 cm0 cm
20 cm20 cm
40 cm40 cm
Figure 2. (A) Deposits and (B) interpreted flood stratigraphy along valley margin, Spring Creek, South Dakota. Gray sandy flood deposits, including a capping sand and flotsam deposited by the June 9, 1972, flood, are separated by poorly sorted rockfall and colluvium (soil and rock transported down slope) that accumulated between floods. Radiocarbon dating indicates that the thicker and coarser sand deposit below the 1972 flood deposit was emplaced about 600–700 years ago (A.D. 1300–1400). Information is from studies reported by Harden and others (2011).
6 Assessing Inundation Hazards to Nuclear Powerplant Sites Using Histories of Riverine Floods, Tsunamis, and Storm Surges
Paleoflood ChronologyDeveloping a flood chronology is vital to assessing flood
frequency, which typically requires numerical age dating of sedimentary flood units and intervening deposits. Common techniques include radiocarbon (14C) and optically stimulated luminescence (OSL), although short-lived and anthropogenic radioisotopes such as lead-210 (210Pb) and cesium-237 (237Cs) are useful for dating young deposits. Radiocarbon dating is the most common absolute dating tool used in paleohydrologic work, although OSL dating is becoming more common. These techniques also are widely applied for developing tsunami and storm-surge chronologies. Radiocarbon dating targets organic materials such as wood, charcoal, seeds, and leaf fragments. These materials are entrained by floods and commonly are deposited with sand and silt in slackwater sequences. Additionally, flood deposits might cover vegetation or organic cultural materials and may, in turn, be covered by vegetation and organic detritus. All these types of materials can be radiocarbon dated, thereby providing information on the age of enclosing flood deposits or bounding deposits.
Radiocarbon decay in plant remains begins with photosynthetic uptake of carbon from the atmosphere; therefore, it is important to minimize (or estimate) the difference between the age of the dated organic material and the time of the flood. The organic materials expected to most closely date enclosing deposits are those not likely to have persisted for a long period of time before entrainment and deposition, such as leaves, seeds, and bark-bearing twigs. Commonly, however, stratigraphic chronologies rely on charcoal, which tends to persist in deposits, sometimes for hundreds or thousands of years (Blong and Gillespie, 1978). For all radiocarbon ages, calibration to actual calendar years requires calibration by standard calibration curves, such as OxCal (University of Oxford, 2014).
For most studies, it is assumed that radiocarbon ages from detrital material within flood deposits closely approximates the flood date, but because the deposition post-dates the photosynthetic carbon uptake, the radiometric date actually provides a maximum limiting age for the enclosing deposit. This is particularly the case for radiocarbon dates from detrital charcoal, which can persist for long periods before being entrained and incorporated in flood deposits. Additionally, dated materials may give ages younger than the enclosing flood deposit when younger charcoal has been incorporated into the deposit through bioturbation, although potential for this error can be reduced by careful stratigraphic analysis. Dating of in-situ organic materials, such as charcoal from ground fires between affected surfaces bracketed by flood deposits, or pedogenic carbon between flood deposits, can provide robust constraints on the timing of flood sequences. As for most geologic investigations, dating of multiple organic materials and multiple deposits within a stratigraphical sequence decreases uncertainty in flood age determinations.
The 5,730-year half-life of 14C limits radiocarbon dating to deposits less than 40,000 years. The range of calendar ages that corresponds to a radiocarbon age expands for time intervals when concentrations of atmospheric 14C have declined relative to stable isotopes of carbon. The most recent such interval of great uncertainty (A.D. 1650–1950). resulted from the burning of fossil fuel. For this recent period, other approaches such as dendrochronology (Sigafoos, 1964; Yanosky and Jarrett, 2002; Jacoby and others, 2008; Ruiz-Villenueva and others, 2010), other isotopes, historical artifacts, or OSL may provide better age estimates.
The OSL method is a dating technique that indicates the burial time of deposits (Aitken, 1998; Rittenour, 2008). This approach involves the determination of when sediment, primarily quartz and feldspar minerals, was last exposed to light and “bleached.” For the purposes of dating sequences of flood deposits, the general presumption is that the sediment was last exposed to light prior to deposition. Sampling and analysis involve several steps of collecting and analyzing sand-sized sediment samples from a target deposit without inadvertently exposing samples to light. Developments in OSL instrumentation have enabled the sample size to be decreased to individual quartz and feldspar grains (Duller and Murray, 2000; Bøtter-Jensen and others, 2000). Moreover, new analytical protocols have improved the application of OSL dating for alluvial deposits (Murray and Wintle, 2000; Wintle and Murray, 2006; Rittenour, 2008), resulting in numerical dating with an error range of 5–10 percent, even for deposits less than 300 years old (Ballarini and others, 2003; Duller, 2004; Arnold and others, 2009). Research also has highlighted the importance of selecting suitable sample locations (Rodnight and others, 2006). The OSL technique can be hampered in situations (1) when the proper mineral species are not present in the deposits and (2) for floods where the transported sediment was not bleached by exposure to light, either because of turbidity or because the flood occurred at night. Under appropriate conditions, however, OSL dating can be an important tool, especially for deposits that (1) contain little or no organic materials; (2) are older than the 40,000-year range of radiocarbon dating (in certain settings, OSL can give ages as much as and exceeding 300,000 years); or (3) are younger than 300 years for which radiocarbon dating cannot yield precise results.
Radiocarbon and OSL dating can be supplemented with analysis of modern radionuclides such as 137Cs and 210Pb (Ely and others, 1992; Stokes and Walling, 2003; Thorndycraft and others, 2005b). In the 1950s, 137Cs was introduced into the atmosphere during nuclear bomb testing and its presence in flood deposits signifies a post-1950 age (unless bioturbation has mixed in Cs-containing sediment into older deposits). The relatively short half-life of 210Pb (22.2 years) limits dating to deposits less than 150 years in age. Likewise, human artifacts, including pottery (Benito and others, 2003), plastics, and even beer cans (House and Baker, 2001), can provide numeric age constraints on enclosing deposits.
Review of Inundation Hazards and Approaches for Geologic Assessment 7
Dendrochronology has supported several paleoflood studies because of the identifiable responses of tree growth to damage of the bark and wood-forming tissues, buds, and leaves, and to radial growth following partial uprooting of the trunk (Yanosky and Jarrett, 2002; Jacoby and others, 2008). For situations when flood damage or effects can be related to tree-ring chronologies derived from the affected tree or from regional chronologies, flood ages commonly can be determined to a specific year, and in some instances, to a specific season (Sigafoos, 1964; Ruíz-Villanueva and others, 2010). Additionally, a minimum flood age can be interpreted from tree-ring analyses if trees are rooted on the surface of that flood deposit and can constrain ages for deposits occurring after tree establishment (Sigafoos, 1964; Helley and LaMarche, 1973; Speer, 2010).
Paleoflood Discharge EstimationHydraulic analysis forms the basis for discharge estimates
for most quantitative paleoflood hydrology studies (O’Connor and Webb, 1988; Webb and Jarrett, 2002; Benito and O’Connor, 2013). In most analyses, discharge estimates follow from the assumption that the elevation of paleostage evidence provides a minimum estimate of the maximum stage attained by an identified flood. In some situations, deposit elevations may closely approximate the maximum flood stage, although this assumption is difficult to verify except for specific investigations of height differences between flood indicators and actual flood water depth for modern floods (Kochel, 1980; Springer and Kite, 1997; Jarrett and England, 2002; House and others, 2002b). Numerous formulas and models are available to estimate flood discharge from known or estimated water surface elevations (O’Connor and Webb, 1988; Webb and Jarrett, 2002; Kutija, 2003; Lang and others, 2004; Benito and O’Connor, 2013), ranging from simple hydraulic equations to more involved, multi-dimensional hydraulic modeling. Most paleoflood studies use one-dimensional flow models with calculations based on (1) uniform flow equations (for example, Manning equation), (2) critical flow conditions, (3) gradually varied flow, and (4) one-dimensional St. Venant equations. In complex river reaches, multi-dimensional modeling may reduce uncertainties associated with reconstructing flood discharge (Denlinger and others, 2002; Wohl, 2002). As more fully described by Webb and Jarrett (2002), the appropriate approach for a particular site depends on local hydraulic conditions.
For paleoflood analyses, these formulas and models are most accurate when applied to the channel geometry and roughness conditions at the time of the flow of interest. In many cases, this geometry may differ from present conditions. Nevertheless, for floods of the last several thousand years in bedrock-bound fluvial systems, the present valley geometry commonly is assumed to adequately represent the channel
conditions at the time of flooding (for example, Ely and Baker, 1985; O’Connor and others, 1986; Webb and others, 1988; O’Connor and others, 1994; Harden and others, 2011). However, because channel geometry is the single most important factor in calculating discharge for a particular stage, assessment of this assumption is important for overall uncertainty analysis. Hydraulic analysis of paleofloods in river channels for which flow-boundary geometry is uncertain requires specific consideration of plausible ranges of channel geometry at the time of flooding. This is the case for alluvial or bedrock-bound channels where incision, widening, or alluviation possibly have occurred since the flood paleostage evidence was emplaced.
Most paleoflood hydraulic analyses use gradually varied flow models (O’Connor and Webb, 1988; Webb and Jarrett, 2002). River channels typically are irregular in shape and surface roughness, leading to non-uniform flow conditions. The simplest gradually varied flow analyses assume a steady state (constant discharge) for which flow depth varies with distance but not with time (Chow, 1959). For such situations, calculation of water-surface profiles are based on the resolution of the conservation of mass and energy equations in their one-dimensional forms. The step-backwater method (Chow, 1959; Henderson, 1966) for gradually varied water-surface profile computation is the typical approach used to relate paleoflood evidence to discharge (O’Connor and Webb, 1988). Available public-domain computer routines, such as the U.S. Army Corps of Engineers HEC-RAS (Hydrologic Engineering Center, 2010) software, allows for rapid calculation of water-surface profiles for specified discharges and energy-loss coefficients. Multiple analyses can provide synthetic stage-discharge ratings at sites of interest, thus providing a basis for estimating paleoflood discharge from the elevation of a deposit or other high-water evidence. Uncertainties in flow modeling parameters (and channel geometry) can be evaluated for their resulting influence in paleoflood discharges by testing outcomes of plausible ranges of Manning’s n values and possible changes in channel geometry. Similarly, it is possible to estimate the uncertainty in paleoflood discharge owing to uncertainty of the fidelity of the preserved flood evidence in marking that actual maximum flood stage.
Recent paleoflood studies have overcome some specific problems of traditional one-dimensional hydraulic models (Cunge and others, 1980; Bates and DeRoo, 2000) through application of two-dimensional hydrodynamic models (Denlinger and others, 2002). Advances in modeling approaches, computational software, and high-resolution topographic data acquisition make such models more practical for applied paleoflood studies. Several such two-dimensional models including the SRH2D model (Lai, 2008, 2009) have been used extensively for paleoflood studies by
8 Assessing Inundation Hazards to Nuclear Powerplant Sites Using Histories of Riverine Floods, Tsunamis, and Storm Surges
the Bureau of Reclamation (Bauer and Klinger, 2010). These models typically take advantage of high-resolution digital elevation models, such as those derived from terrestrial or airborne laser altimetry, to produce better estimates of flow stage and velocity associated with large flows, particularly in environments of substantial secondary and cross-valley flow currents (Denlinger and others, 2002). As these hydraulic models and their interfaces advance, coupled with greater availability of high-resolution topography, application of multi-dimensional models to paleoflood studies will become increasingly common.
Incorporating Paleoflood Information in Flood-Frequency Analysis
Paleoflood data provide tangible information on the occurrence and magnitude of large and infrequent floods. Although paleoflood information may not be as precise as information from gaged or observed records and is not continuous in the manner of many measurement programs, understanding of the timing and magnitude of the largest floods can reduce uncertainties in flood quantile estimates when considered in a statistically appropriate manner (Blainey and others, 2002). Several statistical methods have been applied to estimate distribution function parameters for paleoflood datasets (Ouarda and others, 1998; Francés, 2004). The most efficient methods for incorporating imprecise and categorical data are (1) maximum-likelihood estimators (Leese, 1973; Cohn and Stedinger, 1987), (2) Expected Moments Algorithm (EMA; Cohn and others, 1997; England and others, 2003b), and (3) Bayesian methods (Kuczera, 1999; O’Connell and others, 2002; O’Connell, 2005; Reis and Stedinger, 2005). Examples of these techniques in flood-frequency analysis using both gaged and paleoflood records include O’Connor and others (1994), Bureau of Reclamation (2002), Hosman and others (2003), Levish and others (2003), England and others (2003a), Thorndycraft and others (2005a), England and others (2010), and Harden and others (2011). As shown by the two case studies in section, “Examples of Paleoflood Studies,” the addition of paleoflood information improves estimates of low-probability floods, with markedly narrower confidence limits about flood quantile estimates. More discussion of statistical approaches and considerations is provided in sections, “Statistical Approaches for Incorporating Non-Standard Data in Flood Risk Estimation” and “Statistical Issues Related to Use of Paleoflood Information.”
Examples of Paleoflood Studies
Two contrasting case studies show the usefulness of paleoflood studies. The first study was helpful in assessing spillway suitability for a hydroelectric project on the Deschutes River of central Oregon. The second study focused on smaller and steeper stream systems of the western Black Hills, South Dakota. The Black Hills study investigated the frequency of the exceptionally large and lethal flood in 1972 that far exceeded any other flood in the gaged record.
Deschutes River, OregonThe Deschutes River flows north with an average
flow of 125 m3/s, draining 26,860 km2 of central Oregon before entering the Columbia River about 160 km east of Portland, Oregon. Hosman and others (2003) conducted a paleoflood analysis along the river aimed at assessing the existing spillway design capacity for the Pelton-Round Butte hydroelectric project, a set of three hydropower dams and river-regulating structures operated by Portland General Electric and the Confederated Tribes of Warm Springs 160–180 km upstream of the river mouth. The river downstream of the dam complex is mostly alluvial but includes short bedrock reaches. The channel is flanked by alluvial surfaces for most of its length within a narrow valley incised in Tertiary and Quaternary volcanic and sedimentary rocks. Systematic records of peak flows for the Deschutes River are provided by two U.S. Geological Survey (USGS) streamgages downstream of the hydropower operations. Records have been collected at the streamgage near the river mouth since 1898 (fig. 3), and at a streamgage operated just downstream of the dam complex since 1923.
Records from these streamgages were augmented by stratigraphic records of flooding at four sites between the dam complex and the river mouth. As described more completely in Hosman and others (2003), these paleoflood records were interpreted from the alluvial stratigraphy exposed in cutbanks flanking the channel (fig. 4) and flood plain trenches. Chronology was established on the basis of 41 radiocarbon ages among the four sites. Although the records at each of the sites were different, together they provided a flood chronology extending back 5,000 years, including strong evidence for an exceptionally large flood about 4,600 years ago. This flood, labeled the “Outhouse flood” on figures 4 and 5, was 2–3 times as great as the largest historical flood of 1861 (for which discharge also was estimated from the stratigraphic evidence) and the largest measured floods of 1964 and 1996.
Review of Inundation Hazards and Approaches for Geologic Assessment 9
tac14-0961_fig03
Water year
1900 1910 1920 1930 1940 1950 1960 1970 1980 1990
Disc
harg
e, in
cub
ic m
eter
s pe
r sec
ond
0
500
1,000
1,500
2,000
2,500
3,000
3,500
Dec. 1964
Feb. 1996
Gaged flow
Estimatedunregulateddischarge atMoody, Oregon
NO
DATA
80
Paleoflood study site
USGS streamgage
River mile
EXPLANATION
10 20 30 KILOMETERS0
10 20 30 MILES0
10
20
3040
50
60
70
80
90100
Columbia River
Maupin
Madras
River
Des
chut
es
CASC
ADE
RAN
GE
Pelton Dam
ReregulatingDam
Round Butte Dam
OCHOCO M
OUNTAINS
Moody
Axford
Dant
Dant
Caretaker Flat
HarrisIsland
Study areaStudy area
PortlandPortland
Deschutes River BasinDeschutes River Basin
B
A 121°30'
45°30'
45°00'
121°00' 120°30'
Figure 3. Location and annual peak discharge record, U.S. Geological Survey (USGS) streamgage at Deschutes River at Moody, near Biggs (14103000), Oregon (modified from Hosman and others [2003]).
10 Assessing Inundation Hazards to Nuclear Powerplant Sites Using Histories of Riverine Floods, Tsunamis, and Storm Surges
tac14-0961_fig04
Section 1Section 2
Flow 0 50 METERS
0 50 100 FEETN
Railroad ballast, colluvium, and bedrockRailroad ballast, colluvium, and bedrock
Low surface
Intermediate su
rface
High surface Older deposits
Section 3(pit)
1996 lower contact
1861(?)
Section 11861 (?)
Section 2 3.8 meters
Section 3 (pit)
Elevation,in meters
above sea level
312
311
310
309
308
307
306
305
3,000
2,500
2,000
1,500
1,000
500
Surveyed water surface
Discharge,in cubic metersper second
Outhouse flood
Eolian depositsand colluvium
186
1(?)
floo
d
1875–1630
1305–1155
2030–18702310–20102750–24702060–18803310–3000
1330–12602320–2030
290–5
Maximum February 1996 stage
1
2
3 (pit)
A
C
B
csi
vf m vcsand
19961964(?)
csi
vf m vcsand
csi
vf m vcsand
Radiocarbon sample and calibrated age, in calendar years Before Present
Contact between flood deposits,continuous where traceable between sections
c Claysi Siltvf Very fine sandm Medium sandvc Very coarse sand
EXPLANATION
290–5
Figure 4. Setting and stratigraphy of the paleoflood site at Deschutes River near Dant, Oregon. Details of stratigraphy, radiocarbon dating, and hydraulic modeling are given in Hosman and others (2003). (A) Geomorphic setting. (B) Schematic representation of stratigraphy and radiocarbon ages of sequence of flood deposits exposed and excavated at this site. Section 1 records five distinct flood deposits, all likely from historical floods dating to 1861; section 2, which is higher in elevation than section 1, records deposits of eight floods pre-dating the 1861 flood in a record likely extending back more than 2,000 years. Discharge-elevation relation is obtained from hydraulic modeling. (C) Photograph showing riverbank exposure from which sections 1 and 2 were described. Photographs taken by J.E. O’Connor, U.S. Geological Survey.
Review of Inundation Hazards and Approaches for Geologic Assessment 11
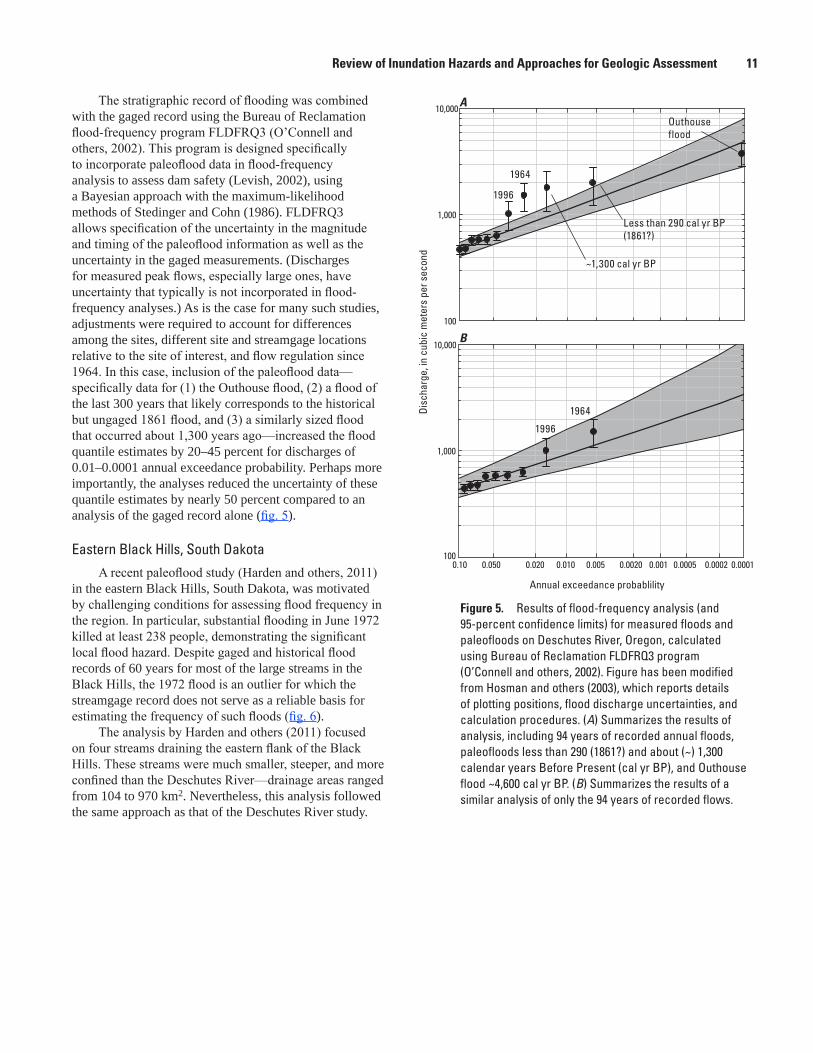
The stratigraphic record of flooding was combined with the gaged record using the Bureau of Reclamation flood-frequency program FLDFRQ3 (O’Connell and others, 2002). This program is designed specifically to incorporate paleoflood data in flood-frequency analysis to assess dam safety (Levish, 2002), using a Bayesian approach with the maximum-likelihood methods of Stedinger and Cohn (1986). FLDFRQ3 allows specification of the uncertainty in the magnitude and timing of the paleoflood information as well as the uncertainty in the gaged measurements. (Discharges for measured peak flows, especially large ones, have uncertainty that typically is not incorporated in flood-frequency analyses.) As is the case for many such studies, adjustments were required to account for differences among the sites, different site and streamgage locations relative to the site of interest, and flow regulation since 1964. In this case, inclusion of the paleoflood data—specifically data for (1) the Outhouse flood, (2) a flood of the last 300 years that likely corresponds to the historical but ungaged 1861 flood, and (3) a similarly sized flood that occurred about 1,300 years ago—increased the flood quantile estimates by 20–45 percent for discharges of 0.01–0.0001 annual exceedance probability. Perhaps more importantly, the analyses reduced the uncertainty of these quantile estimates by nearly 50 percent compared to an analysis of the gaged record alone (fig. 5).
Eastern Black Hills, South DakotaA recent paleoflood study (Harden and others, 2011)
in the eastern Black Hills, South Dakota, was motivated by challenging conditions for assessing flood frequency in the region. In particular, substantial flooding in June 1972 killed at least 238 people, demonstrating the significant local flood hazard. Despite gaged and historical flood records of 60 years for most of the large streams in the Black Hills, the 1972 flood is an outlier for which the streamgage record does not serve as a reliable basis for estimating the frequency of such floods (fig. 6).
The analysis by Harden and others (2011) focused on four streams draining the eastern flank of the Black Hills. These streams were much smaller, steeper, and more confined than the Deschutes River—drainage areas ranged from 104 to 970 km2. Nevertheless, this analysis followed the same approach as that of the Deschutes River study.
Figure 5. Results of flood-frequency analysis (and 95-percent confidence limits) for measured floods and paleofloods on Deschutes River, Oregon, calculated using Bureau of Reclamation FLDFRQ3 program (O’Connell and others, 2002). Figure has been modified from Hosman and others (2003), which reports details of plotting positions, flood discharge uncertainties, and calculation procedures. (A) Summarizes the results of analysis, including 94 years of recorded annual floods, paleofloods less than 290 (1861?) and about (~) 1,300 calendar years Before Present (cal yr BP), and Outhouse flood ~4,600 cal yr BP. (B) Summarizes the results of a similar analysis of only the 94 years of recorded flows.
12 Assessing Inundation Hazards to Nuclear Powerplant Sites Using Histories of Riverine Floods, Tsunamis, and Storm Surges
tac14-0961_fig06
Water year
1950 1960 1970 1980 1990 2000 2010
Annu
al p
eak
disc
harg
e, in
cub
ic m
eter
s pe
r sec
ond
0
200
400
600
800
1,000
Figure 6. Annual peak discharge at U.S. Geological Survey streamgage Rapid Creek above Canyon Lake near Rapid City, South Dakota (06412500). June 9, 1972 peak of 884 cubic meters per second (31,200 cubic feet per second) is a significant outlier for which recurrence is difficult to judge from measured flow records.
Multiple paleoflood sites were analyzed for each stream. In this instance, determining suitable sites was aided by tracing the effects and deposits of the 1972 flood. Stratigraphic records of long duration, commonly extending back 2,000 years or more, were preserved in the numerous caves and alcoves formed in the Paleozoic carbonate rocks flanking many of the canyon reaches.
The stratigraphic record, supported by 99 radiocarbon and 11 OSL age determinations, indicates a minimum of 29 paleofloods during the last 2,000 years (Harden and others, 2011). For some reaches, some of these floods were larger than the 1972 flood, as indicated by deposit elevation, thickness, and grain size. For each of six separate study reaches on the four drainages (study reach locations shown in Harden and others [2011]), this paleoflood information, including
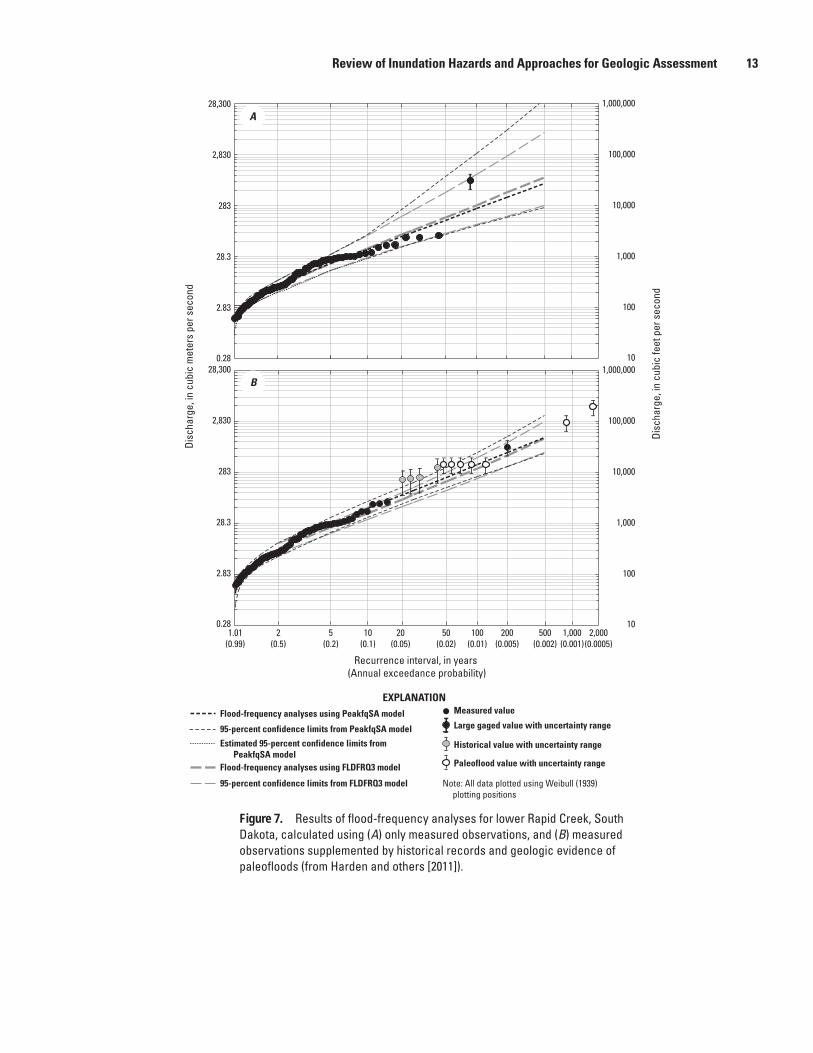
bounds on peak discharge and timing, were analyzed with flood frequency models FLDFRQ3 (O’Connell and others, 2002) and PeakfqSA (Cohn and others, 1997, 2001; Griffis and others, 2004). Both models efficiently incorporate paleoflood and historical information. For four of the six study reaches, incorporating the paleoflood information increased flood quantile estimates for peak discharges of annual exceedance probabilities between 0.01 and 0.002. In all cases, however, uncertainties were reduced substantially; for instance, the 95-percent confidence interval about the 0.01 annual exceedance probability flow was reduced by 78–99 percent for the six study reaches. In all reaches, the paleoflood analysis indicates that the 1972 peak flow had an annual exceedance probability ranging from about 0.01 to 0.002 (fig. 7).
Review of Inundation Hazards and Approaches for Geologic Assessment 13
tac14-0961_fig07
Recurrence interval, in years (Annual exceedance probability)
1,000(0.001)
200(0.005)
100(0.01)
20(0.05)
10(0.1)
5(0.2)
2(0.5)
1.01(0.99)
50(0.02)
500(0.002)
2,000(0.0005)
Disc
harg
e, in
cub
ic m
eter
s pe
r sec
ond
10
100
1,000
10,000
100,000
1,000,000
Disc
harg
e, in
cub
ic fe
et p
er s
econ
d
10
100
1,000
10,000
100,000
1,000,000
A
B
EXPLANATION
Large gaged value with uncertainty range
Historical value with uncertainty range
Paleoflood value with uncertainty range
Flood-frequency analyses using PeakfqSA model
95-percent confidence limits from PeakfqSA model
Estimated 95-percent confidence limits fromPeakfqSA model
Flood-frequency analyses using FLDFRQ3 model
95-percent confidence limits from FLDFRQ3 model Note: All data plotted using Weibull (1939) plotting positions
Measured value
0.28
2.83
28.3
283
2,830
28,3000.28
2.83
28.3
283
2,830
28,300
Figure 7. Results of flood-frequency analyses for lower Rapid Creek, South Dakota, calculated using (A) only measured observations, and (B) measured observations supplemented by historical records and geologic evidence of paleofloods (from Harden and others [2011]).
14 Assessing Inundation Hazards to Nuclear Powerplant Sites Using Histories of Riverine Floods, Tsunamis, and Storm Surges
Statistical Approaches for Incorporating Non-Standard Data in Flood Risk Estimation
Paleoflood analyses have gained credibility in the engineering community because of advances in statistical techniques for taking advantage of non-standard observations of flood magnitude and timing. Non-standard data are those not typically part of gaged or systematic records, including isolated historical observations, interval data (estimates of flood peaks within specified ranges of magnitude and time), paleoflood records, and inferences and observations of discharges that have not occurred over specific time intervals (sometimes called paleohydrologic bounds). Analysis approaches evolved from using maximum-likelihood estimators in conjunction with historical and paleoflood data (Stedinger and Cohn, 1986; Stedinger and Baker, 1987; Cohn and others, 1997). Since their origins, the likelihood functions of Stedinger and Cohn (1986) have been incorporated in a Bayesian approach explicitly accounting for paleohydrologic bounds as well as measurement uncertainties (O’Connell and others, 2002). This approach is the basis of FLDFRQ3, a Bureau of Reclamation flood-frequency analysis program commonly used in Bureau of Reclamation dam safety assessments (Swain and others, 2004).
An alternative to maximum-likelihood estimators for incorporating non-standard data in a flood-frequency analysis is the Expected Moments Algorithm (EMA) (Cohn and others, 1997). This approach is nearly as efficient as maximum-likelihood estimation but more widely applicable, including any distribution type amenable to method-of-moments parameter estimation (Cohn and others, 1997). Additionally, EMA is mathematically tractable and the variance of the estimator can be derived in closed form (Cohn and others, 2001), enabling computation of accurate confidence intervals on quantile estimates. The EMA is now implemented in the USGS program, PeakFQ (Veilleux and others, 2014), which enables incorporation of paleo- and historical data, including interval data and paleohydrologic bounds, in flood-frequency analysis.
For all these approaches, incorporating information on paleohydrologic bounds—flood magnitudes not exceeded—has significantly improved quantile estimates of rare floods. Although the lack of flood evidence is not always unequivocal evidence of the absence of flooding, identifying such bounds can greatly constrain the right-hand tail of the flood distribution. Until the last few decades, however, it was not clear how to incorporate such information in a flood-frequency study.
These types of analyses improve flood-frequency estimates because they incorporate more and different types of information, typically encompassing much longer time periods than typical gaged records. Additionally, paleoflood records preferentially provide information on the largest floods, precisely the information necessary to constrain the
tail of the frequency distribution, no matter what distribution is selected. This benefit can be quantified in terms of the equivalent information gain with respect to a record of annual peak flows (fig. 8). For example, a typical paleoflood record of 1,000 years (which is common), with evidence of only a single flood, provides the equivalent gain of 170–200 years of annual peak flows in estimating the flood discharge associated with the annual exceedance probabilities ranging between 0.01 and 10-6. This represents a gain of 0.17–0.2 for each year of length for the paleoflood record. A 1,000-year record containing evidence of 10 floods (which also is common) provides the equivalent of 500 years of annual flow peaks in estimating the 0.01 flood quantile—a gain of 0.5. Considering the rarity and expense of long-duration annual records, paleoflood studies can be a highly efficient means of improving flood-frequency estimates, particularly of rare flows. Use of these approaches requires care, however. Results are sensitive to the values of the measured peaks and the assigned values of the paleohydrologic bounds (O’Connell and others, 2002). Consequently, defining and characterizing perception thresholds have been emphasized increasingly in recent paleoflood studies (for example, Harden and others, 2011).
Statistical Issues Related to Use of Paleoflood Information
The validity of the statistical methods described here depends on important assumptions about the nature of flood processes. Each sample is assumed to contain independent and identically distributed data. The sampled population of floods, which may go back thousands of years, also is assumed to be the same as or similar to the population of future events to be characterized. In recent years “nonstationarity” has become a prominent issue, recognizing the possibility that future populations of events such as floods will differ markedly from the past populations (Milly and others, 2008). Specifically, if flood-generating processes are substantially different in the future, records of past floods may characterize a population that no longer is relevant. Nonstationarity is a well-established issue in urbanized watersheds where the transition from rural to urban land use can double the magnitude of annual flood peaks (Villarini and others, 2009). However, other types of nonstationarity, such as that related to climate change, are less understood (Milly and others, 2008).
Even when long paleoflood records are available— 1,000 years or more—the uncertainty in estimates of the magnitudes of extreme quantiles still can be large. For the best of circumstances, confidence intervals for flood-quantile estimates corresponding to rare events—those not likely to have occurred during the extended period of record—tend to be wide. Additionally, residual and difficult-to-quantify risk is associated with exceptionally rare events not even seen in paleoflood records of long duration.
Review of Inundation Hazards and Approaches for Geologic Assessment 15
tac14-0961_fig08
Estimating the 0.01 annual exceedance probability flow(”100-year” flood)
Estimate of the 0.000001 annual exceedance probability flow(”million-year” flood)
0.001
0.0001
0.00001
Number of paleofloods in 1,000-year stratigraphic record
1 2 5 10 20 50 100 200 500 1,000100
200
500
1,000
Equi
vale
nt g
ain
in s
tream
gage
reco
rd le
ngth
A typical paleoflood study may contain a stratigraphic record of 1–10 floods in a 1,000-year period
Figure 8. Gain in flood-frequency information from a paleoflood stratigraphic record of 1,000 years, as measured in years of annual peak flow records (record length) for specific flood quantiles (ranging from 0.01 to 10-6 annual exceedance probability) and as a function of the number of events recorded by stratigraphy. The shaded box bounds the common range of scenarios in which 1,000-year stratigraphic records contain information on 1–10 paleofloods.
Summary Points and Special Considerations—Riverine Floods
Geologic records of riverine flooding can substantially extend knowledge of peak flows beyond historical records or observations. Similarly, such records can provide site-specific information at sites lacking direct observations. The longest records typically are obtained from stratigraphic records of sedimentary slackwater deposits left by large floods at sites of persistent sediment accumulation. Such records can extend back several thousand years in protected environments. Shorter but sometimes more precise records can be inferred from dendrochronological evidence where trees or long-lived shrubs have been affected by floods. Erosional trim lines and coarse-grained deposits also can provide evidence of maximum floods of the last several thousand years. In many locations, stratigraphic records of floods can lead to inferences of flood timing and magnitude on the basis of standard techniques of stratigraphic interpretation, geochronology, and hydraulic modeling. These inferences are most secure in confined channel systems, such as narrow bedrock-bound valleys, where substantial channel change is unlikely over the time periods represented by the stratigraphic record. Nevertheless, successful paleoflood studies have been accomplished in a wide variety of physiographic settings.
Key to translating riverine paleoflood records to meaningful planning and policy implementation is the ability to derive better flood-frequency and magnitude estimates. New approaches, such as those incorporated in FLDFRQ3 (O’Connell and others, 2002) and PeakfqSA (Cohn and others, 1997, 2001; Griffis and others, 2004), efficiently incorporate paleoflood and historical data and observations, providing more confident estimates of rare floods with annual exceedance probabilities of 0.01 to 10-6, depending on the length of the geologic record and the abundance and character of flood evidence.
As for the application of all geologic techniques, results regarding event likelihoods indicate conditions during the period encompassed by the geologic record. For example, episodes of more frequent large floods in the Black Hills possibly reflect specific climate or land-cover characteristics distinct from the present (Harden and others, 2011). Some of these conditions may not be applicable at present or for the future. Therefore, calculated likelihoods of floods derived from paleoflood records may not be totally appropriate for assessing future conditions. Nevertheless, geologic evidence provides valuable insight into the magnitude and frequency of past events, which, however used, can provide information on likely future scenarios or events.
Tsunamis
Millions of people viewed tsunamis for the first time in video footage from Indonesia and Thailand on December 26, 2004, and from northeast Japan on March 11, 2011. What they saw looked nothing like Hokusai’s “Great wave off Kanagawa,” the towering menace commonly mistaken for a tsunami (Cox, 2001; Cartwright and Nakamura, 2009). Instead, these real tsunamis resembled rivers in flood. The flow velocities in 2004 were 2–5 m/s for water 1–4 m deep in Banda Aceh, Indonesia (Fritz and others, 2006). Velocities in 2011 measured 4–8 m/s about 1 km inland on the Sendai Plain (Goto and others, 2012; Koshimura and Hayashi, 2012), and 11 m/s after passage of a crest 9 m deep in Kesennuma (Fritz and others, 2006; Fritz and others, 2012).
The 2004 and 2011 tsunamis epitomize historically infrequent hazards. The 2004 tsunami at first seemed without precedent on the shores that it devastated. Only later did geologists begin to identify traces of its predecessors (fig. 9), the most recent of which dates to a medieval period between A.D. 1300 and 1450 (Rajendran and others, 2006; Jankaew and others, 2008; Monecke and others, 2008; Malik and others, 2011). The 2011 tsunami in Japan might have been anticipated on the basis of written evidence of an A.D. 869 tsunami that geologists began corroborating about 2 decades ago (Abe and others, 1990; Minoura and others, 2001).
16 Assessing Inundation Hazards to Nuclear Powerplant Sites Using Histories of Riverine Floods, Tsunamis, and Storm Surges
tac14-0961_fig09
A
B Surface of marshy swale,trampled during digging of pit.Shovel handle 0.5 meter long
Sand interpreted as tsunami deposit and dated to 14th or15th century A.D.
Two earlier sand sheets, eachascribed to a tsunami lessthan 2,500–2,800 years old
Peaty marsh soil buried by2004 tsunami deposit
Beach ridge 0.5 km inland frommodern shore. Soil is sandy,
tsunami deposits poorly preserved
Marshy swale covered by freshwater most of the year. Peaty soils
preserve tsunami deposits bybuilding on top of them (B).
Indian Ocean tsunami in 2004crested 10 meters deep in this
area, which is 0.5 kilometer (km) from the ocean.
Figure 9. Evidence of recurrent tsunamis at Phra Thong Island, Thailand. Details are provided in Jankaew and others (2008). (A) Marshy swale with soils covered in layers of periodic tsunami deposits. (B) Pit dug midway across the marshy swale showing tsunami deposit layers. Photographs taken by B.F. Atwater, U.S. Geological Survey, February 2007.
Review of Inundation Hazards and Approaches for Geologic Assessment 17
The present extent of sandy deposits of the A.D. 869 tsunami has been reproduced with a model that uses an earthquake source far smaller than the magnitude-9 earthquake that produced the 2011 disaster (Sawai and others, 2012; Sugawara and others, 2012). However, the inundation in A.D. 869 probably exceeded the inland limit of sandy deposits if, as happened in 2011, sandy deposits greater than 0.5 cm thick extended only one-half to three-quarters of the inundation distance (Abe and others, 2012).
Most tsunamis, including the unusually large events in 2004 and 2011, are caused by sudden slip on an undersea fault. The slip generates an earthquake while also shifting the ocean floor. At a subduction zone, where one tectonic plate overrides another on a thrust fault, the sudden slip produces an upwarp over the fault-rupture area and a downwarp over deeper parts of the fault (Plafker, 1969; Plafker and Savage, 1970). The paired upwarp and downwarp displaces the ocean bottom, producing an initial tsunami waveform. Crest-to-trough, the initial 2004 wave was only meters high, but with an enormous length—100 km or more (Geist and others, 2007). The wavelength decreases as the tsunami’s leading edge shoals and consequently slows. However, the remaining wavelength—and a huge volume of water—following the leading edge can yield the relentlessly waxing flows that entrained entire Japanese neighborhoods in 2011.
Unusually large tsunamis like those in 2004 and 2011, can threaten shores far from and near the epicenters of the triggering earthquakes. The 2004 tsunami, although generated on the east side of the Bay of Bengal, caused erosion and sedimentation 1,000 km to the west at Kalpakkam (Srinivasalu and others, 2007), near a pair of operating nuclear-power reactors. The 2004 tsunami also took an estimated 35,000 lives in Sri Lanka, a great distance from its origin. Sandy onshore deposits of a modern far-travelling tsunami were first described well in Japan; in this instance, from the Pacific Ocean tsunami that originated during the giant 1960 Chilean earthquake (Kon’no and others, 1961). Deposits attributable to historical tsunamis originating in the Aleutian Trench recently were recognized in Hawaii (Chague-Goff and others, 2012).
The tsunami hazard typically is greatest, however, on shorelines adjacent to the tsunami source. In such near-field wave settings, damage may begin with the associated earthquake, and the ensuing tsunami may arrive before official warnings and before waves have dissipated. Near-field tsunamis accounted for most tsunami deaths worldwide even before the Japanese fatalities in March 2011 (Yulianto and others, 2010). Near-field tsunamis similarly account for most of the examples of tsunami geology.
The west coast of North America faces a mix of near-field and far-field tsunami hazards (González and others, 2007; Dunbar and Weaver, 2008; Committee on the Review of the Tsunami Warning and Forecast System and Overview of the Nation’s Tsunami Preparedness, 2011). Possible tsunami locations along the Pacific Ocean and source features are described here and shown in figure 10.
1. A subduction zone slants beneath Alaska from Prince William Sound westward to the end of the Aleutian Island chain. Most of this zone broke in a series of great earthquakes in the 20th century (Carver and Plafker, 2008). The largest of these earthquakes, in 1964, set off local tsunamis from delta-front slides as well as a tectonic, oceanwide tsunami that took lives in Oregon and California. Landslides and volcanism at Alaskan volcanoes also cause local tsunamis (Beget and others, 2008)
2. The most recent large tsunami from the Cascadia subduction zone, in January 1700, caused unknown numbers of fatalities among the region’s native peoples (Thrush and Ludwin, 2007). The 1700 tsunami is known from sand sheets in its near-field of Washington, Oregon, and northern California and from written records of far-field waves in Japan (Atwater and others, 2005). Additional tsunamis in the region have resulted from faulting and landsliding at Puget Sound (González, 2003) and from landsliding into the Columbia River valley (Jones and others, 1961).
3. Tsunamis from faults within the Caribbean plate caused loss of life in 1867 (presently the U.S. Virgin Islands) and 1918 (in Puerto Rico) (Reid and Taber, 1919, 1920). The Antilles subduction zone produced a tsunami disaster in the Dominican Republic in 1946 (Dolan and Wald, 1998). A thrust earthquake of magnitude 9 farther east along the Puerto Rico Trench would pose a tsunami threat to the Atlantic seaboard of the United States (Geist and Parsons, 2009). The potential for such a tsunami is being evaluated by means of geodesy and tsunami geology (Atwater and others, 2012b; ten Brink and López-Venegas, 2012).
4. Submarine slides in the Caribbean provide additional tsunami sources (ten Brink and others, 2006).
5. Hawaii’s tsunami history includes far-field waves from the Pacific Rim, notably in 1837, 1946, and 1960 (Shepard and others, 1950; Eaton and others, 1961). Near-field tsunamis from island-margin faulting were observed in 1868 and 1975 (Goff and others, 2006). Larger near-field waves from the Pleistocene (11,700 to about 2.5 million years ago) have been inferred from onshore boulders and linked to submarine landslides involving the island chain (McMurtry and others, 2004).
6. Submarine slides off the Atlantic and Gulf Coasts of the United States also pose tsunami hazards. These are difficult to assess because slides appear to have been inactive during the past 5,000 years or more (ten Brink and others, 2007). The Atlantic Coast of the United States is within range for possible tsunamis from the Puerto Rico Trench (Geist and Parsons, 2009); from the source region of the 1755 Lisbon tsunami, which itself failed to register in Atlantic seaports (Barkan and others, 2009); and possibly from volcano collapse in the Canary Islands (Mader, 2001; Ward and Day, 2001; Abadie and others, 2012).
18 Assessing Inundation Hazards to Nuclear Powerplant Sites Using Histories of Riverine Floods, Tsunamis, and Storm Surges
tac14-0961_fig10
1) Subduction zone earthquakes sent tsunamis to Oregon and California in 1964.
1) Subduction zone earthquakes sent tsunamis to Oregon and California in 1964.
2) The most recent Cascadia subduction zone tsunami occured in A.D. 1700.
2) The most recent Cascadia subduction zone tsunami occured in A.D. 1700.
2) Faulting and landsliding in the Puget Sound and Columbia River cause tsunamis.
2) Faulting and landsliding in the Puget Sound and Columbia River cause tsunamis.
4) Submarine slides in the Caribbean provide additional tsunami sources.
4) Submarine slides in the Caribbean provide additional tsunami sources.
5) Hawaii is subject to near-field tsunamis from block slides and faulting, as well as far-field tsunamis sourced in the Pacific Rim.
5) Hawaii is subject to near-field tsunamis from block slides and faulting, as well as far-field tsunamis sourced in the Pacific Rim.
6) Submarine slides threaten the Atlantic and Gulf Coasts of the United States with tsunamis.
6) Submarine slides threaten the Atlantic and Gulf Coasts of the United States with tsunamis.
6) Far-field tsunamis are possible from the Puerto Rico Trench, the source region of the 1755 Lisbon tsunami, and volcano collapse in the Canary Islands.
6) Far-field tsunamis are possible from the Puerto Rico Trench, the source region of the 1755 Lisbon tsunami, and volcano collapse in the Canary Islands.
3) Faulting along Caribbean Plate can cause tsunamis in the U.S. Virgin Islands, Puerto Rico, and the Dominican Republic.
3) Faulting along Caribbean Plate can cause tsunamis in the U.S. Virgin Islands, Puerto Rico, and the Dominican Republic.
Antilles subduction zoneAntilles subduction zone
0 1,500750 MILES
0 1,500750 KILOMETERS
55°80°105°130°155°
60°
35°
10°
15°
Base map modified from Environmental Systems Research Institute (ESRI), Inc. data, 30- to 90-meter resolution. Plate boundary mapping modified from ESRI digital data; mapping is coarse resolution and not suitable for seismic analysis. WGS 1984 Web Mercator Auxilary Sphere.
Subduction zone boundary
Other plate boundary
EXPLANATION
Numbers correspond to text in the report section, "Tsunami.”
Figure 10. Possible tsunami locations and source features relevant to North America. Numbered explanations correspond to descriptions in section, “Tsunamis.”
Review of Inundation Hazards and Approaches for Geologic Assessment 19
Tsunami GeologyStratigraphy and geomorphology provide the main
strategies for extending tsunami history thousands of years into the past, much as they do for riverine flooding and storm surge. A tsunami writes its own history, most commonly by laying down a sedimentary deposit, less widely by means of erosion. This report refers to any of this tsunami evidence as “tsunami geology,” and in a parallel way it uses “earthquake geology” as a term for what is also referred to as “paleoseismology.” Many of the approaches to stratigraphy, depositional environments, and dating are akin to those for extending flood histories.
Identifying a tsunami requires accessible settings where tsunami evidence can form and endure. Additionally, it is important that competing explanations be convincingly discounted, or at least that the geologic evidence resemble the traces of modern tsunamis elsewhere. Over time, biological, sedimentary, and hydrologic processes destroy tsunami traces, and, especially in storm-prone areas, it may be difficult to distinguish tsunami-generated deposits from those formed by other processes, especially storm waves and storm surges.
Publications on tsunami geology number in the hundreds, nearly all since about the mid-1980s (Bourgeois, 2009). The tsunamis inferred from these studies extend more than 1 billion years into the past, but are overwhelmingly from the past 5,000 years. Most are evidenced by sandy sediments deposited in tidal marshes or beach-ridge plains, or on the bottoms of coastal lakes. The inferences increasingly are anchored in the documented geologic evidence left by tsunamis from the past two decades, including the 2004 Indonesian (Lavigne and others, 2009; Paris and others, 2010) and 2011 Japanese tsunamis (Goto and others, 2012).
These modern tsunamis have helped guide interpretation of tsunami deposits, but geologic inferences about tsunami recurrence still require finding the right spot with all the elements for forming and preserving an interpretable record—tsunami “needles” in geologic haystacks. Depositional evidence of past tsunamis varies depending on the sediments in the path of the tsunami, the vegetation the tsunami enters, the eventual burial of tsunami deposits by other sediments or soil, and the mixing of those deposits by plants and burrowing animals. Areas of tsunami evidence also may be subject to overwash by storms, and the tsunami may have occurred in a landscape much different from the landscape today.
Distinguishing Between Tsunami and Storm DepositsMany shores subject to tsunamis are also subject to
storms, and the geologic traces of tsunamis and storms may resemble each other. Places where this ambiguity has been examined include New Zealand (Goff and others, 2004), Australia (Switzer and Burston, 2010), Spain (Lario and others, 2010), the Netherlands Antilles (Morton and others, 2006; Engel and others, 2012), Mexico (Ramirez Herrera and others, 2012), and the British Virgin Islands (Atwater and others, 2012a).
Coastal boulders, evidently moved by waves, may signify tsunamis or storms. In Hawaii, boulders atop historical lava flows can be assigned in some cases to the tsunamis of 1868 and 1975, and in other cases, to recent storms (Richmond and others, 2011). In Ireland, an absence of tsunamis in recent centuries leaves only storms to account for boulders that have moved across 19th-century walls (Cox and others, 2012). In Japan, an 18th-century tsunami moved coral-reef blocks farther landward than did subsequent storms (Goto and others, 2010). In the British Virgin Islands, models of flow velocities at inland boulder fields led to discounting the possibility of transport by storms and supported tsunami transport (Buckley and others, 2012). Progress has been reported in computing the forces needed to lift the boulders to the tops of seacliffs, and in relating repetitive storm waves to shore-parallel ridges of shingled boulders (Weiss, 2012).
The geologic distinction between tsunami and storm can be difficult in coastal plain settings where storms have built washover fans by breaching or crossing over sandy coastal ridges. Such storm effects are common on the Atlantic and Gulf Coasts of the United States, where tropical cyclone activity is common (see section, “Storm surges”) in the paths of hurricanes or northeasters (Tuttle and others, 2004; Morton and others, 2007; Morton and Barras, 2011). In these passive margin environments, far from convergent tectonic plate boundaries, thick sand units extending to a limited inland extent can be attributed to beach overwash or barrier breaching during storms, although such sand units might instead be attributed to a tsunami of distant origin or a tsunami from a submarine landslide nearby (Morton and others, 2007; Switzer and Jones, 2008). By contrast, near the equator, large storms are not common in most of the areas overrun by the 2004 Indian Ocean tsunami. This contextual clue, applied to pre-2004 sand sheets that extend many hundreds of meters inland, helped eliminate catastrophic storms as explanations for such sand sheets in Sumatra and southwestern Thailand (Jankaew and others, 2008; Monecke and others, 2008).
Geologic context provides a simple means of distinguishing between tsunami and storm in estuarine deposits along the Pacific Coast at the Cascadia subduction zone (Atwater and others, 1995); (Atwater and Hemphill-Haley, 1997). Great Cascadia earthquakes are evidenced most clearly by buried marsh and forest soils that are abruptly overlain by tidal-flat mud—the same sequence produced near Anchorage by abrupt tectonic subsidence that accompanied the 1964 Alaska earthquake (Ovenshine and others, 1976; Atwater and others, 2001). At many Cascadia bays and river mouths, the buried soils are coated locally with sand that tapers landward, contains marine fossils, and is coarser grained than the tidal-flat deposits (fig. 11). Such sand provides evidence for landward-directed flows of salt water that shortly followed coseismic subsidence. Such near-coincidence with land-level change is expected of a near-field tsunami, but not of a storm. The tsunami-storm ambiguity persists, however, in a Cascadia flood plain that lacks evidence for coseismic subsidence (Witter and others, 2001).
20 Assessing Inundation Hazards to Nuclear Powerplant Sites Using Histories of Riverine Floods, Tsunamis, and Storm Surges
tac14-0961_fig11
Detail in B
Scale: 20 centimetersScale: 20 centimeters
Sand sheet of 1700 Cascadiatsunami notched by currents and
wind waves that pluck the sandgrains at high tide
Tidal marsh near high-tide level
Forested upland
Soft mud, oxidizing alongmodern roots. Fossils in themud show that it accumulateslower in the intertidal zonethan did the buried peaty soilthat underlies the anomaloussand layers. The differenceshows that the soil subsidedat or about the time when the anomalous sand layers were deposited. Such coincidence with subsidence can be expected of a near-field tsunami, but not of a storm.
Anomalous sand layers (dark)each ascribed to a wave in the tsunami wave train of January1700
Buried tidal-marsh soil
A
B
Figure 11. Simple contextual way of distinguishing between tsunami deposits and storm deposits, as indicated by evidence of the January 1700 Cascadia tsunami at Willapa Bay, Washington. (Oyster locality of Atwater and Hemphill-Haley [1997]. Photographs taken by B.F. Atwater, U.S. Geological Survey.)
Review of Inundation Hazards and Approaches for Geologic Assessment 21
Prospects for Confirming that Submarine Slides Produced Atlantic Coast Tsunamis
Submarine landslides trigger tsunamis (Geist and Parsons, 2009). Such slides have formed along the continental margin, and may be a near-field source of tsunamis along the Atlantic seaboard of the United States. A historical example is Newfoundland’s 1929 tsunami, which was generated offshore by earthquake-induced slides (Tuttle and others, 2004; Moore and others, 2007). Sea-level rise since the last glaciation adds to the challenge of using tsunami geology along the Atlantic seaboard to estimate the tsunami hazard from submarine slides, especially because submarine slides here consistently date to glacial or early post-glacial periods (Lee, 2009), when sea levels were much lower and tsunami-affected shorelines are now deep under water.
An example of the challenge would be a search for coastal tsunami deposits along the outer continental shelf and upper slope in hopes of learning whether the Currituck slide produced a large tsunami. This exceptionally large slide involved a volume of 165 km3 and traveled about 180 km (Locat and others, 2009) from its source on the continental slope offshore of Virginia. It possibly caused a large near-field tsunami (Geist and others, 2009). However, the slide happened between about 25,000 and 50,000 years BP (Prior and others, 1986), when global sea level fluctuated between 50 and 13 m lower than the present sea level. If the slide produced a tsunami that overran coastal lowlands, the traces of those former lowlands now would lie tens of meters below present sea level, and they probably must be searched for on the continental shelf.
Deposits of the Storegga tsunami on shores of the North Sea seemingly indicate the potential for finding onshore evidence of tsunamis from periods of low sea level. These deposits date from about 8,000 to 8,500 years ago, when sea level on most shores was a few tens of meters lower than it is today. The deposits have been extensively documented in Great Britain (Dawson and others, 1988; Smith and others, 2004) and in Norway (Bondevik and others, 1997; Bondevik and others, 2003; Bondevik and others, 2005a, 2005b), where post-glacial uplift has kept the deposits above sea level. Areas of post-glacial uplift along the northeastern Atlantic Coast may offer similar opportunities for finding older deposits.
Geologic Estimates of Tsunami Frequency and Size
Clues From Earthquake GeologyParadoxically, the most common geologic approach
to quantifying tsunami hazards makes little use of tsunami geology. It relies instead on earthquake geology to help geophysicists estimate the parameters of vertical coseismic
displacement that tsunami modelers use as the initial condition of a tsunami. This contrasts with the situation for riverine floods where sedimentary deposits have long served as guides to flow stage and discharge. This approach focusing on rupture likelihood risks discounting or missing other earthquake-related processes, such as coseismic landslides, that also may generate tsunamis.
A hybrid of geology, geophysics, and hydrodynamics has been providing tsunami-inundation maps at the Cascadia subduction zone since the late 1990s. It is represented today by the third generation of tsunami-inundation maps in Oregon (Priest and others, 2010). These maps are based partly on a 10,000-year history of submarine mass movements that have been interpreted as proxy records of earthquake shaking (Goldfinger and others, 2012). Although the inferred earthquake history is debatable in its estimates of earthquake magnitude and recurrence (Atwater and Griggs, 2012; Atwater and others, 2014), it provides a convenient basis for deducing tsunami frequency and sizes, and tsunami geology has provided a test for models of tsunami inundation at Cascadia (Peterson and others, 2008, 2011; González and others, 2009; Witter and others, 2012a; Witter and others, 2013).
Earthquake geology also underpins the only tsunami-hazard assessment that covers all United States shores (Dunbar and Weaver, 2008). This preliminary assessment places tsunami history on a suitably long timescale by using national seismic hazard maps (Petersen and others, 2008, 2014) as guides to tsunami potential. The national seismic maps, which are updated every 6 years, have long used of geology of the past 10,000 years or more to provide estimates of earthquake size and earthquake recurrence (Petersen and others, 2008, 2014). The underlying assessments do not profess to be comprehensive: “The understanding of possible tsunami sources is clearly incomplete, as is the severity of tsunamis expected from underwater landslides or island sector collapse” (Dunbar and Weaver, 2008, p. 4–7). A more complete national assessment of tsunami risk is among the primary recommendations from a review of United States tsunami programs (Committee on the Review of the Tsunami Warning and Forecast System and Overview of the Nation’s Tsunami Preparedness, 2011).
Interplay of Earthquake and Tsunami GeologyConversely, tsunami geology can aid in identifying
and defining earthquake hazards, as indicated at Cascadia, Hokkaido, and Kamchatka. This is an important attribute of geologic investigations—they commonly reveal unknown hazards.
Tsunami geology in the 1980s helped identify the Cascadia subduction zone as a source of great earthquakes (Thompson, 2011). Today, tsunami geology provides some of Cascadia’s longest onshore records of repeated earthquakes,
22 Assessing Inundation Hazards to Nuclear Powerplant Sites Using Histories of Riverine Floods, Tsunamis, and Storm Surges
including a 4,500-year sequence of sand sheets beneath Bradley Lake, Oregon, set behind coastal sand dunes (Kelsey and others, 2005). Allowing for changes in dune height and width, the tsunami history of this lake is providing constraints on deep-sea estimates of earthquake magnitudes and rates (Witter and others, 2012b).
Since the early 2000s, tsunami geology in Japan began providing evidence that subduction of the Pacific plate beneath Hokkaido produces earthquakes larger than those in the written history of that island. The evidence consists of sand sheets that extend a few kilometers inland on coastal plains where historical tsunamis, generated during nearby earthquakes of magnitude 8, left hardly any geologic traces (Nanayama and others, 2003). Today, sand sheets provide a proxy history of great Hokkaido earthquakes of the past 5,500 years (Sawai and others, 2009).
The subduction slip that generated the 1952 earthquake on the eastern coast of Russia’s Kamchatka Peninsula, the third-largest earthquake worldwide in the 20th century, also generated a Pacific Ocean tsunami that was documented minimally in its near field. Geologic field work 5 decades later uncovered 1952 tsunami deposits on plains and hillsides. The inland limits of these deposits, interpreted as closely approximating inland limits of tsunami inundation, were used in tsunami simulations to compute the distribution of seismic slip in the estimated fault-rupture area (MacInnes and others, 2010).
Hydrodynamic Reconstructions From Tsunami GeologyUsing sandy tsunami deposits to estimate flow depths and
velocities is a frontier area in tsunami geology (Huntington and others, 2007). Recent tsunamis have afforded model development and calibration studies of onshore flow, sediment transport, and vertical and lateral trends in grain size. Tsunamis studied include the 1929 Grand Banks (Soulsby and others, 2007), 1998 Papua New Guinea (Jaffe and Gelfenbaum, 2007), 2004 Indian Ocean (Apotsos and others, 2011a), 2006 Java (Spiske and others, 2010; Moore and others, 2011), 2009 Samoa (Apotsos and others, 2011b), and 2011 Tohoku (Jaffe and others, 2012).
Summary Points and Special Considerations—Tsunamis
Tsunamis pose hazards to most coastlines of the United States. The magnitude of the hazard imposed by sometimes huge and far travelled surges of ocean water varies depending on the location and type of source mechanisms, which chiefly are earthquakes and landslides. Great subduction zone earthquakes historically and prehistorically have affected Alaska, Hawaii, and western United States coastlines. The Atlantic seaboard is within range of tsunamis generated from great earthquakes in the Caribbean. All coastlines could be
affected by large submarine landslides, but these events are even rarer than great earthquakes.
As for river flooding, stratigraphic studies can support inferences of the magnitude and frequency of tsunamis. Some records along the west coast of the United States and globally are as old as 5,000 years. The well-studied deposits of the 2004 Indonesian and 2011 Japanese tsunamis have provided strong modern analogies. The primary challenges in developing these records are finding sites recording multiple deposits and clearly distinguishing tsunami deposits from other types of coastal inundation such as storm surges.
Knowledge of tsunami frequency comes from understanding source mechanisms such as earthquakes and landslides, as well as from geologic records of tsunamis themselves. Together, these approaches have been important in identifying the types of hazards possibly affecting a specific location and the magnitude and frequency of such hazards.
Storm Surges
Storm surges refer to episodes of elevated wave and water levels caused by storm conditions such as wind and low pressure. They are associated mostly with tropical and extratropical storms. The Atlantic, Gulf of Mexico, and Pacific coastlines of the United States all experience storm surges. Storm surges are most frequent, however, along the Middle Atlantic and Gulf Coast States, in the path of summer cyclones moving north and west from their origins in the tropical Atlantic Ocean.
The physics and controls on storm-surge development are fairly well known. Prevailing winds and associated ocean currents (as well as pressure gradients, waves, and tides) increase water levels along the coastal zone, causing storm surges. The duration and intensity of storm surges are governed by various factors related to the storm, including the duration of the storm, atmospheric pressure, wind speed and direction, angle of storm approach, direct landfall location, and astronomical tidal range.
The effects of storm surges are well documented from recent storms where imagery, high-resolution Global Positioning System and elevation data, sediment cores, and other information allow assessment of changes before, during, and after storm events. In addition to the surge of water into supratidal regions, other hazards and consequences from storm surges include:
• enhanced wave impact and erosion,
• shoreline erosion and displacement,
• cross-shore sediment transport,
• salt-water intrusion, and
• shifts in estuarine and bay salinity regimes.
Review of Inundation Hazards and Approaches for Geologic Assessment 23
As for riverine flooding and tsunamis, prehistoric storm surges can be studied using geologic records. Such records rely on the growing understanding of sediment transport and erosional processes during storm surges on coastal margins, as well as ecological and water chemistry changes from salinity shifts. Most of this knowledge is collected from analysis of recent storms. As with the section “Tsunamis,” many geologic techniques are similar to those for deciphering chronologies of river flooding, so the emphasis in this section is on conditions and approaches specific to storm-surge inundation.
General Approaches and Techniques for Assessing Storm Frequency
During the mid-20th century, studies of paleostorms involved identifying and assessing the importance of washover sedimentation (fig. 12) on barrier island evolution (Ingram, 1968) and atolls (McKee, 1959; Ingram, 1968; Baines and McLean, 1976; Davis and others, 1989). More recently, paleostorm research, commonly referred to as “paleotempestology” has greatly increased (Liu and Fearn, 1993; Liu and Fearn, 2000; Donnelly and others, 2001; Donnelly and others, 2004; Liu, 2004; Donnelly, 2005; Cheung and others, 2007; Woodruff and others, 2008; McCloskey and Liu, 2012). In this discussion, paleotempestology is the study of prehistoric coastal (extra)tropical cyclones, their frequency, and their spatial distribution and effects, as well as linkages to climate change (Nott, 2004).
Geologic Proxies for Storm SurgesLike riverine floods and tsunami deposits, storm deposits
are distinguished by contrasting sedimentary characteristics relative to those left by other depositional processes (fig. 13). Distinctive lithologic attributes typically include grain size, sand or mud content, organic matter content, and shell material content. Additionally, storm-surge deposits commonly contain biological remains transported from offshore. Most studies investigate such records by coring into appropriate depositional environments. Sedimentary contrasts generally are most evident and best preserved in protected coastal settings, where the relatively constant accumulation of fine-grained (sand and finer) sediment and (or) autochthonous organic matter during periods of stable or slowly rising sea level may be interrupted by inorganic sediment layers (commonly sandy), transported and deposited by energetic flow during storm surges. Such lithological changes commonly are detectable in the visible stratigraphy, but sometimes are subtle and are identified more clearly by changes in organic content, geochemistry, and the bulk sediment density.
A well-known paleotempestology study as was done by Liu and Fearn (1993) along the Gulf of Mexico coastline.
They used sedimentology to identify paleostorms and to assess the frequency of major (category 4 and 5) storms. The stratigraphic record of Lake Shelby, Alabama, contained numerous clastic sediment layers of low organic-material content within a matrix of organic-rich lake sediment and estuarine clay. These clastic layers were interpreted as storm deposits, leading Liu and Fearn (1993) to conclude that there had been an increase in the frequency of catastrophic hurricanes between 1,000 and 3,300 years ago, with an average recurrence interval of about 600 years.
Otvos (2002) noted, however, that non-storm related processes such as inlet evolution, eolian transport, and moderate winter storms also can result in lithologic changes in core sediment similar to changes expected from storms. Such complications hinder interpretation of geologic records, particular if the geomorphic context is not fully known. Given these complications, more quantitative sedimentologic measurements (for example, detailed grain size analysis; Woodruff and others 2008; Wallace and Anderson, 2010; Lane and others, 2011) are commonly used to complement the basic physical parameters presented by Liu and Fearn (1993). Confidence in results increases, consequently, when numerous and complementary geologic proxies support storm-surge inferences.
In addition to estimating frequency, storm-surge deposits also have been used to estimate the magnitude of prehistoric storms for barrier coastal systems (Woodruff and others 2008; Wallace and Anderson, 2010). These efforts originated from work on the Grand Banks tsunami sand sheets, where the texture of sand layers was related to the distance from the shoreline and flow energy. Woodruff and others (2008) simplified the approach to a simple expression dependent on the settling velocity of the coarsest fraction (95th-percentile) of sediment in the deposit and the distance from barrier crest from which the sediment was carried. This approach worked well when compared with observations from a large 1928 event in Playa Laguna Grande, Puerto Rico, particularly for distal parts of the washover fans more than 200 m from the source barriers. One shortcoming of this approach is that it requires knowledge of the geometry of the barrier beach system at the time of the storm, which can be challenging in these dynamic systems.
Micropaleontological criteria also support storm-surge inferences from stratigraphic records. Biological techniques to identify paleostorm events involve the study of microfossil assemblages preserved in sediment (for example, Collins and others, 1999; Hippensteel and Martin, 1999; Scott and others, 2003; Lane and others, 2011). Diatoms, benthic foraminifera, and ostracodes are among the most widely used microfossil groups because most species have well-defined habitat preferences, particularly with respect to salinity (Scott and others, 2003; Ruíz and others, 2009).
24 Assessing Inundation Hazards to Nuclear Powerplant Sites Using Histories of Riverine Floods, Tsunamis, and Storm Surges
tac14-0961_fig12
A B
DC
FE
Figure 12. Examples of modern overwash and associated effects of Hurricane Isabel storm surge along the Outer Banks of North Carolina, 2003. Panels (A) and (B) show overtopping and breaching of the artificial barrier foredunes within the Pea Island National Wildlife Refuge. Panels (C) and (D) show sediment stored in the barrier foredunes was entrained and redeposited, building large washover fans extending several hundred meters into the interior part of the island. Panel (E) shows the washover fans have characteristic rippled bedforms and heavy mineral deposits (dark material), even at the edge of the fan, signifying high flow velocities. Such deposits preserved in sedimentary records provide evidence of paleostorms, potentially indicating the intensity of the storm causing the surge. In addition to transport oriented from the ocean to the estuary (overwash), panel (F) shows characteristic erosion and incision often present in the estuarine side of barriers. These geomorphic features can be the start of breaches and develop into tidal inlets, similar to the Hurricane Isabel inlet formed near Hatteras Village, North Carolina. Photographs taken by C.G. Smith, U.S. Geological Survey, September 27, 2003.
Review of Inundation Hazards and Approaches for Geologic Assessment 25
tac14-0961_fig13
Distal marine overwash deposit(sand)
Juncus roemerianus marsh deposit(fibrous peat)
Estuarine overwash deposit(mud)
Juncus roemerianus marsh deposit(fibrous peat)
A B
Figure 13. (A) Sediment core with two depositional sequences commonly associated with storm surge on barrier islands collected from back-barrier marshes in the Pea Island National Wildlife Refuge, Outer Banks, North Carolina, and (B) representative foraminiferal assemblages for each sedimentary environment. Lower marsh peat is overlain by a mud-dominated, estuarine overwash deposit emplaced when wind duration, fetch, and intensity raise water levels in the back-barrier sound environment (Pamlico Sound). Mud grades back to organic-rich sediment as the marsh recovers, accumulating fibrous peat again. Large sand body overlies the upper peat.
26 Assessing Inundation Hazards to Nuclear Powerplant Sites Using Histories of Riverine Floods, Tsunamis, and Storm Surges
Therefore, microfossil assemblages can be used to identify sediment provenance when key species are transported from inner sublittoral environments shoreward onto barrier island washover deposits. Similarly, cysts of marine dinoflagellate species from shallow marine habitats, present in freshwater environments, can be used to infer transport from offshore, thereby indicating storm surges or other marine incursions. Some long-lived and fossil mollusks and corals also have potential to identify extreme hydrologic events using geochemical proxies in their shells and skeletons (Prouty and others, 2009; Richey and others, 2009; Schöne and others, 2011; Wanamaker and others, 2012). As for lithologic characteristics, Hippensteel and others (2013) note that micropaleontological approaches of paleotempestology are being actively developed; complications associated with taphonomic loss, seasonal variability in microfossil assemblages, and ambiguity in source and sink regions (for example, overlapping taxonomy in estuarine and estuarine wetlands species) make microfossil proxies less precise in certain environments. Most studies, however, use multiple proxies that complement and reinforce the microfossil record (Lane and others, 2011; Pilarczyk and others, 2011).
Sedimentary geochemical proxies also can identify paleostorm deposits (Dezileau and others, 2011). For example, Lambert and others (2008) used organic geochemical proxies, such as sedimentary organic carbon, total nitrogen, and their respective stable isotopic signatures, to infer paleostorm deposits in a core from Lake Shelby, Alabama. They suggested that geochemical signatures are useful in the absence of lithologic changes.
As for studies of riverine floods and tsunamis, multiple sites and multiple lines of evidence are likely to produce the most complete records. Particularly along the Atlantic seaboard, where the coastline is dynamic and the geomorphic effects of storm surges vary over short distances, individual geologic records are likely to be incomplete (Hippensteel and others, 2013). At Onslow Bay, North Carolina, Hippensteel and others (2013) noted the incomplete storm stratigraphic record of prehistoric and historical storm surges, including Hurricane Irene in 2011. When taken together, however, the multiple cores show evidence of several large storm incursions during the last 1,500 years.
Coastal deposits in bays, estuaries, and marine basins in some circumstances also can record freshwater flooding from influent rivers. Studies applying various geochemical and microfaunal methods have documented extremes in regional precipitation and riverine discharge with far-reaching influence on salinity in receiving coastal bays and estuaries (Cronin and Walker, 2006; Willard and Cronin, 2007; Saenger and others, 2008; Bianchi and Allison, 2009; Osterman and Smith, 2012). The stable-isotope and trace-element geochemistry of the shells of microfossils, mollusks, or corals that live in sediments can be especially useful for such analyses and have
been applied in case studies of major coastal systems such as San Francisco, Florida, and Chesapeake Bays (Cronin and others, 2000; Cronin and others, 2003; Cronin and Vann, 2003; Cronin and others, 2005; Saenger and others, 2006; Cronin and others, 2010).
Suitable EnvironmentsBecause coastal zones are dynamic and energetic,
preserved geologic records of storm surges are limited to specific suitable environments. Most storm-surge records have been from coastal zones where sufficient accommodation space allows for preservation of deposits, and where sedimentation rates are high relative to the depth and rate of sediment mixing processes. As with the search for tsunami records, tidal marshes, back-barrier swales and wetlands, estuaries, and river inlets commonly are good targets. Accordingly, most previous studies have focused on back barrier lagoons and coastal ponds, lakes located along Atlantic and Gulf of Mexico coastal zone, coastal mangrove wetlands in southern Florida, and tidal marshes along the Atlantic and Gulf Coasts, as well as shallow estuaries and bays along Pacific, Atlantic and Gulf Coasts (Swart and others, 1996a; Swart and others, 1996b; Brewster-Wingard and Ishman, 1999; Halley and Roulier, 1999; Thomas and others, 2000; Gaiser and others, 2006; Lambert and others, 2008; Lane and others, 2011; Smith and others, 2013). These environments mostly have high sedimentation rates, thereby increasing the likelihood that deposits of short-duration events such as storms are preserved.
GeochronologyAs for tsunamis and riverine flooding, establishing the
chronology of a sediment record is key for any study of storm frequency. The approaches are similar to those for dating river floods and tsunamis, mostly relying on radiocarbon and other short-lived isotopes such as 210Pb. In some environments, other types of “event horizons”—such as volcanic ashes, heavy metal concentrations, and biological changes (such as pollen stratigraphy tied to land-use changes) —can help establish timing.
Local chronologies, in conjunction with stratigraphic relations, can assist in assessing local geomorphic changes, such as inlet or barrier-island formation, which may affect the completeness of the stratigraphic record. Regional chronologies developed from widely spaced records may identify more persistent and widespread changes in storm frequency that owe to broad changes in climate, oceanic circulation, and storm generation (fig. 14). After such chronologies are developed they can assist in interpreting specific sites, as is commonly the case for regional flood and tsunami studies.
Review of Inundation Hazards and Approaches for Geologic Assessment 27
tac14-0961_fig14
500 1,000 1,500 2,000
Year A.D.
Annu
al tr
opic
al h
urric
ane
coun
ts
13
14
12
11
10
9
8
7
Mattapoisett, Massachusetts
Succotash, Rhode Island
Alder, New YorkWhales, New Jersey
Brigantine, New Jersey
Western Lake, Florida
Vieques, Puerto Rico
Singleton Swash, South Carolina
EXPLANATION
Region
New England
Mid-Atlantic
Southeastern coast(oyster beds not used in analysis)
Gulf Coast
Caribbean
Hurricane activity
Modeled Observed
A
B
Figure 14. (A) Individual records of hurricane landfalls based on analysis of overwash deposits along the western north Atlantic Ocean margin, A.D. 500–2000 (composite data of Mann and others, 2009, which describes sources of original data). Identification of hurricane landfalls relies on various sedimentological criteria, but mostly lithologic (grain size, bulk density, or mud content); micropaleontological (foraminifera tests, diatom frustules, or pollen); and biological (for example, extant oyster reefs) measurements. (B) A composite record of the individual datasets presented in graph (A), smoothed to a multi-decadal time-scale (greater than 40 years). Various statistical treatments were used in the composite including Monte Carlo simulations using jack-knife datasets for each region. Results of the statistical treatments are provided in Mann and others (2009); however, only the mean is shown in (B).
Geologic Assessment of Storm-Surge Frequency—Challenges, Limitations and Opportunities
Paleotempestology is a developing science. Significant efforts and progress have been made over the past few decades, particularly on the Gulf and Atlantic Coasts where recent damaging hurricanes such as Rita, Katrina, Ike, Irene, and Sandy have focused attention. Several challenges and limitations emerge from recent studies of these and other events.
For most United States shorelines, collecting paleostorm records from existing lagoons, tidal wetlands, and estuaries is possible for the last 7,000 years. This is the period since the global sea level rose to its approximate modern position and during which it has remained relatively stable, although regional differences are present in relative sea-level history
because of various processes affecting land subsidence and uplift along various coasts. Most of the modern coastal geomorphology has developed during this period.
Because of the dynamic nature of various processes affecting coastlines, accurate interpretation of stratigraphic records requires understanding of the geomorphic context and history of a site. Changes in the local environment, such as barrier island formation or changes in estuary circulation and morphology, may strongly affect local stratigraphic records of storm surges.
Interpreting ancient deposits also requires understanding of storm-surge processes. As Hippensteel and others (2013) note, observations and geologic records of recent hurricanes show a need for improved knowledge of sediment transport and deposition dynamics to better understand how and where stratigraphic records are formed and preserved. Post-depositional processes also can obscure records.
28 Assessing Inundation Hazards to Nuclear Powerplant Sites Using Histories of Riverine Floods, Tsunamis, and Storm Surges
Additionally, as described in the section, “Tsunamis,” storm-surge deposits may be difficult to distinguish from tsunami deposits. This is especially the case for far-field tsunamis, where coseismic subsidence is unlikely at the depositional site. For some situations, it may not be possible to distinguish tsunami sources from and storm-surge sources. Nevertheless, stratigraphic records still can be useful in assessing the frequency of marine inundation, regardless of cause.
Despite these challenges, the diversity of processes and depositional environments along coastlines provide abundant opportunities for reconstructing past storm surges, particularly large ones that leave widespread and diverse evidence. Studies involving multiple approaches are likely to be most successful in developing complete records. With the recent attention generated by Hurricanes Katrina, Irene, and Sandy, new techniques are likely to be developed, improving our ability to derive long-term storm-surge records. These records, in turn, may enhance our understanding of the linkages between climate, oceanic conditions, and storm frequency, and may improve our knowledge of how storms may affect coastlines for various sea-level change scenarios.
Relevance of Sea LevelIn addition to the sedimentological, geomorphic, and
chronological challenges for assessing storm-surge frequency from stratigraphic records, local sea-level history also can influence the stratigraphic record and its interpretation for hazard assessment. Sea-level change is relevant for the study of coastal storm surges because (1) it affects interpretation of geologic records of past storm surges, and (2) it changes areas possibly affected by future storm surges. In these ways, sea-level change is similar to the non-stationarity issue that challenges paleoflood hydrology. Sea-level stabilized about 7,000 years ago, after rising about 130 m above its low point at the peak of the last ice age 22,000 years ago (when continental ice sheets contained a substantial volume of water). Nevertheless, fluctuations (sometimes more than 30 cm over centennial timescales) have affected sea level during the last few thousand years, notably during the Medieval Climate Anomaly (A.D. 800–1400) and Little Ice Age (A.D. 1400–1900) (González and Törnqvist, 2009; Kemp and others, 2011; Cronin, 2012; Gehrels and Woodworth, 2013; Kemp and others, 2013). Recent measurements of sea-level rise from satellite altimetry indicate average global sea-level rise of about 3 mm/yr since 1990 (Nicholls and Cazenave, 2010). This rate continues a pattern of rising sea-level over the last century, totaling about 21 cm since 1880 (Church and White, 2011). Depending on the greenhouse-gas emission scenario, the International Panel on Climate Change predicts continued sea-level rise at similar or even faster rates for the rest of this century, resulting in a global sea level 26–98 cm higher during 2081–2100 than during 1986–2005 (Church
and others, 2013). Such changes, regardless of the effects of atmospheric and oceanic warming on storm generation and intensity, will increase the area of coastal zone affected by storm surges.
Local sea-level variation may be higher or lower than global changes. In particular, subsidence along the Louisiana and Mississippi Gulf Coast has resulted in recent relative sea-level rise exceeding 9 mm/yr, and several areas of the Virginia, Delaware, and New Jersey coastline have had sea-level rises of 3.5–4.5 mm/yr. By contrast, most of the far northeastern U.S. coastline and U.S. Pacific Coast have rates of sea-level rise of less than 3 mm/yr (National Oceanic and Atmospheric Administration, 2014).
Sea-level variations affect geologic interpretation because the elevation of a storm-surge deposit above sea level is an indicator of storm magnitude. To assess magnitude from deposits in the stratigraphic record, the elevation of sea level relative to the deposits at the time of deposition must be estimated. Another factor affecting future storm effects is that sea-level change influences patterns of coastal sedimentation. In environments of changing sea level, separating its effects on sedimentation from those of individual storm surges as well as other coastal processes is a key component of storm-surge reconstructions. An example is provided by studies of coastal tidal marshes in Long Island Sound (van de Plassche and others, 2006). At this location, early studies suggested that sea-level fluctuations during the last 2 millennia were responsible for changes in sedimentation rate and marsh accumulation in coastal tidal marshes. However, restudy of these sequences by van de Plassche and others (2006) showed that abrupt changes in sedimentation, especially infilling by tidal mud and marsh peats, may have been caused by major hurricanes.
Summary Points and Special Considerations—Storm Surges
Holocene sediment records, especially records from tidal marshes, have been investigated in many coastal regions. In some cases, these studies provide detailed records of environmental changes caused by many processes, including storm surges. In some regions, large storms of the last few centuries known from historical records (mainly hurricanes) already have been identified by their characteristic patterns of sediment deposition and erosion. Using similar methods, prehistoric paleostorms also have been identified in several well-studied regions of the Gulf and Atlantic Coasts.
As for floods and tsunamis, geology-based understanding of paleostorm history generally requires integrated analysis of carefully selected coastal sediment sequences. The underpinnings of such integrated analyses are an understanding of modern coastal processes, physical and chemical sedimentology, geochronology, paleoenvironmental proxies, and the regional climatic and sea-level history.
Screening of Potential Riverine Paleoflood Study Sites 29
Geologic Approaches—Overall Considerations
This review of extending records of riverine flooding, tsunamis, and storm surges by geologic studies shows that strong studies likely include the following aspects:1. Geologic and geomorphic environments that generate
and preserve stratigraphic records. This depends partly on the inundation process and the depositional environment, but also depends strongly on the availability of material for transport and deposition. This material commonly is sand, but some deposits also contain other allochthonous materials, helpful for determining source and chronology.
2. Sites that sensitively archive complete stratigraphic records for long periods of time. Finding such sites requires field exploration, but also requires knowledge of inundation and deposition processes; post-depositional obscuring processes; the geomorphology, dynamics, and geologic history of depositional environments; and local anthropogenic environmental changes.
3. Multiple sites to confirm record completeness and magnitude estimates. Geologic records can be capricious. Analysis of multiple sites increases the likelihood of developing an accurate inundation record for a location, particularly for very large events. Multiple site records may help in interpreting source processes, such as tsunami-generating mechanisms and type of riverine flooding.
4. Assessment of landscape changes affecting interpretation of the stratigraphic records. Factors such as sea-level rise, river morphology changes, and changing coastal dynamics can all confound interpretation of geologic records, particularly relating deposits to event magnitudes or depositional processes.
5. Assessment of non-stationarity. In other words, is the geologic record relevant to future hazards? Factors such as climate change, sea-level rise, flow regulation, land use, and local channel and coastline changes and modifications can all affect future frequency and magnitude of inundation. In some cases, geologic records hint at what those changes might be, but in other cases, the geologic record is an incomplete guide to future hazards under changed conditions.
Screening of Potential Riverine Paleoflood Study Sites
On the basis of general physiographic and geologic information, we assess the potential for successful paleoflood
investigations for 104 nuclear powerplant facilities in the United States (table 1). This screening identifies powerplant locations for which paleoflood studies are most likely to provide extended records of riverine flooding to improve flood-hazard assessments. The screening is a “desktop” analysis using available hydrologic, geographic, and geologic information. It accounts for the closeness of the powerplant to rivers that may flood and the geologic and physiographic conditions of the watershed and river corridor relevant to forming and preserving paleoflood deposits. Site visits necessary for confirming suitable and specific paleoflood study sites were not conducted. This analysis only applies to hazards from riverine flooding, although similar screenings could readily assess suitability for geologic investigations of storm-surge or tsunami hazards.
For this screening, we evaluated sites rather than the 104 specific nuclear powerplants. A “site” is referred to in this report as a general location hosting one or more licensed nuclear power plants. Because many sites have more than one plant—for example, the three separately licensed Browns Ferry 1, 2, and 3 plants operated by the Tennessee Valley Authority—the total number of assessed sites is 64. In addition to the co-located plants, the Nine Mile Point (plants 1 and 2) and James A. Fitzpatrick plants in New York are all within 1 km of each other and are treated as a single site (fig. 15, table 1).
Coarse Assessment of Riverine Flood Hazard
Each nuclear powerplant site was evaluated to determine if it possibly had a riverine flood hazard. For each of these 64 sites (fig. 15, table 1), we assessed how close they are to rivers and existing flood-hazard zones. Each site location, as specified in table 1, was buffered by 10 km within the geographical information system ArcGIS™. Buffers were intersected with National Hydrography Dataset water-body and stream network datasets (table 2) to identify rivers, lakes, or oceans that are within this buffer. Sites within 10 km of streams or rivers draining greater than 500 km2 were determined to be possibly close enough to have hazards from riverine floods. This analysis also identified sites within 10 km of oceans and lakes greater than 100 km2—information useful for screening storm-surge or tsunami hazards.
All 64 sites were within 10 km of at least 1 major water body (the types of water bodies are indicated by the “yes” in the column, “Water sources within 10 kilometers of site” in table 3). Sixteen sites were near a lake, 14 were near an ocean, and 54 were near a river. Of these sites, only Crystal River Nuclear Generating Plant was within 10 km of all three types of major water features. Eighteen sites included 2 of the water feature groups within 10 km.
30 Assessing Inundation Hazards to Nuclear Powerplant Sites Using Histories of Riverine Floods, Tsunamis, and Storm Surges
Table 1. Nuclear powerplants in the United States analyzed for this study.
[Multiple plants analyzed as one site are grouped together either by shaded gray or white backgrounds. Abbreviations: No., number; Inc., Incorporated; Co., Company; LLC, limited liability company; UE, Union Electric; TXU, Texas Utilities; PSEG, Public Service Enterprise Group; FPL, Florida Power and Light; STP, South Texas Project; PPL, Pennsylvania Power and Light; PWR, pressurized water reactor; BWR, boiling water reactor; MWe, megawatt electric]
Station5000397 Energy Northwest BWR 1,190 Washington 46.471111, -119.333889
Comanche Peak 1 5000445 TXU Generating Company LP PWR 1,200 Texas 32.298333, -97.785Comanche Peak 2 5000446 TXU Generating Company LP PWR 1,150 Texas 32.298333, -97.785Cooper 5000298 Nebraska Public Power District BWR 830 Nebraska 40.361944, -95.641389Crystal River 3 5000302 Progress Energy PWR 838 Florida 28.9575, -82.698333D.C. Cook 1 5000315 Indiana/Michigan Power Co. PWR 1,009 Michigan 41.975391, -86.565914D.C. Cook 2 5000316 Indiana/Michigan Power Co. PWR 1,060 Michigan 41.975391, -86.565914Davis-Besse 5000346 FirstEnergy Nuclear Operating Co. PWR 893 Ohio 41.596667, -83.086389Diablo Canyon 1 5000275 Pacific Gas and Electric Co. PWR 1,151 California 35.210861, -120.856175Diablo Canyon 2 5000323 Pacific Gas and Electric Co. PWR 1,149 California 35.210861, -120.856175Dresden 2 5000237 Exelon Generation Co., LLC BWR 867 Illinois 41.389722, -88.268056Dresden 3 5000249 Exelon Generation Co., LLC BWR 867 Illinois 41.389722, -88.268056Duane Arnold 5000331 NextEra Energy Duane Arnold, LLC BWR 640 Iowa 42.100556, -91.777222Farley 1 5000348 Southern Nuclear Operating Co. PWR 851 Alabama 31.223056, -85.111667Farley 2 5000364 Southern Nuclear Operating Co. PWR 860 Alabama 31.223056, -85.111667Fermi 2 5000341 Detroit Edison Co. BWR 1,122 Michigan 41.962778, -83.2575Fort Calhoun 5000285 Omaha Public Power District PWR 500 Nebraska 41.520278, -96.077222Ginna 5000244 Constellation Energy PWR 498 New York 43.277778, -77.31Grand Gulf 1 5000416 Entergy Nuclear Operations, Inc. BWR 1,297 Mississippi 32.006667, -91.048333Hatch 1 5000321 Southern Nuclear Operating Co., Inc. BWR 876 Georgia 31.934167, -82.343889Hatch 2 5000366 Southern Nuclear Operating Co., Inc. BWR 883 Georgia 31.934167, -82.343889Hope Creek 1 5000354 PSEG Nuclear BWR 1,061 New Jersey 39.467778, -75.538056Indian Point 2 5000247 Entergy Nuclear Operations, Inc. PWR 1,020 New York 41.269722, -73.952222Indian Point 3 5000286 Entergy Nuclear Operations, Inc. PWR 1,025 New York 41.269722, -73.952222Kewaunee 5000305 Dominion Generation PWR 556 Wisconsin 44.342222, -87.536111La Salle 1 5000373 Exelon Generation Co., LLC BWR 1,118 Illinois 41.245556, -88.669167La Salle 2 5000374 Exelon Generation Co., LLC BWR 1,120 Illinois 41.245556, -88.669167Limerick 1 5000352 Exelon Generation Co., LLC BWR 1,134 Pennsylvania 40.226667, -75.587222Limerick 2 5000353 Exelon Generation Co., LLC BWR 1,134 Pennsylvania 40.226667, -75.587222McGuire 1 5000369 Duke Energy Power Company, LLC PWR 1,100 North Carolina 35.4325, -80.948333McGuire 2 5000370 Duke Energy Power Company, LLC PWR 1,100 North Carolina 35.4325, -80.948333Millstone 2 5000336 Dominion Generation PWR 884 Connecticut 41.311944, -72.168611Millstone 3 5000423 Dominion Generation PWR 1,227 Connecticut 41.311944, -72.168612
Screening of Potential Riverine Paleoflood Study Sites 31
Table 1. Nuclear powerplants in the United States analyzed for this study.—Continued
[Multiple plants analyzed as one site are grouped together either by shaded gray or white backgrounds. Abbreviations: No., number; Inc., Incorporated; Co., Company; LLC, limited liability company; UE, Union Electric; TXU, Texas Utilities; PSEG, Public Service Enterprise Group; FPL, Florida Power and Light; STP, South Texas Project; PPL, Pennsylvania Power and Light; PWR, pressurized water reactor; BWR, boiling water reactor; MWe, megawatt electric]
Plant name
Docket No.
Owner/operatorReactor
typeOutput (MWe)
StateLatitude and longitude
(decimal degrees)
Monticello 5000263 Nuclear Management Co. BWR 579 Minnesota 45.333611, -93.849167Nine Mile Point 1 5000220 Constellation Energy BWR 621 New York 43.520833, -76.406944Nine Mile Point 2 5000410 Constellation Energy BWR 1,140 New York 43.520833, -76.406944FitzPatrick 5000333 Entergy Nuclear Operations, Inc. BWR 852 New York 43.523333, -76.398333North Anna 1 5000338 Dominion Generation PWR 980 Virginia 38.060556, -77.789444North Anna 2 5000339 Dominion Generation PWR 973 Virginia 38.060556, -77.789444Oconee 1 5000269 Duke Energy Power Company, LLC PWR 846 South Carolina 34.793889, -82.898056Oconee 2 5000270 Duke Energy Power Company, LLC PWR 846 South Carolina 34.793889, -82.898056Oconee 3 5000287 Duke Energy Power Company, LLC PWR 846 South Carolina 34.793889, -82.898056Oyster Creek 5000219 Exelon Generation Co., LLC BWR 619 New Jersey 39.814722, -74.205Palisades 5000255 Entergy Nuclear Operations, Inc. PWR 778 Michigan 42.322778, -86.314444Palo Verde 1 5000528 Arizona Public Service Co. PWR 1,335 Arizona 33.389167, -112.865Palo Verde 2 5000529 Arizona Public Service Co. PWR 1,335 Arizona 33.389167, -112.865Palo Verde 3 5000530 Arizona Public Service Co. PWR 1,335 Arizona 33.389167, -112.865Peach Bottom 2 5000277 Exelon Generation Co., LLC BWR 1,112 Pennsylvania 39.758333, -76.268056Peach Bottom 3 5000278 Exelon Generation Co., LLC BWR 1,112 Pennsylvania 39.758333, -76.268056Perry 1 5000440 FirstEnergy Nuclear Operating Co. BWR 1,261 Ohio 41.800833, -81.143333Pilgrim 1 5000293 Entergy Nuclear Operations, Inc. BWR 685 Massachusetts 41.945, -70.578333Point Beach 1 5000266 FPL Energy Point Beach, LLC PWR 512 Wisconsin 44.281111, -87.536667Point Beach 2 5000301 FPL Energy Point Beach, LLC PWR 514 Wisconsin 44.281111, -87.536667Prairie Island 1 5000282 Nuclear Management Co. PWR 511 Minnesota 44.621667, -92.633056Prairie Island 2 5000306 Nuclear Management Co. PWR 545 Minnesota 44.621667, -92.633056Quad Cities 1 5000254 Exelon Generation Co., LLC BWR 867 Illinois 41.726389, -90.31Quad Cities 2 5000265 Exelon Generation Co., LLC BWR 869 Illinois 41.726389, -90.31River Bend 1 5000458 Entergy Nuclear Operations, Inc. BWR 989 Louisiana 30.756667, -91.333333Robinson 2 5000261 Progress Energy PWR 710 South Carolina 34.402778, -80.158333Saint Lucie 1 5000335 Florida Power and Light Co. PWR 839 Florida 27.348611, -80.246389Saint Lucie 2 5000389 Florida Power and Light Co. PWR 839 Florida 27.348611, -80.246389Salem 1 5000272 PSEG Nuclear PWR 1,174 New Jersey 39.462778, -75.535556Salem 2 5000311 PSEG Nuclear PWR 1,130 New Jersey 39.462778, -75.535556San Onofre 2 5000361 Southern California Edison Co. PWR 1,070 California 33.368889, -117.555San Onofre 3 5000362 Southern California Edison Co. PWR 1,080 California 33.368889, -117.555Seabrook 1 5000443 Florida Power and Light Co. PWR 1,295 New Hampshire 42.898889, -70.850833Sequoyah 1 5000327 Tennessee Valley Authority PWR 1,148 Tennessee 35.226389, -85.091667Sequoyah 2 5000328 Tennessee Valley Authority PWR 1,126 Tennessee 35.226389, -85.091667Shearon Harris 1 5000400 Progress Energy PWR 900 North Carolina 35.633333, -78.955South Texas 1 5000498 STP Nuclear Operating Co. PWR 1,410 Texas 28.795556, -96.048889South Texas 2 5000499 STP Nuclear Operating Co. PWR 1,410 Texas 28.795556, -96.048889Summer 5000395 South Carolina Electric and Gas Co. PWR 966 South Carolina 34.298611, -81.314722Surry 1 5000280 Dominion Generation PWR 799 Virginia 37.165556, -76.697778Surry 2 5000281 Dominion Generation PWR 799 Virginia 37.165556, -76.697778Susquehanna 1 5000387 PPL Susquehanna, LLC BWR 1,149 Pennsylvania 41.088889, -76.148889Susquehanna 2 5000388 PPL Susquehanna, LLC BWR 1,140 Pennsylvania 41.088889, -76.148889Three Mile Island 1 5000289 Exelon Generation Co., LLC PWR 786 Pennsylvania 40.153889, -76.724722Turkey Point 3 5000250 Florida Power and Light Co. PWR 720 Florida 25.434167, -80.330556Turkey Point 4 5000251 Florida Power and Light Co. PWR 720 Florida 25.434167, -80.330556Vermont Yankee 5000271 Entergy Nuclear Operations, Inc. BWR 510 Vermont 42.778889, -72.513056Vogtle 1 5000424 Southern Nuclear Operating Co. PWR 1,109 Georgia 33.143333, -81.760556Vogtle 2 5000425 Southern Nuclear Operating Co. PWR 1,127 Georgia 33.143333, -81.760556Waterford 3 5000382 Entergy Nuclear Operations, Inc. PWR 1,250 Louisiana 29.995278, -90.471111Watts Bar 1 5000390 Tennessee Valley Authority PWR 1,123 Tennessee 35.602778, -84.789444Wolf Creek 1 5000482 Wolf Creek Nuclear Operating
CorporationPWR 1,166 Kansas 38.238889, -95.688889
32 Assessing Inundation Hazards to Nuclear Powerplant Sites Using Histories of Riverine Floods, Tsunamis, and Storm Surges
tac14-0961_fig15
70°80°90°100°110°130° 120°50°
40°
30°
0 200 400 600 800 MILES
0 200 400 600 800 KILOMETERSBase map modified from Enviromental Systems Research Institute (ESRI), Inc. digital base maps, various resolutions. Albers equal area projection, North American Datum of 1983 (NAD 83).
EXPLANATION
Powerplants sites with paleoflood screening assessment
Powerplant sites with little plausible riverine flood hazard
Figure 15. Nuclear powerplant sites in the United States screened for paleoflood study suitability. The screening tentatively identified 14 sites that either are not adjacent to large rivers or are physically isolated from nearby rivers. These sites were excluded from the geologic and physiographic screening analysis and are indicated by the open squares. The 50 sites that were fully assessed are indicated by the shaded squares.
Screening of Potential Riverine Paleoflood Study Sites 33
We also assessed whether sites were within or near mapped flood zones, as shown on digital Federal Emergency Management Agency (FEMA) floodplain maps. Digital floodplain maps were downloaded from the FEMA National Flood Hazard Layer (table 2) database where available, and from these maps, we determined how close plant sites are to regulatory flood zones. The distance between the plant sites and the FEMA flood zones (particularly the areas predicted to be inundated by the 0.01 and 0.002 annual exceedance probability floods) was determined with ArcGIS™. For 14 sites that did not have digitally available floodplains maps available as Geographic Information System files, scanned copies of
paper flood maps were examined online with the FEMA Map Service Center viewer (table 2). Four sites lacked digitally available FEMA flood zone information of any type and were not assessed. These are indicated by the “no mapping available online” entries in table 3.
Most power plant sites are in or near mapped flood zones (table 3). All but 5 of the 60 analyzed sites (excluding the 4 sites near rivers with no digitally available flood plain information) were within 2 km of the 0.01 annual exceedance probability (100-year) flood zone. Ten sites are within areas mapped as within the 0.002 annual exceedance probability (500-year) flood zone.
Table 2. Information sources for paleoflood suitability screening.
[ESRI, Environmental Systems Research Institute, Inc.]
Item Resolution Coverage Source Data repository
Geology 1:500,000 United States U.S. Geological Survey http://www.nationalatlas.gov/atlasftp.html
Geology 1:250,000 British Columbia, Canada
British Columbia Geological Survey, Ministry of Energy and Mines
Digital elevation models 10-meter United States U.S. Geological Survey http://nationalmap.gov/viewer.html
Hydrography (streams, water bodies, flow directions, and flow-accumulation rasters)
30-meter United States; parts of Canada
U.S. Geological Survey http://www.horizon-systems.com/NHDPlus/
Aerial photography Varies World ESRI map service http://www.arcgis.com/home/item.html?id=10df2279f9684e4a9f6a7f08febac2a9
Landslides 1:500,000 United States U.S. Geological Survey http://www.nationalatlas.gov/atlasftp.html
Dams Based on National Inventory of Dams criteria
United States U.S. Army Corps of Engineers
http://www.nationalatlas.gov/atlasftp.html
Flood plains Varies Parts of the United States
Federal Emergency Management Agency
https://hazards.fema.gov/femaportal/NFHL/ and https://msc.fema.gov/webapp/wcs/stores/servlet/FemaWelcomeView?storeId=10001&catalogId=10001&langId=-1&userType=G
34 Assessing Inundation Hazards to Nuclear Powerplant Sites Using Histories of Riverine Floods, Tsunamis, and Storm SurgesTa
ble
3.
Sum
mar
y ta
ble
of n
ucle
ar p
ower
plan
t site
s sc
reen
ed fo
r pal
eoflo
od s
tudy
sui
tabi
lity,
incl
udin
g re
sults
.
[See
tabl
e 1
for p
ower
plan
t loc
atio
n. F
or th
e 14
site
s whe
re p
relim
inar
y sc
reen
ing
indi
cate
s no
haza
rd fr
om ri
verin
e flo
odin
g, a
naly
ses o
f “si
te st
udy
pote
ntia
l” w
ere
not c
ondu
cted
. Abb
revi
atio
ns: F
EMA
, Fed
eral
Em
erge
ncy
Man
agem
ent A
genc
y; N
HD
, Nat
iona
l Hyd
rogr
aphy
Dat
a; G
NIS
, Geo
grap
hic
Nam
es In
form
atio
n Sy
stem
; NFA
, no
furth
er a
naly
sis;
km
, kilo
met
er; m
2 /km
2 , met
er sq
uare
d pe
r kilo
met
er sq
uare
d; N
A,
not a
pplic
able
; >, g
reat
er th
an; <
, les
s tha
n]
Site
Maj
or w
ater
bod
ies
with
in 1
0 km
Dis
tanc
e to
FEM
A
100-
year
floo
d pl
ain
(km
)
Clos
est N
HD
str
eam
(o
r wat
er b
ody)
Site
stu
dy p
oten
tial
Maj
or
dam
s
Land
slid
es
Sand
pr
oduc
tion
Geo
logi
c en
viro
nmen
tSt
ream
side
sl
ope
Wat
ersh
ed
dom
ain
2W
ater
shed
do
mai
n 3
Lake
Rive
rO
cean
Hig
h (p
erce
nt)
Rank
Hig
h (p
erce
nt)
Rank
Inde
x (m
2 /km
2 )Ra
nkCo
unt
Hig
h (p
erce
nt)
Hig
h (p
erce
nt)
Ark
ansa
s Nuc
lear
Yes
Yes
No
0.17
Ark
ansa
s Riv
er36
20
117
73
289
56
Bea
ver V
alle
yN
oYe
sN
o0
km, n
o di
gita
l map
Ohi
o R
iver
462
01
3,45
84
108
7369
Bra
idw
ood
No
Yes
No
No
map
ping
ava
ilabl
e on
line
Maz
on a
nd W
est F
ork
M
azon
Riv
ers
01
41
01
00
0
Bro
wns
Fer
ryYe
sYe
sN
o0.
12Te
nnes
see
Riv
er29
243
29
159
400
Bru
nsw
ick
No
Yes
Yes
0.21
Cap
e Fe
ar R
iver
402
41
01
10
0B
yron
No
Yes
No
2.89
Roc
k R
iver
251
703
692
10
7C
alla
way
No
Yes
No
1.72
Mis
sour
i Riv
er20
134
242
73
689
25
Cal
vert
Clif
fsN
oYe
sYe
s0.
42O
cean
NFA
NFA
NFA
NFA
NFA
NFA
NFA
0N
AC
ataw
baN
oYe
sN
o0.
3C
ataw
ba a
nd W
ater
ee R
iver
s83
40
118
211
484
Clin
ton
No
Yes
No
0.23
Salt
Cre
ek0
144
22
11
00
Col
umbi
a G
ener
atin
g St
atio
nN
oYe
sN
oN
o m
appi
ng a
vaila
ble
onlin
eC
olum
bia
Riv
er28
21
10
161
221
Com
anch
e Pe
akN
oYe
sN
o>2
km
, no
digi
tal m
apSq
uaw
Cre
ek49
250
313
22
00
Coo
per
No
Yes
No
No
map
ping
ava
ilabl
e on
line
Mis
sour
i Riv
er22
129
256
63
510
142
Cry
stal
Riv
erYe
sYe
sYe
s<2
km
, no
digi
tal m
apW
ithla
cooc
hee
Riv
er42
278
40
14
0N
AD
.C. C
ook
Yes
No
No
0.09
Gre
at L
akes
NFA
NFA
NFA
NFA
NFA
NFA
NFA
0N
AD
avis
-Bes
seYe
sYe
sN
o<1
km
, no
digi
tal m
apTo
ussa
int R
iver
and
Cre
ek0
199
412
13
00
NA
Dia
blo
Can
yon
No
No
Yes
0.29
No
GN
IS n
ame
(Dia
blo
Can
yon)
452
01
7,01
14
070
NA
Dre
sden
No
Yes
No
0.34
Illin
ois a
nd D
es P
lain
es R
iver
s0
150
214
63
41
11D
uane
Arn
old
No
Yes
No
0.13
Ced
ar R
iver
01
974
762
20
0Fa
rley
No
Yes
No
0.27
Cha
ttaho
oche
e R
iver
784
141
01
96
0Fe
rmi 2
Yes
Yes
No
<1 k
m, n
o di
gita
l map
Swan
Cre
ek20
151
39
10
0N
AFo
rt C
alho
unN
oYe
sN
o0
Mis
sour
i Riv
er20
135
239
43
256
192
Gin
naYe
sN
oN
oN
o m
appi
ng a
vaila
ble
onlin
eM
ill a
nd D
eer C
reek
s14
10
10
10
0N
A
Gra
nd G
ulf
No
Yes
No
0.34
Mis
siss
ippi
Riv
er22
128
237
63
944
411
Hat
chN
oYe
sN
o0.
33O
cone
e an
d A
ltam
aha
Riv
ers
824
21
51
2018
0H
ope
Cre
ekN
oYe
sYe
s<1
km
, no
digi
tal m
apD
elaw
are
Riv
er47
27
120
23
486
0In
dian
Poi
ntN
oYe
sN
o0.
14H
udso
n R
iver
181
61
987
342
155
Kew
aune
eYe
sN
oN
o<1
km
, no
digi
tal m
ap2
smal
l unn
amed
01
994
01
00
NA
La S
alle
No
Yes
No
6.68
Illin
ois a
nd D
es P
lain
es R
iver
s0
144
215
73
81
13Li
mer
ick
No
Yes
No
0.37
Schu
ylki
ll R
iver
272
191
871
39
10
McG
uire
Yes
Yes
No
0.22
Cat
awba
Riv
er89
40
146
29
6339
Screening of Potential Riverine Paleoflood Study Sites 35Ta
ble
3.
Sum
mar
y ta
ble
of n
ucle
ar p
ower
plan
t site
s sc
reen
ed fo
r pal
eoflo
od s
tudy
sui
tabi
lity,
incl
udin
g re
sults
.—Co
ntin
ued
[See
tabl
e 1
for p
ower
plan
t loc
atio
n. F
or th
e 14
site
s whe
re p
relim
inar
y sc
reen
ing
indi
cate
s no
haza
rd fr
om ri
verin
e flo
odin
g, a
naly
ses o
f “si
te st
udy
pote
ntia
l” w
ere
not c
ondu
cted
. Abb
revi
atio
ns: F
EMA
, Fed
eral
Em
erge
ncy
Man
agem
ent A
genc
y; N
HD
, Nat
iona
l Hyd
rogr
aphy
Dat
a; G
NIS
, Geo
grap
hic
Nam
es In
form
atio
n Sy
stem
; NFA
, no
furth
er a
naly
sis;
km
, kilo
met
er; m
2 /km
2 , met
er sq
uare
d pe
r kilo
met
er sq
uare
d; N
A,
not a
pplic
able
; >, g
reat
er th
an; <
, les
s tha
n]
Site
Maj
or w
ater
bod
ies
with
in 1
0 km
Dis
tanc
e to
FEM
A
100-
year
floo
d pl
ain
(km
)
Clos
est N
HD
str
eam
(o
r wat
er b
ody)
Site
stu
dy p
oten
tial
Maj
or
dam
s
Land
slid
es
Sand
pr
oduc
tion
Geo
logi
c en
viro
nmen
tSt
ream
side
sl
ope
Wat
ersh
ed
dom
ain
2W
ater
shed
do
mai
n 3
Lake
Rive
rO
cean
Hig
h (p
erce
nt)
Rank
Hig
h (p
erce
nt)
Rank
Inde
x (m
2 /km
2 )Ra
nkCo
unt
Hig
h (p
erce
nt)
Hig
h (p
erce
nt)
Mill
ston
eN
oYe
sYe
s0.
22O
cean
NFA
NFA
NFA
NFA
NFA
NFA
NFA
0N
AM
ontic
ello
No
Yes
No
0.32
Mis
siss
ippi
Riv
er41
225
110
93
260
0N
ine
Mile
Poi
ntYe
sN
oN
o0.
26G
reat
Lak
esN
FAN
FAN
FAN
FAN
FAN
FAN
FA0
NA
Nor
th A
nna
No
Yes
No
0.12
Nor
th A
nna
Riv
er a
nd
Pam
unke
y C
reek
272
01
01
07
4
Oco
nee
No
Yes
No
0.23
Sene
ca R
iver
864
01
81
910
010
0O
yste
r Cre
ekN
oN
oYe
s0.
17O
yste
r Cre
ek0
10
10
10
00
Palis
ades
Yes
Yes
No
0.07
Bra
ndyw
ine
Cre
ek0
10
10
10
0N
APa
lo V
erde
No
Yes
No
3.76
Arti
ficia
l mos
tlyN
FAN
FAN
FAN
FAN
FAN
FAN
FA0
0Pe
ach
Bot
tom
No
Yes
No
0.03
Smal
l stre
ams
NFA
NFA
NFA
NFA
NFA
NFA
NFA
00
Perr
yYe
sYe
sN
o0.
4G
reat
Lak
esN
FAN
FAN
FAN
FAN
FAN
FAN
FA0
NA
Pilg
rimN
oN
oYe
s0.
3O
cean
NFA
NFA
NFA
NFA
NFA
NFA
NFA
0N
APo
int B
each
Yes
No
No
0.14
Gre
at L
akes
NFA
NFA
NFA
NFA
NFA
NFA
NFA
0N
APr
airie
Isla
ndN
oYe
sN
o0.
11M
issi
ssip
pi R
iver
352
613
3,21
24
340
2Q
uad
Citi
esN
oYe
sN
o0.
13M
issi
ssip
pi R
iver
392
603
1,49
24
127
25
Riv
er B
end
No
Yes
No
<1 k
m, n
o di
gita
l map
Mis
siss
ippi
Riv
er22
126
248
63
951
59
Rob
inso
nN
oYe
sN
o0.
23B
lack
Cre
ek0
10
10
10
00
Sain
t Luc
ieN
oYe
sYe
s0
Flat
arti
ficia
lN
FAN
FAN
FAN
FAN
FAN
FAN
FA0
NA
Sale
mN
oYe
sYe
s<1
km
, no
digi
tal m
apD
elaw
are
Riv
er47
26
127
93
486
0Sa
n O
nofr
eN
oN
oYe
s22
.82
Coa
stal
NFA
NFA
NFA
NFA
NFA
NFA
NFA
0N
ASe
abro
okN
oYe
sYe
s0.
14O
cean
NFA
NFA
NFA
NFA
NFA
NFA
NFA
6543
Sequ
oyah
Yes
Yes
No
0.11
Tenn
esse
e R
iver
292
553
222
7462
6Sh
earo
n H
arris
No
Yes
No
0.35
Whi
te O
ak, T
hom
as, a
nd C
reek
s2
10
10
11
00
Sout
h Te
xas
No
Yes
No
<2 k
m, n
o di
gita
l map
Arti
ficia
l and
nea
r coa
stal
NFA
NFA
NFA
NFA
NFA
NFA
NFA
0N
ASu
mm
erN
oYe
sN
o0
km, n
o di
gita
l map
Salu
da a
nd C
onag
ree
Riv
ers
884
01
532
717
16Su
rry
No
Yes
Yes
0.16
Jam
es R
iver
442
01
432
2723
0Su
sque
hann
aN
oYe
sN
o1.
1Su
sque
hann
a R
iver
332
21
5,06
94
338
51Th
ree
Mile
Isla
ndN
oYe
sN
o0.
22Su
sque
hann
a R
iver
402
181
422
345
604
Turk
ey P
oint
No
No
Yes
0.02
Flat
arti
ficia
lN
FAN
FAN
FAN
FAN
FAN
FAN
FA0
NA
Verm
ont Y
anke
eN
oYe
sN
o0.
09C
onne
ctic
ut R
iver
382
41
650
322
2615
Vogt
leN
oYe
sN
o0.
63Sa
vann
ah R
iver
764
01
682
60
0W
ater
ford
Yes
Yes
No
0 km
, no
digi
tal m
apM
issi
ssip
pi R
iver
221
262
501
395
15
8W
atts
Bar
Ye
sYe
sN
o0.
61Te
nnes
see
Riv
er29
260
369
252
6117
Wol
f Cre
ekN
oYe
sN
o<1
km
, no
digi
tal m
apW
olf C
reek
00
11
01
00
0
36 Assessing Inundation Hazards to Nuclear Powerplant Sites Using Histories of Riverine Floods, Tsunamis, and Storm Surges
Paleoflood Suitability Assessment
Some environments are more conducive to paleoflood studies than others. As described in the section, “Riverine Floods,” key factors include sufficient sediment loads to produce deposits, depositional environments that preserve and protect deposits, and stable valley morphology (Benito and O’Connor, 2013). We broadly assessed these factors within a geographical information system for each plant site by considering watershed geology and valley physiography.
Spatial Analysis DomainsThe analysis entailed defining several analysis domains
that are the basis for separate assessments of sediment production potential, geologically suitable depositional environments, and valley confinement. These domains narrowed the specific suitability assessments to parts of the watershed appropriate for assessing the flood hazard at the
plant site. For each plant site adjacent to a stream or river, we determined the watershed area corresponding to the plant site location by editing the specified location of the plant sites (table 1) so that each site was represented by a point on the stream network of the National Hydrography Dataset (table 2; appendix table A1). The contributing drainage area at each site then was delineated in ArcGIS™ using the Spatial Analyst hydrology toolset. This area was the basis for three watershed analysis domains (fig. 16; appendix table A1): (1) a headwaters domain consisting of the upstream-most 50 percent of watershed area, as measured at the plant site; (2) a mid-watershed domain consisting of the remaining 50 percent of the watershed contributing to the stream or channel at the plant site; and (3) a domain downstream of the plant site enclosing the length of channel with a contributing drainage area equivalent to the area upstream of the plant (thus, the downstream end of this reach has a total drainage area twice as large as that at the plant site). We refer to these as watershed domains 1, 2, and 3, respectively (appendix table A1).
tac14-0961_fig16
95°
90°
45°
40°
0 50 100 150
0 50 100 150
200 MILES
200 KILOMETERS
Analysis domain 3
Analysis domain 1
Analysis domain 2
Near-channel analysis corridor
Flow
Quad Cities, Illinois, Mississippi River
Area of detail
Area of detail
Figure 16. Example of watershed analysis domains enabling targeted paleoflood suitability assessments. The Quad Cities nuclear powerplant is located on the left bank of the Mississippi River in Illinois. The contributing area at this site includes analysis domains 1 and 2 on the map. Analysis domain 1 is 115,757 square kilometers (km2), about one-half the 228,375-km2 basin area at the nuclear powerplant site. Analysis domain 3 is the area downstream of the plant site, with a total drainage area about twice the basin area at the plant site (446,996 km2). The shaded area along the Mississippi River in analysis domains 2 and 3 is the near-channel analysis corridor. The corridor is defined as 10 times the channel width at the plant site; here, the channel width is 63.3 meters (m), resulting in a near-channel analysis corridor width of 633 m, encompassing 12,423 km2 of analysis domains 2 and 3.
Screening of Potential Riverine Paleoflood Study Sites 37
Because the network of tributaries and contributing areas commonly prevents identification of specific points along the channel with drainage areas of exactly one-half and twice the area at the plant, we chose locations as close as possible to the target values. Additionally, several plants were near the downstream ends of rivers, either the ocean or a confluence with a larger river. In these cases, watershed domain 3 was smaller than the target value. For a few plants where the total contributing area at the plant was small, upstream domain 1 was not delineated and the entire upstream watershed area was combined for all analysis components. For several plant sites along coasts or lakeshores, multiple small drainages possibly affected the plant site. In these cases, the upstream contributing watersheds were merged for analysis.
A near-channel analysis corridor was defined in which the potential for paleoflood deposit sites was assessed (fig. 16; appendix table A1). The near-channel corridor extends for the entire length of the main channel within watershed analysis domains 2 and 3 and has a width equivalent to 10 times the width of the river or stream channel at the plant site, applied as a buffer about the National Hydrography Data line representing the watercourse. The channel width was measured from aerial photography (table 2) for each site. In cases where the plant was located adjacent to a reservoir, channel width was measured at a nearby location more representative of the natural channel width. This width measurement provides a means of scaling the buffer width relative to the river size.
By this process of defining the near-channel analysis corridor, we identified 14 coastal and lakeside plant sites unlikely to be affected by large-river floods. These include 6 of the 10 sites previously identified as distant from a large river, as well as 8 other sites for which nearby large rivers are physically isolated from the plant site such that they pose no hazard. Nearby streams, if present, are small. Paleoflood studies for most of these sites are unlikely to improve the understanding of flood hazards at these facilities. Nevertheless, storm-surge and tsunami studies may be useful for many of them. The paleoflood screening was applied to the 50 remaining plant sites (fig. 15, table 3).
Watershed Sediment Production PotentialThe quantity and size of transported sediment—
particularly sand—is important in judging potential for a river to create flood deposits, a necessary component of most paleoflood records. We assessed likely sediment supply conditions from the geology of watershed analysis domains 1 and 2, which together compose the entire contributing area upstream of the plant sites. Our focus was on sediment originating upstream because sediment supplied to the river downstream of the plant site is less likely to contribute to paleoflood records relevant to the plant site.
For each assessed plant site, we obtained digital geologic datasets from the U.S. Geological Survey and the British Columbia Geological Survey (table 2) for the watershed
analysis domains 1, 2, and 3. A total of 178 different lithologic types are identified in these datasets for the United States and southern British Columbia. We classified each of these types as high, medium, or low based on our determination of their tendency to produce sand-sized sediment well suited for creating paleoflood deposits (appendix table A2). Rock types likely producing abundant sand and ranked high include sandstone, intrusive (coarse-grained) igneous rocks, and coarse-grained metamorphic rocks. Rocks least likely to produce sands and ranked low are siltstone and shale, carbonate rocks, fine-grained metamorphic rocks, and extrusive volcanic rocks such as basalt and rhyolite. Mixed categories and other rock types were ranked mostly medium.
For watershed domains 1 and 2 of each plant site, we calculated the percentage area underlain by rock types determined to be high sand producers (fig. 17). The percentage area ranged from 0 to 100 percent, leading to four categorization levels (ranks):1–4 (table 4). The highest rank, 4, includes the 7 sites that had more than 75 percent of watershed analysis domains 1 and 2 underlain by high sand producers (“Sand production” columns in table 3). All these sites are in the southeastern United States. Thirty-one sites ranked between 2 and 3, and 12 sites had 25 percent or less of their contributing areas determined to be high sand suppliers and ranked 1.
Depositional Site GeologyCertain geologic and physiographic conditions can
favor formation and preservation of slackwater deposits. In particular, rock shelters and caves in resistant rock formations along valley edges provide stable and protected areas for accumulation of long stratigraphic records of flooding (for example, Harden and others, 2011). To assess the likelihood of such environments, we categorized the rock types within the near-channel corridor—the strip 10 channel widths wide flanking the river—in watershed domains 2 and 3. This corridor encompasses the near-channel area, with drainage areas ranging from 50 to 200 percent of the drainage area at the plant site—a range of watershed areas for which paleoflood records likely are relevant to the long-term flood history at the plant site.
The data sources (table 2), classification (appendix table A2), and ranking criteria (table 4) are similar to those for assessing sand production, but the rock type classification emphasizes different lithologic characteristics (fig. 17; appendix table A2). Rock types that form caves, rock shelters, or overhanging ledges are ranked high. These include layered sedimentary and metamorphic rocks such as sandstone and quartzite, which commonly outcrop with sheltering ledges; and carbonate rocks such as limestones and marbles, which commonly have caves and alcoves. Unconsolidated rock types, such as Quaternary river and wind deposits, are ranked low. Most other rock types and mixed categories are ranked medium.
38 Assessing Inundation Hazards to Nuclear Powerplant Sites Using Histories of Riverine Floods, Tsunamis, and Storm Surges
tac14-0961_fig17
Base maps modified from Environmental Systems Research Institute (ESRI), Inc.digital base maps, various resolutions. Albers equal area projection, North American Datum of 1983 (NAD 83).
A B C
Area of detailin B and C
0 300 MILES
0 300 KILOMETERS
0 100 MILES
0 100 KILOMETERS
0 100 MILES
0 100 KILOMETERS
86°
84°
88°
90°
92°94°96°100° 98°
48°46°44°
42°
40°
38°88°
90°
92°
94°44°
42°
40°
88°
90°
92°
94°44°
42°
40°
EXPLANATIONGeology
HighSlopes greater than
40 degrees, exaggerated to show detail
ModerateLow
Nuclear powerplant
Figure 17. Example of site assessment for Quad Cities nuclear powerplant site, Illinois. (A) Forty-five different lithologies mapped in analysis domains 1, 2, and 3 of Quad Cities powerplant site. Types were reduced to high, medium, and low categories, based on the potential to produce sand-sized sediment. Percentage of high sand producers in domains 1 and 2 was used to determine a sediment production ranking. More than 39 percent of the area contributing to Quad Cities powerplant site was categorized as high, giving a rank of 2 on a scale of 1–4. (B) Lithologies in the near-channel corridor were also categorized as high, medium, and low, based on the potential to provide a stable depositional environment preserving slackwater deposits. More than 60 percent of the near-channel corridor in domains 2 and 3 was mapped as high, giving rank of 3 on a scale of 1–4. (C) For the near-channel corridor within watershed domains 2 and 3, the total area of slopes greater than 40 degrees is about 18,530,154 square meters (m2). Dividing the area of steep slopes by the buffer area (12,423 square kilometers [km2]), produces a slope environment index of 1,491 m2/km2 and, thus, a slope ranking of 4 on a scale of 1–4.
Screening of Potential Riverine Paleoflood Study Sites 39
Table 4. Ranking criteria for paleoflood suitability screening.
[Abbreviations: m2/km2, meter squared per kilometer squared; >, greater than]
Item Metric Value Rank
Sand production Percentage of watershed domains 1 and 2 underlain by rock types producing abundant sand
0 to 25 percent 1>25 to 50 percent 2>50 to 75 percent 3>75 percent 4
Geologic environment Percentage of near-channel area in watershed domains 2 and 3 underlain by rock types likely to form ledges, caves, and overhangs facilitating preservation of stratigraphic records
0 to 25 percent 1>25 to 50 percent 2>50 to 75 percent 3>75 percent 4
Streamside slope Ratio of near-channel area in watershed domains 2 and 3 where slopes exceed 40 degrees, indexed as square meter of steep slope per square kilometer of near-channel area
0 to 10 m2/km2 1>10 to to 100 m2/km2 2>100 to 1,000 m2/km2 3>1,000 m2/km2 4
Four sites (Crystal River, Florida; Davis-Besse, Ohio; Duane Arnold Energy Center, Iowa; and Kewaunee, Wisconsin) were ranked 4, with more than 75 percent of their near-channel areas composed of rock types possibly forming stable and protecting depositional sites (“Geologic environment” columns in table 3). Seventeen sites with between 25 and 75 percent of the near-channel area composed of appropriate rock types were ranked 2 or 3. Twenty-nine sites with less than 25 percent of their near-channel area in appropriate lithologies were ranked 1 (table 3).
Valley Confinement and StabilitySite physiography and stability are related to the geologic
environment of potential depositional sites. Valley bottoms confined vertically and laterally by resistant rock are more likely to preserve deposits, to have greater changes in flow stage with discharge, and to have stable channel geometry for hundreds to thousands of years. As described in the section, “Quantitative Paleoflood Hydrology,” these qualities preserve longer records and produce better discharge estimates for a deposit sequence.
We assessed valley stability and confinement in potential study reaches from the distribution of terrain slope values in the near-channel corridors of watershed domains 2 and 3—the same area evaluated for depositional site geology. In particular, we assessed the area of slopes greater than 40 degrees (0.84 m/m). Areas this steep are likely to be
resistant rock types, confining the channel and providing stable areas for slackwater sediment deposition and preservation.
To define these areas, we downloaded 10-m resolution digital elevation models from the National Map (table 2) for areas covering watershed analysis domains 2 and 3 for all plants (table 2). We mosaicked contiguous rasters of these data and used Spatial Analyst in ArcGIS™ to create slope rasters (in degrees). These slope rasters were reclassified to create polygons with slopes greater than 40 degrees. The slope polygons were intersected with the near-channel corridors to give locations and total area of slopes greater than 40 degrees (fig. 17). The area of slopes greater than 40 degrees then was divided by the total near-channel analysis corridors to produce an index ratio (in square meter per square kilometer) of the steep terrain within the near-channel corridor. The index values were categorized and ranked 1–4, as was done for the other assessment measurements (table 4).
Five sites have more than 1,000 m2 of steep slopes per square kilometer of analysis area, and are ranked 4 (“Streamside slope” columns in table 3). These sites are Beaver Valley and Susquehanna, Pennsylvania; Diablo Canyon, California; Prairie Island, Minnesota; and Quad Cities, Illinois (fig. 17). Eighteen sites have less than 10 m2 of steep slopes per square kilometer of analysis area (0.001 percent), and are ranked 1. The remaining 27 sites have 10–1,000 m2 of steep slopes per square kilometer and are ranked 2 and 3 (table 3).
40 Assessing Inundation Hazards to Nuclear Powerplant Sites Using Histories of Riverine Floods, Tsunamis, and Storm Surges
Summary RankingWatershed sand production, river corridor geologic
environment, and river corridor slope are the major physical factors (categories) that were considered together to assess the suitability of a river reach for paleoflood studies. Our summary ranking is based on simple addition of the 1–4 ratings for each of these three categories. All categories are weighted equally. For the 50 assessed sites—excluding the 14 with no major streams to produce riverine flood hazard—the totals range from 3 to 9 out of a possible total of 12 (fig. 18; table 5). The average total is 5.7, and the median and modal values are 6, which is the total for 20 sites. Two sites— Prairie Island, Minnesota, and Quad Cities, Illinois, on the Mississippi River—have the overall highest value of 9. The Davis-Besse site on the Toussaint River has a value of 8. Twelve sites have totals of 7, including 2 sites each on the Tennessee and Catawaba Rivers. In the absence of additional information, the 15 sites with totals of 7 and greater probably are the strongest candidates for successful paleoflood assessments.
Although this broad-scale analysis indicates overall site conditions and the likelihood of successful paleoflood investigations, it is only a first step toward prioritizing more detailed investigations. Local conditions are critically important and can only be evaluated by a more detailed map, photograph, and field analysis. Moreover, this assessment does not necessarily account for all factors affecting the formation and preservation of stratigraphic records. Therefore, a low ranking here does not preclude the possibility of informative paleoflood records.
Other Factors
The coarse screening focuses on the potential for stratigraphic records to give better flood-frequency information for determining hazards of riverine inundation. Implicit in this assessment is that the stratigraphic record is relevant to current conditions, and that it accounts for all factors producing extreme riverine floods. Two relevant factors not accounted for in this analysis are (1) modern impoundments regulating flood flows at nuclear powerplant sites as well as posing a hazard from dam-failure floods; and (2) landslide dams that form and breach upstream, causing downstream floods, or form downstream, inundating sites upstream with impounded water. Each of these factors has been analyzed using broad-scale digitally available information. Although these two factors are not inputs to our quantitative screening analysis, they may be relevant in choosing sites or regions for detailed study and are noted in table 5.
Constructed DamsBy storing water, constructed dams affect river flow.
A main purpose of such dams commonly is to reduce flood peaks. For rivers with many or large flood-control structures, the frequency and duration of flooding is changed substantially. In these situations, paleoflood studies, which almost always give records of flooding prior to substantial flow regulation, may not provide insight into current flood frequency. However, with reduced frequency of peak floods under a flow-management regime, frequency and duration data still could be informative for downstream hazards from high flows passing over the top of or through the spillway of dams. Constructed dams also pose a hazard to downstream sites. Failures are rare, but produce exceptional floods (O’Connor and others, 2013).
To examine this factor, we determined the number of large dams in watershed domain 2 for each nuclear powerplant site (the 50 percent of the drainage basin immediately upstream). We determined that dams in this area are most likely to affect flood frequency at the plant site. Dam failures in this area also pose the greatest risk for large outburst floods because outburst floods commonly attenuate rapidly downstream.
The U.S. Army Corps of Engineers National Inventory of Dams (table 2) catalogs nearly 80,000 dams in the United States. Within this inventory are 8,121 “major dams”—dams more than 15.24 m (50 ft) high, with a normal storage capacity exceeding 6.2 million m3 (5,000 acre-ft), or a maximum storage capacity of more than 31 million m3 (25,000 acre-ft). The locations of these major dams, as given in the database, were intersected with watershed area 2 of each plant site.
The number of major dams in analysis domain 2 of the plant sites ranges from 0 for several sites to 951 for the Waterford site on the Mississippi River in Louisiana. For the plant sites ranking high (scores of 7 and above) in the paleoflood suitability analysis, the number of major dams ranges from 0 (Diablo Canyon, California, and Davis-Besse, Ohio) to 127 (Quad Cities, Illinois) (table 3). For the sites with few major dams, successful paleoflood studies are more likely to provide flood-frequency information relevant to the current riverine flood hazard. For sites with many large upstream dams, the relevance of paleoflood studies is ambiguous without additional investigation of how flow regulation affects the site. In situations of many upstream dams, however, paleoflood studies might be valuable in assessing dam safety, which is pertinent to the potential of dam-failure outburst floods or the potential for floods to overtop the dam.
Screening of Potential Riverine Paleoflood Study Sites 41
Base maps modified from Environmental Systems Research Institute, Inc. (ESRI) digital base maps, various resolutions. Albers equal area projection, North American Datum of 1983 (NAD 83).
70°80°90°100°110°130° 120°50°
40°
30°
0 400 800 MILES0 400 800 KILOMETERS
Prairie Island,Minnesota, and Quad Cities, Illinois,Mississippi River
Nuclear powerplant rank9
76Less than or equal to 5
8
EXPLANATION
Figure 18. Summed rankings for and spatial distribution of each nuclear powerplant site analyzed for suitability as paleoflood study site.
42 Assessing Inundation Hazards to Nuclear Powerplant Sites Using Histories of Riverine Floods, Tsunamis, and Storm Surges
Table 5. Summary of geologic and slope environment rankings of paleoflood sites analyzed for suitability as paleoflood study sites.
[Comments in boldface type indicate key factors in flood hazard assessment and paleoflood site suitability. See table 1 for powerplant location. Abbreviations: NHD, National Hydrography Dataset; FEMA, Federal Emergency Management Agency; GNIS, Geographic Names Information System]
SiteClosest NHD stream
(or water body)Summary
rankSummary comments regarding
paleoflood site suitability
Arkansas Nuclear Arkansas River 6 Potential; many dams, some upstream landslide potential
Beaver Valley Ohio River 7 High potential; in 0.01 FEMA floodplain; many upstream dams
Braidwood Mazon and West Fork Mazon Rivers 3 Low potential geologic setting
Browns Ferry Tennessee River 5 Low potential geologic setting; high landslide potential
Brunswick Cape Fear River 4 Low potential geologic setting
Byron Rock River 6 Potential, few dams, some downstream landslide potential
Callaway Missouri River 6 Potential; many upstream dams, some landslide potential
Catawba Catawba and Wateree Rivers 7 High potential, some upstream dams, high upstream landslide potential, relevant to McGuire site
Clinton Salt Creek 4 Low potential geologic setting
Columbia Generating Station Columbia River 4 Low potential geologic setting, many upstream dams, some downstream landslide potential
Comanche Peak Squaw Creek 7 High potential, small drainage, few upstream dams
Cooper Missouri River 6 Potential; many dams, some upstream landslide potential
Crystal River Withlacoochee River 7 High potential, in 0.01 FEMA floodplain, few upstream dams
Davis-Besse Toussaint River 8 High potential, no upstream major dams
Diablo Canyon No GNIS name (Diablo Canyon) 7 Not on major river, but high potential geologic setting and high landslide potential, within FEMA “V” floodplain
Dresden Illinois and Des Plaines Rivers 6 Potential; few dams, some downstream landslide potential
Duane Arnold Cedar River 7 High potential, few upstream dams
Farley Chattahoochee River 6 Potential, some upstream dams
Fermi 2 Swan Creek 5 Low potential geologic setting
Fort Calhoun Missouri River 6 Potential; in 0.01 FEMA floodplain; many upstream dams
Ginna Mill and Deer Creeks 3 No or little likely potential or utility
Grand Gulf Mississippi River 6 Potential; many upstream dams, some landslide potential
Hatch Oconee and Altamaha Rivers 6 Potential; some upstream dams, some upstream landslide hazard
Hope Creek Delaware River 6 Potential, in 0.002 FEMA floodplain, many upstream dams, relevant to Salem site
Indian Point Hudson River 5 Low potential geologic setting
Kewaunee 2 small unnamed 6 No or little likely utility
Screening of Potential Riverine Paleoflood Study Sites 43
Table 5. Summary of geologic and slope environment rankings of paleoflood sites analyzed for suitability as paleoflood study sites.—Continued
[Comments in boldface type indicate key factors in flood hazard assessment and paleoflood site suitability. See table 1 for powerplant location. Abbreviations: NHD, National Hydrography Dataset; FEMA, Federal Emergency Management Agency; GNIS, Geographic Names Information System]
SiteClosest NHD stream
(or water body)Summary
rankSummary comments regarding
paleoflood site suitability
La Salle Illinois and Des Plaines Rivers 6 Potential, some upstream dams, some downstream landslide potential
Limerick Schuylkill River 6 Potential, some upstream dams
McGuire Catawba River 7 High potential, some upstream dams, high upstream landslide potential, relevant to Catawba site
Monticello Mississippi River 6 Potential, many upstream dams
North Anna North Anna River and Pamunkey Creek 4 Low potential geologic setting, some landslide potential
Oconee Seneca River 6 Potential; some upstream dams, high landslide potential
Oyster Creek Oyster Creek 3 No or little likely utility
Palisades Brandywine Creek 3 Very low potential geologic setting
Prairie Island Mississippi River 9 High potential; in 0.002 FEMA floodplain
Quad Cities Mississippi River 9 High potential, many upstream dams, relevant to five other Mississippi plant sites, near FEMA floodplain
River Bend Mississippi River 6 Potential; many upstream dams, some landslide potential
Robinson Black Creek 3 Very low potential geologic setting
Salem Delaware River 6 Potential; many dams, relevant to Hope Creek site
Sequoyah Tennessee River 7 High potential, many upstream dams, high upstream landslide potential
Shearon Harris White Oak, Thomas, and Creeks 3 Low potential geologic setting
Summer Saluda and Conagree Rivers 7 High potential, some upstream dams, high landslide potential
Surry James River 5 Low potential geologic setting
Susquehanna Susquehanna River 7 High potential, many upstream dams, high downstream landslide potential, relevant to Three Mile Island site
Three Mile Island Susquehanna River 6 Potential; may upstream dams; high landslide potential, relevant to Susquehanna site
Vermont Yankee Connecticut River 6 Potential; many dams, some upstream and downstream landslide potential
Vogtle Savannah River 7 High potential, some upstream dams
Waterford Mississippi River 6 Potential, in FEMA 0.01 floodplain, many upstream dams, some upstream and downstreamlandslide potential
Watts Bar Tennessee River 7 High potential, many upstream dams, high landslide potential, relevant to Browns Ferry site
Wolf Creek Wolf Creek 3 Low geologic potential
44 Assessing Inundation Hazards to Nuclear Powerplant Sites Using Histories of Riverine Floods, Tsunamis, and Storm Surges
LandslidesNatural dams also pose riverine flood hazards to critical
facilities. Downstream impoundments can drown sites, and upstream impoundments may breach catastrophically, producing outburst floods (Costa and Schuster, 1988; O’Connor and others, 2013). Although the risk for most locations likely is small, landslide dams are the most likely natural dams to affect rivers near U.S. nuclear power plants. Few if any power-plant sites are on rivers subject other types of hazardous natural dams, such as glacier or volcanic dams. Landslides have blocked U.S. rivers over the last several centuries, exemplified by at least two landslide dams impounding the Columbia River in the last 600 years, including the historical short-lived blockage in 1872 (Madole and others, 1995). The Bonneville landslide, blocking the Columbia 90 m high in about A.D. 1450, breached catastrophically, probably producing the largest flood of the last 2,000 years on the lower Columbia River (O’Connor and Burns, 2009).
Specific assessment of hazards from landslide dams requires site investigation, but we broadly assessed the possibility of landslide dams from the USGS national map of landslide incidence and susceptibility (Radbruch-Hall and others, 1982; table 2). The separately delineated areas of high landslide incidence and high susceptibility shown in this map were combined into an overall high landslide-hazard category. This combined area was intersected with analysis domains 2 and 3 for each powerplant site to determine the percentage area of high landslide hazard (table 4). This designation of “high hazard,” however, is relative to the moderate and low classifications and, according to the original mapping (Radbruch-Hall and others, 1982), indicates that 15 percent or more of the high-hazard area shows evidence of involvement in landslides or is deemed susceptible to landsliding. Quantifying the risk of landslide dams affecting plant sites is not possible with this information alone, but paleoflood studies in areas deemed susceptible may provide evidence of past blockages and outburst floods (for example, O’Connor and others, 2003).
Most plant sites have minimal areas of high landslide hazard in either analysis domain 2 or 3. Of the 64 sites, 47 sites have less than 10 percent of analysis domain 2 classified as having a high landslide hazard. Similarly, 34 of the 46 sites with substantial downstream watersheds have less than 10 percent of analysis domain 3 classified as having a high landslide hazard. Nevertheless, a few plant sites may have substantial hazards from landslides, both upstream and downstream. The Oconee site in South Carolina has all of analysis domains 2 and 3 categorized as having a high landslide hazard. Diablo Canyon, California, and Beaver Valley, Pennsylvania, both have high landslide hazard in 70 percent of area 2. Three Mile Island, Sequoyah, McGuire, Watts Bar, and Seabrook all have a high landslide hazard in about 60 percent of their upstream areas. In addition to the Oconee site, Beaver Valley and Susquehanna, also in
Pennsylvania, are the only plant sites for which more than 50 percent of analysis domain 3, downstream of the plant site, is categorized as a high landslide area. Nearly all of these sites rank high in the paleoflood suitability screening; only Oconee, Three Mile Island, and Seabrook (which has no riverine hazard) have summed suitability scores of less than 7.
Overall Screening Results
The paleoflood suitability assessment, combined with our assessment of other factors, helps target plant sites for which paleoflood studies are likely to be successful and relevant to riverine flood hazards. Nevertheless, complicating factors, such as upstream flow regulation, challenge simple ranking of sites likely to yield pertinent assessments of the magnitude and frequency of rare floods. Taking all information into consideration, we conclude from the screening that:
• Three sites have high geologic potential and no or few upstream dams that might complicate flood-frequency analysis: (1) Crystal River, Florida, on the Withlacoochee River; (2) Duane Arnold, Iowa, on the Cedar River; and (3) Davis-Besse, Ohio, on the Toussaint River.
• A Mississippi River paleoflood analysis would be applicable to multiple plant sites. Both the Quad Cities and Prairie Island sites have very suitable geologic conditions. Analyses on the Mississippi River are complicated by the extensive flow regulation of the river system. Nevertheless, paleoflood analyses on the Mississippi River would be applicable to a broad spectrum of flood hazards in addition to those specific to nuclear plant operations.
• Other high-suitability sites applicable to multiple plants include Susquehanna, Susquehanna River, Pennsylvania; Watts Bar, Tennessee River, Tennessee; and Catawba, Catawba and Wateree Rivers, South Carolina. The Cooper and Callaway sites, both on the Missouri River, also have potential for successful paleoflood analyses.
• Some high-potential sites also may be subject to backwater inundation or outburst floods from landslide dams. Paleoflood analyses and geologic investigations in these areas could assess the potential and past history of landslide dams. These high-potential sites include the Susquehanna River sites, the Tennessee River sites, the Catawba River sites, and the Summer site on the Saluda and Conagree Rivers, South Carolina.
• Although the Diablo Canyon site is not threatened by a large river, the overall paleoflood suitability appears high. The small unnamed drainage within Diablo Canyon has high landslide potential and possibly could pose meteorological flood hazards from small flash floods in the steep basin.
Summary 45
Future Studies
This review and screening provides background information on geologic approaches for assessing inundation hazards, and provides a screening aimed at assisting prioritization of more detailed studies of riverine flood hazards. Two future directions may be useful: (1) Doing a similar screening—perhaps combined—for storm-surge and tsunami hazards; and (2) conducting targeted, in-depth scoping and feasibility analyses for paleoflood studies on the basis of the screening results presented here.
Coarse Screening for Tsunami and Storm Surge
A screening for tsunami and storm-surge studies, similar to the screening reported here for riverine flooding, could identify sites for which tsunami and storm-surge studies could be useful. Moore and Jaffe (2007) have addressed some components of such a study for tsunamis in a report to the Nuclear Regulatory Commission. Because the issues and locations overlap substantially, it would probably be efficient to conduct a single screening for both types of hazards.
A coastal-hazard screening on the Atlantic and Gulf Coasts might involve several tasks:
• Review regional evidence for Holocene and modern inundation by tsunamis and storm surges.
• Assess geologic potential for retaining sediment deposits near nuclear power plants.
• Review non-stationarity factors that may affect storm-surge hazards, including the effects of climate change and sea-level rise.
• Compare the site-specific sources of potential inundation, including riverine floods as well as tsunamis and storm surges.
• Identify approaches and locations for field studies.
Paleoflood Scoping and Feasibility Analysis
The screening for paleoflood suitability indicates several nuclear powerplant sites for which paleoflood analyses may increase knowledge of riverine inundation hazards. However, without closer investigation of site-specific conditions, this screening probably is not a reasonable basis for launching comprehensive studies. A phased approach may be most efficient. As in past USGS paleoflood studies in South Dakota (Harden and others, 2011), this approach could entail a scoping and feasibility analysis, possibly justifying a comprehensive study.
A scoping and feasibility analysis could include the following activities:
• Evaluate previous flood hazard assessments, including local or regional paleoflood studies.
• Assess possible issues affecting the relevance of a paleoflood study, such as existing flood control, land-use changes, and potential for climate change to affect flood frequency.
• Assess local site and river conditions, including field evaluation of stratigraphic records and channel and valley conditions. This activity could include preliminary stratigraphic analysis and geochronology to assess available geologic records.
• Determine other information needs (and their costs) for a full paleoflood analysis, including estimating the number of sites for analysis, the number and type of geochronology samples, site access, archeological and historical resource considerations for compliance with the National Historic Preservation Act, and hydraulic modeling needs (type and scope) and required and available supporting topographic data.
If done thoroughly, these activities should yield sufficient information to develop an accurate cost estimate for a comprehensive paleoflood study, as well as a basis for determining if such a study was likely to significantly increase knowledge of the magnitude and frequency of rare floods.
A first-phase analysis could be conducted for individual plant sites—strong candidate sites emerging from the screening analysis are Crystal River, Florida; Duane Arnold, Iowa; and Davis-Besse, Ohio. However, the screening analysis also indicates regional analyses may be an efficient means for assessing hazards for multiple sites. In particular, the upper Mississippi River Basin and the Appalachian region of the Southeastern United States are both areas for which geologic and physiographic conditions may lead to informative paleoflood analyses pertinent to multiple nuclear power plants as well as other critical structures.
SummaryGeologic records can extend knowledge of rare
hazards. This knowledge can aid in assessing the safety of critical structures such as dams and energy plants, for which even remotely possible hazards are pertinent. Quantitative analysis of inundation from geologic records perhaps is most developed for and applied to riverine flood hazards, but because of recent natural disasters, geologic investigations also are now used widely for understanding tsunami hazards and coastal storm surges.
Layered sedimentary deposits commonly give the most complete geologic record of large floods, storm surges, and tsunamis. Sedimentary layers may be preserved for hundreds or thousands of years in suitable depositional environments, thereby providing an archive of rare, high-magnitude events.
46 Assessing Inundation Hazards to Nuclear Powerplant Sites Using Histories of Riverine Floods, Tsunamis, and Storm Surges
All inundation hazards discussed in this report—riverine floods, tsunamis, and storm surges—have had long records extracted from sedimentary sequences in many different environments, many specifically for hazard assessment.
Stratigraphy provides evidence of the occurrence of past floods, tsunamis, and storm surges, but other techniques are required to establish the timing and magnitude—information critical to quantitatively assessing risk. Common approaches for determining the age of past events include radiocarbon and optically stimulated luminescence dating. In places, event horizons such as tephra falls or other distinct layers, flora or fauna remains, or geochemical conditions of known age also can provide age information. Determining event magnitude commonly requires determining the elevation of deposits relative to an estimate of channel or sea-level conditions at the time of the event. One- and two-dimensional hydraulic modeling commonly is applied to determine approximate discharges of past riverine floods.
Geologic records commonly are imprecise, so most hazard assessments benefit from evaluation of many sites and rigorous uncertainty assessment. Despite uncertainties, geologic records commonly can improve knowledge of the types and magnitudes of hazards threatening specific sites or regions. New statistical tools and approaches, such as the Expected Moments Algorithm, PeakFQ, and FLDFRQ3, can efficiently incorporate geologic information into frequency assessments. These tools are most developed for riverine flood hazards, but are to some degree transferable to other episodic natural phenomena such as tsunamis and storm surges.
Even with these efficient statistical approaches for examining geologic records, systematic landscape changes may reduce the applicability of retrospective assessments. All these non-stationarity issues (such as climate change, sea-level rise, land use, dams, and flow regulation) may affect the validity of using past experience—no matter how complete the record—to assess future likelihoods. These issues require site-specific consideration for nearly all hazard assessments drawn from geologic evidence.
A screening of the 104 nuclear powerplants in the United States licensed by the Nuclear Regulatory Commission (at 64 sites) indicates several sites for which paleoflood studies likely would provide additional flood-frequency information. Two sites—Duane Arnold, Iowa, on the Cedar River; and Davis-Besse, Ohio, on the Toussaint River—have geologic conditions suitable for creating and preserving stratigraphic records of flooding and few upstream dams that may complicate flood-frequency analysis. One site—Crystal River, Florida, on the Withlacoochee River and only 4 kilometers from the coast—has high potential as a candidate for assessing riverine and marine inundation hazards. Several sites on the Mississippi River have high geologic potential, but upstream dams almost certainly now regulate peak flows. Nevertheless, studies on the Mississippi River to evaluate long-term flood frequency may provide results applicable to a wide spectrum of regional hazard issues. Several sites in the southeastern
United States have high geologic potential, and studies at these sites also may be helpful in evaluating hazards from outburst floods from landslide dams (river blockages formed by mass movements), which may be a regional hazard. For all these sites, closer investigation and field reconnaissance would be needed to confirm suitable deposits and settings for a complete paleoflood analysis. Similar screenings may help identify sites for geologic investigations and would improve assessment of tsunami and storm-surge hazards.
Author Roles and AcknowledgmentsThis report is a coordinated effort of several topical
experts. Brian F. Atwater contributed the material on tsunamis, Thomas M. Cronin and Christopher G. Smith provided the material on storm surges, and Jim E. O’Connor provided the material on riverine flooding. Timothy A. Cohn contributed the material on statistical approaches and issues for quantitative paleoflood analysis. Mackenzie K. Keith and Jim E. O’Connor did the paleoflood study suitability assessment, assisted by National Association of Geology Teachers intern Tiffany Napier. Robert R. Mason assisted with project scoping and oversight. Jim E. O’Connor and Mackenzie Keith compiled the report; all authors contributed to final editing. Jeanne Godaire (Bureau of Reclamation) and Bruce Jaffe (U.S. Geological Survey) provided reviews. This work was funded by the Nuclear Regulatory Commission (project V6306), with Joseph Kanney acting as the Commission project manager.
References Cited
Abadie, S.M., Harris, J.C., Grilli, S.T., and Fabre, R., 2012, Numerical modeling of tsunami waves generated by the flank collapse of the Cumbre Vieja Volcano (La Palma, Canary Islands)—Tsunami source and near field effects: Journal of Geophysical Research, v. 117, p. C05030.
Abe, H., Sugeno, Y., and Chigama, A., 1990, Estimation of the height of the Sanriku Jogan 11 earthquake-tsunami (A.D. 869) in the Sendai Plain: Zisin [Earthquakes], v. 43, p. 513–525.
Abe, T., Goto, K., and Sugawara, D., 2012, Relationship between the maximum extent of tsunami sand and the inundation limit of the 2011 Tohoku-oki tsunami on the Sendai Plain, Japan: Sedimentary Geology, v. 282, p. 142–150, doi:10.1016/j.sedgeo.2012.05.004.
Aitken, M.J., 1998, An introduction to optical dating—The dating of Quaternary sediments by the use of photon-stimulated luminescence: Oxford, United Kingdom, Oxford University Press, 280 p.
References Cited 47
Apotsos, A., Buckley, M., Gelfenbaum, G., Jaffe, B., and Vatvani, D., 2011a, Nearshore tsunami inundation model validation—Toward sediment transport applications: Pure and Applied Geophysics, v. 168, no. 11, p. 2,097–2,119, doi:10.1007/s00024-011-0291-5.
Apotsos, A., Gelfenbaum, G., Jaffe, B., Watt, S., Peck, B., Buckley, M., and Stevens, A., 2011b, Tsunami inundation and sediment transport in a sediment-limited embayment on American Samoa—The 2009 South Pacific tsunami: Earth-Science Reviews, v. 107, nos. 1–2, p. 1–11.
Arnold, L.J., Roberts, R.G., Galbraith, R.F., and Delong, S.B., 2009, A revised burial dose estimation procedure for optical dating of young and modern-age sediments: Quaternary Geochronology, v. 4, p. 306–325.
Atwater, B.F., Carson, B., Griggs, G.B., Johnson, H.P., and Salmi, M.S., 2014, Rethinking turbidite paleoseismology along the Cascadia subduction zone: Geology, v. 42, p. 827–830.
Atwater, B.F., and Griggs, G.B., 2012, Deep-sea turbidites as guides to Holocene earthquake history at the Cascadia Subduction Zone—Alternative views for a seismic-hazard workshop: U.S. Geological Survey Open-File Report 2012–1043, 58 p.
Atwater, B.F., and Hemphill-Haley, E., 1997, Recurrence intervals for great earthquakes of the past 3,500 years at northeastern Willapa Bay, Washington: U.S. Geological Survey Professional Paper 1576, 108 p., http://pubs.usgs.gov/pp/1576/report.pdf.
Atwater, B.F., Musumi-Rokkaku, S., Satake, K., Tsuji, Y., Ueda, K., and Yamaguchi, D.K., 2005, The orphan tsunami of 1700—Japanese clues to a parent earthquake in North America: U.S. Geological Survey Professional Paper 1707, 133 p.
Atwater, B.F., Nelson, A.R., Clague, J.J., Carver, G.A., Yamaguchi, D.K., Bobrowsky, P.T., Bourgeois, J., Darienzo, M.E., Grant, W.C., Hemphill-Haley, E., Kelsey, H.M., Jacoby, G.C., Nishenko, S.P., Palmer, S.P., Peterson, C.D., and Reinhart, M.A., 1995, Summary of coastal geologic evidence for past great earthquakes at the Cascadia subduction zone: Earthquake Spectra, v. 11, no. 1, p. 1–18.
Atwater, B.F., ten Brink, U.S., Buckley, M., Halley, R.B., Jaffe, B.E., Lopez-Venegas, A.M., Reinhardt, E.G., Tuttle, M.P., Watt, S., and Wei, Y., 2012a, Geomorphic and stratigraphic evidence for an unusual tsunami or storm a few centuries ago at Anegada, British Virgin Islands: Natural Hazards, v. 63, no. 1, p. 51–84.
Atwater, B.F., ten Brink, U.S., Feuillet, N., Fuentes Figueroa, Z., Halley, R.B., Tuttle, M.P., Wei, Y., and Weil Accardo, J., 2012b, Geologic evidence for a medieval tsunami with an eastern source along the Puerto Rico Trench: American Geophysical Union 2012 Fall Meeting abstract T41A–2566.
Atwater, B.F., Yamaguchi, D.K., Bondevik, S., Barnhardt, W.A., Amidon, L.J., Benson, B.E., Skjerdal, G., Shulene, J.A., and Nanayama, F., 2001, Rapid resetting of an estuarine recorder of the 1964 Alaska earthquake: Geological Society of America Bulletin, v. 113, no. 9, p. 1,193–1,204.
Autorité de Sûreté Nucléaire, 2010, Fifth National Report for the 2011 Peer Review Meeting: French national report to the Convention on Nuclear Safety, Paris, France, 233 p., http://www.french-nuclear-safety.fr/International/International-reference-texts/International-conventions/Convention-on-Nuclear-Safety-CNS.
Baines, G.B.K., and McLean, R.F., 1976, Sequential studies of hurricane deposit evolution at Funafuti atoll: Marine Geology, v. 21, no. 1, p. M1–M8.
Baker, V.R., 1987, Paleoflood hydrology and extraordinary flood events: Journal of Hydrology, v. 96, nos. 1–4, p. 79–99.
Baker, V.R., 2008, Paleoflood hydrology—Origin, progress, prospects: Geomorphology, v. 101, nos. 1–2, p. 1–13.
Baker, V.R., and Kochel, R.C., 1988, Flood sedimentation in bedrock fluvial systems, in Baker, V.R., Kochel, R.C., and Patton, P.C., eds., Flood geomorphology: New York, Wiley, p. 123–137.
Baker, V.R., Webb, R.H., and House, P.K., 2002, The scientific and societal value of paleoflood hydrology, in House, P.K., Webb, R.H., Baker, V.R., and Levish, D.R., eds., Ancient floods, modern hazards—Principles and applications of paleoflood hydrology: Washington, D.C., American Geophysical Union, Water Science and Application Series, v. 5, p. 127–146.
Ballarini, M., Wallinga, J., Murray, A.S., Van Heteren, S., Oost, A.P., Bos, A.J.J., and Van Eijk, C.W.E., 2003, Optical dating of young coastal dunes on a decadal time scale: Quaternary Science Reviews, v. 22, nos. 10–13, p. 1,011–1,017.
Barkan, R., ten Brink, U.S., and Lin, J., 2009, Far field tsunami simulations of the 1755 Lisbon earthquake—Implications for tsunami hazard to the U.S. East Coast and the Caribbean: Marine Geology, v. 264, nos. 1–2, p. 109–122.
48 Assessing Inundation Hazards to Nuclear Powerplant Sites Using Histories of Riverine Floods, Tsunamis, and Storm Surges
Bates, P.D., and De Roo, A.P.J., 2000, A simple raster based model for flood inundation simulation: Journal of Hydrology, v. 236, p. 54–77.
Bauer, T.R., and Klinger, R.E., 2010, Evaluation of paleoflood peak discharge estimates in hydrologic hazard studies: Bureau of Reclamation Dam Safety Technology Development Program, Denver, Report DSO-11-03, 19 p.
Beget, J., Gardner, C., and Davis, K., 2008, Volcanic tsunamis and prehistoric cultural transitions in Cook Inlet, Alaska: Journal of Volcanology and Geothermal Research, v. 176, no. 3, p. 377–386.
Benito, G., and O’Connor, J.E., 2013, Quanitative paleflood hydrology, Wohl, E.E., ed., in Shroder, J., ed. in chief, Treatise on geomorphology, Volume 9—Fluvial geomorphology: San Diego, Academic Press, p. 459–474.
Benito, G., Sopeña, A., Sánchez-Moya, Y., Machado, M.a.J., and Pérez-González, A., 2003, Palaeoflood record of the Tagus River (central Spain) during the Late Pleistocene and Holocene: Quaternary Science Reviews, v. 22, nos. 15–17, p. 1,737–1,756.
Benito, G., and Thorndycraft, V.R., 2005, Palaeoflood hydrology and its role in applied hydrological sciences: Journal of Hydrology, v. 313, nos. 1–2, p. 3–15.
Bianchi, T.S., and Allison, M.A., 2009, Large-river delta-front estuaries as natural “recorders” of global environmental change: Proceedings of the National Academy of Sciences, v. 106, p. 8,085–8,092.
Blainey, J.B., Webb, R.H., Moss, M.E., and Baker, V.R., 2002, Bias and information content of paleoflood data in flood-frequency analysis, in House, P.K., Webb, R.H., Baker, V.R., and Levish, D.R., eds., Ancient floods, modern hazards—Principles and applications of paleoflood hydrology: Washington, D.C., American Geophysical Union, p. 161–174.
Blong, R.J., and Gillespie, R., 1978, Fluvially transported charcoal gives erroneous 14C ages for recent deposits: Nature, v. 271, no. 5647, p. 739–741.
Bondevik, S., Lovholt, F., Harbitz, C.B., Mangerud, J., Dawson, A., and Svendsen, J.I., 2005b, The Storegga Slide tsunami—Comparing field observations with numerical simulations, in Solheim, A., Byrn, P., Berg, K., and Mienert, J, eds, Ormen Lange—An integrated study for the safe development of a deep-water gas field within the Storegga Slide Complex, NE Atlantic continental margin: Marine and Petroleum Geology, v. 22, nos. 1–2, p. 195–208, doi:10.1016/j.marpetgeo.2004.10.003.
Bondevik, S., Mangerud, J., Dawson, S., Dawson, A., and Lohne, O., 2003, Record-breaking height for 8000-year-old tsunami in the North Atlantic: Eos, Transactions, American Geophysical Union, v. 84, no. 31, p. 289, 293.
Bondevik, S., Mangerud, J., Dawson, S., Dawson, A., and Lohne, O., 2005a, Evidence for three North Sea tsunamis at the Shetland Islands between 8000 and 1500 years ago: Quaternary Science Reviews, v. 24, nos. 14–15, p. 1,757–1,775, doi:10.1016/j.quascirev.2004.10.018.
Bondevik, S., Svendsen, J.I., and Mangerud, J., 1997, Tsunami sedimentary facies deposited by the Storegga tsunami in shallow marine basins and coastal lakes, western Norway: Sedimentology, v. 44, no. 6, p. 1,115–1,131.
Bøtter-Jensen, L., Bulur, E., Duller, G.A.T., and Murray, A.S., 2000, Advances in luminescence instrument systems: Radiation Measurements, v. 32, nos. 5–6, p. 523–528.
Bourgeois, J., 2009, The geologic effects and records of tsunamis, in Bernard, E.N. and Robinson, A.R., eds., The sea, Volume 15—Tsunamis: Cambridge, Massachusetts, Harvard University Press, p. 55–91.
Brewster-Wingard, G.L., and Ishman, S.E., 1999, Historical trends in salinity and substrate in central Florida Bay—A paleoecological reconstruction using modern analogue data: Estuaries, v. 22, p. 369–383.
Buckley, M., Wei, Y., Jaffe, B., and Watt, S., 2012, Inverse modeling of velocities and inferred cause of overwash that emplaced inland fields of boulders at Anegada, British Virgin Islands: Natural Hazards, v. 63, no. 1, p. 133–149, doi:10.1007/s11069-011-9725-8.
Bureau of Reclamation, 2002, Flood hazard analysis—Folsom Dam, Central Valley Project, California: Bureau of Reclamation, Denver, Colorado, 128 p. and 4 appendixes.
Cartwright, J.H.E., and Nakamura, H., 2009, What kind of a wave is Hokusai’s Great wave off Kanagawa?: Notes and Records of the Royal Society, v. 63, no. 2, p. 119–135.
Carver, G., and Plafker, G., 2008, Paleoseismicity and neotectonics of the Aleutian subduction zone—An overview, in Freymueller, J.T., Haeussler, P.J., Wesson, R., and Ekstrom, G., eds., Active tectonics and seismic potential of Alaska: American Geophysical Union Monograph 179, p. 43–64.
Chague-Goff, C., Goff, J., Nichol, S.L., Dudley, W., Zawadzki, A., Bennett, J.W., Mooney, S.D., Fierro, D., Heijnis, H., Dominey-Howes, D., and Courtney, C., 2012, Multi-proxy evidence for trans-Pacific tsunamis in the Hawai’ian Islands: Marine Geology, v. 299, p. 77–89, doi:10.1016/j.margeo.2011.12.010.
References Cited 49
Cheung, K.F., Tang, L., Donnelly, J.P., Scileppi, E.M., Liu, K., Mao, X., Houston, S.H., and Murnane, R.J., 2007, Numerical modeling and field evidence of coastal overwash in southern New England from Hurricane Bob and implications for paleotempestology: Journal of Geophysical Research-Earth Surface, v. 112, no. F3, p. F03024, doi:10.1029/2006JF000612.
Church, J.A., Clark, P.U., Cazenave, A., Gregory, J.M., Jevrejeva, S., Levermann, A., Merrifield, M.A., Milne, G.A., Nerem, R.S., Nunn, P.D., Payne, A.J., Pfeffer, W.T., Stammer, D., and Unnikrishnan, A.S., 2013, Sea level change, in Stocker, T.F., Qin, D., Plattner, G.K., Tignor, M., Allen, S.K., Boschung, J., Nauels, A., Xia, Y., Bex, V., and Midgley, P.M., eds., Climate change 2013—The physical science basis—Contribution of Working Group I to the Fifth Assessment Report of the Intergovernmental Panel on Climate Change: Cambridge, United Kingdom, Cambridge University Press, p. 1,137–1,216.
Church, J.A., and White, N.J., 2011, Sea-level rise from the late 19th to the early 21st century: Surveys in Geophysics, v. 32, p. 585–602.
Chow, V.T., 1959, Open-channel hydraulics: New York, McGraw-Hill, 680 p.
Cohn, T.A., Lane, W.L., and Baier, W.G., 1997, An algorithm for computing moments-based flood quantile estimates when historical flood information is available: Water Resources Research, v. 33, no. 9, p. 2,089–2,096.
Cohn, T.A., Lane, W.L., and Stedinger, J.R., 2001, Confidence intervals for expected moments algorithm flood quantile estimates: Water Resources Research, v. 37, no. 6, p. 1,695–1,706.
Cohn, T.A., and Stedinger, J.R., 1987, Use of historical information in a maximum-likelihood framework: Journal of Hydrology, v. 96, nos. 1–4, p. 215–223.
Collins, E.S., Scott, D.B., and Gayes, P.T., 1999, Hurricane records on the South Carolina coast—Can they be detected in the sediment record?: Quaternary International, v. 56, no. 1, p. 15–26.
Committee on the Review of the Tsunami Warning and Forecast System and Overview of the Nation’s Tsunami Preparedness, 2011, Tsunami warning and preparedness—An assessment of the U.S. tsunami program and the nation’s preparedness efforts: Washington, D.C., National Research Council, The National Academic Press, 296 p.
Costa, J.E., and Schuster, R.L., 1988, The formation and failure of natural dams: Geological Society of America Bulletin, v. 100, no. 7, p. 1,054–1,068.
Cox, D.C., 2001, The inappropriate tsunami icon: Science of Tsunami Hazards, v. 19, no. 2, p. 87–92.
Cox, R., Zentner, D.B., Kirchner, B.J., and Cook, M.S., 2012, Boulder ridges on the Aran Islands (Ireland)—Recent movements caused by storm waves, not tsunamis: The Journal of Geology, v. 120, no. 3, p. 249–272.
Cronin, T.M., 2012, Rapid sea-level rise: Quaternary Science Reviews, v. 56, p. 11–30.
Cronin, T.M., Dwyer, G.S., Kamiya, T., Schwede, S., and Willard, D.A., 2003, Medieval Warm Period, Little Ice Age and 20th century temperature variability from Chesapeake Bay: Global and Planetary Change, v. 36, p. 17–29.
Cronin, T.M., Hayo, K., Thunell, R.M., Dwyer, D.S., Saenger, C., and Willard, D.A., 2010, Medieval-Little Ice Age climate variability in Chesapeake Bay and the North Atlantic region: Palaeogeography, Palaeoclimatology, Palaeoecology, v. 297, p. 299–310.
Cronin, T.M., Thunell, R., Dwyer, G.S., Saenger, C., Mann, M.E., Vann, C.D., and Seal, R.R., II., 2005, Multiproxy evidence of Holocene climate variability from estuarine sediments, Eastern North America: Paleoceanography, v. 20, PA4006, 21 p.
Cronin, T.M., and Walker, H., 2006, Restoring coastal ecosystems and abrupt climate change: Climatic Change, v. 74, no. 4, p. 369–374.
Cronin, T.M., Willard, D., Karlsen, A., Ishman, S., Verardo, S., McGeehin, J., Kerhin, R., Holmes, C., and Zimmerman, A., 2000, Climatic variability in the eastern United States over the past millennium from Chesapeake Bay sediments: Geology, v. 28, p. 3–6.
Cronin, T.M., and Vann, C.D., 2003, The sedimentary record of anthropogenic and climatic influence on the Patuxent Estuary and Chesapeake Bay ecosystems: Estuaries, v. 26, no. 2A, p. 196–209.
Cunge, J.A., Holly F.M., and Verwey A., 1980, Practical aspects of computational river hydraulics: London, Pitman, 420 p.
Davis, R.A., Knowles, S.C., and Bland, M.J., 1989, Role of hurricanes in the Holocene stratigraphy of estuaries—Examples from the Gulf-Coast of Florida: Journal of Sedimentary Petrology, v. 59, p. 1,052–1,061.
Dawdy, D., Griffis, V., and Gupta, V., 2012, Regional flood-frequency analysis—How we got here and where we are going: Journal of Hydrologic Engineering, v. 17, no. 9, p. 953–959.
Dawson, A.G., Long, D., and Smith, D.E., 1988, The Storegga slides—Evidence from eastern Scotland for a possible tsunami: Marine Geology, v. 82, nos. 3–4, p. 271–276.
50 Assessing Inundation Hazards to Nuclear Powerplant Sites Using Histories of Riverine Floods, Tsunamis, and Storm Surges
Dempster, A.P., Laird, N. M., and Rubin, D.B., 1977, Maximum likelihood from incomplete data via the EM Algorithm: Journal of the Royal Statistical Society, Series B (Methodological), v. 39, no. 1, p. 1–38.
Denlinger, R.P., O’Connell, D.R.H., and House, P.K., 2002, Robust determination of stage and discharge—An example from an extreme flood on the Verde River, Arizona, in House, P.K., Webb, R.H., Baker, V.R., and Levish, D.R., eds., Ancient floods, modern hazards—Principles and applications of paleoflood hydrology: Washington, D.C., American Geophysical Union, Water Science and Application Series, v. 5, p. 127–146.
Dezileau, L., Sabatier, P., Blanchemanche, P., Joly, B., Swingedouw, D., Cassou, C., Castaings, J., Martinez, P., and Von Grafenstein, U., 2011, Intense storm activity during the Little Ice Age on the French Mediterranean coast: Palaeogeography, Palaeoclimatology, Palaeoecology, v. 299, nos. 1–2, p. 289–297.
Dolan, J.F., and Wald, D.J., 1998. The 1943–1953 north-central Caribbean earthquakes—Active tectonic setting, seismic hazards, and implications for Caribbean-North America plate motions, in Dolan, J.F. and Mann, P., eds., Active strike-slip and collisional tectonics of the northern Caribbean plate boundary zone: Geological Society of America Special Publication 326, p. 143–169.
Donnelly, J.P., 2005, Evidence of past intense tropical cyclones from backbarrier salt pond sediments—A case study from Isla de Culebrita, Puerto Rico, USA: Journal of Coastal Research, v. SI 42, p. 201–210.
Donnelly, J.P., Bryant, S.S., Butler, J., Dowling, J., Fan, L., Hausmann, N., Newby, P., Shuman, B., Stern, J., Westover, K., and Webb, T., III, 2001, 700 year sedimentary record of intense hurricane landfalls in southern New England: Bulletin of the Geological Society of America, v. 113, no. 6, p. 714–727.
Donnelly, J.P., Butler, J., Roll, S., Wengren, M., and Webb, T., III, 2004, A backbarrier overwash record of intense storms from Brigantine, New Jersey: Marine Geology, v. 210, nos. 1–4, p. 107–121, doi:10.1016/j.margeo.2004.05.005.
Donnelly, J.P., and Woodruff, J.D., 2007, Intense hurricane activity over the past 5,000 years controlled by El Niño and the West African monsoon: Nature, v. 447, p. 465–468, doi: 10.1038/nature05834.
Duller, G.A.T., 2004, Luminescence dating of quaternary sediments—Recent advances: Journal of Quaternary Science, v. 19, no. 2, p. 183–192.
Duller, G.A.T., and Murray, A.S., 2000, Luminescence dating of sediments using individual mineral grains: Geologos, v. 5, p. 88–106.
Dunbar, P.K., and Weaver, C.S., 2008, U.S. states and territories national tsunami hazard assessement—Historical record and sources for waves: Report prepared for National Tsunami Hazard Mitigation Program, p. 59–59.
Dury, G.H., 1973, Magnitude-frequency analysis and channel morphology, in Morisawa, M., ed., Fluvial Geomorphology: London, Allen and Unwin, p. 91–121.
Eaton, J.P., Richter, D.H., and Ault, W.U., 1961, The tsunami of May 23, 1960, on the Island of Hawaii: Bulletin of the Seismological Society of America, v. 51, p. 135–157.
Ely, L.L., and Baker, V.R., 1985, Reconstructing paleoflood hydrology with slackwater deposits—Verde River, Arizona: Physical Geography, v. 6, p. 103–126.
Ely, L.L., Enzel, Y., Baker, V.R., and Cayan, D.R., 1993, A 5000-year record of extreme floods and climate change in the southwestern United States: Science, v. 262, no. 5132, p. 410–412.
Ely, L.L., Webb, R.H., and Enzel, Y., 1992, Accuracy of post-bomb 137Cs and 14C in dating fluvial deposits: Quaternary Research, v. 38, no. 2, p. 196–204.
Engel, M., Brueckner, H., Messenzehl, K., Frenzel, P., May, S.M., Scheffers, A., Scheffers, S., Wennrich, V., and Kelletat, D., 2012, Shoreline changes and high-energy wave impacts at the leeward coast of Bonaire (Netherlands Antilles): Earth, Planets, and Space, v. 64, p. 905–921.
England, J.F., Jr., Godaire, J.E., Klinger, R.E., Bauer, T.R., and Julien, P.Y., 2010, Paleohydrologic bounds and extreme flood frequency of the Upper Arkansas River, Colorado, USA: Geomorphology, v. 124, nos. 1–2, p. 1–16.
England, J.F., Jr., Jarrett, R.D., and Salas, J.D., 2003a, Data-based comparisons of moments estimators using historical and paleoflood data: Journal of Hydrology, v. 278, nos. 1–4, p. 172–196.
England, J.F., Jr., Klawon, J.E., Klinger, R.E., and Bauer, T.R., 2006, Flood hazard study, Pueblo Dam, Colorado: Denver, Colo., Bureau of Reclamation, 160 p.
England, J.F., Jr., Salas, J.D., and Jarrett, R.D., 2003b, Comparisons of two moments-based estimators that utilize historical and paleoflood data for the log Pearson type III distribution: Water Resources Research, v. 39, no. 9, p. 5-1–5-16.
Enzel, Y., Ely, L.L., House, P.K., and Baker, V.R., 1993, Paleoflood evidence for a natural upper bound to flood magnitudes in the Colorado River Basin: Water Resources Research, v. 29, p. 2,287–2,297.
References Cited 51
Fanok, S.F., and Wohl, E.E., 1997, Assessing the accuracy of paleohydrologic indicators, Harpers Ferry, West Virgina: Journal of the American Water Resources Association, v. 33, no. 5, p. 1,091–1,102.
Francés, F., 2004, Flood frequency analysis using systematic and non-systematic information, in Benito, G., and Thorndycraft, V.R., eds., Systematic, palaeoflood and historical data for the improvement of flood risk estimation: Madrid, Spain, Consejo Superior de Investigaciones Cientificas, p. 55–70.
Fritz, H.M., Borrero, J.C., Synolakis, C.E., and Yoo, J., 2006, 2004 Indian Ocean tsunami flow velocity measurements from survivor videos: Geophysical Research Letters, v. 33, no. 24, p. L24605.
Fritz, H.M., Phillips, D.A., Okayasu, A., Shimozono, T., Liu, H., Mohammed, F., Skanavis, V., Synolakis, C.E., and Takahashi, T., 2012, The 2011 Japan tsunami current velocity measurements from survivor videos at Kesennuma Bay using LiDAR: Geophysical Research Letters, v. 39, no. 7, 6 p.
Gaiser, E.E., Zafiris, A., Ruiz, P.L., Tobias, F.A.C., and Ross, M.S., 2006, Tracking rates of ecotone migration due to salt-water encroachment using fossil mollusks in coastal South Florida: Hydrobiologia, v. 569, p. 237–257.
Gehrels, W.R., and Woodworth, P.L., 2013, When did modern rates of sea-level rise start?: Global and Planetary Change, v. 100, p. 263–277.
Geist, E.L., Lynett, P.J., and Chaytor, J.D., 2009, Hydronamic modeling of tsunamis from the Currituck landslide: Marine Geology, v. 264, nos. 1–2, p. 41–52.
Geist, E.L., and Parsons, T., 2009, Assessment of source probabilities for potential tsunamis affecting the U.S. Atlantic coast: Marine Geology, v. 264, no. 1–2, p. 98–108.
Geist, E.L., Titov, V.V., Arcas, D., Pollitz, F.F., and Bilek, S.L., 2007, Implications of the 26 December 2004 Sumatra-Andaman earthquake on tsunami forecast and assessment models for great subduction-zone earthquakes: Bulletin of the Seismological Society of America, v. 97, no. 1A, p. S249–S270.
Goff, J., Dudley, W.C., Demaintenon, M.J., Cain, G., and Coney, J.P., 2006, The largest local tsunami in 20th century Hawaii: Marine Geology, v. 226, no. 1–2, p. 65–79.
Goff, J., McFadgen, B.G., and Chague-Goff, C., 2004, Sedimentary differences between the 2002 Easter storm and the 15th-century Okoropunga tsunami, southeastern North Island, New Zealand: Marine Geology, v. 204, nos. 1–2, p. 235–250, doi:10.1016/S0025-3227(03)00352-9.
Goldfinger, C., Nelson, C.H., Johnson, J.E., Morey, A.E., Guitérrez-Pastor, J., Karabanov, E., Eriksson, A.T., Gràcia, E., Dunhill, G., Patton, J., Enkin, R., Dallimore, A., and Vallier, T., 2012, Turbidite event history—Methods and implications for Holocene paleoseismicity of the Cascadia subduction zone: U.S. Geological Survey Professional Paper 1661–F, 170 p.
González, F.I., 2003, Puget Sound tsunami sources—2002 workshop report: National Oceanic and Atmospheric Administration Office of Oceanic and Atmospheric Research Special Report Report, 36 p.
González, F.I., Bernard, E., Dunbar, P., Geist, E., Jaffe, B., Kânoğlu, U., Locat, J., Mofjeld, H., Moore, A., Synolakis, C., Titov, V., and Weiss, R., 2007, Scientific and technical issues in tsunami hazard assessment of nuclear power plant sites: National Oceanic and Atmospheric Administration Technical Memorandum OAR PMEL-136, Science Review Working Group, Pacific Marine Environmental Laboratory, Seattle, Washington, 125 p.
González, F.I., Geist, E.L., Jaffe, B., Kânoğlu, U., Mofjeld, H., Synolakis, C.E., Titov, V.V., Arcas, D., Bellomo, D., Carlton, D., Horning, T., Johnson, J., Newman, J., Parsons, T., Peters, R., Peterson, C., Priest, G., Venturato, A., Weber, J., Wong, F., and Yalciner, A., 2009, Probabilistic tsunami hazard assessment at Seaside, Oregon, for near- and far-field seismic sources: Journal of Geophysical Research: Oceans, v. 114, C11023, doi:10.1029/2008JC005132.
González, J.L., and Törnqvist, T.E., 2009, A new Late Holocene sea-level record from the Mississippi Delta: evidence for a climate/sea level connection: Quaterary Science Reviews, v. 28, p. 1,737–1,749, doi:10.1016/j.quascirev.2009.04.003.
Goto, K., Chague-Goff, C., Goff, J., and Jaffe, B., 2012, The future of tsunami research following the 2011 Tohoku-oki event: Sedimentary Geology, v. 282, p. 1–13.
Goto, K., Miyagi, K., Kawamata, H., and Imamura, F., 2010, Discrimination of boulders deposited by tsunamis and storm waves at Ishigaki Island, Japan: Marine Geology, v. 269, nos. 1–2, p. 34–45.
Griffis, V.W., Stedinger, J.R., and Cohn, T.A., 2004, Log Pearson type 3 quantile estimators with regional skew information and low outlier adjustments: Water Resources Research, v. 40, no. 7, p. W07503.
Halley, R.B., and Roulier, L.M., 1999, Reconstructing the history of eastern and central Florida Bay using mollusk-shell isotope records: Estuaries, v. 22, no. 2, p. 358–368.
52 Assessing Inundation Hazards to Nuclear Powerplant Sites Using Histories of Riverine Floods, Tsunamis, and Storm Surges
Harden, T.M., 2012, Late-Holocene flood history, flood-frequency, and paleoclimate analysis of the central Black Hills, South Dakota: Portland, Oreg., Portland State University, Ph.D. dissertation, 277 p.
Harden, T.M., O’Connor, J.E., Driscoll, D.G., and Stamm, J.F., 2011, Flood-frequency analyses from paleoflood investigations for Spring, Rapid, Boxelder, and Elk Creeks, Black Hills, western South Dakota: U.S. Geological Survey Scientific Investigations Report 2011–5131, p. 136.
Helley, E.J., and LaMarche, V.C., Jr., 1973, Historic flood information for northern California streams from geological and botanical evidence: U.S. Geological Survey Professional Paper 485–E, 16 p.
Henderson, F.M., 1966, Open channel flow: New York, MacMillan, 522 p.
Hippensteel, S.P., Eastin, M.D., and Garcia, W.J., 2013, The geologic legacy of Hurricane Irene—Implications for the fidelity of the paleostorm record: Geological Society of America Today, v. 20, no. 10, p. 4–10.
Hippensteel, S.P., and Martin, R.E., 1999, Foraminifera as an indicator of overwash deposits, Barrier Island sediment supply, and Barrier Island evolution—Folly Island, South Carolina: Palaeogeography, Palaeoclimatology, Palaeoecology, v. 149, nos. 1–4, p. 115–125.
Hosman, K.L., Ely, L.L., and O’Connor, J.E., 2003. Holocene paleoflood hydrology of the Lower Deschutes River, Oregon, in O’connor, J.E., and Grant, G.E., eds., A peculiar river—Geology, geomorphology, and hydrology of the Deschutes River, Oregon: Washington, D.C., American Geophysical Union, Water Science and Application Series, v. 7, p. 267–293.
House, P.K., and Baker, V.R., 2001, Paleohydrology of flash floods in small desert watersheds in western Arizona: Water Resources Research, v. 37, no. 6, p. 1,825–1,839.
House, P.K., Pearthree, P.A., and Klawon, J.E., 2002b, Historical flood and paleoflood chronology of the lower Verde River, Arizona: Stratigraphical evidence and related uncertainties, in House, P.K., Webb, R.H., Baker, V.R., and Levish, D.R., eds., Ancient floods, modern hazards—Principles and applications of paleoflood hydrology: Washington, D.C., American Geophysical Union, Water Science and Application Series, v. 5, p. 267–293.
House, P.K., Webb, R.H., Baker, V.R., and Levish, D.R., 2002a, Ancient floods, modern hazards—Principles and applications of paleoflood hydrology: Washington, D.C., American Geophysical Union, Water Science and Application Series, v. 5, 385 p.
Huntington, K., Bourgeois, J., Gelfenbaum, G., Lynett, P., Jaffe, B., Yeh, H., and Weiss, R., 2007, Sandy signs of a tsunami’s onshore depth and speed: Eos, Transactions, American Geophysical Union, v. 88, no. 52, p. 577–578.
Hydrologic Engineering Center, 2010, HEC-RAS river analysis system–Hydraulics reference manual, Version 4.1, CPD-69: U.S. Army Corps of Engineers, Davis, California [variously paged].
Ingram, R.L., 1968, Vertical profiles of modern sediments along the North Carolina coast: Southeastern Geology, v. 9, p. 237–244.
Interagency Advisory Committee on Water Data, 1982, Guidelines for determining flood flow frequency, Bulletin 17B of the Hydrology Subcommittee: U.S. Geological Survey Office of Water Data Coordination, p. 194.
Jacoby, Y., Grodek, T., Enzel, Y., Porat, N., Mcdonald, E.V., and Dahan, O., 2008, Late Holocene upper bounds of flood magnitudes and twentieth century large floods in the ungauged, hyperarid alluvial Nahal Araya: Israel Geomorphology, v. 95, p. 274–294.
Jaffe, B.E., Goto, K., Sugawara, D., Richmond, B.M., Fujino, S., and Nishimura, Y., 2012, Flow speed estimated by inverse modeling of sandy tsunami deposits—Results from the 11 March 2011 tsunami on the coastal plain near the Sendai Airport, Honshu, Japan: Sedimentary Geology, v. 282, p. 90–109.
Jaffe, B.E., and Gelfenbaum, G. , 2007, A simple model for calculating tsunami flow speed from tsunami deposits: Sedimentary Geology, v. 200, p. 347–361.
Jankaew, K., Atwater, B.F., Sawai, Y., Choowong, M., Charoentitirat, T., Martin, M.E., and Prendergast, A., 2008, Medieval forewarning of the 2004 Indian Ocean tsunami in Thailand: Nature, v. 455, no. 7217, p. 1,228–1,231.
Jarrett, R.D., 1991, Paleohydrology and its value in analyzing floods and droughts, in Paulson, R.W., Chase, E.B., Roberts, R.S., and Moody, D.W., eds., National water summary 1988–89: hydrologic events and floods and droughts: U.S. Geological Survey Water–Supply Paper 2375, p. 105–116.
Jarrett, R.D., and England J.F., Jr., 2002, Reliability of paleostage indicators for paleoflood studies, in House, P.K., Webb, R.H., Baker, V.R., and Levish, D.R., eds., Ancient floods, modern hazards—Principles and applications of paleoflood hydrology: Washington, D.C., American Geophysical Union, Water Science and Application Series, v. 5, p. 91–109.
References Cited 53
Jones, F.O., Embody, D.R., Peterson, W.L., and Hazlewood, R.M., 1961, Landslides along the Columbia River Valley, northeastern Washington—Descriptions of landslides and statistical analyses of data on some 200 landslides in Pleistocene sediments: U.S. Geological Survey Professional Paper 367, 98 p.
Kelsey, H.M., Nelson, A.R., Hemphill-Haley, E., and Witter, R.C., 2005, Tsunami history of an Oregon coastal lake reveals a 4600 year record of great earthquakes on the Cascadia subduction zone: Geological Society of America Bulletin, v. 117, nos. 7–8, p. 1,009–1,032.
Kemp, A.C., Horton, B.P., Donnelly, J.P., Mann, M.E., Vermeer, M., and Rahmstorf, S., 2011, Climate related sea-level variations over the past two millennia: Proceedings of the National Academy of Sciences, doi/10.1073/pnas.1015619108.
Kemp, A.C., Horton, B.P., Vane, C.H., Bernhardt, C.E., Corbett, D.R., Engelhart, S.E., Anisfeld, S.C., Parnell, A.C., and Cahill, N., 2013, Sea-level change during the last 2500 years in New Jersey, USA: Quaternary Science Reviews, v. 81, p. 90–104, doi:10.1016/j.quascirev.2013.09.024.
Kidson, R.L., Richards, K.S., and Carling, P.A., 2006, Hydraulic model calibration for extreme floods in bedrock-confined channels—Case study from northern Thailand: Hydrological Processes, v. 20, no. 2, p. 329–344.
Knox, J.C., 1999, Long-term episodic changes in magnitudes and frequencies of floods in the upper Mississippi Valley, in Brown, A.G. and Quine, T.A., eds., Fluvial processes and environmental change: New York, Wiley, p. 255–282.
Knox, J.C., 2000, Sensitivity of modern and Holocene floods to climate change: Quaternary Science Reviews, v. 19, nos. 1–5, p. 439–457.
Knox, J.C., and Daniels, J.M., 2002, Watershed scale and the stratigraphic record of large floods, in House, P.K., Webb, R.H., Baker, V.R., and Levish, D.R., eds., Ancient floods, modern hazards—Principles and applications of paleoflood hydrology: Washington, D.C., American Geophysical Union, Water Science and Application Series, v. 5, p. 237–255.
Kochel, R.C., 1980, Interpretation of flood paleohydrology using slackwater deposits, Lower Pecos and Devils Rivers, Southwestern Texas: Austin, University of Texas, Ph.D. dissertation, 360 p.
Kochel, R.C., and Baker, V.R., 1982, Paleoflood hydrology: Science, v. 215, no. 4531, p. 353–361.
Kochel, R.C., and Baker, V.R., 1988, Paleoflood analysis using slackwater deposits, in Baker, V.R., Kochel, R.C., and Patton, P.C., eds., Flood geomorphology: New York, Wiley, p. 357–376.
Kochel, R.C., Baker, V.R., and Patton, P.C., 1982, Paleohydrology of southwestern Texas: Water Resources Research, v. 18, no. 4, p. 1,165–1,183.
Kon’no, E., Iwai, J., Kitamura, N., Kotaka, T., Mii, H., Nakagawa, H., Onuki, Y., Shibata, T., and Takayanagi, Y., 1961, Geological observations of the Sanriku coastal region damaged by the tsunami due to the Chile earthquake in 1960: Contributions from the Institute of Geology and Paleontology, Tohoku University 52, 40 p.
Kopytko, N., and Perkins, J., 2011, Climate change, nuclear power, and the adaptation–mitigation dilemma: Energy Policy, v. 39, no. 1, p. 318–333.
Koshimura, S., and Hayashi, S., 2012, Tsunami flow measurement using the video recorded during the 2011 Tohoku tsunami attack: Proceedings, 2012 Institute of Electrical and Electronics Engineers International Geoscience and Remote Sensing Symposium, Munich, Germany, July 22–27, 2012, p. 6,693–6,696.
Kuczera, G., 1999, Comprehensive at-site flood frequency analysis using Monte Carlo Bayesian inference: Water Resources Research, v. 35, no. 5, p. 1,551–1,557.
Kurokawa, K., Ishibashi, K., Oshima, K., Sakiyama, H., Sakurai, M., Tanaka, K., Tanaka, M., Nomura, S., Hachisuka, R., and Yokoyama, Y., 2012, The official report of The Fukushima Nuclear Accident Independent Investigation Commission—Executive summary: The National Diet of Japan, 86 p. [In English.]
Kutija, V., 2003, Hydraulic modeling of floods, in Thorndycraft, V.R., Benito, G., Barriendos, M., and Llasat, M.C., eds., Palaeofloods, historical data and climatic variability—Applications in flood risk assessment: Madrid, Spain, Consejo Superior de Investigaciones Cientificas, p. 163–169.
Lai, Y.G., 2008, SRH-2D version 2—Theory and user’s manual, sedimentation and river hydraulics—Two-dimensional river flow modeling: Bureau of Reclamation, Denver, Colorado, 97 p., http://www.usbr.gov/pmts/sediment/model/srh2d/Downloads/Manual-SRH2D-v2.0-Nov2008.pdf.
Lai, Y.G., 2009, Two-dimensional depth-averaged flow modeling with an unstructured hybrid mesh: Denver, Colo., Bureau of Reclamation, 40 p. http://www.usbr.gov/pmts/sediment/model/srh2d/Downloads/Theory_Paper-SRH2D-v2-2009.pdf.
Lambert, W.J., Aharon, P., and Rodriguez, A., 2008, Catastrophic hurricane history revealed by organic geochemical proxies in coastal lake sediments—A case study of Lake Shelby, Alabama (USA): Journal of Paleolimnology, v. 39, no. 1, p. 117–131.
54 Assessing Inundation Hazards to Nuclear Powerplant Sites Using Histories of Riverine Floods, Tsunamis, and Storm Surges
Lane, P., Donnelly, J.P., Woodruff, J.D., and Hawkes, A.D., 2011, A decadally-resolved paleohurricane record archived in the late Holocene sediments of a Florida sinkhole: Marine Geology, v. 287, nos. 1–4, p. 14–30.
Lang, M., Fernandez Bono, J.F., Recking, A., Naulet, R., and Grau Gimeno, P., 2004, Methodological guide for paleoflood and historical peak discharge estimation, in Benito, G. and Thorndycraft, V.R., eds., Systematic, Palaeoflood and historical data for the improvement of flood risk estimation—Methodological guidelines: Madrid, Spain, Consejo Superior de Investigaciones Cientificas, p. 43–53.
Lario, J., Luque, L., Zazo, C., Goy, J.L., Spencer, C., Cabero, A., Bardaji, T., Borja, F., Dabrio, C.J., and Civis, J., 2010, Tsunami vs. storm surge deposits—A review of the sedimentological and geomorphological records of extreme wave events (EWE) during the Holocene in the Gulf of Cadiz, Spain: Zeitschrift fuer Geomorphologie, v. 54, no. 3, p. 301–316.
Lavigne, F., Paris, R.L., Grancher, D., Wassmer, P., Brunstein, D., Vautier, F., Leone, F.D.R., Flohic, F.O., De Coster, B., Gunawan, T., Gomez, C., Setiawan, A., Rino, C., and Fachrizal, 2009, Reconstruction of tsunami inland propagation on December 26, 2004 in Banda Aceh, Indonesia, through field investigations: Pure and Applied Geophysics, v. 166, no. 1, p. 259–281.
Lee, H.J., 2009, Timing of occurrence of large submarine landslides on the Atlantic Ocean margin: Marine Geology, v. 264, nos. 1–2, p. 53–64.
Leese, M.N., 1973, Use of censored data in the estimation of Gumbel distribution parameters for annual maximum flood series: Water Resources Research, v. 9, no. 6, p. 1,534–1,542.
Levish, D.R., 2002. Paleohydrologic bounds—Nonexceedance information for flood hazard assessment, in House, P.K., Webb, R.H., Baker, V.R., and Levish, D.R., eds., Ancient floods, modern hazards—Principles and applications of paleoflood hydrology: Washington, D.C., American Geophysical Union, Water Science and Application Series, v. 5, p. 175–190.
Levish, D.R., England J.F., J., Klawon, J.E., and O’Connell, D.R.H., 2003, Flood hazard analysis for Seminoe and Glendo Dams, Kendrick and North Platte Projects, Wyoming—Final report: Denver, Colo., Bureau of Reclamation, 126 p. and 2 apps.
Liu, K., 2004, Paleotempestology—Principles, methods, and examples from Gulf Coast lake sediments, in Murnane, R.J., and Liu, K., eds., Hurricanes and typhoons—Past, present, and future: New York, Columbia University Press, p. 13–57.
Liu, K., 2007, Paleotempestology, in Elias, S.A., ed., Encyclopedia of Quaternary science—Chapter on paleoclimate reconstruction: Oxford, United Kingdom, Elsevier, p. 1,974–1,985.
Liu, K.B., and Fearn, M.L., 1993, Lake-sediment record of late Holocene hurricane activities from coastal Alabama: Geology, v. 21, no. 9, p. 793–796.
Liu, K., and Fearn, M.L., 2000, Reconstruction of prehistoric landfall frequencies of catastrophic hurricanes in northwestern Florida from lake sediment records: Quaternary Research, v. 54, no. 2, p. 238–245.
Locat, J., Lee, H.J., ten Brink, U.S., Twichell, D., Geist, E., and Sansoucy, M.N., 2009, Geomorphology, stability and mobility of the Currituck slide: Marine Geology, v. 264, nos. 1–2, p. 28–40.
MacInnes, B.T., Weiss, R., Bourgeois, J., and Pinegina, T.K., 2010, Slip distribution of the 1952 Kamchatka great earthquake based on near-field tsunami deposits and historical records: Bulletin of the Seismological Society of America, v. 100, no. 4, p. 1,695–1,709.
Mader, C., 2001, Modeling the La Palma landslide tsunami: Science of Tsunami Hazards, v. 19, no. 3, p. 150–184.
Madole, R.F., Schuster, R.L., and Sarna-Wojcicki, A.M., 1995, Ribbon Cliff landslide, Washington, and the earthquake of 14 December 1872: Bulletin of the Seismological Society of America, v. 85, no. 4, p. 986–1,002.
Malik, J.N., Shishikura, M., Echigo, T., Ikeda, Y., Satake, K., Kayanne, H., Sawai, Y., Murty, C.V.R., and Dikshit, O., 2011, Geologic evidence for two pre-2004 earthquakes during recent centuries near Port Blair, South Andaman Island, India: Geology, v. 39, no. 6, p. 559–562.
Mann, M.E., Woodruff, J.D., Donnelly, J.P., and Zhang, Zhihua, 2009, Atlantic hurricanes and climate over the past 1,500 years: Nature, v. 460, p. 880–883.
McCloskey, T.A., and Liu, K., 2012, A sedimentary-based history of hurricane strikes on the southern Caribbean coast of Nicaragua: Quaternary Research, v. 78, no. 3, p. 454–464, doi:10.1016/j.yqres.2012.07.003.
McKee, E.D., 1959, Storm sediments on a Pacific atoll: Journal of Sedimentary Petrology, v. 29, p. 354–364.
McMurtry, G.M., Watts, P., Fryer, G.J., Smith, J.R., and Imamura, F., 2004, Giant landslides, mega-tsunamis, and paleo-sea level in the Hawaiian Islands: Marine Geology, v. 203, nos. 3–4, p. 219–233.
Miller, E.W., and Miller, R.M., 2000, Natural disasters—Floods—A reference handbook: Santa Barbara, California, ABC-CLIO, 286 p.
References Cited 55
Milly, P.C.D., Betancourt, J., Falkenmark, M., Hirsch, R.M., Kundzewicz, Z.W., Lettenmaier, D.P., and Stouffer, R.J., 2008, Stationarity is dead—Whither water management?: Science, v. 319, no. 5863, p. 573–574.
Minoura, K., Imamura, F., Sugawara, D., Kono, Y., and Iwashita, T., 2001, The 869 Jogan tsunami deposit and recurrence interval of large-scale tsunami on the Pacific coast of northeast Japan: Journal of Natural Disaster Science, v. 23, no. 2, p. 83–88.
Monecke, K., Finger, W., Klarer, D., Kongko, W., McAdoo, B., Moore, A.L., and Sudrajat, S.U., 2008, A 1,000-year sediment record of tsunami recurrence in northern Sumatra: Nature, v. 455, p. 1,232–1,234.
Moore, A., Goff, J., McAdoo, B.G., Fritz, H.M., Gusman, A., Kalligeris, N., Kalsum, K., Susanto, A., Suteja, D., and Synolakis, C.E., 2011, Sedimentary deposits from the 17 July 2006 western Java tsunami, Indonesia—Use of grain size analyses to assess tsunami flow depth, speed, and traction carpet characteristics: Pure and Applied Geophysics, v. 168, no. 11, p. 1,951–1,961.
Moore, A.L., McAdoo, B.G., and Ruffman, A., 2007, Landward fining from multiple sources in a sand sheet deposited by the 1929 Grand Banks tsunami, Newfoundland: Sedimentary Geology, v. 200, no. 3–4, p. 336–346.
Morton, R.A., and Barras, J.A., 2011, Hurricane impacts on coastal wetlands—A half-century record of storm-generated features from southern Louisiana: Journal of Coastal Research, v. 27 supplement, p. 27–43.
Morton, R.A., Gelfenbaum, G., and Jaffe, B.E., 2007, Physical criteria for distinguishing sandy tsunami and storm deposits using modern examples: Sedimentary Geology, v. 200, nos. 3–4, p. 184–207.
Morton, R.A., Richmond, B.M., Jaffe, B.E., and Gelfenbaum, G., 2006, Reconnaissance investigation of Caribbean extreme wave deposits—Preliminary observations, interpretations, and research directions: U.S. Geological Survey Open–file Report 2006–1293, 45 p.
Murray, A.S., and Wintle, A.G., 2000, Luminescence dating of quartz using an improved single-aliquot regenerative-dose protocol: Radiation Measurements, v. 32, no. 1, p. 57–73.
Nanayama, F., Satake, K., Furukawa, R., Shimokawa, K., Atwater, B.F., Shigeno, K., and Yamaki, S., 2003, Unusually large earthquakes inferred from tsunami deposits along the Kuril Trench: Nature, v. 424, no. 6949, p. 660–663.
National Oceanic and Atmospheric Administration, 2014, Tides and currents—Sea level trends: National Oceanic and Atmospheric Administration Web site, accessed February 7, 2014, at http://tidesandcurrents.noaa.gov/sltrends/sltrends.html.
National Research Council, 2014, Lessons learned from the Fukushima nuclear accident for improving safety of U.S. nuclear plants: Washington, D.C., The National Academies Press, 366 p.
Nicholls, R.J., and Cazenave, A., 2010, Sea-level rise and its impact on coastal zones: Science Magazine, v. 328, no. 5985, p. 1,517–1,520, doi:10.1126/science.1185782.
Nott, J., 2004, Palaeotempestology—The study of prehistoric tropical cyclones—A review and implications for hazard assessment: Environment International, v. 30, no. 3, p. 433–447.
O’Connell, D.R.H., 2005, Nonparametric Bayesian flood frequency estimation: Journal of Hydrology, v. 313, nos. 1–2, p. 79–96.
O’Connell, D.R.H., Ostenaa, D.A., Levish, D.R., and Klinger, R.E., 2002, Bayesian flood frequency analysis with paleohydrologic bound data: Water Resources Research, v. 38, no. 5, p. 16-11–16-13.
O’Connor, J.E., and Burns, S.F., 2009, Columbia cataclysms and controversy—Aspects of the geomorphology of the Columbia River Gorge, in O’Connor, J.E., Dorsey, R.J., and Madin, I.P., eds., Volcanoes to vineyards—Geologic field trips through the dynamic landscape of the Pacific Northwest: Geological Society of America Field Guide 15, doi: 10.1130/2009.fld015(12).
O’Connor, J.E., Clague, J.J., Walder, J.S., Manville, V., and Beebee, R.A., 2013, Outburst floods, Wohl, E.E., ed., in Shroder, J., ed. in chief, Treatise on geomorphology, Volume 9 (Fluvial geomorphology): San Diego, Academic Press, p. 475–510.
O’Connor, J.E., Curran, J.H., Beebee, R.A., Grant, G.E., and Sarna-Wojcicki, A., 2003, Quaternary geology and geomorphology of the lower Deschutes River canyon, Oregon, in O’Connor, J.E., and Grant, G.E., eds., A peculiar river—Geology, geomorphology, and hydrology of the Deschutes River, Oregon: American Geophysical Union Water Science and Application Series No. 7, p. 73–94.
O’Connor, J.E., Ely, L.L., Wohl, E.E., Stevens, L.E., Melis, T.S., Kale, V.S., and Baker, V.R., 1994, A 4500-year record of large floods on the Colorado River in the Grand Canyon, Arizona: The Journal of Geology, v. 102, no. 1, p. 1–9.
56 Assessing Inundation Hazards to Nuclear Powerplant Sites Using Histories of Riverine Floods, Tsunamis, and Storm Surges
O’Connor, J.E., Grant, G.E., and Costa, J.E., 2002, The geology and geography of floods, in House, P.K., Webb, R.H., and Levish, D.R., eds., Ancient floods, modern hazards—Principles and applications of paleoflood hydrology: Washington, D.C., American Geophysical Union, Water Science and Application Series, v. 5, p. 191–215.
O’Connor, J.E., and Webb, R.H., 1988, Hydraulic modeling for paleoflood analysis, in Baker, V.R., Kochel, R.C., and Patton, P.C., eds., Flood geomorphology: New York, Wiley, p. 393–403.
O’Connor, J.E., Webb, R.H., and Baker, V.R., 1986, Paleohydrology of pool-and-riffle pattern development—Boulder Creek, Utah: Bulletin of the Geological Society of America, v. 97, p. 410–420.
Osterman, L.E., and Smith, C.G., 2012, Over 100 years of environmental change recorded by foraminifers and sediments in Mobile Bay, Alabama, Gulf of Mexico, USA: Estuarine Coastal and Shelf Science, v. 115, p. 345–358.
Otvos, E.G., 2002, Discussion of “Reconstruction of prehistorical landfall frequencies of catastraphic hurricanes in northwestern Florida from lake sediment records”: Quaternary Research, v. 57, no. 3, p. 425.
Ouarda, T.B.M.J., Rasmussen, P.F., Bobée, B., and Bernier, J., 1998, Use of historical information in hydrologic frequency analysis: Revue des Sciences de l’Eau, v. 11, p. 41–49.
Ovenshine, A.T., Lawson, D.E., and Bartsch-Winkler, S.R., 1976, The Portage River silt—an intertidal deposit caused by the 1964 Alaska earthquake: Journal of Research of the U.S. Geological Survey, v. 4, p. 151–162.
Paris, R.L., Fournier, J.R.M., Poizot, E., Etienne, S., Morin, J., Lavigne, F., and Wassmer, P., 2010, Boulder and fine sediment transport and deposition by the 2004 tsunami in Lhok Nga (western Banda Aceh, Sumatra, Indonesia)—A coupled offshore-onshore model: Marine Geology, v. 268, nos. 1–4, p. 43–54.
Petersen, M.D., Frankel, A.D., Harmsen, S.C., Mueller, C.S., Haller, K.M., Wheeler, R.L., Wesson, R.L., Zeng, Y., Boyd, O.S., Perkins, D.M., and Luco, N., 2008, Documentation for the 2008 update of the United States national seismic hazard maps: U.S. Geological Survey Open–File Report 2008–1128, 60 p.
Petersen, M.D., Moschetti, M.P., Powers, P.M., Mueller, C.S., Haller, K.M., Frankel, A.D., Zeng, Yuehua, Rezaeian, Sanaz, Harmsen, S.C., Boyd, O.S., Field, Ned, Chen, Rui, Rukstales, K.S., Luco, Nico, Wheeler, R.L., Williams, R.A., and Olsen, A.H., 2014, Documentation for the 2014 update of the United States national seismic hazard maps: U.S. Geological Survey Open-File Report 2014–1091, 243 p., http://dx.doi.org/10.3133/ofr20141091.
Peterson, C.D., Carver, G.A., Cruikshank, K.M., Abramson, H.F., Garrison-Laney, C.E., and Dengler, L.A., 2011, Evaluation of the use of paleotsunami deposits to reconstruct inundation distance and runup heights associated with prehistoric inundation events, Crescent City, southern Cascadia margin: Earth Surface Processes and Landforms, v. 36, no. 7, p. 967–980.
Peterson, C.D., Cruikshank, K.M., Jol, H.M., and Schlichting, R.B., 2008, Minimum runup heights of paleotsunami from evidence of sand ridge overtopping at Cannon Beach, Oregon, Central Cascadia Margin, U.S.A.: Journal of Sedimentary Research, v. 78, no. 6, p. 390–409.
Pielke, R.A.Jr., and Downton, M.W., 2000, Precipitation and damaging floods—Trends in the United States, 1932–97: Journal of Climate, v. 13, no. 20, p. 3,625–3,637.
Pilarczyk, J.E., Reinhardt, E.G., Boyce, J.I., Schwarcz, H.P., and Donato, S.V., 2011, Assessing surficial foraminiferal distributions as an overwash indicator in Sur Lagoon, Sultanate of Oman: Marine Micropaleontology, v. 80, p. 62–73.
Plafker, G., 1969, Tectonics of the March 27, 1964, Alaska earthquake: U.S. Geological Survey Professional Paper 543–I, 74 p.
Plafker, G., and Savage, J.C., 1970, Mechanism of the Chilean earthquakes of May 21 and 22, 1960: Geological Society of America Bulletin, v. 81, no. 4, p. 1,001–1,030.
Prasad, Rajiv, Hibler, L.F., Coleman, A.M., and Ward, D.L., 2011, Design-basis flood estimation for site characterization at nuclear power plants in the United States of America: U.S. Nuclear Regulatory Commission, Office of Nuclear Regulatory Research [variously paged], http://www.osti.gov/scitech/biblio/1036933.
Priest, G.R., Goldfinger, C., Wang, K., Witter, R.C., Zhang, Y., and Baptista, A.M., 2010, Confidence levels for tsunami-inundation limits in northern Oregon inferred from a 10,000-year history of great earthquakes at the Cascadia subduction zone: Natural Hazards, v. 54, p. 27–73.
Prior, D.B., Doyle, E.H., and Neurauter, T., 1986, The Currituck Slide, Mid-Atlantic continental slope—Revisited: Marine Geology, v. 73, nos. 1–2, p. 25–45.
Prouty, N.G., Jupiter, S.D., Field, M.E., and McCulloch, M.T., 2009, Coral proxy record of decadal-scale reduction in base flow from Moloka’i, Hawaii: Geochemistry, Geophysics, Geosystems, v. 10, no. 12, 18 p.
Radbruch-Hall, D.H., Colton, R.B., Davies, W.E., Lucchitta, Ivo, Skipp, B.A., and Varnes, D.J., 1982, Landslide overview map of the conterminous United States: U.S. Geological Survey Professional Paper 1183, 25 p.
References Cited 57
Rajendran, C.P., Rajendran, K., Machado, T., Satyamurthy, T., Aravazhi, P., and Jaiswal, M., 2006, Evidence of ancient sea surges at the Mamallapuram coast of India and implications for previous Indian Ocean tsunami events: Current Science, v. 91, no. 9, p. 1,242–1,247.
Ramirez Herrera, M., Lagos, M., Hutchinson, I., Kostoglodov, V., Machain, M.L., Caballero, M., Goguitchaichvili, A., Aguilar, B., Chague-Goff, C., Goff, J., Ruiz Fernandez, A., Ortiz, M., Nava, H., Bautista, F., Lopez, G.I., and Quintana, P., 2012, Extreme wave deposits on the Pacific coast of Mexico; tsunamis or storms? A multi-proxy approach: Geomorphology, v. 139–140, p. 360–371, doi:10.1016/j.geomorph.2011.11.002.
Reid, H.F., and Taber, S., 1919, The Porto Rico earthquakes of October–November, 1918: Bulletin of the Seismological Society of America, v. 9, no. 4, p. 95–127.
Reid, H.F., and Taber, S., 1920, The Virgin Islands earthquakes of 1867–1868: Bulletin of the Seismological Society of America, v. 10, no. 1, p. 9–30.
Reis, D.S., Jr., and Stedinger, J.R., 2005, Bayesian MCMC flood frequency analysis with historical information: Journal of Hydrology, v. 313, nos. 1–2, p. 97–116.
Richey, J., Hollander, D., Eglinton, T., and Flower, B., 2009, Novel application of organic and inorganic geochemical proxies for exploring ocean-continent linkages over the last 1400 years from Gulf of Mexico sediment: Geochimica et Cosmochimica Acta Supplement, v. 73. p. A1099.
Richmond, B.M., Watt, S., Buckley, M., Jaffe, B.E., Gelfenbaum, G., and Morton, R.A., 2011, Recent storm and tsunami coarse-clast deposit characteristics, southeast Hawai’i: Marine Geology, v. 283, nos. 1–4, p. 79–89.
Rittenour, T.M., 2008, Luminescence dating of fluvial deposits—Applications to geomorphic, palaeoseismic and archaeological research: Boreas, v. 37, p. 613–635, doi: 10.1111/j.1502-3885.2008.00056.x.
Rodnight, H., Duller, G.A.T., Wintle, A.G., and Tooth, S., 2006, Assessing the reproducibility and accuracy of optical dating of fluvial deposits: Quaternary Geochronology, v. 1, no. 2, p. 109–120.
Rodriguez-Vidal, J., Rodriguez-Llanes, J.M., and Guha-Sapir, D., 2012, Civil nuclear power at risk of tsunamis: Natural Hazards, v. 63, no. 2, p. 1,273–1,278.
Ruíz, J.M., Marín-Guirao, Lazaro, and Sandoval-Gil, J.M., 2009, Responses of the Mediterranean seagrass Posidonia oceanica to in situ simulated salinity increase: Botanica Marina, v. 52, no. 5, p. 459–470.
Ruíz-Villanueva, V., Díez-Herrero, A., Stoffel, M., Bollschweiler, M., Bodoque, J.M., and Ballesteros, J.A., 2010, Dendrogeomorphic analysis of flash floods in a small ungauged mountain catchment (central Spain): Geomorphology, v. 118, nos. 3–4, p. 383–392.
Saenger, C., Cronin, T.M, Thunell, R., and Vann, C.D, 2006, Modeling river discharge and precipitation from estuarine salinity in the northern Chesapeake Bay—Application to Holocene paleoclimate: The Holocene, v. 16, no. 4, p. 1–11.
Saenger, C., Cronin, T.M., Willard, D., Halka, J., Kerhin, R., 2008, Increased terrestrial to ocean sediment fluxes in the northern Chesapeake Bay with twentieth century land alteration: Estuaries and Coasts, v. 31, p. 492–500.
Saint Laurent, D., 2004, Palaeoflood hydrology—An emerging science: Progress in Physical Geography, v. 28, no. 4, p. 531–543.
Sawai, Y., Kamataki, T., Shishikura, M., Nasu, H., Okamura, Y., Satake, K., Thomson, K.H., Matsumoto, D., Fujii, Y., Komatsubara, J., and Aung, T.T., 2009, A periodic recurrence of geologically recorded tsunamis during the past 5500 years in eastern Hokkaido, Japan: Journal of Geophysical Research, v. 114, p. B01319.
Sawai, Y., Namegaya, Y., Okamura, Y., Satake, K., and Shishikura, M., 2012, Challenges of anticipating the 2011 Tohoku earthquake and tsunami using coastal geology: Geophysical Research Letters, v. 29, no. 21, p. L2130.
Schildgen, R., 1999, Unnatural disasters: Sierra, v. 84, p. 48–57.
Schöne, B.R., Wanamaker, A.D., Jr., Fiebig, J., Thébault, J., and Kreutz, K., 2011, Annually resolved δ13Cshell chronologies of long-lived bivalve mollusks (Arctica islandica) reveal oceanic carbon dynamics in the temperate North Atlantic during recent centuries: Palaeogeography, Paleoclimatology, Palaeoecology, v. 302, p. 31–42.
Schumm, S.A., 1968, River adjustment to altered hydrologic regimen—Murrimbidgee River and paleochannels: U.S. Geological Survey Professional Paper 598, p. 65.
Scott, D.B., Collins, E.S., Gayes, P.T., and Wright, E., 2003, Records of prehistoric hurricanes on the South Carolina coast based on micropaleontological and sedimentological evidence, with comparison to other Atlantic Coast records: Geological Society of America Bulletin, v. 115, no. 9, p. 1,027–1,039.
Sheffer, N.A., Enzel, Y., Benito, G., Grodek, T., Poart, N., Lang, M., Naulet, R., and Coeur, D., 2003, Historical and palaeofloods of the Ardèche River, France: Water Resources Research, v. 39, no. 12, p. ESG 7-1–ESG 7-13.
58 Assessing Inundation Hazards to Nuclear Powerplant Sites Using Histories of Riverine Floods, Tsunamis, and Storm Surges
Shepard, F.P., Macdonald, G.A., and Cox, D.C., 1950, The tsunami of April 1, 1946 [Hawaii]:California University, Bulletin of the Scripps Institute of Oceanography, v. 5, no. 6, p. 391–528.
Sigafoos, R.S., 1964, Botanical evidence of floods and flood-plain deposition: U.S. Geological Survey Professional Paper 485A, p. 35.
Smith, C.G., Osterman, L.E, and Poore. R.Z., 2013, An examination of historical inorganic sedimentation and organic matter accumulation in several marsh types within the Mobile Bay and Mobile-Tensaw River delta region: Jounal of Coastal Research, v. 63, p. 68–83.
Smith, D.E., Shi, S., Cullingford, R.A., Dawson, A.G., Dawson, S., Firth, C.R., Foster, I.D.L., Fretwell, P.T., Haggart, B.A., Holloway, L.K., and Long, D., 2004, The Holocene Storegga Slide tsunami in the United Kingdom: Quaternary Science Reviews, v. 23, nos. 23–24, p. 2,291–2,321, doi:10.1016/j.quascirev.2004.04.001.
Soulsby, R., Smith, D., and Ruffman, A., 2007, Reconstructing tsunami run-up from sedimentary characteristics—A simple mathematical model: Proceedings, Coastal Sediments ’07—Sixth International Symposium on Coastal Engineering and Science of Coastal Sediment, New Orleans, Louisiana, May 13–17, 2007, p. 1,075–1,088, accessed March 30, 2014, at http://ascelibrary.org/doi/abs/10.1061/40926%28239%2983.
Speer, J.H., 2010, Dendrogeomorphology, chap. 10 of Speer, J.H., Fundamentals of tree ring research: Tucson, The University of Arizona Press, p. 219–230.
Spiske, M., Weiss, R., Bahlburg, H., Roskosch, J., and Amijaya, H., 2010, The TsuSedMod inversion model applied to the deposits of the 2004 Sumatra and 2006 Java tsunami and implications for estimating flow parameters of palaeo-tsunami: Sedimentary Geology, v. 224, nos. 1–4, p. 29–37, doi:10.1016/j.sedgeo.2009.12.005.
Springer, G.S., and Kite, J.S., 1997, River-derived slackwater sediments in caves along Cheat River, West Virginia: Geomorphology, v. 18, no. 2, p. 91–100.
Srinivasalu, S., Thangadurai, N., Switzer, A.D., Ram Mohan, V., and Ayyamperumal, T., 2007, Erosion and sedimentation in Kalpakkam (N Tamil Nadu, India) from the 26th December 2004 tsunami: Marine Geology, v. 240, nos. 1–4, p. 65–75.
Stedinger, J.R., and Baker, V.R., 1987, Surface water hydrology—Historical and paleoflood information: Reviews of Geophysics, v. 25, no. 2, p. 119–124, doi:10.102/RG025i002p00119.
Stedinger, J.R., and Cohn, T.A., 1986, Flood frequency analysis with historical and paleoflood information: Water Resources Research, v. 22, no. 5, p. 785–793.
Stedinger, J.R., and Griffis, V.W., 2008, Flood frequency analysis in the United States—Time to update: Journal of Hydrologic Engineering, v. 12, no. 4, p. 199–204.
Stokes, S., and Walling, D.E., 2003, Radiogenic and isotopic methods for the direct dating of fluvial sediments, in Kondolf, G.M. and Piégay, H., eds., Tools in fluvial geomorphology: Chichester, United Kingdom, Wiley, p. 233–267.
Sugawara, D., Goto, K., Imamura, F., Matsumoto, H., and Minoura, K., 2012, Assessing the magnitude of the 869 Jogan tsunami using sedimentary deposits—Prediction and consequence of the 2011 Tohoku-oki tsunami: Sedimentary Geology, v. 282, p. 14–26.
Swain, R.E., England, J.F., Jr., Bullard, K.L., and Raff, D.A., 2004, Hydrologic hazard curve estimating procedures: Bureau of Reclamation Research Report DSO-04-08, 79 p.
Swart, P.K., Dodge, R.E., and Hudson, H.J., 1996a, A 240-year stable Oxygen and Carbon isotopic record in a coral from South Florida—Implications for the prediction of precipitation in southern Florida: Palaios, v. 11, p. 362–375.
Swart, P.K., Healy, G.F., Dodge, R.E., Kramer, P., Hudson, J.H., Halley, R.B., and Robblee, M.B., 1996b, The stable oxygen and carbon isotopic record from a coral growing in Florida Bay—A 160-year record of climatic and anthropogenic influence: Palaeogeography, Palaeoclimatology, Palaeoecology, v. 123, p. 219–237.
Switzer, A.D., and Burston, J.M., 2010, Competing mechanisms for boulder deposition on the southeast Australian coast: Rock Coast Geomorphology, v. 114, nos. 1–2, p. 42–54.
Switzer, A.D., and Jones, B.G., 2008, Large-scale washover sedimentation in a freshwater lagon from the southeast Australian coast—Sea-level change, tsunami or exceptionally large storm?: The Holocene, v. 18, p. 787–803.
ten Brink, U., Twichell, D., Geist, E., Chaytor, J., Locat, J., Lee, H., Buczkowski, B., and Sansoucy, M., 2007, The current state of knowledge regarding potential tsunami sources affecting U.S. Atlantic and Gulf coasts—A report to the Nuclear Regulatory Commission: U.S. Geologcial Survey Administrative Report, 156 p.
References Cited 59
ten Brink, U.S., Al-Zoubi, A.S., Flores, C.H., Rotstein, Y., Qabbani, I., Harder, S.H., and Keller, G.R., 2006, Seismic imaging of deep low-velocity zone beneath the Dead Sea basin and transform fault—Implications for strain localization and crustal rigidity: Geophysical Research Letters, v. 33, no. 24, p. L24314.
ten Brink, U.S., and López-Venegas, A.M., 2012, Plate interaction in the NE Caribbean subduction zone from continuous GPS observations: Geophysical Research Letters, v. 39, no. 10, p. L10304.
Thomas, E., Gapotchenko, T., Varekamp, J.C., Mecray, E.L., and Buchholtz ten Brink, M.R., 2000, Benthic foraminifera and environmental changes in Long Island Sound: Journal of Coastal Research, v. 16, p. 641–655.
Thompson, J., 2011, Cascadia’s fault; the coming earthquake and tsunami that could devastate North America: Berkeley, California, Counterpoint Press, 352 p.
Thorndycraft, V.R., Benito, G., Rico, M., Sopeña, A., Sánchez-Moya, Y., and Casas, A., 2005a, A long-term flood discharge record derived from slackwater flood deposits of the Llobregat River, NE Spain: Journal of Hydrology, v. 313, nos. 1–2, p. 16–31.
Thorndycraft, V.R., Benito, G., Walling, D.E., Sopeña, A., Sánchez-Moya, Y., Rico, M., and Casas, A., 2005b, Caesium-137 dating applied to slackwater flood deposits of the Llobregat River, NE Spain: Catena, v. 59, no. 3, p. 305–318.
Thrush, C., and Ludwin, R.S., 2007, Finding fault—Indigenous seismology, colonial science, and the rediscovery of earthquakes and tsunamis in Cascadia: American Indian Culture and Research Journal, v. 31, no. 4, p. 1–24.
Tuttle, M.P., Ruffman, A., Anderson, T., and Jeter, H., 2004, Distinguishing tsunami from storm deposits in Eastern North America—The 1929 Grand Banks tsunami versus the 1991 Halloween storm: Seismological Research Letters, v. 75, no. 1, p. 117–131.
University of Oxford, 2014, OxCal online radiocarbon calibration: Oxford, United Kingdom, Oxford Radiocarbon Accelerator Unit Web site http://c14.arch.ox.ac.uk.
van de Plassche, O., Erkens, G., van Vliet, F., Brandsma, J., van der Borg, K., and de Jong, A.F.M., 2006, Salt-marsh erosion associated with hurricane landfall in southern New England in the fifteenth and seventeenth centuries: Geology, v. 34, no. 10, p. 829–832.
Veilleux, A.G., Cohn, T.A., Flynn, K.M., Mason, R.R., Jr., and Hummel, P.R., 2014, Estimating magnitude and frequency of floods using the PeakFQ 7.0 program: U.S. Geological Survey Fact Sheet 2013-3108, 2 p., http://pubs.usgs.gov/fs/2013/3108/.
Villarini, G., Smith, J.A., Serinaldi, F., Bales, J., Bates, P.D, and Krajewski, W.F., 2009, Flood frequency analysis for nonstationary annual peak records in an urban drainage basin: Advances in Water Resources, v. 32, no. 8, p. 1,255-1,266, http://dx.doi.org/10.1016/j.advwatres.2009.05.003.
Wallace, D.J., and Anderson, J.B., 2010, Evidence of similar probability of intense hurricane strikes for the Gulf of Mexico over the late Holocene: Geology, v. 38, p. 511–514.
Wanamaker, A.D. Jr., Butler, P.G., Scourse, J.D., Heinemeier, J., Eiríksson, J., Knudsen, K.L., and Richardson, C.A., 2012, Surface changes in the North Atlantic meridional overturning circulation during the last millennium: Nature Communications, v. 3, no. 899, doi:10.1038/ncomms1901.
Ward, S.N., and Day, S., 2001, Cumbre Vieja Volcano—Potential collapse and tsunami at La Palma, Canary Islands: Geophysical Research Letters, v. 28, no. 17, p. 3,397–3,400.
Webb, R.H., and Jarrett, R.D., 2002, One-dimensional estimation techniques for discharges of paleofloods and historical floods, in House, P.K., Webb, R.H., Baker, V.R., and Levish, D.R., eds., Ancient floods, modern hazards—Principles and applications of paleoflood hydrology: Washington, D.C., American Geophysical Union, Water Science and Application Series, v. 5, p. 111–125.
Webb, R.H., O’Connor, J.E., and Baker, V.R., 1988, Paleohydrologic reconstruction of flood frequency on the Escalante River, South-central Utah, in Baker, R.V., Kochel, R.C., and Patton, P.C., eds., Flood geomorphology: New York, Wiley, p. 403–418.
Weiss, R., 2012, The mystery of boulders moved by tsunamis and storms: Marine Geology, v. 295–298, no. 0, p. 28–33.
Willard, D.W., and Cronin, T.M., 2007, Paleoecology and ecosystem restoration—Case studies from Chesapeake Bay and the Florida Everglades: Frontiers in Ecology and the Environment, v. 5, no. 9, p. 491–498.
Williams, G.P., and Costa, J.E., 1988, Geomorphic measurements after a flood, in Baker, V.R., Kochel, R.C., and Patton, P.C., eds., Flood geomorphology: New York, Wiley, p. 65–77.
60 Assessing Inundation Hazards to Nuclear Powerplant Sites Using Histories of Riverine Floods, Tsunamis, and Storm Surges
Wintle, A.G., and Murray, A.S., 2006, A review of quartz optically stimulated luminescence characteristics and their relevance in single-aliquot regeneration dating protocols: Radiation Measurements, v. 41, no. 4, p. 369–391.
Witter, R.C., Jaffe, B., Zhang, Y., and Priest, G., 2012a, Reconstructing hydrodynamic flow parameters of the 1700 tsunami at Cannon Beach, Oregon, USA: Natural Hazards, v. 63, no. 1, p. 223–240.
Witter, R.C., Kelsey, H.M., and Hemphill-Haley, E., 2001, Pacific storms, El Niño and tsunamis—Competing mechanisms for sand deposition in a coastal marsh, Euchre Creek, Oregon: Journal of Coastal Research, v. 17, no. 3, p. 563–583.
Witter, R.C., Zhang, Y., Wang, K., Goldfinger, C., Priest, G.R., and Allan, J.C., 2012b, Coseismic slip on the southern Cascadia megathrust implied by tsunami deposits in an Oregon lake and earthquake-triggered marine turbidites: Journal of Geophysical Research, v. 117, p. 10303.
Witter, R.C., Zhang, Y.J., Wang, K., Priest, G.R., Goldfinger, C., Stimely, L., English, J.R., and Ferro, P.A., 2013, Simulated tsunami inundation for a range of Cascadia megathrust earthquake scenarios at Bandon, Oregon, USA: Geosphere, v. 9, p. 1783–1803.
Wohl, E.E., 2000, Mountain rivers: Water Resources Monogram Series, American Geophysical Union, v. 114, 320 p.
Wohl, E.E., 2002, Modeled paleoflood hydraulics as a tool for interpreting bedrock channel morphology, in House, P.K., Webb, R.H., Baker, V.R., and Levish, D.R., eds., Ancient floods, modern hazards—Principles and applications of paleoflood hydrology: Washington, D.C., American Geophysical Union, Water Science and Application Series, v. 5, p. 345–358.
Woodruff, J.D., Donnelly, J.P., Mohrig, D., and Geyer, W.R., 2008, Reconstructing relative flooding intensities responsible for hurricane-induced deposits from Laguna Playa Grande, Vieques, Puerto Rico: Geology, v. 36, no. 5, p. 391–394, doi:10.1130/G24731A.1.
Yanosky, T.M., and Jarrett, R.D., 2002. Dendrochronologic evidence for the frequency and magnitude of paleofloods, in House, P.K., Webb, R.H., Baker, V.R., and Levish, D.R., eds., Ancient floods, modern hazards—Principles and applications of paleoflood hydrology: Washington, D.C., American Geophysical Union, Water Science and Application Series, v. 5, p. 77–89.
Yulianto, E., Kusmayanto, F., Supriyatna, N., and Dirhamsyah, M., 2010, Where the first wave arrives in minutes—Indonesian lessons on surviving tsunamis near their sources, in Atwater, B.F., Yulianto, E., Kodijat, A.M., eds.: Paris, France, United National Educational, Scientific and Cultural Oranization, Intergovernmental Oceanographic Commission Brochure 2010–4 Report, p. 1–28.
Appendix A 61
Appendix A. Supplementary and Supporting Data
62 Assessing Inundation Hazards to Nuclear Powerplant Sites Using Histories of Riverine Floods, Tsunamis, and Storm SurgesTa
ble
A1.
N
ucle
ar p
ower
plan
t site
s an
alyz
ed fo
r pal
eoflo
od s
uita
blili
ty s
tudy
.
[In
som
e ca
ses,
mul
tiple
pou
r poi
nts w
ere
requ
ired
for w
ater
shed
del
inea
tion
to c
over
a p
lant
; onl
y th
e m
ain
pour
poi
nts a
re li
sted
in th
e ta
ble.
See
tabl
e 1
for p
ower
plan
t loc
atio
ns. A
bbre
viat
ions
: km
2 , squ
are
kilo
met
er; m
, met
er; N
A, n
ot a
pplic
able
]
Site
Dom
ain
area
1Po
ur p
oint
Dom
ain
area
2Po
ur p
oint
Dom
ain
area
3Po
ur p
oint
Tota
l are
a (k
m2 )
Dra
inag
e ar
ea a
t pla
nt
(km
2 )
Buf
fer
wid
th
(m)
Buf
fer
area
(k
m2 )
(km
2 )La
titud
eLo
ngitu
de(k
m2 )
Latit
ude
Long
itude
(km
2 )La
titud
eLo
ngitu
de
Ark
ansa
s Nuc
lear
187,
185.
236
.167
9-9
6.27
0220
4,22
7.8
35.2
778
-93.
2125
17,9
14.9
33.7
778
-91.
0708
417,
596.
539
1,41
3.0
552
8,26
8.6
Bea
ver V
alle
y29
,836
.140
.549
0-7
9.76
4629
,690
.540
.623
3-8
0.45
0745
,483
.938
.838
4-8
2.14
3810
8,44
1.1
59,5
26.6
412
3,43
0.7
Bra
idw
ood
630.
741
.252
7-8
8.35
0866
4.9
41.3
093
-88.
3386
51.2
41.3
534
-88.
4204
1,40
2.6
1,29
5.6
4055
.8B
row
ns F
erry
32,2
52.1
35.8
625
-84.
5331
37,7
01.7
34.7
000
-87.
1228
35,8
80.1
37.0
757
-88.
5683
143,
927.
269
,953
.92,
388
38,0
93.3
Bru
nsw
ick
11,5
38.6
34.9
678
-78.
8206
12,0
58.3
33.9
268
-77.
9758
21.0
33.9
161
-77.
9999
38,4
84.5
23,5
96.9
3,39
514
,866
.7B
yron
9,64
7.6
42.4
601
-89.
0942
11,5
40.9
42.0
710
-89.
3257
7,09
4.1
41.4
838
-90.
6197
29,3
60.2
21,1
88.5
226
1,07
7.6
Cal
law
ay69
0,96
1.8
42.7
674
-98.
0185
613,
033.
838
.680
8-9
1.82
050.
0N
AN
A1,
313,
197.
31,
303,
995.
641
19,
201.
7C
alve
rt C
liffs
0.0
NA
NA
1.2
38.4
321
-76.
4356
0.0
NA
NA
1.2
1.2
10.
0C
ataw
ba3,
777.
135
.714
3-8
1.06
403,
841.
635
.050
5-8
1.05
056,
910.
033
.702
9-8
0.59
8817
,803
.07,
618.
757
73,
274.
3C
linto
n19
5.8
40.2
947
-88.
7650
554.
140
.142
4-8
8.87
7946
8.3
40.0
834
-89.
3948
1,28
6.9
749.
929
68.7
Col
umbi
a G
ener
atin
gSt
atio
n10
1,56
2.9
49.0
046
-117
.622
295
,797
.446
.421
6-1
19.2
623
16,2
63.4
46.1
871
-119
.029
022
0,65
9.3
197,
360.
454
07,
035.
6
Com
anch
e Pe
ak32
.532
.340
2-9
7.83
0373
.832
.290
9-9
7.76
6188
.432
.246
7-9
7.72
0322
6.4
106.
342
31.7
Coo
per
536,
836.
344
.807
7-1
00.7
112
498,
210.
640
.313
6-9
5.65
8277
4,05
7.8
36.9
812
-89.
1316
1,81
5,30
8.2
1,03
5,04
6.9
271
6,20
3.4
Cry
stal
Riv
er2,
252.
028
.760
7-8
2.18
692,
414.
829
.001
6-8
2.75
960.
0N
AN
A4,
759.
74,
666.
853
92.9
D.C
. Coo
k0.
0N
AN
A0.
941
.974
8-8
6.56
710.
0N
AN
A0.
90.
91
0.0
Dav
is-B
esse
262.
041
.477
2-8
3.40
8226
4.3
41.5
870
-83.
0617
0.0
NA
NA
585.
352
6.3
7859
.0D
iabl
o C
anyo
n0.
0N
AN
A1.
335
.212
1-1
20.8
576
0.0
NA
NA
1.6
1.3
20.
3D
resd
en11
,639
.641
.074
0-8
7.81
547,
151.
441
.398
6-8
8.26
7918
,777
.040
.635
6-8
9.62
1740
,557
.018
,791
.040
42,
989.
1D
uane
Arn
old
6,80
0.3
42.6
135
-92.
4957
9,36
7.2
42.0
950
-91.
7725
16,2
10.1
41.1
654
-91.
1608
33,8
39.9
16,1
67.5
152
1,46
2.2
Farle
y10
,694
.732
.715
7-8
5.11
9910
,575
.331
.221
8-8
5.09
7323
,164
.530
.725
3-8
4.87
5945
,151
.021
,270
.013
071
6.5
Ferm
i 214
8.2
42.0
742
-83.
3647
112.
541
.976
4-8
3.25
410.
0N
AN
A53
2.1
260.
656
227
1.5
Fort
Cal
houn
234,
747.
647
.978
5-1
03.9
831
556,
548.
841
.517
9-9
6.06
3397
3,54
5.2
38.8
117
-90.
1168
1,77
4,88
3.2
791,
296.
445
110
,041
.5G
inna
18.5
43.2
557
-77.
3316
19.2
43.2
783
-77.
3038
0.0
NA
NA
40.7
37.7
83.
1G
rand
Gul
f1,
035,
046.
936
.981
5-8
9.12
9994
9,92
9.2
32.0
057
-91.
0831
180,
997.
629
.307
9-8
9.37
312,
240,
247.
01,
984,
976.
11,
166
74,2
73.2
Hat
ch15
,666
.231
.919
0-8
2.64
5714
,267
.731
.938
1-8
2.34
236,
905.
531
.320
7-8
1.29
0038
,440
.129
,933
.817
31,
600.
8H
ope
Cre
ek15
,762
.540
.689
3-7
5.20
3513
,590
.839
.466
1-7
5.55
371,
281.
939
.265
6-7
5.34
9152
,960
.329
,353
.34,
030
22,3
25.1
Indi
an P
oint
11,9
51.9
42.7
840
-73.
6769
21,0
76.4
41.2
744
-73.
9602
1,58
9.5
40.7
034
-74.
0244
42,4
99.3
33,0
28.3
1,46
17,
881.
4K
ewau
nee
0.0
44.3
403
-87.
5342
4.7
44.3
403
-87.
5342
0.0
NA
NA
5.4
4.7
60.
7La
Sal
le11
,639
.641
.074
0-8
7.81
549,
661.
941
.312
3-8
8.67
2920
,974
.640
.307
7-9
0.06
8844
,450
.121
,301
.525
12,
174.
0Li
mer
ick
1,65
9.7
40.4
232
-75.
9491
1,36
6.1
40.2
267
-75.
5928
1,92
7.5
39.8
771
-75.
1959
5,16
8.9
3,02
5.8
8121
5.7
McG
uire
2,37
4.3
35.7
784
-81.
6532
2,27
2.7
35.4
325
-80.
9593
4,54
4.1
34.7
864
-80.
8755
10,3
06.8
4,64
7.0
261
1,11
5.8
Mill
ston
e0.
541
.308
7-7
2.16
140.
741
.306
8-7
2.15
990.
0N
AN
A1.
11.
11
0.0
Mon
ticel
lo17
,802
.746
.493
2-9
4.08
7818
,498
.645
.336
6-9
3.84
4614
,985
.944
.893
7-9
3.17
7052
,311
.236
,301
.419
31,
023.
9N
ine
Mile
Poi
nt0.
0N
AN
A3.
543
.521
8-7
6.41
460.
0N
AN
A3.
53.
51
0.0
Nor
th A
nna
343.
538
.103
9-7
7.83
8642
6.6
38.0
660
-77.
7820
769.
037
.803
4-7
7.40
831,
665.
977
0.1
6412
6.8
Oco
nee
579.
334
.890
5-8
2.90
8358
8.5
34.7
358
-82.
8917
1,02
6.9
34.4
998
-82.
8312
2,35
9.8
1,16
7.8
183
165.
1O
yste
r Cre
ek19
.139
.796
4-7
4.25
6717
.839
.811
2-7
4.20
275.
739
.811
0-7
4.17
0252
.736
.956
10.1
Appendix A 63Ta
ble
A1.
N
ucle
ar p
ower
plan
t site
s an
alyz
ed fo
r pal
eoflo
od s
uita
blili
ty s
tudy
.—Co
ntin
ued
[In
som
e ca
ses,
mul
tiple
pou
r poi
nts w
ere
requ
ired
for w
ater
shed
del
inea
tion
to c
over
a p
lant
; onl
y th
e m
ain
pour
poi
nts a
re li
sted
in th
e ta
ble.
See
tabl
e 1
for p
ower
plan
t loc
atio
ns. A
bbre
viat
ions
: km
2 , squ
are
kilo
met
er; m
, met
er; N
A, n
ot a
pplic
able
]
Site
Dom
ain
area
1Po
ur p
oint
Dom
ain
area
2Po
ur p
oint
Dom
ain
area
3Po
ur p
oint
Tota
l are
a (k
m2 )
Dra
inag
e ar
ea a
t pla
nt
(km
2 )
Buf
fer
wid
th
(m)
Buf
fer
area
(k
m2 )
(km
2 )La
titud
eLo
ngitu
de(k
m2 )
Latit
ude
Long
itude
(km
2 )La
titud
eLo
ngitu
de
Palis
ades
20.7
42.2
959
-86.
3081
23.1
42.3
147
-86.
3197
0.0
NA
NA
45.2
43.9
151.
3Pa
lo V
erde
21.9
33.4
012
-112
.855
522
.433
.345
6-1
12.8
643
5.1
33.3
198
-112
.860
549
.444
.39
0.0
Peac
h B
otto
m4.
839
.755
8-7
6.28
255.
139
.756
6-7
6.26
632.
439
.754
8-7
6.24
8412
.39.
932
0.0
Perr
y7.
141
.775
3-8
1.13
6713
.141
.799
7-8
1.15
460.
0N
AN
A20
.220
.210
0.0
Pilg
rim0.
241
.942
8-7
0.58
191.
141
.945
1-7
0.57
500.
0N
AN
A1.
31.
31
0.0
Poin
t Bea
ch0.
044
.274
7-8
7.53
115.
744
.274
7-8
7.53
110.
0N
AN
A5.
75.
78
0.0
Prai
rie Is
land
51,2
87.3
44.8
937
-93.
1770
64,6
84.4
44.6
186
-92.
6236
113,
058.
941
.484
1-9
0.62
0023
7,38
5.2
115,
971.
735
14,
108.
8Q
uad
Citi
es1 1
5,75
6.9
44.7
459
-92.
8025
112,
618.
241
.726
0-9
0.31
6721
8,62
1.0
38.8
130
-90.
1164
459,
419.
122
8,37
5.1
633
12,4
23.1
Riv
er B
end
1,03
5,04
6.9
36.9
815
-89.
1299
959,
958.
030
.739
9-9
1.36
1117
0,96
8.8
29.3
079
-89.
3731
2,21
2,28
0.7
1,99
5,00
4.9
702
46,3
07.0
Rob
inso
n21
7.3
34.5
418
-80.
1712
224.
434
.402
9-8
0.15
1839
9.7
34.2
908
-79.
8275
915.
644
1.7
5874
.2Sa
int L
ucie
7,84
7.9
27.0
470
-80.
7682
8,14
6.2
27.1
701
-80.
1855
0.0
NA
NA
15,9
94.1
15,9
94.1
1,20
70.
0Sa
lem
15,7
62.5
40.6
891
-75.
2031
13,5
92.4
39.4
596
-75.
5519
1,28
0.4
39.2
656
-75.
3491
66,5
90.2
29,3
54.9
3,98
135
,954
.9Sa
n O
nofr
e0.
0N
AN
A13
.633
.369
8-1
17.5
587
0.0
NA
NA
13.6
13.6
600.
0Se
abro
ok3.
542
.900
7-7
0.83
753.
642
.896
6-7
0.83
5835
.442
.896
4-7
0.82
1142
.57.
131
0.0
Sequ
oyah
24,7
41.6
35.7
836
-84.
2603
28,6
60.1
35.2
125
-85.
0904
52,4
32.3
37.0
757
-88.
5683
119,
014.
853
,401
.776
513
,180
.8Sh
earo
n H
arris
55.1
35.6
322
-78.
9043
55.2
35.6
028
-78.
9589
96.6
35.5
305
-78.
9766
426.
511
0.2
379
219.
7So
uth
Texa
s0.
0N
AN
A80
.228
.708
0-9
6.04
170.
0N
AN
A80
.280
.232
20.
0Su
mm
er6,
419.
734
.839
3-8
1.45
735,
603.
334
.292
7-8
1.34
0210
,064
.033
.702
6-8
0.59
8925
,821
.512
,023
.066
63,
734.
5Su
rry
12,3
48.3
37.7
157
-78.
3298
12,3
17.7
37.2
061
-76.
6664
2,00
5.5
36.9
786
-76.
3486
51,3
95.7
24,6
66.1
4,38
424
,724
.1Su
sque
hann
a12
,797
.041
.917
5-7
6.51
7213
,728
.241
.084
4-7
6.12
9824
,584
.440
.397
5-7
7.01
4252
,655
.226
,525
.224
91,
545.
6Th
ree
Mile
Isla
nd29
,279
.440
.876
6-7
6.79
5335
,299
.440
.154
3-7
6.74
056,
643.
939
.543
7-7
6.07
5883
,422
.264
,578
.82,
638
12,1
99.5
T urk
ey P
oint
0.0
NA
NA
301.
925
.442
7-8
0.33
030.
0N
AN
A30
1.9
301.
968
0.0
Verm
ont Y
anke
e8,
105.
243
.841
3-7
2.18
278,
108.
142
.771
4-7
2.51
3012
,958
.541
.272
6-7
2.33
1131
,379
.116
,213
.330
82,
207.
3Vo
gtle
11,2
97.4
33.9
581
-82.
5680
9,98
7.2
33.1
220
-81.
7120
5,84
0.2
32.0
348
-80.
8831
27,8
05.1
21,2
84.6
9368
0.3
Wat
erfo
rd1,
035,
046.
936
.981
5-8
9.12
9996
1,29
3.2
29.9
997
-90.
4675
169,
633.
629
.307
9-8
9.37
312,
209,
425.
01,
996,
340.
165
643
,451
.3W
atts
Bar
23
,046
.735
.958
8-8
3.85
0221
,734
.735
.596
4-8
4.77
9644
,791
.235
.711
3-8
8.03
3795
,378
.844
,781
.438
35,
806.
2W
olf C
reek
33.5
38.2
580
-95.
7148
34.4
38.2
067
-95.
6869
22.5
38.1
475
-95.
7066
106.
367
.946
15.9
64 Assessing Inundation Hazards to Nuclear Powerplant Sites Using Histories of Riverine Floods, Tsunamis, and Storm Surges
Table A2. Reclassification of geologic rock types in high, medium, and low categories for producing and preserving paleoflood deposits.
[Geologic rock type from the lithology description from U.S. Geological Survey and British Columbia Geological Survey digital maps (table 2). Abbreviations: Med, medium; U.S., United States; BC, British Columbia, Canada]
Geologic rock type
Reclassification of geologyData
source
Sediment producing
environment
Depositional preservation environment
U.S./BC
Alkalic intrusive rock High Med U.S.Alkali-feldspar syenite High Med U.S.Alkaline volcanic rocks Low Med BCAlluvial fan Med Low U.S.Alluvial terrace Med Low U.S.Alluvium Med Low U.S.Amphibole schist High Med U.S.Amphibolite High Med U.S.Andesite Low Med U.S.Andesitic volcanic rocks Low High BCAnorthosite High Med U.S.Aplite High Med U.S.Arenite High Med U.S.Argillite Low Med U.S.Argillite, greywacke, wacke,
conglomerate turbiditesLow Med BC
Arkose High Med U.S.Ash-flow tuff Low Med U.S.Augen gneiss High Med U.S.Basalt Low Med U.S.Basaltic volcanic rocks Low Med BCBeach sand High Low U.S.Bimodal suite Med Med U.S.Biotite gneiss High Med U.S.Black shale Low Med U.S.Calc-alkaline volcanic rocks Low Med BCCalcarenite High High U.S.Calcsilicate metamorphic rocks High Med BCCalc-silicate rock High Med U.S.Carbonate rock Low High U.S.Charnockite High Med U.S.Chert Low High U.S.Chert, siliceous argillite,
siliciclastic rocksLow High BC
Clastic rock Med Med U.S.Clay or mud Low Low U.S.Claystone Low Med U.S.Coarse clastic sedimentary
rocksMed Med BC
Coarse-grained mixed clastic rock
Med Med U.S.
Conglomerate Med Med U.S.Conglomerate, coarse clastic
sedimentary rocksMed Med BC
Dacite Low Med U.S.Delta Med Low U.S.Diabase Med Med U.S.Diorite High Med U.S.Dioritic intrusive rocks High Med BC
Geologic rock type
Reclassification of geologyData
source
Sediment producing
environment
Depositional preservation environment
U.S./BC
Dolomitic carbonate rocks Low High BCDolostone Low High U.S.Dune sand Med Low U.S.Dunite Med Med U.S.Eolian material High Low U.S.Evaporite Low Low U.S.Feldspar porphyritic intrusive
rocksHigh Med BC
Felsic gneiss High Med U.S.Felsic metavolcanic rock Med Med U.S.Felsic volcanic rock Low Med U.S.Fine-grained mixed clastic rock Low Low U.S.Gabbro Med Med U.S.Glacial drift Med Low U.S.Glacial outwash sediment High Low U.S.Glaciolacustrine sediment Low Low U.S.Gneiss High Med U.S.Granite High Med U.S.Granite, alkali feldspar granite
intrusive rocksHigh Med BC
Granitic gneiss High Med U.S.Granitoid High Med U.S.Granodiorite High Med U.S.Granodioritic intrusive rocks High Med BCGranofels High Med U.S.Granulite High Med U.S.Gravel Med Low U.S.Graywacke Low Med U.S.Greenstone Low Med U.S.Greenstone, greenschist
metamorphic rocksLow Med BC
Hornblendite Med Med U.S.Hornfels Low Med U.S.Ignimbrite Med Med U.S.Intermediate metavolcanic rock Low Med U.S.Intrusive rocks, undivided Med Med U.S.Iron formation Low Med U.S.Lake or marine sediment Low Low U.S.Lamprophyre Med Med U.S.Landslide Low Low U.S.Latite Low Med U.S.Lava flow Low Med U.S.Limestone Low High U.S.Limestone, marble, calcareous
sedimentary rocksLow High BC
Limestone, slate, siltstone, argillite
Low High BC
Loess Med Low U.S.
Appendix A 65
Table A2. Reclassification of geologic rock types in high, medium, and low categories for producing and preserving paleoflood deposits.—Continued
[Geologic rock type from the lithology description from U.S. Geological Survey and British Columbia Geological Survey digital maps (table 2). Abbreviations: Med, medium; U.S., United States; BC, British Columbia, Canada]
Geologic rock type
Reclassification of geologyData
source
Sediment producing
environment
Depositional preservation environment
U.S./BC
Lower amphibolite/kyanite grade metamorphic rocks
High Med BC
Mafic gneiss High Med U.S.Mafic metavolcanic rock Low Med U.S.Mafic volcanic rock Low Med U.S.Marble Low High U.S.Marine sedimentary and
volcanic rocksLow Med BC
Medium-grained mixed clastic rock
Med Low U.S.
Melange Low Med U.S.Meta-argillite Low Med U.S.Metabasalt Low Med U.S.Metaconglomerate Med Med U.S.Metamorphic rock Med Med U.S.Metamorphic rocks, undivided Med Med BCMetarhyolite Low Med U.S.Metasedimentary rock Med Med U.S.Metavolcanic rock Low Med U.S.Mica schist High Med U.S.Migmatite Med Med U.S.Mixed carbonate/clastic rock Med Med U.S.Monzonite High Med U.S.Moraine Med Low U.S.Mudstone Low Med U.S.Mudstone, siltstone, shale fine
clastic sedimentary rocksLow Med BC
Mudstone/laminite fine clastic sedimentary rocks
Low Med BC
Mylonite Med Med U.S.Nepheline syenite High Med U.S.No data Med Med U.S.Norite Med Med U.S.Novaculite Low Med U.S.Orthogneiss High Med U.S.Orthogneiss metamorphic rocks High Med BCParagneiss High Med U.S.Paragneiss metamorphic rocks High Med BCPeat Low Low U.S.Pegmatite High Med U.S.Pegmatitic intrusive rocks High Med BCPelitic schist Low Med U.S.Peraluminous granite High Med U.S.Peridotite Med Med U.S.Phyllite Med Med U.S.Phyllonite Med Med U.S.Plutonic rock High Med U.S.Pyroxenite Med Med U.S.Quartz diorite High Med U.S.Quartz latite Low Med U.S.
Geologic rock type
Reclassification of geologyData
source
Sediment producing
environment
Depositional preservation environment
U.S./BC
Quartz monzodiorite High Med U.S.Quartz monzonite High Med U.S.Quartz monzonitic intrusive
rocksHigh Med BC
Quartz syenite High Med U.S.Quartz-feldspar schist High Med U.S.Quartzite Med High U.S.Quartzite, quartz arenite
sedimentary rocksMed High BC
Rhyodacite Low Med U.S.Rhyolite Low Med U.S.Rhyolite, felsic volcanic rocks Low Med BCSand High Low U.S.Sandstone High Med U.S.Schist High Med U.S.Sedimentary breccia Med Med U.S.Sedimentary rock Med Med U.S.Serpentinite Med Med U.S.Serpentinite ultramafic rocks Med Med BCShale Low Med U.S.Silt Low Low U.S.Siltstone Low Med U.S.Slate Low Med U.S.Stratified glacial sediment Med Low U.S.Syenite High Med U.S.Syenitic to monzonitic
intrusive rocksHigh Med BC
Tectonic breccia Med Med U.S.Terrace Med Low U.S.Tholeiite Low Med U.S.Till Low Low U.S.Tonalite High Med U.S.Tonalite intrusive rocks High Med BCTrachytic volcanic rocks Low Med BCTrondhjemite High Med U.S.Tuff Med Med U.S.Ultramafic intrusive rock Med Med U.S.Ultramafic rock Med Med U.S.Ultramafic rocks Med Med BCUltramafitite Med Med U.S.Unconsolidated material Med Low U.S.Undivided sedimentary rocks Med Med BCUndivided volcanic rocks Low Med BCUnknown Med Med U.S.Volcanic breccia Med Med U.S.Volcanic rock Low Med U.S.Volcaniclastic rocks Med Med BCWacke Low Med U.S.Water Low Low U.S.
Publishing support provided by the U.S. Geological Survey Science Publishing Network, Tacoma Publishing Service Center
For more information concerning the research in this report, contact theDirector, Oregon Water Science CenterU.S. Geological Survey2130 SW 5th AvenuePortland, Oregon 97201http://or.water.usgs.gov