64
Assessing the demand for labour in the Capital Goods Sector in Maharashtra Status: Final version Date: 29 March 2016

Assessing the demand for labour in the Capital Goods Sector in Maharashtra
Status: Final version
Date: 29 March 2016
2
Table of content
Chapters
Table of content 2
Executive summary 4
Introduction 4
Participating companies and their workforce 4
Employee turnover and recruitment 5
Women and people with disabilities 6
Opinions on the economic situation 6
Training of employees 6
Employee benefits 7
Conclusions 7
1 Introduction 9
1.1 The India EU Skills Development Project 9
1.2 The Capital Goods Skill Council 9
1.3 A labour market analysis of the sector 10
2 Context of the study 11
2.1 The economy and labour market in Maharashtra 11
2.2 Specific features of the capital goods sector 11
3 Methodology 13
3.1 Data collection methodology 13
3.2 Selection of companies for the enterprise survey 14
3.3 Data analysis 16
3.4 Limitations of the study 16
4 Findings 18
4.1 Characteristics of the participating companies 18
4.2 Composition of the workforce 19
4.3 Employee turnover and recruitment & selection of new employees 27
4.4 Opinions on and expectations for the economic situation of the sector 38
4.5 Training and training providers 44
4.6 Employee benefits and the going rates for the most common job roles 47
4.7 Technical information on CNC setters cum operators and on Fitters-Fabrication 52
5 Conclusions and recommendations 58

3
5.1 Set up a system for labour market analysis 58
5.2 Active involvement in future labour market analyses 58
5.3 Determine the size of the unorganised sector 59
5.4 Use the information about the most common job roles 60
5.5 Recruitment and selection 60
5.6 Supply of labour for common job roles 61
5.7 Role of companies and training providers in education and training 62
5.8 Career paths 63
6 List of consulted documents 64
List of figures Figure 1 - Reasons for higher turnover and recruitment problems (in number of companies) *) 30 Figure 2 - Approach to higher turnover and recruitment problems (in number of companies) *) 30 Figure 3 - Methods to recruit new employees by company size (in terms of number of workers) 31 Figure 4 - Criteria used for the selection of workers 33 Figure 5 - Criteria for the selection of contractors 33 Figure 6 – Where do you recruit new employees? Figure 7 - Would you recruit under- or overqualified employees? 34 Figure 8 - Most common job roles for which women and disabled persons would be considered 36 Figure 9 - Rating of the current and last year’s economic situation 37 Figure 10 - Expected economic developments 40 Figure 11 - Type of training use to train new employees *) 45 Figure 12 - Nature of relationship between companies and training institutes *) 46 Figure 13 - Most important issues when dealing with training institutes 47 Figure 14 - Employee benefits 48 Figure 15 - Minimum and maximum going rates for the most common job roles for employees and
contract workers 51 Figure 16 - Rating the skills and knowledge of staff in the field of CNC work, graduates in this field
and/or the importance of this for the company 54 Figure 17 -- Rating of the skills and knowledge of workers in field of fitter fabrication, graduates in this
field and/or the importance of this for the company 56
List of tables Table 1 - Response by division and number of additional participants through recommendation 15 Table 2 - Characteristics of participating companies 18 Table 3 - Number of workers by category and sub-sector 20 Table 4 - Job roles mentioned by job role category and distribution by company size (in terms of workers) 23 Table 5 - Job roles mentioned by job role category and distribution by sub-sector 24 Table 6 - Number of workers per job role category by sub-sector 26 Table 7 - Number of workers in differnt categories of workers by job role category 27 Table 8 - Employee turnover compared to last year by sector, division, average number of workers
and vacancies 28 Table 9 – Reported issues concerning turnover, recruitment and skill problems for the most common
job roles 29 Table 10 - Changes in the size of the workforce in the last year 39 Table 11 - Does the company plan for capital investments in the next year? 41 Table 12 - Expected changes in the size of the workforce in the next year 43
4
Executive summary
Introduction The capital goods sector is regarded a strategic sector for the development of India’s economy,
which is why the development of capabilities for the sector is considered essential from the
perspective of national self-reliance and security. The capital goods industry contributes 12% to the
total manufacturing output and about 1.8% to the country’s Gross Domestic Product (GDP).
In May and June 2015, the India –EU skill project and the Capital Goods Skill Council (CGSC) have
conducted an enterprise survey among capital goods companies in the state of Maharashtra.
Maharashtra is the second largest state in India with a relatively high Gross State Domestic Product
(GSDP), which has been growing rapidly over the last few years. The industrial and service sectors
account for 23% and 64% of the GSDP respectively while the remaining 13% comes from the
agriculture sector. This contrasts with the distribution of labour force over the different sectors, i.e.
64% in agriculture, 14% in industrial sectors and 22% in services. A large number of workers work is
estimated to work in the unorganised sector and unorganised workers are present in most economic
sectors.
The project recruited external interviewers to collect primary data during structured interviews. The
focus of the study was on assessing the occupational structure, human resources management
practices and skill needs in the capital goods industry, as well as on the collection of information for
the development of curricula for CNC-Setter-cum-operator and Fitter-Fabrication. The findings and
conclusions are mostly of a qualitative nature, meant to better understand the composition of the
labour force, employee turnover, recruitment and selection practices and problems, expected
economic developments, workforce training practices, the nature and problems in relationships
between companies and training providers, etc. In short, the collected information would need to
improve our understanding of labour market developments in the sector in Maharashtra, allowing
for appropriate measures and initiatives, for example in the field of education and training.
This being the first of its kind survey for the Capital Goods Sector, the response rate was low so the
researchers had to adopt a non-probability (i.e. not random) method of “snowball sampling” or
“referral sampling”. Though some unorganised sector companies took part in the survey, the main
focus was on the organised sector, commencing with the members of sub sectoral associations
represented on the Governing Council of Capital Goods Skill Council. Taking this into account, as well
as the fact that the findings of the study cannot be compared to the results of any previous surveys,
it is recommended to validate the finding with one or more future surveys.
Participating companies and their workforce Representatives of a total of 105 companies participated in the enterprise survey. The two biggest
sub-sectors were machine tools, and dies, moulds and press tools. Smaller sub-sectors in the survey
are light engineering goods, other capital goods sectors, and the unorganised sector. Half of the
companies were based in Pune, almost a third in Mumbai, and 10% and 8% were based in
Aurangabad and Nashik respectively. In terms of the number of workers, 41% were small size
companies, 37% medium size, 13% large, and the remaining 9% were from the unorganised sector.
Companies that took part in the survey had on average 220 workers and 6.5 vacancies. On average
they had 70% permanent employees, 12% contract workers, 10% temporary employees and 5%
trainees. Only 1% of the positions were vacant and the share of casual workers was negligible.

5
In terms of number of workers, companies producing dies, moulds and press tools were relatively
small with an average of 88 workers. This was also the case for companies based outside Pune,
especially in Konkan division where the average number of workers was 60. The average number of
workers in the participating unorganised sector companies was 6.3.
In terms of vacancies, small and medium-sized companies had a higher vacancy rate than other
companies, i.e. 3% and 4% on average respectively. This was also the case for companies producing
dies, moulds and press tools, where 6% of the positions were vacant on average. The vacancy rate in
Pune was lower than in the other divisions (i.e. 1% versus 2%) and higher in unorganised sector
where 7% of the positions was vacant.
Though there were major differences in the composition of the workforce in the different sub-
sectors, six job role categories accounted for more than two thirds of the workers in the most
common job roles in the participating companies. These job role categories are:
Design Roles - Designer / draughtsman
Machinist Roles - CNC operator
Machinist Roles - Conventional machine operator
Production Roles - Assembly - Fitter – Mechanical / Maintenance
Welding and Related Roles
Projects and Planning Roles
The number of vacancies for CNC operators and project and planning roles is relatively high
compared to the number of workers in these job role categories. On the other hand, the number of
vacancies for welders and related roles and for fitter – mechanical / maintenance is relatively low.
Employee turnover and recruitment Two out of five companies reported that turnover was higher for staff in the most common job roles
than in other job roles and 58% reported recruitment problems for these job roles. The higher
turnover concerned 11% of the most common job roles and recruitment problems were reported for
22% of the most common job roles. Retention strategies involved mostly financial measures, though
non-financial measures have been reported as well.
Skill related problems were mentioned for 10% of the most common job roles, especially for CNC
operator job roles, followed by tool and die makers, conventional machine operators, welding and
related roles, and for marketing, research and service roles.
Unorganised sector and small companies used especially informal recruitment methods (like
recruitment through word of mouth, of walk-ins, through the network of the company, etc.),
whereas medium-sized and large companies preferred a combination of informal and formal
methods (such as recruitment via a training institute, advertisements on internet, etc.). The
employment exchange was not a favoured recruitment method by any category of companies.
Almost half of the participating companies recruit employees from all over India and a third only
from the places near the companies. Selection criteria vary significantly between sub-sectors. For
example, unorganised sector companies gave little importance to certificates, diplomas or degrees
but preferred to recruit underqualified workers, while having the right qualifications was much more
important for larger companies. Work experience is more important for smaller companies than for
larger ones, and micro-sized and large companies laid greater importance to references of previous
employers than small and medium-sized companies. None of the companies want to work with over-
qualified workers.

6
Women and people with disabilities Though two thirds of the companies employed women, the share of women in the workforce is not
big (i.e. 4%). The situation is similar for persons with disabilities: 13% of the companies had employed
one or more persons with a disability but the share of this group in the labour force is negligible.
Nevertheless, half of the respondents indicated that they would consider recruiting women and 30%
would consider recruiting disabled persons for the most common job roles. When asked to specify
for which job roles, respondents indicated that they would recruit women for job role categories like
designer / draughtsman, CNC Programmer, CNC (setter cum) operator, and quality, managerial and
supervisory roles. Fewer job role categories were mentioned for disabled people, i.e. CNC
Programmer, designer / draughtsman and CNC operator.
Opinions on the economic situation When respondents were asked to rate the current economic situation, the responses were not very
positive. Respondents of companies producing dies, moulds and press tools and respondents of
companies based in Pune are more positive than others, while respondents of unorganised sector
companies and respondents of companies based in Konkan rate the situation more negative than
others. On the other hand, the workforce of the respondents’ companies did increase in the last
year. The reported increase was bigger for companies producing dies, moulds and press tools, as well
as for companies based in Konkan division and for medium-sized companies. The increase involved
especially job role categories like CNC operators and assembly fitters mechanical/maintenance, and
to a lesser extend marketing, research and service roles. Decreases were reported for quality roles,
helpers and component fabrication and preparation.
The respondents appeared positive about the future: three out of four participants believed that the
economic situation will improve in the year to come, especially of companies producing “other”
capital goods1. About two-fifths of the companies plan for capital investments, which can be
regarded as an indicator of the level of confidence of the participating business representatives. The
majority of the capital investments plans concerned the adoption of new technology that will change
the way of working in the company. Respondents expected that the workforce will grow in the year
to come, but only a few companies specified the job roles for which this would be the case. The ones
that did, mentioned especially fabrication fitters, CNC operators, conventional machine operators
and staff in project and planning roles.
Training of employees Practically all companies train new employees.. The most common type of training was on the job
and about a third of the participants had non-formal/structured training programme in the company.
Slightly fewer companies used formal training by an outside provider.
Two out of five participating companies had a direct relation with training providers. The nature of
the relationship between the companies and the training institutes differed, but recruitment
activities were an important part. Another important element was that apprenticeship students or
trainees of the training institutes were placed in the company, and a third of the companies co-
operated with visits of the students to the company. A very small number of companies provided the
institutes with training facilities. Typical concerns when dealing with training providers were the use
of outdated curricula resulting in students lacking necessary knowledge and skills, the institute’s staff
1 Other capital goods are specified in Table 2, and include companies producing process plant equipment,
tools & gauges, power & electrical equipment, textile machinery, and material handling and lifting
equipment.

7
lacking skills, students lacking motivation, and the absence of a good training infrastructure in the
institutes. Many participants remarked that there is a gap between the quality of the students with a
certificate or diploma and the needs of the companies and that training should be up-to-date and
with a strong “practice oriented” component.
Employee benefits Most common employee benefits were medical insurance or medical services for employees,
bonuses and paid leave days. Other employee benefits offered by a relatively big share of
respondents were bonuses and gratuity.
Respondents have given the minimum and maximum wages they would need to pay when recruiting
new employees and contract workers for the most common job roles. The wages for employees are
substantially higher than for contract workers. It seems that contract workers are especially hired for
relatively simple jobs which would justify a lower rate, and jobs that require dealing with strategic
information are generally not done by contract workers. The range between the minimum and
maximum rate for employees is much larger for some job role categories than for others. For
example, for categories like designer/draughtsmen, quality roles, projects and planning roles, and
marketing, research and service roles, the rate range is much larger than for welding and related
roles, helpers, and CNC setter cum operator roles. This suggests that the first mentioned group of job
role categories offers potential for professional growth, while employees in the second group of job
role categories have less room for growth.
Conclusions Based on the findings, the experts have formulated several recommendations on the following
subjects:
1. The role of the CGSC in future labour market analyses
2. Determining the share of the unorganised sector in the capital goods sector
3. The use of the most common job roles identified during this labour market analysis when
updating the National Occupational Standards/Qualification Packs (NOS/QPs)
4. The need for labour market analysis on a regular basis to understand fluctuations and
differences in the labour market.
5. The role of public and private employment services organisations, the possibility that
retention strategies can conflict with recognition of prior learning initiatives, targeting labour
market shortages by targeting less common groups of workers (like women, workers with a
disability) and the planning of education and training based on the location of the demand
for labour
6. The need for skill development programmes to target job roles for which there are current
shortages (i.e. high turnover, recruitment problems, skill problems)
7. The need for training providers to take an active role in collaboration with employers to offer
training with more opportunities for the students to acquire practical skills, the need to
review the use of equipment and tools in the training centres in vocational education, the
role of training providers in the upgrading of skills of the current workforce and the need to
develop or evaluate curricula based on the inputs of employers.
8. The need to include information about career paths in the NOS/QPS, career progression as
retention strategy for all workers and the inclusion of career path information in curricula
development for education and training.

8
The information about CNC-setters-cum-operators and fitters-fabrication, which was collected
through a separate questionnaire, has been briefly presented in this report and will be used to
evaluate curricula for these job roles.

9
1 Introduction
1.1 The India EU Skills Development Project
The India-EU Skills Development project funded by the European Union assists the National Skill
Development Agency (NSDA) and selected State Skill Development Missions (SSDMs) and Sector Skill
Councils (SSCs) in implementing policies aimed at skilling a large numbers of Indian men and women
to increase their employability and entrepreneurship, as a precondition of economic and social
development. The project does this by using international experience for developing institutional
capacities in the Indian context, by helping to define standards and procedures of implementing the
National Skill Qualification Framework (NSQF) and by supporting the development of the Indian
Labour Market Information System (LMIS). At the ground level the project experts work with the
Indian partners on piloting Labour Market Analyses through enterprise surveys to determine the
structure of the workforce, human resources management practices and training needs. Project
experts and Indian partners also work on developing and testing examples of competence based
curricula and on training the trainers and assessors.
One component of the Project has been tasked to enhance labour market and analyses at the
national as well as the state/industrial cluster level. The intention is to build on what has already
been achieved, to identify gaps and to support improvement. More specifically in regards to labour
market information at the state/cluster level, it is planned to pilot new or amended methods of
implementing a sector LMA, drawing on resources allocated by the Sector Skills Councils. These
sector LMAs report on specific aspects of the labour market, and the outcomes can be used to target
(quantitative and qualitative) labour market constraints and the development of new skill developing
programmes or the update of existing ones.
1.2 The Capital Goods Skill Council The Capital Goods Skill Council (CGSC) is responsible for the skills development for the capital goods
sector in India. The CGSC is a not-for-profit organisation, registered under the Societies Registration
Act, 1860. The Council has been promoted by the Federation of Indian Chambers of Commerce and
Industry (FICCI) and by the Department of Heavy industries (DHI) and receives financial support by
National Skill Development Corporation (NSDC).
The purpose of establishing CGSC is to ensure that the capital goods industry is able to grow with
skilled manpower, as well as to increase its productivity and profitability.
The CGSC is expected to create a dynamic LMIS to keep track of the labour market skill gaps, to
develop occupational standards, to facilitate the development of practical and high quality training
content, and to ensure adequate availability of faculty through “Train The Trainer” initiatives. It will
also build accreditation and certification mechanisms, and encourage capacity building through
private sector participation.
To achieve the objective of creating a robust and vibrant eco-system for quality education and skill
development in the capital goods sector, the CGSC has the mandate to:

10
Identify skill development needs, including the preparation of a catalogue of types of skills,
range and depth of skills to facilitate individuals to choose from them;
Develop of a sector skill development plan and maintain a skill inventory;
Determine skills/competency standards and qualifications.
Standardise affiliation and accreditation processes;
Participate in affiliation, accreditation, examination and certification;
Plan and execute training of trainers;
Promote academies of excellence;
Establish a well-structured sector specific LMIS to assist the planning and delivery of training.
1.3 A labour market analysis of the sector In line with the objectives of the project and of the CGSC, the following objectives have been set for
the LMA:
To test a methodology to collect primary data on human resources management practices,
training needs and skills requirements for technical workers/employees,
To better understand the skills demand and human resource management practices in the
sector, and
To collect information for the development of curricula for the job roles of CNC-Setter-cum-
operator and Fitter-Fabrication.
In May and June 2015, the project and the Capital Goods Skill Council (CGSC) have implemented a
labour market analysis in the state of Maharashtra. The findings of this study are presented in this
technical report. The methodology has been evaluated in a “lessons learned” report, in order to
highlight positive and practical learning that can be used for future, similar exercises.

11
2 Context of the study
2.1 The economy and labour market in Maharashtra Maharashtra is the second largest state in India, both in terms of population and geographic area.
According to the 2011 census the State has a population of approximately 11 crore, which is 9.3% of
India’s entire population. 45% of the population resides in urban areas, which also makes
Maharashtra one of the most urbanised states in India.
The gross state domestic product (GSDP) at current prices for 2013-14 is estimated at 15 10 132
crores and contributes about 14.4% of the overall GDP of India. The GSDP has been growing rapidly
over the last few years. At present industrial and service sectors together contribute approximately
87.1% of the State’s income. The agriculture sector and related activities contribute the remaining
12.9% of the State’s income.
The calculations of GSDP between 2004-05 and 2009-10 show high economic growth rates for
Maharashtra in the last decade. Between 2004-05 and 2009-10, Maharashtra’s economy grew at
11.1%, a faster rate than in comparative states and more than the all-India average of 9%.
Though agriculture contributes only 13% to the GSDP of Maharashtra, 64% of the labour force is
active in this sector. Maharashtra, unlike other States, has only a small proportion of the share of
employment in the industrial sector, amounting to just 14%. This is despite the fact that the
industrial sector has a rather large contribution to the GSDP. In the service sector, the labour force is
relatively small (22%) but contributes a large share of GSDP (64%), which points to high labour
productivity in the sector.
The draft labour policy 2011 for Maharashtra highlights that a large number of workers operate in
the unorganised sector. These include:
Shops and establishments sector workers,
Agricultural workers,
Almost 2 000 000 domestic workers,
Building and construction workers,
Loading and unloading workers, and
Almost 32 000 security guards.
In addition to these groups of unorganised sector workers, which have been mentioned in the
Maharashtra labour policy, most other economic sectors also have a share of unorganised workers
contributing in some way to the performance of the sector.
2.2 Specific features of the capital goods sector Capital Goods sector comprises the production of plant and machinery, equipment /accessories
required for manufacture / production, either directly or indirectly, of goods or for rendering
services, including those required for replacement, modernization, technological up-gradation and
expansion. It also includes packaging machinery and equipment, refrigeration equipment, power
generating sets, equipment and instruments for testing, research and development, quality and
pollution control.

12
The capital goods sector is crucial for the development of India’s economy for the two reasons.
Firstly, the capital goods sector is considered a strategic sector and the development of the necessary
capabilities because the sector is essential from a national self-reliance and security perspective.
Secondly, the capital goods sector has a direct effect on the growth of the user industries as it
provides critical input, i.e., machinery and equipment, to the remaining sectors covered under the
manufacturing activity. The capital goods industry contributes 12% to the total manufacturing
activity (which is about 15% of the GDP).
With a view to achieve 9% growth in GDP during the 12th Five Year Plan, the manufacturing industry
should grow at least by 11% to 13% per annum. This would mean that the Capital Goods sector,
which is considered to be the core of manufacturing, should grow at around 17% to 19%
(Department of Heavy Industry, 2011)).
Economic performance of the capital goods sector is linked with that of the manufacturing industry
which is the key end-user of the Capital Goods industry. The capability to manufacture most of the
major capital goods exists indigenously. However, given the superior technology competitiveness and
competitive pricing of foreign players, the sector faces a stiff competition from imported
machineries. The output of the sector is concentrated with a top few companies in most product
groups, followed by a section of companies comprising medium to small scale players. Indian
companies lack export thrust as the focus is largely on the domestic market. However, some of the
larger players are exploring export market growth targeted especially towards the Middle East and
Asian markets. The sector is expected to rely on government support in areas like export financing
and promotion to tap vast global capital goods market opportunity (National Skill Development
Corporation, 2012).

13
3 Methodology
For the Labour Market Analysis (LMA) Information from secondary and primary sources has been
collected to understand the situation in the labour market for companies producing capital goods in
the state of Maharashtra. Sources of secondary information were information portals of the
government of India and the government of Maharashtra. Also, the CGSC has provided the
consultants with reports on previous research in the sector and with the qualification profiles that
have been developed for 56 job roles that are common in the sector. Of these 56 qualification
profiles, 31 were final and 25 were under public view at the time of the implementation of the
survey, and can still be changed. See the list of consulted documents on page 64 for more
information.
Primary data has been collected during an enterprise survey in the Maharashtra in May and June
2015. Prior to and in parallel with the implementation of the survey, primary (qualitative)
information has also been collected from representatives of the CGSC and from the project’s expert
in skills development for the capital goods sector, Mr Michael Wolf.
Findings based on secondary data and on (primary) information collected from the CGSC and the
project’s sector expert have been presented in the previous chapters. The collected primary
information have been included in chapter 4.
3.1 Data collection methodology For the collection of primary data for this study, the experts have developed three structured
questionnaires for
1. Companies in the organised sector
2. Companies in the unorganised sector
3. Shop floor managers of CNC setter cum operators and fitters fabrication
The questionnaires have been discussed in detail with representatives of the CGSC. All
questionnaires are included in Appendix 1.
The first questionnaire has been used most and has been designed to collect information from
companies that are not part of the unorganised sector. It covers subjects like the occupational
structure of companies, skills and training needs, common practices in recruitment and training, the
economic situation in the sector and financial packages and benefits for workers in the most
common job roles.
The second questionnaire is designed for companies in the unorganised sector. The National
Commission for Enterprises in the Unorganised Sector (NCEUS) defines the unorganised or informal
sector as:
"… all unincorporated private enterprises owned by individuals or households engaged
in the sale and production of goods and services operated on a proprietary or
partnership basis and with less than ten total workers".
(From: National Commission for Enterprises in the Unorganised Sector, 2008, page 3)
The questionnaire for the unorganised sector is similar to the questionnaire for the organised sector,
but a number of questions have been removed because they are not so relevant for unorganised
sector companies and because the interviewers have conducted the interviews without the help of a
14
paper version of the questionnaire (so as to not to scare off potential unorganised sector
respondents) which is easier if the questionnaire is shorter.
The third questionnaire for shop floor managers that supervise CNC setters cum operator and/or
fitters-fabrication contains specific questions about the number of workers in these job roles, skills
and knowledge of recent school leavers and current workers in these job roles, and about equipment
that is currently used in the company.
The questionnaires consist for the most part of closed questions, resulting in discrete quantitative
information on a range of subjects. Yet the questionnaire also contained open questions, resulting in
qualitative data that has been clustered in the final stages for analysis and presentation here.
A team of four, externally recruited, interviewers guided by labour market analysis experts of the
project, collected the data directly from companies during face-to-face interviews with a company
representative that is familiar with human resources management practices in the company, and
with the shop floor manager supervising CNC setters cum operator and/or fitters-fabrication. The
interviews to administer questionnaire 1 (and 2) took 45 minutes to 1 hour, and the interviews with
the shop floor managers took about 20 minutes per job role (i.e. about 40 minutes for interviewees
that supervised both CNC setters cum operators and fitters-fabrication).
3.2 Selection of companies for the enterprise survey
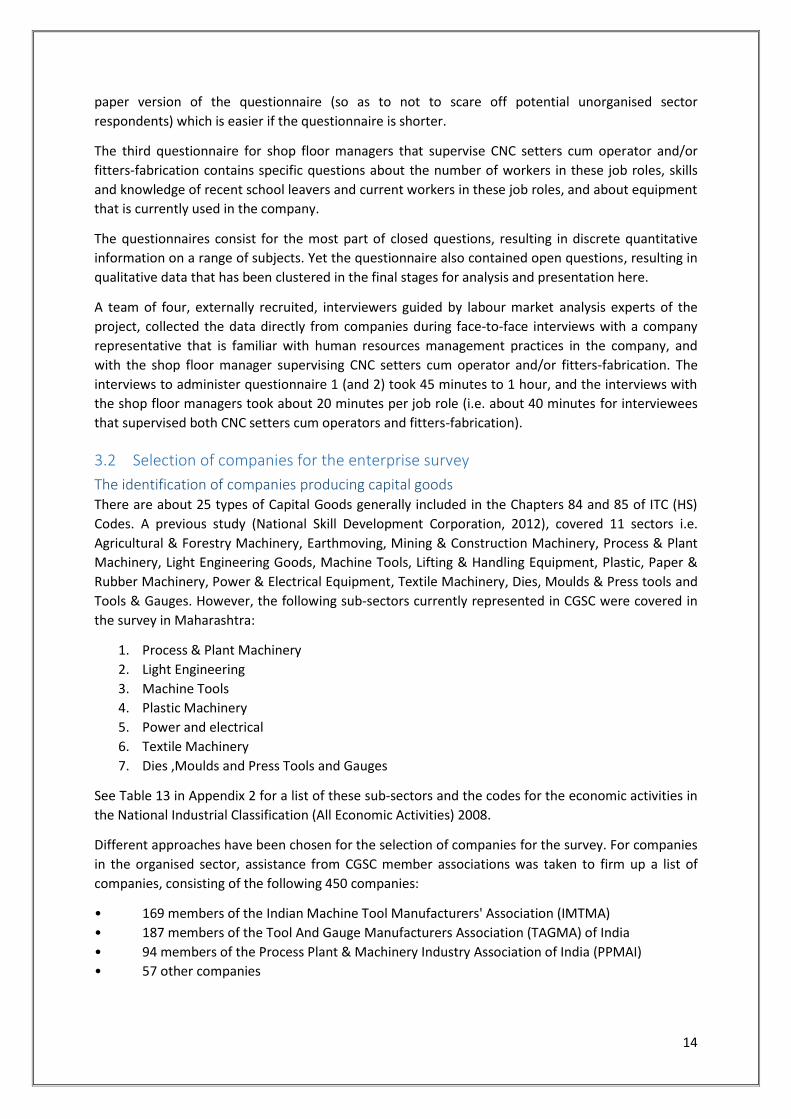
The identification of companies producing capital goods There are about 25 types of Capital Goods generally included in the Chapters 84 and 85 of ITC (HS)
Codes. A previous study (National Skill Development Corporation, 2012), covered 11 sectors i.e.
Agricultural & Forestry Machinery, Earthmoving, Mining & Construction Machinery, Process & Plant
Machinery, Light Engineering Goods, Machine Tools, Lifting & Handling Equipment, Plastic, Paper &
Rubber Machinery, Power & Electrical Equipment, Textile Machinery, Dies, Moulds & Press tools and
Tools & Gauges. However, the following sub-sectors currently represented in CGSC were covered in
the survey in Maharashtra:
1. Process & Plant Machinery
2. Light Engineering
3. Machine Tools
4. Plastic Machinery
5. Power and electrical
6. Textile Machinery
7. Dies ,Moulds and Press Tools and Gauges
See Table 13 in Appendix 2 for a list of these sub-sectors and the codes for the economic activities in
the National Industrial Classification (All Economic Activities) 2008.
Different approaches have been chosen for the selection of companies for the survey. For companies
in the organised sector, assistance from CGSC member associations was taken to firm up a list of
companies, consisting of the following 450 companies:
• 169 members of the Indian Machine Tool Manufacturers' Association (IMTMA)
• 187 members of the Tool And Gauge Manufacturers Association (TAGMA) of India
• 94 members of the Process Plant & Machinery Industry Association of India (PPMAI)
• 57 other companies
15
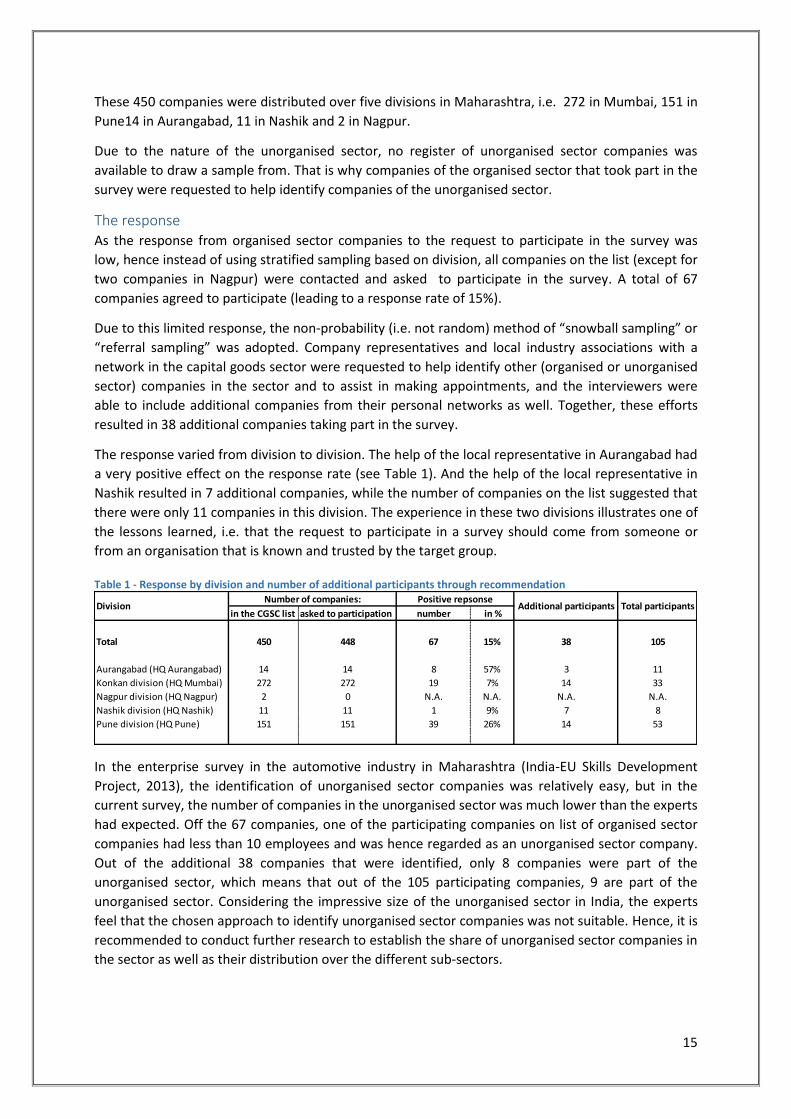
These 450 companies were distributed over five divisions in Maharashtra, i.e. 272 in Mumbai, 151 in
Pune14 in Aurangabad, 11 in Nashik and 2 in Nagpur.
Due to the nature of the unorganised sector, no register of unorganised sector companies was
available to draw a sample from. That is why companies of the organised sector that took part in the
survey were requested to help identify companies of the unorganised sector.
The response As the response from organised sector companies to the request to participate in the survey was
low, hence instead of using stratified sampling based on division, all companies on the list (except for
two companies in Nagpur) were contacted and asked to participate in the survey. A total of 67
companies agreed to participate (leading to a response rate of 15%).
Due to this limited response, the non-probability (i.e. not random) method of “snowball sampling” or
“referral sampling” was adopted. Company representatives and local industry associations with a
network in the capital goods sector were requested to help identify other (organised or unorganised
sector) companies in the sector and to assist in making appointments, and the interviewers were
able to include additional companies from their personal networks as well. Together, these efforts
resulted in 38 additional companies taking part in the survey.
The response varied from division to division. The help of the local representative in Aurangabad had
a very positive effect on the response rate (see Table 1). And the help of the local representative in
Nashik resulted in 7 additional companies, while the number of companies on the list suggested that
there were only 11 companies in this division. The experience in these two divisions illustrates one of
the lessons learned, i.e. that the request to participate in a survey should come from someone or
from an organisation that is known and trusted by the target group.
Table 1 - Response by division and number of additional participants through recommendation
In the enterprise survey in the automotive industry in Maharashtra (India-EU Skills Development
Project, 2013), the identification of unorganised sector companies was relatively easy, but in the
current survey, the number of companies in the unorganised sector was much lower than the experts
had expected. Off the 67 companies, one of the participating companies on list of organised sector
companies had less than 10 employees and was hence regarded as an unorganised sector company.
Out of the additional 38 companies that were identified, only 8 companies were part of the
unorganised sector, which means that out of the 105 participating companies, 9 are part of the
unorganised sector. Considering the impressive size of the unorganised sector in India, the experts
feel that the chosen approach to identify unorganised sector companies was not suitable. Hence, it is
recommended to conduct further research to establish the share of unorganised sector companies in
the sector as well as their distribution over the different sub-sectors.
in the CGSC list asked to participation number in %
Total 450 448 67 15% 38 105
Aurangabad (HQ Aurangabad) 14 14 8 57% 3 11
Konkan division (HQ Mumbai) 272 272 19 7% 14 33
Nagpur division (HQ Nagpur) 2 0 N.A. N.A. N.A. N.A.
Nashik division (HQ Nashik) 11 11 1 9% 7 8
Pune division (HQ Pune) 151 151 39 26% 14 53
Number of companies: Positive repsonseDivision Additional participants Total participants
16
3.3 Data analysis The interviewers noted the information on the paper questionnaires during the interviews or, in the
case of unorganised sector companies, immediately after the interview. At the end of the day, they
entered the data in the online questionnaires programmed on the Qualtrics software platform (see
www.qualtrics.com). In these online questionnaires, potential mistakes and problems were taken
into account as much as possible. Regular Microsoft software for spreadsheets and databases was
used to clean the data of any remaining mistakes.
The first steps of the analysis involved the clustering and categorisation of the answers to open
questions, the recoding of the sub-sectors based on the description of the activities in the company
and the coding of the job roles. The table in Appendix 3 holds the categorisation of companies in
different sub-sectors: for the companies that were not in the CGSC list, the sub-sector has been
chosen based on the description of the companies’ activities as given by the interviewers. If
necessary, the experts have studied web-sites and promotion materials the interviewers received
during the interview. For 35 companies on the CGSC list, the sub-sector given on the list has
remained the same, while the sub-sector for 32 other companies has been changed according to the
description of the interviewers.
The 105 respondents have mentioned 584 job roles being present in their companies. As similar job
roles can go by different names (for example, fitters-fabrication are likely to do the same work as
fabrication-welders or fitters-welders, etc.), the 584 job roles have been coded into 46 job role
names. Coding has been based on the descriptions given by the respondents and as much as possible
in line with the National Occupational Standards/Qualification Packs (NOS/QPs) that the CGSC has
developed / is currently developing (see www.cgsc.in/qualification_pack.html for more information).
It was not always possible to code the job roles in line with the NOS/QPs, sometimes because the job
roles were not specific for the capital goods sector (like administrative roles or managers) and
sometimes because (especially micro-sized and small companies tend to) have more generalist job
roles, while the NOS/QPs are developed for highly specialised job roles2.
As 46 job role names give too much detail for an analysis of the workforce in the participating 105
companies, the job role names have been merged into 20 job map developed by CGSC (Consultants
Progilence & GlobalPeers, 2014). See Appendix 4 for detailed role categories, using the occupational
information on the job role names, job role categories and the description given by the respondents.
3.4 Limitations of the study The study was designed to address the objectives described in Chapter 1. The findings of the study
can also be useful for other purposes, but whoever wants to use the information should keep the
following in mind:
• Due to limited time and limited participation, the selection method had to be amended as
described above. This means that the findings cannot be generalised for the entire capital
goods sector in Maharashtra.
• Since this was the first time ever enterprise survey to collect information about the skills in
the capital goods sector in Maharashtra, the outcomes cannot be compared to previous
2 One example of a more general job role is the role of helpers. For this job role, no qualification pack has
been developed because Governing Council of the CGSC has decided to reduce the use of helpers on the
shop floor across all companies.
17
results. However, the outcomes can be used as a baseline for similar future studies in
Maharashtra or elsewhere.
• The focus of the study was on assessing the occupational structure, human resources
management practices and skill needs in the capital goods industry, as well as on the
collection of information for the development of curricula for CNC-Setter-cum-operator and
Fitter-Fabrication. The findings and conclusions are more of a qualitative nature, useful for
initiatives to improve or strengthen training of employees or future employees, rather than
forecasting numbers.
• The quality of the findings of any survey depends on the ability of the respondents to
understand questions and give answers that truly reflects their views or circumstances. Also,
it is possible that respondents answer strategically rather than truthfully, for example
because their perception and understanding of the parties involved in the survey and of the
way the data will be used. Of course, these factors have been taken into account when
developing the questionnaires and while implementing the survey, but an effect on the
findings of the survey cannot be ruled out.
• This survey on labour market demand has not been complemented with a similar exercise on
labour market supply. Also, the findings have not been discussed with a “focus group”
consisting of key sector stakeholders. This will be taken as learnings for the next such survey.
Through careful analysis of the results, while taking the limitations into account, the findings of the
survey have helped in describing the current situation in the participating capital goods companies in
Maharashtra. See Chapter 4 for more information.

18
4 Findings
4.1 Characteristics of the participating companies Table 2 illustrates some selected characteristics of the companies participating in the survey. It
shows that the group of 105 companies operate in different sub-sectors, are based in different
divisions, and have different sizes and forms of ownership. Almost one in ten companies is part of
the unorganised sector, but the overall majority is part of the organised sector.
Sub-sector Looking at the table in more detail, it is clear that the participating company mostly operate in two
sub-sectors, i.e. in Machine tools and Dies, moulds and press tools. One in ten produces light
engineering goods and the remaining companies produce process plant equipment, tools and
gauges, power & electrical equipment, textile machinery and material handling and lifting
equipment. To facilitate the analysis, the variables organised/unorganised sector and sub-sector
have been merged into another sub-sector variable, showing that Machine tools and Dies, moulds
and press tools are the biggest with a share of 36% and 26% respectively. Light engineer goods
remains a separate category with 9% and the two new categories are other capital Goods and
unorganised sector companies.
Table 2 - Characteristics of participating companies
Location Half of the companies were based in Pune, almost a third in Mumbai, and 10% and 8% were based in
Aurangabad and Nashik respectively. Compared with the number of companies on the CGSC list (see
Table 1), this means that the companies in Aurangabad and Nashik are over-represented, which is
Company characteristicsNumber of
companies
Share in
total (in %)Company characteristics
Number of
companies
Share in
total (in %)
Total 105 100% Total 105 100%
Organised / unorganised sector Location
Organised sector 96 91% an urban area 98 93%
Unorganised sector 9 9% a rural area 7 7%
Subsector Type of ownership
Dies, Moulds & Press tools 31 30% Sole proprietorship (owned by one person) 15 14%
Light Engineering Goods 11 10% Partnership (owned by two or more people) 22 21%
Machine Tools 41 39% Public corporation 7 7%
Material Handling and Lifting Equipment 1 1% Private corporation 51 49%
Power & Electrical equipment 5 5% Not asked (unorganised sector) / unknown 10 10%
Process Plant Equipment 7 7%
Textile Machinery 3 3% Company Size - investment
Tools & Gauges 6 6% Micro (investment less than Rs 25 Lakh) 1 1%
Small (investment Rs. 25 lakh to Rs. 5 crore) 30 29%
Sub-sector (merged) Medium (investment Rs.5 crore to Rs.10 crore) 31 30%
Dies, Moulds & Press Tools 27 26% Large (investment more than Rs. 10 crore) 33 31%
Light Engineering Goods 9 9% Not asked (unorganised sector) / unknown 10 10%
Machine Tools 38 36%
Other capital Goods 22 21% Company size - number of workers *)
Unorganised sector 9 9% Up to 9 workers 9 9%
10 to 49 workers 43 41%
Division 50 to 249 workers 39 37%
Pune division (HQ Pune) 53 50% 250 workers or more 14 13%
Konkan division (HQ Mumbai) 33 31%
Aurangabad (HQ Aurangabad) 11 10%
Nashik division (HQ Nashik) 8 8% *) Number of workers is the sum of permanent employees, temporary
employees, contract workers and trainees

19
probably the result of the help of the local representatives of the company associations in making
appointments for the interviews. The overall majority is based in urban areas.
Ownership Almost half of the companies are private corporations (whose shareholders cannot sell/buy shares
on a stock exchange), while about one in three companies are owned by one owner or by a
partnership of two or more people. Very few of the organised sector participating companies are
public corporations (i.e. a company owned by shareholders that can sell/buy shares on a stock
exchange).
Company size In terms of investment, all company sizes are present among the participating companies, except for
micro-sized companies. This could be explained by the nature of the sector (i.e. production requiring
relatively expensive machinery), but it is also possible that an under-representation of unorganised
sector companies results in the under-representation of micro-sized companies, i.e. an investment of
up to INR 25 lakh. The share of small, medium and large companies is more or less the same among
the participating companies. Unorganised sector companies have not been asked about investments
and some organised sector companies did not feel comfortable to answer this question.
Another way to define company size is by looking at the number of persons working with the
company. Through the questionnaire for the organised sector, the companies were asked about the
number of permanent employees, the number of temporary employees, workers employed via a
contractor, trainees and the number of vacancies. The company size according to the number of
persons working with the company has been categorised based according to the total number of
persons that work with the company as a permanent employee, temporary employee, contract
worker or trainee. Companies in the unorganised sector were asked only about the number of
employees.
The majority of the organised sector companies had up to 250 workers: 41% had 10 to 49 workers
and 37% had 50 to 249 employees. Only 14 companies had more than 250 persons and 9 companies,
that are part of the unorganised sector, had 9 employees or less.
Comparing the different variables for company size shows that the relation between the number of
workers and investment in the company is not straightforward. There is only one micro-sized
company (in terms of investment) in the group of participants, while there are 9 companies with 9
employees or less. Similarly, large sized companies (with an investment of more than 10 crore) do
not necessarily employ 250 employees or more. See Table 14 in Appendix 2 for a break down of
companies by company size (both in terms of investment and in terms of number of workers) and
sub-sector.
4.2 Composition of the workforce
Number of workers Table 3 holds more detailed information about the workforce in the capital goods sector as a whole
and in the different sub-sectors. The figure shows that all companies had permanent employees, but
that other categories of workers were not present in all of the participating companies: half of the
companies had trainees and about a similar share offered employment to contract workers. Only
14% temporary employees and 6% casual workers were reported. . Four out of every ten companies
(42%) reported vacancies – on average 6.5 per company, which is about 1% of the total number of
workers.

20
Table 3 - Number of workers by category and sub-sector
number % of total Minimum Maximum Average
Total
Permanent employees 105 100% 4 3500 152,8 69%
Temporary employees 15 14% 1 2000 160,9 10%
Contract workers 55 52% 1 522 63,9 15%
Trainees 54 51% 1 400 20,4 5%
Vacancies 44 42% 1 40 6,5 1%
Casual workers 6 6% 2 15 4,7 0%
Total employees *) 105 100% 4 5500 175,8 80%
Total workers *) 105 100% 4 5956 220,0 100%
Total employment *) 105 100% 4 5956 222,7 101%
Number of women 69 66% 1 240 13,5 4%
Number of disabled persons 14 13% 1 8 2,4 0%
Dies, Moulds & Press Tools
Permanent employees 27 100% 8 211 55,6 63%
Temporary employees 4 15% 2 36 16,5 3%
Contract workers 14 52% 6 160 41,8 25%
Trainees 15 56% 2 120 15,5 10%
Vacancies 14 52% 2 20 6,4 4%
Casual workers 0 0% 0 0 #DIV/0! #DIV/0!
Total employees *) 27 100% 8 211 58,1 66%
Total workers *) 27 100% 11 371 88,4 100%
Total employment *) 27 100% 14 371 91,7 104%
Number of women 16 59% 1 19 5,3 4%
Number of disabled persons 3 11% 1 3 2,0 0%
Light Engineering Goods
Permanent employees 9 100% 13 1200 214,7 69%
Temporary employees 2 22% 1 14 7,5 1%
Contract workers 3 33% 6 400 137,7 15%
Trainees 5 56% 2 400 91,4 16%
Vacancies 5 56% 1 16 7,2 1%
Casual workers 1 11% 2 2 2,0 0%
Total employees *) 9 100% 14 1200 216,3 69%
Total workers *) 9 100% 17 1600 313,2 100%
Total employment *) 9 100% 17 1600 317,2 101%
Number of women 7 78% 1 40 10,0 2%
Number of disabled persons 3 33% 1 8 4,3 0%
Machine Tools
Permanent employees 38 100% 6 3500 180,4 68%
Temporary employees 6 16% 2 2000 340,3 20%
Contract workers 22 58% 1 456 45,9 10%
Trainees 21 55% 1 50 10,5 2%
Vacancies 17 45% 2 40 6,7 1%
Casual workers 0 0% 0 0 #DIV/0! #DIV/0!
Total employees *) 38 100% 6 5500 234,1 88%
Total workers *) 38 100% 11 5956 266,5 100%
Total employment *) 38 100% 16 5956 269,5 101%
Number of women 29 76% 1 90 12,2 4%
Number of disabled persons 5 13% 1 5 1,8 0%
Other capital Goods
Permanent employees 22 100% 5 3500 259,0 74%
Temporary employees 3 8% 4 278 96,7 4%
Contract workers 16 42% 7 522 94,3 20%
Trainees 13 34% 2 69 14,8 3%
Vacancies 6 16% 2 25 6,8 1%
Casual workers 4 11% 3 15 6,0 0%
Total employees *) 22 58% 5 3778 272,1 78%
Total workers *) 22 58% 20 4369 350,5 100%
Total employment *) 22 58% 23 4369 352,4 101%
Number of women 16 42% 1 240 26,2 5%
Number of disabled persons 3 8% 1 2 1,7 0%
Unorganised sector **)
Employees 9 100% 4 9 6,3 100%
Vacancies 2 22% 2 2 2,0 7%
Casual workers 1 11% 2 2 2,0 4%
Total employees / workers 9 100% 4 9 6,3 100%
Total employment *) 9 100% 4 9 7,0 111%
Number of women 1 11% 1 1 1,0 2%
Number of disabled persons 0 0% 0 0 #DIV/0! #DIV/0!
Share in total
workers (in%)
*) The fol lowing defini tions are used in this report:
Tota l employees : the tota l number of permanent employees and temporary employees .
Tota l workers : tota l employees plus the number of contract workers and the number of tra inees
Tota l employment: tota l workers plus tota l vacancies**) Unorganised sector companies were asked for the tota l number of employees , vacancies and casual workers in the last months .
They a lso mentioned the number of women and the number of workers with a disabi l i ty
Sub-sectors and
categories of workers
Number of persons in categoryValid answers (companies)
21
On average, the total number of persons directly employed by the companies (on a permanent or
temporary basis) was 176. Together with the number of contract workers, trainees and casual
workers, the average number of people working with companies in the capital goods sector was 220.
Keeping in view the average number of 6.5 vacancies in the companies, the average number of
positions in the company would be 223.
Almost 70% of the workers (153 out of 220) were permanent employees. The remaining work was
done by contract workers (12%) and temporary employees (10%), and to a lesser extent by trainees
(5%). Only 1% of the positions were vacant at the time of the interview and hardly any work was
done by casual labourers.
Though two-thirds of the companies indicated that women were employed, the reported share of
women in the workforce was 4%. Only 13% of the companies had employed differently abled
persons, but the share of this group in the labour force was negligible. The reported share of women
and differently abled persons was more or less the same in all sub-sectors.
The average number of workers per company differed between the sub-sectors. Companies
producing dies, moulds and press tools had relatively fewer workers compared to the other sub-
sectors: while the overall average number of workers was 220, the average number of workers in
companies producing dies, moulds and press tools was 88. Also, the share of (permanent and
temporary) employees was smaller than average (66% versus 80%) in this sector, which was
compensated by a higher share of contract workers and trainees. Lastly, the dies, moulds and press
tools sub-sector had a relatively high share of vacancies, i.e. 4% compared to 1% on average.
The workforce of the biggest sub-sector Machine tools in this survey was bigger than average: on
average a company producing machine tools had 267 workers. The number of permanent employees
was about average, but a bigger than average share (20%) consisted of temporary employees while
the number of contract workers and trainees was much lower than average. Though 45% of the
companies reported vacancies, the number of vacancies was relatively low.
Participating companies that produce light engineering goods were a bit bigger than average. As only
9 companies from this sub-sector took part in the survey, no conclusions could be drawn about the
distribution of workers over different categories. However, the figures suggest that, though 5 out of
9 companies reported vacancies, the share of vacancies in the total workforce was relatively low.
Companies producing other capital goods had the largest average workforce and offered work to a
comparatively large number of permanent employees and contract workers. They employed a
relatively small share of temporary employees and trainees. Only 16% of these companies reported
vacancies, which is very little compared to the average of 42% companies reporting vacancies during
the survey.
Due to its definition, the number of workers in the participating unorganised sector companies was
low, i.e. 6 persons on average. The number of vacancies and casual workers seemed higher than
average, but this is be based on the answers of only 2 and 1 companies respectively, which is not
sufficient to support this conclusion.
The number of workers in different categories by division is presented in Table 15 in Appendix 2. The
table shows that relatively many companies in Pune had trainees and vacancies and that a fairly large
share of these companies employed women. However, the share of trainees and women in the work
force did not deviate much from the other companies and the number of vacancies was also not
higher than average, which means that the numbers of trainees, vacancies and women in the

22
companies was small. Companies based in Mumbai had fewer (permanent and temporary)
employees and many Mumbai-based companies worked with staff provided by contractors. Very few
companies reported having vacancies and not so many companies had trainees. However, companies
that had vacancies and worked with trainees had a relatively high number of them. The number of
participating companies in Aurangabad and Nashik was small. These companies seemed to have
relatively few temporary employees and contract workers, which was compensated by a higher share
of trainees in the workforce.
Table 16 in Appendix 2 holds information about the number of workers in different categories by
company size in terms of investment. It shows that the share of permanent employees was high in all
company sizes, varying from 68% to 75% of the total number of workers. The number of temporary
employees in small and medium-sized companies was much lower than in large companies. On the
other hand, small companies worked more often with contractors, which resulted in a relatively high
share of contract workers in small companies. Also, small companies were more likely to have
vacancies than larger companies and the number of vacancies per company was also higher than
average.
Comparatively many medium sized companies had temporary employees, but the average number of
temporary per company was not so big. The lower share of temporary employees in the work force
was compensated by a higher share of permanent employees and trainees. Large companies stand
out because a large majority of the companies (79%) worked with contractors.
Table 17 in Appendix 2 contains information of the different categories of workers by company size
in terms of workers. The information in this table is more or less in line with the findings mentioned
above: small companies had a relatively low share of temporary employees in the workforce, which
was compensated by a higher share of permanent employees and contract workers. Also, more small
companies reported vacancies and the number of vacancies was relatively high. Medium sized
companies also reported a lower share of temporary employees than bigger companies, which was
compensated by a higher share of permanent employees and trainees. Fewer medium sized
companies reported vacancies than large companies, but the number of vacancies per company is
higher. The overall majority of companies employing 250 workers or more worked with contractors
(93%) and had trainees in the company (79%). Relatively few large companies reported vacancies.
Table 16 and Table 17 show that the more employees companies had, the more likely they were to
hire women. Nevertheless, the share of women in the work force was higher in medium sized and
small companies. As mentioned before, the share of differently abled workers in the work force was
negligible in all categories of companies, i.e. there was no difference between sub-sectors, divisions
or company sizes.
Most common job roles As mentioned in the methodology chapter, the participating companies mentioned 584 job role
titles, which have been recoded to 46 job role names and 20 broader job role categories. Table 4
contains the breakdown of the job roles mentioned by different job role categories and by company
size, while these figures are presented by sub-sector in Table 5.

Table 4 - Job roles mentioned by job role category and distribution by company size (in terms of workers)
TotalUp to 9
workers
10 to 49
workers
50 to 249
workers
250 workers or
more
Total job roles mentioned 584 584 27 220 236 101
Average number job roles mentioned per company 5,6 5,6 3,0 5,1 6,1 7,2
Design roles: 110 19% 7% 19% 23% 12%
CNC Programmer 32 5% 4% 5% 7% 2%
Designer / draughtsman 78 13% 4% 13% 16% 10%
Machinist roles: 136 23% 30% 28% 19% 21%
CNC operator 40 7% 0% 10% 6% 6%
CNC setter cum Operator 17 3% 4% 2% 3% 4%
Conventional machine operator 63 11% 26% 13% 7% 11%
Operator and/or setter (EDM) 16 3% 0% 4% 3% 0%
Production Roles 149 26% 22% 22% 28% 30%
Assembly - Fitter – Electrical & electronic 30 5% 11% 4% 6% 5%
Assembly - Fitter – Mechanical / Maintenance 29 5% 0% 5% 5% 6%
Assembly - Tool and Die Maker 14 2% 4% 3% 1% 4%
Component Fabrication and Preparation 13 2% 0% 2% 1% 6%
Component Fabrication and Preparation - Fabrication
Fitter
19 3% 7% 2% 4% 4%
Quality, Managerial and Supervisory roles 44 8% 0% 6% 11% 5%
Welding and Related Roles 18 3% 4% 2% 2% 8%
Painting and Coating Roles 7 1% 0% 2% 1% 0%
Quality Roles 17 3% 0% 4% 3% 2%
Helper 41 7% 19% 9% 6% 4%
Projects and Planning Roles 70 12% 4% 11% 12% 16%
Marketing, Research and Service Roles 18 3% 0% 2% 4% 4%
Administrative Roles 11 2% 15% 1% 1% 1%
Other (production) Roles 7 1% 0% 0% 1% 3%
Distribution over job role category by company sizeJob roles
mentionedJob role category

24
Table 5 - Job roles mentioned by job role category and distribution by sub-sector
TotalDies, Moulds
& Press Tools
Light Engineering
Goods
Machine
Tools
Other Capital
Goods
Unorganised
sector
Total job roles mentioned 584 584 158 60 216 123 27
Average number job roles mentioned per company 5,6 5,6 5,9 6,7 5,7 5,6 3,0
Design roles: 110 19% 24% 13% 20% 15% 7%
CNC Programmer 32 5% 9% 0% 6% 3% 4%
Designer / draughtsman 78 13% 15% 13% 15% 11% 4%
Machinist roles: 136 23% 30% 22% 26% 9% 30%
CNC operator 40 7% 11% 8% 6% 4% 0%
CNC setter cum Operator 17 3% 3% 0% 5% 0% 4%
Conventional machine operator 63 11% 11% 10% 13% 4% 26%
Operator and/or setter (EDM) 16 3% 6% 3% 2% 1% 0%
Production Roles 149 26% 25% 32% 22% 30% 22%
Assembly - Fitter – Electrical & electronic 30 5% 3% 3% 6% 7% 11%
Assembly - Fitter – Mechanical / Maintenance 29 5% 4% 10% 6% 3% 0%
Assembly - Tool and Die Maker 14 2% 6% 5% 0% 0% 4%
Component Fabrication and Preparation 13 2% 1% 8% 1% 3% 0%
Component Fabrication and Preparation -
Fabrication Fitter19 3% 1% 2% 3% 7% 7%
Quality, Managerial and Supervisory roles 44 8% 9% 3% 6% 11% 0%
Welding and Related Roles 18 3% 0% 3% 2% 8% 4%
Painting and Coating Roles 7 1% 1% 0% 2% 1% 0%
Quality Roles 17 3% 1% 3% 4% 5% 0%
Helper 41 7% 8% 3% 6% 7% 19%
Projects and Planning Roles 70 12% 8% 18% 11% 18% 4%
Marketing, Research and Service Roles 18 3% 1% 2% 5% 4% 0%
Administrative Roles 11 2% 1% 3% 0% 2% 15%
Other (production) Roles 7 1% 1% 0% 1% 2% 0%
Total job roles mentioned
Distribution over job role category by sub-sector
Total job roles
mentioned

Companies mentioned on average 5,6 common job roles. Table 4 shows that the average number of
job roles per company corresponded with the company size in terms of number of workers, which
makes sense as big companies are more likely to have relatively specialised positions while workers
in smaller companies will need to do these tasks with a smaller number of people, leading to more
generalist positions. Table 5 shows that the companies producing light engineering goods mentioned
the largest number of job roles, i.e. 6.7 job roles on average. With 5.9 most common job roles per
company, positions in companies producing dies, moulds and press tools are also a bit more
specialised than in other companies.
Of course the nature of the most common job roles is more interesting than the number of most
common job roles per company. The distribution of the job role categories in the two middle size
categories -i.e. small companies with 10 to 49 workers and medium sized companies with 50 to 249
workers- is more or less similar, though the share of small companies mentioning CNC operators as a
common job role is relatively high and a higher than average number of small companies mentioned
having conventional machine operators on the work floor (see Table 4). Relatively many medium
sized companies indicated having design roles, and quality, managerial and supervisory roles, but
relatively few participants mentioned having conventional machine operators. Lastly, large
companies (with 250 employees or more) mentioned projects and planning roles and job roles
related to welding as common job roles more often than the other companies. Design roles are more
common in small and medium-sized companies than in micro-sized and large companies.
Analysis of the data shows that companies producing dies, moulds and press tools mentioned design
roles, machinist roles (i.e. CNC operators and operator and/or setter (EDM)), and tool and die makers
more often than other companies. Companies producing light engineering goods also mentioned tool
and die makers more than average and reported more machinist roles, design roles and projects and
planning roles as well. Machine tools producing companies did not deviate from the total distribution
of job roles very much, but mentioned relatively often CNC setters cum operators and marketing,
research and service roles. Companies producing other capital good mentioned common job roles
such as component fabrication and preparation (including fabrication fitters), welding and related job
roles, and quality roles, but relatively few machinist roles. A relatively big share of the job roles
mentioned by unorganised sector companies are directly related to production, i.e. machinist roles
(especially conventional machine operators), production roles (excluding the quality, managerial and
supervisory roles) and helpers. Helpers are also mentioned by organised sector companies, but the
number of helpers seems to decrease if the company size increases.
In Table 18 in Appendix 2, job role categories and names are broken down by the associated
qualification level mentioned by the interviewees. The table makes clear that the associated
education level of machinist, production, and welding and related roles, was generally class 8 to 12
and (ITI or CGSC) certificate level. Design, quality, project and planning, marketing, research and
service roles are associated mostly with degree level and to a lesser extend with diploma level.
The number of workers per job role category is presented by sub-sector in Table 6. It shows that six
job role categories account for more than eight thousand (i.e. two thirds of the) workers in the most
common job roles in the participating companies. These job role categories are:
Design Roles - Designer / draughtsman - 1.433 workers (12%)
Machinist Roles - CNC operator - 1.323 workers (11%)
Machinist Roles - Conventional machine operator - 1.063 workers (9%)
Production Roles - Assembly - Fitter – Mechanical / Maintenance - 1.039 workers (8%)
Welding and Related Roles - 1.093 workers (9%)

26
Projects and Planning Roles - 2.204 workers (18%)
Table 6 - Number of workers per job role category by sub-sector
There were significant differences in the composition of the workforce in the different sub-sectors.
For example, in the unorganised sector, the smallest sub-sector in this survey, only two job role
categories stood out, i.e. conventional machine operators and helpers. In contrast, in the biggest
sub-sector in this survey, Machine Tools, the number of workers in four to six different job role
categories was substantially higher than in others. These were CNC operators, fitters – mechanical /
maintenance, designers / draughtsmen, and projects and planning roles. Also important in this sub-
sector were CNC setters cum operators and conventional machine operators. In companies
producing dies, moulds and press tools, the most common job role category was conventional
machine operating roles, followed by designers / draughtsmen, CNC operators and operators and/or
setters of electro discharge machines. An (unlikely) big share of the work force in the sub-sector Light
Engineering Goods consisted of persons in project and planning roles and companies also employed
a relatively big number of workers in CNC operators and component fabrication and preparation job
roles. Major job role categories in companies producing other capital goods were welding and
related roles followed by fabrication fitters, designers / draughtsmen and projects and planning
roles.
Table 7 contains information about the distribution of different worker categories over the different
job role categories. It shows that the distribution of permanent employees over the different job role
categories was more or less the same as the average distribution, most likely because it was the
biggest group in the total number of workers. However, this was not the case for all job role
categories. The table shows that almost six out of ten temporary employees were welder or had
related positions and one in five temporary employees worked as fabrication fitters. Less likely
positions for temporary employees were project planning roles and fitter mechanical / maintenance.
Dies, Moulds
& Press Tools
Light Engineering
Goods
Machine
Tools
Other Capital
Goods
Unorganised
sector
Total 12.356 1.717 1.890 5.626 3.070 53
Design roles:
CNC Programmer 1% 3% 0% 1% 1% 2%
Designer / draughtsman 12% 13% 2% 13% 14% 2%
Machinist roles:
CNC operator 11% 13% 9% 15% 3% 0%
CNC setter cum Operator 5% 3% 0% 11% 0% 6%
Conventional machine operator 9% 18% 5% 10% 2% 34%
Operator and/or setter (EDM) 2% 12% 0% 1% 0% 0%
Production Roles:
Assembly - Fitter – Electrical & electronic 3% 1% 2% 4% 4% 6%
Assembly - Fitter – Mechanical / Maintenance 8% 8% 5% 14% 1% 0%
Assembly - Tool and Die Maker 2% 7% 4% 0% 0% 9%
Component Fabrication and Preparation 2% 1% 7% 1% 1% 0%
Component Fabrication and Preparation - Fabrication Fitter 5% 3% 0% 2% 15% 4%
Quality, Managerial and Supervisory roles 2% 4% 0% 2% 3% 0%
Welding and Related Roles 9% 0% 1% 6% 25% 2%
Painting and Coating Roles 0% 0% 0% 1% 0% 0%
Quality Roles 1% 0% 1% 1% 1% 0%
Helper 4% 4% 1% 3% 7% 25%
Projects and Planning Roles 18% 3% 61% 12% 11% 2%
Marketing, Research and Service Roles 3% 1% 0% 4% 4% 0%
Administrative Roles 1% 0% 0% 0% 5% 9%
Other (production) Roles 2% 7% 0% 0% 3% 0%
Job role category Total
Number of workers distribution over job role *) categories
*) Number of workers i s the total of permanent employees , termporary employees , contract workers and tra inees
27
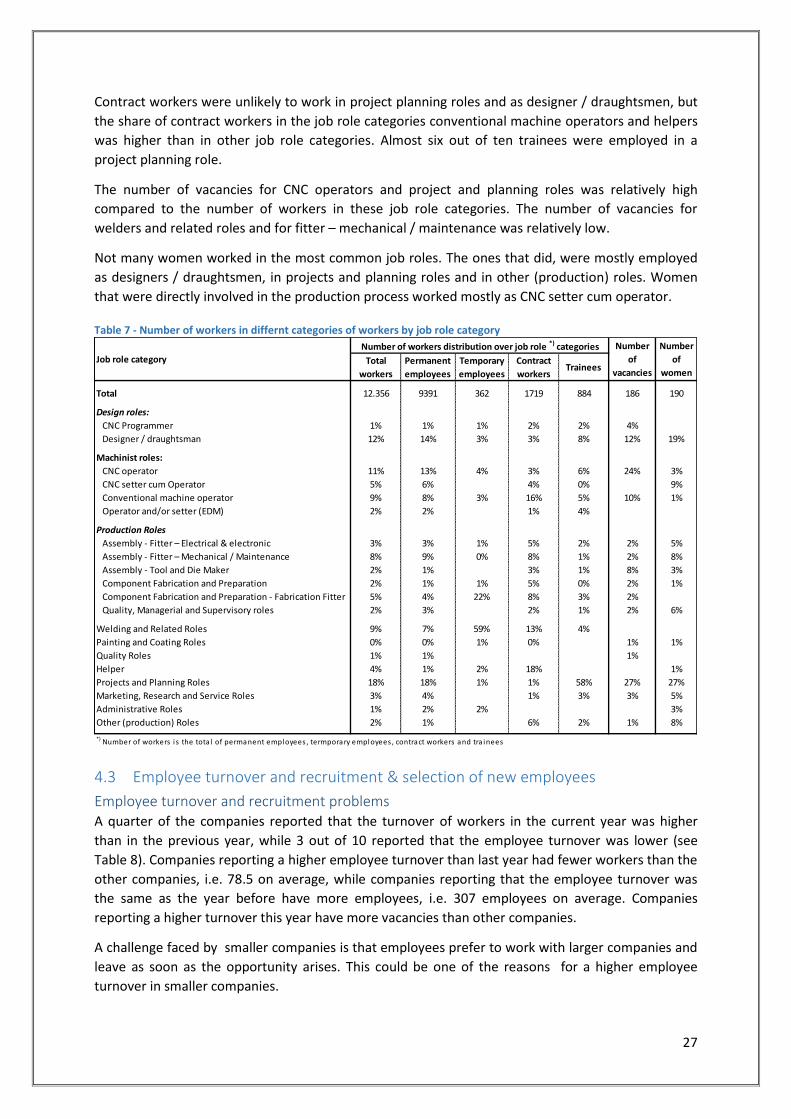
Contract workers were unlikely to work in project planning roles and as designer / draughtsmen, but
the share of contract workers in the job role categories conventional machine operators and helpers
was higher than in other job role categories. Almost six out of ten trainees were employed in a
project planning role.
The number of vacancies for CNC operators and project and planning roles was relatively high
compared to the number of workers in these job role categories. The number of vacancies for
welders and related roles and for fitter – mechanical / maintenance was relatively low.
Not many women worked in the most common job roles. The ones that did, were mostly employed
as designers / draughtsmen, in projects and planning roles and in other (production) roles. Women
that were directly involved in the production process worked mostly as CNC setter cum operator.
Table 7 - Number of workers in differnt categories of workers by job role category
4.3 Employee turnover and recruitment & selection of new employees
Employee turnover and recruitment problems A quarter of the companies reported that the turnover of workers in the current year was higher
than in the previous year, while 3 out of 10 reported that the employee turnover was lower (see
Table 8). Companies reporting a higher employee turnover than last year had fewer workers than the
other companies, i.e. 78.5 on average, while companies reporting that the employee turnover was
the same as the year before have more employees, i.e. 307 employees on average. Companies
reporting a higher turnover this year have more vacancies than other companies.
A challenge faced by smaller companies is that employees prefer to work with larger companies and
leave as soon as the opportunity arises. This could be one of the reasons for a higher employee
turnover in smaller companies.
Total
workers
Permanent
employees
Temporary
employees
Contract
workersTrainees
Total 12.356 9391 362 1719 884 186 190
Design roles:
CNC Programmer 1% 1% 1% 2% 2% 4% 0%
Designer / draughtsman 12% 14% 3% 3% 8% 12% 19%
Machinist roles:
CNC operator 11% 13% 4% 3% 6% 24% 3%
CNC setter cum Operator 5% 6% 0% 4% 0% 0% 9%
Conventional machine operator 9% 8% 3% 16% 5% 10% 1%
Operator and/or setter (EDM) 2% 2% 0% 1% 4% 0% 0%
Production Roles
Assembly - Fitter – Electrical & electronic 3% 3% 1% 5% 2% 2% 5%
Assembly - Fitter – Mechanical / Maintenance 8% 9% 0% 8% 1% 2% 8%
Assembly - Tool and Die Maker 2% 1% 0% 3% 1% 8% 3%
Component Fabrication and Preparation 2% 1% 1% 5% 0% 2% 1%
Component Fabrication and Preparation - Fabrication Fitter 5% 4% 22% 8% 3% 2% 0%
Quality, Managerial and Supervisory roles 2% 3% 0% 2% 1% 2% 6%
Welding and Related Roles 9% 7% 59% 13% 4% 0% 0%
Painting and Coating Roles 0% 0% 1% 0% 0% 1% 1%
Quality Roles 1% 1% 0% 0% 0% 1% 0%
Helper 4% 1% 2% 18% 0% 0% 1%
Projects and Planning Roles 18% 18% 1% 1% 58% 27% 27%
Marketing, Research and Service Roles 3% 4% 0% 1% 3% 3% 5%
Administrative Roles 1% 2% 2% 0% 0% 0% 3%
Other (production) Roles 2% 1% 0% 6% 2% 1% 8%
Number of workers distribution over job role *) categories Number
of
vacancies
Number
of
women
Job role category
*) Number of workers i s the total of permanent employees , termporary employees , contract workers and tra inees
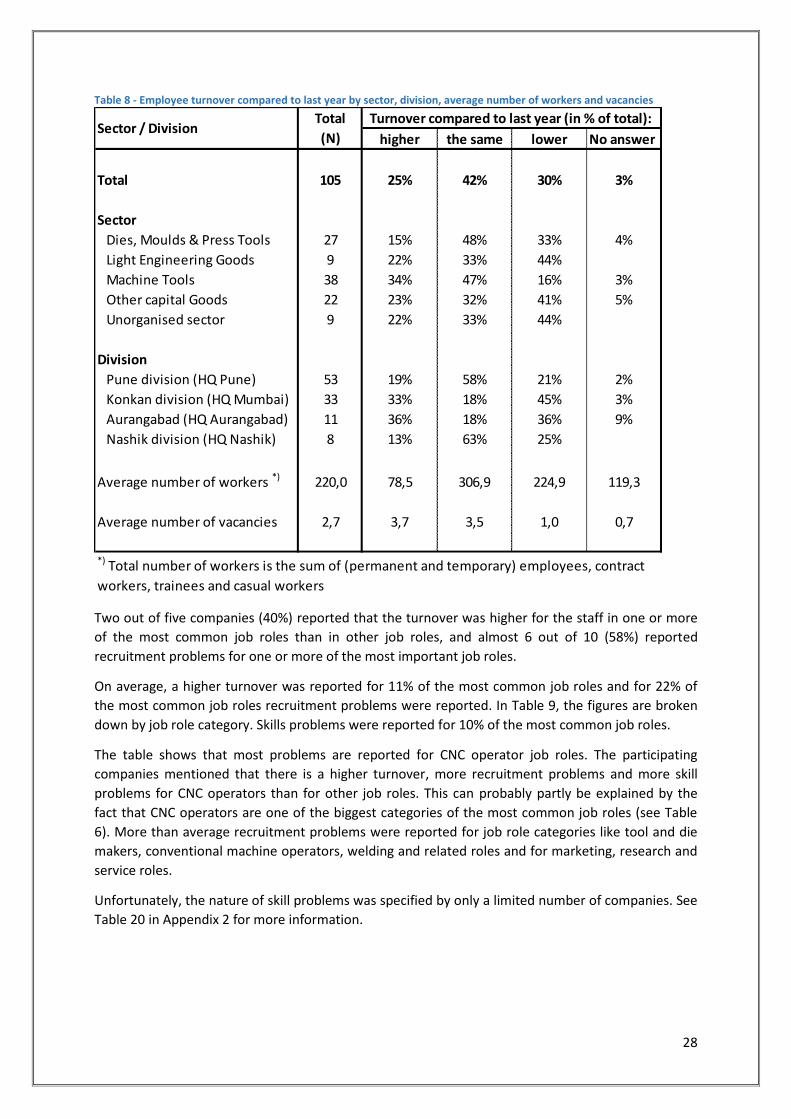
28
Table 8 - Employee turnover compared to last year by sector, division, average number of workers and vacancies
Two out of five companies (40%) reported that the turnover was higher for the staff in one or more
of the most common job roles than in other job roles, and almost 6 out of 10 (58%) reported
recruitment problems for one or more of the most important job roles.
On average, a higher turnover was reported for 11% of the most common job roles and for 22% of
the most common job roles recruitment problems were reported. In Table 9, the figures are broken
down by job role category. Skills problems were reported for 10% of the most common job roles.
The table shows that most problems are reported for CNC operator job roles. The participating
companies mentioned that there is a higher turnover, more recruitment problems and more skill
problems for CNC operators than for other job roles. This can probably partly be explained by the
fact that CNC operators are one of the biggest categories of the most common job roles (see Table
6). More than average recruitment problems were reported for job role categories like tool and die
makers, conventional machine operators, welding and related roles and for marketing, research and
service roles.
Unfortunately, the nature of skill problems was specified by only a limited number of companies. See
Table 20 in Appendix 2 for more information.
higher the same lower No answer
Total 105 25% 42% 30% 3%
Sector
Dies, Moulds & Press Tools 27 15% 48% 33% 4%
Light Engineering Goods 9 22% 33% 44% 0%
Machine Tools 38 34% 47% 16% 3%
Other capital Goods 22 23% 32% 41% 5%
Unorganised sector 9 22% 33% 44% 0%
Division
Pune division (HQ Pune) 53 19% 58% 21% 2%
Konkan division (HQ Mumbai) 33 33% 18% 45% 3%
Aurangabad (HQ Aurangabad) 11 36% 18% 36% 9%
Nashik division (HQ Nashik) 8 13% 63% 25% 0%
Average number of workers *) 220,0 78,5 306,9 224,9 119,3
Average number of vacancies 2,7 3,7 3,5 1,0 0,7
*) Total number of workers is the sum of (permanent and temporary) employees, contract
workers, trainees and casual workers
Total
(N)Sector / Division
Turnover compared to last year (in % of total):
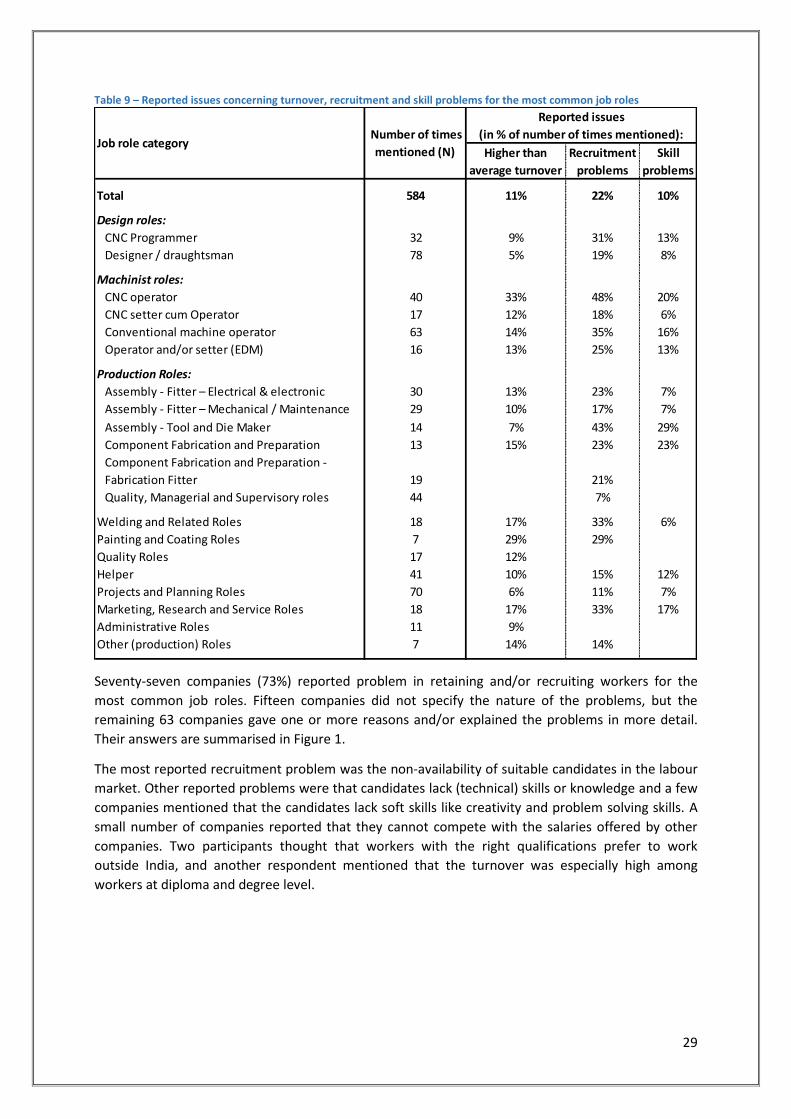
29
Table 9 – Reported issues concerning turnover, recruitment and skill problems for the most common job roles
Seventy-seven companies (73%) reported problem in retaining and/or recruiting workers for the
most common job roles. Fifteen companies did not specify the nature of the problems, but the
remaining 63 companies gave one or more reasons and/or explained the problems in more detail.
Their answers are summarised in Figure 1.
The most reported recruitment problem was the non-availability of suitable candidates in the labour
market. Other reported problems were that candidates lack (technical) skills or knowledge and a few
companies mentioned that the candidates lack soft skills like creativity and problem solving skills. A
small number of companies reported that they cannot compete with the salaries offered by other
companies. Two participants thought that workers with the right qualifications prefer to work
outside India, and another respondent mentioned that the turnover was especially high among
workers at diploma and degree level.
Higher than
average turnover
Recruitment
problems
Skill
problems
Total 584 11% 22% 10%
Design roles:
CNC Programmer 32 9% 31% 13%
Designer / draughtsman 78 5% 19% 8%
Machinist roles:
CNC operator 40 33% 48% 20%
CNC setter cum Operator 17 12% 18% 6%
Conventional machine operator 63 14% 35% 16%
Operator and/or setter (EDM) 16 13% 25% 13%
Production Roles:
Assembly - Fitter – Electrical & electronic 30 13% 23% 7%
Assembly - Fitter – Mechanical / Maintenance 29 10% 17% 7%
Assembly - Tool and Die Maker 14 7% 43% 29%
Component Fabrication and Preparation 13 15% 23% 23%
Component Fabrication and Preparation -
Fabrication Fitter 19 0% 21% 0%
Quality, Managerial and Supervisory roles 44 0% 7% 0%
Welding and Related Roles 18 17% 33% 6%
Painting and Coating Roles 7 29% 29% 0%
Quality Roles 17 12% 0% 0%
Helper 41 10% 15% 12%
Projects and Planning Roles 70 6% 11% 7%
Marketing, Research and Service Roles 18 17% 33% 17%
Administrative Roles 11 9% 0% 0%
Other (production) Roles 7 14% 14% 0%
Reported issues
(in % of number of times mentioned): Number of times
mentioned (N)Job role category

30
Figure 1 - Reasons for higher turnover and recruitment problems (in number of companies) *)
*) Companies could refuse to answer or give more than one answer, so the number of reasons can
differ from the number of companies.
Companies have taken different measures to cope with the higher turnover and/or recruitment
problems (see Figure 2). The most common measures were financial, for example by paying salaries
that are in line with the experience of workers and with the demand in the market. Others provide
loans to employees or give bonuses and other financial incentives.
Figure 2 - Approach to higher turnover and recruitment problems (in number of companies) *)
*) Companies could refuse to answer or give more than one answer, so the number of approaches
can differ from the number of companies.
Companies also reported taking non-financial measures. Some companies organised social events
like birthday celebrations, get-togethers and trips for employees, while others offered workers
medical facilities, meals, library with books in the local language or even stress management training.
Three companies found a positive and open working environment important, whereas four

31
companies mention “other approaches”3. Lastly, six companies mentioned the training of existing
and new workers as a way to retain workers as well as to overcome recruitment problems.
Recruitment methods and criteria Participants were asked to explain how their company recruits new employees. Ther responses are
presented in Figure 3 and further broken down by sub-sector, division and company size in Table 21,
Table 22, Tabel 23 in Appendix 2.
Figure 3 - Methods to recruit new employees by company size (in terms of number of workers)
Informal recruitment methods were used most: more than six out of ten companies recruited new
employees through word of mouth, i.e. via the company’s network, the network of family, friends
and current employees, etc. More than a third recruited walk-ins and people that sent an open
application (i.e. applying in general, not for a specific position that was advertised). Almost a third of
the companies recruit via training institutes. This could be formal campus recruitment, but could also
be more informal, i.e. through internships, notice boards in schools, etc.
Concerning the more formal recruitment methods: about 30% of the companies used advertisements
in newspapers, on radio or on TV and recruitment via online advertisements was used by almost as
many companies. Recruitment via the employment exchange is not popular: only 7% of the
companies mentioned this as a recruitment method. Obviously, the choice for one or more “formal
recruitment methods” would depend on whether potential candidates are likely to use these media.
For example, older workers are less likely to use the internet, while young persons may be less likely
to read newspapers. Likewise, positions that require a higher qualification may be advertised online,
while recruitment for positions that require an ITI certificate could require a different approach.
3 Including good working circumstances (green manufacturing), direct interaction of the company with
schools, a learn and earn scheme and regular promotions of staff.
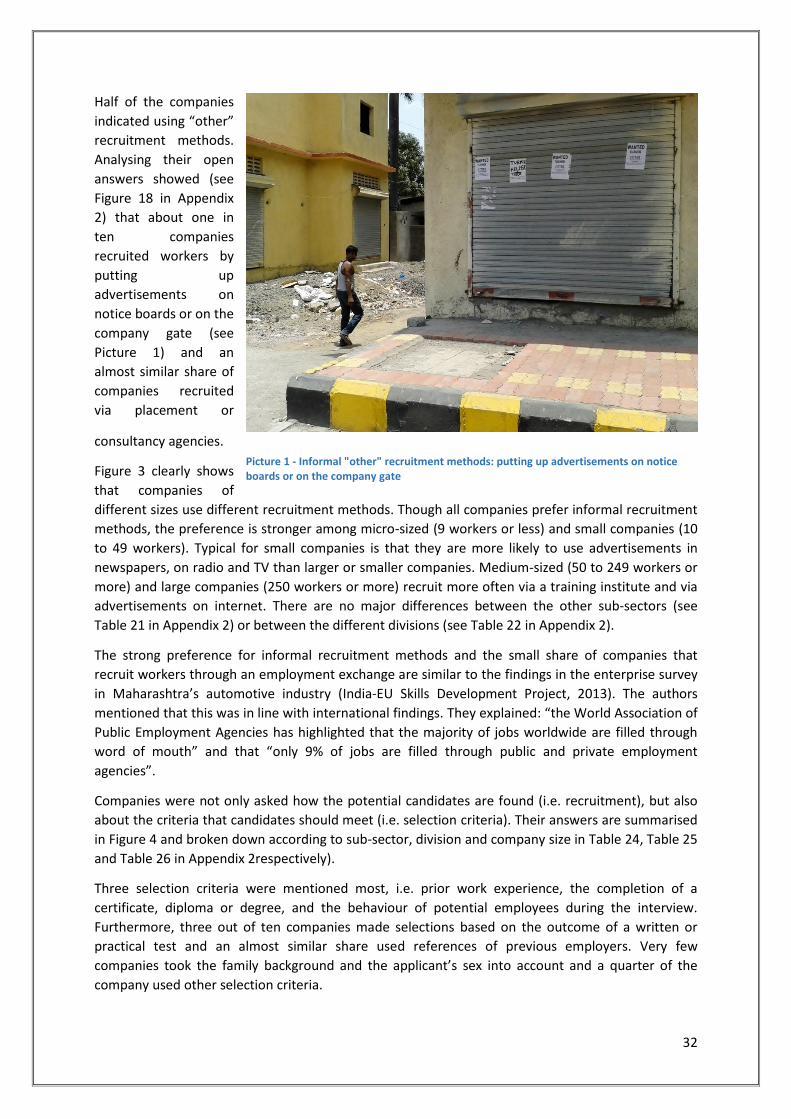
32
Half of the companies
indicated using “other”
recruitment methods.
Analysing their open
answers showed (see
Figure 18 in Appendix
2) that about one in
ten companies
recruited workers by
putting up
advertisements on
notice boards or on the
company gate (see
Picture 1) and an
almost similar share of
companies recruited
via placement or
consultancy agencies.
Figure 3 clearly shows
that companies of
different sizes use different recruitment methods. Though all companies prefer informal recruitment
methods, the preference is stronger among micro-sized (9 workers or less) and small companies (10
to 49 workers). Typical for small companies is that they are more likely to use advertisements in
newspapers, on radio and TV than larger or smaller companies. Medium-sized (50 to 249 workers or
more) and large companies (250 workers or more) recruit more often via a training institute and via
advertisements on internet. There are no major differences between the other sub-sectors (see
Table 21 in Appendix 2) or between the different divisions (see Table 22 in Appendix 2).
The strong preference for informal recruitment methods and the small share of companies that
recruit workers through an employment exchange are similar to the findings in the enterprise survey
in Maharashtra’s automotive industry (India-EU Skills Development Project, 2013). The authors
mentioned that this was in line with international findings. They explained: “the World Association of
Public Employment Agencies has highlighted that the majority of jobs worldwide are filled through
word of mouth” and that “only 9% of jobs are filled through public and private employment
agencies”.
Companies were not only asked how the potential candidates are found (i.e. recruitment), but also
about the criteria that candidates should meet (i.e. selection criteria). Their answers are summarised
in Figure 4 and broken down according to sub-sector, division and company size in Table 24, Table 25
and Table 26 in Appendix 2respectively).
Three selection criteria were mentioned most, i.e. prior work experience, the completion of a
certificate, diploma or degree, and the behaviour of potential employees during the interview.
Furthermore, three out of ten companies made selections based on the outcome of a written or
practical test and an almost similar share used references of previous employers. Very few
companies took the family background and the applicant’s sex into account and a quarter of the
company used other selection criteria.
Picture 1 - Informal "other" recruitment methods: putting up advertisements on notice boards or on the company gate
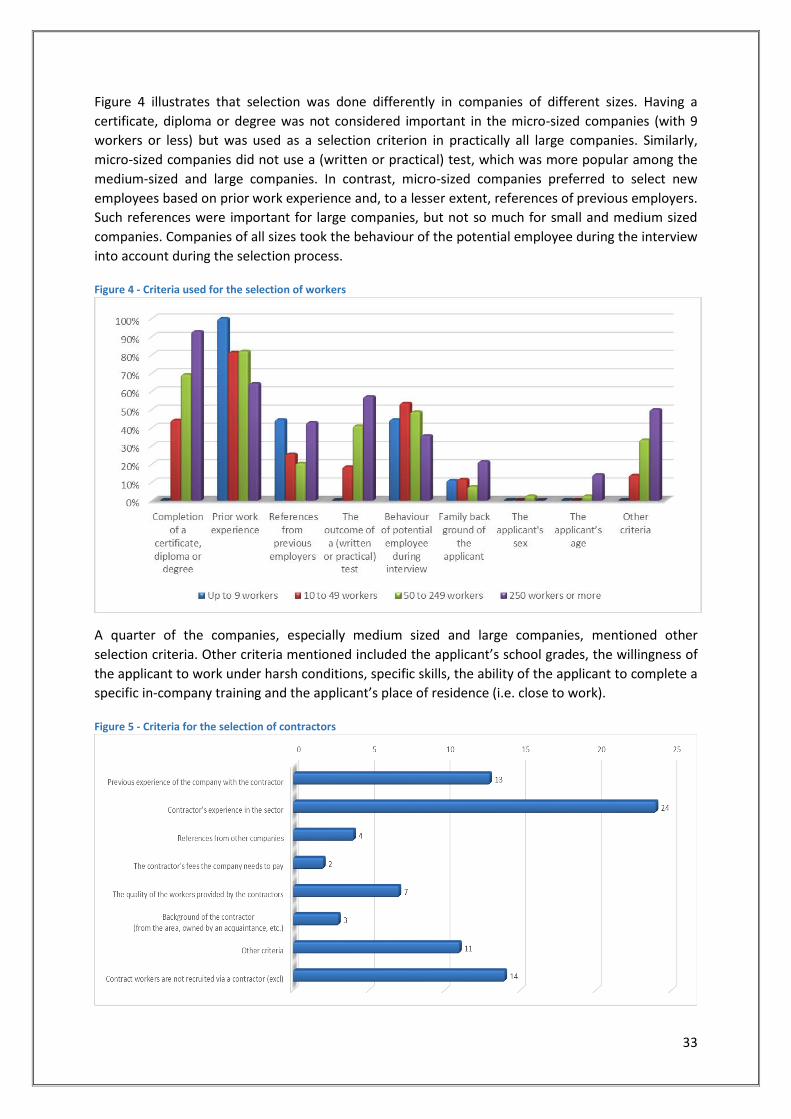
33
Figure 4 illustrates that selection was done differently in companies of different sizes. Having a
certificate, diploma or degree was not considered important in the micro-sized companies (with 9
workers or less) but was used as a selection criterion in practically all large companies. Similarly,
micro-sized companies did not use a (written or practical) test, which was more popular among the
medium-sized and large companies. In contrast, micro-sized companies preferred to select new
employees based on prior work experience and, to a lesser extent, references of previous employers.
Such references were important for large companies, but not so much for small and medium sized
companies. Companies of all sizes took the behaviour of the potential employee during the interview
into account during the selection process.
Figure 4 - Criteria used for the selection of workers
A quarter of the companies, especially medium sized and large companies, mentioned other
selection criteria. Other criteria mentioned included the applicant’s school grades, the willingness of
the applicant to work under harsh conditions, specific skills, the ability of the applicant to complete a
specific in-company training and the applicant’s place of residence (i.e. close to work).
Figure 5 - Criteria for the selection of contractors

34
Contract workers are employees that are seconded by their (legal) employer, i.e. a contractor, to
other companies. Fifty-five of the companies in this survey have contract workers, and these
companies were asked how they select a suitable contractor. Their answers have been summarised.
in Figure 5. It is obvious that the most important criterion was the experience of the contractor in the
sector, followed by previous experience of the company with the contractor. A smaller number of
companies mentioned the quality of the workers provided by the contractor and references of other
companies. The contractor’s background, and the contractor’s fees were less important selection
criteria. Eleven companies (i.e. 20%) chose the option “other”, but most did not explain what other
criteria they used. Fourteen companies (i.e. 25%) indicated that their contract workers were not
recruited via a contractor but in a different way.
The selection of the contract workers was usually a combined effort of the contractors and
companies: contractors made an initial selection of the candidates for an interview with the
company. The company would then select the contract workers they considered suitable for the
work.
Almost half of the participating
companies recruited employees
from all over India (see Figure
6), while about a third preferred
workers living near the
company. The remaining
companies limited their
searches to the state of
Maharashtra.
Some companies explained that
for lower level jobs, recruitment
was mostly directed at the
district or block in which the
company is located. Other
companies would welcome anyone to come and work with the company as long as he or she was
willing to move to city in which the company is based. Some participants preferred workers from
other states, because they considered these workers to be especially flexible, hardworking, reliable,
and because these workers had fewer family obligations they would be available for work at any
time. Workers recruited from other states would get 2 months leave per year to visit their families
and spend the remaining 10 months working for the company. In one case, the respondents
preferred recruiting graduates from good quality training institutes in specific states.
Figure 7 - Would you recruit under- or overqualified employees?
A big share of the
participants (43%)
preferred to recruit
workers with the right
qualifications, but an even
bigger share (54%) of
companies would recruit
underqualified workers. In
contrast, very few
companies would recruit
Figure 6 – Where do you recruit new employees?

35
overqualified staff (see Figure 7 and Table 30 in Appendix 2).
There are clear differences between companies of different sizes. Larger companies preferred to
employee workers with right qualifications, but micro-sized companies (with 9 workers or less)
preferred candidates that are under-qualified. Preferences of small and medium-sized companies or
less extreme, but follow the same trend. It seems that the bigger the company was, the stronger its
preference for workers with the right qualifications.
The preference of employers to recruit staff with the right-qualifications will depend on the
remuneration, the level of specialisation required for the job role and on the situation on the labour
market. The reluctance of employers to work with over-qualified staff could result from the
expectation that over-qualified workers will demand higher salaries or that they will quickly find
other (better) jobs. On the other hand, working with underqualified workers has the advantage that
salaries tend to be lower than for workers with the right qualifications and that these employees can
trained exactly according to the employer’s requirements. And though some specialised job-roles
simply cannot be done by someone without the right qualifications other more general jobs could
even be done better by overqualified workers. One could conclude that the preference of smaller
companies for underqualified workers will result from employers to keep labour costs low, to secure
their labour force (underqualified workers have fewer opportunities in the labour market) and to
train workers according to their specific needs. The more specialised nature of the position in larger
companies would be an explanation for the preference of larger companies for workers with the
right qualification – apart from the fact that larger companies can choose from a larger pool of
interested candidates because bigger companies generally offer better salaries, career perspectives,
and working environment. These factors will need to be taken into account when developing
initiatives concerning recognition of prior learning.
Participants have indicated the share of women and disabled workers in their current workforce (see
paragraph 4.2), but have also been asked to indicate for which most common job roles they would
consider women and disabled workers. Their answers are summarised in Figure 8 and in Table 31 in
Appendix 2. Just over half of the participants would consider recruiting women for one or more of
the most common job roles and 30% would consider recruiting disabled persons. There were no
major differences between the different divisions and between the different sub-sectors, except for
companies in the unorganised sector, who were less willing to recruit women and not willing at all to
recruit disabled persons. Though the reason for the companies’ preferences has not officially been
part of the questionnaire, several respondents explained during the interview that they felt that the
company was not a suitable environment for women or disabled persons, because the work can be
dangerous, the workplace not clean and because physical strength is important.
The companies that would consider women for the most common job roles, were asked to specify
for which job roles they might recruit women and disabled persons. Respondents mentioned 18% of
the most common job roles for women and 8% of the most common job roles for disabled people
(see Figure 8). Job role categories mentioned most for women are designer / draughtsman, CNC
Programmer, CNC (setter cum) operator, and Quality, Managerial and Supervisory roles. Fewer job
role categories were mentioned for disabled people, i.e. CNC Programmer, designer / draughtsman
and CNC operator. Less mentioned, but more than other job role categories, were assembly – fitter
positions (electrical & electronic and mechanical / maintenance). The information about the
willingness to consider women and differently abled persons should be used as career guidance
information. Women and disabled persons considering taking part in training for certain job roles will
need to be aware of the reluctance of employers to consider them for the associated job roles.
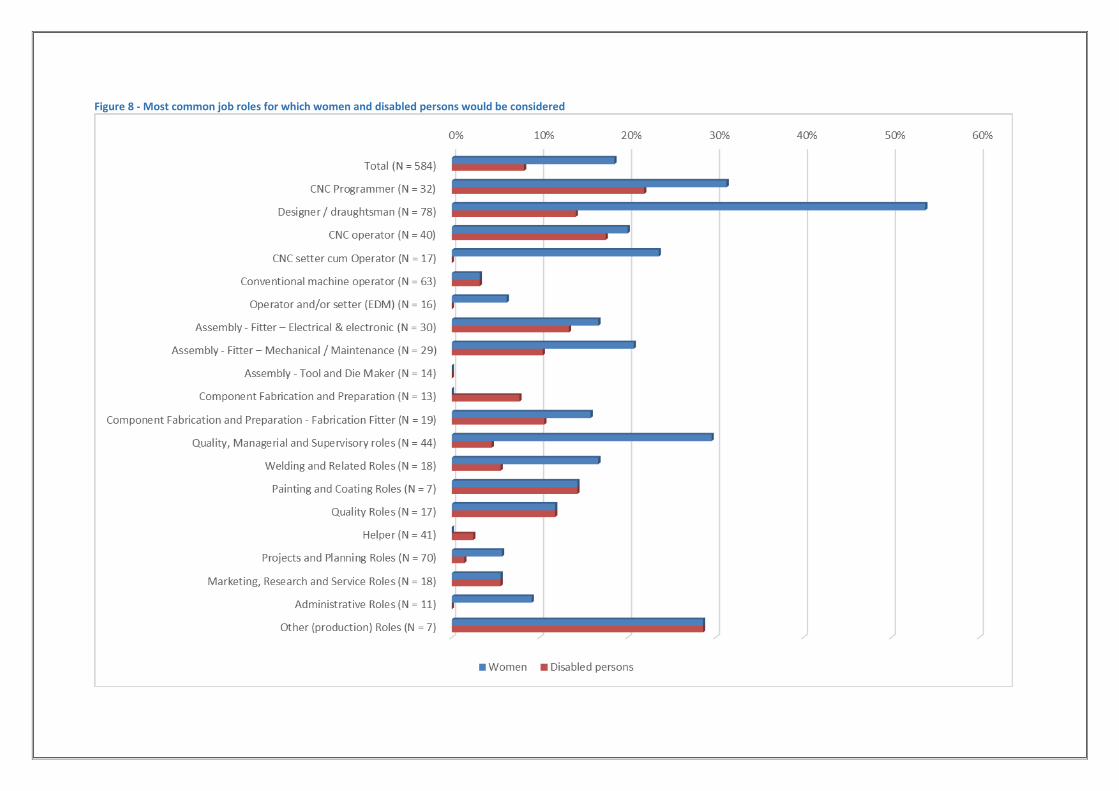
Figure 8 - Most common job roles for which women and disabled persons would be considered

Figure 9 - Rating of the current and last year’s economic situation

4.4 Opinions on and expectations for the economic situation of the sector
Current and last year’s economic situation Employers generally know best what goes on in the sector. That is why the participants have been
asked about their opinion of the current economic situation and their expectations for future
developments. The assessments of the current economic situation and of last year’s economic
situation are summarised in Figure 9 above.
Respondents were not positive about the current economic situation. Though a quarter of the
respondents felt that the current situation was good, almost a third of the respondents said that the
current economic situation is bad or very bad . Two out of five respondents rated the current
economic situation as average. Yet there were some differences between the different sub-sectors.
For example, representatives of companies producing dies, moulds and press tools were relatively
positive: almost a quarter rated the economic situation as good and almost half of them felt that the
economic situation was average. In contrast, representatives of the unorganised sector were in a
very negative mood: the overall majority rated the situation as bad or very bad. There were not
many differences in opinion between the remaining sectors. Looking at the different divisions, it is
apparent that the mood in Konkan was more negative than elsewhere and that the share of
companies that felt the current economic situation was good is bigger in Pune than in the other
divisions. Lastly, the information in Figure 9 suggests that the size of the company affected the rating
of the current economic situation: the larger the company, the bigger the share of respondents that
rated the situation as “good” and the smaller the share of respondents that rated the economic
situation as bad or very bad.
When asked about last year’s economic situation, more than a third of the respondents said that last
year was worse than this year and 45 % said that the situation was more or less the same. Only one
in ten respondents felt that last year was better than this year. Figure 9 shows that this is not
consistent for all categories of companies. A relatively large share of companies in Konkan felt that
last year’s economic situation was worse than this year. The same was true for companies producing
light engineering goods and for companies in the unorganised sector.
More interesting than the opinion about last year’s economic was better or worse than the current
situation is whether companies have reduced or increased their workforce in the last year. The
answers of the respondents have been presented in Table 10. The table shows that 10% of the
participating companies had fewer workers than last year, on average 15 workers less. Yet 24% of the
participating companies currently have more workers than last year, on average 15 workers more.
The remaining 61% report having the same number of workers as last year. This information means
that the total number of workers in the participating companies has increased (by 0.9%) in the last
year. Considering the relatively small number of companies participating in the survey and the non-
probability sampling as described in the methodology chapter, we cannot conclude that the size of
the reported changes is representative for the total sector, but the direction of the change may well
be in line with the developments in other companies.
Some groups of companies reported substantially better figures than average. For example, 30% of
the companies producing dies, moulds and press tools had more workers than last year and only 11%
of the companies had fewer workers. Considering the average reported size of the changes and the
average number of workers, the workforce in the participating companies that produce dies, moulds
and press tools has increased in the last year by 4.7%. Likewise, a relatively big share of the
companies based in Konkan division reported an increase of the workforce and very few companies
report a decrease, resulting in an increase of 4.6%. Lastly, the workforce of medium-sized companies

39
in the survey has increased by 3.6% in the last year, which was the result of to a higher share of
companies reporting relatively big increases and to the fact that companies that reported a decrease
in the last year, reported a smaller decrease than average.
Table 10 - Changes in the size of the workforce in the last year
Respondents that reported a change in the workforce were asked if the most common job roles were
affected by this change. Table 33 in Appendix 2 lists the reported changes per job role. As only 34%
(i.e. 36) of the participating companies reported a change in the size of the workforce, the table
includes information about 85 job roles.
Relatively big increases are mentioned for the job role categories CNC operators and for assembly -
fitter – mechanical / maintenance: in the companies that reported an increase, the total number of
workers in these job role increased by 10 and 11.3 on average respectively. Smaller but still
substantial (average) increases are reported for marketing, research and service roles (6.0 per
company) and for assembly - tool and die maker (5.8 per company). Decreases were reported for
quality roles (-5.0 per company), helpers (-4.5 per company) and for component fabrication and
preparation (-1.5 per company).
The explanation for the reported increases and decreases is not clear. The reported increase in the
number of CNC operators seems to be in line with ongoing automation of the production. The
decrease of workers in quality roles could be the result of the ambition to produce more efficiently –
possibly also because of ongoing automation of the production process. Yet the decrease of helpers
(working especially in the unorganised sector) does not fit with the finding that last year’s economic
situation in the unorganised sector was worse than the current situation, unless the companies did
the same
% of
companies
% of
companies
Average number
of workers less
% of
companies
Average number
of workers more
Total 105 220,0 61% 10% 15,0 24% 14,6 5%
Sub-sector
Dies, Moulds & Press Tools 27 88,4 56% 11% 8,3 30% 17,3 4%
Light Engineering Goods 9 313,2 78% 11% 5,0 11% 3,0 0%
Machine Tools 38 266,5 63% 8% 8,0 21% 13,6 8%
Other capital Goods 22 350,5 45% 18% 27,8 32% 16,0 5%
Unorganised sector 9 6,6 89% 0% #DIV/0! 11% 2,0 0%
Division:
Pune 53 367,2 57% 11% 18,0 32% 14,5 0%
Konkan 33 59,5 67% 3% 14,0 21% 15,0 9%
Aurangabad 11 85,1 55% 18% 10,0 9% 12,0 18%
Nashik 8 93,1 75% 25% 11,5 0% #DIV/0! 0%
Company size:
Up to 9 workers 9 6,6 89% 0% #DIV/0! 11% 2,0 0%
10 to 49 workers 43 28,1 67% 12% 6,4 19% 3,9 2%
50 to 249 workers 39 109,1 49% 10% 12,8 31% 16,9 10%
250 workers or more 14 1255,9 57% 14% 41,0 29% 32,0 0%
Number of
companies
Average
number of
workers
No
answerVariables
lower
Compared to last year, the number of workers is
higher

40
not recruit new helpers for the helpers that progressed to a more specialised job roles. Similarly, it is
unclear why there was a reduction in the number of workers in component fabrication and
preparation and an increase for assembly fitter-mechanical/maintenance increases. The validation of
these findings will need to be taken prior to or during the next study on this or on a related subject.
Expected economic developments Respondents were not only asked to think about the past, but also about the future. They were
questioned about their expectations for the year to come, whether the company plans capital
investments for that period and if they expect their workforce to change.
Figure 10 shows that the industry appeared positive about the future: three out of four participants
believed that the economic situation would improve in the year to come, while 19% expected the
situation to remain the same. The remaining 4% did not expect the situation to deteriorate, but
preferred not to answer this question.
Figure 10 - Expected economic developments
Though the mood was generally positive, there were some differences between different groups of
participants. For example, a much smaller share of participants from the unorganised sector expects
the economic situation to improve while a relatively larger share of respondents of companies
producing “other” capital goods expected positive economic developments. And a bigger share of
respondents based in Aurangabad and Konkan expected the economic situation to improve than
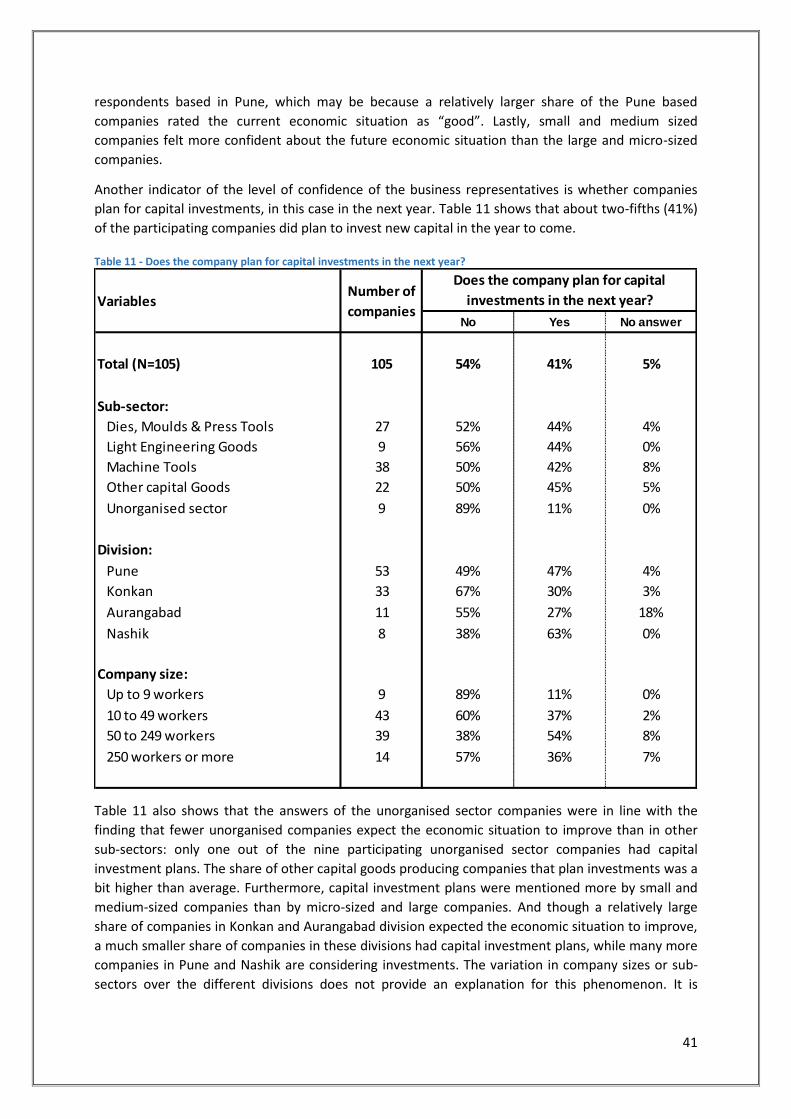
41
respondents based in Pune, which may be because a relatively larger share of the Pune based
companies rated the current economic situation as “good”. Lastly, small and medium sized
companies felt more confident about the future economic situation than the large and micro-sized
companies.
Another indicator of the level of confidence of the business representatives is whether companies
plan for capital investments, in this case in the next year. Table 11 shows that about two-fifths (41%)
of the participating companies did plan to invest new capital in the year to come.
Table 11 - Does the company plan for capital investments in the next year?
Table 11 also shows that the answers of the unorganised sector companies were in line with the
finding that fewer unorganised companies expect the economic situation to improve than in other
sub-sectors: only one out of the nine participating unorganised sector companies had capital
investment plans. The share of other capital goods producing companies that plan investments was a
bit higher than average. Furthermore, capital investment plans were mentioned more by small and
medium-sized companies than by micro-sized and large companies. And though a relatively large
share of companies in Konkan and Aurangabad division expected the economic situation to improve,
a much smaller share of companies in these divisions had capital investment plans, while many more
companies in Pune and Nashik are considering investments. The variation in company sizes or sub-
sectors over the different divisions does not provide an explanation for this phenomenon. It is
No Yes No answer
Total (N=105) 105 54% 41% 5%
Sub-sector:
Dies, Moulds & Press Tools 27 52% 44% 4%
Light Engineering Goods 9 56% 44% 0%
Machine Tools 38 50% 42% 8%
Other capital Goods 22 50% 45% 5%
Unorganised sector 9 89% 11% 0%
Division:
Pune 53 49% 47% 4%
Konkan 33 67% 30% 3%
Aurangabad 11 55% 27% 18%
Nashik 8 38% 63% 0%
Company size:
Up to 9 workers 9 89% 11% 0%
10 to 49 workers 43 60% 37% 2%
50 to 249 workers 39 38% 54% 8%
250 workers or more 14 57% 36% 7%
Number of
companies
Does the company plan for capital
investments in the next year?Variables

42
possible that these findings only seem contradictory and are in fact very logical, but for a final
decision about this, the finding would need to be discussed further with industry experts.
The overall majority (88%) of the capital investments plans involves the adoption of new technology
that will change the way of working in the company, for example by investing in different machines.
All respondents were asked if they expected the size of the workforce to change in the next 12
months. One in ten companies did not answer this question and about half of the remaining
companies expected that the number of workers would remain the same (see Table 12). Of the
remaining 49 companies, only 6 of the respondents expected that the number of workers would
decrease, on average by 15 workers, and 43 companies foresaw an increase of the workforces, on
average by 15 workers as well. Based on the average number of workers per company, this would be
an increase of the workforce of the participating companies by about 3%.
The expected changes in the workforce was relatively small in companies producing machine tools,
because a smaller share of companies expect a smaller than average increase. On the other hand,
companies producing other capital goods expected a higher increase: combining the figures in the
table on the expected changes and the average number of workers leads to an increase of almost
5%. This finding is in line with the positive mood in these companies concerning future economic
developments and that relatively many companies producing other capital goods planned for capital
investments. Also in line with the findings described above is that the overall majority of the
unorganised sector generally do not expect any changes in the size of their labour force, while the
figures reported by small companies (with 10 to 49 employees) implied a very big increase of the
workforce of well over 12%. Medium sized companies would also grow, but only slightly more than
the average figures.
Companies in Nashik generally expected to have a larger workforce by next year. In Konkan,
relatively few companies expected the workforce to increase in the year to come, but those who did,
expected a bigger than average increase of the workforce, leading to a increase of about 5%. This
finding is in line with the finding that Konkan division based companies expected the economic
situation to improve, but not (as mentioned above) with the finding that relatively few companies of
this group plan capital investments. These findings require further validation.
Companies that expected size of the workforce to change were also asked to indicate which current
job roles would be affected and which new job roles might be introduced. Of the 49 companies that
expected the size of the workforce to change, only 11 answered this question. Their answers are
summarised in Table 34 in Appendix 2. Together, the 11 companies mentioned 102 job roles, 1 for
which the number of workers would decrease and 101 for which the number of workers would
increase. A closer look at the data reveals that 17 of the job roles mentioned would be new job roles
for the company, while the remaining 84 job roles for which the respondents expected the workforce
to increase, were already present in the company. More precisely, the workforce of the 11
companies is expected to grow especially for the job role categories welding and related roles and
“component fabrication and preparation - fabrication fitter”. The participating companies expected
that the number of workers in these job roles would grow by 166 and 162 workers respectively, i.e.
33 and 32 on average per company. Other job role category for which the participating companies
expected an increase were CNC operators (115 in total or 8.8 per company on average), conventional
machine operators (85 in total or 7.1 per company on average) and staff in projects and planning
roles (79 in total or 8.8 per company on average). The findings support the decision of the CGSC to
focus part of the survey on the skills and knowledge of fitters - fabrication (see paragraph 1.14.7).

Table 12 - Expected changes in the size of the workforce in the next year
the same
% of
companies
% of
companies
Average number
of workers less
% of
companies
Average number
of workers more
Total 105 220,0 44% 6% 15,0 41% 19,5 10%
Sub-sector
Dies, Moulds & Press Tools 27 88,4 30% 15% 17,5 44% 13,5 11%
Light Engineering Goods 9 313,2 44% 0% #DIV/0! 44% 16,3 11%
Machine Tools 38 266,5 53% 0% #DIV/0! 37% 13,7 11%
Other capital Goods 22 350,5 27% 9% 10,0 55% 32,9 9%
Unorganised sector 9 6,6 89% 0% #DIV/0! 11% 25,0 0%
Division:
Pune 53 367,2 42% 2% 10,0 57% 21,1 0%
Konkan 33 59,5 58% 6% 3,8 15% 21,0 21%
Aurangabad 11 85,1 36% 27% 7,2 9% 20,0 27%
Nashik 8 93,1 13% 0% #DIV/0! 88% 11,7 0%
Company size:
Up to 9 workers 9 6,6 89% 0% #DIV/0! 11% 25,0 0%
10 to 49 workers 43 28,1 30% 7% 8,3 47% 8,8 16%
50 to 249 workers 39 109,1 46% 8% 21,7 38% 14,7 8%
250 workers or more 14 1255,9 50% 0% #DIV/0! 50% 59,9 0%
VariablesNumber of
companies
Average number
of workers
In the next year, the number of workers is is expected to be
No
answer
lower higher

The last question of this section in the questionnaire was whether participants expected that their
workforce would need new skills in the year to come. See Table 35 in Appendix 2 for a detailed
breakdown of the answers of the respondents. The table shows that the share of respondents that
expected that the skills required from the workers would remain the same is more or less as big as
the share of respondents that expected that other skills would be required. A change in the required
skills was especially expected in the sub-sectors light engineering goods and machine tools, while the
overall majority of the respondents from the unorganised sector did not expect any changes.
Furthermore, relatively many companies based in the Konkan division expected their skill
requirements to change in the year to come, while the opposite was the case for participating
companies in Pune division. In terms of company size, the table shows that changes were especially
expected by small companies with 10 to 49 workers.
The respondents have specified what other skills they expected to be needed in the year to come.
Their answers have been analysed (see Appendix 5) and summarised in Table 36 in Appendix 2. The
50 respondents mentioned 76 different skills, of which the majority involved needing very practical
and concrete skills. Interesting is that 10 respondents felt that they would need better social skills
from their workforce and that 8 respondents wanted the workers to combine different skills rather
than specialising in one specific skill. Six respondents wanted their workers to have better technical
skills, but did not specify what skills exactly, and five respondents did not answer or could not answer
this question yet, for example because it would depend on the adoption of new technology.
The skills mentioned were not new for the sector, but may well have been new for the company in
question. However, it is also possible that some of the participants misunderstood the question and
mentioned which skills in their workers needed to improve, rather than skills that were completely
new to their workforce. The question may have to be articulated differently in a future survey on this
subject.
4.5 Training and training providers
Training of employees and contract workers One in five companies that participated in the survey had training departments and over a quarter
had training plans/budgets (see Table 37 in Appendix 2). Not surprisingly, the bigger the company,
the more likely it was for the company to have training department and a training plan / budget. And
as participating companies that produced other capital goods had on average the biggest number of
workers, a bigger share these companies had a training department and a training plan / budget than
companies in other sub-sectors.
The figures also varied a bit between sub-sectors and divisions: in terms of average number of
workers, companies based in Aurangabad and Nashik were medium sized, but a relatively big share
of them had a training department and/or training plan / budget. On the other hand, an average
Pune based company in this survey was large sized (i.e. with 250 workers or more), but relatively few
companies had training departments while a comparatively big share had a training plan / budget.
According to Table 38 in Appendix 2, practically all companies trained new employees, which is in line
with expectations. More interesting is that three quarters of the 55 participating companies that had
contract workers gave contract workers the same training as their employees (see Table 39 in
Appendix 2). However, this share was lower for companies producing machine tools or other capital
goods and for companies based in Pune.
From the perspective of the companies, and this was confirmed by some of the respondents, it
would have made sense to invest less in training of contract workers than in training of the
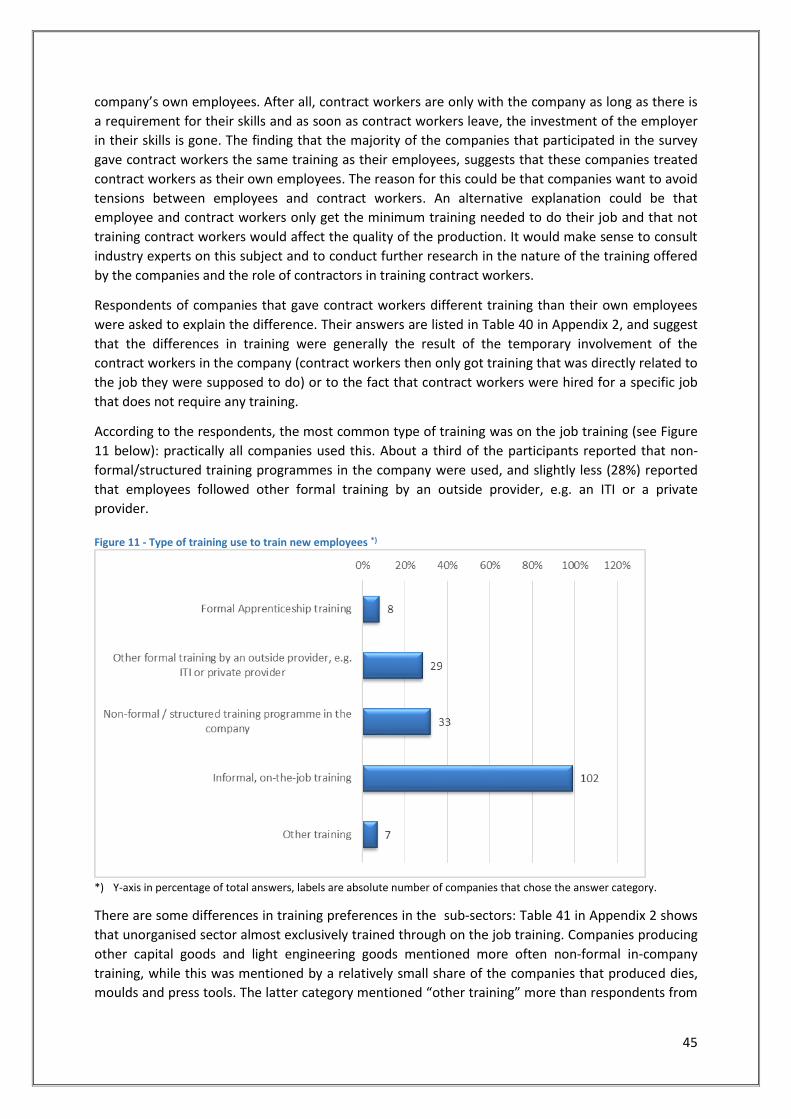
45
company’s own employees. After all, contract workers are only with the company as long as there is
a requirement for their skills and as soon as contract workers leave, the investment of the employer
in their skills is gone. The finding that the majority of the companies that participated in the survey
gave contract workers the same training as their employees, suggests that these companies treated
contract workers as their own employees. The reason for this could be that companies want to avoid
tensions between employees and contract workers. An alternative explanation could be that
employee and contract workers only get the minimum training needed to do their job and that not
training contract workers would affect the quality of the production. It would make sense to consult
industry experts on this subject and to conduct further research in the nature of the training offered
by the companies and the role of contractors in training contract workers.
Respondents of companies that gave contract workers different training than their own employees
were asked to explain the difference. Their answers are listed in Table 40 in Appendix 2, and suggest
that the differences in training were generally the result of the temporary involvement of the
contract workers in the company (contract workers then only got training that was directly related to
the job they were supposed to do) or to the fact that contract workers were hired for a specific job
that does not require any training.
According to the respondents, the most common type of training was on the job training (see Figure
11 below): practically all companies used this. About a third of the participants reported that non-
formal/structured training programmes in the company were used, and slightly less (28%) reported
that employees followed other formal training by an outside provider, e.g. an ITI or a private
provider.
Figure 11 - Type of training use to train new employees *)
*) Y-axis in percentage of total answers, labels are absolute number of companies that chose the answer category.
There are some differences in training preferences in the sub-sectors: Table 41 in Appendix 2 shows
that unorganised sector almost exclusively trained through on the job training. Companies producing
other capital goods and light engineering goods mentioned more often non-formal in-company
training, while this was mentioned by a relatively small share of the companies that produced dies,
moulds and press tools. The latter category mentioned “other training” more than respondents from

46
other companies. What “other training” was offered was not clarified by the respondents (see Table
42 in Appendix 2).
Relationships between companies and training providers Two out of five participating companies had a direct relation with training providers (see Table 43 in
Appendix 2). This share was higher in companies producing dies, moulds and press tools or machine
tools and lower in the other sub-sectors. The companies in Konkan division differed substantially
from the other participating companies: only 21% (7 out of 33) reported having a direct relation with
an ITI or a private training provider. As to be expected, a much bigger share of the large companies
had direct relationships with training institutes than smaller companies.
The nature of the relationship between the companies and the training institutes differed, but Figure
12 shows that recruitment activities were an important part for a big majority of more than two
thirds of the 42 companies with a direct relationship with one or more training institutes. Another
important element in the relationship with training institutes was that apprenticeship students or
trainees of the training institutes were placed in the company (45%), and companies welcoming
visiting students of training institutes (36%). A very small number (i.e. 6) of companies provided the
institutes with training facilities and five companies qualified the nature of their relationship with
training 5) institute as “other”. The number of companies with a direct relation with training institute
is too small to report on differences between sub-sectors: see Table 44 in Appendix 2 for more
information.
Figure 12 - Nature of relationship between companies and training institutes *)
*) Y-axis in percentage of total answers, labels are absolute number of companies that chose the answer category.
The descriptions of the relationships that were qualified as “other” are listed in Table 45 in
Appendix 2. The nature of these relationships varied from activities in the context of Corporate Social
Responsibility to another approach to recruitment and having students of ITIs or colleges work in the
company. Two companies worked with the training institute on content, for example by organising
seminars or giving lectures, and by asking the institute to give input for reports.
Company representatives were also asked about the issues they encountered when dealing with
training institutes. The respondents reported 95 issues, of which almost a quarter referred to
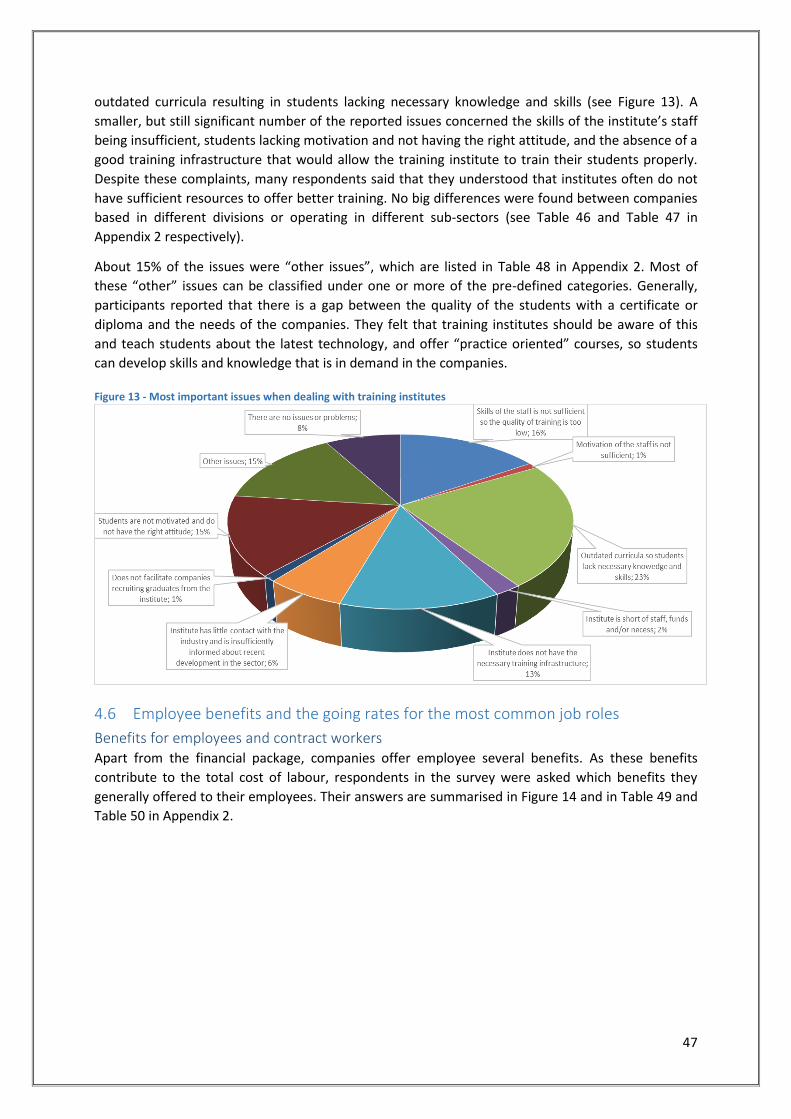
47
outdated curricula resulting in students lacking necessary knowledge and skills (see Figure 13). A
smaller, but still significant number of the reported issues concerned the skills of the institute’s staff
being insufficient, students lacking motivation and not having the right attitude, and the absence of a
good training infrastructure that would allow the training institute to train their students properly.
Despite these complaints, many respondents said that they understood that institutes often do not
have sufficient resources to offer better training. No big differences were found between companies
based in different divisions or operating in different sub-sectors (see Table 46 and Table 47 in
Appendix 2 respectively).
About 15% of the issues were “other issues”, which are listed in Table 48 in Appendix 2. Most of
these “other” issues can be classified under one or more of the pre-defined categories. Generally,
participants reported that there is a gap between the quality of the students with a certificate or
diploma and the needs of the companies. They felt that training institutes should be aware of this
and teach students about the latest technology, and offer “practice oriented” courses, so students
can develop skills and knowledge that is in demand in the companies.
Figure 13 - Most important issues when dealing with training institutes
4.6 Employee benefits and the going rates for the most common job roles
Benefits for employees and contract workers Apart from the financial package, companies offer employee several benefits. As these benefits
contribute to the total cost of labour, respondents in the survey were asked which benefits they
generally offered to their employees. Their answers are summarised in Figure 14 and in Table 49 and
Table 50 in Appendix 2.

48
Figure 14 - Employee benefits
Figure 14 shows that three benefits were the most common: medical insurance or medical services
for employees, bonuses and paid leave days.
Four out of five respondents indicated that the company offered medical insurance or medical
services for employees. Table 50 in Appendix 2 shows that the share was higher in larger companies
than in small companies. Though the question clearly asked about for medical insurance or services
other than the Employees' State Insurance (ESI) package4, it is likely that the respondents did not
make a difference between the insurance for employees earning more than the maximum ESI
amount and employees that take part in this scheme. Under the ESI scheme, both the insured
employees and their dependents are entitled to medical treatment. However, offering medical
insurance or medical services to family members was not very common among the participating
companies: just over one in five companies reported this benefit, though the share is a lot higher
among medium-sized and large companies than in the smaller ones.
According to the respondents, employees in their companies had on average 25.5 leave days. Legally
(i.e. according to the Factories Act), employees are entitled to 1 paid leave day for every 20 days of
work, amounting to maximum 12 paid leave days per year. However, according to an article on
www.dnaindia.com, employees get on average 18 paid days of leave5. In addition to this, there are
three public holidays during which all employees are off (i.e. January 26(Republic Day), August 15
(Independence Day) and October 2 (Mahatma Gandhi's Birthday)) and several holidays that are not
observed throughout India. It is plausible that the average number of paid leave days mentioned in
this survey, includes national and regional public holidays, but may still be higher than the legal
minimum.
4 The Employees' State Insurance is a social security and health insurance scheme for Indian employees
earning wages of INR 15.000 per month or less. Considering the type of work in the companies that
participated in this survey, it is very likely that many employees of the participating companies are obliged
to take part in this scheme. 5 See www.dnaindia.com/mumbai/report-53-indians-feel-paid-vacation-time-given-to-them-not-fair-2013573
(retrieved on 1 November 2015)

49
Other employee benefits that were mentioned by a relatively big share of respondents were bonuses
(86%) and gratuity (67%)6. Less common benefits were transport to and from work (and especially
reimbursement of transport costs) and the provision of meals. Only one company offered unpaid
leave to its workers. Two out of five employers mentioned having an accident policy for workers
while on the job. However, this is not so much an employee benefit, but part of the operational
management strategy of the company.
One out of five respondents mentioned “other benefits” (see Table 53 in Appendix 2). These other
benefits involved mostly arranging accommodation to employees, support in education (for the
employee or for his or her children), other insurance of employees, and the provision of uniforms
and safety gear. Just like having an accident policy for workers while on the job, the provision of
uniforms and safety gear would not be an employee benefit, but part of operational management of
the company.
The figures on employee benefits are broken down by sub-sector in Table 49 and by company size in
Table 50 in Appendix 2. The figures show that there were not so many differences between the sub-
sectors, except for companies that are part of the unorganised sector, where the number of
employee benefits was limited, which is in line with the nature of the company.The company size has
a strong effect on the employee benefits that are offered: the bigger the company is, the more
benefits it offers to its employees. This may be because large companies are legally required to offer
more benefits than smaller companies, but also because large companies generally have more
professional human resources departments than smaller companies.
The overall majority (80%) of companies made provident fund payments for their employees (see
Table 52 in Appendix 2). One in ten companies did not answer this question and the remaining 10%
did not make provident fund payments. Table 52 shows that the companies that did not make these
payments are mostly micro-sized and small companies, while almost all (except for one) medium
sized companies and large companies did. Though some respondents were not sure about the
amounts they paid into the provident fund, the majority (72 out of 84 companies that made
provident fund payments) mentioned paying 12% of the total salary, which is in line with regulations.
Contractors are responsible for the financial package and other benefits for contract workers.
However, if contract workers work side by side with regular employees, but receive very different
pay and benefits, the atmosphere on the shop floor may be negatively affected. That is why some
companies also offer services and extras to contract workers. Participants representing 55 companies
with contract workers were asked about these services and extras for contract workers and their
responses are listed in Table 54 in Appendix 2. Like the benefits of regular employees, medical
insurance or medical services, and paid leave days are mentioned by the majority of the respondents
as benefits for contract workers, which is not in line with expectations because medical insurance
(65%) and paid leave days (75%) would typically be the responsibility of the contractor. This is an
indication that the question may need to be rephrased in a future survey on this subject. Other
benefits companies mentioned for contract workers are bonuses (69%) and gratuity (31%).
Going rates for the most common job roles Employers are generally hesitant to share information about the remuneration of their employees.
That is why respondents were asked what wages / salaries they would offer to recruit new
employees or to hire contract workers for the most common job roles. Respondents gave a minimum
6 Gratuity is a statutory benefit payable by employers (directly or via an insurance) to employee after 5 years
of continuous full time service.

50
amount and a maximum amount for each job role, both for permanent employees and for contract
workers. The results are presented in Figure 15 and in Table 51 in Appendix 2.
Respondents have given minimum and maximum rates for employees in 470 of the total of 584 job
roles that were mentioned (see paragraph 4.2). For contract workers, 59 respondents mentioned a
minimum and maximum rate.
Looking at Figure 15 and at Table 51, it is immediately clear that the rates for permanent employees
are much higher than for contract workers, both for the average minimum fees that were mentioned
and for the maximum fees. Also, the figures show that contract workers are not hired for certain job
roles, for example for quality roles and administrative roles. During the interviews, some
respondents explained that contract workers were especially hired for relatively simple jobs and that
contract workers did not need to have experience, justifying a lower rate. This would explain the
lower minimum and maximum rate for contract workers. Also, respondents stressed that jobs in
which strategic information about the company is used or produced, are generally not done by
contract workers, which could explain why no fees for contract workers are mentioned for quality
roles and administrative staff.
Figure 15 clearly shows that the range between the minimum and maximum rate for employees is
much larger for some job role categories than for others. For example, for categories like
designer/draughtsmen, quality roles, projects and planning roles, and marketing, research and
service roles, the difference between the minimum and maximum monthly rate varies from almost
INR 30 thousand to well over INR 40 thousand. For employees in welding and related roles, helpers,
and CNC setter cum operator roles, the range is much smaller, varying from INR 4 thousand to just
over INR 5 thousand. This suggests that the first mentioned group of job role categories offers
potential for professional growth, while employees in the second group of job role categories have
less room for growth.
Lastly, the average monthly rate for the production role category “component fabrication and
preparation” is much higher than for the other production roles. This can indicate that there is a
longer career path for workers in this job role, but might also be an indication of a shortage of
capable workers for this job role category, forcing employers to offer higher wages.

Figure 15 - Minimum and maximum going rates for the most common job roles for employees and contract workers
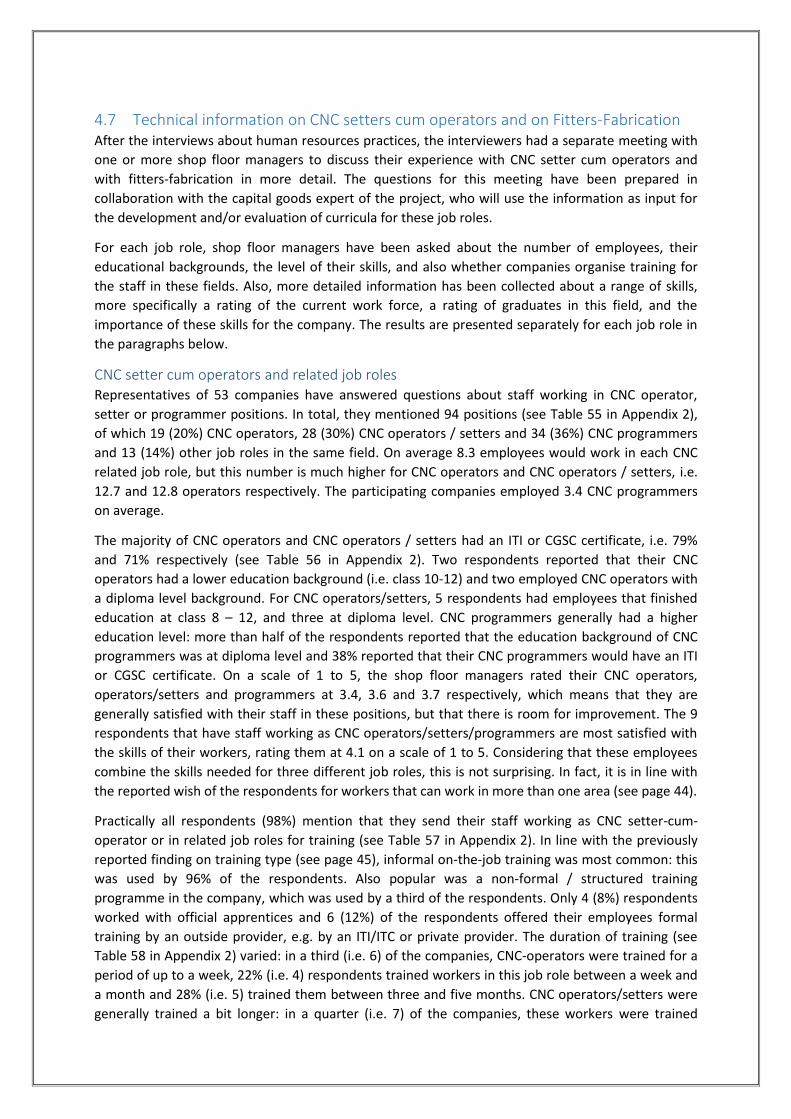
4.7 Technical information on CNC setters cum operators and on Fitters-Fabrication After the interviews about human resources practices, the interviewers had a separate meeting with
one or more shop floor managers to discuss their experience with CNC setter cum operators and
with fitters-fabrication in more detail. The questions for this meeting have been prepared in
collaboration with the capital goods expert of the project, who will use the information as input for
the development and/or evaluation of curricula for these job roles.
For each job role, shop floor managers have been asked about the number of employees, their
educational backgrounds, the level of their skills, and also whether companies organise training for
the staff in these fields. Also, more detailed information has been collected about a range of skills,
more specifically a rating of the current work force, a rating of graduates in this field, and the
importance of these skills for the company. The results are presented separately for each job role in
the paragraphs below.
CNC setter cum operators and related job roles Representatives of 53 companies have answered questions about staff working in CNC operator,
setter or programmer positions. In total, they mentioned 94 positions (see Table 55 in Appendix 2),
of which 19 (20%) CNC operators, 28 (30%) CNC operators / setters and 34 (36%) CNC programmers
and 13 (14%) other job roles in the same field. On average 8.3 employees would work in each CNC
related job role, but this number is much higher for CNC operators and CNC operators / setters, i.e.
12.7 and 12.8 operators respectively. The participating companies employed 3.4 CNC programmers
on average.
The majority of CNC operators and CNC operators / setters had an ITI or CGSC certificate, i.e. 79%
and 71% respectively (see Table 56 in Appendix 2). Two respondents reported that their CNC
operators had a lower education background (i.e. class 10-12) and two employed CNC operators with
a diploma level background. For CNC operators/setters, 5 respondents had employees that finished
education at class 8 – 12, and three at diploma level. CNC programmers generally had a higher
education level: more than half of the respondents reported that the education background of CNC
programmers was at diploma level and 38% reported that their CNC programmers would have an ITI
or CGSC certificate. On a scale of 1 to 5, the shop floor managers rated their CNC operators,
operators/setters and programmers at 3.4, 3.6 and 3.7 respectively, which means that they are
generally satisfied with their staff in these positions, but that there is room for improvement. The 9
respondents that have staff working as CNC operators/setters/programmers are most satisfied with
the skills of their workers, rating them at 4.1 on a scale of 1 to 5. Considering that these employees
combine the skills needed for three different job roles, this is not surprising. In fact, it is in line with
the reported wish of the respondents for workers that can work in more than one area (see page 44).
Practically all respondents (98%) mention that they send their staff working as CNC setter-cum-
operator or in related job roles for training (see Table 57 in Appendix 2). In line with the previously
reported finding on training type (see page 45), informal on-the-job training was most common: this
was used by 96% of the respondents. Also popular was a non-formal / structured training
programme in the company, which was used by a third of the respondents. Only 4 (8%) respondents
worked with official apprentices and 6 (12%) of the respondents offered their employees formal
training by an outside provider, e.g. by an ITI/ITC or private provider. The duration of training (see
Table 58 in Appendix 2) varied: in a third (i.e. 6) of the companies, CNC-operators were trained for a
period of up to a week, 22% (i.e. 4) respondents trained workers in this job role between a week and
a month and 28% (i.e. 5) trained them between three and five months. CNC operators/setters were
generally trained a bit longer: in a quarter (i.e. 7) of the companies, these workers were trained

53
between three and five months and 29% (i.e. 8) even for more than a year. In ten of the participating
companies (29%) CNC programmers were trained for three to five months and in 8 companies (24%),
workers in this job role were trained for up to one week. Five companies (15%) trained CNC
programmers for more than a year and a similar number trained them for 1 week to 1 month.
Figure 16 and Table 59 in Appendix 2 contain the rating of skills and knowledge of the current
workforce in CNC positions and of graduates in this field. Also, the importance to the company is
rated for each item.
Figure 16 shows that on all the items, respondents rated their workforce at 3.2 or higher (on a scale
of 1 to 5), while graduates were rated at 2.9 or higher. The distribution of the scores on the items is
strongly skewed towards the right and the variance (not mentioned in the table) is rather small. In
short, the items do not have a statistical “normal distribution”. Though respondents did report
several issues when dealing with training providers (see page 45 and 46), the distribution of the
ratings indicates that respondents were quite satisfied with the skills and knowledge of their
workforce and of the graduates. An explanation can be that the training in the field of CNC is
sufficient, but that the reported issues concern other fields. Alternatively, respondents may have
found it difficult to criticize their team-members and interns and would therefore give a score of 3 or
above, which would be a “social desirability bias”
Comparing the scores of the different items, it seems that there would be room for improvement for
the skills of the workforce in their “use of shop mathematics” (average score 3.2) and to a lesser
extend in the “use of hand tools” and “CNC G & M codes” (both have an average score of 3.5) and in
“interpreting engineering drawings” and “CNC canned cycles” (each scored at 3.6 on average).
Only few respondents had direct experience with employees that recently completed an education
or training in the field of CNC. Those who did, rated the skills of the current workforce generally
higher than the skills of the graduates, which is not surprising as the latter group does not have as
much experience as the current employees. Only the skill “use of shop mathematics” is rated higher
for graduates than for the current workforce and the skill “interpreting engineering drawings” is
rated almost equal for the current workforce and for graduates. This finding supports the remark
above that these two skills among the current workforce may need to be improved. For training and
education providers, the findings suggest that more attention should be given to “CNC G & M codes”
(average score of 2.9). And with an average score of 3 (albeit by a limited number of respondents),
training and education might be improved on “use of hand tools”, “CNC vertical machining centre
setup”, “CNC vertical machining centre operation” and “CNC canned cycles”.
All items in the questionnaire were considered “important” for the company: on a scale of 1 to 5, the
average score varied from 4.3 to 4.7.
Additional remarks on about the skills and knowledge of the current workforce in CNC positions and
graduates in the field of CNC, as well as the importance to the company are listed in Table 60 in
Appendix 2.
Fitters fabrication and related job roles Representatives of 24 companies responded to questions about staff working in fitter-fabrication
positions. In total, they mentioned 56 positions (see Table 61 in Appendix 2), of which 15 (27%)
welders, 12 (21%) fitters-fabrication and 7 (13%) fitters/welders. Sub arc operators, welders fitters
and welder/fabricators were each mentioned 5 times (i.e. 9%), and other job roles in the same field
were mentioned by 7 companies (i.e. 12%).
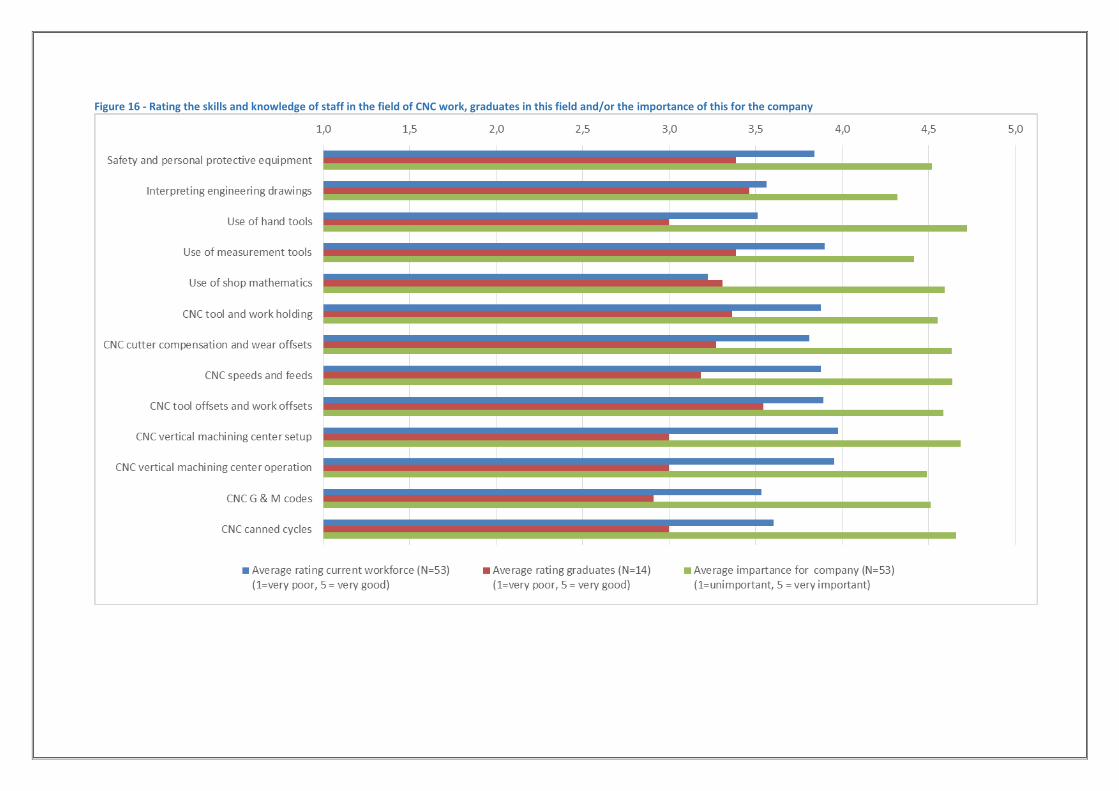
Figure 16 - Rating the skills and knowledge of staff in the field of CNC work, graduates in this field and/or the importance of this for the company

On average 12.2 employees worked in these job roles, but this number is much higher for welders-
fitters (23.8 employees). The number of welders is also above average (12.7 employees), while the
average number of employees is lower for the other job roles.
The overall majority of the respondents mentioned that employees in the fitter-fabrication job roles
had an ITI/CGSC certificate. Only some respondents mention lower educational achievements for
their staff in some job roles, for example, 3 out of 11 mention that their fitter-fabrication had
finished class 10-12 and half of the fitters/welders had finished class 8-10 or class 10-12. As for the
rating of the skills, shop floor managers rated their staff in the fitter-fabrication job roles between 3.5
and 4 on a scale of 1 to 5.
All 24 respondents mentioned that the company’s staff working in fitter-fabrication job roles were
trained (see Table 63 in Appendix 2). As is the case for the CNC operator/setter/programmer job
roles, informal on-the-job training was most popular: it was used in all participating companies.
Seven respondents (29%) used a non-formal / structured training programme in the company and
only 2 (8%) worked with official apprentices. The duration of training varied (see Table 64 in
Appendix 2), but generally about half of the respondents trained their fitter-fabrication staff for 1-2
months or 3 to 5 months, and about a quarter of the respondents trained their staff for up to 1
month.
Figure 17 and Table 65 contain the rating of skills and knowledge of the current workforce in fitter-
fabrication positions and of graduates in this field. Also, the importance to the company was rated
for each item. Similar to the rating of skills and knowledge of CNC operators/setters/programmers,
respondents rated their fitter-fabrication workforce relatively high. Only one item, “GMAW (Gas
Metal Arc Welding) equipment - recognize, setup and operate”, is rated at 2.8 on a scale of 1 to 5.
The other ratings were all 3.3 or higher. As explained above, this can mean that the respondents
were just satisfied with their workforce or that they found it difficult to criticize their team-members,
giving them a score of 3 or above, which would be a “social desirability bias”.
Comparing the scores of the different items, it seems that there is room for improvement for the
workforce in the above-mentioned skill “Gas Metal Arc Welding equipment - recognize, setup and
operate”, and to a lesser extend in “interpreting engineering drawings” and the “use of shop
mathematics”. The average score was 3.3 for each of the latter two items.
Very few respondents (i.e. 4) had direct experience with employees that recently completed an
education or training for fitter-fabrication. However, the ones that did, gave graduates a higher rate
on some of the items. The rating of graduates for interpreting engineering drawings was 0.7 point
higher than for the workforce. For “Gas Metal Arc Welding equipment - recognize, setup and
operate”, the difference was also 0.7 point, but this is based on the scores of only 2 respondents. A
smaller difference of 0.2 in favour of graduates is found for the skills “use of shop mathematics” and
“examine work pieces”. On the other hand, the skills and knowledge of the workforce are rated
higher for welding positions (a difference of 0.6). The difference (in favour of the workforce) for
“Oxy-Fuel Gas Cutting equipment - recognize, setup and operate” and “Plasma Arc Cutting
equipment - recognize, setup and operate” is 0.9 and 0.8 respectively, but the average rating of
graduates on these items is based on the answers of only two respondents, which means that the
actual difference in skill and knowledge of workers and graduates may be smaller. If necessary, this
can be investigated further in future studies in this field.
Similar to the items about the skills and knowledge of CNC operators/setters/programmers: all
questions about the skills and knowledge of fitters-fabrication were considered “important” for the
company: on a scale of 1 to 5, the average score varied from 4.3 to 4.8.
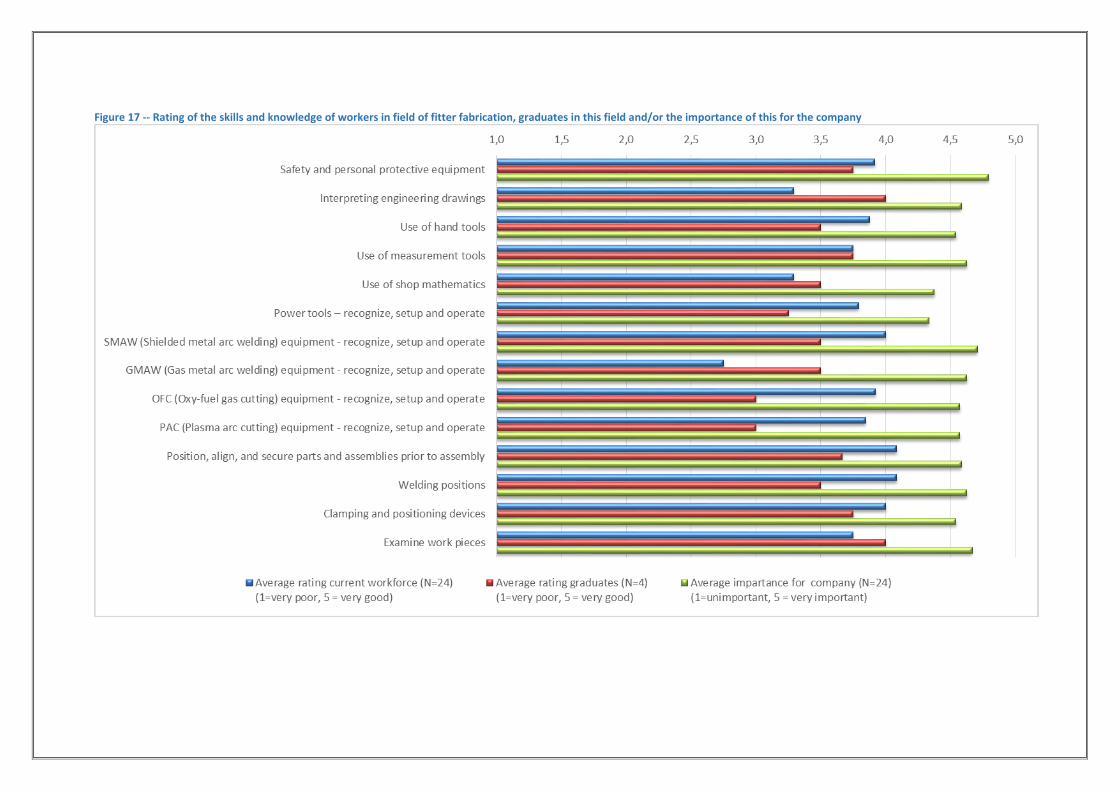
Figure 17 -- Rating of the skills and knowledge of workers in field of fitter fabrication, graduates in this field and/or the importance of this for the company

Additional remarks on about the skills and knowledge of the current fitters-fabrication workforce and
graduates in this field, as well as the importance to the company are listed in Table 66 in Appendix 2.
Changes in number of workers The final question for the shop floor managers was whether the number of workers in CNC
operator/setter/programmer and fitters-fabrication would change in the years to come. If so,
respondents were asked to specify the size of the change. In Table 67 in Appendix 2, their answers
are listed. The table show that the respondents were in a very positive mood: they all expected that
the number of workers in all job roles would increase or remain the same. More precisely, half of the
respondents expected an increase and the other half expect the number of workers to remain the
same.
The average increase would be especially big for CNC setters, welder-fitters, CNC operators and
welders. The total number of CNC operators was expected to increase the most (9 respondents
expecting an increase of 13 workers on average), followed by welders (6 respondents and an average
increase of 10.8), welder-fitters (3 respondents expecting an increase of 21 on average) and CNC
programmers (12 respondents expecting an increase of 5.1 on average).
Considering the limited number of respondents, the reported expectations may be indicative for
what was expected for the work force in the participating companies and not for sector wide
developments in Maharashtra for which further (econometric) research will be required.
58
5 Conclusions and recommendations
Considering that this labour market analysis was a pilot study and that the participation in the survey
was limited (see paragraph 3.2), the findings in this survey may not be representative for all capital
goods producing companies in Maharashtra. However, the labour market analysis has contributed to
clarifying a number of issues.
The findings and recommendations presented below are not necessarily new and may have been
anecdotally stated in different forums in the past. In contrast, the current findings and conclusions
are primary and evidence-based (i.e. not on based on assumptions), and express the views of a range
of companies from different divisions in Maharashtra, from different sub-sectors and of different
company sizes. The study provides proof of and further details on selected issues and constraints
related to the demand and supply of labour in the capital goods sector in Maharashtra.
This last chapter contains the conclusions and recommendations that can be based on the findings
reported above. In the next paragraphs, the main findings and conclusions for each subject are
briefly discussed, followed by one or more recommendations.
5.1 Set up a system for labour market analysis
Findings and conclusions Labour markets are not always predictable and are influenced by many internal and external factors.
There are important differences between companies in different sub-sectors, regions, company sizes
and other characteristics of companies. For example, in this survey, the mood in companies in the
unorganised sector was much more negative than in other sub-sectors. And though many companies
were not happy about the economic situation at the time, the total size of the workforce of the
participating companies had increased, suggesting an increase in productivity. Understanding the
reasons behind these findings requires a qualitative labour market analysis rather than econometric
forecasting models. This is also the case for subjects like skill problems, retention and recruitment
problems, recruiting women and persons with disabilities for specific job roles, etc.
Recommendations The traditional manpower planning approach differs from the qualitative methodology used in this
survey. Qualitative labour market analysis, or labour market signalling, implemented on a regular
basis, is more useful as a means of informing policy makers and other stakeholders on labour market
developments. It would be good if a system were adopted that is sensitive to fluctuations and
differences in the labour market and that would help to understand unexpected changes, differences
between sub-sectors, company sizes and regions, etc.
5.2 Active involvement in future labour market analyses
Findings and conclusions Convincing representatives of companies to take part in the survey was difficult, whereas having
access to employers is key to any labour market analysis. Due to circumstances, little time was left
prior to the survey to approach companies to “test the water”, which was why the active support of
the CGSC representatives during the first week of the survey was essential in arranging appointments
for interviews with a number of large sized enterprises. During the following weeks of the survey, the
project and the interviewers had to take up this role, which was time consuming and not always
successful. In the final stages of the survey, local representatives of CGSC member associations in
59
Aurangabad and Nashik have helped convincing companies to take part in the survey, and as a result,
the response rate of companies in these divisions increased significantly.
Despite these efforts to convince companies to participate in the survey, the number of companies
that took part was less than the experts had hoped. This means that generalising the findings of the
survey can only be done very carefully. Secondly, though more companies will now know of the
existence and the role of the CGSC, and how the CGSC relates to the sub-sector associations they are
a member of, the survey could have been used more as a marketing instrument for the CGSC to
increase the awareness of the companies in this field.
This LMA for the demand side should ideally have been complemented by an analysis of the supply
side, e.g. obtaining data and opinions from training institution principals, teachers and students.
However, the survey budget did not allow for these additional activities, which is why the
information and views presented in this report are based on the responses of the 105 participating
companies and to a certain extent on additional information received from selected key informants.
Recommendations CGSC and/or its member associations could consider to not only conduct regular labour market
analyses on different subjects and in different states, but to also play an active and leading role in
the design, implementation, analysis and reporting and to not leave it to an outside consultant. . This
would increase the CGSC’s own knowledge and understanding of the sector, and it would also be an
excellent way to use the surveys to increase the visibility of the CGSC in the sector and, if possible, to
further build up the CGSC’s network of companies.
5.3 Determine the size of the unorganised sector
Findings and conclusions The small number of unorganised sector companies taking part in the survey could mean that the
sector is highly organised, but it is also possible that the chosen approach to identify unorganised
sector companies was not appropriate. Considering the impressive size of the unorganised sector in
India, it is very well possible that unorganised sector companies are considerably under-represented
in this survey.
If the capital goods sector is indeed highly organised, it would make sense to only target organised
sector companies when designing and implementing skill development programmes and recognition
of prior learning initiatives. However, if the number of unorganised sector capital goods producing
companies and the number of persons these companies employ is not negligible, the design of these
programmes and initiatives would need to be adjusted to the needs of the unorganised sector
companies and their workers. This is especially the case for recognition of prior learning initiatives,
asmany workers in the unorganised sector do not have official qualifications but acquire knowledge
and skills on the job.
Recommendations At the moment, there is no statistical data on the share of unorganised sector companies in the
capital goods sector and the number of workers these companies would employ is unknown.
Therefore, it is recommended to establish the number of unorganised sector companies producing
capital goods and their number of employees through further research, and to use this information
when designing and implementing future activities in skill development.
60
5.4 Use the information about the most common job roles
Findings and conclusions As mentioned in the report, the 105 respondents have mentioned 584 job roles being present in
their companies. As similar job roles can go by different names (for example, fitters-fabrication are
likely to do the same work as fabrication-welders or fitters-welders, etc.), the 584 job roles have
been recoded into 46 job role names. Coding has been based on the descriptions given by the
respondents and as much as possible in line with the NOS/QPs developed by the CGSC. Because 46
job role names give too much detail for an analysis of the workforce in the participating 105
companies, the job role names have been merged into 20 job role categories, using the occupational
map developed by CGSC .
Recommendations A closer look is advised at the coding of the job roles into job role names and job role categories. This
information may be relevant when the NOS/QPs are updated. Depending on the share of
unorganised sector companies in the capital goods sector (see the previous paragraph), consulting
with organisations representing the unorganised sector is advised to understand how the job roles in
these companies differ from the organised sector and to find out what support would be needed to
assist unorganised sector companies in improving their skills base.
5.5 Recruitment and selection
Findings and conclusions A. Companies consulted during the survey use many different recruitment methods and selection
criteria. There was a strong preference for informal recruitment methods, but this preference
was especially strong among unorganised sector companies and small companies with up to 50
employees. Medium-sized and larger companies used more formal ways of recruitment. Almost
none of the companies recruited via employment exchanges. Selection criteria also differed in
companies of different sizes. Having a certificate, diploma or degree was not considered
important in the unorganised sector companies, but having work experience was. In bigger
companies, respondents used (written or practical) tests and references from previous
employers, which was not the case for small and medium-sized companies. The behaviour of the
potential employee during the interview was into account by companies of all sizes.
The strong preference for informal recruitment methods is a common feature for recruitment
worldwide. In many countries, this has led to government employment agencies shifting their
focus from placement-related services to active labour market measures. In other words,
employment services move away from simple matching support towards offering career
guidance, support to establishments, especially for small enterprises, and tailor made training
for specific target groups. In these fields, public employment services often face competition
from private organisations offering (part of) these services.
B. Smaller companies preferred recruiting underqualified workers and larger companies preferred
people with the right qualification. This may be because the limited number of workers in
smaller companies implies that the job roles will be more general while the larger companies
can afford to have more specialised positions among their staff. Yet representatives of smaller
companies also mentioned that workers were keen to work for larger companies, so recruiting
(and training) underqualified staff by smaller companies could be a way to control labour costs
and to secure their labour force. This information would need to be taken into account when
developing initiatives concerning recognition of prior learning.

61
C. Just over half of the participants would consider recruiting women for one or more of the
common job roles and 30% would consider recruiting persons with disabilities. In the
unorganised sector, reluctance to recruit women and persons with disabilities was highest.
Respondents mentioned that 18% of the most common job roles would be open for women and
8% for people with disabilities. Job role categories mentioned most for women were designer /
draughtsman, CNC Programmer, CNC (setter cum) operator, and Quality, Managerial and
Supervisory roles. Job role categories mentioned for disabled people were CNC Programmer,
designer / draughtsman and CNC operator.
D. A third of the companies recruited employees locally and almost half of the company
representatives recruited throughout India. Respondents highlighted that anyone is welcome to
work as long as they are willing to move to the base of the company.
Recommendations A. Public and private organisations offering employment services would need to focus especially on
offering services to job seekers (like career guidance) and to companies (in recruitment and
selection). They might want to target small companies specifically, as these reported more
retention problems and a higher number of vacancies on the one hand, but were very positive
about the economic developments and expected their workforce to grow on the other hand.
The information collected during labour market surveys and through other research should be
used as a tool in providing information about the different job roles in the sector for career
guidance purposes by relevant organisations.
B. When developing recognition of prior learning initiatives, take the recruitment and retention
strategy of small companies into account: recognition of prior learning should not increase the
apprehensions of employers that the employees may leave after getting an official qualification.
C. Labour market shortages might be targeted by considering workers that are currently a minority
in the sector, i.e. women and persons with disabilities. It might be good to conduct a more in-
depth study on how the companies might be willing to do this and if and what changes are
needed in the companies to realise this.
D. Though companies are generally willing to recruit from all over India, it would make sense if the
planning of education and training takes the local demand for labour into account.
5.6 Supply of labour for common job roles
Findings and conclusions Higher turnover and recruitment and skill problems were reported especially for the most common
job role category CNC operator. Fewer, but still more than average problems were mentioned for
tool and die makers, conventional machine operators, welding and related roles and for marketing,
research and service roles. Unfortunately, respondents also expected the demand to increase in the
year to come for four of these five job roles categories (i.e. CNC operators, tool and die makers,
conventional machine operators and welding and related roles).

62
The most reported recruitment problem is non availability of suitable candidates in the labour
market, followed by candidates not having the right technical skills and knowledge. A few companies
mentioned that the candidates lack soft skills like creativity and problem solving skills.
Recommendations Workers active as CNC operators, tool and die makers, conventional machine operators and in
welding and related roles seemed to be in short supply in the labour market. Also the demand for
workers in these job roles is likely to grow. Though the rates paid for employees in these job roles are
not exceptionally high, it would make sense for private and public training providers to concentrate
on training for these job roles, using up to date curricula that are in line with the relevant NOS/QPs.
5.7 Role of companies and training providers in education and training
Findings and conclusions About half of the respondents reported about expected changes in the skills required from the
workers. Changes in skill requirements were especially expected among companies producing light
engineering goods and machine tools, companies in Konkan division, and in small companies (i.e. 10
to 49 workers). The nature of the expected changes in skill requirement varied. Some respondents
mentioned very practical and concrete skills like machine operating, designing and fitting, etc. Of
course these are not new skills for the sector, but may be new for the company in question.
Technical skills and knowledge were mentioned as well, especially the ability to understand
engineering drawings. Also, respondents reported that they would need their workers to combine
different skills rather than the skills for one specific job role only.
In all companies, and especially in the unorganised sector, the vast majority of training is provided on
the job. About a third of the companies offered structured training programmes in the company and
an almost 30% offered formal training by an outside training provider.
The relationship of companies with education and training providers, involved mostly recruitment
activities, traineeships/apprenticeships and company visits of students to the company.
Several companies reported that new workers generally lacked practical skills. They would like
education and training providers to teach students about the latest technology and have “practice
oriented” courses, allowing students to develop skills and knowledge that are in demand in the
companies.
Recommendations A. Considering companies’ need for workers with more practical skills, collaboration between
companies and education and training providers in offering additional practical skills through
apprenticeships, internships and other short training programmes needs to be encouraged.
B. For some more specialist training the utilisation of company facilities and equipment would be
more efficient and useful than procuring additional facilities and equipment for the training
centres. Policy makers could consider incentives for companies and training providers to
participate in such schemes. The initiative to establish this collaboration would need to come
from training providers rather than expecting companies to initiate this.
C. Ministries and other organisations directly involved in vocational education and training may
review the handling of equipment and tools in their training centres and ensure that the practical

63
elements of the curricula are implemented as planned and/or are improved.
D. As employers mentioned that they will require several new skills and technical knowledge,
training providers could play a more active role in the upgrading of skills of the current
workforce. They could organise tailor-made training for companies and actively approach
companies to discuss opportunities to collaborate. Of course, the exact content of the trainings
would need to be based on a detailed needs assessment at local level.
E. Lastly, shop floor managers have been asked in detail about their experience with CNC setter
cum operators and with fitters-fabrication, both regarding the current workforce and workers
that recently obtained a certificate or diploma. The information will be used to evaluate a
curriculum developed for these two job roles by the project. It is recommended to repeat this for
updated or newly developed NOS/QPs-based curricula for other job roles as well – either as part
of a new labour market analysis or as a separate enterprise survey.
5.8 Career paths
Findings and conclusions The sizes of the participating companies varied substantially, as did the composition of their
workforce. Workers in large companies had a higher degree of specialisation, while job roles in
smaller companies were often more generalist by nature. Of course, this would make economic
sense for companies but a high degree of specialisation can have disadvantages for employees: it
could reduce workers’ chances for moving up the career ladder, unless the company has a suitable
training programme to help employees progress through the ranks. Career prospects in smaller
companies will be limited due to the generalist nature of job roles, which means that career
prospects of employees in smaller companies will be limited as well.
As always, there are exceptions to the above-mentioned. For some job roles, the range between the
minimum and the maximum wages for employees is much larger than for other job roles. For
example, for categories like designer/draughtsmen, quality roles, projects and planning roles, and
marketing, research and service roles, the difference between the minimum and maximum monthly
rate is substantially larger than for employees in welding and related roles, helpers, and CNC setter
cum operator roles, the range is much smaller. This suggests that the first mentioned group of job
role categories offers potential for professional growth, which is hardly the case for employees in the
second group of job role categories have less room for growth.
Recommendations The Occupational Map of the sector (Consultants Progilence & GlobalPeers, 2014) developed by
CGSC is indicative of the vertical and horizontal career progressions. This must be fully utilised by the
training system to counsel the trainees on potential careers, and when developing curricula, both for
public and private training providers. Also, companies with a high number of specialised job roles
could use career progression as a retention strategy in their human resources management strategy.
64
6 List of consulted documents
Capital Goods Skill Council (2013). Capital Goods Skill Council. By the Industry For the Industry.
Downloaded on 16 September 2015 from: www.cgsc.in/CGSC_Brochure_Aug13.pdf
Capital Goods Skill Council (2015). 56 National Occupational Standards/Qualification Packs.
Downloaded on 16 September 2015 from www.cgsc.in/qualification_pack.html
Consultants Progilence & GlobalPeers (2014). Capital Goods Sector Skills Council National
Occupational Standards Development Project. Occuptional map.
Downloaded on 16 September 2015 from: www.cgsc.in/om.pdf
Department of Heavy Industry, Ministry of Heavy Industries & Public Enterprises (2011). Report of
the working group on Capital Goods & Engineering Sector for the 12th Five year Plan (2012 – 2017).
Downloaded on 10 November 2015 from: http://dhi.nic.in/writereaddata/WG_CGES_rep_2011-
17.pdf
Directorate of Economics and Statistics, Planning Department, Government of Maharashtra (2015),
Economic Survey of Maharashtra 2014-15. Downloaded on 16 September 2015 from
http://mahades.maharashtra.gov.in/files/publication/esm_2014-15_eng.pdf
Government of India (2015). Draft National Policy for Skill Development and Entrepreneurship 2015.
Retrieved on 10 November from:
https://mygov.in/sites/default/files/master_image/Draft_National_Policy_for_Skill_Development_an
d_Entrepreneurship_2015.pdf
India-EU Skills Development Project (2013). Understanding the demand side of the labour market.
The automotive industry in Maharashtra. Downloaded on 16 September 2015 from: www.india-
euskills.com/img/documents/docs/Resized_Technical_Report_LMI_Report_FINAL.PDF
Ministry of Statistics and Programme Implementation (MOSPI) (2008). National Industrial
Classification 2008. Downloaded on 16 September 2015 from:
mospi.nic.in/Mospi_New/upload/nic_2008_17apr09.pdf
National Commission for Enterprises in the Unorganised Sector (2008). Working Paper No 2.
Contribution of the Unorganised sector to GDP. Report of the Sub Committee of a NCEUS Task Force.
Downloaded on 16 September from: nceuis.nic.in/Final_Booklet_Working_Paper_2.pdf
National Skill Development Corporation (2012). Human Resource and Skill Requirements in the
Capital Goods Sector (2012-17, 2017-22). Downloaded on 16 September from:
www.cgsc.in/Humanresource_skill_requirement.pdf


