95
Assessing The Potential For Renewable Energy On Public Lands
February 2003
U.S. Department of the Interior
Bureau of Land Management
U.S. Department of Energy
Energy Efficiency and Renewable Energy

Assessing The Potential For Renewable Energy On Public Lands
U.S. Department of the Interior
Bureau of Land Management
U.S. Department of Energy
Energy Efficiency and Renewable Energy
DOE/GO-102003-1704February 2003

NOTICE This report was prepared as an account of work sponsored by an agency of the United States government. Neither the United States government nor any agency thereof, nor any of their employees, makes any warranty, express or implied, or assumes any legal liability or responsibility for the accuracy, completeness, or usefulness of any information, apparatus, product, or process disclosed, or represents that its use would not infringe privately owned rights. Reference herein to any specific commercial product, process, or service by trade name, trademark, manufacturer, or otherwise does not necessarily constitute or imply its endorsement, recommendation, or favoring by the United States government or any agency thereof. The views and opinions of authors expressed herein do not necessarily state or reflect those of the United States government or any agency thereof.
Available electronically at http://www.osti.gov/bridge
Available for a processing fee to U.S. Department of Energy and its contractors, in paper, from:
U.S. Department of Energy Office of Scientific and Technical Information P.O. Box 62 Oak Ridge, TN 37831-0062 phone: 865.576.8401 fax: 865.576.5728 email: [email protected]
Available for sale to the public, in paper, from:
U.S. Department of Commerce National Technical Information Service 5285 Port Royal Road Springfield, VA 22161 phone: 800.553.6847 fax: 703.605.6900 email: [email protected] online ordering: http://www.ntis.gov/ordering.htm
Printed on paper containing at least 50% wastepaper, including 20% postconsumer waste
COVER PHOTOS (top to bottom): Wind turbines, Palm Springs, CA (PIX 01241, Warren Gretz, NREL); photovoltaic system, Lake Powell, UT (PIX 08022, Warren Gretz); hybrid cottonwood tree farm, Washington State (PIX 00241, Warren Gretz); concentrating solar power system, southwestern U.S. (courtesy of Henry Price, NREL); geothermal power plant, Sierra Nevada range, CA (PIX 10991, courtesy of Geothermal Resources Council).

iii
Acknowledgments David Garman, Assistant Secretary, U.S. Department of Energy (DOE), Energy Efficiency and Renewable Energy, the Federal Energy Management Program (FEMP), and the DOE National Renewable Energy Laboratory (NREL) gratefully acknowledge Ray Brady, Mike Kirby, and Lee Otteni in the Bureau of Land Management (BLM), Department of the Interior, for their contributions to this partnership project in support of BLM’s National Energy Policy activities. Their vision and commitment enabled the project partners to assess public lands with the highest potential for renewable energy resource development by industry. The primary authors of this report are Mike Kirby (National Science and Technology Center, BLM); Doug Dahle, project leader (Federal Energy Management Program, NREL); Donna Heimiller (Distributed Energy Resource Center, NREL); Barbara Farhar (Geothermal Program, NREL); and Brandon Owens (formerly in the Energy Analysis Office, NREL). The authors thank DOE FEMP Director Beth Shearer and FEMP Renewable Energy Program Lead Anne Sprunt Crawley for funding and programmatic support. We also thank DOE Wind & Hydropower Program Manager Peter Goldman for providing NREL technology staff support in the development of the report. And we thank the following NREL staff members for their contributions:
Mark Mehos and Hank Price (Concentrating Solar Power). Byron Stafford and John Thornton (Photovoltaics) Ed Cannon, Larry Flowers, and Brian Parsons (Wind) Richard Bain, Kevin Craig, and Ralph Overend (Biomass) Gerry Nix (Geothermal) Liz Brady-Sabeff and Dave Renne’ (Distributed Energy Resources Center) Tonya Cook, May Anne Dunlap, and Paula Pitchford, (Communications) Judy Hulstrom, Kathy Rose, and Margo Stenzel (Information Services) Pam Lee-Bull and Judy Powers (NREL FEMP) Lynn Kaemmerer (Human Resources).
We are also grateful to these BLM and DOE experts for contributions regarding the geothermal “top-pick” sites:
Paul Dunlevy (Geothermal Program Lead, BLM, Washington, DC) Rich Hoops and Jack Kelly (BLM Nevada State Office) Nancy Ketrenos, Duane Dippon, Corey Plank, and Eric Stone (BLM Oregon/Washington State Office) Sean Hagerty, Sonja Santillan, and Larry Vredenberg (BLM California State Office) Jim Fouts and Al McKee (BLM Utah State Office) Jay Spielman and Joe Torrez (BLM New Mexico State Office) Bill Lee (BLM Idaho State Office) Susan Norwood (Geopowering the West Program, DOE) Joel Renner (Idaho National Energy Engineering Laboratory, DOE).
And we thank Mary James, National Aeronautics and Space Administration, and John Townshend, University of Maryland, for contributing biomass data (see Appendix B).
Also acknowledged for their voluntary contributions are these organizations and industry partners in Colorado:
Dale Osborne (Disgen, Inc.) Doug Larson (Western Interstate Energy Board) Ron Lehr (Attorney, WindPowering America) John Neilson (Colorado Land & Water Fund) Randy Manion (Western Area Power Administration) Randy Gee (Duke Solar) Roger Davenport (Science Applications International Corporation).
Finally, the authors thank all those who responded to BLM’s request for public comment on the draft.
iv
Assessing the Potential for
Renewable Energy on Public Lands
Contents Page
Acknowledgments............................................................................................................. iii
Executive Summary ........................................................................................................... 1
1. Objective ...................................................................................................................... 2
2. Scope ............................................................................................................................ 2
3. Background .................................................................................................................. 2
4. The Approach for Assessing Renewable Energy Potential ......................................... 4
Task 1―Gather available information on renewable energy potential (including low-impact hydro, solar, wind, biomass and geothermal) ......................... 4
Task 2―Develop appropriate screens ......................................................................... 6
Task 3―Process data identifying broad geographical areas as high-, medium-, and low- or no potential for renewable energy development .................... 11
Task 4―Report on high-potential areas for inclusion in a Renewable Energy Action Plan ................................................................................. 18
5. The Comparative Analysis ......................................................................................... 18
6. Recommendations ...................................................................................................... 26
7. List of Appendices ..................................................................................................... 27
A. Western U.S. Renewable Resource and BLM Land Ownership GIS Maps ....... A1 B. Detailed Description and Data Sets for GIS Maps ............................................. B1 C. Intermediate and Analysis Results GIS Maps .................................................... C1 D. Intermediate and “Top-Pick” GIS Maps for Geothermal Field-Based
Resource Assessment .......................................................................................... D1 E. Planning Units with Highest Renewable Energy Potential ................................. E1 F. State Policies and Financial Incentives for Renewable Energy .......................... F1 G. References ........................................................................................................... G1 H. BLM, DOE, DOE National Laboratory Contacts ............................................... H1

v
List of Figures Page
Figure 1: Concentrating Solar Power Analysis Results ................................................... 13
Figure 2: Photovoltaics Analysis Results ........................................................................ 14
Figure 3: Wind Resource Analysis Results ..................................................................... 15
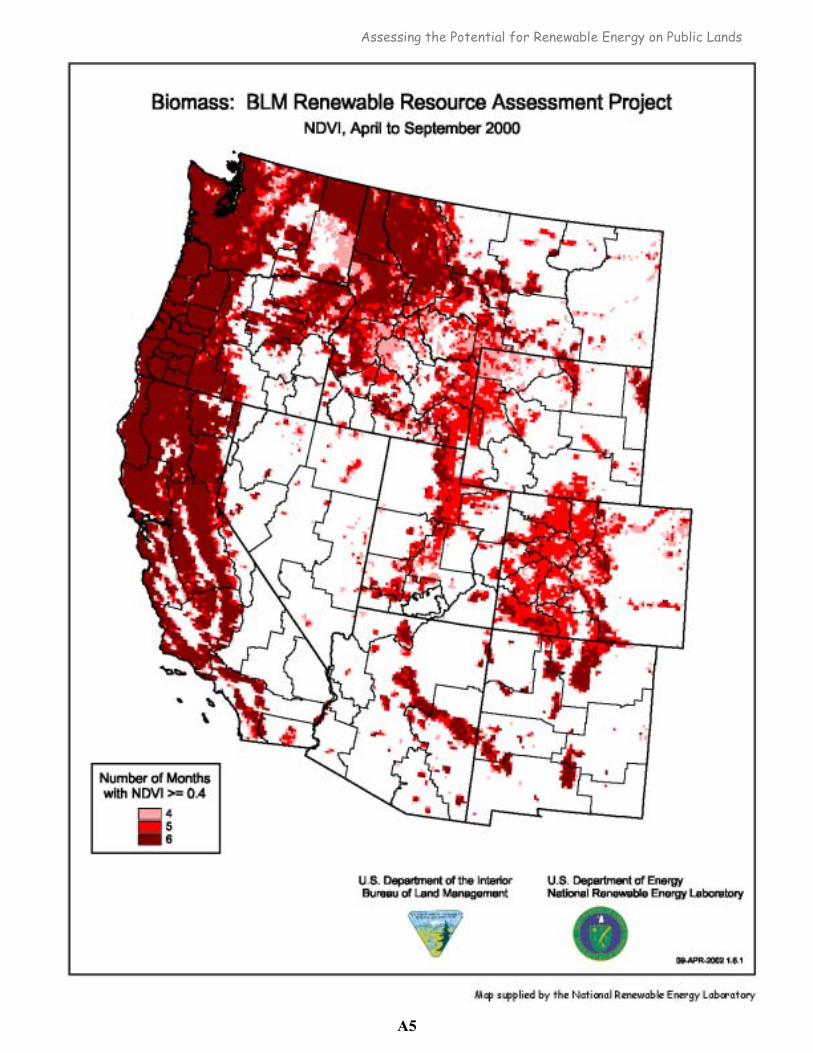
Figure 4: Biomass Analysis Results ................................................................................ 16
Figure 5: BLM Planning Units with “Top-Pick” Geothermal Sites ................................ 17
List of Tables
Table 1a. BLM Planning Units with the Largest Total Land Area of High-Potential Concentrating Solar Power Sites with Solar Resources of 6 kWh/m2/Day or Greater ............................................... 19
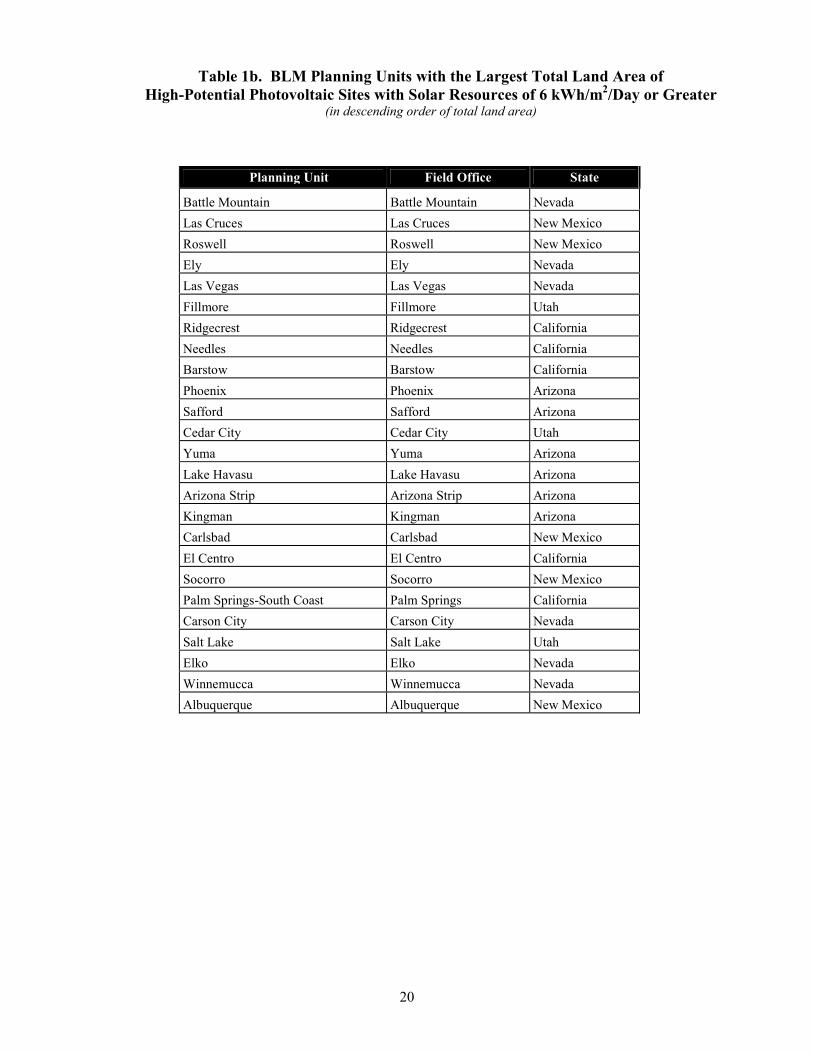
Table 1b. BLM Planning Units with the Largest Total Land Area of High-Potential Photovoltaic Sites with Solar Resources of 6 kWh/m2/Day or Greater .............................................................................. 20
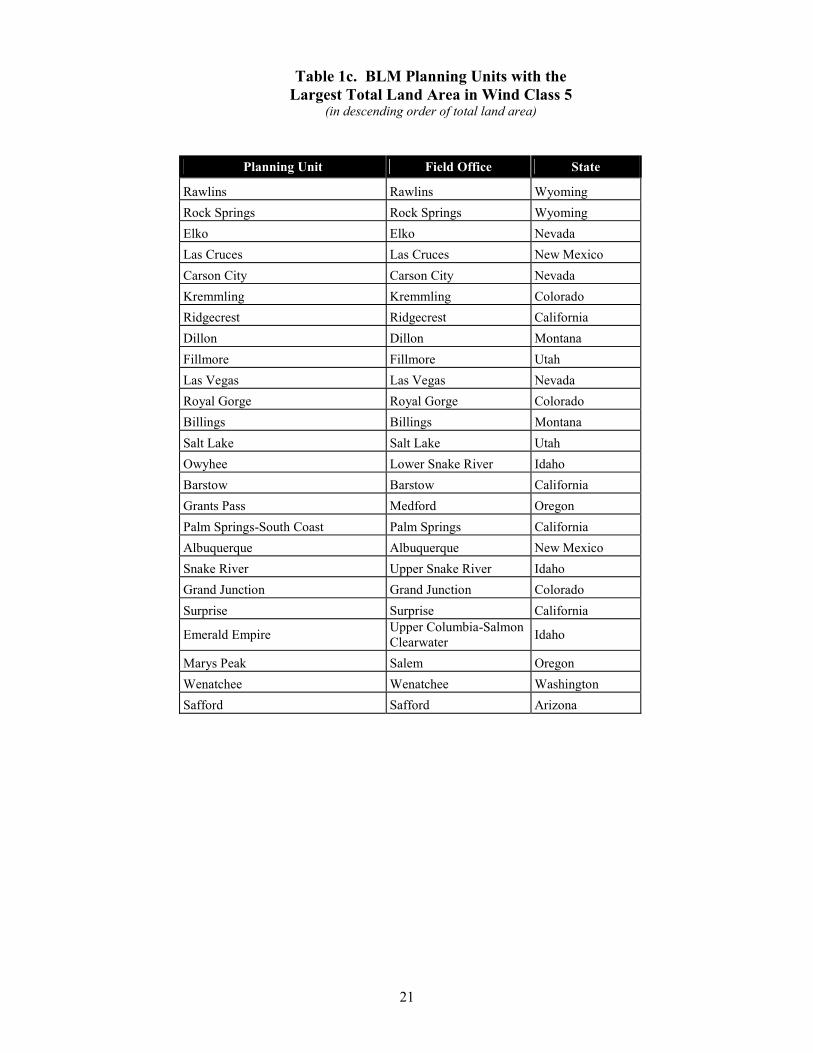
Table 1c. BLM Planning Units with the Largest Total Land Area in Wind Class 5 .................................................................................................. 21
Table 1d. BLM Planning Units with the Largest Total Land Area of Biomass Sites Having an NDVI Greater than 5 ............................................. 22
Table 1e. BLM Planning Units Identified as Having the Highest Potential for Geothermal Resources .............................................................................. 23
Table 2. Western U.S. BLM Planning Units with High Potential for the Development of Three or More Renewable Energy Sources ........................ 24
Table 3. Summary of Western State Renewable Energy Policies ............................... 25

1
Executive Summary This report represents an important initial activity of the Bureau of Land Management’s (BLM) proposed National Energy Policy Implementation Plan, which is to identify and evaluate renewable energy resources on public lands and any limitations on access to them. Ultimately, BLM will use this information in prioritizing land-use planning activities in order to increase industry’s development and use of the renewable energy resources on public lands. These renewable resources include solar, biomass, geothermal, water, and wind energy. To accomplish this task, BLM and the Department of Energy’s National Renewable Energy Laboratory (NREL) established a partnership to conduct an assessment of renewable energy resources on BLM lands in the western United States. The objective of this collaboration was to identify BLM planning units in the western states with the highest potential for private-sector development of renewable resources. The BLM/NREL team used Geographic Information System (GIS) data to analyze and assess the potential for concentrating solar power (CSP), photovoltaics (PV), wind, and biomass resources and technologies on public lands. BLM, NREL, and several industry representatives jointly developed screening criteria for each of these renewable resources to produce GIS-based maps and analyses. The team identified the top 25 BLM planning units whose areas have the highest potential for CSP, PV, wind, and biomass. The BLM/NREL team also identified high-potential geothermal energy sites through visits to BLM state offices. The assessment focused on BLM’s knowledge of, and experience with, the geothermal resources in seven western states. BLM experts identified 35 "top-pick" sites in 18 planning units in six states as having high potential for near-term development. The assessment resulted in the following findings:
• Sixty-three BLM planning units in eleven western states have high potential for power production from one or more renewable energy sources.
• Twenty BLM planning units in seven western states have high potential for power
production from three or more renewable energy sources. This assessment report provides BLM with information needed to evaluate the potential for renewable energy development on public lands.

2
Assessing the Potential for Renewable Energy on Public Lands
1. Objective The U.S. Bureau of Land Management’s (BLM) plan for using renewable energy on public lands must begin with an assessment of the renewable resource potential. This assessment has a two-part objective:
1. To assess the potential for geothermal, wind, solar, biomass, and low-impact
hydropower resources on BLM lands; and 2. To identify BLM planning units in the western United States with the highest
potential for development by industry of power production facilities based on renewable energy.
This report provides information to BLM so that efforts to increase industry’s access to public lands for renewable energy development can concentrate on areas with high potential. 2. Scope
This renewable resource assessment addressed BLM, Bureau of Indian Affairs (BIA), and U.S. Forest Services lands in the western United States, except Alaska. Alaska was not included because of the lack of transmission system data in Geographic Information System (GIS) format. The renewable energy sources and technologies addressed in the report include concentrating solar power (CSP), photovoltaics (PV), wind, biomass, and geothermal. Low-impact hydropower was not included because the National Renewable Energy Laboratory (NREL), which provided support for the assessment, did not have the resource data required to assess the energy resource potential of that technology. This report does include a CD-ROM with the report in PDF format, releasable GIS data used in the analysis, PowerPoint files of all GIS maps for each renewable resource analyzed, and Excel files for all tables cited in this report containing lists of planning units with the highest potential for renewable energy (Tables 1a-1e, 2, and E-1). 3. Background
This BLM assessment of the potential for renewable energy power production facilities on public lands responds to a directive in the National Energy Policy (NEP) report dated May 2001. The National Energy Policy Development (NEPD) Group recommended “that the President direct the Secretaries of the Interior and Energy to re-evaluate access limitations to Federal lands in order to increase renewable energy production such as biomass, wind and solar” (pp. 6-17). The NEPD Group also recommended “that the President direct the Secretary of Interior to determine ways to reduce delays in geothermal lease processing as part of the permitting review process” (pp. 6-17).

3
The need for this assessment of the potential for renewable energy power production was also identified as an outcome of the National Conference on Opportunities to Expand Renewable Energy on Public Lands, hosted by the U.S. Department of the Interior (DOI) and the U.S. Department of Energy (DOE) in November 2001 in Washington, D.C. The conference was chaired by the DOI Secretary, Honorable Gale Norton, and the DOE Assistant Secretary for Energy Efficiency and Renewable Energy (EERE), David Garman, representing Energy Secretary Spencer Abraham. Representatives from the U.S Department of Agriculture (USDA), the Environmental Protection Agency (EPA), the Department of Defense (DOD), the Council on Environmental Quality, and the Federal Energy Regulatory Commission also attended. Attendees heard testimony from industry on issues related to the development of power from geothermal, wind, solar, biomass, and hydropower resources on public lands. As a result of the conference and the NEP directive, a BLM NEP Implementation Plan activity was proposed that is based on the action described here and four supporting tasks. The tasks are described in more detail in the rest of this report. Action The BLM will consider potential for renewable energy development on public lands, as appropriate, in land use decisions and use authorizations.
Method Using data readily available from DOE and other sources, as well as appropriate screens related to such matters as transmission facilities and markets, the BLM will determine the best order in which to prepare and amend land-use plans in order to meet the Interior Secretary’s commitment to developing energy from renewable resources on public lands. Four tasks will be accomplished to assess the potential for renewable power production and help guide the formulation of a BLM NEP Implementation Plan for renewable energy development on public lands.
Tasks
1. Gather available information on renewable energy potential including low-impact hydro (low-impact hydro was not addressed as data were not readily available), solar, wind, biomass and geothermal.
2. Develop appropriate screens.
3. Process data identifying broad geographic areas as having high potential for renewable
energy development.
4. Provide a report on high-potential areas for inclusion in a Renewable Energy Action Plan.

4
As a result of collaborations begun at the November 2001 conference, BLM requested technical assistance and support from DOE through NREL in Golden, Colorado. BLM Headquarters and its National Science and Technology Center (NSTC) in Denver, Colorado, formed a partnership with NREL to obtain the government’s expertise in the use of renewable energy. NREL agreed to provide information and guidance on renewable energy technology development, renewable energy resource potential assessment, GIS mapping of analysis and results, and renewable energy system analysis. Based on this experience, BLM's NSTC, the DOE Golden Field Office, and NREL have developed a Memorandum of Understanding to provide a mechanism for continued cooperation in the assessment and analysis of renewable energy resources. During the development of this report, staff from DOE Headquarters, NREL, and Oak Ridge National Laboratory met with BLM and renewable energy industry representatives. They provided support for BLM’s plan, which focused on the goal of increasing access to public lands for renewable power production projects. Discussions were held on hydropower, solar, wind, biomass, and geothermal energy resources. Preliminary GIS maps supplied by the BLM/NREL team indicated areas with high potential for wind and solar power, including concentrating solar power (CSP). Most renewable energy uses of the public lands can currently be accommodated by existing BLM land-use plans, and applicants from industry may apply for an authorization under the appropriate authority at any time. These existing land-use plans will identify wilderness areas, Areas of Critical Environmental Concern (ACEC), and other special designated management areas where land-use restrictions may apply to a variety of uses, including renewable energy projects. However, if a land-use plan is prepared to specifically address and provide for renewable energy development within certain areas of a land-use planning area, it may facilitate the accelerated processing of future renewable energy applications. The land-use plan will address environmental issues associated with those proposed uses, which can then be used to tier further environmental review of specific renewable energy project proposals. Identifying land-use plans that could be prioritized to specifically address renewable energy development provides an opportunity to potentially reduce the amount of additional environmental review required. The documentation needed to process applications and make management decisions on renewable energy projects could also be reduced. Therefore, one purpose of this report is to assist BLM in identifying land-use planning areas with the highest potential for the development of renewable energy resources. 4. The Approach for Assessing Renewable Energy Potential
TASK 1—Gather available information on renewable energy potential (including low-impact hydro, solar, wind, biomass and geothermal).
BLM’s NSTC staff provided GIS-based land ownership data to NREL. NREL Resource Assessment staff then produced GIS maps illustrating renewable energy resources, with an overlay of BLM land ownership, field offices, and planning units. Maps for CSP, PV, wind, and biomass are provided in Appendix A. Renewable resource and BLM land ownership GIS data descriptions are provided in Appendix B. Resource assessment for high-potential geothermal sites did not include GIS resource and BLM land ownership maps or screening criteria development meetings. Rather, high-potential geothermal sites were identified through site visits and telephone calls with BLM state offices and GIS data sources. (See also Task 2.)

5
NREL resource data for solar, CSP, PV, and wind energy were deemed suitable for a regional-scale analysis. However, the current national biomass resource information appeared to be incomplete, and a comprehensive geothermal resource database did not exist. The resource data used are suitable for a regional analysis, but more detailed data are necessary for site-specific applications. Descriptions of the resource data sets used in the analysis are as follows. Solar NREL has developed a national solar resource assessment for the United States at a resolution of approximately 40 km by 40 km. These data are updated periodically. The most recent update occurred in the summer of 2001 and represents 14 solar collector configurations. The data were developed using NREL’s Climatological Solar Radiation Model. Appendix B describes the solar data in further detail.
CSP The CSP analysis used direct normal data. These data are pertinent to concentrating systems that track the sun throughout the day, such as trough collectors or dishes. PV Data for flat-plate collectors were used. This is typical for a photovoltaic panel oriented due south at an angle from horizontal equal to the latitude of the collector’s location. Wind A low-resolution (~25 km2) U.S. wind resource assessment was produced in 1987. Since then, NREL and other organizations have produced updated higher resolution (0.16 to 1 km2) wind resource assessments that better reflect the effects of terrain on the potential wind resource. The low-resolution wind data captured continental wind patterns. But the coarse scale meant that the assigned wind resource could apply to as little as 5% of the area if, for example, good resources were on ridge crests. Higher resolution digital terrain data allow the updated wind resource assessments to more accurately depict ridge lines and the effects of blocking on potential wind resources. These data also produce a more accurate overall picture of the resource. However, the updated assessments are model-derived data and not a substitute for on-site measurements before actual site development, even with the large increase in resolution.
NREL has completed and validated updated assessments for Washington, Oregon, Idaho, and Montana in the western United States. Updated assessments by other organizations were completed for Colorado and New Mexico, but NREL has not yet validated them. Currently, NREL plans to complete additional updated assessments for Wyoming in April 2002, and late in 2002 for the remaining western states listed in this report. Information on updated wind resource assessments is available at http://www.eren.doe.gov/windpoweringamerica. For this analysis, the updated NREL assessments were used when completed, and the 1987 assessment was used for the rest of the states. Wherever the Colorado and New Mexico assessments showed higher resource estimates than those shown by the 1987 assessment, those areas were added to the analysis. See Appendix B for more information on data sources.

6
Biomass Current biomass resource data at NREL contain partial information on municipal solid waste, specific crop residues in eastern states, and timber residues. During the biomass technology meeting, a different approach to rating a resource area was discussed. In that approach, sites are assessed for long-term sustainability to support biomass plants. Given the limited time available to complete this analysis, the monthly Normalized Difference Vegetation Index (NDVI) computed from National Aeronautics and Space Administration’s (NASA’s) Advanced Very High Resolution Radiometer Land Pathfinder satellite program was chosen as a basis for the initial biomass resource assessment. The NDVI satellite data have a resolution of 8 km by 8 km. Appendix B further describes sources of biomass GIS data. Geothermal Southern Methodist University (SMU) produced a national geothermal resource assessment in February 2002. The assessment shows general areas suitable for possible geothermal development assessment; specific areas need to be identified by local-area studies. GIS data also exist on known geothermal resource areas (KGRAs) and on geothermal leases. For a description of the data and method used to identify high-potential geothermal sites, see Task 2 below.
BLM-Specific and Other Data BLM’s NSTC staff provided detailed land ownership data to NREL. BLM staff also supplied information on areas that should be excluded from development (wilderness areas, wilderness study areas1, national monuments, and national conservation areas) on BLM lands and planning unit boundaries. Areas of Critical Environmental Concern (ACEC) were not included in the BLM GIS land ownership data. However, ACEC are BLM lands excluded from development and will be addressed at Field Office level as required in processing renewable power development applications. Other data used in the analysis included topographical data and data on transmission lines, major roads, and populated areas. For more information on data sources, see Appendix B. TASK 2—Develop appropriate screens. BLM and NREL staff held meetings on CSP, PV, wind, and biomass to develop screening criteria for GIS analysis and characterization of the potential for renewable power production. The objective of each screening criteria development meeting was to identify any criteria that impact the economic and technical feasibility of renewable power production. The list of criteria was then evaluated for its ability to be used in GIS mapping, and GIS data availability and sources were discussed. Finally, the top three to six most significant criteria in targeting high-potential renewable power opportunities were selected for Task 3 (for CSP, PV, wind, and biomass). High-potential geothermal sites were identified by field visits to selected BLM state offices. Knowledgeable personnel in BLM state offices were consulted during field visits to Nevada, Oregon, Idaho, California, Utah, and Washington. The high-potential geothermal sites were identified without
1 Wilderness Study Areas are not closed to development, subject to valid existing rights.

7
developing screening criteria. (See Geothermal High-Potential Site Identification: Direct Data Collection with BLM State Offices on p. 10.)
Solar-CSP Screening Criteria Development Meeting On February 14, 2002, the BLM/NREL team met with NREL and industry CSP technology representatives to develop a list of high-potential site screening criteria. The following were identified as the most important screening criteria (in order of importance).
Central Generation Technology Criteria 1. Solar resource is 5 kWh/m2/day of direct normal (at least). 2. Slope of land area at the site must be less than 5%, and ideally less than 1%. 3. Transmission access is within 50 miles (69-345 kV), and transmission capacity is
available. 4. Forty acres is the minimum parcel size. 5. Site must have access to roads or rail within 50 miles. Distributed Generation Technology Criteria 1. Solar resource is 5 kWh/m2/day of direct normal. 2. Slope of land area at the site must be less than 10%. 3. Site must have access to roads.
The following items were also identified by the meeting participants. But they were not identified as the most important screening criteria.
Central Generation Technology Criteria
• The site must have a low average wind speed (average wind speed < 10 miles/hour). • Water resources must be available. • The site should be within 25 miles of a main natural gas pipeline for some
configurations. • All vegetation at the site must be removed. • Federal, state, and local policies are supportive. • The site must allow structures 15-50 feet high. Some technologies could require
structures hundreds of feet high. • Livestock protection is possible. • Light reflection at sites near major roads could be an issue for some technologies • A population center should be within 100 miles.
Distributed Generation Criteria
• The site is within 100 miles of a population center. • Transmission access, water availability, and minimum parcel size are not an issue.

8
Solar–PV Screening Criteria Development Meeting
On February 20, 2002, the BLM/NREL team met with NREL PV technology representatives to develop a well-defined list of screening criteria. The following items were identified as the most important screening criteria (in order of importance).
Large-Scale Technologies
1. Solar resource availability is known, and favorable to large-scale PV. 2. Full cost of competing power (production, transmission and distribution [T&D],
environmental costs, etc.) is known and favorable to PV. 3. Transmission line is accessible, plus available capacity. 4. Electric power regulatory regime (want retail access) is favorable to PV. 5. Federal, state, and local policies are supportive. Small-Scale Technologies 1. Full cost of competing power (production, T&D, environmental costs, etc.) is known
and favorable to PV. 2. Current fuel use at the site (especially unpowered and diesel-powered sites) is known
and favors PV. 3. Water access is available (important for water-pumping applications). 4. Grazing sites are good small-scale applications. 5. Existing and planned recreation areas are good for remote applications.
The following items were also identified by the meeting participants, but they were not identified as the most important screening criteria.
• Cost of environmental impacts of existing infrastructure is favorable to PV. • Cost of maintaining existing energy infrastructure is favorable. • High or unique environmental standards exist in the region. • Cost of a site-specific environmental assessment is favorable. • Security must be considered. • Road access is needed for construction equipment. • Extending transmission is needed in some cases for large-scale PV systems. • Projected growth in the region is known, if supplying additional energy. • Local utilities and peak unit power production costs should be considered.

9
Wind Screening Criteria Development Meeting
On January 29, 2002, the BLM/NREL team met with NREL wind technology representatives and selected members of the wind energy community at the National Wind Technology Center (NWTC) to develop a well-defined list of screening criteria. The following items were identified as the most important screening criteria (in order of importance):
1. Wind resource is wind power Class 4 and above for short term, Class 3 and above for
long term. 2. Federal, state, and local policies support wind energy. 3. Transmission access is within 25 miles (69-345 kV) and transmission capacity is
available. 4. Site must be compatible with wind energy development; scenic areas, view-sheds, and
non-development regions must be eliminated. 5. Site must have access to roads within 50 miles.
The following items were also identified by the meeting participants, but were not identified as the most important screening criteria.
• Ease of permitting and siting should be considered. • Regional market conditions are important (electricity rates, load growth, reserve margins,
etc.). • Site is five miles from the nearest population center. • Elevation of 3,000-4,500 ft is optimal (generally, the site must be below 7,000 ft). • Slope of land area is a 14% grade (maximum) or less. • Minimum parcel size is 20 megawatts (MW) per section (1 square mile) on rolling
terrain. • Large contiguous parcels are best; 10 square miles is optimal and at least 1 square mile is
necessary.
Biomass Screening Criteria Development Meeting
On March 4, 2002, the BLM/NREL team met with NREL biomass technology representatives to develop a well-defined list of screening criteria. The following items were identified as the most important screening criteria (in order of importance).
1. Sustainable biomass resource is available; biomass power plant must be within 50 miles of the fuel source.
2. Site must be within 50 miles of a population center with a skilled labor force. 3. Proximity of communities in “at risk” regions identified by the National Fire Plan is
known and favors biomass power.

10
The following items were also identified by the meeting participants, but were not identified as the most important screening criteria.
• A water supply is needed. • Land slope is 7%-12% or less. • The visual impact is an issue. • Landscape changes caused by harvesting must be considered. • Invasive species control is a consideration. • Livestock protection is possible at the site. • Forest thinning and municipal solid waste applications are good potential sites. • Full cost of competing power (production, T&D, environmental costs, etc.) is known and
favorable to biomass.
Geothermal High-Potential Site Identification: Direct Data Collection with BLM State Offices The BLM has had statutory authority for leasing geothermal mineral rights under the Geothermal Steam Act of 1970 (P.L. 91-581; 30 U.S.C. §§ 1001-1027, December 24, 1970, as amended 1977, 1988, and 1993). Therefore, the BLM has extensive experience with geothermal resources and environmental impact assessments. In addition, the BLM’s sister agency within the DOI, the U.S. Geological Survey (USGS), completed a nationwide assessment of geothermal resources in the United States some years ago. The data were collected in 1978 and published in 1979 as Circular 790 (Muffler 1979). Although resources are available, geothermal activity has decreased markedly over the past 17 years. In 1985, more than 2 million acres were leased for geothermal activity in the United States, and 1.2 million acres were leased in Nevada alone. (Nationally, there were 29 power plants on line and more than 680 leases.) At that time, it took only two to three months to issue a permit. BLM had a $3.2 million budget, and 464 work months were dedicated to the geothermal program. During the 1990s, when energy economics declined, industry’s efforts in geothermal decreased. This lack of activity led to a decrease in geothermal program emphasis within BLM and USGS. As of May 23, 2002, there were 329 leases and 299 pending lease applications. At least 83 of the geothermal lease applications are more than 25 years old. As a result of this decline in program emphasis, no current resource data provide detailed information on geothermal resources in the United States. The best data currently available are Professor David Blackwell’s compilation at Southern Methodist University (SMU) (www.smu.edu/geothermal/georesou/georesourcesmap.htm), based on the 1978 USGS data and other information collected since then. The map is a qualitative composite of heat flow, thermal gradient, sediment thickness, and hot springs. Based on these variables, this map demonstrates broad areas of geothermal resources and rates these resources as “excellent” or “good.” The SMU data show general areas suitable for possible geothermal development; specific areas need to be identified by local-area studies. The SMU data were deemed inadequate for purposes of identifying the BLM planning units with the highest near-term geothermal potential because they are too geographically broad. For example, the SMU data classify virtually the entire state of Nevada as having excellent geothermal resource potential, allowing no differentiation among areas within the state.

11
With BLM’s guidance, NREL contacted—and in five cases, personally visited—BLM staff responsible for geothermal programs in seven BLM western states: California, Idaho, Nevada, New Mexico, Oregon, Utah and Washington. These states are known for their comparatively high level of geothermal resources and activity. Visits were completed in California, Nevada, New Mexico, and Oregon/Washington between February 15, 2002, and April 5, 2002. NREL asked the lead geothermal staff from each BLM state office to identify the best geothermal sites for near-term geothermal development within each of their states, based on their expert opinion. BLM geothermal staff have the best experience in determining sites because they are responsible for identifying and classifying the known geothermal resource areas (or KGRAs) 2 and for managing the geothermal leasing program within their states. The staff also provided, in digital form when possible, the most recent data on the classification of KGRAs and on BLM leasing activity within the seven states. The sites the BLM staff identified were termed the top-pick sites for each state, and resulted in 9 top picks for California, 10 for Nevada, 3 for New Mexico, 7 for Oregon, 3 for Utah, and 3 for Washington. Most, but not all, of the top-pick sites were KGRAs. These locations were then compared with the BLM lease data in GIS format, the KGRA data in GIS format, and the SMU GIS data to check their validity. The top-pick locations correlated well with all of the technical GIS data sets. On March 17, 2002, staff from NREL and the Idaho National Engineering and Environmental Laboratory met at NREL to review the method and results of the analysis. They found that the analysis met technical criteria and that it was straightforward and sensible given the limited time available. They also found that the top-pick sites identified by BLM state office staff were likely to fall within no more than 20 BLM planning units within the western United States. Therefore, it was not necessary to apply other screening criteria to reduce the number of BLM planning units with geothermal sites identified as having the best potential for near-term development. TASK 3—Process data identifying broad geographical areas as high-, medium-, and low- or no potential for renewable energy development.
This task ultimately focused on processing GIS data to identify high-potential areas for renewable energy development. A Geographical Information System, or GIS, is a computer-based system used to manipulate, manage, and analyze multidisciplinary geographic and related attribute data. All the information in a GIS is linked to a spatial reference system used to store and access the data. GIS data layers can be recombined, manipulated, and analyzed with other layers of information to identify relationships between features, within a common layer or across layers.
This analysis was conducted on a regional scale, and the results are suitable for use at the planning-unit level. On-site measurement and analysis are recommended before the development of any facilities, but this analysis should be useful in refining the prospecting process of site identification.
2 “KGRA” means an area in which the geology, nearby discoveries, competitive interests, or other indicia would, in the opinion of the Secretary of Interior through BLM, engender a belief that prospects for extraction of geothermal steam or associated geothermal resources are good enough to warrant expenditures of money for that purpose.

12
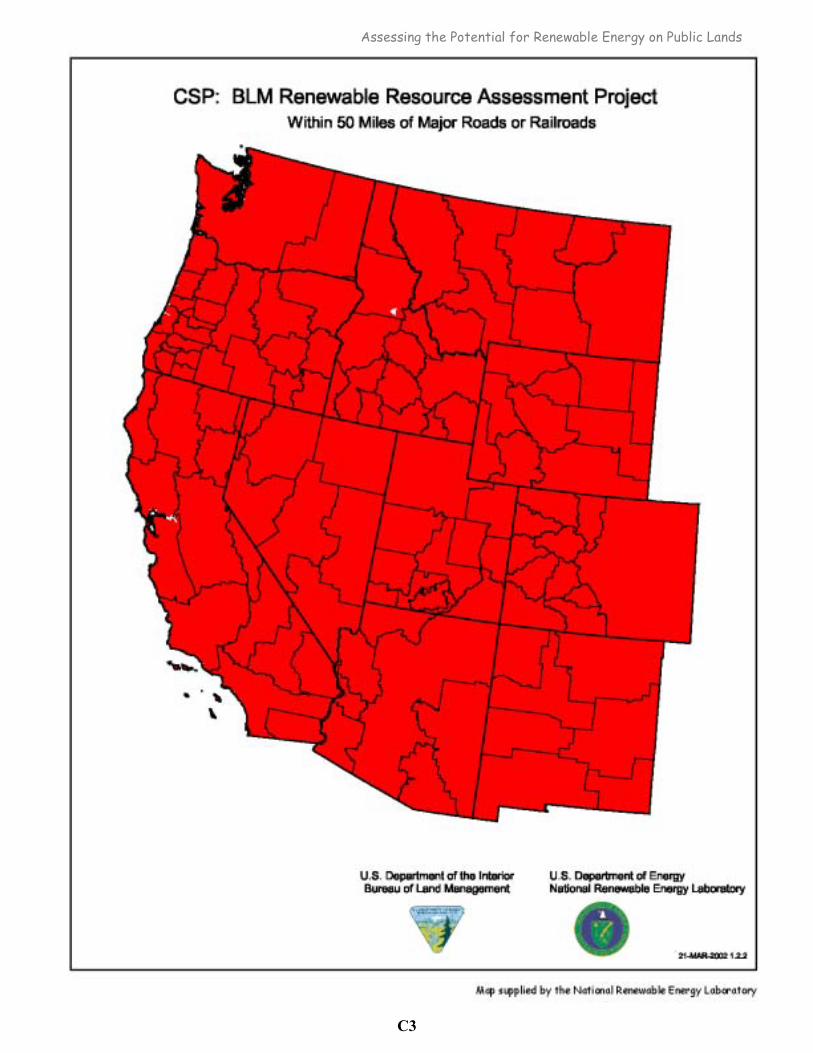
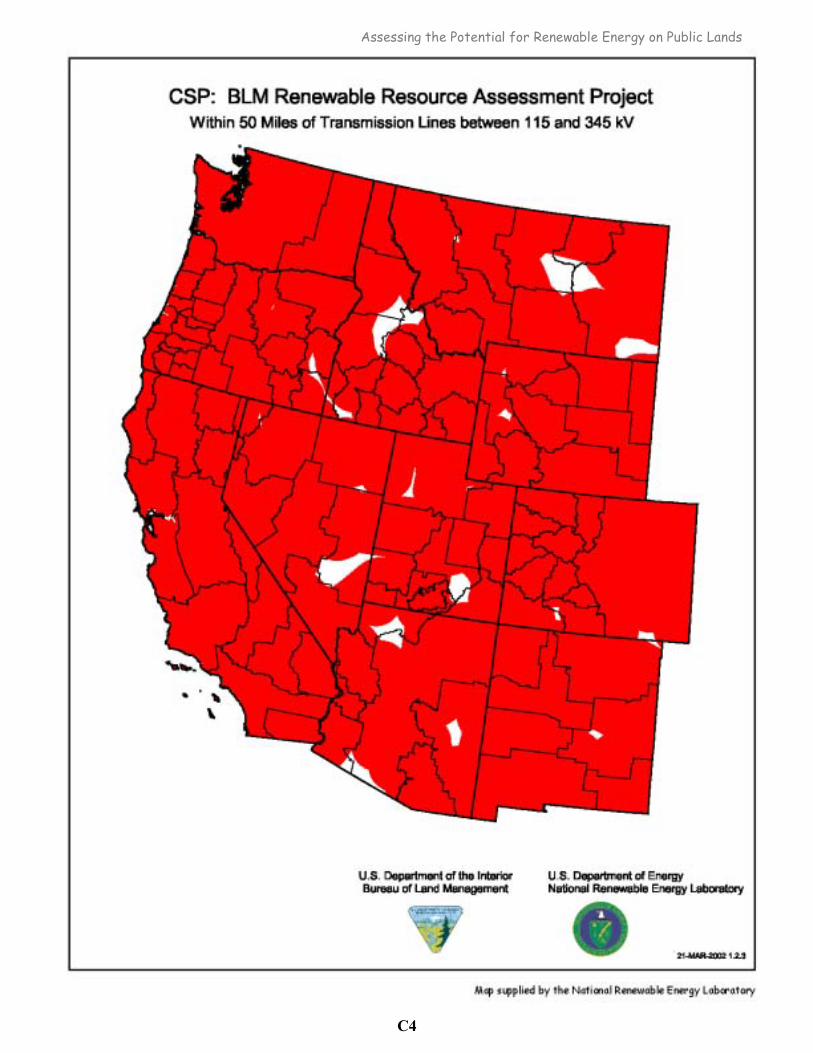
Initial meetings held to develop technology screening criteria identified several categories of GIS data to be used in the screening process. Unfortunately, the GIS data needed to implement several of the screening criteria were not available or could not be fully implemented in the limited amount of time available for this analysis. In particular, one constraint was mentioned in each technology meeting: transmission line congestion and availability. Detailed data are available, but they are not in a spatially referenced format. Several other data sets were not available at the regional scale with the level of informational detail that participants wanted, but they were deemed adequate given the regional nature of the analysis. The roads data set used in the analysis depicts only major paved roads, although all groups agreed that an upgradeable dirt road would be acceptable. Generally, distance to roads was not a severely limiting factor for development (see the maps in Appendix C), given the acceptable distance for each technology (50 miles). The transmission line data set covers the contiguous United States and is generally complete down to 100 kV. NREL staff thought that lines with lower voltages would be suitable for development, but a consistent nationwide database for lower voltage lines could not be located.
The screening criteria applied to each technology (except geothermal) are described below.

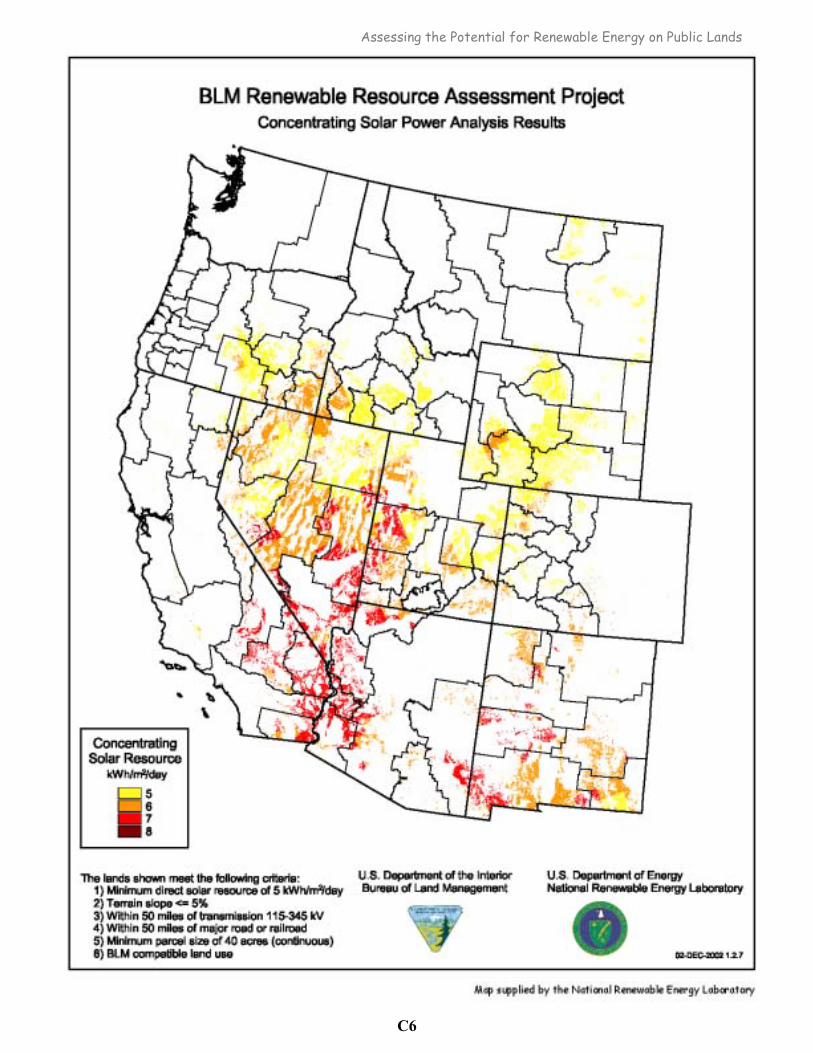
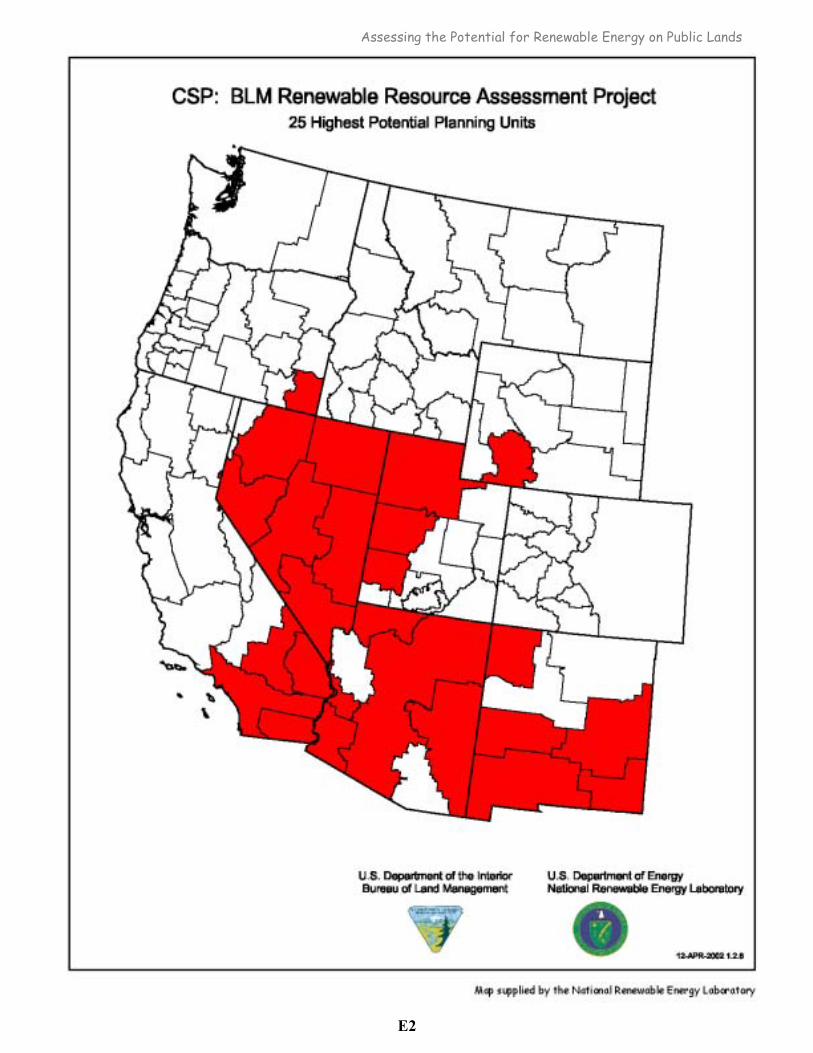
13
CSP 1. Direct solar resource is 5 kWh/m2/day or greater. 2. Terrain slope is ≤ 5%. 3. Site is within 50 miles of transmission lines at 115-345 kV. 4. Site is within 50 miles of a major road or railroad. 5. The minimum parcel size of 40 continuous acres is available. 6. Land use is BLM-compatible.
Figure 1: Concentrating Solar Power Analysis Results

14
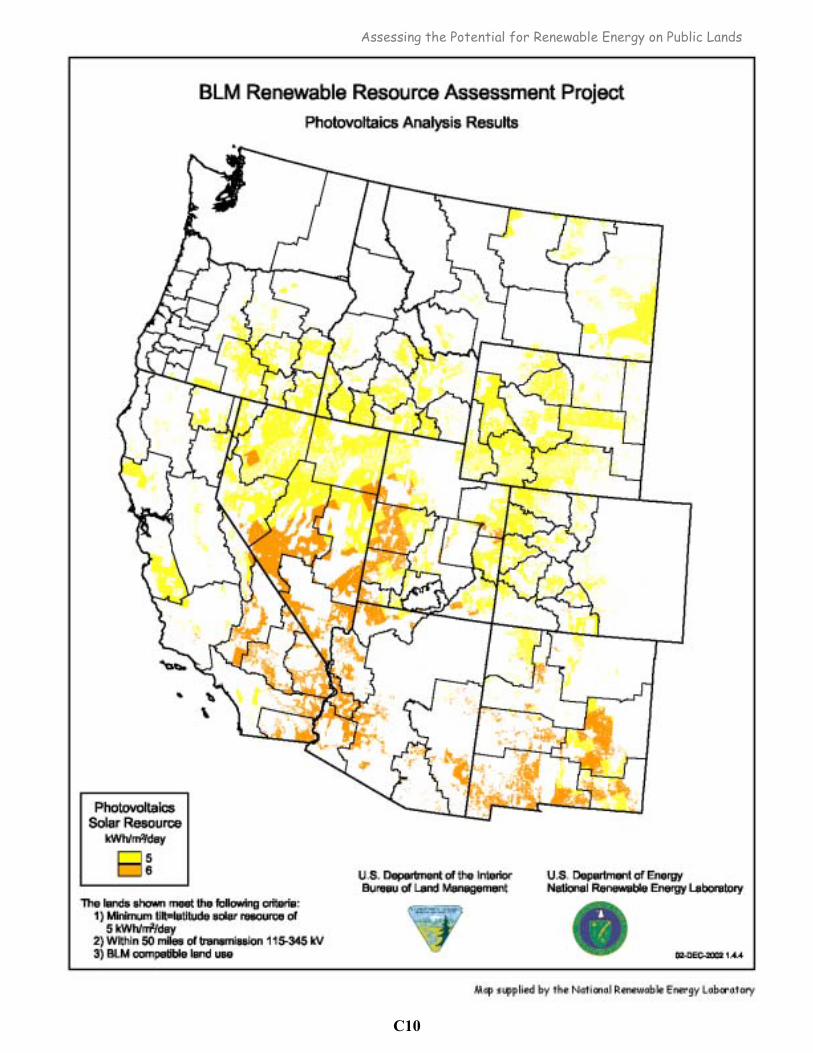
PV 1. Direct solar resource is 5 kWh/m2/day or greater. 2. Site is within 50 miles of transmission lines at 115-345 kV. 3. Land use is BLM-compatible.
Figure 2: Photovoltaics Analysis Results

15
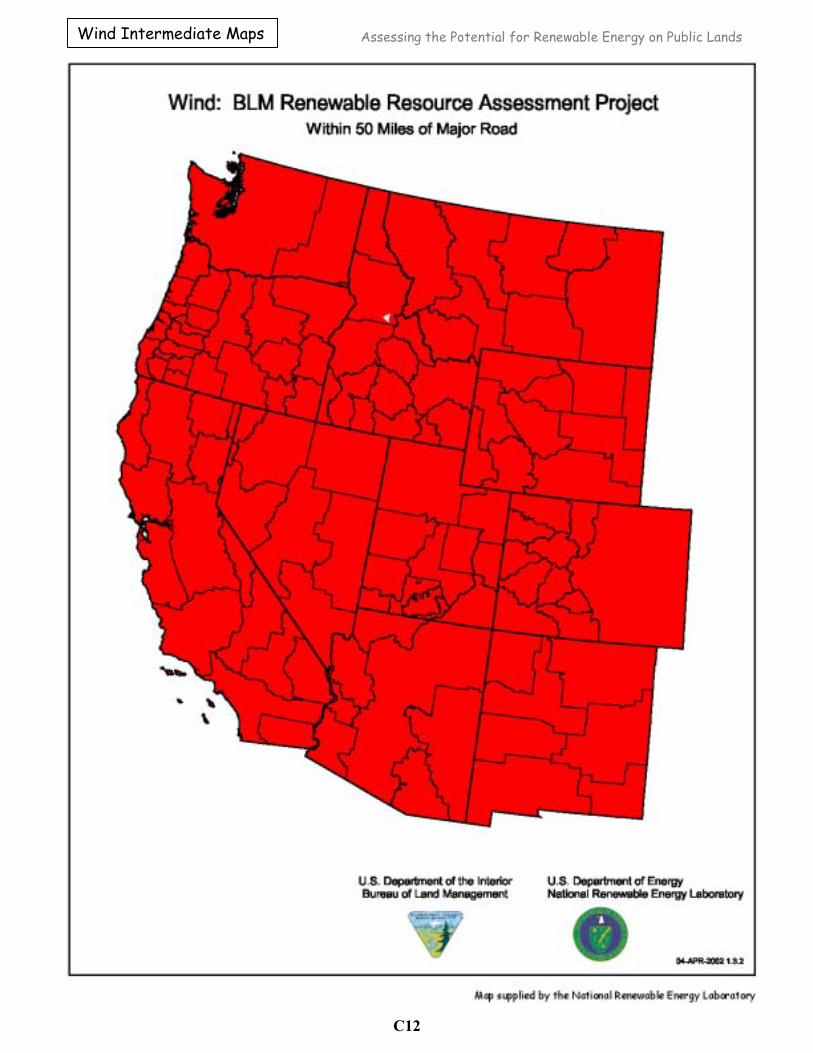
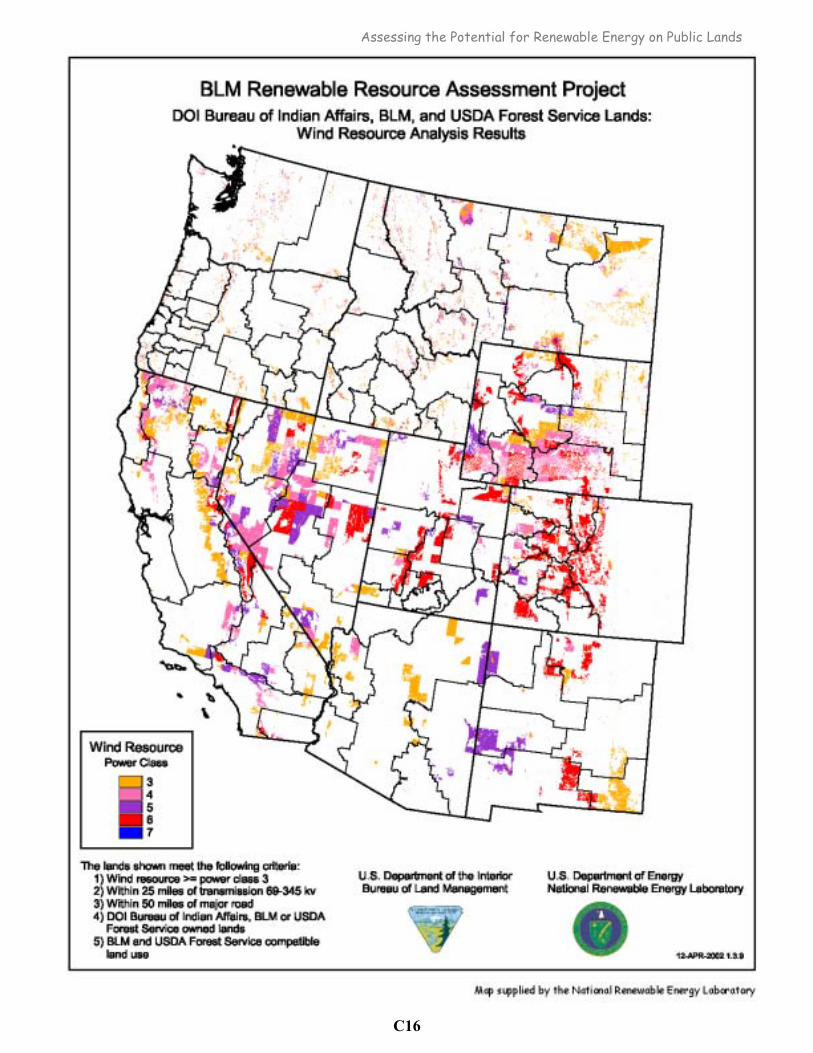
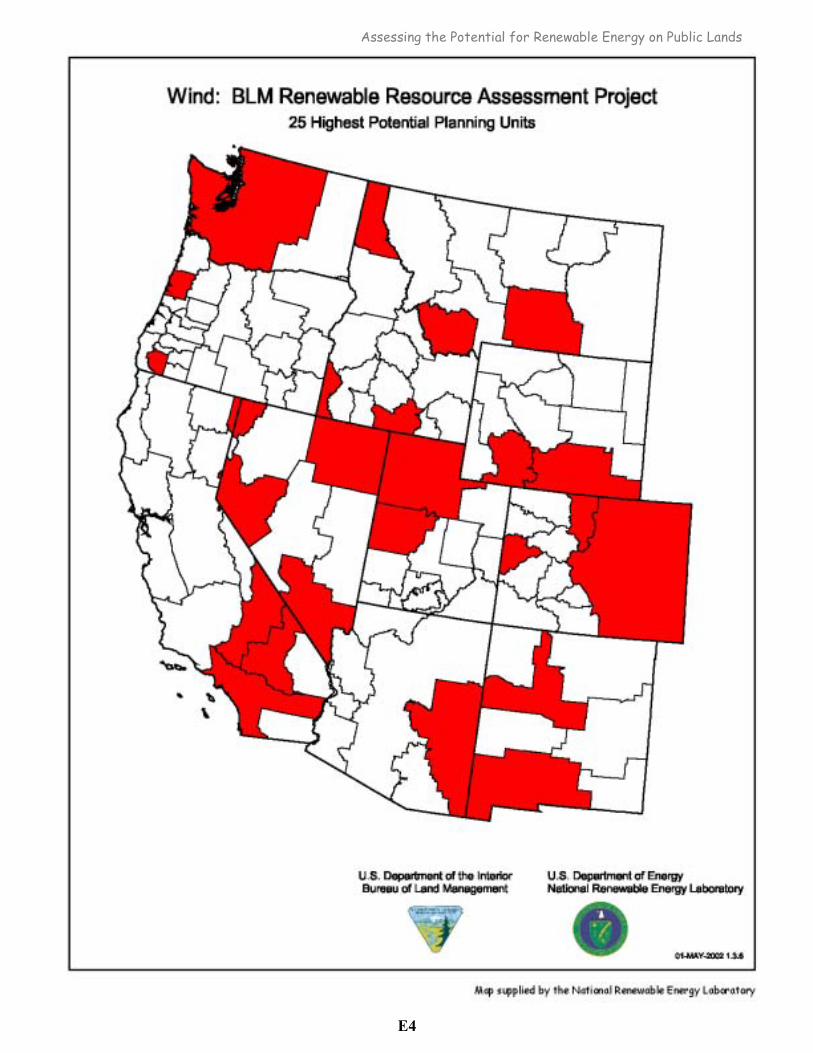
Wind 1. Wind resource is limited to areas in Wind Class 3 or greater. 2. Site is within 25 miles of transmission lines at 69-345 kV. 3. Site is within 50 miles of a major road or railroad. 4. Land use is BLM-compatible.
Figure 3: Wind Resource Analysis Results

16
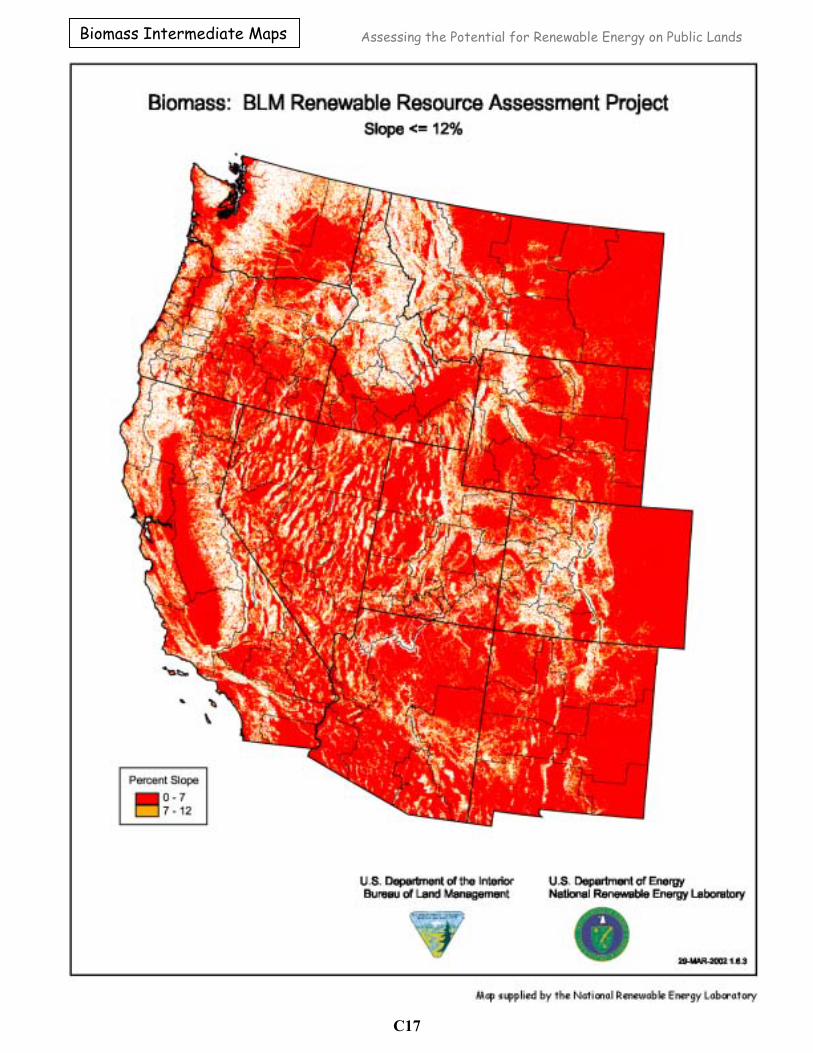
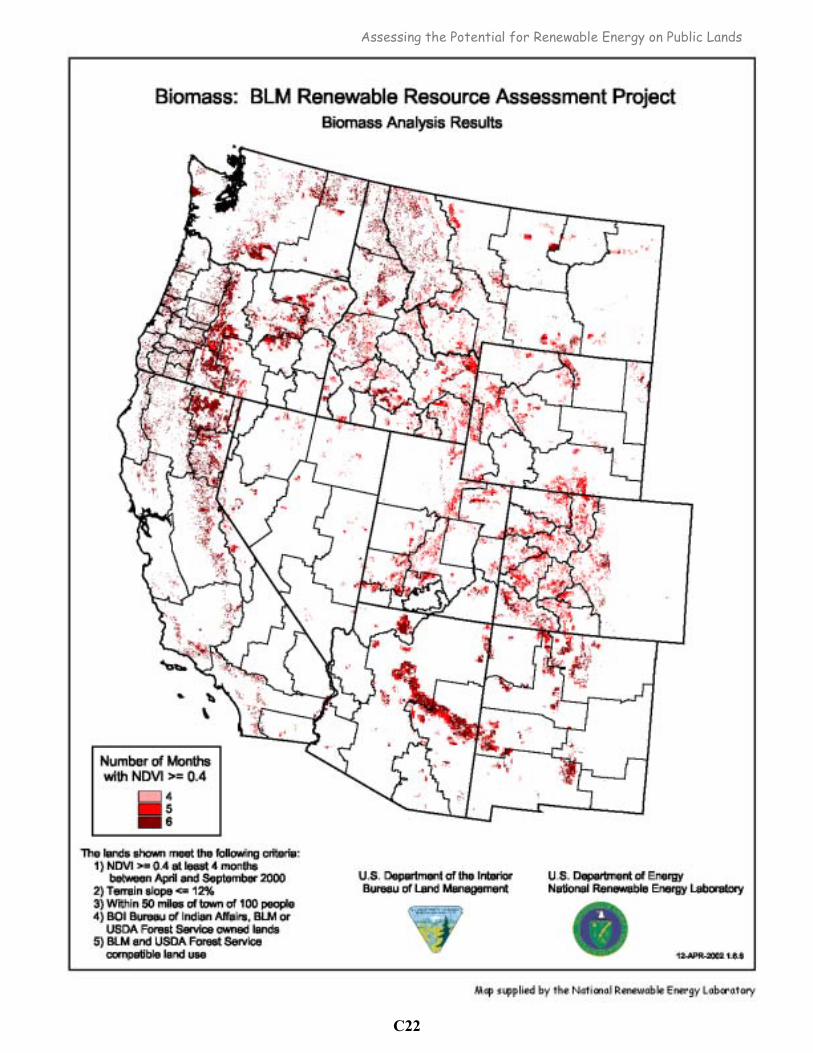
Biomass 1. NDVI is 0.4 or greater for at least 4 months between April and September 2000. 2. The terrain slope is ≤ 12%. 3. Site is within 50 miles of a town with at least 100 people. 4. Land use is BLM-compatible.
Figure 4: Biomass Analysis Results
17
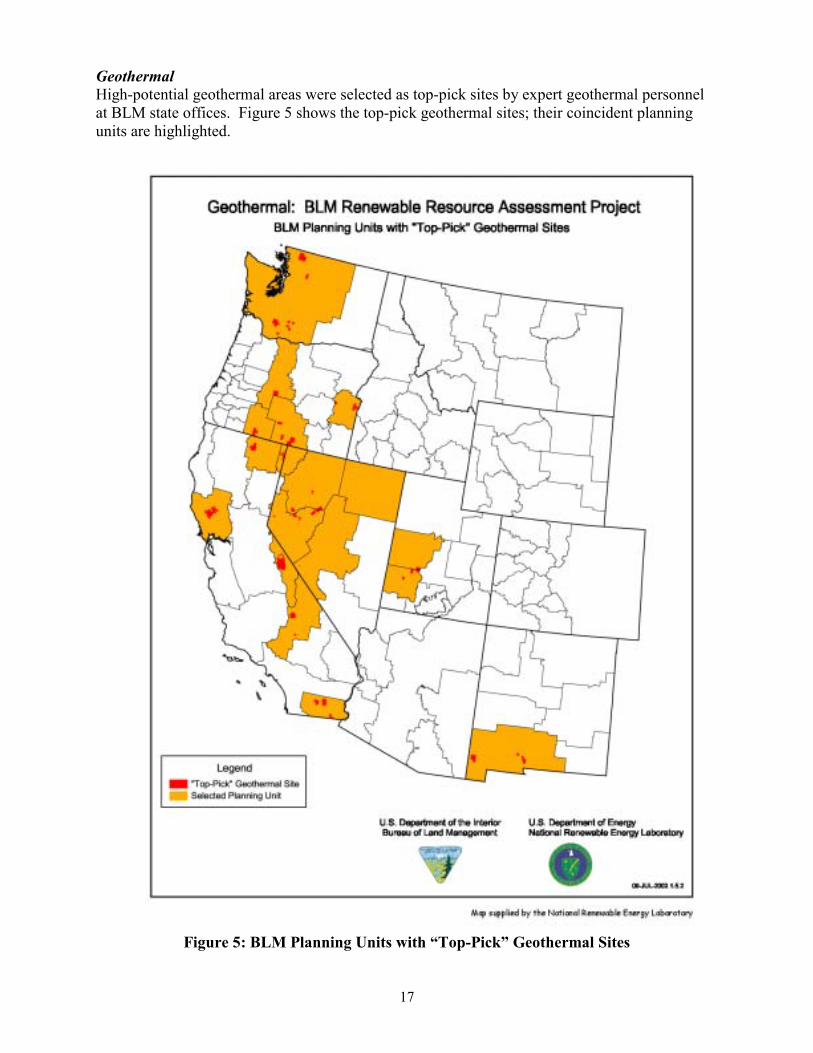
Geothermal High-potential geothermal areas were selected as top-pick sites by expert geothermal personnel at BLM state offices. Figure 5 shows the top-pick geothermal sites; their coincident planning units are highlighted.
Figure 5: BLM Planning Units with “Top-Pick” Geothermal Sites

18
Each screening criterion was developed into a separate data layer indicating whether the criterion was met. The layers were combined into a final data set that included only lands that met all the criteria for each technology. Maps of individual criteria are in Appendix C. The criteria listed above were used to identify areas with long-term development potential. A more restrictive definition of resource availability was used in identifying the planning units with the highest near-term development potential. These planning units should not be considered the only areas with significant development potential, however. Task 4—Report on high-potential areas for inclusion in a Renewable Energy Action Plan. This report is the product of this task. To develop recommendations for this report, BLM and NREL performed a comparative analysis. They used the renewable energy GIS maps and geothermal field-based site identifications resulting from Task 3 to conduct the analysis. 5. The Comparative Analysis The GIS maps constructed for Task 3 were used as a starting point to identify the BLM offices with sites having the highest potential for renewable energy development. On March 27 and 28, 2002, NREL technology experts developed the following final technology-specific decision rules. Each rule was used as a last screening criterion to eliminate marginal and less desirable renewable energy sites from the final maps developed under Task 3.
CSP: Include all sites with a solar resource of 6 kWh/m2/day or greater and terrain slope less than or equal to 1%. PV: Include all sites with a solar resource of 6 kWh/m2/day or greater. Wind: Include all sites that are in Wind Class 5 or greater and are within the proximity of either a major load center (city) or a major transmission line connecting with a major load center. Biomass: Include all sites with an NDVI of 4 or greater, communities at risk from fire, and proximity to Forest Service lands (less than 100 miles) Geothermal: No final decision rule is required; the highest-potential sites were identified using an alternative process. After the final decision rules were applied to technology-specific maps, the land area of the remaining renewable energy sites was summed on a planning unit basis. This summed list was then rank-ordered on a technology-by-technology basis. The top 25 offices in the rank-ordered list were identified by the BLM/NREL team as planning units having the highest potential. Planning units and field offices for each technology are presented in descending order of total land area for CSP, PV, wind, and biomass in Tables 1a-1d. Table 1e lists the top-pick sites by state, along with the BLM planning units and field offices where they are located.

19
Table 1a. BLM Planning Units with the Largest Total Land Area of High-Potential Concentrating Solar Power Sites with Solar Resources of 6 kWh/m2/Day or Greater
(in descending order of total land area)
Planning Unit Field Office State
Battle Mountain Battle Mountain Nevada Las Cruces Las Cruces New Mexico Ely Ely Nevada Winnemucca Winnemucca Nevada Salt Lake Salt Lake Utah Elko Elko Nevada Carlsbad Carlsbad New Mexico Roswell Roswell New Mexico Fillmore Fillmore Utah El Centro El Centro California Yuma Yuma Arizona Phoenix Phoenix Arizona Needles Needles California Las Vegas Las Vegas Nevada Jordan Vale Oregon Safford Safford Arizona Socorro Socorro New Mexico Arizona Strip Arizona Strip Arizona Farmington Farmington New Mexico Barstow Barstow California Rock Springs Rock Springs Wyoming Palm Springs-South Coast Palm Springs California Cedar City Cedar City Utah Lake Havasu Lake Havasu Arizona Carson City Carson City Nevada
20
Table 1b. BLM Planning Units with the Largest Total Land Area of High-Potential Photovoltaic Sites with Solar Resources of 6 kWh/m2/Day or Greater
(in descending order of total land area)
Planning Unit Field Office State
Battle Mountain Battle Mountain Nevada Las Cruces Las Cruces New Mexico Roswell Roswell New Mexico Ely Ely Nevada Las Vegas Las Vegas Nevada Fillmore Fillmore Utah Ridgecrest Ridgecrest California Needles Needles California Barstow Barstow California Phoenix Phoenix Arizona Safford Safford Arizona Cedar City Cedar City Utah Yuma Yuma Arizona Lake Havasu Lake Havasu Arizona Arizona Strip Arizona Strip Arizona Kingman Kingman Arizona Carlsbad Carlsbad New Mexico El Centro El Centro California Socorro Socorro New Mexico Palm Springs-South Coast Palm Springs California Carson City Carson City Nevada Salt Lake Salt Lake Utah Elko Elko Nevada Winnemucca Winnemucca Nevada Albuquerque Albuquerque New Mexico
21
Table 1c. BLM Planning Units with the Largest Total Land Area in Wind Class 5
(in descending order of total land area)
Planning Unit Field Office State
Rawlins Rawlins Wyoming Rock Springs Rock Springs Wyoming Elko Elko Nevada Las Cruces Las Cruces New Mexico Carson City Carson City Nevada Kremmling Kremmling Colorado Ridgecrest Ridgecrest California Dillon Dillon Montana Fillmore Fillmore Utah Las Vegas Las Vegas Nevada Royal Gorge Royal Gorge Colorado Billings Billings Montana Salt Lake Salt Lake Utah Owyhee Lower Snake River Idaho Barstow Barstow California Grants Pass Medford Oregon Palm Springs-South Coast Palm Springs California Albuquerque Albuquerque New Mexico Snake River Upper Snake River Idaho Grand Junction Grand Junction Colorado Surprise Surprise California
Emerald Empire Upper Columbia-Salmon Clearwater Idaho
Marys Peak Salem Oregon Wenatchee Wenatchee Washington Safford Safford Arizona

22
Table 1d. BLM Planning Units with the Largest Total Land Area of Biomass Sites Having an NDVI Greater than 5
(in descending order of total land area)
Planning Unit Field Office State
Phoenix Phoenix Arizona Wenatchee Wenatchee Washington Safford Safford Arizona Missoula Missoula Montana Deschutes Prineville Oregon Alturas Alturas California Eagle Lake Eagle Lake California Taos Taos New Mexico Central Oregon Prineville Oregon Folsom Folsom California Lakeview Lakeview Oregon Royal Gorge Royal Gorge Colorado Klamath Falls Klamath Falls Oregon Socorro Socorro New Mexico Redding Redding California San Juan San Juan Colorado Albuquerque Albuquerque New Mexico Dillon Dillon Montana Kremmling Kremmling Colorado Butte Butte Montana Las Cruces Las Cruces New Mexico Little Snake Little Snake Colorado Arizona Strip Arizona Strip Arizona Swiftwater Roseburg Oregon Mckenzie Eugene Oregon

23
Table 1e. BLM Planning Units Identified as Having the Highest Potential for Geothermal Resources
State Top-Pick Site BLM Planning Unit BLM Field Office
Glass Mountain Alturas Alturas Mono Long Valley Bishop Bishop
East Mesa Salton Sea
Truckhaven El Centro El Centro
Coso Randsburg Ridgecrest Ridgecrest
Lake City-Surprise Surprise Surprise
California (9 top picks)
Geysers Ukiah Ukiah
Beowawe Battle Mountain Elko
Battle Mountain Elko
Fish Lake Battle Mountain Carson City Salt Wells Soda Lake Steamboat Stillwater
Carson City Carson City
Dixie Valley Carson City Winnemucca
Carson City Winnemucca
Nevada (10 top picks)
Brady Rye Patch
San Emidio Winnemucca Winnemucca
New Mexico (3 top picks)
Lightning Dock Radium Springs
Tortugas Mountain Las Cruces Las Cruces
Klamath Falls Klamath Falls Klamath Falls Crump
Lakeview Summer Lake
Lakeview Lakeview
Newberry Crater Upper Deschutes Prineville
Oregon (7 top picks)
Malheur River Vale Southeast Oregon Vale
Thermo Hot Springs II Roosevelt Hot Springs Cedar City Cedar City Utah
(3 top picks) Cove Fort-Sulphurdale Cedar City
Fillmore Cedar City Fillmore
Washington (3 top picks)
Mt. Adams area Mt. Baker area
Wind River area Wenatchee Wenatchee
Source: Farhar and Heimiller 2002
24
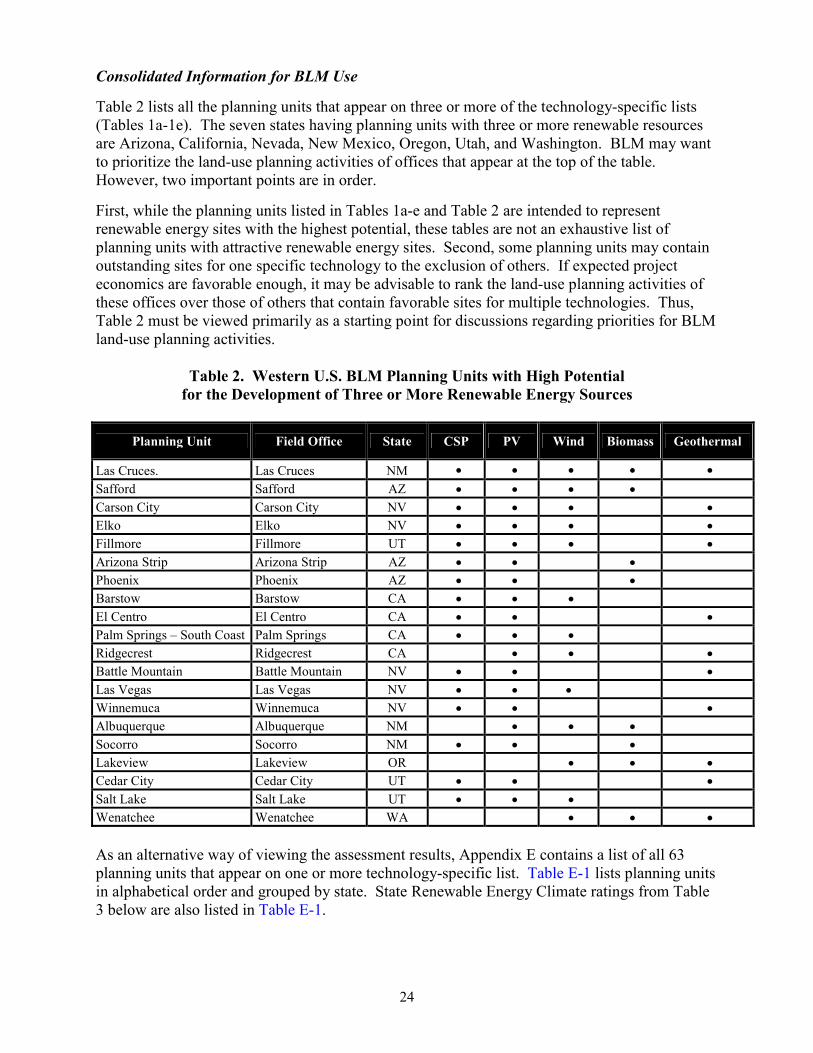
Consolidated Information for BLM Use Table 2 lists all the planning units that appear on three or more of the technology-specific lists (Tables 1a-1e). The seven states having planning units with three or more renewable resources are Arizona, California, Nevada, New Mexico, Oregon, Utah, and Washington. BLM may want to prioritize the land-use planning activities of offices that appear at the top of the table. However, two important points are in order.
First, while the planning units listed in Tables 1a-e and Table 2 are intended to represent renewable energy sites with the highest potential, these tables are not an exhaustive list of planning units with attractive renewable energy sites. Second, some planning units may contain outstanding sites for one specific technology to the exclusion of others. If expected project economics are favorable enough, it may be advisable to rank the land-use planning activities of these offices over those of others that contain favorable sites for multiple technologies. Thus, Table 2 must be viewed primarily as a starting point for discussions regarding priorities for BLM land-use planning activities.
Table 2. Western U.S. BLM Planning Units with High Potential for the Development of Three or More Renewable Energy Sources
Planning Unit Field Office State CSP PV Wind Biomass Geothermal
Las Cruces. Las Cruces NM • • • • • Safford Safford AZ • • • • Carson City Carson City NV • • • • Elko Elko NV • • • • Fillmore Fillmore UT • • • • Arizona Strip Arizona Strip AZ • • • Phoenix Phoenix AZ • • • Barstow Barstow CA • • • El Centro El Centro CA • • • Palm Springs – South Coast Palm Springs CA • • • Ridgecrest Ridgecrest CA • • • Battle Mountain Battle Mountain NV • • • Las Vegas Las Vegas NV • • • Winnemuca Winnemuca NV • • • Albuquerque Albuquerque NM • • • Socorro Socorro NM • • • Lakeview Lakeview OR • • • Cedar City Cedar City UT • • • Salt Lake Salt Lake UT • • • Wenatchee Wenatchee WA • • •
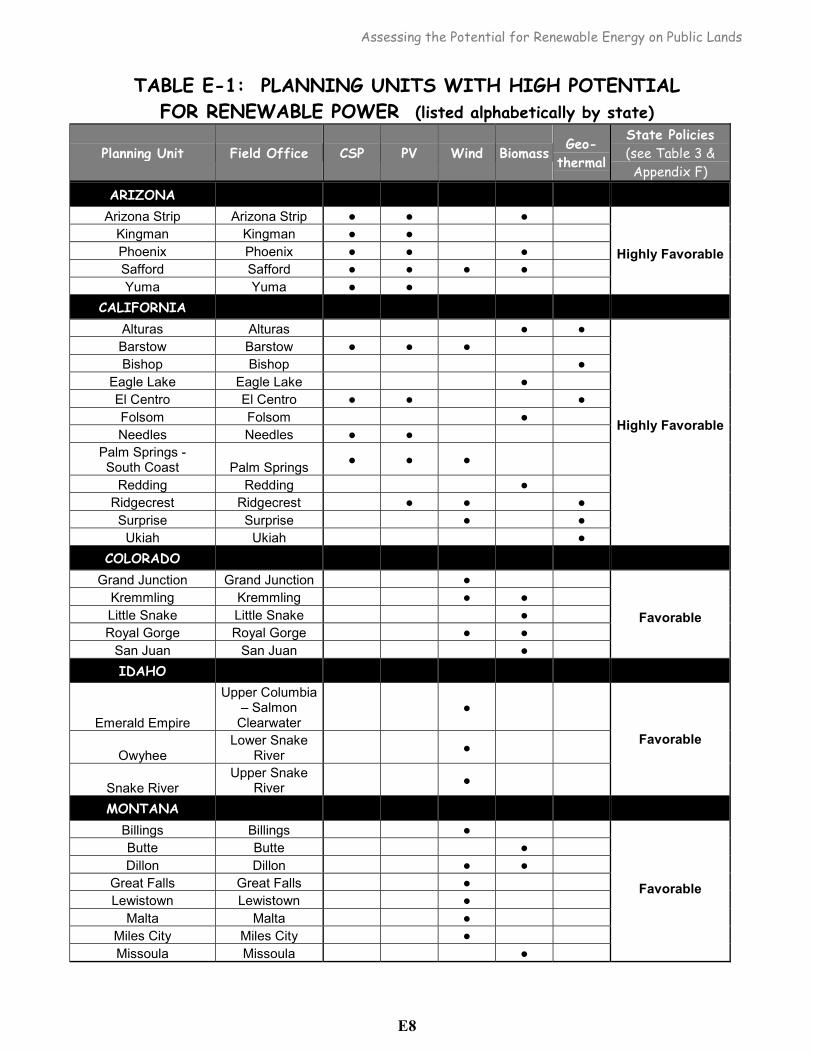
As an alternative way of viewing the assessment results, Appendix E contains a list of all 63 planning units that appear on one or more technology-specific list. Table E-1 lists planning units in alphabetical order and grouped by state. State Renewable Energy Climate ratings from Table 3 below are also listed in Table E-1.

25
Western State Government Renewable Energy Policies State-level policies are also an important consideration in prioritizing land-use planning activities. As a result of an ongoing deregulating process, many western states have enacted a variety of laws and rules providing incentives for renewable energy use. However, the size of these incentives varies from state to state. Some states have worked aggressively to create an environment in which renewable energy projects have the potential to flourish, while others have adopted a more policy-neutral response. Because the energy policy environment in each state will evolve over time, current state-level incentives should not be the primary driver of BLM's land-use priorities. Current state-level incentives should rather serve as information needed in the prioritizing process. Table 3 summarizes major state-specific renewable energy policies.
Table 3. Summary of Western State Renewable Energy Policies State
Renewable Energy Climate
Key Policies
Arizona Highly Favorable
Many policies are in place, including (1) green pricing programs, (2) green power aggregation, (3) generation disclosure, (4) net metering, and most important, (5) a renewable energy portfolio standard.
California Highly Favorable
Many policies are in place, including (1) a solar and wind energy tax credit, (2) a solar property tax exemption, (3) green pricing programs, (4) green power aggregation, (5) generation disclosure, (6) a net-metering law, (7) a public benefits fund, and (8) a state loan program.
Colorado Favorable
Colorado utilities currently offer at least 10 green pricing programs across the state. At least three large Colorado cities aggregate their green power purchases. Colorado also requires generation disclosure and has multiple net-metering laws.
Idaho Neutral
Idaho Power offers (1) a green pricing program, (2) income tax deduction, (3) low interest loans for renewable energy resources, and (4) net metering.
Montana Favorable
Multiple policies are in place, including (1) a corporate tax credit, (2) a green pricing program, (3) generation disclosure, (4) a mandatory green power option, (5) net metering, (6) a property tax exemption, and (7) a systems benefits fund.

26
State
Renewable Energy Climate
Key Policies
Nevada Highly Favorable
Many policies are in place, including (1) a property tax exemption, (2) a green pricing program, (3) generation disclosure, (4) a net-metering law, and most important, (5) a renewable energy portfolio standard.
New Mexico Favorable
Multiple policies are in place, including (1) electric generation facilities tax incentives, (2) generation disclosure, (3) net metering, and (4 ) a renewable energy production tax credit.
Oregon Favorable
Several policies are in place, including (1) a business tax credit, (2) green pricing programs, (3) a green power purchasing program, (4) generation disclosure, (5) net metering, (6) a public benefits fund, and (7) a state loan program.
Utah Neutral
Utah offers (1) a corporate income tax credit for renewable energy systems, (2) a green pricing program, and (3) a green power aggregation program.
Washington Favorable
Several policies are in place, including (1) several green pricing programs, (2) generation disclosure, (3) a green option requirement, (4) a net-metering law, and (5) an expanded sales tax exemption.
Wyoming Neutral Wyoming has a green pricing program and enacted a net-metering law that applies to solar, wind, and hydropower systems up to 25 kW.
6. Recommendations
Table 2 showed the BLM planning units with the highest potential for projects using three or more renewable energy sources, as needed for the BLM NEP implementation plan for renewable energy use on public lands. The BLM can use Table 2 in prioritizing land-use planning activities. BLM can then determine the best order in which to prepare or amend land-use plans to meet the Interior Secretary’s commitment to using energy from renewable resources on public lands. Other Opportunities 1. Consider a follow-on effort to develop a statewide renewable energy resource assessment for
Alaska. Because of the lack of GIS-based transmission data, a key factor used for screening high-potential renewable energy sites, Alaska was not included in this report. The assessment should consider power production potential and high-potential distributed generation opportunities.

27
2. Investigate the feasibility of developing a renewable resource assessment for low-impact hydro resources.
7. Appendices
A. Western U.S. Renewable Resource and BLM Land Ownership GIS Maps
B. Detailed Description and Data Sets for GIS Maps
C. Intermediate and Analysis Results GIS Maps
D. Intermediate and Top-Pick GIS Maps for Geothermal Field-Based Resource
Assessment E. Planning Units with Highest Renewable Energy Potential
F. State Policy and Financial Incentives for Renewable Energy
G. References
H. BLM, DOE, DOE National Laboratory Contacts

Assessing the Potential for Renewable Energy on Public Lands
A1
Appendix A
Western U.S. Renewable Resource and BLM Land Ownership GIS Maps

Assessing the Potential for Renewable Energy on Public Lands
A2

Assessing the Potential for Renewable Energy on Public Lands
A3

Assessing the Potential for Renewable Energy on Public Lands
A4
Assessing the Potential for Renewable Energy on Public Lands
A5
Assessing the Potential for Renewable Energy on Public Lands
B1
Appendix B
Detailed Description and Data Sets for GIS Maps
Assessing the Potential for Renewable Energy on Public Lands
B2
Resource Data Solar NREL has developed a national solar resource assessment for the United States at a resolution of approximately 40 km by 40 km. The data are updated periodically; the most recent update was in the summer of 2001 and represents 14 collector configurations. The CSP analysis utilized direct normal data, which represent concentrating systems that track the sun throughout the day, such as trough collectors or dishes. The PV analysis used data from the flat-plate collector type, typical for a PV panel oriented due south at an angle from horizontal equal to the latitude of the location of the collector. The data were developed from the Climatological Solar Radiation (CSR) Model, developed by NREL for DOE. This model uses information on cloud cover, atmospheric water vapor and trace gases, and the amount of aerosols in the atmosphere to calculate the monthly average daily total insolation (sun and sky) falling on a horizontal surface. Where possible, existing ground measurement stations were used to validate the model. Nevertheless, uncertainty is associated with the meteorological input to the model, since some of the input parameters are not available at a 40 km resolution. As a result, the modeled values are believed to be accurate to approximately 10% of a true measured value within the grid cell. Because of terrain effects and other microclimate influences, local cloud cover can vary significantly even within a single grid cell. Furthermore, the uncertainty of the modeled estimates increases with distance from reliable measurement sources and with the complexity of the terrain. Concentrating solar collectors are much more sensitive to solar resource characteristics than flat-plate collectors, so these sources of uncertainty are more important to concentrator applications. Wind A compilation of data from many different sources was used in this analysis. Updated resource assessments of Idaho, Montana, Oregon, and Washington were produced by TrueWind Solutions in 2000 and 2001. The assessments were produced using the Mesomap system and historical weather data, and were validated with available surface data by NREL and wind energy meteorological consultants. The accuracy of the updated wind resource assessment is generally within 20% for wind power density for 80% of the areas. For more information, see http://www.windpowermaps.org. An updated assessment of Colorado was produced in 1995 for the Colorado Governor’s Office of Energy Conservation “Study to Identify and Characterize Sites for Utility Wind Farm Development in Colorado.” This study was conducted by Michael Brower of RLA Consulting in Bothell, WA. The data are available from the Colorado Renewable Resource Database (http://www.coloradoenergy.org/corrd). The resolution of the data is 1 x 1 km, and the 1987 U.S. wind resource assessment was used as a base. These data have not been validated by NREL. An updated assessment of New Mexico was produced by Brower & Co., Inc., for the New Mexico Energy, Minerals and Natural Resources Department in 1996. The original data produced for the assessment were for 50-m wind speeds. The resolution of the data is 1 x 1 km, and the 1987 U.S. wind resource assessment was used as a base. These data have not been validated by NREL. The data were converted to 50-m wind power density using elevation as a proxy for air density, assuming a wind distribution Weibull k = 2.0.

Assessing the Potential for Renewable Energy on Public Lands
B3
A Wind Energy Resource Atlas of the United States was produced in 1987 by staff at the Pacific Northwest National Laboratory. The resolution of the gridded contiguous U.S. wind resource data is 1/4 degree of latitude by 1/3 degree of longitude. Each grid cell was assigned a wind power class, which applies only to sites within the grid cell that are well exposed to the wind. Depending on the terrain type within the grid cell, the portion of the grid cell that is exposed could vary from as little as 5% (ridge crests) to 95% (flat plains). The values were assigned by integrating several subjective factors: quantitative wind data, qualitative indicators of wind speed or power, the characteristics of exposed sites in various terrains, and familiarity with the meteorology, climatology, and topography of the region. As a result, the degree of certainty with which the wind power class can be specified depended on the abundance and quality of wind data, the complexity of the terrain, and the geographical variability of the resource. For more information, see http://rredc.nrel.gov/wind/pubs/atlas. Reference: Elliott, D.L., C.G. Holladay, W.R. Barchet, H.P. Foote, and W.F. Sandusky. 1987. Wind Energy Resource Atlas of the United States. Golden, CO: Solar Energy Research Institute. Biomass A Normalized Difference Vegetation Index (NDVI) has been shown to be highly correlated to surface vegetation. NDVI is derived from the visible and near-infrared channel reflectances. This data set is produced as part of the NOAA/NASA Pathfinder Advanced Very High Resolution Radiometers Land program. It contains global monthly composites of NDVI at a 1 x 1 degree resolution, resampled to 8 x 8 km pixels in the output product. NDVI is derived using the following formula:
(near-infrared reflectance - visible reflectance) (near-infrared reflectance + visible reflectance)
The visible channel (0.58 to 0.68 µm) is in a part of the spectrum where chlorophyll causes considerable absorption of incoming radiation. The near-infrared channel (0.73 to 1.10 µm) is in a spectral region where spongy mesophyll leaf structure leads to considerable reflectance. A few validation checks have been built into the Pathfinder data processing (quality control flags). Automated quality checks are made for consistency in fields such as date and satellite or scan times. Geophysical values are checked to see that they are within a reasonable range. Certain anomalies may exist in the data set because of conditions inherent in the input data—for example, missing scan lines or orbits, incorrect or incomplete calibration coefficients—and many of these data are flagged with the quality control indicator. The authors wish to thank the Distributed Active Archive Center (Code 902.2) at the Goddard Space Flight Center, Greenbelt, MD 20771, for producing the data in their present form and distributing them. The original data products were produced under the NOAA/NASA Pathfinder program, by a processing team headed by Mary James of the Goddard Global Change Data Center. The science algorithms were established by the AVHRR Land Science Working Group, chaired by Dr. John Townshend of the University of Maryland. The Goddard Center’s contributions to these activities were sponsored by NASA's “Mission to Planet Earth” program.
Assessing the Potential for Renewable Energy on Public Lands
B4
Geothermal Data from BLM offices are available as legal descriptions detailing township, range, section, and aliquot portion. Two offices (California and Nevada) provided digital data depicting the boundaries down to the aliquot portion. Publicly available data were used to geo-code data from the other four states, which could only be done to the township range level. Therefore, a square that is shown on the map for Oregon, Idaho, Utah, and New Mexico might represent less than one section (1/36th) of the square shown. Additional data on current and expired BLM geothermal lease locations and a national geothermal resource potential assessment produced by Southern Methodist University Geothermal Laboratory were used to provide assurance that the selected areas were generally perceived as high-potential areas. Other GIS Data Used in the Analysis Communities at Risk: Information is available from the GeoMAC Web site on the location of communities at risk of fire hazards. Roads: The roads data used represent major roads in the western United States, such as interstates, U.S. and state highways, and other major thoroughfares. The data were produced by Geographic Data Technology (2000) and are distributed by Environmental Systems Research Institute, Inc. Topography: 30 arc second digital elevation model (DEM) data from the U.S. Geological Survey were used to calculate percent slope. The DEM has a nominal resolution of 1 km2. Populated Place Areas: U.S. populated place areas are represented in this data set, as identified by the U.S. Census Bureau. Population statistics are based on the 1990 Census. The data are distributed by Environmental Systems Research Institute, Inc. Transmission Lines: The transmission line data used are licensed by NREL from POWERmap, ©2002 Platts, A Division of the McGraw-Hill Companies. The data are generally complete down to 100 kilovolts (kV) and contain lower voltage lines in selected areas. The transmission lines have a nominal accuracy of 1 mile.
Assessing the Potential for Renewable Energy on Public Lands
C1
Appendix C
Intermediate and Analysis Results GIS Maps

Assessing the Potential for Renewable Energy on Public Lands
C2
CSP Intermediate Maps
Assessing the Potential for Renewable Energy on Public Lands
C3
Assessing the Potential for Renewable Energy on Public Lands
C4

Assessing the Potential for Renewable Energy on Public Lands
C5
Assessing the Potential for Renewable Energy on Public Lands
C6

Assessing the Potential for Renewable Energy on Public Lands
C7

Assessing the Potential for Renewable Energy on Public Lands
C8
PV Intermediate Maps

Assessing the Potential for Renewable Energy on Public Lands
C9
Assessing the Potential for Renewable Energy on Public Lands
C10

Assessing the Potential for Renewable Energy on Public Lands
C11
Assessing the Potential for Renewable Energy on Public Lands
C12
Wind Intermediate Maps

Assessing the Potential for Renewable Energy on Public Lands
C13

Assessing the Potential for Renewable Energy on Public Lands
C14

Assessing the Potential for Renewable Energy on Public Lands
C15
Assessing the Potential for Renewable Energy on Public Lands
C16
Assessing the Potential for Renewable Energy on Public Lands
C17
Biomass Intermediate Maps

Assessing the Potential for Renewable Energy on Public Lands
C18

Assessing the Potential for Renewable Energy on Public Lands
C19

Assessing the Potential for Renewable Energy on Public Lands
C20

Assessing the Potential for Renewable Energy on Public Lands
C21
Assessing the Potential for Renewable Energy on Public Lands
C22

Assessing the Potential for Renewable Energy on Public Lands
C23
Assessing the Potential for Renewable Energy on Public Lands
D1
Appendix D
Intermediate and “Top-Pick” GIS Maps for Geothermal Field-Based
Resource Assessment

Assessing the Potential for Renewable Energy on Public Lands
D2
Geothermal Intermediate Maps

Assessing the Potential for Renewable Energy on Public Lands
D3

Assessing the Potential for Renewable Energy on Public Lands
D4

Assessing the Potential for Renewable Energy on Public Lands
D5

Assessing the Potential for Renewable Energy on Public Lands
E1
Appendix E
Planning Units with Highest Renewable Energy Potential
GIS Maps By Technology Source for Tables 1a-1e
Table of All Planning Units
Listed Alphabetically by State
Assessing the Potential for Renewable Energy on Public Lands
E2

Assessing the Potential for Renewable Energy on Public Lands
E3
Assessing the Potential for Renewable Energy on Public Lands
E4

Assessing the Potential for Renewable Energy on Public Lands
E5

Assessing the Potential for Renewable Energy on Public Lands
E6

Assessing the Potential for Renewable Energy on Public Lands
E7
This page intentionally left blank.
Assessing the Potential for Renewable Energy on Public Lands
E8
TABLE E-1: PLANNING UNITS WITH HIGH POTENTIAL FOR RENEWABLE POWER (listed alphabetically by state)
Planning Unit Field Office CSP PV Wind Biomass Geo-
thermal
State Policies (see Table 3 & Appendix F)
ARIZONA Arizona Strip Arizona Strip ● ● ●
Kingman Kingman ● ● Phoenix Phoenix ● ● ● Safford Safford ● ● ● ● Yuma Yuma ● ●
Highly Favorable
CALIFORNIA Alturas Alturas ● ● Barstow Barstow ● ● ● Bishop Bishop ●
Eagle Lake Eagle Lake ● El Centro El Centro ● ● ● Folsom Folsom ● Needles Needles ● ●
Palm Springs - South Coast Palm Springs ● ● ●
Redding Redding ● Ridgecrest Ridgecrest ● ● ● Surprise Surprise ● ●
Ukiah Ukiah ●
Highly Favorable
COLORADO Grand Junction Grand Junction ●
Kremmling Kremmling ● ● Little Snake Little Snake ● Royal Gorge Royal Gorge ● ●
San Juan San Juan ●
Favorable
IDAHO
Emerald Empire
Upper Columbia – Salmon
Clearwater ●
Owyhee Lower Snake
River ●
Snake River Upper Snake
River ●
Favorable
MONTANA Billings Billings ● Butte Butte ● Dillon Dillon ● ●
Great Falls Great Falls ● Lewistown Lewistown ●
Malta Malta ● Miles City Miles City ● Missoula Missoula ●
Favorable

Assessing the Potential for Renewable Energy on Public Lands
E9
Planning Unit Field Office CSP PV Wind Biomass Geo-
thermal
State Policies (see Table 3 & Appendix F)
NEVADA Battle Mountain Battle Mountain ● ● ●
Carson City Carson City ● ● ● ● Elko Elko ● ● ● ● Ely Ely ● ●
Las Vegas Las Vegas ● ● ● Winnemuca Winnemuca ● ● ●
Highly Favorable
NEW MEXICO Albuquerque Albuquerque ● ● ●
Carlsbad Carlsbad ● ● Las Cruces Las Cruces ● ● ● ● ● Farmington Farmington ●
Roswell Roswell ● ● Socorro Socorro ● ● ●
Taos Taos ●
Favorable
OREGON Central Oregon Prineville ●
Deschutes Prineville ● ● Grants Pass Medford ●
Jordan Vale ● Klamath Falls Klamath Falls ● ●
Lakeview Lakeview ● ● ● Malheur Vale ●
Mary’s Peak Salem ● McKenzie Eugene ● Swiftwater Roseburg ●
Favorable
UTAH Cedar City Cedar City ● ● ●
Fillmore Fillmore ● ● ● ● Moab Moab ●
Salt Lake Salt Lake ● ● ●
Neutral
WASHINGTON Wenatchee Wenatchee ● ● ● Favorable WYOMING
Rawlins Rawlins ● Rock Springs Rock Springs ● ● Neutral
Assessing the Potential for Renewable Energy on Public Lands
F1
Appendix F
State Policies and Financial Incentives for Renewable Energy
Assessing the Potential for Renewable Energy on Public Lands
F2
This appendix provides most of the state policies and financial incentives considered applicable to the development of renewable power production facilities on BLM lands. Some policies were omitted (e.g., residential solar tax credits) as not being directly applicable to this assessment. After October 2002, readers are encouraged to consult the Database of State Incentives for Renewable Energy (www.dsireusa.org) for the most current state policies and incentives. Arizona (Highly Favorable) Green Pricing Programs • APS - Solar Partners • SRP - EarthWise Energy • Tucson Electric Power - GreenWatts
Green Power Aggregation Scottsdale – Green Power Purchasing Generation Disclosure The Arizona Corporation Commission adopted disclosure provisions as part of its 1996 Retail Electric Competition Rules. Under the disclosure provisions, all retail suppliers of electricity must disclose composition, fuel mix, and emissions characteristics upon request. Net Metering The original Arizona Corporation Commission regulatory decision allowing net metering was made on July 27, 1981. This ruling allows net metering for qualifying facilities (QF) as defined by PURPA. This ruling applies to QFs of 10 kW or less for Arizona Public Service or 100 kW or less for Tucson Electric Power. Renewables Portfolio Standard Arizona’s Environmental Portfolio Standard (EPS) was formally approved by the Arizona Corporation Commission (ACC) in May 2000, and it became operational on March 30, 2001. Under the standard, regulated utilities in the state are required to provide a certain percentage of their electricity from renewable energy. The standard begins with 0.2% renewables for 2001 and increases to 1.1%. California (Highly Favorable) Solar and Wind Energy Tax Credit California Governor Gray Davis approved SB 17 on October 8, 2001. The law provides income tax credits for the purchase and installation of solar energy systems. Solar energy systems are defined as photovoltaic or wind-driven systems with a peak generating capacity of up to, but not more than, 200 kW. The credit is equal to 15% of the cost of a system installed after January 1, 2001, and before January 1, 2004, or $4.50 per rated watt of the system, whichever is less. After January 1, 2004, and before January 1, 2006, a credit of 7.5% of the cost of an installed solar energy system will be available. If an installed system is removed from the state within one year, the credit must be repaid to the state.

Assessing the Potential for Renewable Energy on Public Lands
F3
Solar Property Tax Exemption According to California Revenue and Taxation Code, section 73, active solar energy systems installed between January 1, 1999, and January 1, 2006, are not subject to property taxes. Green Pricing Programs • Alameda - Clean Future Fund • Burbank Water & Power - Clean Green Support • LADWP - Green Power for a Green LA • Palo Alto Utilities - Future Green Power • Roseville Electric - Green Energy • SMUD - Community Solar • SMUD - Greenergy • SMUD - PV Pioneers I • Turlock Irrigation District - Green Valley Energy Green Power Aggregation • Santa Barbara Generation Disclosure California’s energy suppliers must disclose to all customers the energy resource mix used in generation. Providers must use a standard label created by the California Energy Commission (CEC), and this information must be provided to end-use customers at least four times per year. Net Metering California’s net metering law requires that all California electric utilities, regulated and unregulated, allow net metering for all customer classes. Bi-directional time-of-use pricing means that net metering customers are entitled to deliver electricity back to the system for the same time-of-use (including real-time) price that they pay for power purchases. Eligible systems are not to exceed 1,000 kW (1 MW) of peak generating capacity. The Los Angeles Department of Water and Power is exempt from the net metering rules. Public Benefits Fund California set the bar for all other renewable energy funds with the creation of a $540 million fund for renewables in its electric industry restructuring legislation (Assembly Bill 1890) in 1996. The success of that program lead to legislation to extend that funding—at the same annual levels—another 10 years through 2012, creating an additional $1.35 billion in renewables funding. This extended funding was enabled through Assembly Bill 995, which passed in September 2000. The initial funding amount is being collected from 1998 to 2001 from customers of the state’s three investor-owned utilities—SDG&E, SCE, and PG&E—which must pay specified amounts each year. The CEC manages the renewables funds. State Loan Program The California Consumer Power and Conservation Financing Authority (the Power Authority or CPA) offers below-market rate loans to manufacturing companies that use the loan to purchase and install renewable energy systems, energy-efficient equipment, or clean distributed generation systems on their own site(s), or a company that manufactures renewable energy distributed generation systems or components in California. Eligible technologies include photovoltaics, solar thermal electric, fuel cells, small and large wind turbines, biogas, landfill gas, biomass, geothermal electric, solar industrial process heating, and waste heat recovery. Funding for the program includes $30 million of tax-exempt industrial development bonds awarded in March

Assessing the Potential for Renewable Energy on Public Lands
F4
2002, and $3-$8 million scheduled to be awarded in November 2002. The minimum loan amount is $500,000, and the maximum amount is $10 million per applicant, with a limit of $40 million to any one company. Colorado (Favorable) Green Pricing Programs • Colorado Springs - Green Power Program • Estes Park - Wind Power Program • Fort Collins - Wind Power Program • Holy Cross Electric - Wind Power Pioneers • Longmont - Wind Program • Loveland - Wind Energy Program • Xcel Energy - Renewable Energy Trust • Xcel Energy - Solarsource • Xcel Energy - Windsource • Yampa Valley Electric Association - Electricity from the Wind Green Power Aggregation • Aspen • Boulder • Denver Generation Disclosure Colorado is one of several states to require disclosure without having restructured its electricity market. In January 1999, the Colorado Public Utility Commission (PUC) adopted regulations requiring the state's investor-owned utilities (IOUs) to disclose information regarding their fuel mix to retail customers. Utilities with a total system load of more than 100 MW are required to provide this information as a bill insert or as a separate mailing twice annually, beginning October 1999. The PUC provided a suggested format for the disclosure. Fuel mix percentages are to be based on the power supply mix for the previous calendar year. Supporting documentation concerning the calculations used to determine the power supply mix percentages must be submitted to the PUC for approval. Net Metering Rules • Aspen Electric/Holy Cross Electric • Fort Collins Utilities • Xcel Energy Idaho (Neutral) Green Pricing Program Avista Utilities - Buck-A-Block for Renewable Energy Idaho Power - Green Power Program

Assessing the Potential for Renewable Energy on Public Lands
F5
Income Tax Deduction Idaho statute 63-3022-C allows taxpayers an income tax deduction for the entire cost (1005) up to a maximum of $20,000 of the cost of a solar, wind, or geothermal device used for heating or electricity generation. Taxpayers can apply for a 40% deduction in the year in which the system is installed and can also deduct 20% of the cost for three years thereafter. The maximum deduction in any one year is $5,000. Low-Interest Loans for Renewable Energy Resources This low-interest loan program, administered by the Energy Division of the Idaho Department of Water Resources, makes funds available at a 4% interest rate for active solar, photovoltaic, wind, geothermal, hydropower, and biomass energy projects. The program also makes loans for energy conservation projects. Residential loans are available from $1,000 to $10,000. In commercial and industrial sectors there is no minimum loan amount, but there is a maximum cap of $100,000. Loans are repaid in five years or less. Net Metering There is no net metering law in Idaho. However, several utilities offer net-metering tariffs approved by the Idaho Public Utilities Commission. Idaho Power Company has offered net metering tariff (Schedule 84) for residential and small commercial customers. Generation facilities that qualify under this tariff include solar, wind, biomass, hydropower, and fuel cells, and they must be rated at 25 kW or less. Avista Utilities also offers a net-metering option under Schedule 62F. This tariff is available to all customer classes in Idaho with an electric generating facility that uses solar, wind, or hydropower of not more than 25 kW. Montana (Favorable) Commercial or Net-Metering System Investment Credit This statute allows a 35% tax credit for an individual, partnership, or corporation that makes an investment of $5,000 or more in a wind electricity generating system or facilities that manufacture wind energy equipment. Eligible property includes wind energy system equipment, transmission lines, and equipment used in the manufacture of wind energy devices. The credit must be taken the year the equipment is placed in service; however, excess credit may be carried over for the following 7 years. Certain rules apply when using other state or federal financial incentives. This tax credit broadens the previous tax credit—which applied only to wind systems—to alternative energy systems. Alternative energy systems include solar, wind, geothermal, conversion of biomass, fuel cells that do not require hydrocarbon fuel, small hydroelectric generators producing less than 1 MW, or methane from solid waste. Green Pricing Program Flathead EC - Environmentally Friendly Power
Generation Disclosure Montana’s 1997 restructuring law called for the disclosure of fuel mix and environmental impact information. Regulations proposed by the Montana Department of Public Service Regulation on November 8, 1999, have yet to be implemented. Mandatory Green Power Option Montana has passed legislation requiring regulated electric utilities to offer their customers an opportunity to purchase "a separately marketed product composed of power from renewable resources," defined as biomass, wind, solar, or geothermal resources. The legislation, HB 474, allows the product to be priced differently

Assessing the Potential for Renewable Energy on Public Lands
F6
from the standard electricity product. The law also extends the state's universal system benefits program funding through 2005. Net Metering Montana's net metering law, enacted July 1, 1999, allows net metering for customers with solar, wind, and hydropower systems of 50 kW or less that are intended primarily to offset part or all of the customer's requirements for electricity. All customer classes are eligible, and no limit on enrollment or statewide installed capacity is specified. Property Tax Exemption This statute exempts from property taxation the value added by a qualified renewable energy source. Qualified equipment includes active and passive solar, wind, hydropower, solid waste, and the decomposition of organic wastes. Such equipment is exempt from taxation for a period of 10 years following installation. The value-added exemption applies to systems with up to $20,000 in value in the case of a single-family residential dwelling and $100,000 in the case of a multifamily residential dwelling or a nonresidential structure. System Benefits Fund As part of its 1997 restructuring legislation, Montana established its Universal System Benefits Program (USBP). Beginning January 1, 1999, all electricity suppliers began contributing 2.4% of their 1995 revenues annually to the USBP. This is an amount equivalent to $14.9 million annually, collected at a rate of 1.1 mills/kWh. The funds support energy efficiency, renewable energy resources, low-income energy assistance, and renewable energy R&D. Montana’s USBP is effective until December 31, 2005.
Nevada (Highly Favorable) Property Tax Exemptions This statute states that any value added by a qualified renewable energy source shall be subtracted from the assessed value of any residential, commercial, or industrial building for property tax purposes. Qualified equipment includes solar, wind, geothermal, solid waste converters, and hydropower systems. This exemption applies for all years following installation. Enacted in 1993, and most recently revised by S.B. 227 on June 1, 2001, this statute allows a property tax exemption for any business that (1) uses a process where at least 50% of the material or product is recycled, or (2) includes a facility for the generation of electricity from recycled material, whose primary purpose is the conservation of energy or the substitution of other sources of energy for fossil sources of energy. The exemption applies to 50% of the business property—personal and real—for up to 10 years. Property tax exemptions are managed by the Nevada Commission on Economic Development and include capital investment requirements and wage stipulations. Green Pricing In October 1997, Nevada Power Company applied to the Public Utilities Commission of Nevada for approval of its green pricing program. Today, Nevada Power Company, a subsidiary of Sierra Pacific Resources, and the Desert Research Institute’s Research Foundation, a fund-raising and public outreach arm of the Desert Research Institute, are partners in the GreenPower program. Soon, the GreenPower program will be transferred to the Desert Research Institute’s Research Foundation, enabling participants to take a tax

Assessing the Potential for Renewable Energy on Public Lands
F7
deduction for past donations in this tax year, or receive a refund check. Nevada Power Company will continue to collect customer contributions through the electric bill statements. Generation Disclosure Beginning January 2002, each electric utility must disclose certain information to its customers, according to regulations established by the Nevada Public Service Commission. The disclosure must be in a standard format and provided in bill inserts twice a year, as well as on utility Web sites. The disclosure must include the average mix of fuel sources used to create electricity, average emissions, customer service information, and information on low-income energy programs. Net Metering This law allows net metering for customers with solar and wind generation units of 10 kW or less. Utilities are required to supply a two-way meter to measure flow in both directions, and the utilities are prohibited from adding any additional charges to the bills of customers participating in net metering. Furthermore, utilities cannot place any additional standards or requirements on customer-generators beyond the requirements established by the National Electric Code and Underwriters Laboratories. Utilities are not required to pay for any net excess generation by the customer-generator. Customers have the option of annualizing the net metering calculation by having net excess generation at the end of a month credited toward the following month's bill. Renewables Portfolio Standard As part of its 1997 restructuring legislation, the Nevada legislature established a renewable energy portfolio standard. Under the standard, utilities must derive a minimum percentage of the total electricity they sell from renewable energy resources. In 2001, the legislature revised the minimum amounts to increase by 2% every two years, starting with a 5% renewable energy requirement in 2003 and achieving a 15% requirement by 2013 and each year thereafter. Not less than 5% of the renewable energy must be generated from solar renewable energy systems. New Mexico (Favorable) Electric Generation Facilities Tax Incentives H.B. 143 amends the Industrial Revenue Bond Act and the County Industrial Revenue Bond Act to allow “electricity generation facilities that do not provide retail electric services to customer” to qualify for Industrial Revenue Bonds under the definition of allowed projects. This legislation also amends the Uniform Division of Income for Tax Purposes Act and the Investment Credit Act to include “electricity from generation facilities that do not provide retail electric services to New Mexico customers” under the definition of manufacturing. The bill, effective May 15, 2002, authorizes the cost of certain wind energy equipment to be deducted from gross receipts for tax purposes, thereby providing a significant incentive for wind power development. Generation Disclosure As part of New Mexico’s Electric Utility Industry Restructuring Act of 1999, the legislature requires the NM Public Regulation Commission (PRC) to "promulgate rules governing competitive electric suppliers for the protection of customers, including required disclosure to a potential customer of unbundled prices, generation sources and fuel mix, and associated emissions." In May 2000, the PRC issued proposed rules that would require environmental disclosure in a standard format at least once a year. The proposed rules would require information on fuel mix to be compared to the national and regional averages, based on data available for the most recent calendar year, except in some circumstances in which forecasted data could be used.
Assessing the Potential for Renewable Energy on Public Lands
F8
Net Metering New Mexico Public Regulation Commission Rule 571 differs from the NM Administrative Code Title 17.10.571. Rule 571 applies to cogeneration facilities and small power producers with systems of 10 kW or less, and details a net-metering calculation that credits net energy generation to the consumer from month to month. The excess credit is zeroed out annually. The administrative code offers a second option for calculating the net energy generation credit, which essentially pays the customer the utility’s avoided cost, "crediting or paying the customer for the net energy supplied to the utility at the utility's energy rate pursuant to NMPRC Rule 570.17." The utility gets to choose which method it wants to use. Renewable Energy Production Tax Credit S.B. 187, effective May 15, 2002, provides a tax credit against the corporate income tax of one cent per kilowatt-hour for companies that generate electricity from qualifying wind or solar power facilities. The maximum benefit to any corporate taxpayer is $4 million per year, applicable only to the first 400,000 MWh of electricity in each of 10 consecutive years. To qualify, an energy generator must use a zero-emissions generation technology and have capacity of at least 20 MW. The total incentive program cost is capped at $8 million per year (800,000 MWh per year). If the amount of the tax credit claimed exceeds the taxpayer's corporate income tax liability, the excess may be carried forward for up to five consecutive taxable years. The provisions of this statute apply to taxable years beginning on or after July 1, 2002. Oregon (Favorable) Business Tax Credit Oregon's Business Energy Tax Credit is for investments in energy conservation, recycling, renewable energy resources, or less-polluting transportation fuels. Any Oregon business may qualify. As examples, projects may be in manufacturing plants, stores, offices, apartment buildings, farms, and transportation. The 35% tax credit is taken over five years: 10% the first and second years and 5% for each year thereafter. Any unused credit can be carried forward up to eight years. Under the "pass-through" option, IOUs and other companies can claim the credit and give customers a lump-sum cash payment of about 28%—the net present value—of their project costs. Green Pricing Programs • Ashland - Solar Pioneer Program • Eugene W&EB - Windpower • Pacific Power - Blue Sky • PGE - Clean Wind Power Green Power Purchasing In 1995, before the deregulation of the electric market in Oregon, the City of Portland signed an innovative five-year contract with Portland General Electric (PGE) that allowed direct purchase of renewable resources. The contract allowed the city to take advantage of wholesale rates for a 10 MW minimum purchase and to designate 5% of that purchase to be from wind power. Generation Disclosure Under Oregon’s 1999 electric utility restructuring legislation, the state’s two largest utilities are required to disclose their fuel mix and emissions. Beginning March 1, 2002, disclosure must be supplied using a format
Assessing the Potential for Renewable Energy on Public Lands
F9
prescribed by the Oregon Public Utility Commission. Power source and environmental impact information must be provided to all residential consumers at least quarterly. Net Metering Utilities offer net metering for all customers for solar, wind, and fuel cell systems that are 25 kW or less. The utility values the excess power generated by the customer at its avoided cost. Public Benefits Fund Oregon’s 1999 utility restructuring legislation included a 3% public benefits charge to be paid by all Portland General Electric and Pacific Power customers. A portion of those funds will provide $8 million to $10 million per year for 10 years toward the above-market cost of new renewable resource generation. Large electricity customers may invest most of their public benefits charges in their own facilities. For renewable resources, they may invest in green power, renewable energy certificates, or on-site generation. State Loan Program The State Loan Program provides up to $20 million per project in low-interest financing for investments in conservation, recycling, alternative fuels, and renewable resources. Individuals, businesses, governments, nonprofits, and tribes are eligible. Funds come from the sale of state general obligation bonds, and borrowers pay the full cost of their loans. Terms range from 5 to 20 years. The program has provided more than $175 million in financing for renewable energy programs to date. Utah (Neutral) Renewable Energy Tax Credit This corporate income tax credit for renewable energy systems applies to 10% of the cost of installation of a system, up to $50,000. Eligible technologies include active and passive solar systems, photovoltaics, biomass, hydropower, and wind. For residential buildings owned by the business, the credit is 25% of the cost of installation of a system up to a maximum credit of $2,000 per system. For commercial systems, the credit is 10% of the cost of installation up to $50,000. This tax credit expires on December 31, 2006. Green Pricing Program Utah Power - Blue Sky Green Power Aggregation In July 2002, Salt Lake City became the largest purchaser of wind power in the state of Utah. In an agreement with Utah Power, the City will purchase 350 blocks (or 35,000 kWh) of Blue Sky wind energy each month for the historic City and County Building. This action is consistent with the Salt Lake City Green program and the city’s Local Climate Action Plan. Washington (Favorable) Green Pricing Programs • Avista Utilities - Buck-A-Block for Renewable Energy • Benton County PUD - Green Power Program • Chelan County PUD - Sustainable Natural Alternative Power (SNAP) • Clark County Utilities - Green Lights • Orcas Power & Light - Green Power
Assessing the Potential for Renewable Energy on Public Lands
F10
• Pacific Power - Blue Sky • Puget Sound Energy - Green Power Program • Seattle City Light - Green Power Program • Snohomish County PUD - Planet Power • Tacoma - EverGreen Options Generation Disclosure Beginning in May 2001, retail electricity suppliers in Washington must provide a disclosure label in a standard format to their retail customers at least semiannually. Small utilities and mutual light and power companies must provide the disclosure label annually unless they market a "specific electric product new to that utility." Mandatory Green Power Option On May 8, 2001, the Governor signed EHB 2247, which requires investor-owned and publicly owned utilities to offer customers the option to purchase power generated from renewable sources, defined as power produced by wind, solar, geothermal, landfill gas, wave or tidal action, wastewater treatment gas, some biomass, and "qualified hydropower" that is fish-friendly. Net Metering Washington's net-metering law, enacted March 1998, allows net metering for customers with solar, wind, and hydropower systems of 25 kW or less that are intended primarily to offset part or all of the customer's requirements for electricity. All customer classes are eligible for enrollment. Enrollment is limited to a statewide installed generating capacity of 0.1% of the utility's 1996 peak demand. Sales Tax Exemption On May 8, 2001, the Governor of Washington signed legislation, H.B. 1859, expanding the sales and use tax exemption for solar, wind, and landfill gas electric generating facilities to include fuel cells. In addition, the exemption now applies to smaller systems—those that have a generating capacity of at least 200 W rather than at least 200 kW, as required previously. This tax exemption takes effect July 1, 2001.
Wyoming (Neutral) Green Pricing Program Pacific Power - Blue Sky Net Metering Wyoming has enacted its net metering law, which will take effect July 1, 2001. House Bill 195 was passed by the House and Senate of the Wyoming legislature and signed by the Governor on February 22, 2001. The law applies to solar, wind, and hydropower systems up to 25 kW. Systems must meet IEEE and UL standards and cannot be subject to additional interconnection requirements, except that system owners must install a manual, lockable external disconnect.
Assessing the Potential for Renewable Energy on Public Lands
G1
Appendix G
References

Assessing the Potential for Renewable Energy on Public Lands
G2
Agbu, P.A., and M.E. James. 1994. The NOAA/NASA Pathfinder AVHRR Land Data Set User's Manual. Goddard Distributed Active Archive Center. Greenbelt, MD: NASA Goddard Space Flight Center. Blackwell, D. 2002. Personal communication of data. Dallas: Southern Methodist University (SMU) (www.smu.edu/geothermal/geothermal_resources). Farhar, B.C., and D. Heimiller. 2002. Opportunities for Near-Term Geothermal Development on Public Lands in the Western United States. NREL/TP-550-32581. October. 65 pp. George, R, and E. Maxwell. 1999. “High-Resolution Maps of Solar Collector Performance Using a Climatological Solar Radiation Model.” Proceedings of the 1999 Annual Conference, American Solar Energy Society, Portland, ME. Elliott, D.L., C.G. Holladay, W.R. Barchet, H.P. Foote, and W.F. Sandusky. 1987. Wind Energy Resource Atlas of the United States. Golden, CO: Solar Energy Research Institute. Maxwell, E., R. George, and S. Wilcox. 1998. “A Climatological Solar Radiation Model.” Proceedings of the 1998 Annual Conference, American Solar Energy Society, Albuquerque NM. Muffler, L.J.P. (Ed.). 1979. Assessment of Geothermal Resource of the United States. Geological Survey Circular 790. Washington, DC: U.S. Department of the Interior, U.S. Bureau of Land Management. 162 pp. U.S. Bureau of Land Management. 2002. Personal communication with data from S. Hagerty and S. Santillan concerning geothermal leases on BLM lands. Sacramento, CA: U.S. Bureau of Land Management.

Assessing the Potential for Renewable Energy on Public Lands
H1
Appendix H
BLM, DOE, DOE National Laboratory Contacts

Assessing the Potential for Renewable Energy on Public Lands
H2
Bureau of Land Management (BLM)
Name Office Phone# e-mail address
Lee Otteni Headquarters, Renewable Energy Program Manager 505-599-0981 [email protected]
Mike Kirby National Science & Technology Center, Associate Director 303-236-6491 [email protected]
Paul Dunlevy Headquarters, Geothermal Program Lead 202-452-7707 [email protected] Mary Beth Stultz National Science & Technology Center 303-236-0100 [email protected]
Department of Energy (DOE)
Name Office Phone# e-mail address Beth Shearer Federal Energy Management Program 202-586-5772 [email protected] Anne Crawley Federal Energy Management Program 202-586-1505 [email protected] Peter Goldman Program Manager, Wind & Hydropower 202-586-1776 [email protected]
Susan Norwood Technical Coordinator, Geopowering the West Program 202-586-4779 [email protected]
National Renewable Energy Laboratory (NREL)
Name Office Phone# e-mail address
Doug Dahle Energy & Environmental Applications Office Federal Energy Management Program 303-384-7513 [email protected]_
Donna Heimiller Distributed Energy Resources Center Graphic Information System Expert
303-384-7098 or 303-274-4661 [email protected]
Dave Renne’ Distributed Energy Resources Center 303-275-4648 Dave_renne’@nrel.gov
Brandon Owens Energy Analysis Office (at NREL til 5/02) RDI/Platts Research and Consulting 720-548-5554 [email protected]
Ed Cannon National Wind Technology Center 303-384-6920 [email protected] Larry Flowers National Wind Technology Center 303-384-6910 [email protected] Brian Parsons National Wind Technology Center 303-384-6958 [email protected] Mark Mehos Building and Thermal Systems Center 303-384-7458 [email protected] Hank Price Building and Thermal Systems Center 303-384-7437 [email protected] John Thornton National Center for Photovoltaics 303-384-6469 [email protected] Byron Stafford National Center for Photovoltaics 303-384-6426 [email protected] Helena Chum National Bioenergy Center 303-275-2949 [email protected] Ralph Overend National Bioenergy Center 303-275-4450 [email protected] Rich Bain National Bioenergy Center 303-275-2946 [email protected] Kevin Craig National Bioenergy Center 303-275-2931 [email protected] Barbara Farhar Building and Thermal Systems Center 303-384-7367 [email protected] Gerry Nix Building and Thermal Systems Center 303-384-7566 [email protected] Chuck Kutscher Building and Thermal Systems Center 303-384-7521 [email protected]
Idaho National Energy and Environmental Laboratory (INEEL)
Name Office Phone# e-mail address Joel Rennert INEEL Geothermal Program 208-526-9824 [email protected]
Oak Ridge National Laboratory (ORNL)
Name Office Phone# e-mail address Lynn Wright Environmental Sciences Division 865-574-7378 [email protected] Mike Sale Environmental Sciences Division 865-574-7305 [email protected]
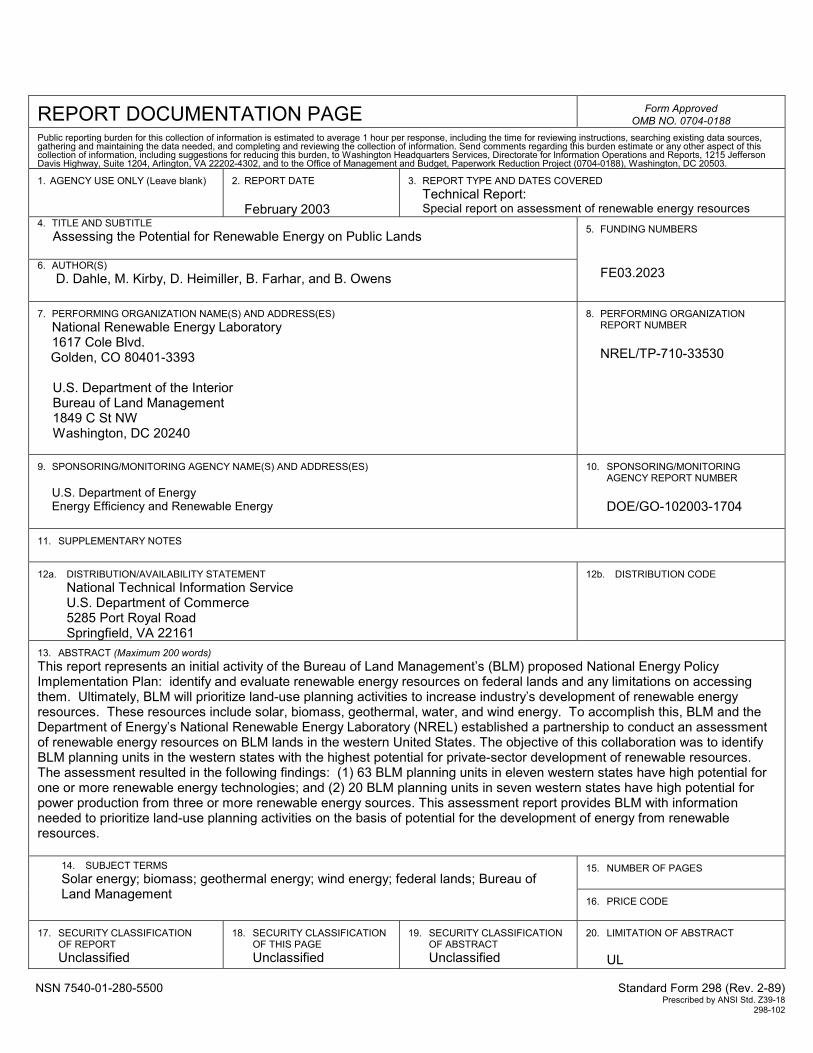
REPORT DOCUMENTATION PAGE
Form Approved OMB NO. 0704-0188
Public reporting burden for this collection of information is estimated to average 1 hour per response, including the time for reviewing instructions, searching existing data sources, gathering and maintaining the data needed, and completing and reviewing the collection of information. Send comments regarding this burden estimate or any other aspect of this collection of information, including suggestions for reducing this burden, to Washington Headquarters Services, Directorate for Information Operations and Reports, 1215 Jefferson Davis Highway, Suite 1204, Arlington, VA 22202-4302, and to the Office of Management and Budget, Paperwork Reduction Project (0704-0188), Washington, DC 20503. 1. AGENCY USE ONLY (Leave blank)
2. REPORT DATE
February 2003
3. REPORT TYPE AND DATES COVERED
Technical Report: Special report on assessment of renewable energy resources
4. TITLE AND SUBTITLE Assessing the Potential for Renewable Energy on Public Lands
6. AUTHOR(S) D. Dahle, M. Kirby, D. Heimiller, B. Farhar, and B. Owens
5. FUNDING NUMBERS
FE03.2023
7. PERFORMING ORGANIZATION NAME(S) AND ADDRESS(ES)
National Renewable Energy Laboratory 1617 Cole Blvd.
Golden, CO 80401-3393 U.S. Department of the Interior Bureau of Land Management 1849 C St NW Washington, DC 20240
8. PERFORMING ORGANIZATION
REPORT NUMBER NREL/TP-710-33530
9. SPONSORING/MONITORING AGENCY NAME(S) AND ADDRESS(ES)
U.S. Department of Energy Energy Efficiency and Renewable Energy
10. SPONSORING/MONITORING
AGENCY REPORT NUMBER DOE/GO-102003-1704
11. SUPPLEMENTARY NOTES
12a. DISTRIBUTION/AVAILABILITY STATEMENT
National Technical Information Service U.S. Department of Commerce 5285 Port Royal Road
Springfield, VA 22161
12b. DISTRIBUTION CODE
13. ABSTRACT (Maximum 200 words) This report represents an initial activity of the Bureau of Land Management’s (BLM) proposed National Energy Policy Implementation Plan: identify and evaluate renewable energy resources on federal lands and any limitations on accessing them. Ultimately, BLM will prioritize land-use planning activities to increase industry’s development of renewable energy resources. These resources include solar, biomass, geothermal, water, and wind energy. To accomplish this, BLM and the Department of Energy’s National Renewable Energy Laboratory (NREL) established a partnership to conduct an assessment of renewable energy resources on BLM lands in the western United States. The objective of this collaboration was to identify BLM planning units in the western states with the highest potential for private-sector development of renewable resources. The assessment resulted in the following findings: (1) 63 BLM planning units in eleven western states have high potential for one or more renewable energy technologies; and (2) 20 BLM planning units in seven western states have high potential for power production from three or more renewable energy sources. This assessment report provides BLM with information needed to prioritize land-use planning activities on the basis of potential for the development of energy from renewable resources.
15. NUMBER OF PAGES
14. SUBJECT TERMS Solar energy; biomass; geothermal energy; wind energy; federal lands; Bureau of Land Management
16. PRICE CODE
17. SECURITY CLASSIFICATION
OF REPORT Unclassified
18. SECURITY CLASSIFICATION
OF THIS PAGE Unclassified
19. SECURITY CLASSIFICATION
OF ABSTRACT Unclassified
20. LIMITATION OF ABSTRACT
UL
NSN 7540-01-280-5500 Standard Form 298 (Rev. 2-89) Prescribed by ANSI Std. Z39-18 298-102
Assessing the Potential for Renewable Energy on Public Lands
Prepared by the
National Renewable Energy Laboratory
A DOE National Laboratory
and the Bureau of Land Management
For the U.S. Department of Energy
Energy Efficiency and Renewable Energy
DOE/GO-102003-1704February 2003
Printed with a renewable-source ink on paper containing at least 50% wastepaper, including 20% postconsumer waste


