106
1 Green Remediation & Renewable Energy Development on Contaminated Lands and Mining Sites January 13, 2008 Penelope McDaniel OSWER Center for Program Analysis

11
Green Remediation&
Renewable Energy Development on Contaminated Lands and Mining Sites
January 13, 2008
Penelope McDaniel OSWER Center for Program Analysis

2
Overview of Available Tools
EPA’s approach to Green Remediation and Renewable Energy on Contaminated Land and Mining Sites Green remediation contract toolkitUSACE MOU UpdateRenewable energy initiative and mapping

3
EPA is taking a multi-prong approach
• Developing tools, such as GIS-based RE and contaminated lands/mining sites mapping and State incentive sheets
• Model AOCs, comfort letters, PPAs and PLAs for RE development on contaminated lands and mining sites
• Provide technical expertise to assess siting issues such as geotechnical conditions/soil stability

4
EPA is taking a multi-prong approach
• Outreach and education• Coordinate with interested parties• Identify and work on pilot sites• Measure results

5
Green Remediation Contract ToolkitWhat is it?
Quick reference guide to determine how to use the contract execution process to encourage the use of innovative approaches (e.g. green remediation technologies and practices) to site cleanup
Guide EPA staff as they develop procurements to identify where in various contract mechanisms to include requirements or preference for innovative cleanup strategies

6
Green Remediation Contract Toolkit What are some of the contract mechanisms covered in this
effort?
Remedial Action Contracts (RAC)Emergency and Rapid Response Services (ERRS) Superfund Technical Assessment & Response Team (START) Environmental Services Assistance Team (ESAT)RCRA Enforcement, Permitting and Assistance (REPA)US Army Corps of Engineers (USACE) contractsSite-specific contracts for Remedial ActionOthers….

7
Green Remediation Contract Toolkit Who is the target audience?
RPMsOSCsContracting and Project Officers who support removal action, remedial response, and support services

8
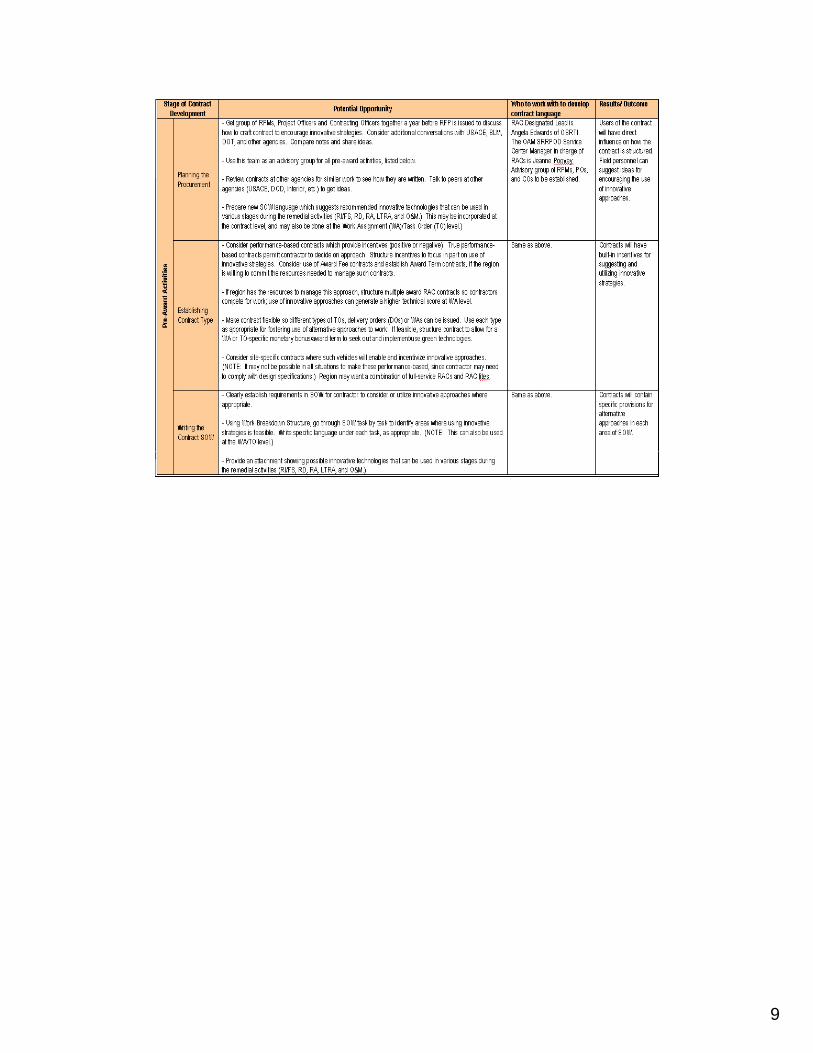
Green Remediation Contract Toolkit Example contract mechanism: RAC
Matrix showing RAC contract process to support the use of innovative/green cleanup strategiesProvides suggestions for how to incorporate GR language at various stages of the contracting process (e.g., from pre-award process through the contract performance)
Pre-Award•Planning & procurement •Establishing contract type •Writing the SOW•Establishing contract terms and conditions•Establishing evaluation criteria and selecting contractors
Contract performance•Writing a Work Assignment / Task Order
•General category of consideration•RI/FS, RD/RA, O&M
•Reviewing and approving work plans•Evaluating performance •Recognition of contractor performance
9

10

11

12

13
Green Remediation Contract Toolkit Next steps
Finalize contract tool kit for RACContinue to develop tool kit for all contract mechanismsContinue outreach on how to use tool kit
14
USACE MOU Update
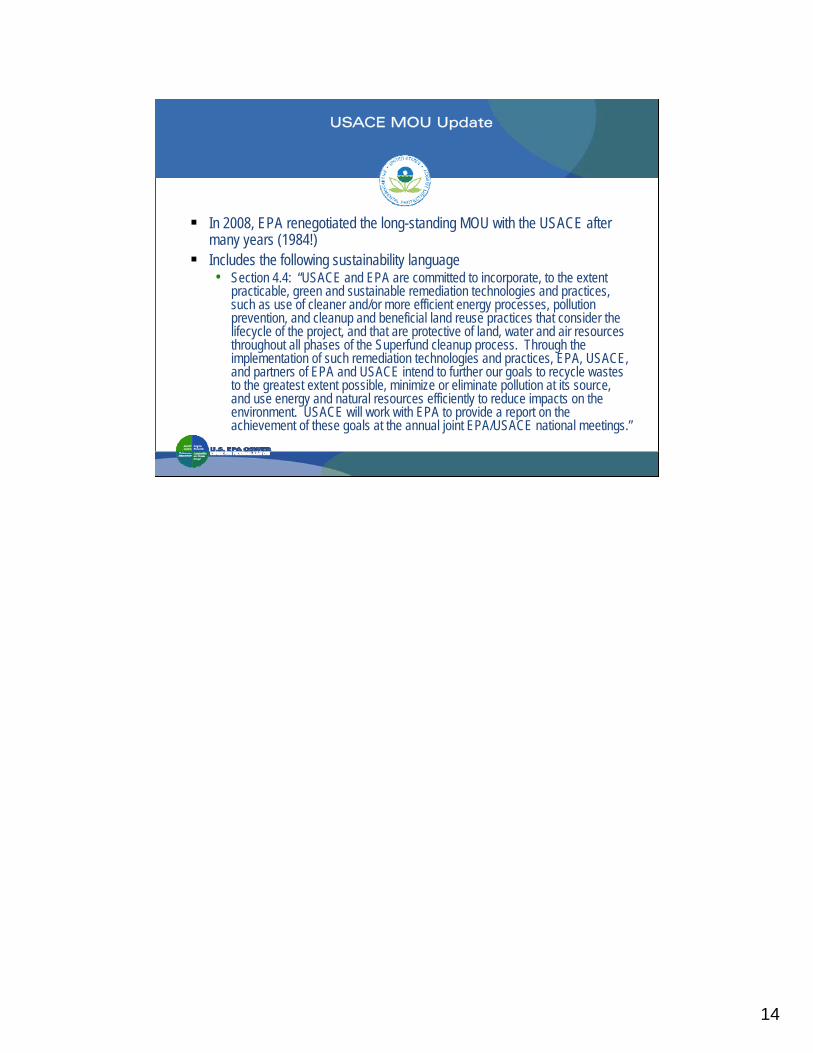
In 2008, EPA renegotiated the long-standing MOU with the USACE after many years (1984!)Includes the following sustainability language• Section 4.4: “USACE and EPA are committed to incorporate, to the extent
practicable, green and sustainable remediation technologies and practices, such as use of cleaner and/or more efficient energy processes, pollution prevention, and cleanup and beneficial land reuse practices that consider the lifecycle of the project, and that are protective of land, water and air resources throughout all phases of the Superfund cleanup process. Through the implementation of such remediation technologies and practices, EPA, USACE, and partners of EPA and USACE intend to further our goals to recycle wastes to the greatest extent possible, minimize or eliminate pollution at its source, and use energy and natural resources efficiently to reduce impacts on the environment. USACE will work with EPA to provide a report on the achievement of these goals at the annual joint EPA/USACE national meetings.”
15
RE-Powering America’s Land: Siting Renewable Energy On Contaminated
Land and Mining Sites
• New Initiative launched by OSWER• Goal: Encourage, support and facilitate the development of renewable energy
production facilities on contaminated lands and mining sites• Focuses on renewable energy development potential on Superfund, RCRA,
Brownfields and Mining Sites

16
RE-Powering America’s LandBenefits of Renewable Energy Development on
EPA Tracked Sites
Many Superfund, RCRA, Brownfield, Mining Sites and other blighted properties offer:• Offer thousands of acres• Existing infrastructure - transmission lines, roads and
railway• NIMBY issues may be less prevalent• Adequate zoning
Siting renewable energy on these sites may be a viable reuse option:• Provides economic value for property that might
otherwise lack significant value • Furthers environmental sustainability by maximizing
land use and optimizing renewable energy opportunities• May have lower overall transaction costs compared to
greenfields• Reduces the stress on greenfields land for construction
of new energy facilities • Provides clean, emission-free energy for use on-site,
locally, and utility grid

17
RE-Powering America’s LandBenefits of Renewable Energy Development on
EPA Tracked Sites
Approximately 16 million acres of potentially contaminated properties (approx. 480,000 sites) across the United States are tracked by EPA• ~80% (13.6 million acres) are non-urban• ~20% (3.2 million acres) are abandoned mine land
Cleanup goals have been achieved and controls put in place to ensure long-term protection at more than 850,000 acres
Reintroduce local job opportunities for development, operation and maintenance of, and equipment manufacture for renewable energy facilities

18
Why Develop Renewable Energy Facilities on EPA Tracked Sites?
Over 16 million acres of potentially contaminated properties (approx. 480,000 sites) across the United States are tracked by EPA• ~80% (13.6 million acres) are non-urban• ~20% (3.2 million acres) are abandoned mine land
Cleanup goals have been achieved and controls put in place to ensure long-term protection for more than 850,000 acres
Reintroduce local job opportunities for development, operation and maintenance of, and equipment manufacture for renewable energy facilities

19
How Much Energy Can EPA Tracked Lands Support?
Solar Energy PotentialSolar Energy Generation Capacity on EPA Tracked Lands• 2,670,227 MW
In 2010, EIA projects U.S. solar PV and thermal capacity at 6,100 MW
Wind Energy PotentialWind Energy Generation Potential on EPA Tracked Lands• 120,379 MW
In 2010, EIA projects U.S. wind capacity at 25,610 MW
20
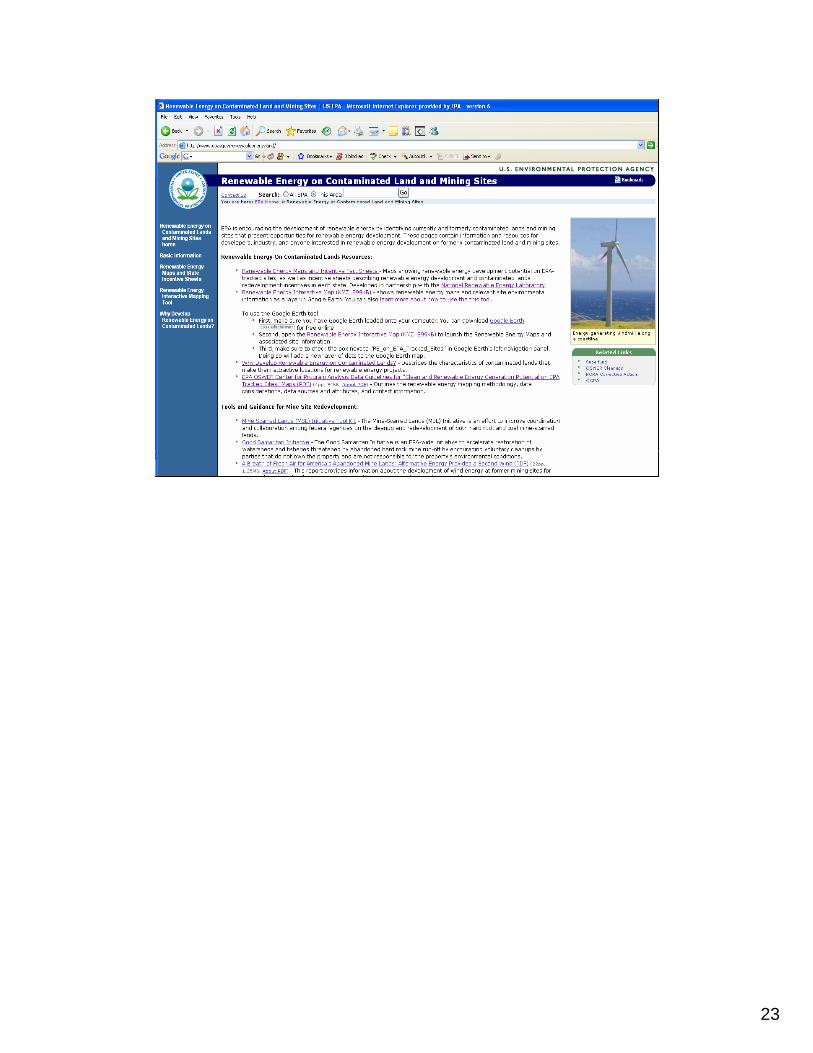
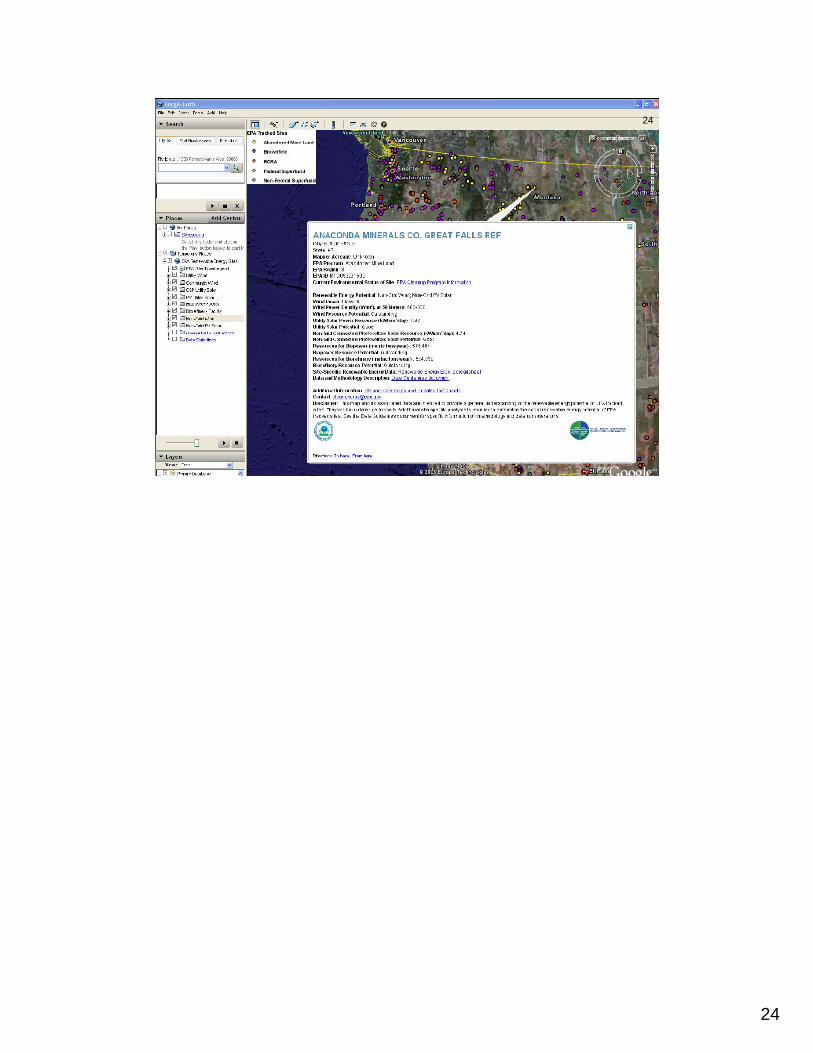
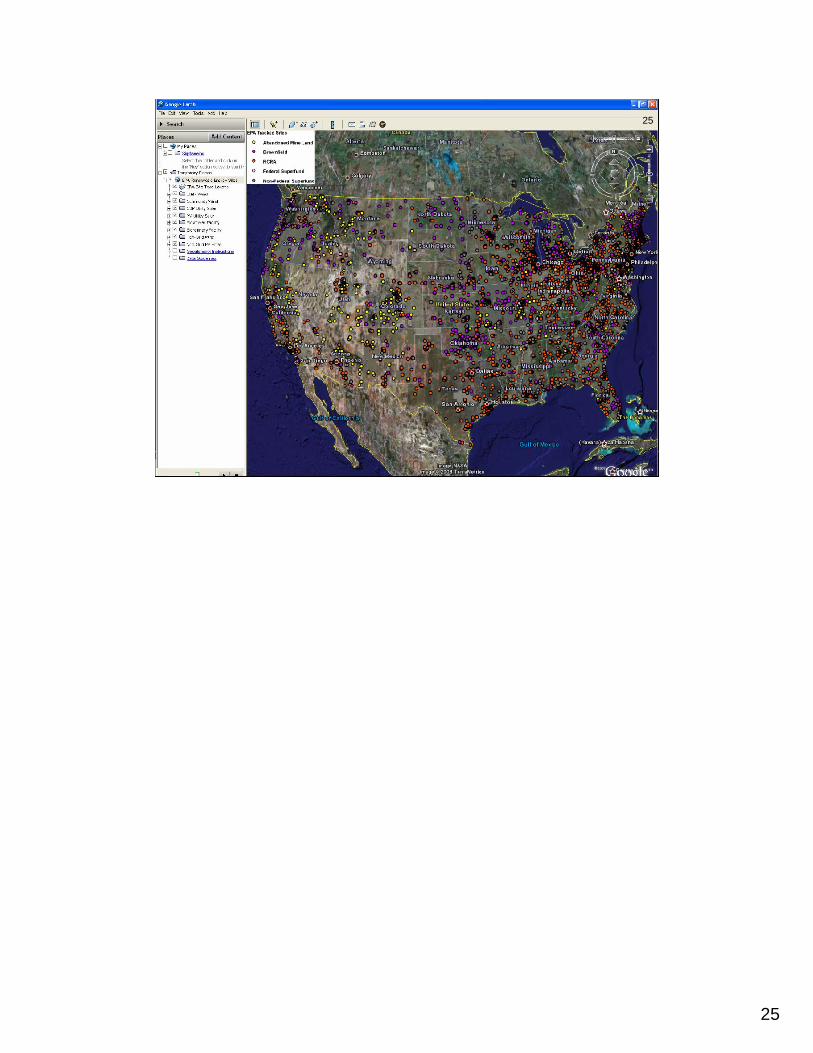
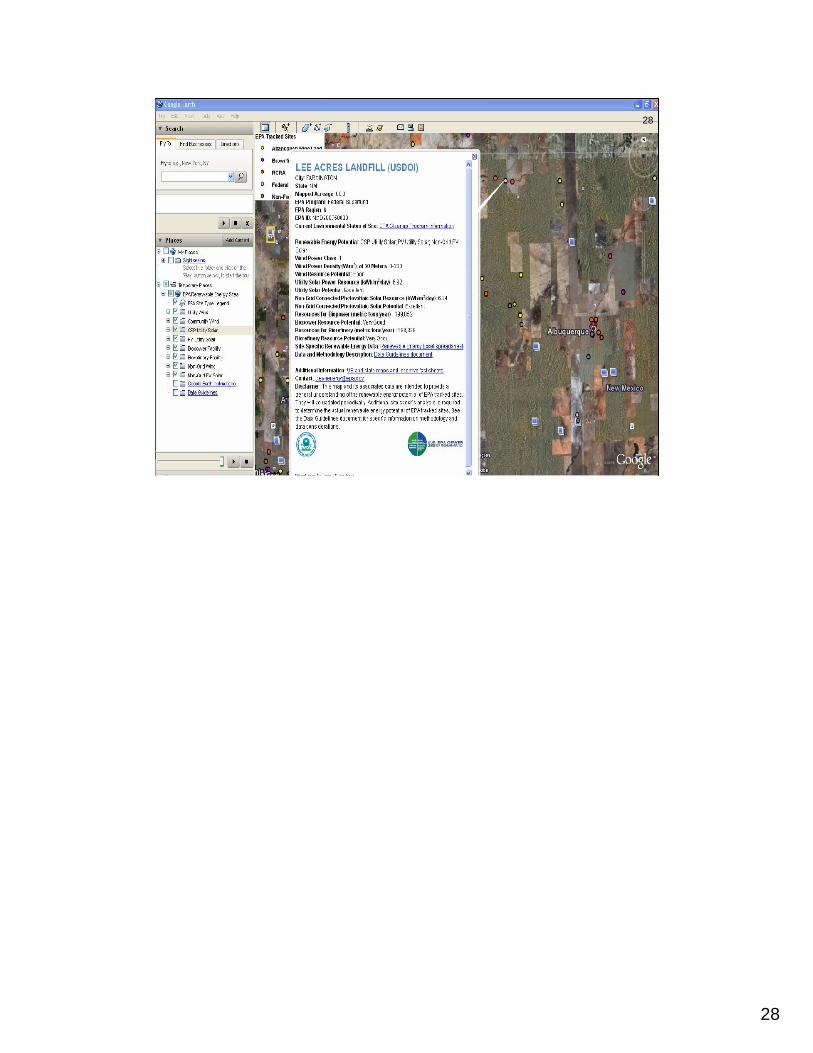
Google Earth Mapping Tool
Successful EPA-NREL joint venture produced an interactive Google Earth mapping application
Shows opportunities to site renewable energy on contaminated lands and mining sites in each state
Using criteria, such as distance to electric transmission lines, distance to roads, renewable energy potential, and site acreage, we produced over 170 state-specific maps showing renewable energy development potential on EPA tracked sites
Produced incentive sheets describing renewable energy development and contaminated lands redevelopment incentives in each state
21
Google Earth Mapping Tool
Audience:• Developers• Environmental managers (state, federal, private)• Consultants• Private industry• Communities• Local, state, and federal energy and environment
officials• Anyone interested in renewable energy projects on
contaminated lands and mining sites
22
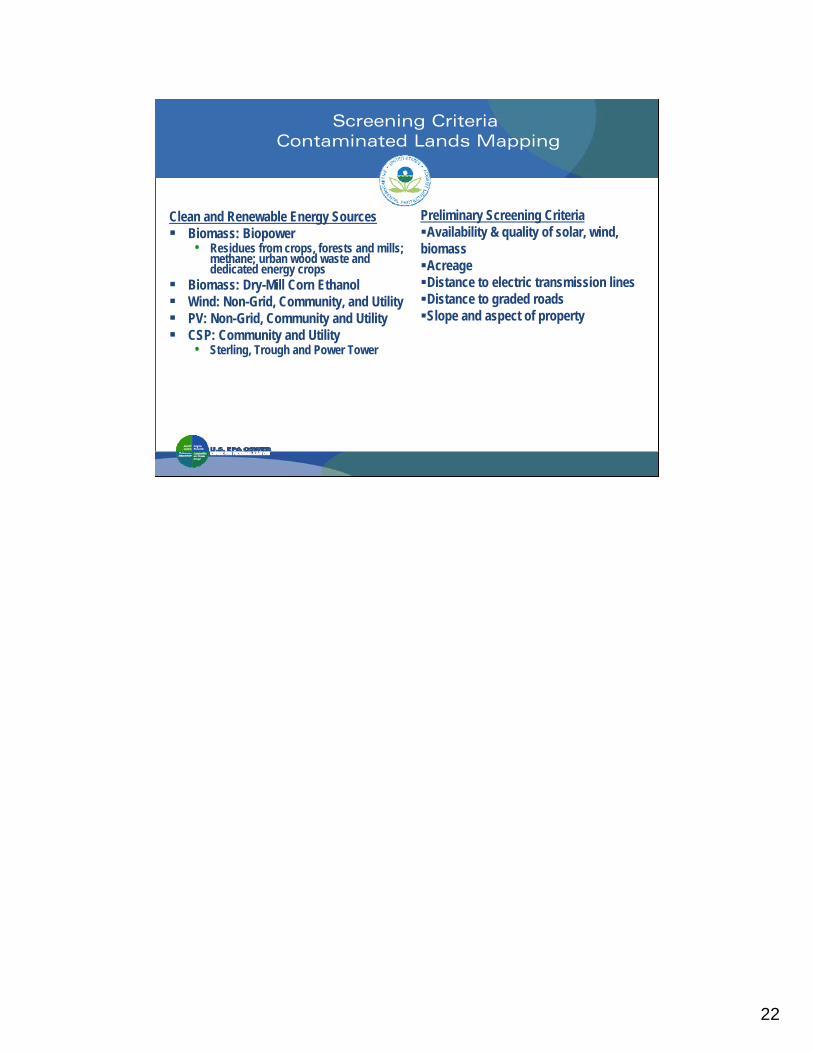
Screening CriteriaContaminated Lands Mapping
Clean and Renewable Energy SourcesBiomass: Biopower • Residues from crops, forests and mills;
methane; urban wood waste and dedicated energy crops
Biomass: Dry-Mill Corn EthanolWind: Non-Grid, Community, and UtilityPV: Non-Grid, Community and UtilityCSP: Community and Utility• Sterling, Trough and Power Tower
Preliminary Screening CriteriaAvailability & quality of solar, wind,
biomassAcreageDistance to electric transmission linesDistance to graded roadsSlope and aspect of property
23
24
24
25
25

26
26

27
Cannon AFB27
28
White Sands Missile Range28

29
Utility-Scale Solar & Wind Potential
~ 5.2 million acres of EPA-tracked land are located in an area with the highest solar resource potential If developed for utility-scale photovoltaic and concentrating solar power
yield an electricity capacity more than 919,000 MW and a GHG emission reduction of approximately 2,169 MMTCO2E
~ 580,000 acres of EPA-tracked land are located in an area with the highest wind resource potential If developed for utility-scale and community-scale wind power,
it would yield an electricity capacity more than 17,000 MW and a GHG emission reduction of approximately 39 MMTCO2E
30
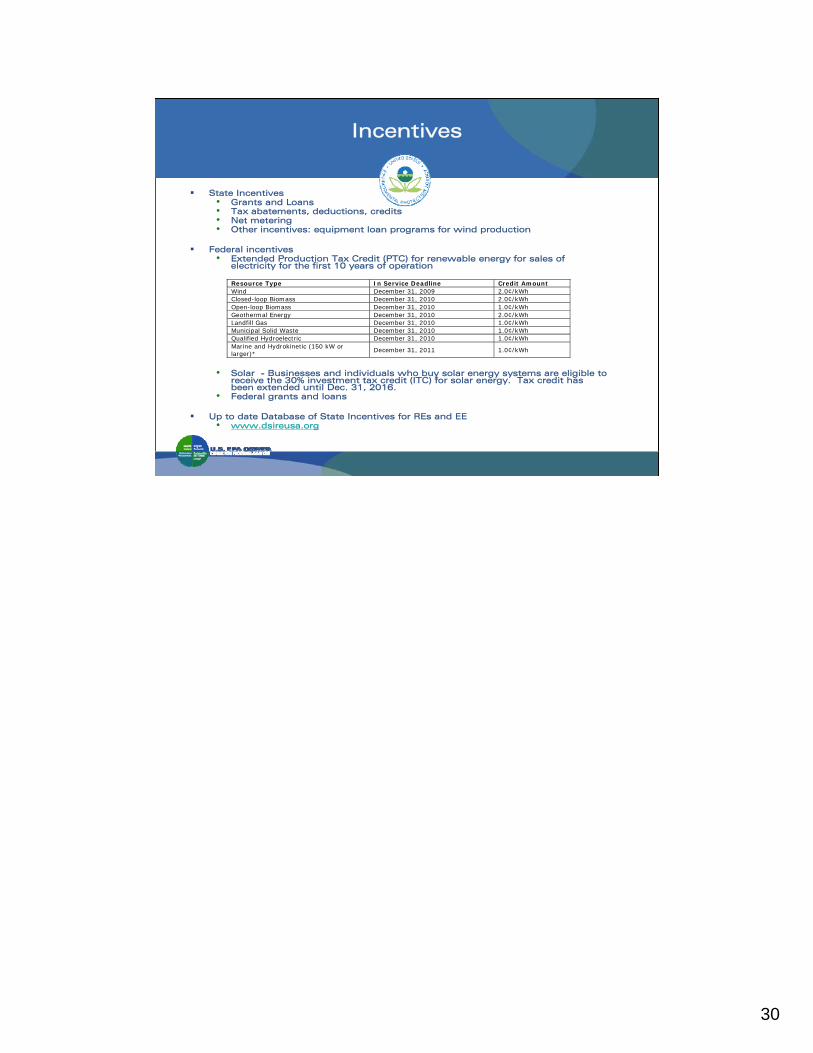
Incentives
State Incentives• Grants and Loans• Tax abatements, deductions, credits• Net metering• Other incentives: equipment loan programs for wind production
Federal incentives• Extended Production Tax Credit (PTC) for renewable energy for sales of
electricity for the first 10 years of operation
• Solar - Businesses and individuals who buy solar energy systems are eligible to receive the 30% investment tax credit (ITC) for solar energy. Tax credit has been extended until Dec. 31, 2016.
• Federal grants and loans
Up to date Database of State Incentives for REs and EE• www.dsireusa.org
Resource Type In Service Deadline Credit Amount Wind December 31, 2009 2.0¢/kWh Closed-loop Biomass December 31, 2010 2.0¢/kWh Open-loop Biomass December 31, 2010 1.0¢/kWh Geothermal Energy December 31, 2010 2.0¢/kWh Landfill Gas December 31, 2010 1.0¢/kWh Municipal Solid Waste December 31, 2010 1.0¢/kWh Qualified Hydroelectric December 31, 2010 1.0¢/kWh Marine and Hydrokinetic (150 kW or larger)*
December 31, 2011 1.0¢/kWh

31
32
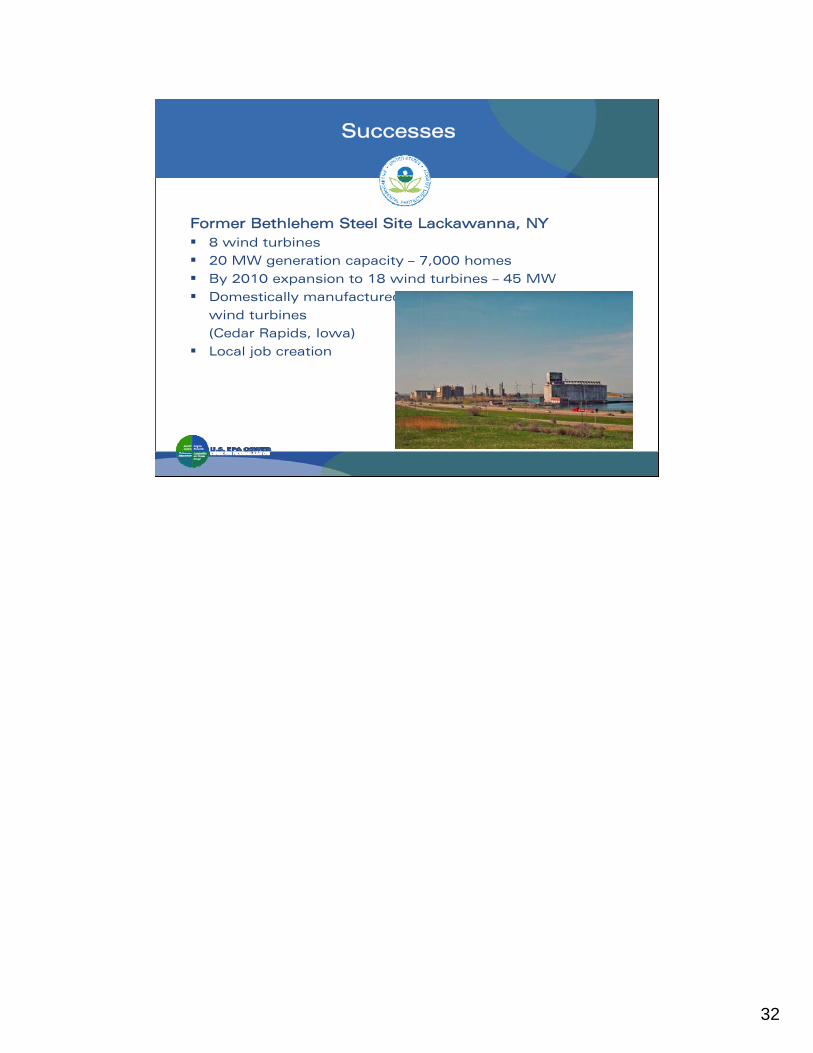
Successes
Former Bethlehem Steel Site Lackawanna, NY8 wind turbines20 MW generation capacity – 7,000 homesBy 2010 expansion to 18 wind turbines – 45 MWDomestically manufacturedwind turbines(Cedar Rapids, Iowa)Local job creation

33
Successes
Fort Carson, Colorado2 MW solar array on 12-acre landfillProduces 3,200 MW-hrs of electricity each yearFort Carson purchases electricity produced from the array at a fixed rate of 5.5 cents per kW-hr for the duration of a 17-year contractExpected savings of $500,000 in electricity costs during the contract life

34
Successes
Summitville Mine Site, ColoradoMico-hydroelectric plant Will generate 250,000-290,000 kW-hr/yr• enough to power about 25
households• prevent 250 – 275 metric tons of
CO2 from being released into the atmosphere every year
Enough power to operate the new on-site treatment plant,The treatment of acid-mine drainage will be a zero-net energy operation Power generated by the hydro plant will be fed back into the Xcel Energy grid through a net metering agreement and will be used to offset the cost of power usage required for water treatment
35
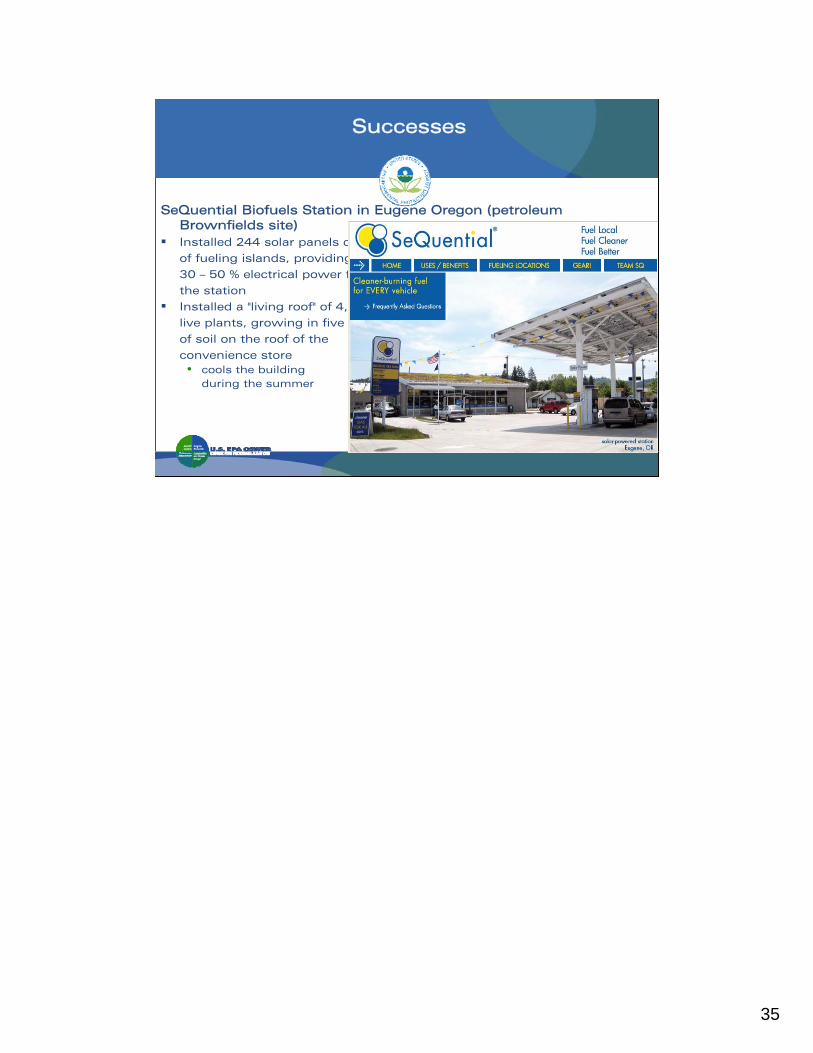
SeQuential Biofuels Station in Eugene Oregon (petroleum Brownfields site)Installed 244 solar panels on roof of fueling islands, providing 30 – 50 % electrical power for the stationInstalled a "living roof" of 4,800 live plants, growing in five inches of soil on the roof of the convenience store • cools the building
during the summer
Successes
36
Successes
Holmes Road Landfill Solar Field, Houston TXRevitalization of a 300-acre former landfill site located near downtown Houston
EPA awarded a $50k grant to assess solar energy production• Evaluating various environmental, engineering, and
regulatory issues involved in the project• Conducting a solar energy production and financial
feasibility study

37
Next Steps
Mapping tools• State sites• Landfill methane• Coalbed methane• Transmission capacity
Partnerships• Continue to develop key partnerships between Federal and State
organizations, and private entitiesResources• Brownfields funds• Office of Solid Waste and Emergency Response (OSWER) – National
Renewable Energy Laboratory (NREL) Interagency AgreementDocument ongoing and future successesTechnical and Regulatory Guide to Siting REs on Contaminated Lands

38
Contacts
Contacts for Contract Toolkit
Carlos PachonOffice of Superfund Remediation andTechnology Innovation, OSWER [email protected](703) 603-9904
Penelope McDanielCenter for Program Analysis, [email protected](202) 566-1932
Contacts for Renewable Energy Development
Penelope McDanielCenter for Program Analysis, [email protected](202) 566-1932
Stephen HoffmanOffice of Superfund Remediation andTechnology Innovation, OSWER [email protected]
Or, email us at:[email protected]

39
More Information
Renewable Energy on Contaminated Lands and Mining Sites:
http://www.epa.gov/renewableenergyland
Further information: [email protected]

40
Green Remediation Green Remediation TechnologyTechnologySolar Panels at Solar Panels at PemacoPemaco
Rose Marie CarawayRose Marie CarawayUSEPA Region 9, San Francisco, CAUSEPA Region 9, San Francisco, CA
41
Pemaco Superfund SitePemaco Superfund Site
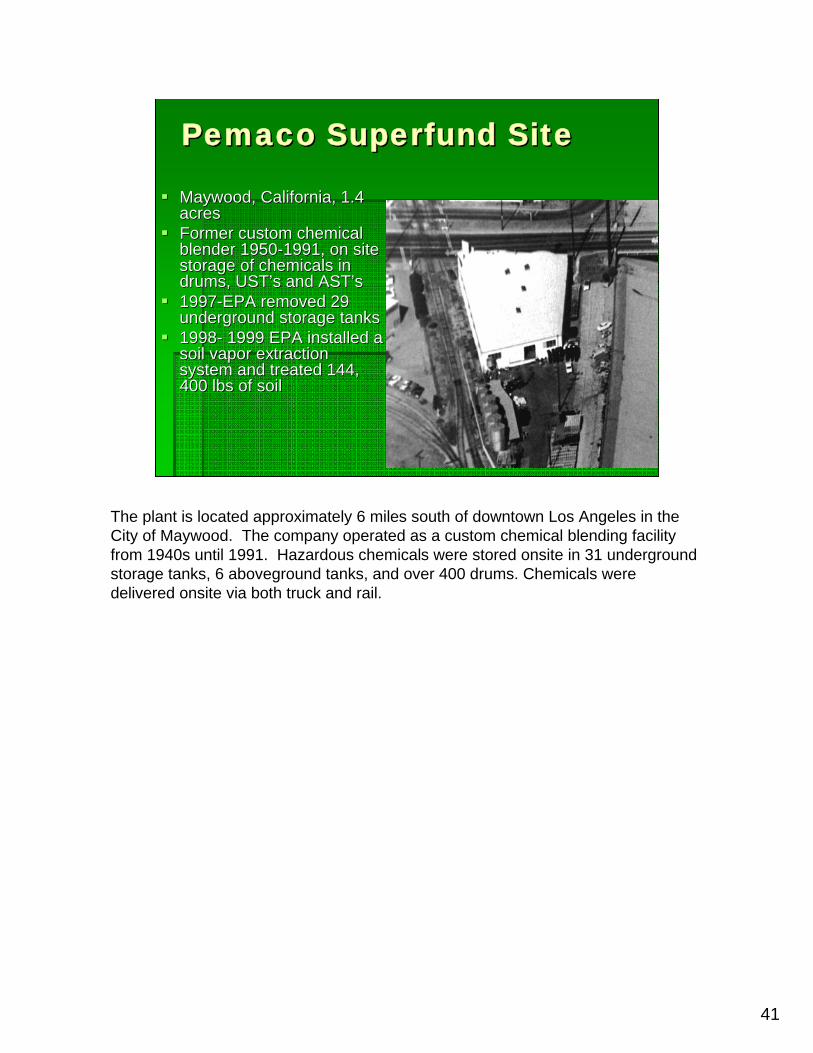
Maywood, California, 1.4 Maywood, California, 1.4 acresacresFormer custom chemical Former custom chemical blender 1950blender 1950--1991, on site 1991, on site storage of chemicals in storage of chemicals in drums, USTdrums, UST’’s and ASTs and AST’’ss19971997--EPA removed 29 EPA removed 29 underground storage tanksunderground storage tanks19981998-- 1999 EPA installed a 1999 EPA installed a soil vapor extraction soil vapor extraction system and treated 144, system and treated 144, 400 lbs of soil400 lbs of soil
The plant is located approximately 6 miles south of downtown Los Angeles in the City of Maywood. The company operated as a custom chemical blending facility from 1940s until 1991. Hazardous chemicals were stored onsite in 31 underground storage tanks, 6 aboveground tanks, and over 400 drums. Chemicals were delivered onsite via both truck and rail.

42
PemacoPemaco Superfund SiteSuperfund Site
Soil and groundwater contaminated with Soil and groundwater contaminated with Chlorinated Chlorinated solventsolventss(TCE(TCE) and other ) and other chemicals.chemicals.2005 ROD: Vapor and Groundwater P&T 2005 ROD: Vapor and Groundwater P&T system and Electrical Resistance Heating system and Electrical Resistance Heating (ERH) in source zone.(ERH) in source zone.Enhanced In Situ Bioremediation: stand alone Enhanced In Situ Bioremediation: stand alone for dissolved phase plume and polish for for dissolved phase plume and polish for source zone if needed after ERH Treatment. source zone if needed after ERH Treatment.

43
EPA conducted a removal in 1997 and Chemicals in tanks included alcohols, xylene, toluene, acetone, hexane, and other volatile organic compoundsChemicals in tanks included alcohols, xylene, toluene, acetone, hexane, and other volatile organic compounds.

44
Activities to DateActivities to Date20042004-- Remedial Investigation/Feasibility StudyRemedial Investigation/Feasibility Study20042004--Public Comment (April Public Comment (April –– September 2004)September 2004)20052005-- ROD addressing public comments signedROD addressing public comments signed20052005-- Construction on remedy beganConstruction on remedy began
Vapor and groundwater well installationVapor and groundwater well installationInstallation of conveyance piping to treatment plantInstallation of conveyance piping to treatment plant
2006 2006 –– Design of ERH SystemDesign of ERH SystemConstruction of treatment plantConstruction of treatment plantInstallation of ERH electrodes and temperature Installation of ERH electrodes and temperature monitoring well locationsmonitoring well locations
45
46
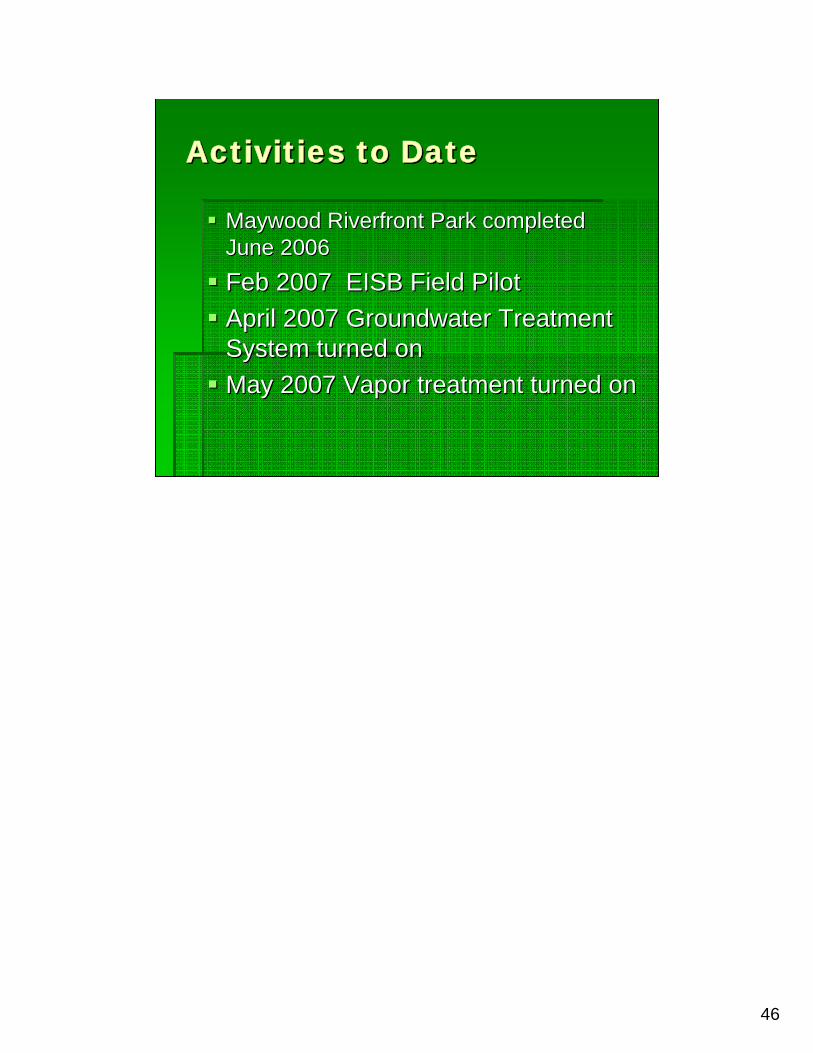
Activities to DateActivities to Date
Maywood Riverfront Park completed Maywood Riverfront Park completed June 2006June 2006FebFeb 2007 EISB Fiel2007 EISB Field d Pilot Pilot April 2007 Groundwater Treatment April 2007 Groundwater Treatment System turned onSystem turned onMay 2007 Vapor treatment turned onMay 2007 Vapor treatment turned on

47
Activities to DateActivities to Date
September 2007 turned on electricity to September 2007 turned on electricity to the ERH well fieldthe ERH well fieldApril 2008 turned off electricity in the April 2008 turned off electricity in the ERH well field after 200 days of heatingERH well field after 200 days of heatingOctober 2008 sampled October 2008 sampled ““hot soilshot soils”” in the in the ERH well field (postERH well field (post--treatment sampling).treatment sampling).

4848
“B” zone TCE groundwater plume (~85’ to 95’ bgs) – extends 1200’ downgradientfrom siteShallow Groundwater
(25 - 35 feet below ground surface) shallow plume extends 200 ft to southwest
32 Chemicals of Concern including vinyl chloride, benezene, PCE, TCE, and 1,4 dioxane in shallow groundwaterplume extends 1100 feet southwest of site22 contaminants which include:
TCE 22,000 ppb
vinyl chloride 780 ppbCis 1,2 DCE 14,000 ppbAcetone 20,000 ppb

49
Dimensions of Treatment Dimensions of Treatment BuildingBuilding
The southThe south--facing facing steel roof is 81steel roof is 81’’--44””long x 27long x 27’’--1111”” wide. wide. The roof pitch is 4:12 The roof pitch is 4:12 and the ridge is 20and the ridge is 20’’high. high. collateral load for collateral load for solar panels is 4.00 solar panels is 4.00 LB/SF. LB/SF.

50
System Design System Design
Carefully inventory all electrical Carefully inventory all electrical equipment in your facilityequipment in your facilityDetermine the power consumption of the Determine the power consumption of the equipment and hourly usage within a 24 equipment and hourly usage within a 24 hour periodhour periodSize a PV system that will match that Size a PV system that will match that energy usage based on the number of energy usage based on the number of "peak sun hours per day" for your locale "peak sun hours per day" for your locale

51
PemacoPemaco
Installed 3.4 kW Installed 3.4 kW photovoltaic systemphotovoltaic systemsystemsystem on July 3, on July 3, 20072007Produces about 5,600 Produces about 5,600 kWh / yrkWh / yrOffset about 3.3 tons Offset about 3.3 tons COCO22 per yearper year
2.5 acres trees2.5 acres trees7,600 car miles 7,600 car miles
Photo of the Pemaco building. It houses the Flameless Thermal Oxidation System and water and soil treatment plant. Maywood, CA in Los Angeles County.

52
InstallationInstallation
2 sets of Mounting 2 sets of Mounting tracks on south tracks on south facing rooffacing roof

53
InstallationInstallation
4 days to install4 days to install20 solar panels20 solar panels

54
InstallationInstallation
battery backup power will be used for battery backup power will be used for the computers, backup lighting, and the the computers, backup lighting, and the Treatment System in the event of a Treatment System in the event of a power failure to keep critical loads power failure to keep critical loads operating.operating.

55

56

57
Electrical panel installed inside control room. Xantrax Grid Tie Solar Inverter owner’s manual.

58

59

60

61

62

63
Energy UsageEnergy Usage
Monthly usage of electricity in the treatment plant. Solar energy has already been used by the system.

64
Cost of SystemCost of System
XantraxXantrax Grid Tie Solar Inverter Grid Tie Solar Inverter photovoltaic system $30,227photovoltaic system $30,227Average $9,000 rebate for systemAverage $9,000 rebate for systemBy July 5, 2008( one year operation) By July 5, 2008( one year operation) Solar panels generated 6172 kWh or 514 Solar panels generated 6172 kWh or 514 kWh per month.kWh per month.

65
Energy EstimatesEnergy Estimates
Examples from electrical bill shows the Examples from electrical bill shows the following:following:
5440 kWh payment to SCE = $2497.085440 kWh payment to SCE = $2497.08~.46/kWh so generating 6172 kWh for year ~.46/kWh so generating 6172 kWh for year saved approximately $2839 for year or saved approximately $2839 for year or $236.44 per month in energy charges.$236.44 per month in energy charges.

66
Lessons LearnedLessons Learned
Building placement and roof alignmentBuilding placement and roof alignmentSouthern exposure important in layout of Southern exposure important in layout of panels on roofpanels on roofMinimize shadowingMinimize shadowingSolar panels generated 5906 kWh/year Solar panels generated 5906 kWh/year as of June 21, 2008 or ~521 kWh/monthas of June 21, 2008 or ~521 kWh/monthSolar panels generated 6172 kWh as of Solar panels generated 6172 kWh as of July 5, 2008(operating one year). July 5, 2008(operating one year).
Placement of building on your site might change how you orient construction build-out on your site so that you get the best orientation to facilitate receiving the most energy into your system.

67
Lessons LearnedLessons Learned
Average usage of electricity inside the Average usage of electricity inside the treatment plant is equal to 126,741 treatment plant is equal to 126,741 kWh/monthkWh/monthCheck eligibility of solar system for Check eligibility of solar system for state sponsored rebatesstate sponsored rebates

68
Site Security affected decision on what type of Site Security affected decision on what type of system to installsystem to install

69

70
Maywood Riverfront Park – Opened in April 2008!

71
PEMACO SUPERFUND PEMACO SUPERFUND SITESITE
Contact InformationContact Information
Rose Marie Caraway, MBARose Marie Caraway, MBARemedial Project Manager/Environmental ScientistRemedial Project Manager/Environmental Scientist
U.S. Environmental Protection AgencyU.S. Environmental Protection Agency75 Hawthorne Street, SFD 775 Hawthorne Street, SFD 7--22
San Francisco, CA 94105San Francisco, CA 94105415 972 3158415 972 3158

72
Groundwater Pump & Groundwater Pump & Treat Pilot Study Using Treat Pilot Study Using
Alternative Energy Alternative Energy K. David Drake, K. David Drake,
USEPA Region 7, Kansas City, KSUSEPA Region 7, Kansas City, KS

73
Project OverviewProject Overview
ShortShort--term pilot study evaluating cost term pilot study evaluating cost savings of alternative wind power.savings of alternative wind power.Project duration of one year funded at Project duration of one year funded at $300,000.$300,000.Multiple organizations participating: EPA; Multiple organizations participating: EPA; Army Corps of Engineers, University of Army Corps of Engineers, University of MissouriMissouri--Rolla, Bergy Wind Systems, Inc.Rolla, Bergy Wind Systems, Inc.

74
Study GoalsStudy Goals
Quantify the reduction of power Quantify the reduction of power requirements by comparison with historic requirements by comparison with historic power use data. power use data. Calculate the mass of VOCs removed Calculate the mass of VOCs removed during the demonstration period.during the demonstration period.Identify system enhancements and Identify system enhancements and recommend new followrecommend new follow--on studies.on studies.

75
System DetailsSystem Details
10 kilowatt wind turbine with grid10 kilowatt wind turbine with grid--interinter--tie tie system.system.100 foot lattice tower with guy wires and 100 foot lattice tower with guy wires and warning lights.warning lights.Groundwater circulation well (GCW) for Groundwater circulation well (GCW) for water conservation. water conservation.

76

77
A Green TechnologyA Green Technology
Renewable wind energy powers the Renewable wind energy powers the system with potential netsystem with potential net--metering and metering and solar/battery enhancements. solar/battery enhancements. Conservation of groundwater using GCW Conservation of groundwater using GCW approach.approach.Fossil fuels conserved and emissions Fossil fuels conserved and emissions reduced. reduced.

78

79
Why Nebraska?Why Nebraska?
Favorable wind conditions Favorable wind conditions -- 14.4 mile per 14.4 mile per hour mean intensity. hour mean intensity.
Favorable Geology Favorable Geology -- highly transmissive highly transmissive Pleistocene sand and gravel deposits. Pleistocene sand and gravel deposits.
Many contaminated sites. Many contaminated sites.

80

81

82
Wind Energy FactsWind Energy Facts
Most rapid growing source of electricity Most rapid growing source of electricity and projected lowest cost within a decade. and projected lowest cost within a decade. 1/3 rd. of the U.S. has Class 3 or higher 1/3 rd. of the U.S. has Class 3 or higher wind intensity (Class 2 is the minimum). wind intensity (Class 2 is the minimum). Wind energy potential is proportional to Wind energy potential is proportional to velocity cubed (2 x v = 8 x power).velocity cubed (2 x v = 8 x power).

83
Nebraska Ordnance Plant SiteNebraska Ordnance Plant Site
17,000 acres in east17,000 acres in east--central Nebraska, central Nebraska, Saunders County.Saunders County.1942 1942 -- 1956, munitions production and 1956, munitions production and storage for WWII and Korean Conflict.storage for WWII and Korean Conflict.1959 1959 -- 1964, Atlas Missile construction 1964, Atlas Missile construction and maintenance. and maintenance. Four VOC and explosives plumes.Four VOC and explosives plumes.

84

85
Site Groundwater FactsSite Groundwater Facts
23 billion gallons of groundwater over 23 billion gallons of groundwater over 6,000 acres. 6,000 acres. 4 groundwater plumes (2 with explosives 4 groundwater plumes (2 with explosives and 2 with VOCs)and 2 with VOCs)Todd Valley, ancestral Platte River Stream Todd Valley, ancestral Platte River Stream Channel, 81 Channel, 81 -- 157 feet of alluvial 157 feet of alluvial overburden Pleistocene deposits. overburden Pleistocene deposits.

86
Historic GCW FactsHistoric GCW Facts
12 inch diameter well, 24 inch boring.12 inch diameter well, 24 inch boring.50 gallons per minute pump rate, 26 50 gallons per minute pump rate, 26 million gallons annually. million gallons annually. Annual power usage of 28,000 kilowatt Annual power usage of 28,000 kilowatt hours. hours. Annual power cost of $1,800.Annual power cost of $1,800.

87
Estimated Versus Actual Estimated Versus Actual SavingsSavings
36 % of GCW power demands expected to 36 % of GCW power demands expected to be met by alternative energy, 26% actual. be met by alternative energy, 26% actual. Estimated annual savings of $780 and the Estimated annual savings of $780 and the generation of 12,00 kWh, actual savings of generation of 12,00 kWh, actual savings of $547 and 8,422 kWh generated.$547 and 8,422 kWh generated.Total capital costs of $38,000 recovered in Total capital costs of $38,000 recovered in 69 years of operation versus 49 years 69 years of operation versus 49 years estimated. estimated.

88
30 Year Environmental Gains30 Year Environmental Gains
169 tons of greenhouse gasses 169 tons of greenhouse gasses eliminated.eliminated.
$16,400 power savings (not inflation $16,400 power savings (not inflation adjusted and $0.065 per kWh assumed). adjusted and $0.065 per kWh assumed).
$22,740 power savings (not inflation $22,740 power savings (not inflation adjusted and $0.09 kWh assumed). adjusted and $0.09 kWh assumed).

89

90

91

92

93

94

95

96

97

98

99

100

101

102

103

104

105

106
Thank YouAfter viewing the links to additional resources,
please complete our online feedback form.
Thank You
Links to Additional Resources
Feedback Form


