ASSESSMENT OF AMPHIBIAN RESPONSE TO WETLANDS AUGMENTATION Final Report Submitted to: St. Johns River Water Management District By: Ryan C. Means and Rebecca P.M. Means Coastal Plains Institute and Land Conservancy 2008
Transcript
ASSESSMENT OF AMPHIBIAN RESPONSE
TO WETLANDS AUGMENTATION
Final Report
Submitted to: St. Johns River Water Management District By: Ryan C. Means and Rebecca P.M. Means Coastal Plains Institute and Land Conservancy
EXECUTIVE SUMMARY This amphibian study is one component of a larger wetlands augmentation pilot study that took place within the St. Johns River Water Management District from 1998 through April 2008. The pilot study is part of a larger program entitled “Avoidance of Impacts and Alternative Water Supply Strategies in the St. Johns River Water Management District.” The pilot study was designed to evaluate the effects, costs, and benefits of applying supplemental water to wetlands impacted by municipal groundwater withdrawal. The feasibility of using wetlands augmentation and water retention techniques as impact avoidance tools was investigated. The objective of this, the amphibian monitoring portion of the study, was to determine possible impacts on amphibians of either actively or passively applying supplemental water to wetlands. There were a total of four study sites within this project: Tillman Ridge Wellfield, St Johns County (TR); Bennett Swamp, Volusia County (BS); Port Orange Wellfield, Volusia County (PO); Parkland Wetland, City of Titusville Wellfield, Brevard County (PW). TR and PO were active hydration sites, and BS and PW were passive hydration sites. Data collection took place at all sites both before and after augmentation of experimental wetlands. Two years (1999 and 2000) of baseline (pre-augmentation) amphibian data were collected and reported at Port Orange Wellfield (PO), Bennett Swamp (BS), and Parkland Wetland (PW); and four months of baseline data were reported for Tillman Ridge (TR) (Franz and Means 2001; Means and Franz 2005; Means 2001). Four years of post-augmentation data were collected from TR and PW. Four and a half years of post-augmentation data were collected from BS. Five years of post-augmentation data were collected from PO. At the actively hydrated TR study site, amphibian activity in both the experimental and control wetlands was positively correlated with rainfall and water residency time. Species diversity increased during periods of increased rainfall and decreased during periods of drought and wetland dryness. Results from a Bray-Curtis similarity index indicated that the similarity of the amphibian communities between the experimental and control ponds did not change appreciably between baseline and hydration periods. Water levels of experimental and control wetlands were below the surface during the entire four month baseline period, but filled and dried several times during the four year hydration period. Area climate during the four and a half year study was marked by extreme rainy periods or intense drought. CH2M Hill (2008b) reported that active hydration measurably increased water levels at the experimental wetland and that measured water quality parameters remained unchanged after hydration. Amphibian reproduction was consistently greater at the experimental wetland than at the control wetland during the hydration period. Reproductive results may reflect a beneficial effect of hydration on amphibian reproduction but we cannot say this definitively. We observed a diverse, healthy, and successfully reproducing amphibian fauna for over four years at the experimental wetland; however, the contribution that active hydration made to these ecological metrics was inconclusive because of experimental and control wetland dryness
during baseline and study design constraints (brief baseline period). We observed no detrimental effects from the application of groundwater on the amphibian community at the experimental wetland during the study. At the passively hydrated BS study site, amphibian activity was positively correlated with rainfall and presence of water in the swamp. Species diversity and reproduction increased during periods of increased rainfall and available surface water and decreased during periods of drought and wetland dryness. Results from a Bray-Curtis similarity index showed that amphibian communities of the swamp were fairly similar between baseline and operational periods. Area climate during the six and a half year study was marked by extreme rainy periods or intense drought. By the last two and a half years of the project (concurrent with a severe drought), there were almost no amphibian captures. CPI scientists predict that amphibians will become active again (e.g. species diversity will increase) in the swamp basin when normal rainfall and swamp inundation return. CPI scientists observed a diverse, healthy, and successfully reproducing amphibian fauna during periods of available surface water in BS. CH2M Hill (2008b) reported that passive hydration measurably increased water levels of the swamp near the weir and that measured water quality parameters remained unchanged after the weir was installed. Results regarding the effect of passive hydration on amphibians were inconclusive because of study design constraints (lack of control wetland). Passive hydration appeared to have no detrimental effects on the amphibian community during this study. At the actively hydrated PO study site, amphibian activity primarily was positively correlated with rainfall at all wetlands, though some response to water residency time was also noted, particularly as hydroperiod approached zero near study’s end. Species diversity and reproduction increased during periods of increased rainfall and decreased during periods of drought and wetland dryness. Area climate during the seven year study was marked by extreme rainy periods or prolonged dry periods. Hydrological observations made by CPI of three additional control wetlands showed that the experimental and control wetlands all became inundated and dried synchronously during rainy and droughty periods, respectively. Results from a Bray-Curtis similarity index showed that the amphibian communities of the experimental and two control wetlands were similar during baseline and hydration period, which indicated that there was no measured effect of hydration on the amphibian community at the experimental wetland. The results suggest that the effects that hydration had on the experimental wetland were minor in comparison to rainfall and that hydration alone did not illicit a response by the amphibian community. CH2M Hill (2008b) reported that hydration coupled with increased rainfall resulted in higher water levels of the experimental wetland during the hydration period, and that rainfall was the dominant cause of the water level increase. CH2M Hill (2008b) also reported that measured water quality parameters remained unchanged after active hydration. Results regarding the effect of active hydration on amphibians were inconclusive because hydration itself did not have a significant enough effect on the experimental wetland to illicit a response in the amphibian community. CPI did not observe any detrimental effects on amphibian communities from the application of groundwater at the experimental wetland.
At the passively hydrated PW site, species richness of amphibian adults and larvae generally increased during rainy periods and decreased during dry periods in both the baseline and operational periods of the study. Observed amphibian communities were similar between baseline and operational periods. Results regarding the effect of passive hydration on amphibian communities at PW were inconclusive due to repeated occurrences of vandalism, lack of quantitative sampling, and study design constraints (lack of a control wetland). However, CPI scientists believe that amphibian fauna at the PW study site were not detrimentally affected by passive hydration. CH2M Hill (2008b) reported that passive hydration measurably increased water levels of the wetland during the hydration period, and that water quality parameters remained unchanged after weir installation.
PROJECT BACKGROUND 1 AUGMENTATION STUDY 1 AMPHIBIAN ASSESSMENT 3 CLARIFICATION OF TERMS 3 OBJECTIVES OF THE FINAL REPORT 4
TILLMAN RIDGE WELLFIELD 6
SITE DESCRIPTION 6 ACTIVE HYDRATION 6 METHODS 7 STATISTICS 8 RESULTS AND DISCUSSION 8 WEATHER 8 WETLAND HYDROPERIODS 9 EFFECTS OF AUGMENTATION ON THE EXPERIMENTAL WETLAND 9 EFFECTS OF AUGMENTATION ON AMPHIBIANS 10
BENNETT SWAMP 13
SITE DESCRIPTION 13 PASSIVE HYDRATION 14 METHODS 14 STATISTICS 14 RESULTS AND DISCUSSION 15 WEATHER 15 WETLAND HYDROPERIOD 15 EFFECTS OF PASSIVE HYDRATION ON BENNETT SWAMP 16 EFFECTS OF PASSIVE HYDRATION ON AMPHIBIANS 16
PORT ORANGE WELLFIELD 20
SITE DESCRIPTION 20 ACTIVE HYDRATION 21 METHODS 22 STATISTICS 22 RESULTS AND DISCUSSION 22 WEATHER 22 WETLAND HYDROPERIODS 23 EFFECTS OF AUGMENTATION ON THE EXPERIMENTAL WETLAND 23 EFFECTS OF AUGMENTATION ON AMPHIBIANS 24
SITE DESCRIPTION 28 PASSIVE HYDRATION 29 METHODS 29 RESULTS AND DISCUSSION 29 WEATHER 29 WETLAND HYDROPERIOD 30 EFFECTS OF PASSIVE HYDRATION ON PARKLAND WETLAND 30 EFFECTS OF PASSIVE HYDRATION ON AMPHIBIANS 30
OVERALL PROJECT DISCUSSION 31
SUMMARY 35
OVERALL CONCLUSIONS 35 RECOMMENDATIONS 35
REFERENCES 37
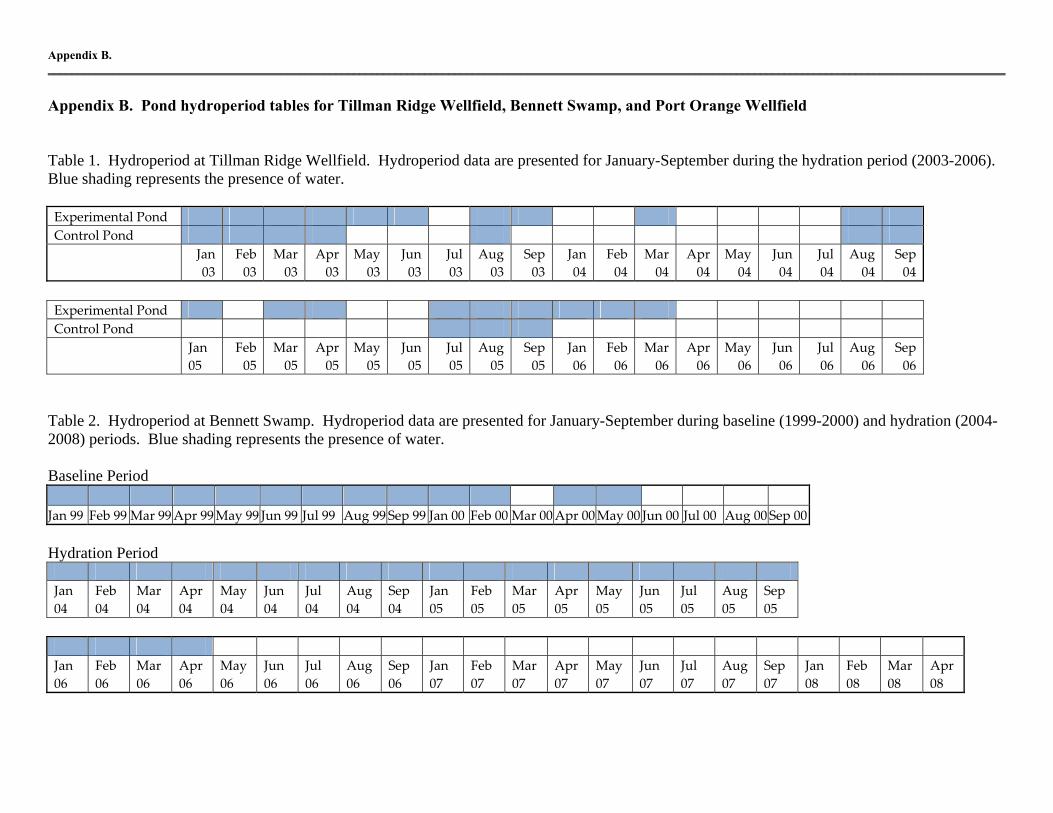
Appendix A. Site maps and photos Appendix B. Pond hydroperiod tables for Tillman Ridge Wellfield, Bennett Swamp, and Port
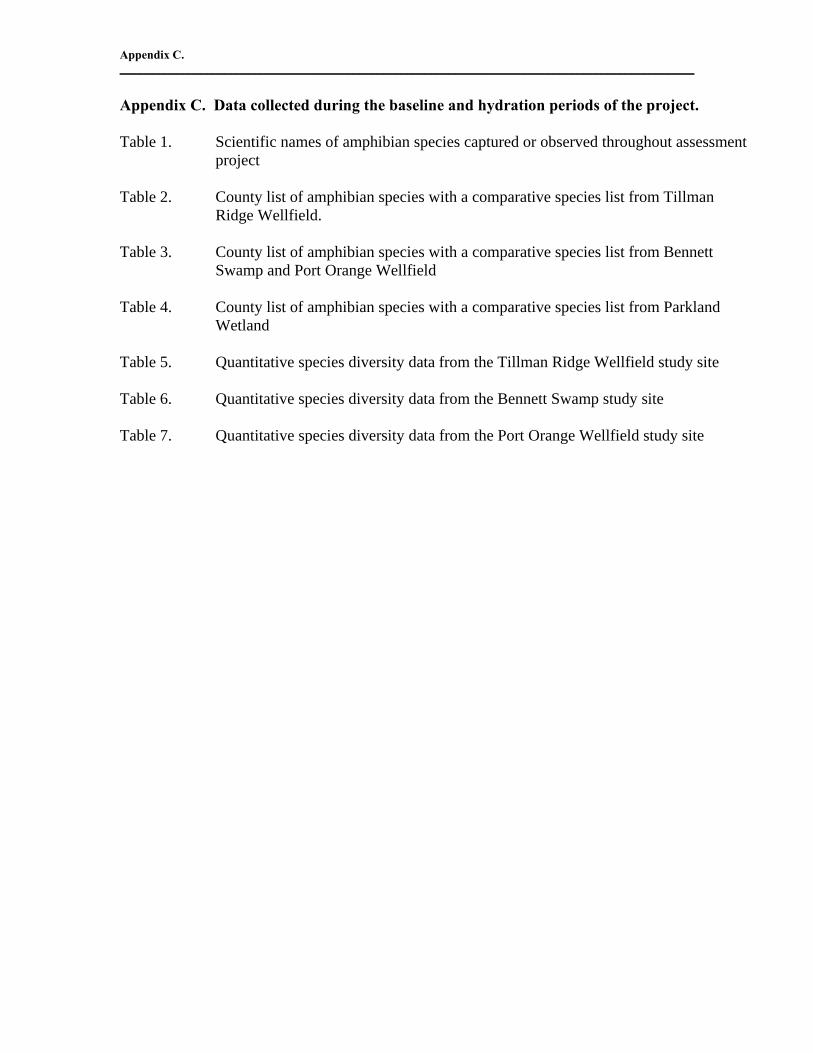
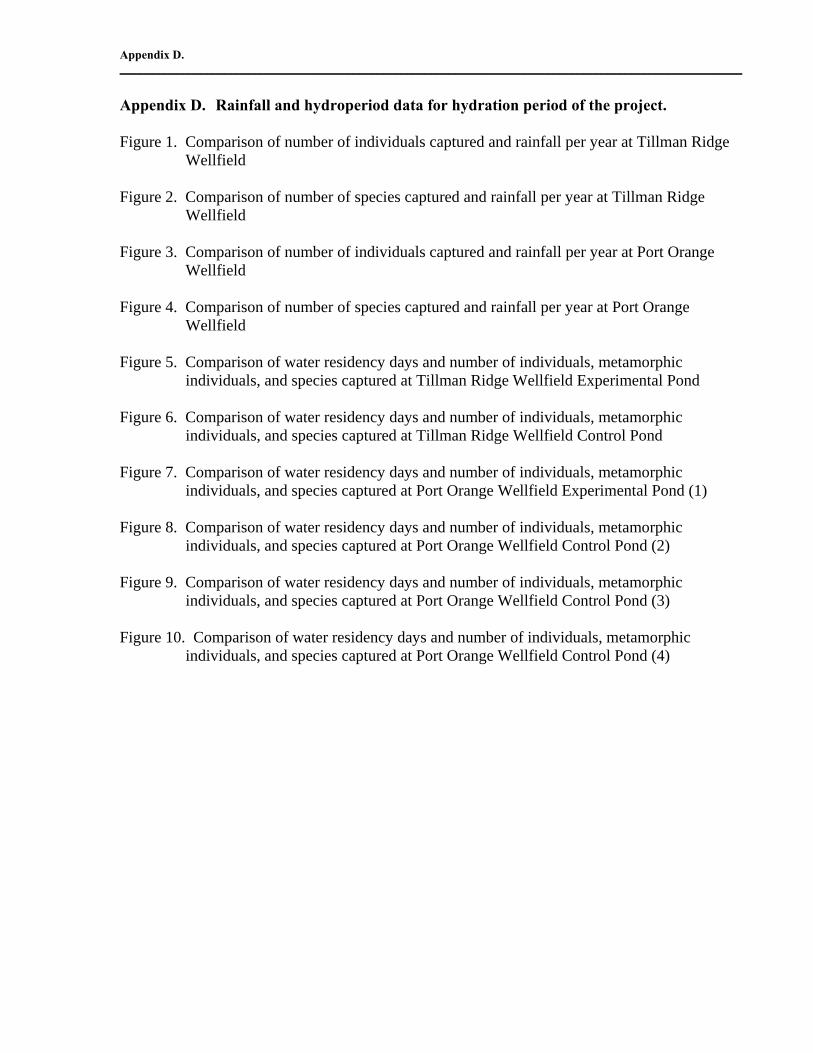
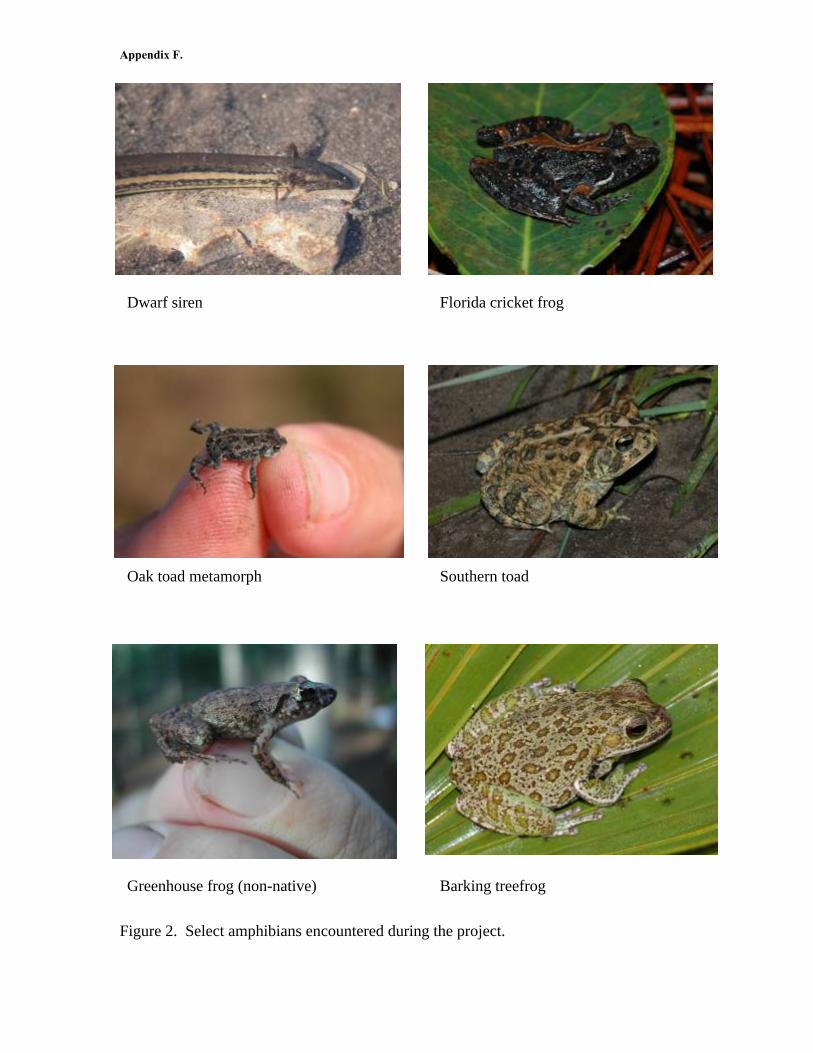
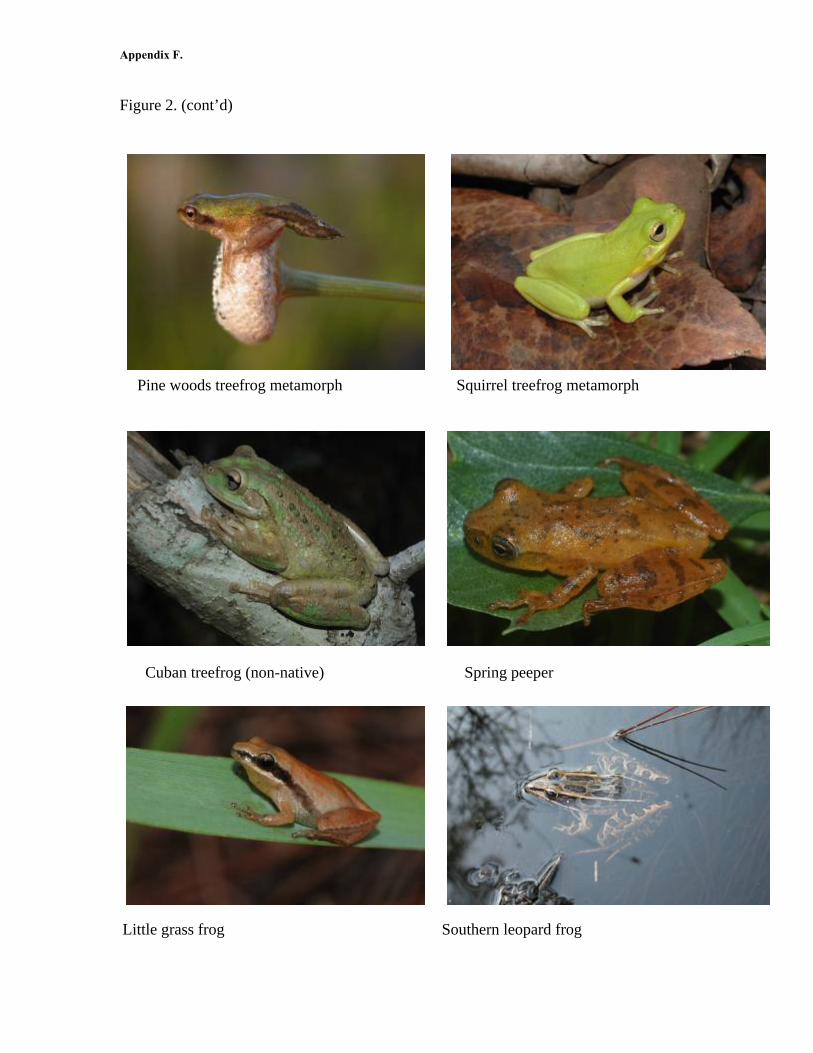
Orange Wellfield Appendix C. Data collected during the baseline and hydration periods of the project Appendix D. Rainfall and hydroperiod data for hydration period of the project Appendix E. Species diversity data and analyses for baseline and hydration periods Appendix F. Select amphibian photos Appendix G. CPI justifications for unincorporated comments by SJRWMD staff Appendix H. Amphibian augmentation database excel file provided as an attachment
LIST OF FIGURES Figure 1. Map of the study sites within the St. Johns River Water Management District..............2 Figure 2. Cluster dendrogram representing Bray-Curtis similarity among experimental and
control ponds at Tillman Ridge Wellfield during baseline and hydration periods. ...............10 Figure 3. Cluster dendrogram representing Bray-Curtis similarity between baseline and
operational periods at Bennett Swamp. .................................................................................. 17 Figure 4. Cluster dendrogram representing Bray-Curtis similarity among experimental and
control ponds at Port Orange Wellfield during baseline and hydration periods. ...................25 Figure 5. Multidimensional scaling plot representing Bray-Curtis similarity among experimental
and control ponds at Port Orange Wellfield during baseline and hydration periods. ............25
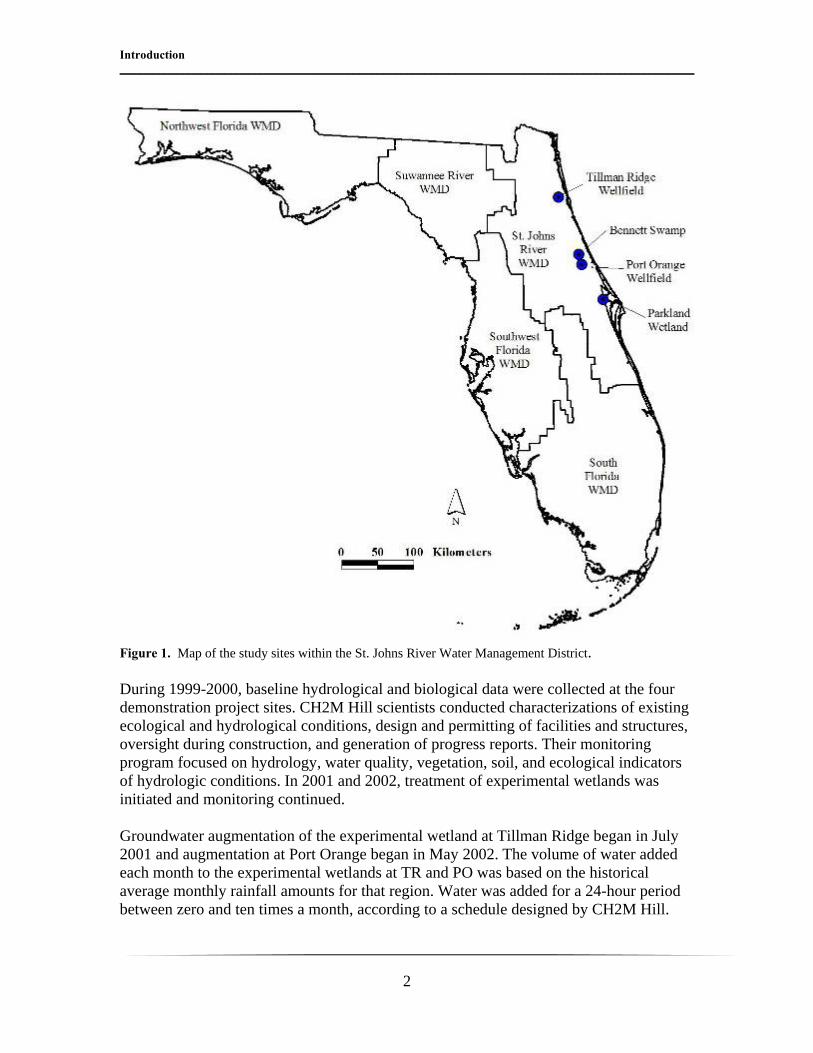
INTRODUCTION Project Background Groundwater is the primary source of freshwater for all uses in Florida (U.S. Geological Survey 1990). Billions of gallons of groundwater have been removed for human consumption over the years. As a result of such water withdrawal, the potentiometric surface of the Floridan Aquifer System has lowered over time. The hydrology and ecology of surface wetlands may become impacted by underlying aquifer level depressions, especially over the long-term. During the 1990’s, the St Johns River Water Management District (SJRWMD) assessed areas anticipated to develop critical water resource problems as a result of future ground water pumping (Vergara 1994, Vergara 1998). As one component of this assessment, areas in which native plant communities and wetlands were at risk from future ground water development were identified with the use of a GIS model. Many of these areas were found to be located near existing water supply wellfields. To reduce impacts to natural systems in these wellfields, the SJRWMD began investigating the environmental and economic feasibility of alternative water supply strategies to prevent or minimize environmental harm (CH2M Hill 1996). Augmentation Study One strategy for balancing impact and resource development is to compensate for altered hydrology by directly augmenting or otherwise managing water levels in affected or threatened wetlands (CH2M Hill 1997). To investigate this strategy, four demonstration projects were initiated in 1999. Two wetland augmentation and two water retention projects were recommended by the District’s primary contractor, CH2M Hill. At augmentation sites, an experimental wetland was chosen to be augmented with groundwater based on field observations of apparent impact. At water retention sites, a control weir was constructed to serve as a passive water retention system. The four sites from north to south are (Figure 1): Tillman Ridge Wellfield, St Johns County (TR) (active hydration) Bennett Swamp, Volusia County (BS) (passive hydration) Port Orange Wellfield, Volusia County (PO) (active hydration) Parkland Wetland, Titusville, Brevard County (PW) (passive hydration)
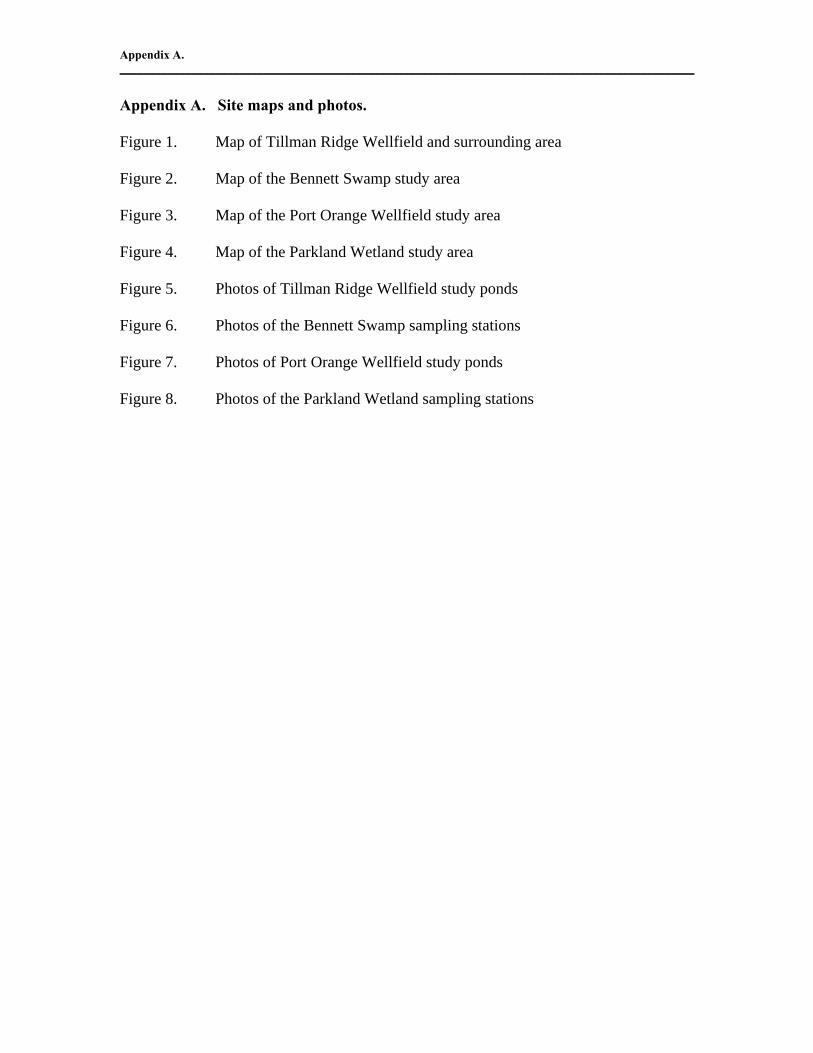
Figure 1. Map of the study sites within the St. Johns River Water Management District. During 1999-2000, baseline hydrological and biological data were collected at the four demonstration project sites. CH2M Hill scientists conducted characterizations of existing ecological and hydrological conditions, design and permitting of facilities and structures, oversight during construction, and generation of progress reports. Their monitoring program focused on hydrology, water quality, vegetation, soil, and ecological indicators of hydrologic conditions. In 2001 and 2002, treatment of experimental wetlands was initiated and monitoring continued. Groundwater augmentation of the experimental wetland at Tillman Ridge began in July 2001 and augmentation at Port Orange began in May 2002. The volume of water added each month to the experimental wetlands at TR and PO was based on the historical average monthly rainfall amounts for that region. Water was added for a 24-hour period between zero and ten times a month, according to a schedule designed by CH2M Hill.
During the hydration period, water delivery schedules were sometimes modified whenever necessary. A control weir at Parkland Wetland was constructed in a ditch draining out of the north side of the wetland and was operational beginning May 2002. A control weir at Bennett Swamp was constructed across Thayer Canal, on the east side of the study area in January of 2004. Thayer Canal is one of four main outflows of Bennett Swamp. The control weirs located at Bennett Swamp and Parkland Wetland were designed to be passive water retention systems (CH2M Hill 2008b). The objective was to retain more surface water within the systems for a longer duration without increasing flooding during major storm events. Water retention continued at BS through April 2008. Project operations at TR and PW concluded in 2006 and at PO in 2007. Hydrological results of this wetlands augmentation pilot study are fully discussed in the latest project annual reports by CH2M Hill (2006, 2007a, 2007b, 2008). A summary of final hydrological results from this project can be found in (CH2M Hill 2008b). Amphibian Assessment University of Florida biologists L. Richard Franz and Ryan C. Means were contracted to monitor amphibians and evaluate amphibian species diversity at all sites during baseline (1999 and 2000). The baseline period is fully discussed in Means (2001) and Means and Franz (2005). The Coastal Plains Institute (CPI) was contracted to continue amphibian monitoring during the five and a half year operational period (2003-2008). Results from the operational period are fully discussed in annual reports generated by CPI (Means and Meegan 2003, 2004, 2005; Means 2006, 2007, 2008). The amphibian study was undertaken because the SJRWMD wanted to investigate and assess any possible effects wetlands treatments may have on amphibians. Amphibians were selected as a study focus in the augmentation/retention demonstration projects because of their sensitivity to water quality changes and their well-documented worldwide decline (Alford and Richards 1999, IUCN et al. 2004, Lannoo 2005). Many factors are responsible for amphibian declines. The loss and alteration of upland and wetland habitats is probably the most significant cause for declines in the Southeast (Dodd 1997, Means 2003). With habitat loss and worldwide species declines underway, the current study offered something beyond the obvious goal of assessing the amphibian response to wetlands augmentations. It offered the opportunity to obtain much needed long-term data on amphibians from a poorly sampled portion of the southeastern U.S., namely, northeast and east-central Florida. Clarification of Terms In this report, the term “active hydration” is a synonym for “augmentation.” The term “passive hydration” is a synonym for “water retention.” The terms “baseline” and “pre-augmentation” are considered synonyms. The terms “post-augmentation,” and “hydration period” are synonyms and are used for active hydration sites (Port Orange Wellfield and
Tillman Ridge Wellfield). “Operational period” refers to the post weir installation periods at Bennett Swamp and Parkland Wetland. The terms “wetland” and “pond” also are considered synonyms, and these two apply to both the TR and PO study sites only. “Water residency time” is considered synonymous to “hydroperiod” in this report. Synonymous terms are used throughout the report. Objectives of the Final Report The remainder of this report will summarize amphibian community activity at the four study sites over the past decade. Some pertinent results from the hydrological portion of this study conducted by CH2M Hill will be cited within this report to provide the reader with a coherent big picture of how amphibian results relate to hydrological results. Assessments of the effects of active and passive hydration on amphibians were inconclusive for various reasons in this study. Nevertheless, we present and analyze pertinent amphibian data from all sites and inform the reader why results were inconclusive. If the reader would like more detailed information within a given single project year, he/she is referred to an M.S. Thesis by Means (2001) and annual reports by Means and Meegan (2003, 2004, 2005) and Means (2006, 2007, 2008). The wetlands augmentation pilot study’s final project report by CH2M Hill (2008b) should be read in unison with this amphibian final report.
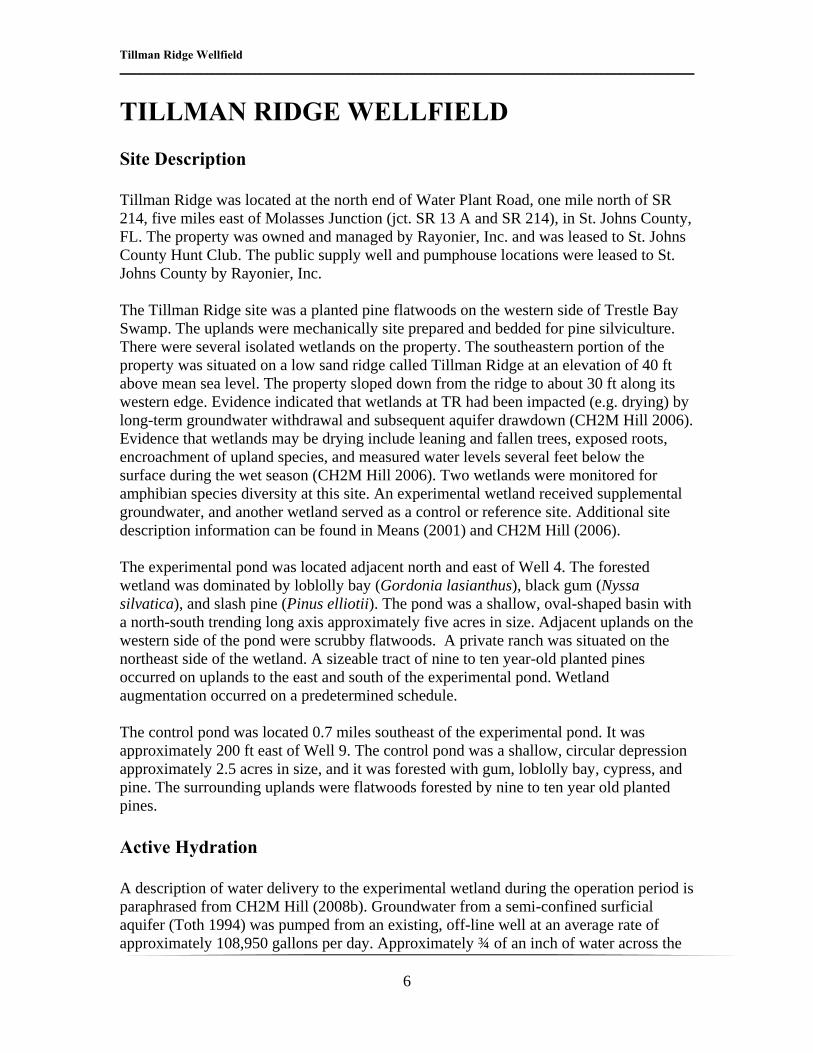
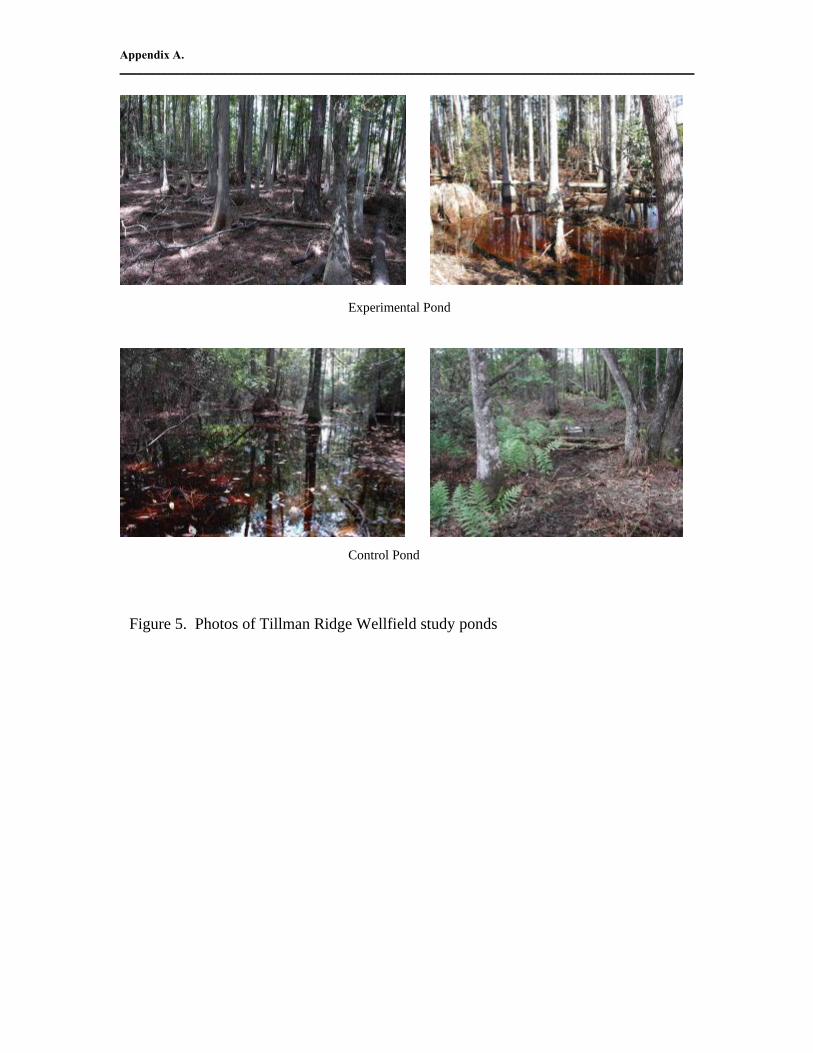
TILLMAN RIDGE WELLFIELD Site Description Tillman Ridge was located at the north end of Water Plant Road, one mile north of SR 214, five miles east of Molasses Junction (jct. SR 13 A and SR 214), in St. Johns County, FL. The property was owned and managed by Rayonier, Inc. and was leased to St. Johns County Hunt Club. The public supply well and pumphouse locations were leased to St. Johns County by Rayonier, Inc. The Tillman Ridge site was a planted pine flatwoods on the western side of Trestle Bay Swamp. The uplands were mechanically site prepared and bedded for pine silviculture. There were several isolated wetlands on the property. The southeastern portion of the property was situated on a low sand ridge called Tillman Ridge at an elevation of 40 ft above mean sea level. The property sloped down from the ridge to about 30 ft along its western edge. Evidence indicated that wetlands at TR had been impacted (e.g. drying) by long-term groundwater withdrawal and subsequent aquifer drawdown (CH2M Hill 2006). Evidence that wetlands may be drying include leaning and fallen trees, exposed roots, encroachment of upland species, and measured water levels several feet below the surface during the wet season (CH2M Hill 2006). Two wetlands were monitored for amphibian species diversity at this site. An experimental wetland received supplemental groundwater, and another wetland served as a control or reference site. Additional site description information can be found in Means (2001) and CH2M Hill (2006). The experimental pond was located adjacent north and east of Well 4. The forested wetland was dominated by loblolly bay (Gordonia lasianthus), black gum (Nyssa silvatica), and slash pine (Pinus elliotii). The pond was a shallow, oval-shaped basin with a north-south trending long axis approximately five acres in size. Adjacent uplands on the western side of the pond were scrubby flatwoods. A private ranch was situated on the northeast side of the wetland. A sizeable tract of nine to ten year-old planted pines occurred on uplands to the east and south of the experimental pond. Wetland augmentation occurred on a predetermined schedule. The control pond was located 0.7 miles southeast of the experimental pond. It was approximately 200 ft east of Well 9. The control pond was a shallow, circular depression approximately 2.5 acres in size, and it was forested with gum, loblolly bay, cypress, and pine. The surrounding uplands were flatwoods forested by nine to ten year old planted pines. Active Hydration A description of water delivery to the experimental wetland during the operation period is paraphrased from CH2M Hill (2008b). Groundwater from a semi-confined surficial aquifer (Toth 1994) was pumped from an existing, off-line well at an average rate of approximately 108,950 gallons per day. Approximately ¾ of an inch of water across the
five-acre wetland was delivered in a 24-hour period. Approximately eight million gallons per year were delivered to the wetland. The number of irrigation periods per month varied depending on a predetermined schedule. Hydration water was applied on a schedule that mimics the monthly average rainfall of the region. Because of the significantly low water levels in the wetland during the baseline period, an initial hydration amount equal to average annual rainfall was scheduled. Methods Amphibian monitoring methodology during the post-augmentation period was identical to baseline. The experimental and control wetlands were monitored identically for amphibian species diversity (richness and abundance). The control pond was selected on the basis of being botanically and hydrologically similar to the experimental pond. The size of the experimental pond was approximately two times larger than the control pond. At each pond, a total of four Y-shaped drift fence arrays modified from Bury and Corn (1987) were installed roughly equidistantly around the pond perimeter near the ordinary high water line. Drift fences consisted of three two-foot high strips of black siltation fencing. Each array strip or arm began seven meters from the midpoint and was approximately seven meters long. One arm pointed north and the others extended southeast and southwest such that the angle between all arms was 120 degrees. One screen funnel trap of standard size was placed at the ends of each drift fence strip for a total of 24 traps per pond (six traps per array, four arrays per pond = 24 traps per pond). Traps were operational for a standard seven night period during each month (January-September) and checked daily to reduce amphibian mortality. The monitoring week usually took place during the last week of each month. Aberrations from the standard monitoring schedule occurred only on rare occasions due to extenuating circumstances such as inclement weather or illness. Near each trap, one three-foot high 1.5” diameter PVC pipe was stood upright in the ground. Standing pipes acted as refugia (not traps) that attracted many treefrogs. Large numbers of tree frogs could be removed, captured and processed. Pipes were checked once during a sampling week. We felt that repeated pipe checks during a week may disturb frogs that take refuge in pipes and ultimately cause a reduction in numbers of treefrogs around wetlands. Individuals captured in drift fence arrays were non-uniquely marked by clipping the outer two toes from the right foot This was done to distinguish between new captures and recaptures to reduce sampling biases and keep sampling efforts equal between study ponds, only new captures from drift fence arrays were used for statistical analysis. Aural surveys were conducted to record breeding events during one night per sample week, dependent upon the presence of water in the ponds and heavy rains. Dipnetting also was conducted once per sample week to record the presence of larval amphibians whenever pond water levels permitted.
CH2M Hill scientists closely monitored water level fluctuations of the experimental wetland using piezometers and associated monitoring technology. CPI scientists recorded presence or absence of standing water in experimental and control wetland basins on a monthly basis. The experimental wetland was predetermined (CH2M Hill 1997), and the control pond was selected by University of Florida biologists at the outset of baseline amphibian monitoring (Means 2001). Monetary constraints at the outset of the project limited the number of control ponds to one, and initial lack of landowner access permission limited the length of baseline monitoring to four months (June-September 2000), instead of the desired two years. Statistics
PRIMER 6 software for MS Windows was used in the analysis of quantitative species diversity data from drift fence arrays (new captures only). The data were converted into captures per unit effort (CPUE) both in the pre and post-hydration periods in order to diminish the effects of comparing periods of unequal sampling duration. Raw data also were smoothed using square root transformation. The Bray-Curtis Similarity Index, widely used for ecological applications, was computed for each study wetland and sampling period. This index was used to compare amphibian community similarity between the two sites before and after active hydration. The Bray-Curtis Similarity Index is actually a distance measure of dissimilarity where coefficients are weighted toward abundant species, with rare species adding little to the value (Dodd in press). The measure of similarity is the reciprocal of the calculated value. Bray-Curtis results were visually displayed in a cluster dendrogram and used to interpret diversity changes in the post-augmentation period relative to baseline. A multidimensional scaling (MDS) plot also was used to graphically display Bray-Curtis results. Bray-Curtis does not measure statistical significance; however, it has proven extremely useful in assessing the effects of environmental change on herpetofauna and other taxa during monitoring studies (Pawar et al. 2004; Pieterson et al. 2006; Dodd et al. 2007). Dodd (in press) provides a complete description of the Bray-Curtis Similarity Index. Results and Discussion Weather Rainfall data were reported in CH2M Hill (2008b) and are utilized in this report. Average annual baseline period rainfall was 38.4 inches and increased to 48.7 inches during the hydration period (CH2M Hill 2008b). Although average annual rainfall increased significantly during the hydration period, the hydration period was near the historical annual average of approximately 50 inches. The entire study period saw extremes in weather conditions. It was dry and desert-like for the majority of the time punctuated by extreme rainfall events, most notably the intense tropical cyclone seasons of 2004 and 2005. Were it not for the tropical storm activity in those two years, the average annual rainfall measured during the hydration period would be appreciably less. Extreme rain
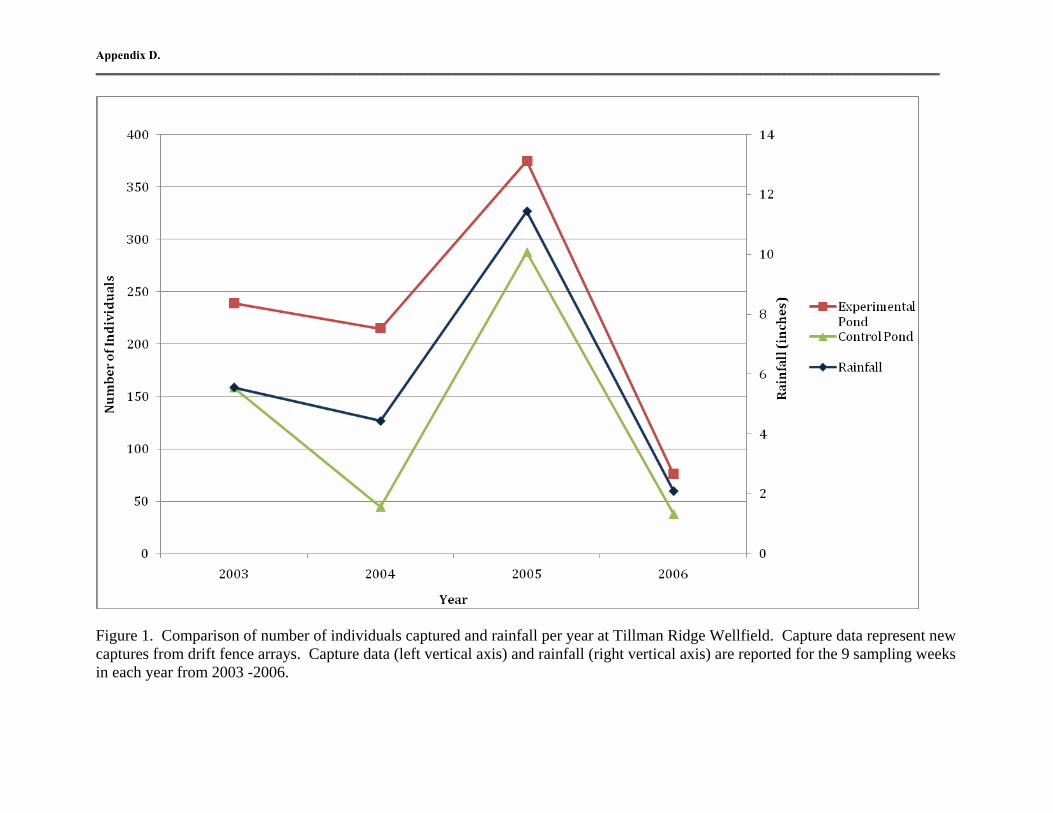
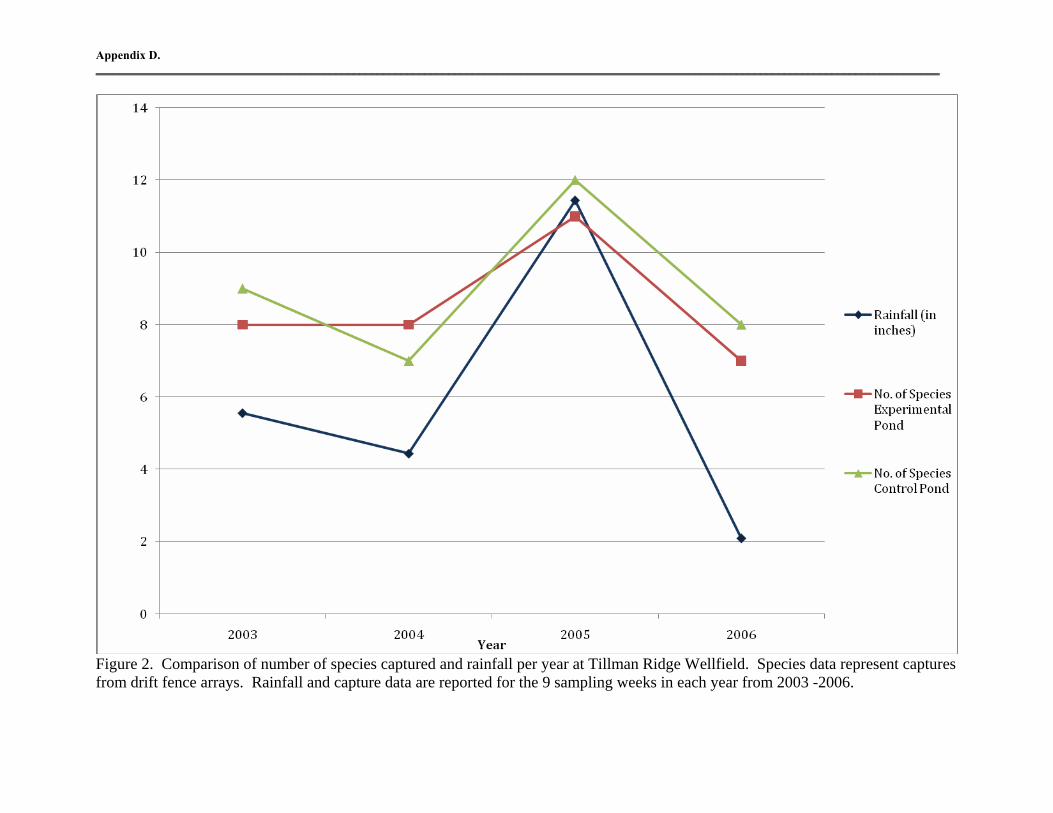
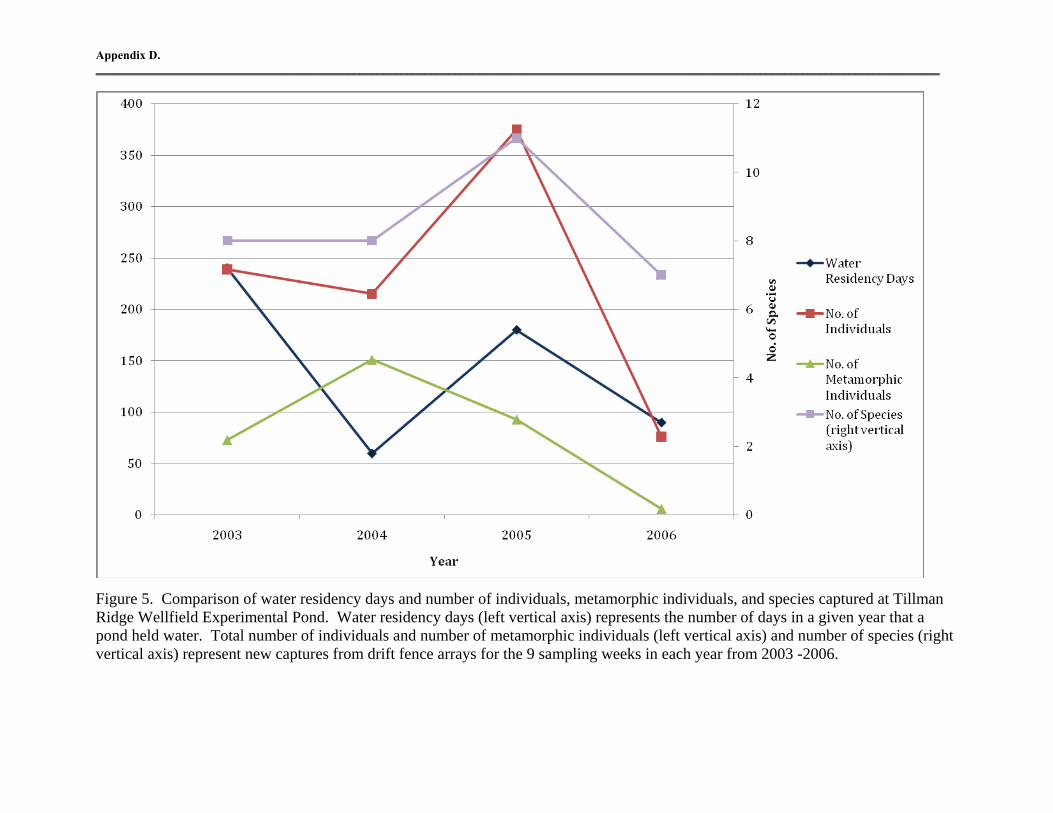
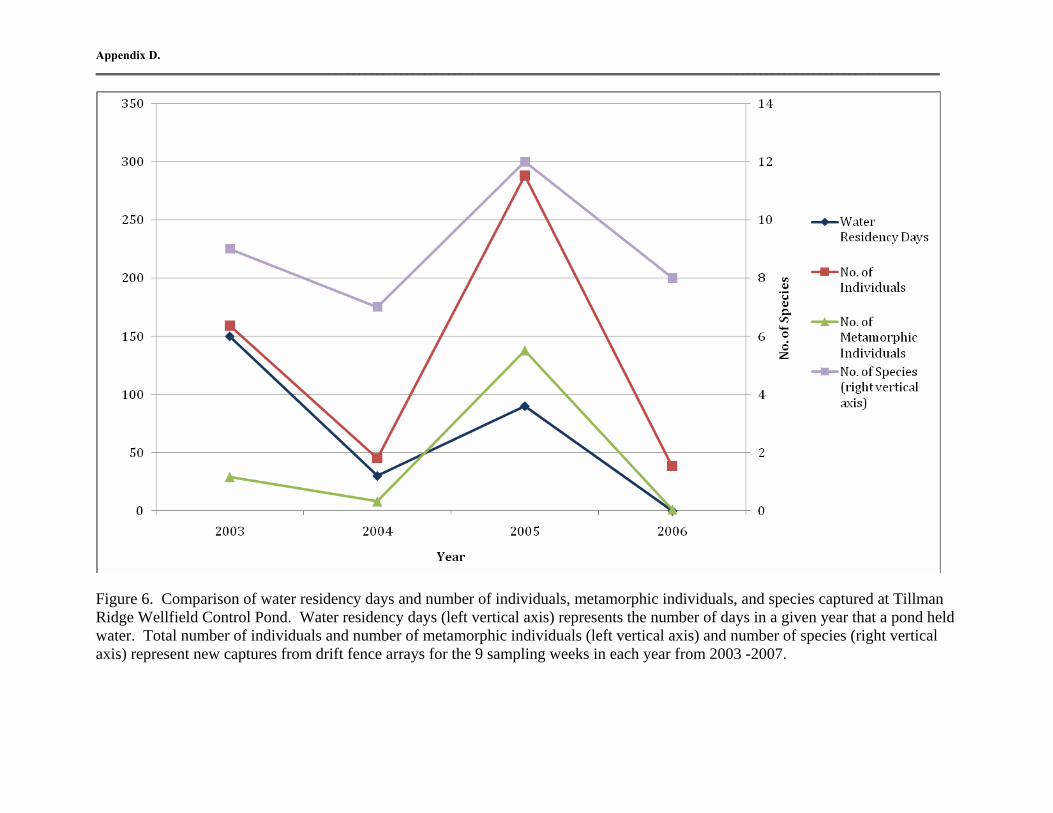
events often occurred when CPI was not actively amphibian monitoring either during the fall or between sampling weeks. Some heavy rainfalls occurred during monitoring weeks and were always accompanied by amphibian capture increases. Droughty conditions always resulted in relatively few captures. Appendix D, Figures 1 and 2 demonstrate the positive relationship between rainfall and amphibian species diversity at TR study wetlands during the hydration period. Amphibian richness and abundance at both study wetlands were positively correlated to rainfall. The correlation between amphibian activity and rainfall is a well-documented occurrence in amphibian ecology (Gibbons and Bennett 1974, Dodd 1995, R.P.M. Means 2008). Wetland Hydroperiods Both the experimental and control wetlands were dry during the four month baseline period (June-September 2000). During the hydration period, both ponds periodically filled and dried, but not always synchronously. The experimental pond typically held water for longer than the control pond during hydration. This difference may have resulted from active hydration. There were not enough baseline data for use as a reference frame to determine whether or not both ponds’ hydroperiods were similar before hydration of the experimental wetland. Appendix D, Figures 5 and 6 demonstrate the relationship of water residency days (number of days in a given year that a pond held water) to species richness, abundance, and to young (metamorphic) amphibian production. While not as strongly correlated as to rainfall, amphibian activity at both ponds was positively correlated to water residency days. These results indicate that amphibians primarily responded to rainfall and secondarily to water residency at TR. Effects of Augmentation on the Experimental Wetland Water levels increased in the wetland 5.7 feet during the hydration period compared to the baseline period (CH2M Hill 2008b). The hydration period had approximately ten inches more average annual rainfall than the baseline period. CH2M Hill (2008b) reports that active hydration played a role in the increase and its effects were very quickly realized at the Tillman Ridge site beginning in the first hydration year. Cumulative inputs from rainfall and active hydration had a greater effect on water levels during the hydration period than rainfall alone did during the baseline period (CH2M Hill 2008b). During active hydration periods when no rainfall occurred, water levels at the wetland piezometer increased an average of 0.03 feet per day. When no active hydration and no rainfall occurred, daily water levels fell during both the baseline period (-0.09 feet) and during all five hydration years (-0.13, -0.18, -0.06, -0.06, and -0.11 feet, respectively) (CH2M Hill (2008b). The application of groundwater did not significantly alter wetland water-quality
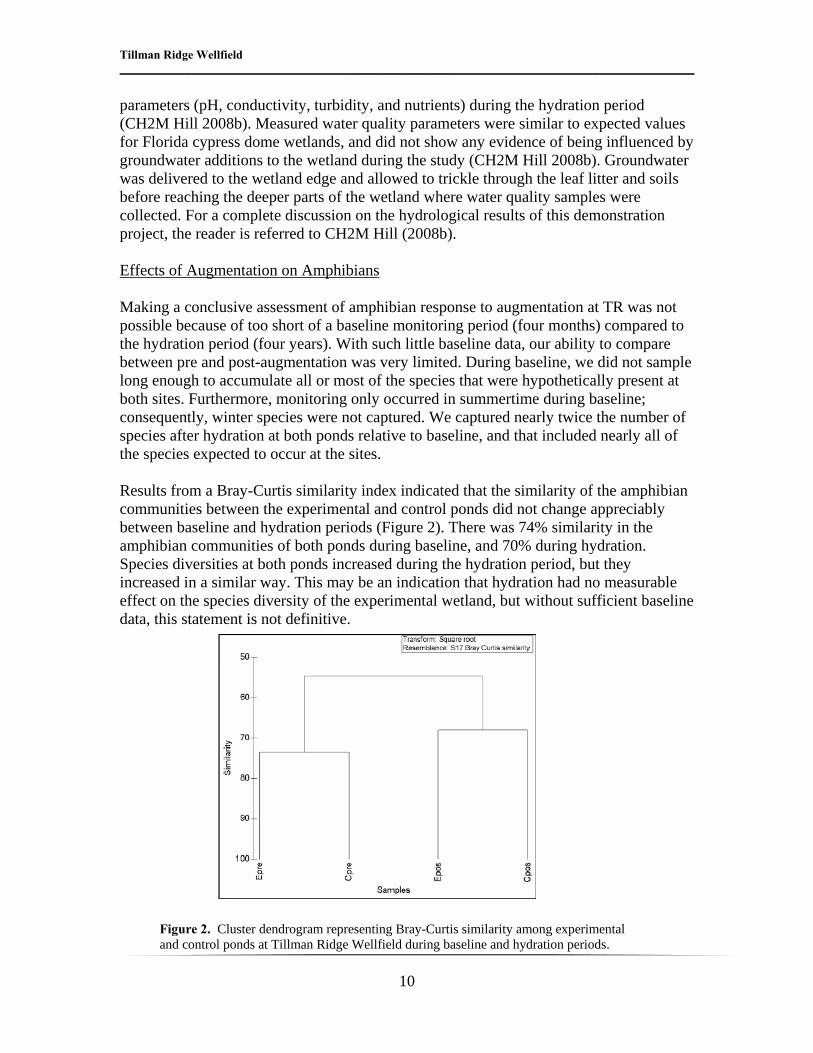
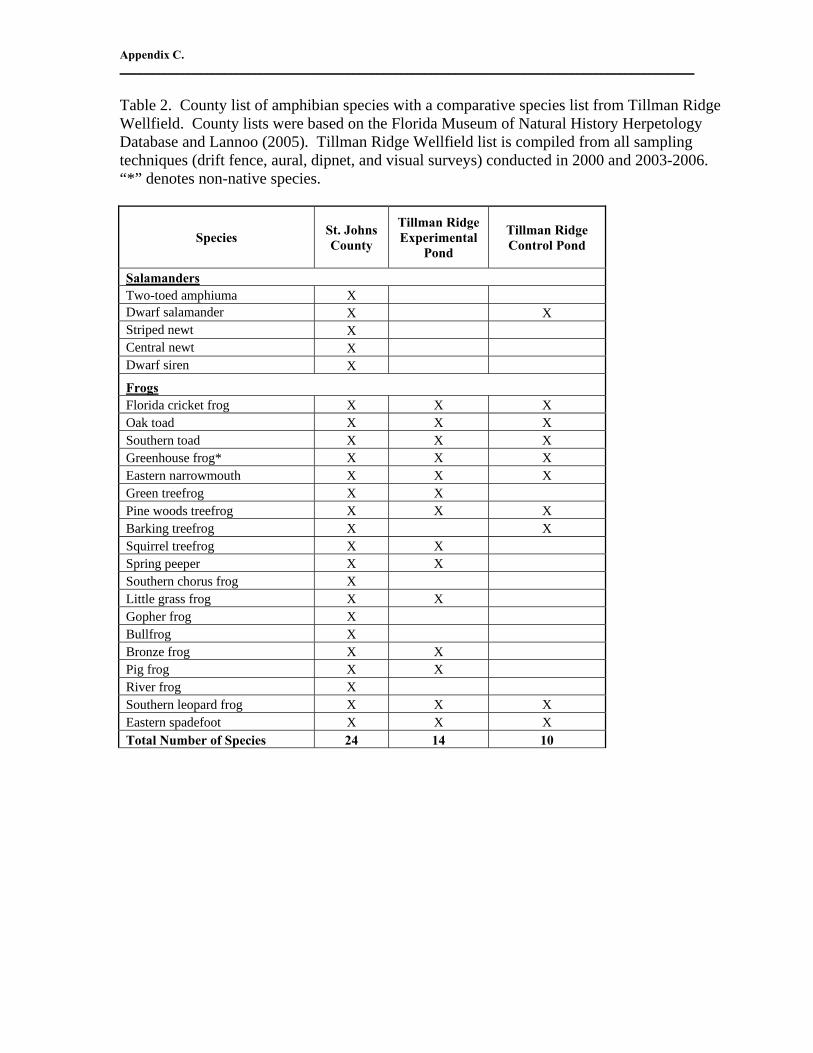
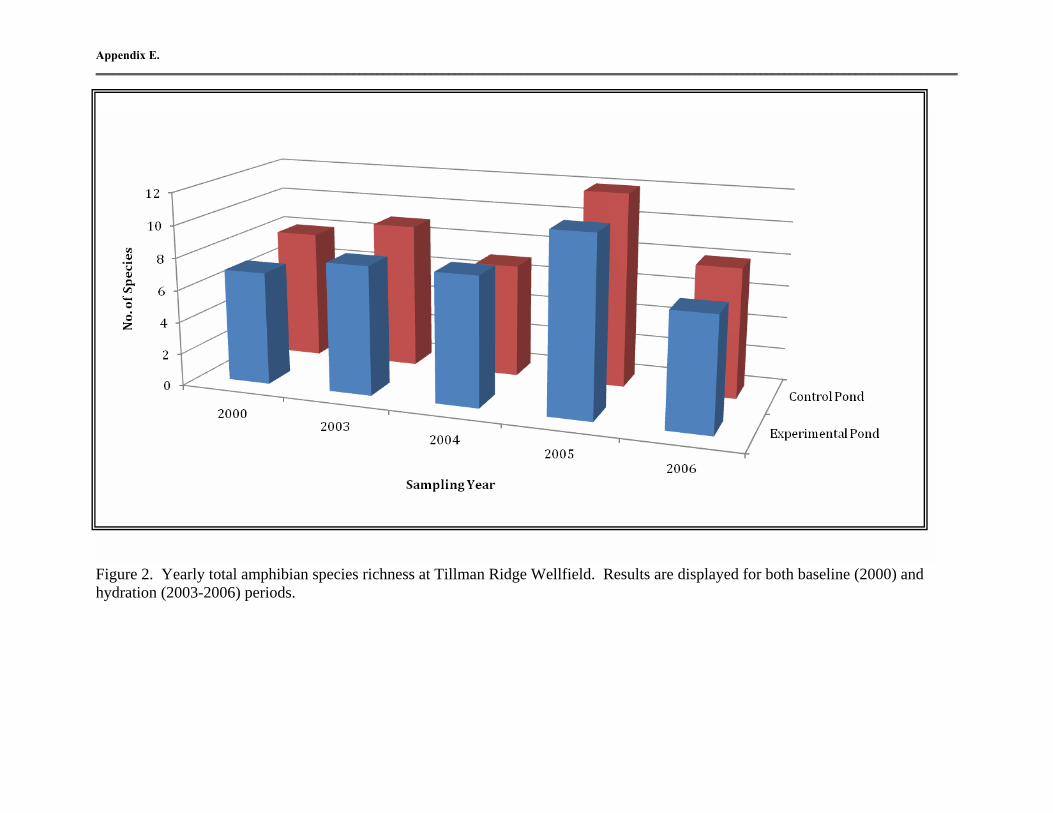
parameters (pH, conductivity, turbidity, and nutrients) during the hydration period (CH2M Hill 2008b). Measured water quality parameters were similar to expected values for Florida cypress dome wetlands, and did not show any evidence of being influenced by groundwater additions to the wetland during the study (CH2M Hill 2008b). Groundwater was delivered to the wetland edge and allowed to trickle through the leaf litter and soils before reaching the deeper parts of the wetland where water quality samples were collected. For a complete discussion on the hydrological results of this demonstration project, the reader is referred to CH2M Hill (2008b). Effects of Augmentation on Amphibians Making a conclusive assessment of amphibian response to augmentation at TR was not possible because of too short of a baseline monitoring period (four months) compared to the hydration period (four years). With such little baseline data, our ability to compare between pre and post-augmentation was very limited. During baseline, we did not sample long enough to accumulate all or most of the species that were hypothetically present at both sites. Furthermore, monitoring only occurred in summertime during baseline; consequently, winter species were not captured. We captured nearly twice the number of species after hydration at both ponds relative to baseline, and that included nearly all of the species expected to occur at the sites. Results from a Bray-Curtis similarity index indicated that the similarity of the amphibian communities between the experimental and control ponds did not change appreciably between baseline and hydration periods (Figure 2). There was 74% similarity in the amphibian communities of both ponds during baseline, and 70% during hydration. Species diversities at both ponds increased during the hydration period, but they increased in a similar way. This may be an indication that hydration had no measurable effect on the species diversity of the experimental wetland, but without sufficient baseline data, this statement is not definitive.
Figure 2. Cluster dendrogram representing Bray-Curtis similarity among experimental and control ponds at Tillman Ridge Wellfield during baseline and hydration periods.
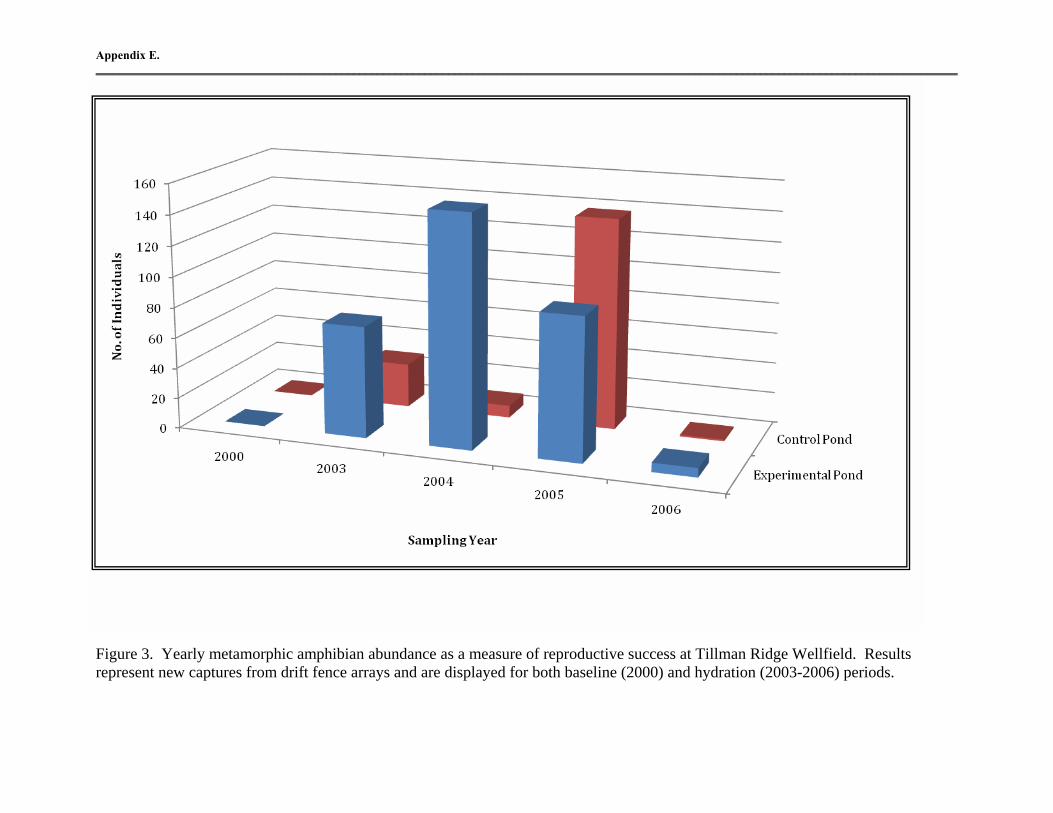
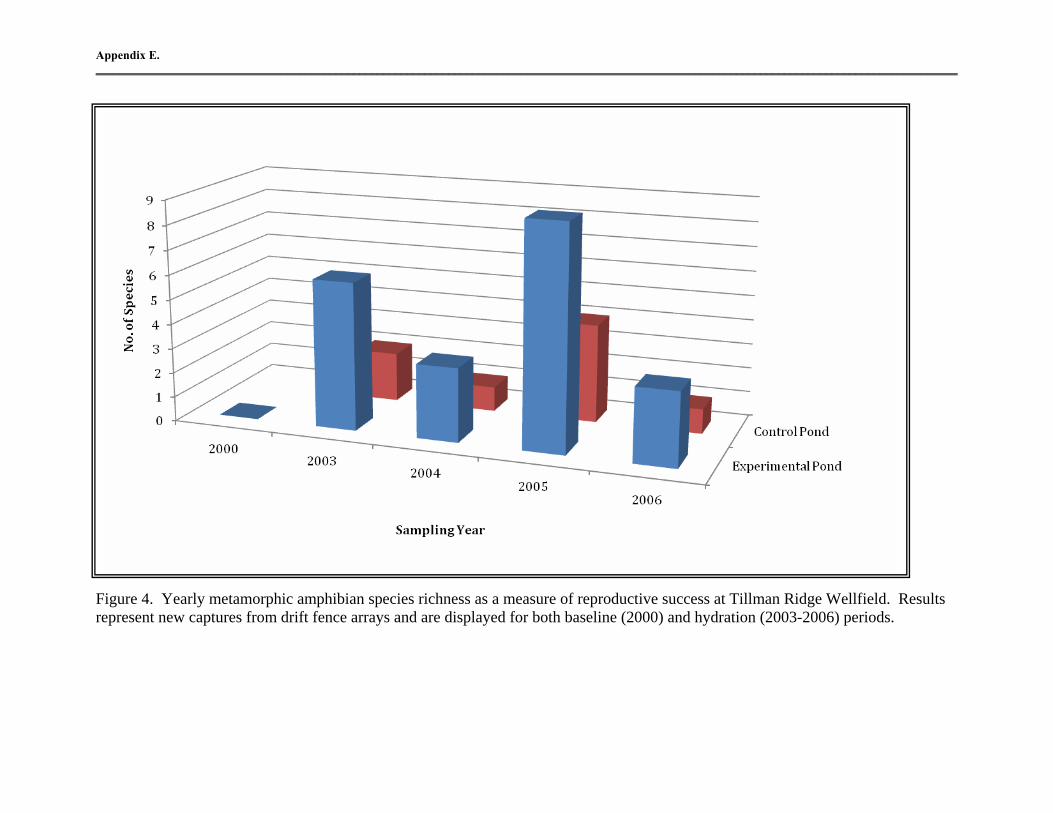
Amphibian reproductive success was measured as the richness and abundance of young, newly recruited amphibians (also called “metamorphs”) that emerged from study wetlands and were captured in drift fence arrays soon after their metamorphosis. No metamorphs were captured during baseline at neither the experimental nor the control pond. This was expected since both ponds were dry during baseline and had been dry for a substantial period. Young individuals were captured during every hydration year for each pond. During hydration, species richness and abundance of metamorphs were almost always substantially higher at the experimental wetland than the control wetland (Appendix E, Figures 3 and 4). It is possible that the higher reproductive output of the experimental wetland relative to the control wetland was the result of hydration. The experimental pond was more reproductively active during hydration period, but we cannot conclude that hydration was the reason for the higher reproductive output of the experimental wetland without having an understanding of the original reproductive conditions of each wetland prior to active hydration. In summary, the amphibian community of the experimental wetland responded to rainfall, or the lack thereof, throughout the study and secondarily to pond hydroperiod. CH2M Hill (2008b) reported that active hydration measurably increased water levels at the experimental pond. After observing a diverse, healthy, and successfully reproducing amphibian fauna for over four years, it is our opinion that augmentation had no detrimental effects on the amphibian community of the TR experimental wetland. Active hydration might have been beneficial to the amphibian community of the experimental wetland, especially to breeding success. However, we are unable to make definitive scientific conclusions relating to augmentation effects because there were not enough baseline data available for us to have an understanding of the original herpetological conditions of the experimental and control wetlands. Without that understanding, an assessment of the effect of augmentation on amphibians was inconclusive.
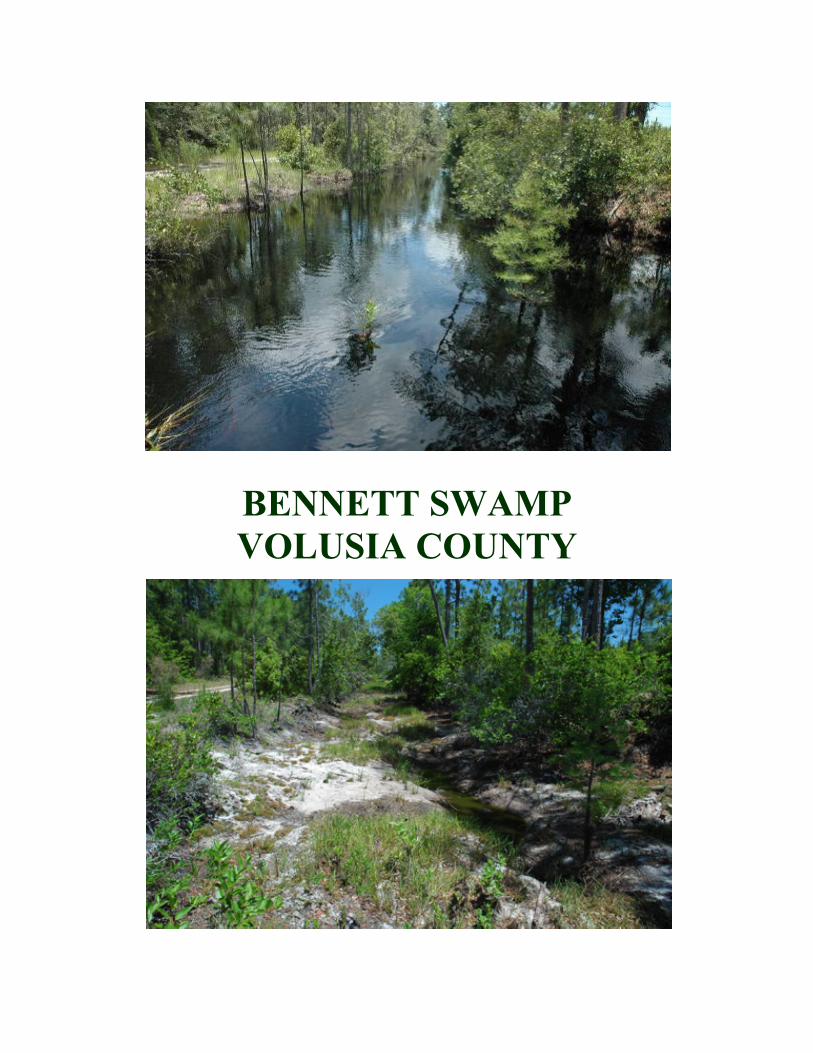
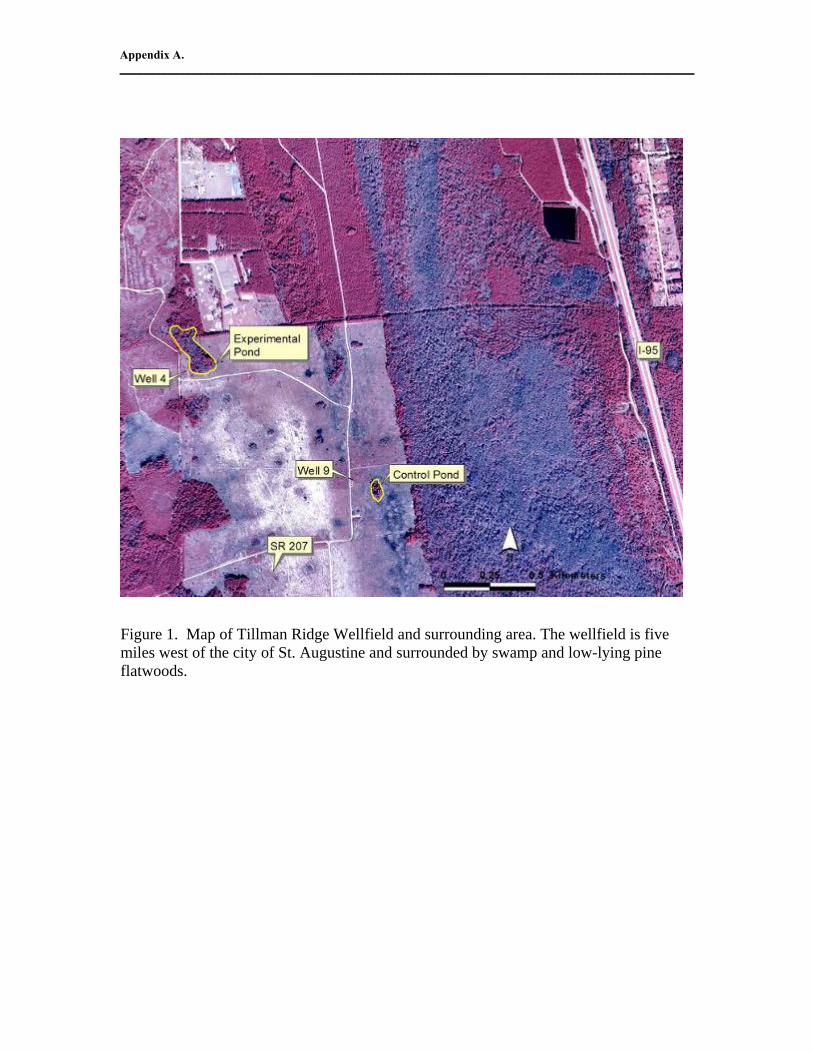
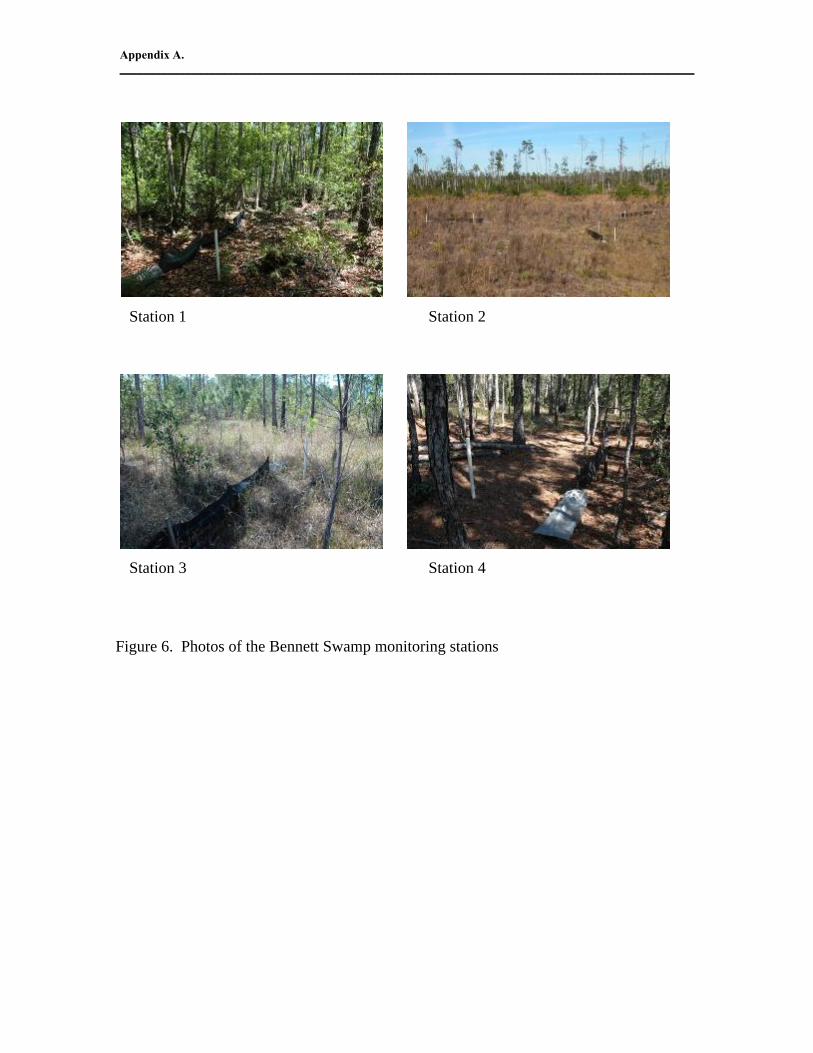
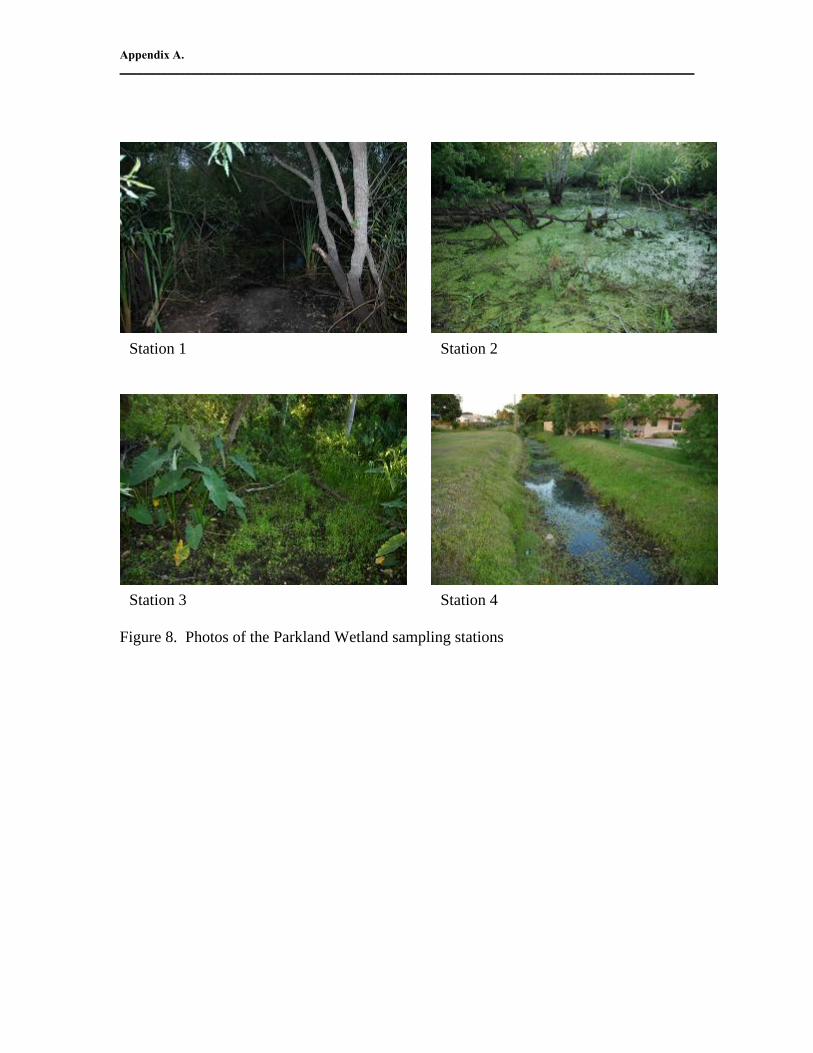
BENNETT SWAMP Site Description Bennett Swamp (BS) was located 5 miles west of the city of Daytona Beach and 1 mile north of US 92. The swamp was owned by the SJRWMD and managed by the Tiger Bay State Forest, Florida Division of Forestry. Access to the eastern side of the property was through the Tomoka Land Development property along Thayer Canal. Western access was off of Indian Lake Road, which intersects US 92 approximately 5 miles west of Daytona Beach. BS was a single, large wetland basin approximately 7 miles long, trending NNW to SSW, with a total area of 2540 acres. The wetland basin was dominated by bays, cypress, and pines. Brush thickets were common in areas that burned during the 1998 summer wildfires. Many trees were killed and remained as charred snags throughout the project. BS drains eastward into the Tomoka River, via a man-made canal called Thayer canal. A sand ridge called Rima Ridge bordered the west side of the swamp basin and it attained a maximum elevation of about 45 feet. Upland vegetation on Rima Ridge included patches of sand pine scrub, longleaf pine, and planted slash pine. Four amphibian monitoring stations were placed around the perimeter of the swamp basin. Additional site description information can be found in Means (2001). Station 1 was located east of Banks Lake entirely within the swamp in a mature loblolly bay forest that held standing water during wet periods. Access was off of Indian Lake Rd. down a small track that eventually dead ends at the upland/swamp ecotone, where the station lies. Station 2 was located along the northwest edge of the swamp where Rima Ridge sloped into the swamp basin. Site access was off of Bennett Field Rd., a western swamp access road along Rima Ridge. The site was situated on the ecotone between sandhill and swamp basin. The entire area was salvage logged after the 1998 summer wildfires that burned through and killed the majority of trees. Most of the uplands were treeless with herbs and shrubs characteristic of dry sand soils. Longleaf pines were planted here late in 2004. In early January 2005, Station 2 was control burned by Tiger Bay State Forest. The adjacent swamp basin was a dense shrub and briar thicket with areas of standing water. Station 3 was located along the northeast edge of the swamp in a mixed slash pine and loblolly bay stand. The area burned during the 1998 summer wildfires, but by 2004, dense shrubby and herbaceous undergrowth had returned to the site. The station was established in a low-lying area that flooded during wet periods. Access was off of Slim Pines Rd on the eastern side of the swamp within the Tomoka Land Development property. Station 4 was located on Hayes Island along an old logging track. Access was limited by a cable gate off of where Slim Pines Rd intersected Thayer Canal within Tomoka Land
Development property. The array was established in a stand of slash pine, about 50 yards west of a large area of bay swamp. The station was set near an ephemeral borrow pit within a dense planted slash pine forest. Understory consisted of pine needles and occasional shrubs. Passive Hydration A water retention weir was constructed across Thayer canal in January 2004, which acted to retain surface water flowing out of the swamp. The weir was operational through April 2008. This weir was designed to increase the hydroperiod and aquifer recharge of BS. Extreme flooding was avoided by allowing rain water from flood events to overtop the weir (CH2M Hill 2008a). The control elevation of the weir was set at 27.5 feet (NGVD29), two feet above the invert elevation of Thayer Canal at that location, and was designed to increase the wetland average seasonal high in 6-inch increments to 2 feet above the canal’s invert, and wetland outflow elevation (CH2M Hill 2008a). Methods Amphibian monitoring methodology for the post-augmentation sampling period was identical to the baseline sampling period. Four drift fence arrays identical to those in use at TR and PO were employed around the perimeter of BS, one drift fence array (three arms, six traps) per each monitoring station. Additional amphibian sampling techniques were utilized at each station including dipnetting and aural surveys. Traps were operational for a seven night period during each month (January-September) and checked daily to reduce amphibian mortality. Presence or absence of standing water at the four monitoring stations was recorded monthly. All stations did not necessarily dry and fill with water in unison during the study, however, if any of the stations recorded standing water then it was assumed that BS as a whole had standing water somewhere in the basin. Amphibian monitoring baseline period and hydrological monitoring baseline period were different because of logistical constraints. Amphibian baseline took place from January through September of 1999 and 2000. Hydrological baseline took place from February 2000 through September 2003. The study design was predetermined before the outset of baseline monitoring. There were no control wetlands monitored at the BS study site due to logistical and monetary constraints and the unavailability of a nearby similar site. CPI inherited the study design during the operational period. Statistics PRIMER 6 software for Windows was used for statistical computations. Quantitative species diversity data from drift fence arrays (new captures only) were converted into
captures per unit effort (CPUE) both in the pre and post-hydration periods in order to diminish the effects of comparing periods of unequal sampling duration. Raw data also were smoothed using square root transformation. The Bray-Curtis Similarity Index, widely used for ecological applications, was computed for each sampling period. This index was used to compare amphibian community similarity of BS before and after passive hydration. Bray-Curtis results were used to interpret diversity changes in the operational period relative to baseline. Bray-Curtis results were visually displayed in a cluster dendrogram and used to interpret diversity changes in the post-augmentation period relative to baseline. A multidimensional scaling (MDS) plot also was used to graphically display Bray-Curtis results. The reader is referred to the “Statistics” heading of the Tillman Ridge section of this report and to Dodd (in press) for a complete description of the Bray-Curtis Similarity Index. Results and Discussion Weather Rainfall data were reported in CH2M Hill (2008b) and are utilized in this report. Weather conditions were droughty with a few heavy rains during amphibian baseline, but it was wetter on the average during hydrological baseline than during the operational period. Operational period monitoring was the same for both amphibian and hydrological aspects of the study (January 2004-April 2008). During the operational period, annual rainfall totals were well above historical annual average at the beginning and dropped to well below average by the end of the period. From early 2006 through the end of the study, conditions at BS were droughty. The entire study period saw extremes in weather conditions. It was dry and desert-like for the majority of the time punctuated by extreme rainfall events, most notably the intense tropical cyclone seasons of 2004 and 2005. If it were not for the tropical storm activity in those two years, the average annual rainfall measured during the hydration period would be appreciably less, and average annual rainfall would have been below historical average. Extreme rain events often occurred when CPI was not actively amphibian monitoring either during the fall or between sampling weeks. Some heavy rainfalls occurred during monitoring weeks and were always accompanied by amphibian capture rate increases. Droughty conditions always resulted in relatively few captures. Wetland Hydroperiod Standing water was observed at BS stations throughout the first year (1999) of amphibian monitoring baseline. By March 2000, the swamp basin in the vicinity of all monitoring stations had dried. A heavy rain in April 2000 rehydrated most stations and standing water remained for a short period through May. By June 2000, all stations were dry again and remained so throughout the rest of the baseline period (through September 2000). Standing water levels during the operational period were generally high relative to baseline within the first two hydration years because of large rainfall inputs from the
2004 and 2005 tropical cyclone seasons. BS continuously had standing water at some or all of the monitoring stations during this time. Inflow and outflow creeks/canals to and from the swamp were flooded and many access roads were difficult to travel. However, a marked drying trend in the swamp basin began in late 2005 concurrent with decreasing monthly rainfall totals and what would become the beginning of persistent droughty conditions in the area for the remainder of the operational period. In May 2006, standing water at all amphibian monitoring stations dried and remained so for the rest of the study through April 2008. Effects of Passive Hydration on Bennett Swamp Measurable water levels increased in the wetland 0.61 feet at the Thayer Canal transect located near the control structure during the operational period compared to baseline. Surface water levels fell more slowly within the effective height of the weir during the operational period compared to baseline at the Thayer Canal transect. This indicated that the weir had the desired effect of retaining surface waters for longer periods with slower attenuation (CH2M Hill 2008b). Surface water samples collected exhibited water quality typical of central Florida forested black water swamps (CH2M Hill 2008b). Water quality values were similar between baseline and operational periods. Water quality parameter values, from the three monitoring transects within Bennett Swamp, were similar to one another. Values measured were low pH, conductivity, nutrients, and total dissolved solids; and high color (CH2M Hill 2008b). Effects of Passive Hydration on Amphibians Results regarding the effect of passive hydration on amphibians at BS were inconclusive because there were no available control sites for use as reference frames for the Bennett Swamp demonstration project. We could not definitively say whether amphibians at BS responded to passive hydration without being able to compare BS to a similar untreated control wetland. Results from the Bray-Cutis Similarity Index indicate that amphibian species diversity during baseline was fairly similar (65 percent) to that of the operational period (Figure 3). Species diversity peaked in the first two years of hydration. Average annual rainfall during baseline was reportedly greater than that of the operational period. Increased rainfall from the tropical cyclone seasons of the first two hydration years (2004 and 2005) were accompanied by marked increases in amphibian species diversity relative to baseline at BS (Means and Meegan 2005). Intense drought during the last half of the operation period smoothed out the effects of increased rainfall early on in operation by reducing measured species diversity. The opposing effects of rainfall and drought during the longer operational period smoothed out species diversity such that overall, it measured similar to that of baseline. This shows that short term fluctuations are not always congruent to long term trends.
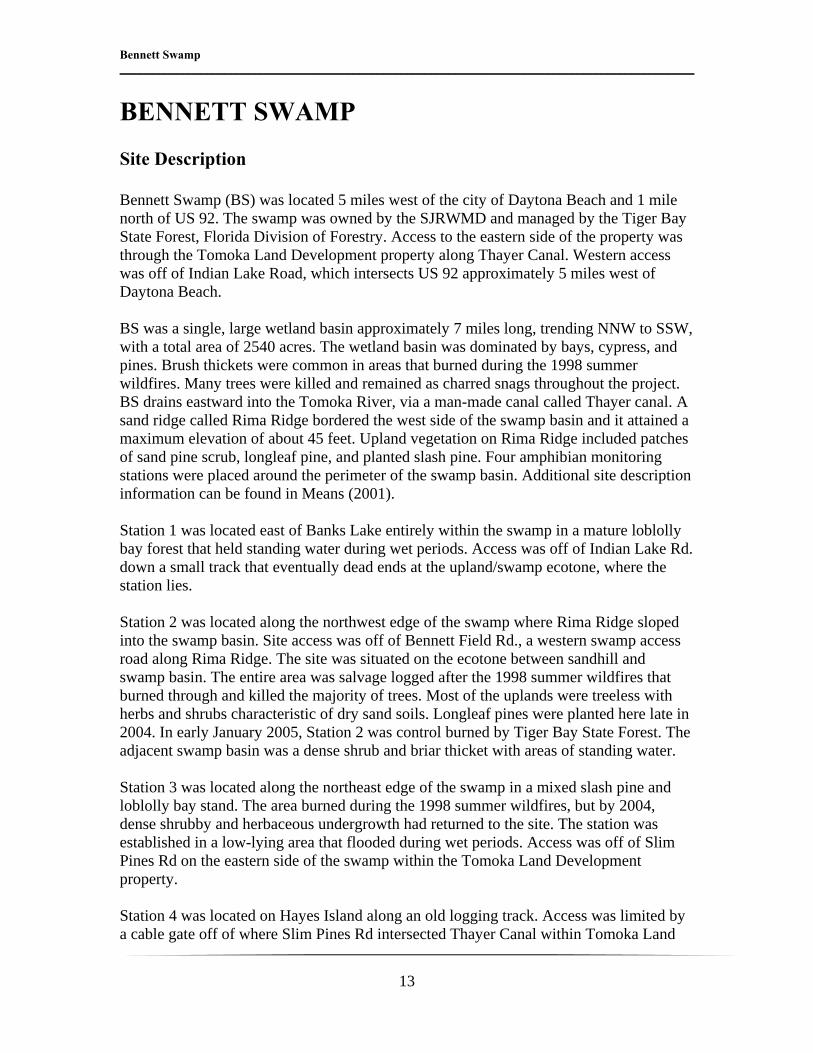
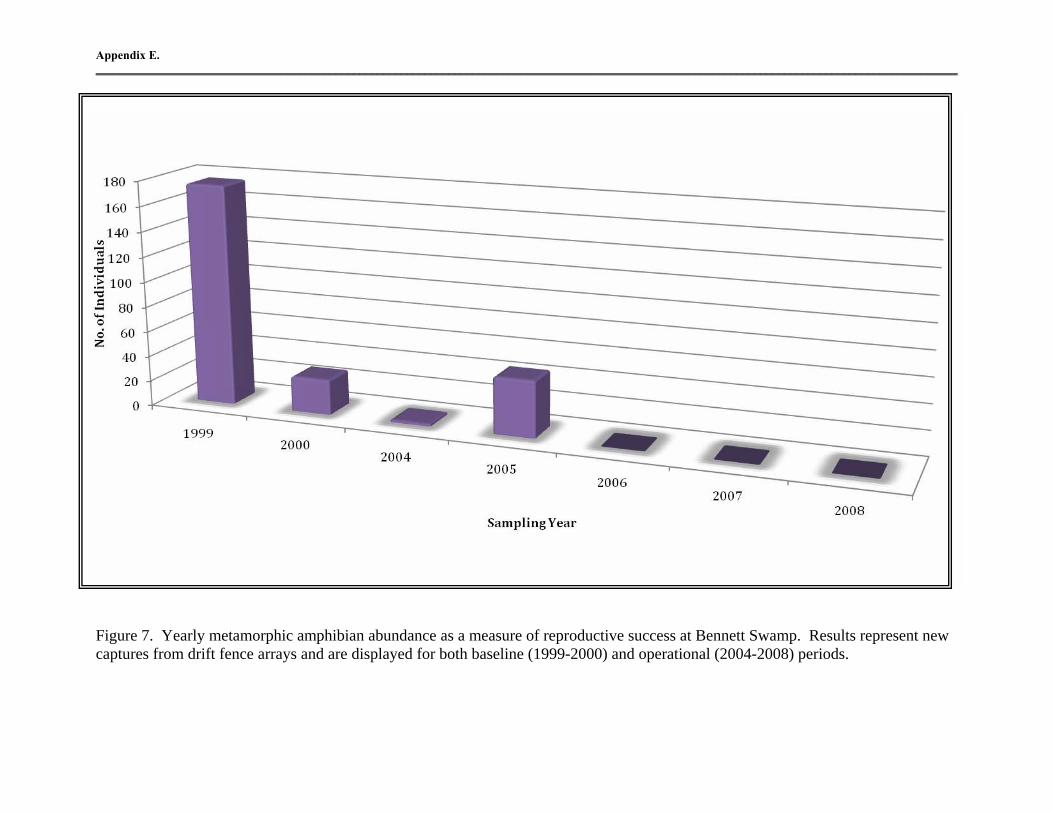
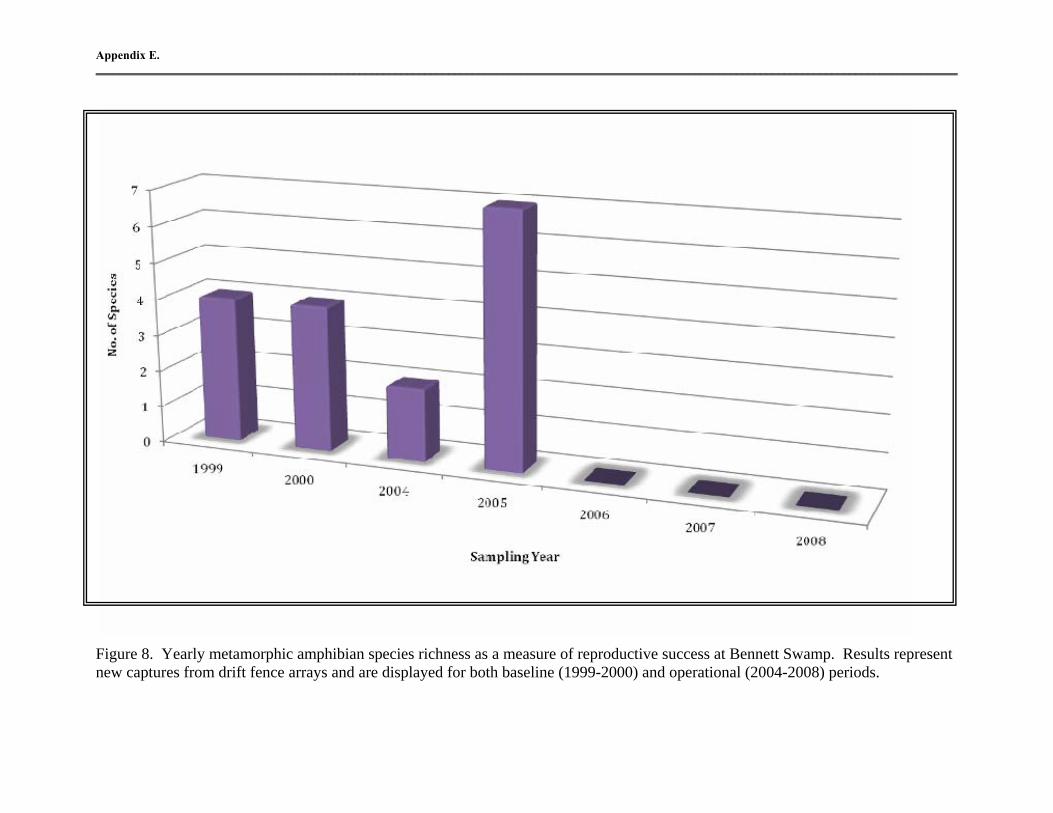
Amphibian reproductive success was measured as the richness and abundance of young, newly recruited amphibians that emerged from study wetlands and were captured in drift fence arrays soon after their metamorphosis (Appendix E, Figures 7 and 8). In each of the baseline and first two years of hydration, amphibian reproduction was measurably existent and apparently healthy. Beginning in 2006, young metamorph species richness and abundance steeply dropped to zero and remained so through the end of the study in 2008. This sharp decline in measured amphibian reproduction was concurrent with the onset of severe drought conditions and wetland basin dry-up. In summary, CH2M Hill (2008b) reported that passive hydration slightly increased the amount of water held at BS, but no conclusive assessment on whether passive hydration affected amphibians could be made. However, after observing a diverse, healthy, and successfully reproducing amphibian fauna for over five years, we feel that passive hydration had no detrimental effects on the amphibian community of BS. Throughout both phases of the project, amphibian species diversity waxed and waned with increased and decreased rainfall, respectively. By the last two and a half years of the project, there were very few amphibian captures and no reproduction relative to the rest of the study. We hypothesize that amphibians will become active again (e.g. species diversity will
Figure 3. Cluster dendrogram representing Bray-Curtis similarity between baseline and operational periods at Bennett Swamp.
increase) in the swamp basin when normal rainfall and swamp inundation return. The life histories of amphibians, in general, make them well-suited to withstand drought, and this surely is not the only drought to have happened in east-central Florida.
PORT ORANGE WELLFIELD VOLUSIA COUNTY
Port Orange Wellfield ‗‗‗‗‗‗‗‗‗‗‗‗‗‗‗‗‗‗‗‗‗‗‗‗‗‗‗‗‗‗‗‗‗‗‗‗‗‗‗‗‗‗‗‗‗‗‗‗‗‗‗‗‗‗‗‗‗‗‗‗‗‗‗‗‗‗‗‗‗‗‗‗‗‗‗‗‗‗‗‗‗‗‗‗‗‗‗‗‗‗‗‗‗‗‗‗
20
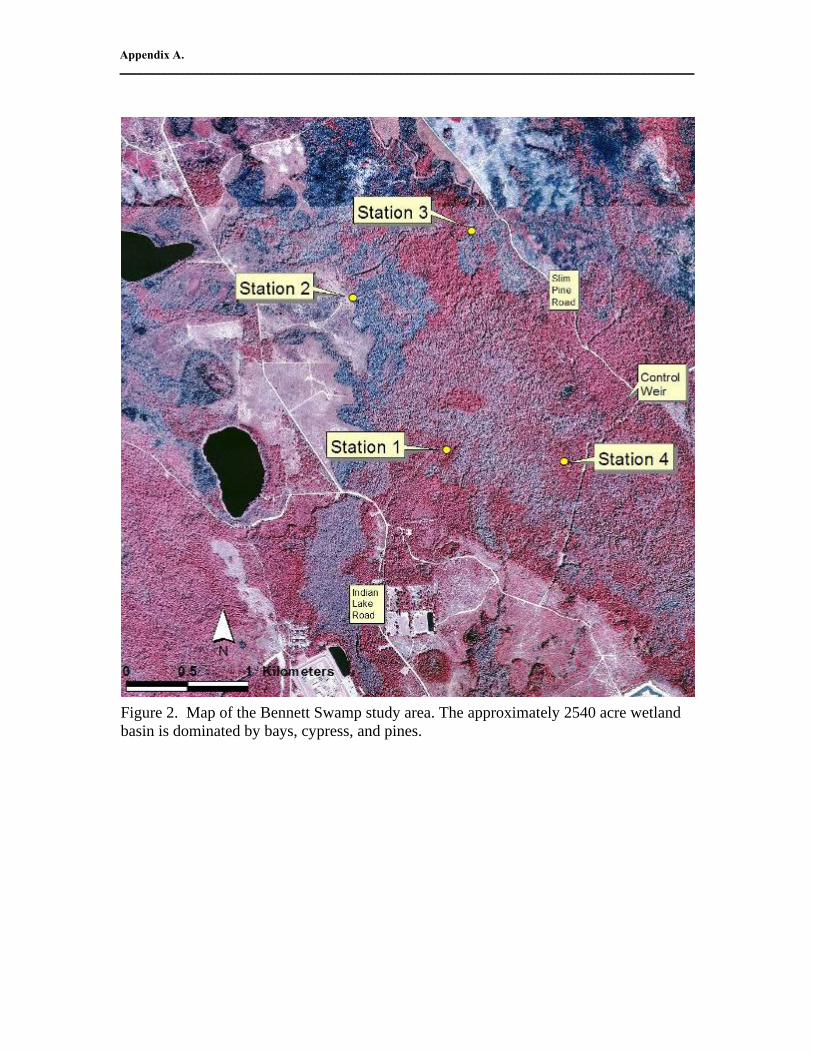
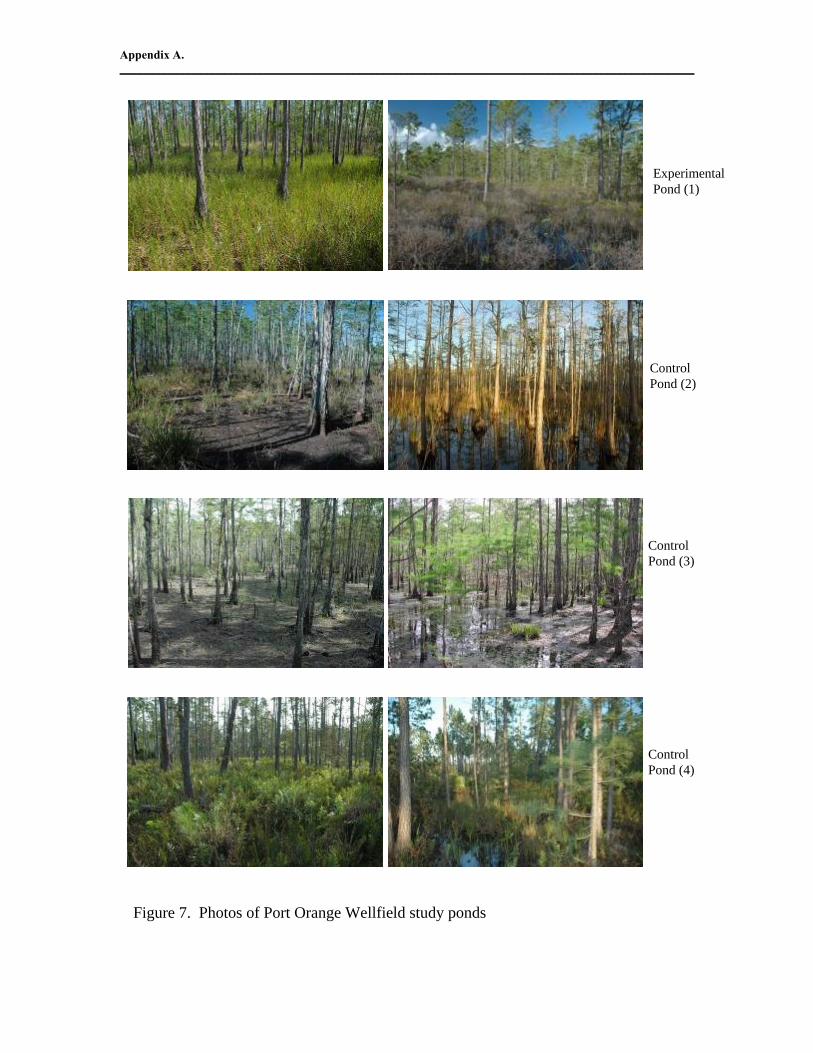
PORT ORANGE WELLFIELD Site Description Port Orange Wellfield was located along the west side of Tomoka Farms Rd approximately two miles south of US 92 on the outskirts of Daytona Beach. The gated entrance to the property was on Shunz Rd adjacent south of the Volusia County landfill. PO was owned by the City of Port Orange. The wellfield property was approximately 16,000 acres primarily utilized as a water recharge and supply area for municipal purposes. Several water supply wells located along the property’s paved road system pumped groundwater to nearby cities on a rotational schedule. PO was almost entirely forested in mixed slash pine and longleaf pine (Pinus palustris) flatwoods. Hundreds of small to large ephemeral cypress-dome ponds were scattered across the flatwoods landscape. One sandhill ridge complex called Rima Ridge spanned north to south roughly through the center of the property. Elevations associated with the ridge averaged 40 feet, with higher points exceeding 45 feet. Some intact longleaf pine-wiregrass community occurred on the ridge. Of the four properties studied in this project, PO was the best ecologically managed. Extensive areas of relatively healthy native Florida ecosystems were present. The land was used for additional purposes including hunting, off-road vehicular riding, horseback riding, and limited timber harvesting. Additional site description information can be found in Means (2001). The project study wetlands were located along the eastern side of Tiger Bay Swamp in extensive flatwoods. Three of the study ponds were located adjacent to well pumphouses. The fourth study pond was located on the south side of the property, approximately one mile south of the other three. All of the ponds were dominated by pond cypress (Taxodium ascendens) with occasional black gum and slash pines present. The experimental wetland (Pond 1) received supplemental water on a predetermined schedule. It was located directly south of Well 19 on Puddle Lane. It was a shallow cypress pond with an area of approximately six and a half acres. Severe wildfires in summer 1998 burned entirely through the depression and surrounding flatwoods. Pines and bays were killed in the fire, but most of the cypress survived. By project’s end in 2008, remains of the 1998 wildfires were barely detectable, save for a few charred dead snags. A blanket of nearly continuous herbaceous vegetation returned to the pond basin by about three or four years after the fires. On the north side of the pond, a ten meter wide fire line was constructed to fight the 1998 fires. This feature still existed at project’s end. The fire lane may have altered the hydrology of the north side of the wetland. Furthermore, there were deep roadside ditches along Puddle Lane adjacent to the pond. When the pond dried during normal dry periods, the ditches sometimes contained deep puddles. The ditches may have served as refuges for aquatic species such as predatory fish that normally would have been eliminated during pond dry-up.
Port Orange Wellfield ‗‗‗‗‗‗‗‗‗‗‗‗‗‗‗‗‗‗‗‗‗‗‗‗‗‗‗‗‗‗‗‗‗‗‗‗‗‗‗‗‗‗‗‗‗‗‗‗‗‗‗‗‗‗‗‗‗‗‗‗‗‗‗‗‗‗‗‗‗‗‗‗‗‗‗‗‗‗‗‗‗‗‗‗‗‗‗‗‗‗‗‗‗‗‗‗
21
Pond 2 was a control pond located approximately 650 m southeast of Pond 1 and was adjacent north of Well 16. It was very similar to Pond 1, with pond cypress dominating the wetland. Pond area was approximately eight acres. Pond 2 historically was part of a larger strand complex, but was bisected by the paved narrow access road. Like at Pond 1, deep ditches existed at Pond 2 along the access road, and culverts allowed the intermixing of water from both sides of the road. Wildfires swept through the pond during summer 1998, also killing some of the pines and cypress in the depression. Other than a few snags, evidence of the 1998 wildfires was barely detectable by project’s end. Herbaceous vegetation gradually returned to most parts of the depression by four or five years after the fire. A continuous shallow fireline ditch surrounded the wetland. Pond 3 was the largest of the study ponds with an area of nearly 15 acres. This control pond was dominated by cypress and had more young slash pines than the other study ponds. The abundance of young slash pines may indicate wetland disturbance due to aquifer drawdown, but this statement is only speculative. Pond 3 was located north of Pond 1 approximately 900 m and was adjacent west of Well 11 off Harley Rd. The pond depression was protected from the 1998 summer wildfires by a 30 m wide fire line that was put in on the south side of the wetland within wetland boundaries. This treeless swath began at the end of Shunz Road. During pond fillings, the denuded swath nearest the wetland formed a muddy puddle of open water. As a result of fire exclusion in 1998, the understory character of the wetland remained thickly herbaceous during baseline in contrast to the denuded, charred wetland floors of the other three study ponds that burned. By midway into the project, the groundcover of the other three wetlands that had burned in 1998 resembled that of pond 3. U.S. Interstate Highway 4 (I-4) borders the northern fringes of Pond 3. Pond 4 was a control pond located outside of the cluster of Ponds 1, 2, and 3. It was approximately 1.5 miles southeast of pond 1, and 0.4 miles east of a major powerline. It had an area of four acres. Pond 4 was not located adjacent to a pump station like the other three study ponds. The depression burned in the summer of 1998, and herbaceous understory vegetation had gradually returned in the years since the fires, like at ponds 1 and 2. An old fireline ditch encircled the pond. The ditch would sometimes retain water puddles when the rest of the original pond basin dried. Active Hydration A description of water delivery to the experimental wetland (Pond 1) at PO was paraphrased from CH2M Hill (2008b). Groundwater, presumably from the Upper Floridan aquifer, was pumped from an existing, on-line well (#19) at an average rate of approximately 360,000 gallons per day. Approximately two inches of water across the 6.5-acre wetland was generally delivered in a 24-hour period. Approximately four million gallons per year were delivered to the wetland. Hydration water was applied on a schedule that mimicked the pattern of the average monthly rainfall, with no active hydration during the dry season.
Port Orange Wellfield ‗‗‗‗‗‗‗‗‗‗‗‗‗‗‗‗‗‗‗‗‗‗‗‗‗‗‗‗‗‗‗‗‗‗‗‗‗‗‗‗‗‗‗‗‗‗‗‗‗‗‗‗‗‗‗‗‗‗‗‗‗‗‗‗‗‗‗‗‗‗‗‗‗‗‗‗‗‗‗‗‗‗‗‗‗‗‗‗‗‗‗‗‗‗‗‗
22
Methods The study design for PO was the most robust of the four study sites within this pilot study. Monitoring methodology for baseline and hydration periods was identical. The monitoring methods employed at PO were the same as those used at TR except for three differences. First, there were three control ponds at PO versus one control pond at TR. Second, baseline monitoring lasted for two years at PO versus only four months for TR. Last, the hydration period at PO lasted five years versus four at TR. The PO experimental pond (Pond 1) was predetermined (CH2M Hill 1997), and the control ponds (Ponds 2-4) were selected by University of Florida biologists at the outset of baseline amphibian monitoring (Means 2001). The control ponds were selected on the basis of being botanically and hydrologically similar to the experimental pond. Control ponds were located nearby to the experimental pond. Presence or absence of standing water in all four study ponds was recorded monthly. The reader is referred to the TR Methods section of this report for a complete description of amphibian monitoring methods. Statistics PRIMER 6 software for MS Windows was used in the analysis of quantitative species diversity data from drift fence arrays (new captures only). The data were converted into captures per unit effort (CPUE) both in the baseline and post-hydration periods in order to diminish the effects of comparing periods of unequal sampling duration. Raw data also were smoothed using square root transformation. The Bray-Curtis Similarity Index, widely used for ecological applications, was computed for each study wetland and sampling period. This index was used to compare amphibian community similarity between four sites before and after active hydration. Percent similarity between study wetlands before and after hydration was visually presented in a cluster dendrogram. A multidimensional scaling (MDS) plot of the Bray-Curtis values was utilized to visually interpret diversity changes in the post-augmentation period relative to baseline. The reader is referred to the “Statistics” heading of the Tillman Ridge section of this report and to Dodd (in press) for a complete description of the Bray-Curtis Similarity Index. Results and Discussion Weather Rainfall data were reported in CH2M Hill (2008b) and are utilized in this report. Average annual baseline period rainfall was 48 inches and increased to 58 inches during the hydration period (CH2M Hill 2008b). Baseline average annual rainfall was similar to the historical average of approximately 50 inches, while the hydration period saw a 10 inch increase annually. These figures can be misleading, however. The entire study period saw extremes in weather conditions. It was dry and desert-like for the majority of the time punctuated by extreme rainfall events, most notably the intense tropical cyclone seasons of 2004 and 2005. Were it not for the tropical storm activity in those two years, the average annual rainfall measured during the hydration period would be substantially less.
Port Orange Wellfield ‗‗‗‗‗‗‗‗‗‗‗‗‗‗‗‗‗‗‗‗‗‗‗‗‗‗‗‗‗‗‗‗‗‗‗‗‗‗‗‗‗‗‗‗‗‗‗‗‗‗‗‗‗‗‗‗‗‗‗‗‗‗‗‗‗‗‗‗‗‗‗‗‗‗‗‗‗‗‗‗‗‗‗‗‗‗‗‗‗‗‗‗‗‗‗‗
23
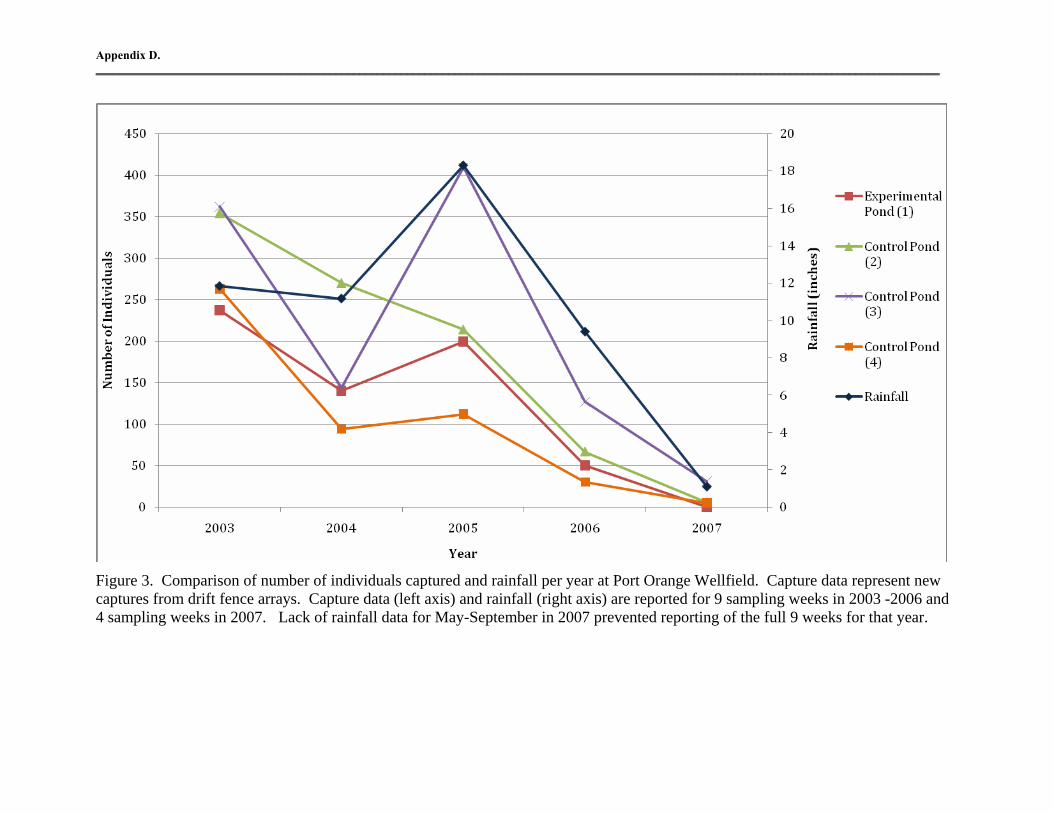
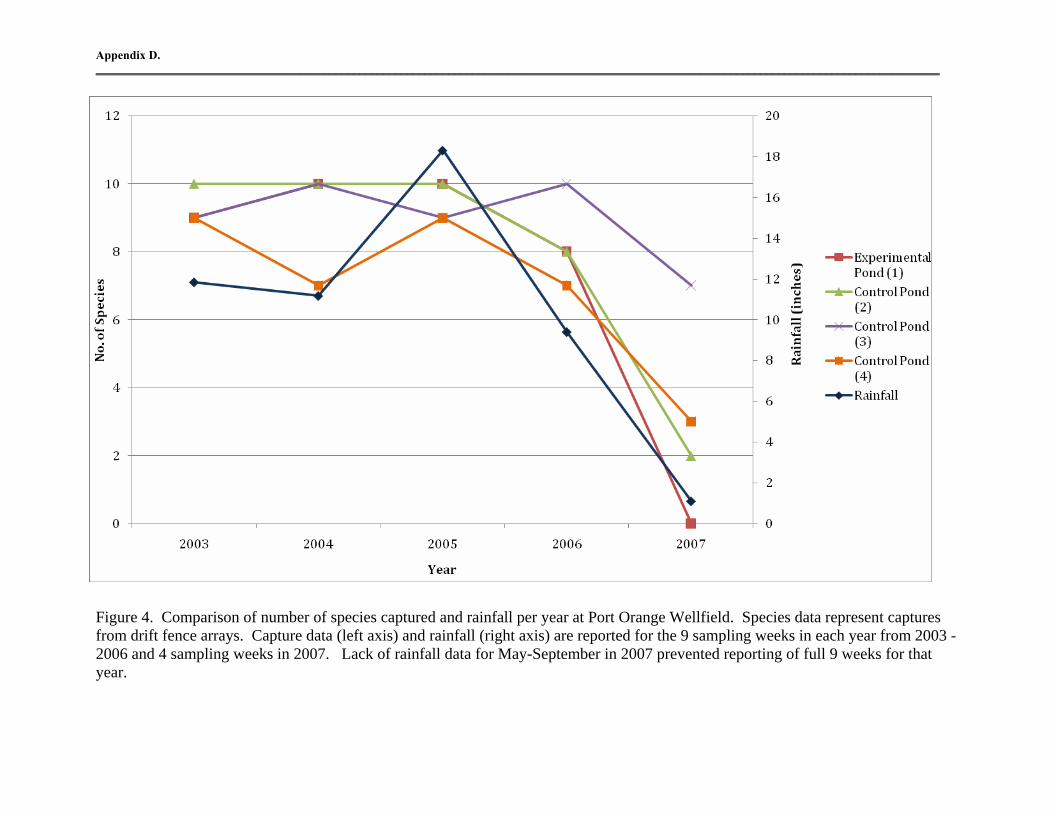
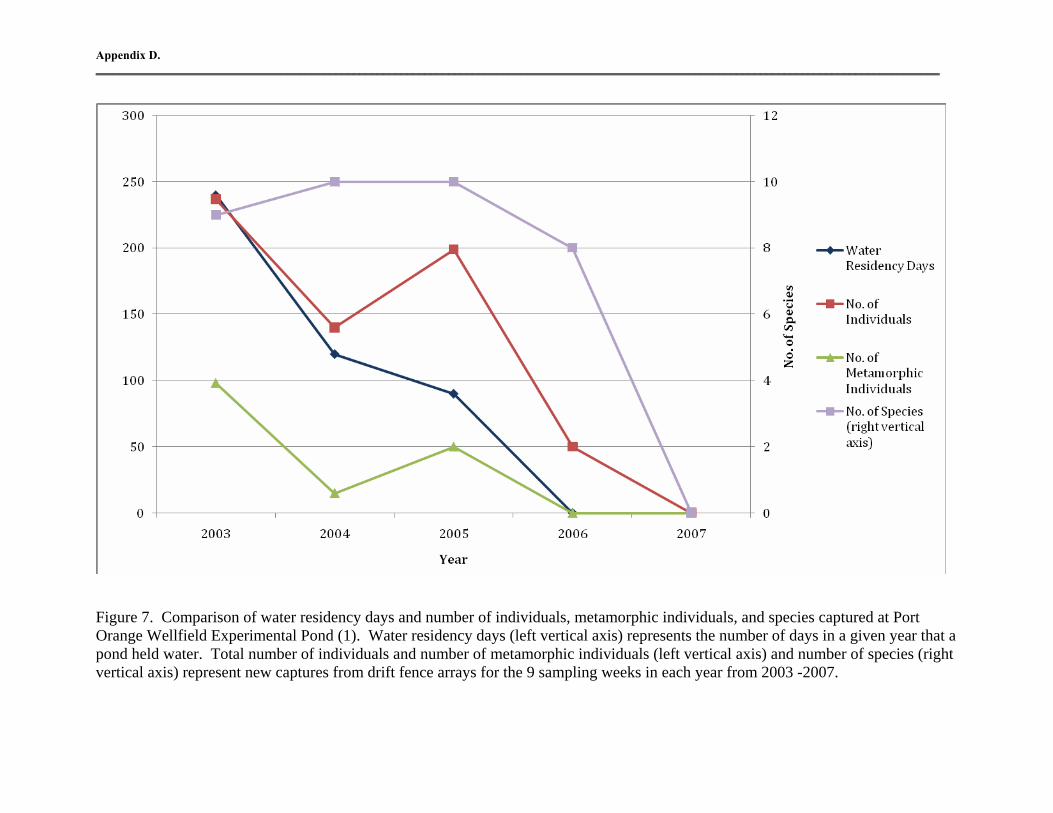
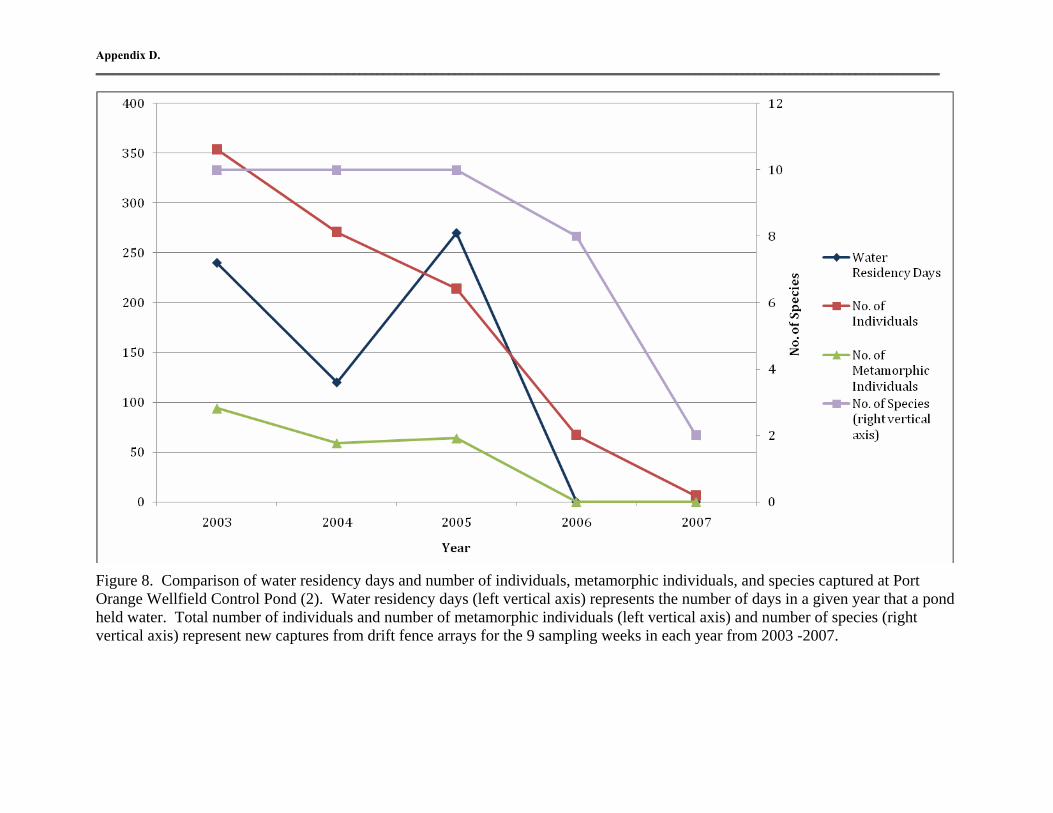
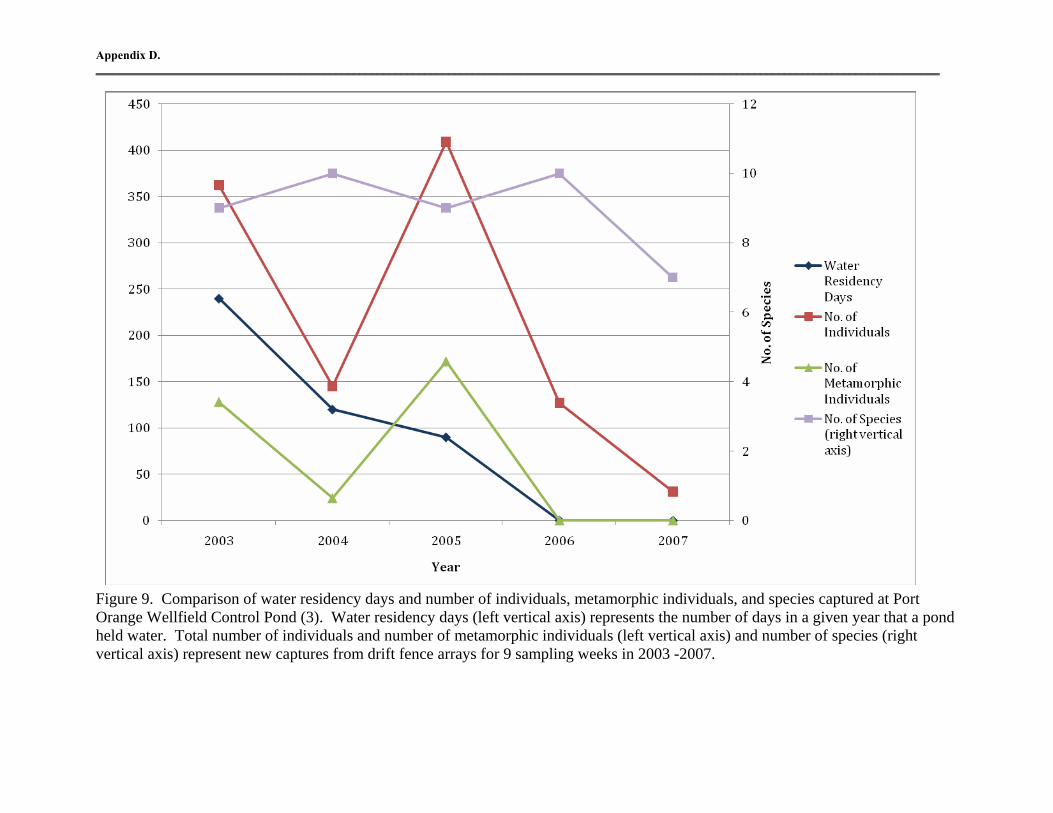
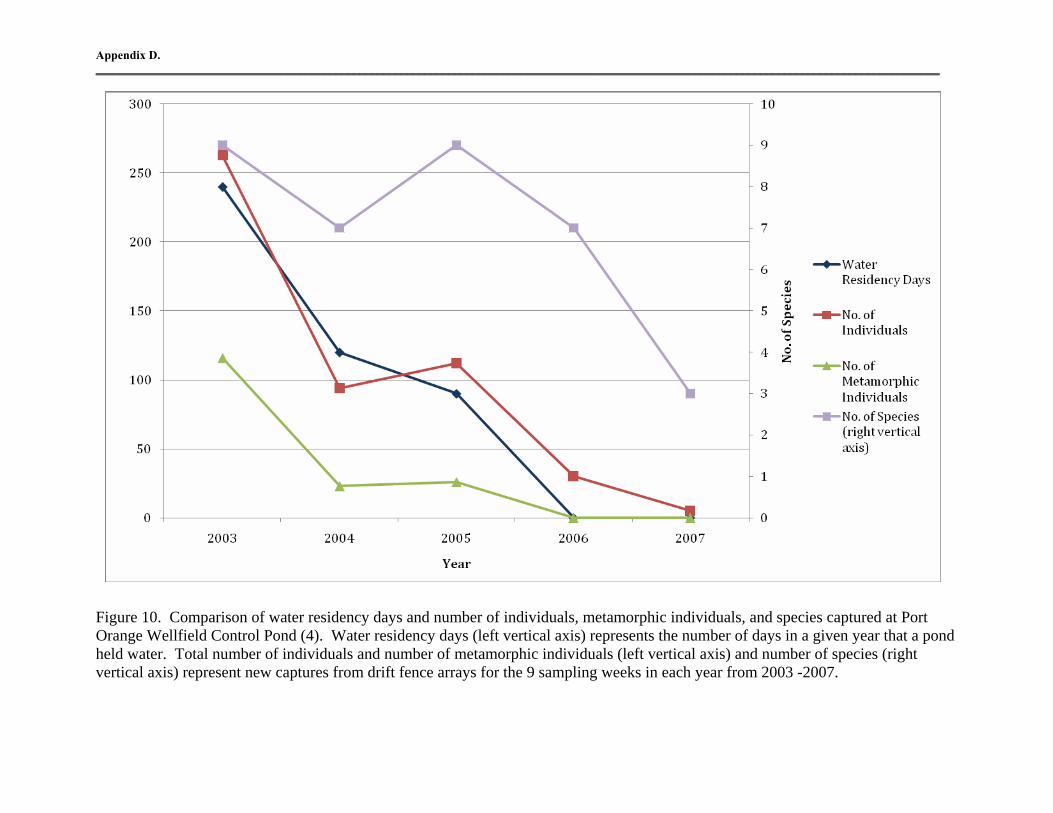
Extreme rain events often occurred when CPI was not actively amphibian monitoring either during the fall or between sampling weeks. Some heavy rainfalls occurred during monitoring weeks and were always accompanied by amphibian capture rate increases. Droughty conditions always resulted in relatively few captures. Appendix D, Figures 3 and 4 demonstrate the positive relationship between rainfall and amphibian species diversity at the study wetlands. While amphibian response at some ponds showed more direct correlation with rainfall, all four study ponds generally had a positive correlation between rainfall and number of individuals and species. The correlation between amphibian activity and rainfall is a well-documented occurrence in amphibian ecology (Gibbons and Bennett 1974, Dodd 1995, R.P.M. Means 2008). Wetland Hydroperiods Throughout the baseline and hydration periods, the experimental pond (Pond 1) and the additional three CPI control ponds (Ponds 2-4) all filled and dried synchronously in response to rainfall or droughty conditions. During heavy rain events, all ponds became hydrated. Lengthy dry periods would dry out the pond basins, and all would dry within the same month, and whenever dry-up occurred within our sampling week, all pond dry-ups occurred within the same week. Beginning in early 2006, all study ponds dried and remained dewatered through the end of amphibian monitoring in September 2007. The drying of the wetlands was concurrent with the onset of severe drought conditions. Appendix D, Figures 7-10 demonstrate the relationship of water residency days (number of days in a given year that a pond held water) to species richness, abundance, and young (metamorphic) amphibian production at study wetlands during the hydration period. From year to year, amphibian activity was not consistently correlated with water residency days at any of the study wetlands. A general trend for all ponds was that as water residency approached zero at the end of the study, amphibian activity also became greatly reduced. Amphibian activity at the experimental pond did not exhibit any outstanding trends with respect to control ponds. Our results indicated that amphibians primarily responded to rainfall and secondarily to water residency at PO. Effects of Augmentation on the Experimental Wetland Daily water levels during the baseline period averaged 36.69 feet. During the hydration period, water levels averaged 37.48 feet, 0.79 feet greater than the baseline period (CH2M Hill 2008b). The hydration period had approximately ten inches more average annual rainfall than the baseline period. Increases in water levels at the wetland piezometer were not observed on days when only active hydration and no rainfall took place. On these days during the hydration period, water levels in the wetland piezometer decreased an average of 0.03 feet per day, indicating that the wetland may have been discharging to the Surficial Aquifer System (CH2M Hill 2008b). Water levels also decreased in the same piezometer an average of 0.03 feet when no hydration and no rainfall occurred (CH2M Hill 2008b). CH2M Hill’s hydrological data also indicated that cumulative inputs from rainfall and active hydration had a slightly greater effect on water
Port Orange Wellfield ‗‗‗‗‗‗‗‗‗‗‗‗‗‗‗‗‗‗‗‗‗‗‗‗‗‗‗‗‗‗‗‗‗‗‗‗‗‗‗‗‗‗‗‗‗‗‗‗‗‗‗‗‗‗‗‗‗‗‗‗‗‗‗‗‗‗‗‗‗‗‗‗‗‗‗‗‗‗‗‗‗‗‗‗‗‗‗‗‗‗‗‗‗‗‗‗
24
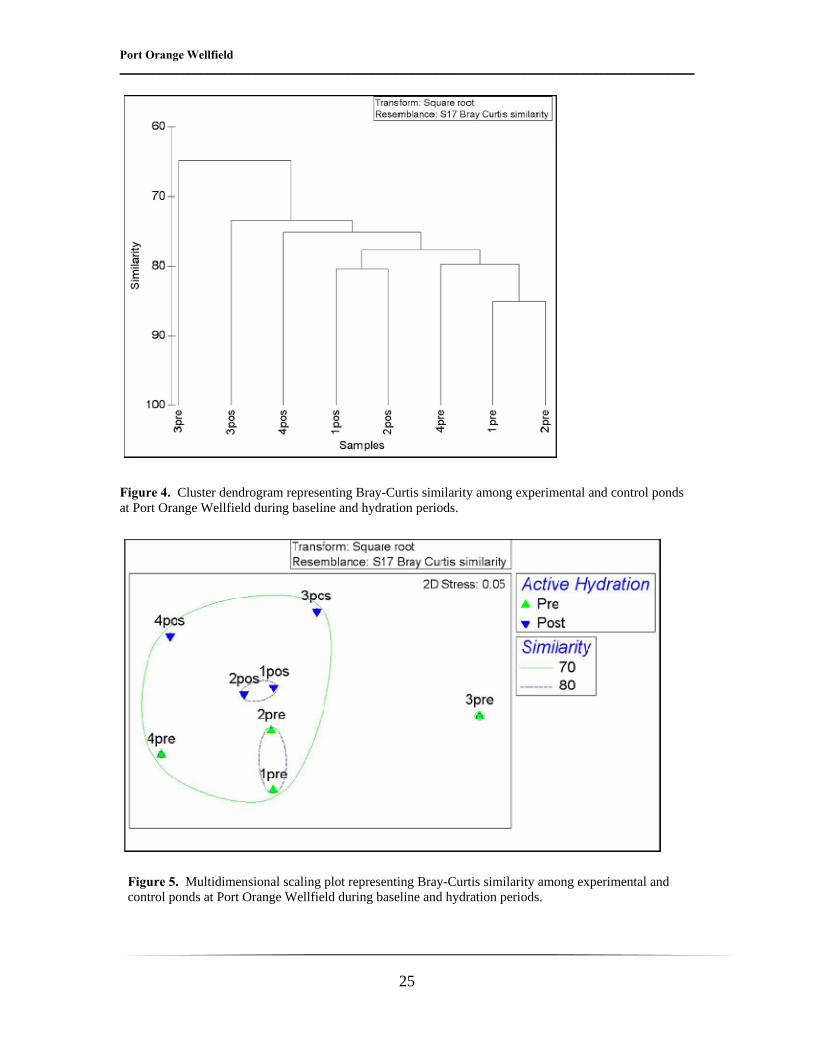
levels during the hydration period than rainfall alone did during the baseline period (CH2M Hill 2008b). Hydroperiod observations from the three CPI control ponds in conjunction with CH2M Hill hydrological data from the experimental wetland indicated that rainfall had a much greater effect on water level fluctuations than did augmentation. Active hydration had no long term, measurable effect on water quality in the experimental wetland. Water quality parameters were similar during the baseline and hydration periods and were typical of a central Florida stillwater cypress swamp (CH2M Hill 2008b). Values for pH, conductivity, total suspended solids, metals, and nutrients were typically low. For a complete discussion on the hydrological results of this pilot project, the reader is referred to CH2M Hill (2008b). Effects of Augmentation on Amphibians There was sufficient study design rigor at PO in place to make a conclusive assessment of amphibian response to hydration, provided that hydration itself had a noticeable effect on the experimental wetland. Although CH2M Hill (2008b) reported that there was a modest effect of hydration on the water level of Pond 1, from an amphibian’s perspective, the effects were not great enough. That the experimental and control ponds all filled and dried synchronously during baseline and hydration periods indicated that any hydroperiod boost at Pond 1 measured by CH2M Hill was not readily noticeable within monthly CPI sampling visits during hydration. Furthermore, wetland water quality remained unchanged after hydration. Results from a Bray-Curtis Similarity Index are displayed in both a cluster dendrogram (Figure 4) and a MDS plot (Figure 5). Results indicate that the species diversities of Ponds 1, 2, and 4 were similar (70 percent) to one another in both pre and post augmentation. Ponds 1 and 2 were even more highly similar (80 percent) to one another in the pre and the post periods. Results indicated that there was no measurable effect of hydration on amphibian species diversity of Pond 1 relative to two control ponds. These results should be expected, since there was no substantial effect of hydration on abiotic conditions of Pond 1. If abiotic factors (e.g. water quality or hydroperiod) at Pond 1 had changed, then one might hypothesize that species diversity also would have changed there. But this was not the case. Without any noticeable effects of hydration on the experimental wetland, it was not possible to make a definitive assessment of the effects of hydration on the amphibian community at the PO experimental wetland. Therefore, results regarding the possible effects of active hydration on amphibians at PO were inconclusive.
Port Orange Wellfield ‗‗‗‗‗‗‗‗‗‗‗‗‗‗‗‗‗‗‗‗‗‗‗‗‗‗‗‗‗‗‗‗‗‗‗‗‗‗‗‗‗‗‗‗‗‗‗‗‗‗‗‗‗‗‗‗‗‗‗‗‗‗‗‗‗‗‗‗‗‗‗‗‗‗‗‗‗‗‗‗‗‗‗‗‗‗‗‗‗‗‗‗‗‗‗‗
25
Figure 4. Cluster dendrogram representing Bray-Curtis similarity among experimental and control ponds at Port Orange Wellfield during baseline and hydration periods.
Figure 5. Multidimensional scaling plot representing Bray-Curtis similarity among experimental and control ponds at Port Orange Wellfield during baseline and hydration periods.
Port Orange Wellfield ‗‗‗‗‗‗‗‗‗‗‗‗‗‗‗‗‗‗‗‗‗‗‗‗‗‗‗‗‗‗‗‗‗‗‗‗‗‗‗‗‗‗‗‗‗‗‗‗‗‗‗‗‗‗‗‗‗‗‗‗‗‗‗‗‗‗‗‗‗‗‗‗‗‗‗‗‗‗‗‗‗‗‗‗‗‗‗‗‗‗‗‗‗‗‗‗
26
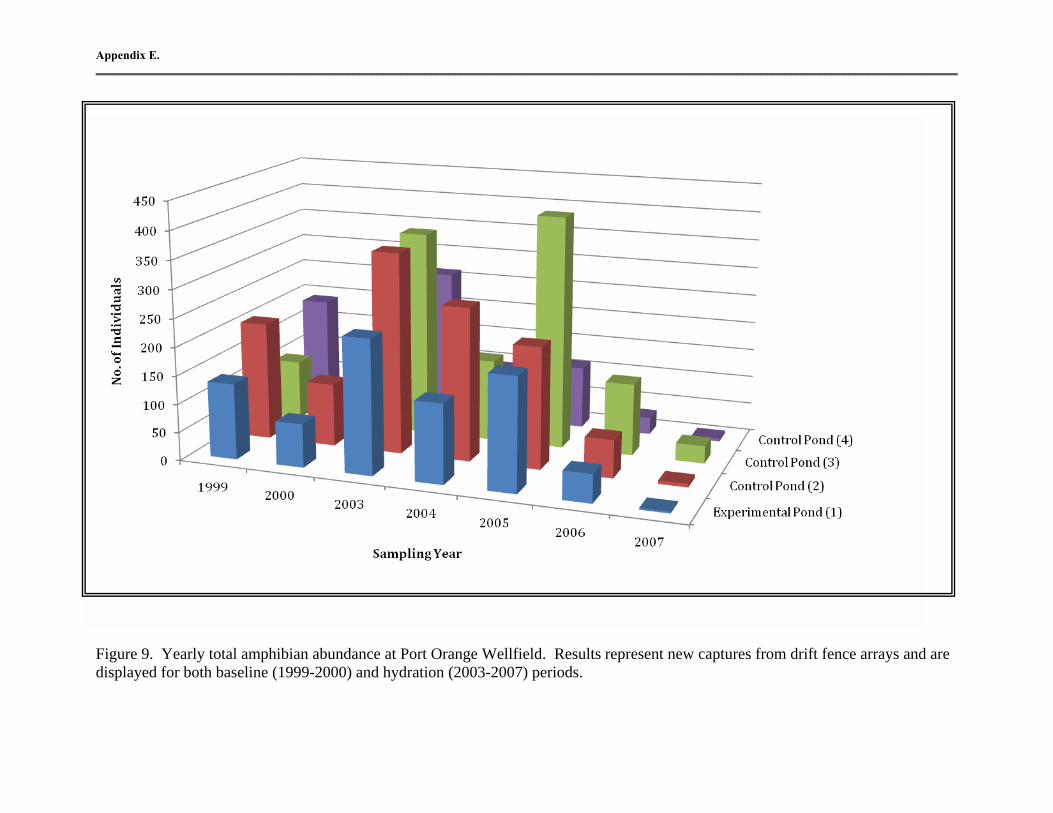
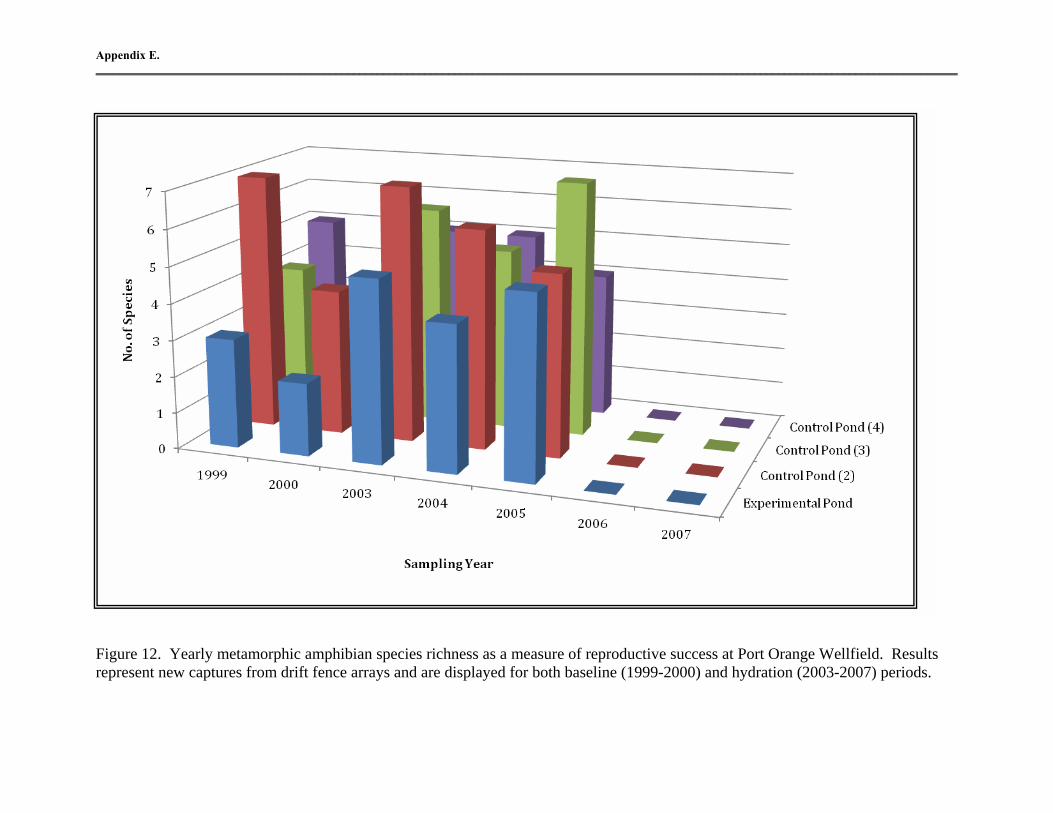
As an aside, results from Pond 3 (control pond) were very interesting and may indicate an effect of wildfire on species diversity of this pond. As mentioned in “Site Descriptions,” Pond 3 was the only PO study pond that did not burn during the severe wildfires of 1998. The other three ponds (Ponds 1,2 and 4) burned thoroughly, The MDS plot (Figure 5) clearly shows that Pond 3 was dissimilar to Ponds 1,2 and 4 during the pre-treatment phase, but by the end of the study, it became highly similar (at least 70 percent) to the other ponds. We suggest that, as ecological succession returned the physical attributes of Ponds 1, 2 and 4 back to a state similar to unburned Pond 3, amphibian species diversity of all ponds gradually became more similar. Amphibian reproductive success was measured as the richness and abundance of young, newly recruited amphibians that emerged from study wetlands that were captured in drift fence arrays soon after their metamorphosis (Appendix E, Figures 11 and 12). In general, the reproductive output of all ponds was similar during baseline and the first three hydration years. But from 2006 until project’s end in 2007, no amphibian reproduction was recorded. This sharp decline in reproductive success was concurrent with the onset of severe drought conditions in 2006 and 2007. Results from amphibian reproductive data also suggest that the amphibian community of the experimental pond did not substantially differ from control ponds from pre to post-augmentation. In summary, hydrological results from both CH2MHill and CPI showed that augmentation had no appreciable effect at the PO experimental wetland. Therefore, no conclusive assessment of the amphibian response to augmentation could be made. Analysis of amphibian species diversity and reproductive data indicated that the amphibian species communities of experimental and control wetlands were similar during baseline and hydration periods. This should be expected since there was no appreciable effect of hydration on the treated wetland. Amphibian activity and reproduction sharply declined starting in early 2006 with the onset of drought and remained low through project’s end in 2007. Throughout both study phases, amphibian activity and reproduction waxed and waned responding to wet and dry periods, respectively.
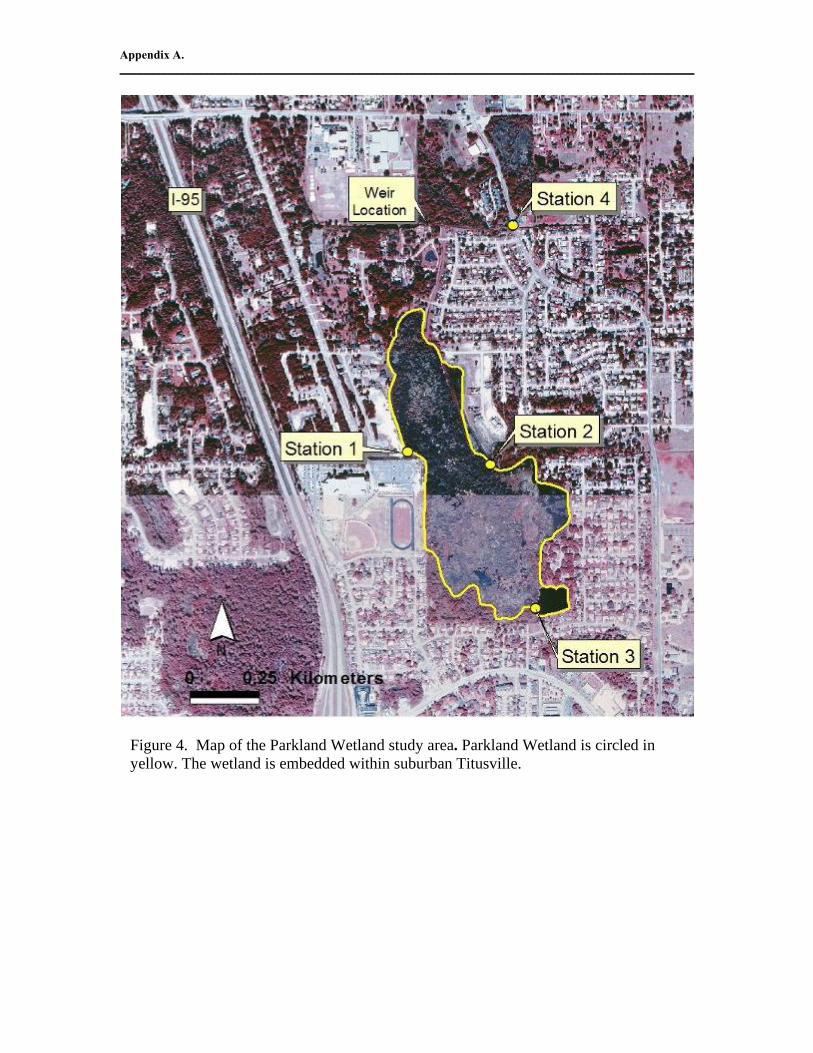
PARKLAND WETLAND Site Description Parkland Wetland (PW) was located northwest of the Titusville water treatment plant, north of SR 406, between Dixie Hwy and I-95. The wetland was owned by the City of Titusville. The wetland served as a water supply source to the City of Titusville as well as recharge area to the surficial aquifer. Parkland Wetland was a natural depressional wetland with a total area of 100 acres embedded within a suburban landscape associated with the western edge of the city of Titusville. The uplands on the west side of the depression exceeded 50 feet in elevation, and those on the east rose to about 30 feet. Dense thickets of willow (Salix sp.) and patches of red maple (Acer rubrum) dominated the vegetation of PW. Open areas contained dense patches of cattail (Typha sp.), maidencaine (Panicum hemitomum), wax myrtle (Myrica cerifera), and blackberry (Rubus sp.). Brazilian Pepper (Shinus terebinthifolius) and other exotics also were common in and around PW. The perimeter was almost entirely surrounded by high-density housing with little or no natural plant buffers. Astronaut High School was located on the southwest perimeter. Tiny patches (< one acre) of the original upland plant communities remained around the fringes of the wetland, including longleaf pine on the east side. By 2004, small remaining patches of sand pine scrub north of the high school were eliminated and replaced with additional high-density housing. Four stations were distributed around the perimeter of the wetland and were inventoried for amphibian species. Station 1 was located in a dense willow-red maple thicket along the southwest wetland margin in back of Astronaut High School. It was bordered by open sand, school grounds, and high density housing. By 2004, new housing eliminated all patches of sand pine scrub that once stood here during baseline through early in the operational period. Station 2 was located in a dense wax myrtle thicket along the east central shore of PW at the end of Bonnymeade Street. A small remnant patch of longleaf pine sandhill community lies adjacent to the wetland. The area had large longleaf pines and a small live oak hammock. Houses were nearby, and off-road-vehicle trails penetrated all areas. Active gopher tortoise burrows were present, and old adult tortoises were often observed on site. Station 3 was located at a permanent open water body along Elder Street. The approximately two acre body of water was in the southeast corner of PW. We believe that this water body was a man-made structure serving as a water retention pond. It was bordered by houses, yards, and fences along its south and east perimeter. Station 4 consisted of an outflow canal that drained the northern part of PW. It was a steep-sided ditch cut through an urban neighborhood next to a convenience store on Singleton Avenue.
Passive Hydration A water retention weir was constructed across a canal draining north out of PW and was operational May 2002. The objective of the weir was to hold more naturally occurring surface water within the system for a longer duration by raising the outlet elevation without increasing flooding from major storm events CH2M Hill (2008b). Methods The PW study site was predetermined, and no control wetlands were selected for amphibian sampling because of logistical constraints and the unavailability of a nearby similar site. Sampling methodology during baseline and operation was identical. Four stations were inventoried for amphibian species richness around the perimeter of the wetland. Inventory techniques consisted of generalized searching, dipnetting for larvae, and frog call surveys at each of the four sampling stations. Presence or absence of standing water at the four monitoring stations was recorded per site visit. All stations did not necessarily dry and fill with water in unison during the study, however, if any of the stations recorded standing water then it was assumed that PW as a whole had standing water somewhere in the basin. PW was inventoried during one day each in the months of February (winter), April (spring), July (summer), and September (fall) in 1999 and 2000 (baseline) and 2003-2006 (operation period). To diminish the effects of comparing data from periods of unequal duration, we compared the species observed per unit effort for both the pre and post-operation periods. Because of site vandalism and logistical and monetary constraints early in the study (1999 and 2000), no standard on-site trapping devices were employed at PW. Because of aforementioned constraints, no quantitative data were obtained at PW. Lack of quantitative data diminished our ability to make a definitive assessment of amphibian response to passive hydration at this site. Results and Discussion Weather Rainfall data were reported in CH2M Hill (2008b) and are utilized in this report. Rainfall during the baseline period averaged 51 inches annually. This figure is very close to the historical annual average of approximately 50 inches. Operational period annual rainfall averaged 58 inches, which was eight inches above average. Increased annual rainfall during operational period resulted largely from inputs from the heavy tropical cyclone seasons of 2004 and 2005. Even though PW received consistently more rainfall throughout baseline and operational periods than the other three study sites, there still were lengthy periods of dryness punctuated by heavy rains in both study phases. CH2M Hill (2008b) has further discussion on rainfall trends for PW.
Wetland Hydroperiod Water was present above the wetland ground surface 68 percent of the time during baseline and 99 percent of the time during operation (CH2M Hill 2008b). Effects of Passive Hydration on Parkland Wetland During the operational period, the surface water was held at higher elevations and for longer periods than during the baseline period. Average baseline and operational periods daily water elevations differed by a mean value of 1.55 feet (CH2M Hill 2008b). Water quality parameters were within expected values for surface water systems in Brevard County and adjacent areas in central Florida. The Parkland Wetland exhibits water quality typical of Class III Surface Waters and a wetland receiving runoff from an urban area. The operational period did not significantly affect water quality parameters compared to the baseline period (CH2M Hill 2008b). Effects of Passive Hydration on Amphibians Making a definitive assessment of the effects of passive hydration on amphibians was not possible because of the lack of quantitative sampling and unavailability of a control site. However, drawing from the experience of conducting inventories on this wetland before and after weir installation, the authors believe that the amphibian fauna of PW was neither positively nor negatively affected by the installation of a weir during the course of this project. Amphibian activity and reproduction were affected by rainfall and drought throughout the study. Numbers of species of adults and larvae increased during rainy periods and decreased during dry periods both before and after passive hydration. Five species were observed during baseline. Ten species were observed during the operational period. Sampling duration was twice as long in post-operation period than in the pre-operation period. Except for one species (the two-toed amphiuma), species composition of baseline was a subset of that for post-operation. This similarity is probably because we did not have time enough to observe all potential species for the site during the shorter baseline sampling period. If given enough time in baseline, we probably would have accumulated equal or very similar species composition as that observed during post-operation. The drop out of the two-toed amphiuma in post-operation probably is explained by sampling bias, not a true species decline. To diminish the biasing effects of comparing data from periods of unequal duration, we computed the species observed per unit effort and determined that the total number of amphibian species observed per unit sampling effort was identical for the pre and post-operation periods. This provided an indication that the amphibian species richness did not measurably change from baseline to operation. All species observed were expected occurrences for this location.
OVERALL PROJECT DISCUSSION Although results from this study were inconclusive regarding the effects of active or passive hydration on amphibians, other studies from around the Southeast confirm that there can be both positive and negative effects on amphibians from active hydrations. A recent study from southern Louisiana demonstrated benefits of wetlands augmentation to pond breeding amphibians (Seigel et al. 2006). During a seven-week period, researchers added 366,000 L of water from nearby wells to an important breeding pond of the highly imperiled dusky gopher frog (Rana sevosa). Water level of the pond was increased and maintained during a dry period until a heavy natural rainfall filled the pond basin. This avoided what may have been a complete larval mortality. Instead, 130 metamorphic frogs were produced in the first successful reproduction in three years. In this case, the addition of supplemental water into a breeding pond allowed a rare species to successfully reproduce and avoid possible extirpation. A study of a 30-year groundwater augmentation at Round Pond in Hillsborough County, Florida, provides an example of negative effects to fauna of altering water quality of treated wetlands (Brenner et al. 2000). This research documented the bioaccumulation of 226RA in fishes (bone), unionid mussels (shell and mantle), plants, and lake-bottom sediments from groundwater originating in phosphate-rich sediments of the Floridan aquifer system in the Tampa Bay area. The data suggest that high levels of radium in soft tissues could represent an important pathway for transfer of radionuclides into higher trophic levels in both aquatic and terrestrial food webs. This SJRWMD augmentation pilot study was the first to investigate the effects of augmentation on amphibians at impacted sites in east central Florida. A second similar study in the Southwest Florida Water Management District (SWFWMD) was initiated in October 1997 at an impacted wellfield site called Brooker Creek Preserve (Wildlands Conservation in press). During their study’s baseline period, experimental wetlands were characterized as severely desiccated communities with xeric-adapted species present such as the six-lined racerunner (Cnemidophorus sexlineatus). Virtually no aquatic amphibians had been observed in these impacted wetlands since the El Niño rainfall pattern of 1997-98. In the first augmentation year (2003), increased rainfall led to an increased occurrence of wetland adapted species such as the southern leopard frog (Rana sphenocephala) and pig frog (R. grylio) at both experimental and control sites. Because of vacillating climate extremes during their study, wetlands quickly went from having wildlife populations comprised predominantly of species found in xeric and mesic habitats to rapid influxes of species that prefer wetlands—and back again. In that study, amphibians and birds seemed to respond most readily to hydrological changes (Wildlands Conservation in press). Their study’s results mirrored our own in that species apparently responded well to increased rainfall and hydroperiod in both augmented and non-augmented wetlands. Inconclusive results from our amphibian study resulted from several factors. Insufficient study design at three sites (TR, BS, PW) eliminated our ability to make definitive final
assessments in this study. At PO, there was sufficiently rigorous experimental design in order to make a definitive assessment of amphibian response to augmentation; however, from an amphibian’s perspective, water input was not significant enough to measurably affect the experimental wetland. In this study, weather conditions often were marked by severe drought. During drought, at PO, supplemental water from augmentation typically did not remain for long on the surface of the experimental wetland. Supplemental water, when applied to the parched wetland basin, rapidly percolated into the surficial aquifer system. There was not the requisite boost in hydroperiod that amphibians needed in order to breed more successfully or sustain high activity during drought. Of particular concern in this study was whether augmentation using water of a different chemical constitution in experimental wetlands would have significant impacts on the species diversity or reproductive success of pond-breeding amphibians present in these wetlands. Hydrological results from this study indicated that measured water quality parameters did not differ between baseline and hydration/operational periods. This probably resulted from a combination of factors including well-conceived hydration techniques utilized by CH2M Hill, dilution by heavy rain, and some discharge of supplemental water into the surficial aquifer system. Introducing groundwater to the wetland’s edge to allow groundwater to be conditioned by wetland soil and detritus as described in CH2M Hill’s report likely will benefit amphibian populations because water quality changes will be diminished by this technique. Amphibians can be very sensitive to water quality changes. That water quality did not change at any of the study sites is encouraging and positive from a management standpoint. In future augmentations, water quality should be monitored. CH2M Hill (2008b) showed that measured water levels at experimental wetlands were higher during hydration/operation periods for all sites. Cumulative inputs of water from increased rainfall and augmentation during hydration periods were the reason for higher water levels. CPI reported that both control and experimental wetlands filled and dried in unison at PO throughout the entire study. These observations indicated that rainfall dictated the hydrological regime of the experimental wetland at PO. To what extent hydration might have added to the hydroperiod of the experimental pond is unknown and seems insignificant given observations from control ponds. If impacted wetlands are to be artificially hydrated in the future (either active or passive), then what impacted amphibian populations need most out of this procedure is an increase in water residency time (hydroperiod) such that larvae will have enough time to fully metamorphose and recruit into surrounding uplands. The amphibian community of a given wetland should benefit from having standing water during drought periods when other area wetlands are dry. The scheduling of water inputs into the active hydration sites (PO and TR) was well-conceived in this study. Water was added to wetlands during wet seasons and wetlands were given the opportunity to dry during dry seasons. This should be the approach in any future augmentations of ephemeral wetlands. Water levels should be monitored in any future augmentations in order to verify that the targeted hydrograph is attained. Water input design and scheduling were reported in CH2M Hill (2008b).
During periods of impending wetland dry-up, it would be beneficial to amphibians to augment at this time to boost hydroperiod long enough for successful metamorphosis to take place. There were several instances where the experimental pond at TR dried and all aquatic amphibian larvae were lost (Appendix E, Figure 1). If supplemental water had been added during times of low water when abundant larvae were present, then large amphibian die-offs could have been avoided. It is a natural phenomenon for amphibians to perish in drying ephemeral ponds within natural ecosystems. But if the specific goal of management of wetlands is to mitigate or avoid impacts, then managers should “turn on the water” during times when larval amphibians are in danger of perishing in a dry-up. Augmentation should, in theory, be able to supplement water levels to boost the water residency time long enough for larvae to metamorphose. Augmentation could be done on an as-needed basis. Although it didn’t happen in this study, augmentation using calcareous (high pH) groundwater in the future may affect amphibian species diversity and reproductive success. The pH of water in isolated wetlands in Florida is normally very acidic and may be as low as 3.7 (R. C. Means, pers. obs.). Some frog species, such as the pine woods treefrog (Hyla femoralis), readily breed in highly acidic waters (Means and Moler 1979). Acidity of aquatic habitats can affect amphibian distribution, reproduction, and egg and larval growth (Freda and Dunson 1986). The effects of acidity on amphibians are much better understood than the effects of alkalinity. The introduction of basic groundwater into normally acidic wetlands could have serious effects on larval and adult amphibians and should be further investigated before initiating an extensive augmentation project. Amphibian activity primarily was correlated with rainfall at all sites though some response to water residency time was also noted, particularly as pond hydroperiod approached zero. Amphibian response to rainfall is a well documented occurrence in amphibian ecology (Gibbons and Bennett 1974, Dodd 1995, R.P.M. Means 2008). A positive correlation between hydroperiod and the number of species that successfully produce juveniles and the number of individuals produced has also been documented (Pechmann et al. 1989). Additionally, several species are more likely to breed successfully when a pond dries and subsequently fills during a breeding season (Pechmann et al. 1989). Therefore, timing of inundation matters as well as hydroperiod (Paton and Crouch 2002). Many biotic and abiotic factors can influence the presence and successful metamorphosis of amphibian species from a pond such as competition, predation, fish presence/absence, fecundity, and hydroperiod. Active or passive hydration eventually changes the hydroperiod of treated wetlands. Hydroperiod alteration could have a profound impact on the amphibians inhabiting the wetland. For example, increased hydroperiods may allow for an increase in the occurrences of amphibian predators such as fish, crayfish, and other macroinvertebrates. An increase in predation could result in the depletion or elimination of a species from the wetland. Ephemeral wetlands in Florida harbor at least 12 amphibian species that breed exclusively in this wetland type. Some of those species are considered rare or are state and federally listed species. It is important to a diverse amphibian fauna that ephemeral
ponds be managed to remain ephemeral. As a rule of thumb, impacted wetlands should be managed to mimic the historically natural hydrological regime. The occurrence of amphibian abnormalities has been a topic of concern in amphibian biology since the mid 1990’s. Observational increase in amphibian deformities is part of the global amphibian decline dilemma. Deformities can occur in amphibian populations for a number of complex, intertwined reasons (Blaustein and Johnson 2003), but they are often the result of anthropogenic factors such as pollution. The occurrence of physical deformities was extremely low and all but non-existent during this pilot study. We report that the overall physical health of amphibians encountered in the field at all study sites appeared excellent. The authors handled thousands of individuals. Of these, only one young southern leopard frog from the Port Orange Wellfield exhibited a physical abnormality. The frog had an extra, long digit emanating from the side of the right foot. Other regions of the United States, and world, report much higher occurrences of amphibian abnormalities (Blaustein and Johnson 2003). All species encountered at all sites were considered expected occurrences in this study. Appendix C provides information comparing county records with individual study sites. The species captured per study wetland were always an expected subset of the species known to occur in that study wetland’s respective county. It is expected that we did not capture all species known to occur within a given county because we sampled only a tiny subset of habitat types per county. One species that we captured, the gopher frog (Rana capito), is listed as a state species of special concern in Florida. Only one individual female gopher frog was captured during a heavy rain at a PO control pond during baseline. No other species of state or federal listing status were encountered. Exotic amphibian species often were reported from all sites in this study. The greenhouse frog (Eleutherodactylus planirostris) existed at all sites and appeared to be naturalized. The Cuban treefrog (Osteopilus septentrionalis), was encountered frequently at the southernmost site (PW). Cuban treefrogs were documented as single occurrences in 2004, 2005, and 2008 at BS. Two were captured at PO (Pond 3) in 2006. Cuban treefrog data probably represent the expansion of this exotic species from the urban I-95 corridor into wilder, more natural areas inland. This seven year study on amphibians provided more than just data for augmentation assessments. It provided a long-term profile on amphibian species diversity for four sites in heretofore poorly sampled areas—northeast and east central Florida. Data from this study can be used as baseline information in future studies.
• Amphibian activity and reproduction primarily responded to rainfall and secondarily to available surface water during baseline and hydration/operational periods. Amphibian species diversity increased with increased rainfall and decreased during drought.
• Drought conditions during the last two years of the study resulted in fewer
captures and less reproduction than any other equal time period throughout the study, particularly at PO and BS. Although amphibian activity was reduced during this time, CPI scientists predict that populations will rebound once normal rainfall and wetland inundation return.
• Results regarding the potential effect of active hydration on amphibians were
difficult to quantify and considered inconclusive in this study because of: 1) experimental design - there were not enough baseline data available at TR to use as a reference frame for comparisons between pre and post-augmentation; 2) limited measurable hydration effect - at PO, hydration had a minor role in influencing water levels compared to rainfall in the experimental wetland.
• Results regarding the potential effect of passive hydration on amphibians also
were difficult to quantify and considered inconclusive because of: 1) experimental design - at BS, there was no control wetland used as a reference frame to determine background conditions; and at PW, there was no control wetland and a lack of quantitative sampling.
• CPI scientists believe that all four study sites harbor relatively diverse and healthy
amphibian communities. Although quantification of the effects of active and passive hydration was difficult and considered inconclusive, we believe no detrimental effects to amphibian communities resulted from active and passive hydrations in this study.
Recommendations
• Hydroperiod plays a major role in determining which amphibian species will inhabit a given wetland. Ephemeral wetlands typically harbor many amphibian species that cannot tolerate the presence of predaceous fishes in order to successfully reproduce. Permanent wetlands containing predaceous fishes typically harbor a different suite of amphibian fauna. When restoring or augmenting a wetland with either active or passive hydration, the appropriate hydroperiod for the wetland type must be considered. Increasing the hydroperiod may result in changing the amphibian species composition of a wetland by introducing predators of amphibian larvae.
• When using active or passive hydration techniques, land managers should restore
impacted wetlands to mimic the historically natural hydrological conditions. For example, if a wetland was naturally ephemeral, then the management approach should allow for periodic seasonal dryings.
• Whereas augmented ephemeral wetlands should be allowed to dry seasonally,
active hydration also could be performed during periods of impending dry-up on an as-needed basis to boost wetland hydroperiod long enough so that larval amphibians can successfully metamorphose and recruit into the uplands. After metamorphosis, active hydration could be suspended so that ponds are allowed to dry or otherwise respond to natural conditions. Water levels within the hydrated wetlands should be monitored during reproductive periods to ensure there is sufficient water for reproductive success. Reproduction can occur year-round in Florida and varies by species, but winter, spring, and summer are the most reproductively active seasons.
• Water quality should be monitored during active or passive hydration prior to-
and after implementing the strategy. Changes in surface water quality resulting from hydration should be viewed as having the potential to negatively impact amphibian communities and alter wetland ecological function.
REFERENCES Alford, R. A., and S. J. Richards. 1999. Global amphibian declines: a problem in applied ecology. Annu. Rev. Ecol. Syst. 30:133-165. Blaustein, A. R., and P. T. J. Johnson. 2003. The complexity of deformed amphibians. Front. Ecol. Environ. 1(2), 87-94. Brenner, M., J. M. Smoak, M. S. Allen, and C. L. Schelske. 2000. Biological accumulation of 226 Radium in a groundwater-augmented Florida lake. Limnol. Oceanogr. 45(3): 710-715. Bury, R. B. and P. S. Corn. 1987. Evaluation of pitfall trapping in northwestern forests: trap arrays with drift fences. J. of Wildl. Mgt. 51:112-119. CH2M Hill. 1996. Water supply needs and sources assessment. Alternative water supply strategies investigation. Wetlands impact, mitigation, and planning-level cost estimating procedures. Special Publications SJ96-SP7. Prepared for St. Johns River Water Management District, Palatka, Florida. CH2M Hill. 1997. A methodology for evaluating wetland augmentation systems. Technical Memorandum E.2.D. CH2M Hill, Gainesville, FL. CH2M Hill. 2006. Demonstration Project No. 1 Tillman Ridge Wellfield, St. Johns County, Florida. Fifth annual hydration report prepared for St. Johns River Water Management District, Palatka, Florida. CH2M Hill. 2007a. Demonstration Project No. 3 City of Port Orange Wellfield. Fifth annual hydration report prepared for St. Johns River Water Management District, Palatka, Florida. CH2M Hill. 2007b. Demonstration Project No. 4 City of Titusville Well Field Operational Conditions at Parkland Wetland. Fifth Annual Report Prepared for St. Johns River Water Management District, Palatka, Florida. CH2M Hill. 2008a. Demonstration Project No. 2 St. Johns County, Florida Bennett Swamp control weir operational conditions. Fifth annual report prepared for St. Johns River Water Management District, Palatka, Florida. CH2M Hill. 2008b. Summary of results impact avoidance project. Project final report prepared for the St. Johns River Water Management District, Palatka, Florida. Dodd, C. K., Jr., et al. In press. Diversity and similarity. In (eds), Oxford University Press. Dodd, C. K., Jr. 1995. The ecology of a sandhills population of the eastern narrow-mouthed toad, Gastrophryne carolinensis, during a drought. Bull. Florida Mus. Nat. Hist., Biol. Sci. 38, Pt. I (1):11-41.
Dodd, C. K., Jr. 1997. Imperiled amphibians: a historical perspective. In G. W. Benz and D. E. Collins (eds.), Aquatic fauna in peril: The southeastern perspective, pp. 165-200. Special Publication 1, Southeast Aquatic Research Institute, Lenz Design and Communications, Decatur, GA. Dodd, C.K., Jr., Barichivich, W.J., Johnson, S.A., and Staiger, J.R. 2007. Changes in a northwestern Florida Gulf Coast herpetofaunal community over a 28-y period. American Midland Naturalist 158: 29-48. Franz, R. and R. C. Means. 2001. Herpetofauna of impacted wetlands on municipal well fields in East Florida: a pre-augmentation assessment. Final Report submitted to the St. Johns River Water Management District. 53pp. Freda, J., and W. A. Dunson. 1986. Effects of low pH and other chemical variables on the local distribution of amphibians. Copeia 1986: 454-466. Gibbons, J. W., and D. H. Bennett. Determination of anuran terrestrial activity patterns by a drift fence method. Copeia 1974(1): 236-242. IUCN, Conservation International, and NatureServe. 2004. Global amphibian assessment. www.globalamphibians.org. Downloaded on 15 October 2004. Jones, K. B. 1986. Amphibians and reptiles. In A. Y. Cooperrider, R. J. Boyd, and H. R. Stuart (eds.), Inventory and monitoring of wildlife habitat, pp. 267-290. U.S.D.I. Bureau of Land Management Service Center, Denver, CO. Lannoo, M. (ed.). 2005. Amphibian declines: the conservation status of United States species. University of California Press, Berkeley, CA, USA. Means, D. B. 2003. Vertebrate faunal diversity in longleaf pine savannas. Chapter 9 in S. Jose, E. Jokela, and D. Miller, eds. Longleaf pine ecosystems: ecology, management, and restoration. Springer-Verlag. (In press.) Means, D. B. and P. E. Moler. 1979. The pine barrens treefrog: fire, seepage bogs, and management implications. In R. R. Odum and L. Landers (eds.), Proc. rare and endangered wildlife symposium, pp. 77-83. Georgia Dept. Natural Resources Game and Fish Division Technical Bulletin WL-4. Means, R. C. 2001. Herpetofauna of impacted wetlands in East Florida: a pre-augmentation assessment. University of Florida thesis. 122pp. Means, R. C. 2006. Assessment of amphibian response to wetlands augmentation. Annual contract report to the St. Johns River Water Management District, Palatka, FL. Means, R. C. 2007. Assessment of amphibian response to wetlands augmentation. Annual contract report to the St. Johns River Water Management District, Palatka, FL.
Means, R. C. 2008. Assessment of amphibian response to wetlands augmentation. Annual contract report to the St. Johns River Water Management District, Palatka, FL. Means, R.C. and L.R. Franz. 2005. Herpetofauna of impacted wetlands in east Florida: a pre-augmentation assessment. In W. Meshaka and K. Babbitt (eds.) Amphibians and reptiles: status and conservation in Florida, pgs 23-31. Krieger Press. Means, R. C. and R. P. Meegan. 2003. Assessment of amphibian response to wetlands augmentation. Annual contract report to the St. Johns River Water Management District, Palatka, FL. Means, R. C. and R. P. Meegan. 2004. Assessment of amphibian response to wetlands augmentation. Annual contract report to the St. Johns River Water Management District, Palatka, FL. Means, R. C. and R. P. Meegan. 2005. Assessment of amphibian response to wetlands augmentation. Annual contract report to the St. Johns River Water Management District, Palatka, FL. Means, R. P. M. 2008. Management strategies for Florida’s ephemeral ponds and pond-breeding amphibians. Final report to the Florida Fish and Wildlife Conservation Commission. Coastal Plains Institute, Tallahassee, Florida, USA. Pawar, S.S., Rawat, G.S., and Choundhury, B.C. 2004. Recovery of frog and lizard communities following primary habitat alteration in Mizoram, northeast India. BMC Ecology, Online: www.biomedcentral.com/1472-6785/4/10. Pieterson, E. C., Addison, L. M., Agobian, J. N., Brooks-Solveson, B., Cassani, J., and Everham III, E., M. 2006. Five years of the southwest Florida frog monitoring network: changes in frog communities as an indicator of landscape change. Florida Scientist 69: 117-126. Seigel, R. A., A. Dinsmore, and S.C. Richter. 2006. Using well water to increase hydroperiod as a management option for pond-breeding amphibians. Wildlife Society Bulletin 34: 1022-1027. Toth, D. J. 1994. Projected aquifer drawdowns Tillman Ridge Wellfield St. Johns County, Florida. Professional Paper SJ94-pp 4. 19 pages. St. Johns River Water Management District, Palatka, Florida. U.S. Geological Survey. 1990. National water summary 1987—hydrologic events and water supply and use. U. S. Geological Survey Water Supply Paper no. 2350. 553 p. Vergara, B. 1994. Water supply needs and sources assessment. Technical Publication SJ94-7. SJWRMD. Palatka, FL.
Vergara, B. 1998. Water Supply Assessment Technical Publication SJ98-2. SJRWMD, Palatka, FL. Wildlands Conservation. In press. Brooker Creek Preserve wetlands rehydration project. Final report submitted to Pinellas County Utilities Department.
APPENDIX Appendix A. Site maps and photos Appendix B. Pond hydroperiod tables for Tillman Ridge Wellfield, Bennett Swamp,
and Port Orange Wellfield Appendix C. Data collected during the baseline and hydration periods of the project Appendix D. Rainfall and hydroperiod data for hydration period of the project Appendix E. Species diversity data and analyses for baseline and hydration periods Appendix F. Select amphibian photos Appendix G. CPI justifications for unincorporated comments by SJRWMD staff Appendix H. Amphibian augmentation database excel file
Appendix A. ‗‗‗‗‗‗‗‗‗‗‗‗‗‗‗‗‗‗‗‗‗‗‗‗‗‗‗‗‗‗‗‗‗‗‗‗‗‗‗‗‗‗‗‗‗‗‗‗‗‗‗‗‗‗‗‗‗‗‗‗‗‗‗‗‗‗‗‗‗‗‗‗‗‗‗‗‗‗‗‗‗‗‗‗‗‗‗‗‗‗‗‗‗‗‗‗
Appendix A. Site maps and photos. Figure 1. Map of Tillman Ridge Wellfield and surrounding area Figure 2. Map of the Bennett Swamp study area Figure 3. Map of the Port Orange Wellfield study area Figure 4. Map of the Parkland Wetland study area Figure 5. Photos of Tillman Ridge Wellfield study ponds Figure 6. Photos of the Bennett Swamp sampling stations Figure 7. Photos of Port Orange Wellfield study ponds Figure 8. Photos of the Parkland Wetland sampling stations
Appendix A. ‗‗‗‗‗‗‗‗‗‗‗‗‗‗‗‗‗‗‗‗‗‗‗‗‗‗‗‗‗‗‗‗‗‗‗‗‗‗‗‗‗‗‗‗‗‗‗‗‗‗‗‗‗‗‗‗‗‗‗‗‗‗‗‗‗‗‗‗‗‗‗‗‗‗‗‗‗‗‗‗‗‗‗‗‗‗‗‗‗‗‗‗‗‗‗‗
Figure 1. Map of Tillman Ridge Wellfield and surrounding area. The wellfield is five miles west of the city of St. Augustine and surrounded by swamp and low-lying pine flatwoods.
Appendix A. ‗‗‗‗‗‗‗‗‗‗‗‗‗‗‗‗‗‗‗‗‗‗‗‗‗‗‗‗‗‗‗‗‗‗‗‗‗‗‗‗‗‗‗‗‗‗‗‗‗‗‗‗‗‗‗‗‗‗‗‗‗‗‗‗‗‗‗‗‗‗‗‗‗‗‗‗‗‗‗‗‗‗‗‗‗‗‗‗‗‗‗‗‗‗‗‗
Figure 2. Map of the Bennett Swamp study area. The approximately 2540 acre wetland basin is dominated by bays, cypress, and pines.
Appendix A. ‗‗‗‗‗‗‗‗‗‗‗‗‗‗‗‗‗‗‗‗‗‗‗‗‗‗‗‗‗‗‗‗‗‗‗‗‗‗‗‗‗‗‗‗‗‗‗‗‗‗‗‗‗‗‗‗‗‗‗‗‗‗‗‗‗‗‗‗‗‗‗‗‗‗‗‗‗‗‗‗‗‗‗‗‗‗‗‗‗‗‗‗‗‗‗‗
Figure 3. Map of the Port Orange Wellfield study area. The four study ponds are circled in yellow. The property supports extensive pine flatwoods and many isolated and connected cypress wetlands.
Appendix A. ‗‗‗‗‗‗‗‗‗‗‗‗‗‗‗‗‗‗‗‗‗‗‗‗‗‗‗‗‗‗‗‗‗‗‗‗‗‗‗‗‗‗‗‗‗‗‗‗‗‗‗‗‗‗‗‗‗‗‗‗‗‗‗‗‗‗‗‗‗‗‗‗‗‗‗‗‗‗‗‗‗‗‗‗‗‗‗‗‗‗‗‗‗‗‗‗
Figure 4. Map of the Parkland Wetland study area. Parkland Wetland is circled in yellow. The wetland is embedded within suburban Titusville.
Appendix A. ‗‗‗‗‗‗‗‗‗‗‗‗‗‗‗‗‗‗‗‗‗‗‗‗‗‗‗‗‗‗‗‗‗‗‗‗‗‗‗‗‗‗‗‗‗‗‗‗‗‗‗‗‗‗‗‗‗‗‗‗‗‗‗‗‗‗‗‗‗‗‗‗‗‗‗‗‗‗‗‗‗‗‗‗‗‗‗‗‗‗‗‗‗‗‗‗
Figure 5. Photos of Tillman Ridge Wellfield study ponds
Experimental Pond
Control Pond
Appendix A. ‗‗‗‗‗‗‗‗‗‗‗‗‗‗‗‗‗‗‗‗‗‗‗‗‗‗‗‗‗‗‗‗‗‗‗‗‗‗‗‗‗‗‗‗‗‗‗‗‗‗‗‗‗‗‗‗‗‗‗‗‗‗‗‗‗‗‗‗‗‗‗‗‗‗‗‗‗‗‗‗‗‗‗‗‗‗‗‗‗‗‗‗‗‗‗‗
Figure 6. Photos of the Bennett Swamp monitoring stations
Station 1 Station 2
Station 3 Station 4
Appendix A. ‗‗‗‗‗‗‗‗‗‗‗‗‗‗‗‗‗‗‗‗‗‗‗‗‗‗‗‗‗‗‗‗‗‗‗‗‗‗‗‗‗‗‗‗‗‗‗‗‗‗‗‗‗‗‗‗‗‗‗‗‗‗‗‗‗‗‗‗‗‗‗‗‗‗‗‗‗‗‗‗‗‗‗‗‗‗‗‗‗‗‗‗‗‗‗‗
Figure 7. Photos of Port Orange Wellfield study ponds
Experimental Pond (1)
Control Pond (2)
Control Pond (3)
Control Pond (4)
Appendix A. ‗‗‗‗‗‗‗‗‗‗‗‗‗‗‗‗‗‗‗‗‗‗‗‗‗‗‗‗‗‗‗‗‗‗‗‗‗‗‗‗‗‗‗‗‗‗‗‗‗‗‗‗‗‗‗‗‗‗‗‗‗‗‗‗‗‗‗‗‗‗‗‗‗‗‗‗‗‗‗‗‗‗‗‗‗‗‗‗‗‗‗‗‗‗‗‗
Station 2
Station 4
Station 1
Station 3
Figure 8. Photos of the Parkland Wetland sampling stations
Appendix B. ‗‗‗‗‗‗‗‗‗‗‗‗‗‗‗‗‗‗‗‗‗‗‗‗‗‗‗‗‗‗‗‗‗‗‗‗‗‗‗‗‗‗‗‗‗‗‗‗‗‗‗‗‗‗‗‗‗‗‗‗‗‗‗‗‗‗‗‗‗‗‗‗‗‗‗‗‗‗‗‗‗‗‗‗‗‗‗‗‗‗‗‗‗‗‗‗‗‗‗‗‗‗‗‗‗‗‗‗‗‗‗‗‗‗‗‗‗‗‗‗‗‗‗‗‗‗‗‗‗‗‗‗‗‗‗‗‗‗‗‗‗‗‗‗‗‗‗‗‗‗‗‗‗‗‗‗‗‗‗‗
Appendix B. Pond hydroperiod tables for Tillman Ridge Wellfield, Bennett Swamp, and Port Orange Wellfield Table 1. Hydroperiod at Tillman Ridge Wellfield. Hydroperiod data are presented for January-September during the hydration period (2003-2006). Blue shading represents the presence of water. Experimental Pond Control Pond
Jan 03
Feb 03
Mar 03
Apr 03
May 03
Jun 03
Jul 03
Aug 03
Sep 03
Jan 04
Feb 04
Mar 04
Apr 04
May 04
Jun 04
Jul 04
Aug 04
Sep 04
Experimental Pond Control Pond
Jan 05
Feb 05
Mar 05
Apr 05
May 05
Jun 05
Jul 05
Aug 05
Sep 05
Jan 06
Feb 06
Mar06
Apr 06
May 06
Jun 06
Jul 06
Aug 06
Sep 06
Table 2. Hydroperiod at Bennett Swamp. Hydroperiod data are presented for January-September during baseline (1999-2000) and hydration (2004-2008) periods. Blue shading represents the presence of water. Baseline Period Jan 99 Feb 99 Mar 99 Apr 99 May 99 Jun 99 Jul 99 Aug 99Sep 99 Jan 00 Feb 00 Mar 00Apr 00May 00 Jun 00 Jul 00 Aug 00Sep 00 Hydration Period Jan 04
Feb 04
Mar 04
Apr 04
May 04
Jun 04
Jul 04
Aug 04
Sep 04
Jan 05
Feb 05
Mar 05
Apr 05
May 05
Jun 05
Jul 05
Aug 05
Sep 05
Jan 06
Feb 06
Mar 06
Apr 06
May 06
Jun 06
Jul 06
Aug 06
Sep 06
Jan 07
Feb 07
Mar 07
Apr 07
May 07
Jun 07
Jul 07
Aug 07
Sep 07
Jan 08
Feb 08
Mar 08
Apr 08
Appendix B. ‗‗‗‗‗‗‗‗‗‗‗‗‗‗‗‗‗‗‗‗‗‗‗‗‗‗‗‗‗‗‗‗‗‗‗‗‗‗‗‗‗‗‗‗‗‗‗‗‗‗‗‗‗‗‗‗‗‗‗‗‗‗‗‗‗‗‗‗‗‗‗‗‗‗‗‗‗‗‗‗‗‗‗‗‗‗‗‗‗‗‗‗‗‗‗‗‗‗‗‗‗‗‗‗‗‗‗‗‗‗‗‗‗‗‗‗‗‗‗‗‗‗‗‗‗‗‗‗‗‗‗‗‗‗‗‗‗‗‗‗‗‗‗‗‗‗‗‗‗‗‗‗‗‗‗‗‗‗‗‗
Table 3. Hydroperiod at Port Orange Wellfield. Hydroperiod data are presented for January-September during baseline (1999-2000) and hydration (2003-2007) periods. Blue shading represents the presence of water. Baseline Period Experimental Pond (1) Control Pond (2) Control Pond (3) Control Pond (4)
Jan 99
Feb 99
Mar 99
Apr 99
May 99
Jun 99
Jul 99
Aug 99
Sep 99
Jan 00
Feb 00
Mar 00
Apr 00
May 00
Jun 00
Jul 00
Aug 00
Sep 00
Hydration Period Experimental Pond (1) Control Pond (2) Control Pond (3) Control Pond (4)
Jan 03
Feb 03
Mar 03
Apr 03
May 03
Jun 03
Jul 03
Aug 03
Sep 03
Jan 04
Feb 04
Mar 04
Apr 04
May 04
Jun 04
Jul 04
Aug 04
Sep 04
Jan 05
Feb 05
Mar 05
Apr 05
May 05
Experimental Pond (1) Control Pond (2) Control Pond (3) Control Pond (4)
Jun 05
Jul 05
Aug 05
Sep 05
Jan 06
Feb 06
Mar 06
Apr 06
May 06
Jun 06
Jul 06
Aug 06
Sep 06
Jan 07
Feb 07
Mar 07
Apr 07
May 07
Jun 07
Jul 07
Aug 07
Sep 07
Appendix C. ‗‗‗‗‗‗‗‗‗‗‗‗‗‗‗‗‗‗‗‗‗‗‗‗‗‗‗‗‗‗‗‗‗‗‗‗‗‗‗‗‗‗‗‗‗‗‗‗‗‗‗‗‗‗‗‗‗‗‗‗‗‗‗‗‗‗‗‗‗‗‗‗‗‗‗‗‗‗‗‗‗‗‗‗‗‗‗‗‗‗‗‗‗‗‗‗
Appendix C. Data collected during the baseline and hydration periods of the project. Table 1. Scientific names of amphibian species captured or observed throughout assessment
project Table 2. County list of amphibian species with a comparative species list from Tillman
Ridge Wellfield. Table 3. County list of amphibian species with a comparative species list from Bennett
Swamp and Port Orange Wellfield Table 4. County list of amphibian species with a comparative species list from Parkland
Wetland Table 5. Quantitative species diversity data from the Tillman Ridge Wellfield study site Table 6. Quantitative species diversity data from the Bennett Swamp study site Table 7. Quantitative species diversity data from the Port Orange Wellfield study site
Appendix C. ‗‗‗‗‗‗‗‗‗‗‗‗‗‗‗‗‗‗‗‗‗‗‗‗‗‗‗‗‗‗‗‗‗‗‗‗‗‗‗‗‗‗‗‗‗‗‗‗‗‗‗‗‗‗‗‗‗‗‗‗‗‗‗‗‗‗‗‗‗‗‗‗‗‗‗‗‗‗‗‗‗‗‗‗‗‗‗‗‗‗‗‗‗‗‗‗
Table 1. Scientific names of amphibian species captured or observed throughout assessment project. “*” denotes non-native species.
Salamanders
Amphiuma means Two-toed amphiuma Eurycea quadridigitata Dwarf salamander
Appendix C. ‗‗‗‗‗‗‗‗‗‗‗‗‗‗‗‗‗‗‗‗‗‗‗‗‗‗‗‗‗‗‗‗‗‗‗‗‗‗‗‗‗‗‗‗‗‗‗‗‗‗‗‗‗‗‗‗‗‗‗‗‗‗‗‗‗‗‗‗‗‗‗‗‗‗‗‗‗‗‗‗‗‗‗‗‗‗‗‗‗‗‗‗‗‗‗‗
Table 2. County list of amphibian species with a comparative species list from Tillman Ridge Wellfield. County lists were based on the Florida Museum of Natural History Herpetology Database and Lannoo (2005). Tillman Ridge Wellfield list is compiled from all sampling techniques (drift fence, aural, dipnet, and visual surveys) conducted in 2000 and 2003-2006. “*” denotes non-native species.
Species St. Johns County
Tillman Ridge Experimental
Pond
Tillman Ridge Control Pond
Salamanders Two-toed amphiuma X Dwarf salamander X X Striped newt X Central newt X Dwarf siren X Frogs Florida cricket frog X X X Oak toad X X X Southern toad X X X Greenhouse frog* X X X Eastern narrowmouth X X X Green treefrog X X Pine woods treefrog X X X Barking treefrog X X Squirrel treefrog X X Spring peeper X X Southern chorus frog X Little grass frog X X Gopher frog X Bullfrog X Bronze frog X X Pig frog X X River frog X Southern leopard frog X X X Eastern spadefoot X X X Total Number of Species 24 14 10
Appendix C. ‗‗‗‗‗‗‗‗‗‗‗‗‗‗‗‗‗‗‗‗‗‗‗‗‗‗‗‗‗‗‗‗‗‗‗‗‗‗‗‗‗‗‗‗‗‗‗‗‗‗‗‗‗‗‗‗‗‗‗‗‗‗‗‗‗‗‗‗‗‗‗‗‗‗‗‗‗‗‗‗‗‗‗‗‗‗‗‗‗‗‗‗‗‗‗‗
Table 3. County list of amphibian species with a comparative species list from Bennett Swamp and Port Orange Wellfield. County lists were based on Florida Museum of Natural History Herpetology Database and Lannoo (2005). Bennett Swamp list is compiled from all survey techniques (drift fence, aural, dipnet, and visual surveys) conducted in 1999-2000 and 2004-2008. Port Orange Wellfield list is compiled from all survey techniques (drift fence, aural, dipnet, and visual surveys) conducted in 1999-2000 and 2003-2007. “*” denotes non-native species.
Species Volusia County
Bennett Swamp
Port Orange Experimental Pond (1)
Port Orange Control Pond (2)
Port Orange Control Pond (3)
Port Orange Control Pond (4)
Salamanders Two-toed amphiuma X Southern dusky salamander X Dwarf salamander X X X X X Central newt X Dwarf siren X X X X Frogs Florida cricket frog X X X X X X Oak toad X X X X X X Southern toad X X X X X X Greenhouse frog* X X X X X X Eastern narrowmouth X X X X X X Green treefrog X X X X X X Pine woods treefrog X X X X X X Barking treefrog X X X X X Squirrel treefrog X X X X X X Cuban treefrog* X X X Spring peeper X Southern chorus frog X X X X X X Little grass frog X X X X X X Gopher frog X X Bronze frog X X River frog X Pig frog X X X X X X Southern leopard frog X X X X X X Eastern spadefoot X Total Number of Species 24 16 15 14 16 14
Appendix C. ‗‗‗‗‗‗‗‗‗‗‗‗‗‗‗‗‗‗‗‗‗‗‗‗‗‗‗‗‗‗‗‗‗‗‗‗‗‗‗‗‗‗‗‗‗‗‗‗‗‗‗‗‗‗‗‗‗‗‗‗‗‗‗‗‗‗‗‗‗‗‗‗‗‗‗‗‗‗‗‗‗‗‗‗‗‗‗‗‗‗‗‗‗‗‗‗
Table 4. County list of amphibian species with a comparative species list from Parkland Wetland. County lists were based on Florida Museum of Natural History Herpetology Database and Lannoo (2005). Parkland Wetland list is compiled from all survey techniques (aural, dipnet, and visual surveys) conducted in 1999-2000 and 2003-2006. “*” denotes non-native species.
Species Brevard County
Parkland Wetland
Salamanders Two-toed amphiuma X X Dwarf salamander X Central newt X X Dwarf siren X Frogs Florida cricket frog X X Oak toad X Southern toad X X Greenhouse frog* X X Eastern narrowmouth X X Green treefrog X X Pine woods treefrog X Barking treefrog X Squirrel treefrog X X Cuban treefrog* X X Southern chorus frog X Little grass frog X Gopher frog X Pig frog X X Southern leopard frog X X Eastern spadefoot X Total Number of Species 20 11
Appendix C. ‗‗‗‗‗‗‗‗‗‗‗‗‗‗‗‗‗‗‗‗‗‗‗‗‗‗‗‗‗‗‗‗‗‗‗‗‗‗‗‗‗‗‗‗‗‗‗‗‗‗‗‗‗‗‗‗‗‗‗‗‗‗‗‗‗‗‗‗‗‗‗‗‗‗‗‗‗‗‗‗‗‗‗‗‗‗‗‗‗‗‗‗‗‗‗‗
Table 6. Quantitative species diversity data from the Tillman Ridge Wellfield study site. Data represent new captures obtained by drift fence arrays and are presented for baseline (2000) and hydration (2003-2006) periods. “*” denotes non-native species.
Experimental Pond Control Pond Species 2000 2003 2004 2005 2006 2000 2003 2004 2005 2006
Appendix C. ‗‗‗‗‗‗‗‗‗‗‗‗‗‗‗‗‗‗‗‗‗‗‗‗‗‗‗‗‗‗‗‗‗‗‗‗‗‗‗‗‗‗‗‗‗‗‗‗‗‗‗‗‗‗‗‗‗‗‗‗‗‗‗‗‗‗‗‗‗‗‗‗‗‗‗‗‗‗‗‗‗‗‗‗‗‗‗‗‗‗‗‗‗‗‗‗
Table 7. Quantitative species diversity data from the Bennett Swamp study site. Data represent new captures obtained by drift fence arrays and are presented for baseline (1999-2000) and operational (2004-2008) periods. “*” denotes non-native species. Species 1999 2000 2004 2005 2006 2007 2008 Salamanders Dwarf salamander 0 0 1 1 0 0 0 Frogs Florida cricket frog 17 8 10 21 4 0 0 Oak toad 3 2 4 5 0 0 0 Southern toad 191 20 1 21 7 3 0 Greenhouse frog 35 49 17 8 7 10 0 Eastern narrowmouth toad 70 25 15 15 18 3 0 Pine woods treefrog 25 48 24 42 23 2 1 Squirrel treefrog 0 23 20 14 10 2 0 Cuban treefrog * 0 0 1 1 0 0 1 Little grass frog 3 1 3 3 0 0 0 Bronze frog 0 0 1 0 0 0 0 Pig frog 0 0 0 6 0 0 0 Southern leopard frog 34 49 3 38 2 1 0 Total number of individuals 378 225 100 175 71 21 2 Total number of species 8 9 12 12 7 6 2
Appendix C. ‗‗‗‗‗‗‗‗‗‗‗‗‗‗‗‗‗‗‗‗‗‗‗‗‗‗‗‗‗‗‗‗‗‗‗‗‗‗‗‗‗‗‗‗‗‗‗‗‗‗‗‗‗‗‗‗‗‗‗‗‗‗‗‗‗‗‗‗‗‗‗‗‗‗‗‗‗‗‗‗‗‗‗‗‗‗‗‗‗‗‗‗‗‗‗‗‗‗‗‗‗‗‗‗‗‗‗‗‗‗‗‗‗‗‗‗‗‗‗‗‗‗‗‗‗‗‗‗‗‗‗‗‗‗‗‗‗‗‗‗‗‗‗‗‗‗‗‗‗‗‗‗‗‗‗‗‗‗‗‗‗‗‗‗
Table 8. Quantitative species diversity data from Port Orange Wellfield study site. Data represent new captures obtained by drift fence arrays and are presented for baseline (1999-2000) and hydration (2003-2007) periods. “*” denotes non-native species.
Appendix D. ‗‗‗‗‗‗‗‗‗‗‗‗‗‗‗‗‗‗‗‗‗‗‗‗‗‗‗‗‗‗‗‗‗‗‗‗‗‗‗‗‗‗‗‗‗‗‗‗‗‗‗‗‗‗‗‗‗‗‗‗‗‗‗‗‗‗‗‗‗‗‗‗‗‗‗‗‗‗‗‗‗‗‗‗‗‗‗‗‗‗‗‗‗‗‗‗‗‗‗‗‗‗‗‗
Appendix D. Rainfall and hydroperiod data for hydration period of the project. Figure 1. Comparison of number of individuals captured and rainfall per year at Tillman Ridge
Wellfield Figure 2. Comparison of number of species captured and rainfall per year at Tillman Ridge
Wellfield Figure 3. Comparison of number of individuals captured and rainfall per year at Port Orange
Wellfield Figure 4. Comparison of number of species captured and rainfall per year at Port Orange
Wellfield Figure 5. Comparison of water residency days and number of individuals, metamorphic
individuals, and species captured at Tillman Ridge Wellfield Experimental Pond Figure 6. Comparison of water residency days and number of individuals, metamorphic
individuals, and species captured at Tillman Ridge Wellfield Control Pond Figure 7. Comparison of water residency days and number of individuals, metamorphic
individuals, and species captured at Port Orange Wellfield Experimental Pond (1) Figure 8. Comparison of water residency days and number of individuals, metamorphic
individuals, and species captured at Port Orange Wellfield Control Pond (2) Figure 9. Comparison of water residency days and number of individuals, metamorphic
individuals, and species captured at Port Orange Wellfield Control Pond (3) Figure 10. Comparison of water residency days and number of individuals, metamorphic
individuals, and species captured at Port Orange Wellfield Control Pond (4)
Appendix D. ‗‗‗‗‗‗‗‗‗‗‗‗‗‗‗‗‗‗‗‗‗‗‗‗‗‗‗‗‗‗‗‗‗‗‗‗‗‗‗‗‗‗‗‗‗‗‗‗‗‗‗‗‗‗‗‗‗‗‗‗‗‗‗‗‗‗‗‗‗‗‗‗‗‗‗‗‗‗‗‗‗‗‗‗‗‗‗‗‗‗‗‗‗‗‗‗‗‗‗‗‗‗‗‗‗‗‗‗‗‗‗‗‗‗‗‗‗‗‗‗‗‗‗‗‗‗‗‗‗‗‗‗‗‗‗‗‗‗‗‗‗
Figure 1. Comparison of number of individuals captured and rainfall per year at Tillman Ridge Wellfield. Capture data represent new captures from drift fence arrays. Capture data (left vertical axis) and rainfall (right vertical axis) are reported for the 9 sampling weeks in each year from 2003 -2006.
Appendix D. ‗‗‗‗‗‗‗‗‗‗‗‗‗‗‗‗‗‗‗‗‗‗‗‗‗‗‗‗‗‗‗‗‗‗‗‗‗‗‗‗‗‗‗‗‗‗‗‗‗‗‗‗‗‗‗‗‗‗‗‗‗‗‗‗‗‗‗‗‗‗‗‗‗‗‗‗‗‗‗‗‗‗‗‗‗‗‗‗‗‗‗‗‗‗‗‗‗‗‗‗‗‗‗‗‗‗‗‗‗‗‗‗‗‗‗‗‗‗‗‗‗‗‗‗‗‗‗‗‗‗‗‗‗‗‗‗‗‗‗‗‗
Figure 2. Comparison of number of species captured and rainfall per year at Tillman Ridge Wellfield. Species data represent captures from drift fence arrays. Rainfall and capture data are reported for the 9 sampling weeks in each year from 2003 -2006.
Appendix D. ‗‗‗‗‗‗‗‗‗‗‗‗‗‗‗‗‗‗‗‗‗‗‗‗‗‗‗‗‗‗‗‗‗‗‗‗‗‗‗‗‗‗‗‗‗‗‗‗‗‗‗‗‗‗‗‗‗‗‗‗‗‗‗‗‗‗‗‗‗‗‗‗‗‗‗‗‗‗‗‗‗‗‗‗‗‗‗‗‗‗‗‗‗‗‗‗‗‗‗‗‗‗‗‗‗‗‗‗‗‗‗‗‗‗‗‗‗‗‗‗‗‗‗‗‗‗‗‗‗‗‗‗‗‗‗‗‗‗‗‗‗
Figure 3. Comparison of number of individuals captured and rainfall per year at Port Orange Wellfield. Capture data represent new captures from drift fence arrays. Capture data (left axis) and rainfall (right axis) are reported for 9 sampling weeks in 2003 -2006 and 4 sampling weeks in 2007. Lack of rainfall data for May-September in 2007 prevented reporting of the full 9 weeks for that year.
Appendix D. ‗‗‗‗‗‗‗‗‗‗‗‗‗‗‗‗‗‗‗‗‗‗‗‗‗‗‗‗‗‗‗‗‗‗‗‗‗‗‗‗‗‗‗‗‗‗‗‗‗‗‗‗‗‗‗‗‗‗‗‗‗‗‗‗‗‗‗‗‗‗‗‗‗‗‗‗‗‗‗‗‗‗‗‗‗‗‗‗‗‗‗‗‗‗‗‗‗‗‗‗‗‗‗‗‗‗‗‗‗‗‗‗‗‗‗‗‗‗‗‗‗‗‗‗‗‗‗‗‗‗‗‗‗‗‗‗‗‗‗‗‗
Figure 4. Comparison of number of species captured and rainfall per year at Port Orange Wellfield. Species data represent captures from drift fence arrays. Capture data (left axis) and rainfall (right axis) are reported for the 9 sampling weeks in each year from 2003 -2006 and 4 sampling weeks in 2007. Lack of rainfall data for May-September in 2007 prevented reporting of full 9 weeks for that year.
Appendix D. ‗‗‗‗‗‗‗‗‗‗‗‗‗‗‗‗‗‗‗‗‗‗‗‗‗‗‗‗‗‗‗‗‗‗‗‗‗‗‗‗‗‗‗‗‗‗‗‗‗‗‗‗‗‗‗‗‗‗‗‗‗‗‗‗‗‗‗‗‗‗‗‗‗‗‗‗‗‗‗‗‗‗‗‗‗‗‗‗‗‗‗‗‗‗‗‗‗‗‗‗‗‗‗‗‗‗‗‗‗‗‗‗‗‗‗‗‗‗‗‗‗‗‗‗‗‗‗‗‗‗‗‗‗‗‗‗‗‗‗‗‗
Figure 5. Comparison of water residency days and number of individuals, metamorphic individuals, and species captured at Tillman Ridge Wellfield Experimental Pond. Water residency days (left vertical axis) represents the number of days in a given year that a pond held water. Total number of individuals and number of metamorphic individuals (left vertical axis) and number of species (right vertical axis) represent new captures from drift fence arrays for the 9 sampling weeks in each year from 2003 -2006.
Appendix D. ‗‗‗‗‗‗‗‗‗‗‗‗‗‗‗‗‗‗‗‗‗‗‗‗‗‗‗‗‗‗‗‗‗‗‗‗‗‗‗‗‗‗‗‗‗‗‗‗‗‗‗‗‗‗‗‗‗‗‗‗‗‗‗‗‗‗‗‗‗‗‗‗‗‗‗‗‗‗‗‗‗‗‗‗‗‗‗‗‗‗‗‗‗‗‗‗‗‗‗‗‗‗‗‗‗‗‗‗‗‗‗‗‗‗‗‗‗‗‗‗‗‗‗‗‗‗‗‗‗‗‗‗‗‗‗‗‗‗‗‗‗
Figure 6. Comparison of water residency days and number of individuals, metamorphic individuals, and species captured at Tillman Ridge Wellfield Control Pond. Water residency days (left vertical axis) represents the number of days in a given year that a pond held water. Total number of individuals and number of metamorphic individuals (left vertical axis) and number of species (right vertical axis) represent new captures from drift fence arrays for the 9 sampling weeks in each year from 2003 -2007.
Appendix D. ‗‗‗‗‗‗‗‗‗‗‗‗‗‗‗‗‗‗‗‗‗‗‗‗‗‗‗‗‗‗‗‗‗‗‗‗‗‗‗‗‗‗‗‗‗‗‗‗‗‗‗‗‗‗‗‗‗‗‗‗‗‗‗‗‗‗‗‗‗‗‗‗‗‗‗‗‗‗‗‗‗‗‗‗‗‗‗‗‗‗‗‗‗‗‗‗‗‗‗‗‗‗‗‗‗‗‗‗‗‗‗‗‗‗‗‗‗‗‗‗‗‗‗‗‗‗‗‗‗‗‗‗‗‗‗‗‗‗‗‗‗
Figure 7. Comparison of water residency days and number of individuals, metamorphic individuals, and species captured at Port Orange Wellfield Experimental Pond (1). Water residency days (left vertical axis) represents the number of days in a given year that a pond held water. Total number of individuals and number of metamorphic individuals (left vertical axis) and number of species (right vertical axis) represent new captures from drift fence arrays for the 9 sampling weeks in each year from 2003 -2007.
Appendix D. ‗‗‗‗‗‗‗‗‗‗‗‗‗‗‗‗‗‗‗‗‗‗‗‗‗‗‗‗‗‗‗‗‗‗‗‗‗‗‗‗‗‗‗‗‗‗‗‗‗‗‗‗‗‗‗‗‗‗‗‗‗‗‗‗‗‗‗‗‗‗‗‗‗‗‗‗‗‗‗‗‗‗‗‗‗‗‗‗‗‗‗‗‗‗‗‗‗‗‗‗‗‗‗‗‗‗‗‗‗‗‗‗‗‗‗‗‗‗‗‗‗‗‗‗‗‗‗‗‗‗‗‗‗‗‗‗‗‗‗‗‗
Figure 8. Comparison of water residency days and number of individuals, metamorphic individuals, and species captured at Port Orange Wellfield Control Pond (2). Water residency days (left vertical axis) represents the number of days in a given year that a pond held water. Total number of individuals and number of metamorphic individuals (left vertical axis) and number of species (right vertical axis) represent new captures from drift fence arrays for the 9 sampling weeks in each year from 2003 -2007.
Appendix D. ‗‗‗‗‗‗‗‗‗‗‗‗‗‗‗‗‗‗‗‗‗‗‗‗‗‗‗‗‗‗‗‗‗‗‗‗‗‗‗‗‗‗‗‗‗‗‗‗‗‗‗‗‗‗‗‗‗‗‗‗‗‗‗‗‗‗‗‗‗‗‗‗‗‗‗‗‗‗‗‗‗‗‗‗‗‗‗‗‗‗‗‗‗‗‗‗‗‗‗‗‗‗‗‗‗‗‗‗‗‗‗‗‗‗‗‗‗‗‗‗‗‗‗‗‗‗‗‗‗‗‗‗‗‗‗‗‗‗‗‗‗
Figure 9. Comparison of water residency days and number of individuals, metamorphic individuals, and species captured at Port Orange Wellfield Control Pond (3). Water residency days (left vertical axis) represents the number of days in a given year that a pond held water. Total number of individuals and number of metamorphic individuals (left vertical axis) and number of species (right vertical axis) represent new captures from drift fence arrays for 9 sampling weeks in 2003 -2007.
Appendix D. ‗‗‗‗‗‗‗‗‗‗‗‗‗‗‗‗‗‗‗‗‗‗‗‗‗‗‗‗‗‗‗‗‗‗‗‗‗‗‗‗‗‗‗‗‗‗‗‗‗‗‗‗‗‗‗‗‗‗‗‗‗‗‗‗‗‗‗‗‗‗‗‗‗‗‗‗‗‗‗‗‗‗‗‗‗‗‗‗‗‗‗‗‗‗‗‗‗‗‗‗‗‗‗‗‗‗‗‗‗‗‗‗‗‗‗‗‗‗‗‗‗‗‗‗‗‗‗‗‗‗‗‗‗‗‗‗‗‗‗‗‗
Figure 10. Comparison of water residency days and number of individuals, metamorphic individuals, and species captured at Port Orange Wellfield Control Pond (4). Water residency days (left vertical axis) represents the number of days in a given year that a pond held water. Total number of individuals and number of metamorphic individuals (left vertical axis) and number of species (right vertical axis) represent new captures from drift fence arrays for the 9 sampling weeks in each year from 2003 -2007.
Appendix E. ‗‗‗‗‗‗‗‗‗‗‗‗‗‗‗‗‗‗‗‗‗‗‗‗‗‗‗‗‗‗‗‗‗‗‗‗‗‗‗‗‗‗‗‗‗‗‗‗‗‗‗‗‗‗‗‗‗‗‗‗‗‗‗‗‗‗‗‗‗‗‗‗‗‗‗‗‗‗‗‗‗‗‗‗‗‗‗‗‗‗‗‗‗‗‗‗
Appendix E. Species diversity data and analyses for baseline and hydration periods. Figure 1. Yearly total amphibian abundance at Tillman Ridge Wellfield Figure 2. Yearly total amphibian species richness at Tillman Ridge Wellfield. Figure 3. Yearly metamorphic amphibian abundance as a measure of reproductive success at
Tillman Ridge Wellfield Figure 4. Yearly metamorphic amphibian species richness as a measure of reproductive
success at Tillman Ridge Wellfield Figure 5. Yearly total amphibian abundance at Bennett Swamp Figure 6. Yearly total amphibian species richness at Bennett Swamp Figure 7. Yearly metamorphic amphibian abundance as a measure of reproductive success at
Bennett Swamp Figure 8. Yearly metamorphic amphibian species richness as a measure of reproductive
success at Bennett Swamp Figure 9. Yearly total amphibian abundance at Port Orange Wellfield Figure 10. Yearly total amphibian species richness at Port Orange Wellfield Figure 11. Yearly metamorphic amphibian abundance as a measure of reproductive success at
Port Orange Wellfield Figure 12. Yearly metamorphic amphibian species richness as a measure of reproductive
success at Port Orange Wellfield
Appendix E. ‗‗‗‗‗‗‗‗‗‗‗‗‗‗‗‗‗‗‗‗‗‗‗‗‗‗‗‗‗‗‗‗‗‗‗‗‗‗‗‗‗‗‗‗‗‗‗‗‗‗‗‗‗‗‗‗‗‗‗‗‗‗‗‗‗‗‗‗‗‗‗‗‗‗‗‗‗‗‗‗‗‗‗‗‗‗‗‗‗‗‗‗‗‗‗‗‗‗‗‗‗‗‗‗‗‗‗‗‗‗‗‗‗‗‗‗‗‗‗‗‗‗‗‗‗‗‗‗‗‗‗‗‗‗‗‗‗‗‗‗‗‗‗‗
Figure 1. Yearly total amphibian abundance at Tillman Ridge Wellfield. Results represent new captures from drift fence arrays and are displayed for both baseline (2000) and hydration (2003-2006) periods.
Appendix E. ‗‗‗‗‗‗‗‗‗‗‗‗‗‗‗‗‗‗‗‗‗‗‗‗‗‗‗‗‗‗‗‗‗‗‗‗‗‗‗‗‗‗‗‗‗‗‗‗‗‗‗‗‗‗‗‗‗‗‗‗‗‗‗‗‗‗‗‗‗‗‗‗‗‗‗‗‗‗‗‗‗‗‗‗‗‗‗‗‗‗‗‗‗‗‗‗‗‗‗‗‗‗‗‗‗‗‗‗‗‗‗‗‗‗‗‗‗‗‗‗‗‗‗‗‗‗‗‗‗‗‗‗‗‗‗‗‗‗‗‗‗‗‗‗
Figure 2. Yearly total amphibian species richness at Tillman Ridge Wellfield. Results are displayed for both baseline (2000) and hydration (2003-2006) periods.
Appendix E. ‗‗‗‗‗‗‗‗‗‗‗‗‗‗‗‗‗‗‗‗‗‗‗‗‗‗‗‗‗‗‗‗‗‗‗‗‗‗‗‗‗‗‗‗‗‗‗‗‗‗‗‗‗‗‗‗‗‗‗‗‗‗‗‗‗‗‗‗‗‗‗‗‗‗‗‗‗‗‗‗‗‗‗‗‗‗‗‗‗‗‗‗‗‗‗‗‗‗‗‗‗‗‗‗‗‗‗‗‗‗‗‗‗‗‗‗‗‗‗‗‗‗‗‗‗‗‗‗‗‗‗‗‗‗‗‗‗‗‗‗‗‗‗‗
Figure 3. Yearly metamorphic amphibian abundance as a measure of reproductive success at Tillman Ridge Wellfield. Results represent new captures from drift fence arrays and are displayed for both baseline (2000) and hydration (2003-2006) periods.
Appendix E. ‗‗‗‗‗‗‗‗‗‗‗‗‗‗‗‗‗‗‗‗‗‗‗‗‗‗‗‗‗‗‗‗‗‗‗‗‗‗‗‗‗‗‗‗‗‗‗‗‗‗‗‗‗‗‗‗‗‗‗‗‗‗‗‗‗‗‗‗‗‗‗‗‗‗‗‗‗‗‗‗‗‗‗‗‗‗‗‗‗‗‗‗‗‗‗‗‗‗‗‗‗‗‗‗‗‗‗‗‗‗‗‗‗‗‗‗‗‗‗‗‗‗‗‗‗‗‗‗‗‗‗‗‗‗‗‗‗‗‗‗‗‗‗‗
Figure 4. Yearly metamorphic amphibian species richness as a measure of reproductive success at Tillman Ridge Wellfield. Results represent new captures from drift fence arrays and are displayed for both baseline (2000) and hydration (2003-2006) periods.
Appendix E. ‗‗‗‗‗‗‗‗‗‗‗‗‗‗‗‗‗‗‗‗‗‗‗‗‗‗‗‗‗‗‗‗‗‗‗‗‗‗‗‗‗‗‗‗‗‗‗‗‗‗‗‗‗‗‗‗‗‗‗‗‗‗‗‗‗‗‗‗‗‗‗‗‗‗‗‗‗‗‗‗‗‗‗‗‗‗‗‗‗‗‗‗‗‗‗‗‗‗‗‗‗‗‗‗‗‗‗‗‗‗‗‗‗‗‗‗‗‗‗‗‗‗‗‗‗‗‗‗‗‗‗‗‗‗‗‗‗‗‗‗‗‗‗‗
Figure 5. Yearly total amphibian abundance at Bennett Swamp. Results represent new captures from drift fence arrays and are displayed for both baseline (1999-2000) and operational (2004-2008) periods.
Appendix E. ‗‗‗‗‗‗‗‗‗‗‗‗‗‗‗‗‗‗‗‗‗‗‗‗‗‗‗‗‗‗‗‗‗‗‗‗‗‗‗‗‗‗‗‗‗‗‗‗‗‗‗‗‗‗‗‗‗‗‗‗‗‗‗‗‗‗‗‗‗‗‗‗‗‗‗‗‗‗‗‗‗‗‗‗‗‗‗‗‗‗‗‗‗‗‗‗‗‗‗‗‗‗‗‗‗‗‗‗‗‗‗‗‗‗‗‗‗‗‗‗‗‗‗‗‗‗‗‗‗‗‗‗‗‗‗‗‗‗‗‗‗‗‗‗
Figure 6. Yearly amphibian species richness at Bennett Swamp. Results are displayed for both baseline (1999-2000) and operational (2004-2008) periods.
Appendix E. ‗‗‗‗‗‗‗‗‗‗‗‗‗‗‗‗‗‗‗‗‗‗‗‗‗‗‗‗‗‗‗‗‗‗‗‗‗‗‗‗‗‗‗‗‗‗‗‗‗‗‗‗‗‗‗‗‗‗‗‗‗‗‗‗‗‗‗‗‗‗‗‗‗‗‗‗‗‗‗‗‗‗‗‗‗‗‗‗‗‗‗‗‗‗‗‗‗‗‗‗‗‗‗‗‗‗‗‗‗‗‗‗‗‗‗‗‗‗‗‗‗‗‗‗‗‗‗‗‗‗‗‗‗‗‗‗‗‗‗‗‗‗‗‗
Figure 7. Yearly metamorphic amphibian abundance as a measure of reproductive success at Bennett Swamp. Results represent new captures from drift fence arrays and are displayed for both baseline (1999-2000) and operational (2004-2008) periods.
Appendix E. ‗‗‗‗‗‗‗‗‗‗‗‗‗‗‗‗‗‗‗‗‗‗‗‗‗‗‗‗‗‗‗‗‗‗‗‗‗‗‗‗‗‗‗‗‗‗‗‗‗‗‗‗‗‗‗‗‗‗‗‗‗‗‗‗‗‗‗‗‗‗‗‗‗‗‗‗‗‗‗‗‗‗‗‗‗‗‗‗‗‗‗‗‗‗‗‗‗‗‗‗‗‗‗‗‗‗‗‗‗‗‗‗‗‗‗‗‗‗‗‗‗‗‗‗‗‗‗‗‗‗‗‗‗‗‗‗‗‗‗‗‗‗‗‗
Figure 8. Yearly metamorphic amphibian species richness as a measure of reproductive success at Bennett Swamp. Results represent new captures from drift fence arrays and are displayed for both baseline (1999-2000) and operational (2004-2008) periods.
Appendix E. ‗‗‗‗‗‗‗‗‗‗‗‗‗‗‗‗‗‗‗‗‗‗‗‗‗‗‗‗‗‗‗‗‗‗‗‗‗‗‗‗‗‗‗‗‗‗‗‗‗‗‗‗‗‗‗‗‗‗‗‗‗‗‗‗‗‗‗‗‗‗‗‗‗‗‗‗‗‗‗‗‗‗‗‗‗‗‗‗‗‗‗‗‗‗‗‗‗‗‗‗‗‗‗‗‗‗‗‗‗‗‗‗‗‗‗‗‗‗‗‗‗‗‗‗‗‗‗‗‗‗‗‗‗‗‗‗‗‗‗‗‗‗‗‗
Figure 9. Yearly total amphibian abundance at Port Orange Wellfield. Results represent new captures from drift fence arrays and are displayed for both baseline (1999-2000) and hydration (2003-2007) periods.
Appendix E. ‗‗‗‗‗‗‗‗‗‗‗‗‗‗‗‗‗‗‗‗‗‗‗‗‗‗‗‗‗‗‗‗‗‗‗‗‗‗‗‗‗‗‗‗‗‗‗‗‗‗‗‗‗‗‗‗‗‗‗‗‗‗‗‗‗‗‗‗‗‗‗‗‗‗‗‗‗‗‗‗‗‗‗‗‗‗‗‗‗‗‗‗‗‗‗‗‗‗‗‗‗‗‗‗‗‗‗‗‗‗‗‗‗‗‗‗‗‗‗‗‗‗‗‗‗‗‗‗‗‗‗‗‗‗‗‗‗‗‗‗‗‗‗‗
Figure 10. Yearly amphibian species richness at Port Orange Wellfield. Results are displayed for both baseline (1999-2000) and hydration (2003-2007) periods.
Appendix E. ‗‗‗‗‗‗‗‗‗‗‗‗‗‗‗‗‗‗‗‗‗‗‗‗‗‗‗‗‗‗‗‗‗‗‗‗‗‗‗‗‗‗‗‗‗‗‗‗‗‗‗‗‗‗‗‗‗‗‗‗‗‗‗‗‗‗‗‗‗‗‗‗‗‗‗‗‗‗‗‗‗‗‗‗‗‗‗‗‗‗‗‗‗‗‗‗‗‗‗‗‗‗‗‗‗‗‗‗‗‗‗‗‗‗‗‗‗‗‗‗‗‗‗‗‗‗‗‗‗‗‗‗‗‗‗‗‗‗‗‗‗‗‗‗
Figure 11. Yearly metamorphic amphibian abundance as a measure of reproductive success at Port Orange Wellfield. Results represent new captures from drift fence arrays and are displayed for both baseline (1999-2000) and hydration (2003-2007) periods.
Appendix E. ‗‗‗‗‗‗‗‗‗‗‗‗‗‗‗‗‗‗‗‗‗‗‗‗‗‗‗‗‗‗‗‗‗‗‗‗‗‗‗‗‗‗‗‗‗‗‗‗‗‗‗‗‗‗‗‗‗‗‗‗‗‗‗‗‗‗‗‗‗‗‗‗‗‗‗‗‗‗‗‗‗‗‗‗‗‗‗‗‗‗‗‗‗‗‗‗‗‗‗‗‗‗‗‗‗‗‗‗‗‗‗‗‗‗‗‗‗‗‗‗‗‗‗‗‗‗‗‗‗‗‗‗‗‗‗‗‗‗‗‗‗‗‗‗
Figure 12. Yearly metamorphic amphibian species richness as a measure of reproductive success at Port Orange Wellfield. Results represent new captures from drift fence arrays and are displayed for both baseline (1999-2000) and hydration (2003-2007) periods.
Appendix F.
APPENDIX F. Select amphibian photos. Figure 1. Experimental pond dry-up hole at Tillman Ridge (A). Amphibian larvae were concentrated and subsequently perished (B).
A.
Appendix F.
Figure 2. Select amphibians encountered during the project.
Dwarf siren Florida cricket frog
Oak toad metamorph Southern toad
Greenhouse frog (non-native) Barking treefrog
Appendix F.
Figure 2. (cont’d)
Pine woods treefrog metamorph Squirrel treefrog metamorph
Cuban treefrog (non-native) Spring peeper
Little grass frog Southern leopard frog
Appendix G.
Appendix G. CPI justifications for unincorporated comments by SJRWMD staff Jerry Salsano Comment:
Jerry Salsano: CPI statement on Page 28, Draft 1: “At the one site where sufficient study design was in place (PO), the water delivery was not substantial enough to be noticed by amphibians.” Comment [JMS5]: I have a real problem with this statement and I would think that Rosanne and other CH staff would also. Why was the water delivered not substantial enough? CPI response: Our original sentence was edited and moved to the top of the paragraph. The gist of the sentence remains the same. The sentence now says: “At PO, there was sufficiently rigorous experimental design in order to make a definitive assessment of amphibian response to augmentation; however, from an amphibian’s perspective, water input was not significant enough to measurably affect the experimental wetland.” The idea in this sentence is agreed upon by CPI and CH2M Hill staff.
Bob Epting General Comments: Bob Epting: The authors state on page four that—“Some pertinent results from the hydrological portion of this study conducted by CH2M Hill will be cited within this report to provide the reader with a coherent big picture of how amphibian results relate to hydrological results.” I don’t find where this is done in the overall discussion of “Inconclusive results…” (P 27) or elsewhere in the report. CPI response: There are numerous citations of direct results from the hydrological portion of this study taken directly from the report of CH2M Hill (2008b). There are nine citations of direct CH results in the Tillman Ridge section. There are four in the Bennett Swamp section. There are eight in the Port Orange section. There are four in the Parkland Wetland section. Instead of only providing amphibian study results, CH results are laced throughout the CPI report in order to provide the reader with a big picture of what happened in the entire study, not just in the amphibian study.
Bob Epting: I’m aware that project constraints severely limited the extent to which (page 4) “Assessments of the effects of active and passive hydration on amphibians will be made per study site.” Nevertheless, the authors inform the reader that “At the end of this report in the Summary section, a general assessment of the effects of wetlands augmentation/water retention on amphibians will be made by drawing from the information learned from the four demonstration projects.” A color-coded graphical summary of the type quantitative data summary mentioned above could be used to support such a general assessment. Such results would be useful in designing future augmentation projects and establishing success criteria. CPI response: Regarding the first part of Bob’s comment, we see the irony in telling the reader that we will provide amphibian assessments, when that is not possible—because of inconclusive results. We omitted the portion of the “Objectives of the Final Report” section that represents the irony, and tell the reader here that results were inconclusive in this study instead. Regarding the color-coded graphical summary, we will not include this idea in the report because we reached inconclusive results. Since results on the effect of augmentations on amphibians were inconclusive in this study, it is therefore unnecessary to create a color-coded graph summarizing our findings as such. We don’t yet know all the benefits or detriments that augmentations could have on amphibians.
Appendix G.
Marc Minno General Comments:
Comments on the Executive Summary: Marc Minno: First paragraph is ok, but the rest needs to be rewritten. CPI response: The ES was reorganized but does not follow the exact recommendations provided by the reviewer. Our report is set up by site so it makes sense to summarize each site in a paragraph as we have done. This also is the format of our annual reports. Marc Minno: Present a summary of the species found (# of amphibians, which were characteristic, which were exotic, any T&E species of concern). CPI response: Because the number of amphibians and the presence/absence of exotics and T&E species were not relevant to the overall objective, we did not include this information in the executive summary. However, this information is provided in the main body of the text and in the Overall Project Discussion. Comments on Discussion and Conclusions: Marc Minno: The discussion is too slanted toward inconclusive results and too generalized. CPI response: Our firm scientific opinion is that results regarding the effect of augmentation on amphibians are inconclusive in this study. We include relevant results that back up our interpretations. There is no “slanting” of our data interpretation. Scientific results often are inconclusive. It is an important part of the scientific process. Next time, investigators will be better informed and prepared as to how to conduct another amphibian/augmentation study because of what we learned in this study.
Marc Minno: Were the exotics benefiting from the hydrations? CPI response: We cannot say for sure whether exotic species benefited from hydrations because of inconclusiveness of our study. Marc Minno: How did the rainfall variation affect the various species of amphibians? CPI response: Looking at individual species was not the main focus in our study. We looked at the amphibian community as a whole at each site in order to learn how species diversity may have been affected by augmentation. Amphibians become active during rainfall and often become stimulated to breed. This phenomenon is well known in literature and is cited in our report. Marc Minno: The hurricane year of 2005 shows up in the data (see figures) for some sites, but not all. Which species really responded to the hurricanes and why? CPI response: Studying amphibian species’ response to hurricanes was not our objective. CPI shows the relationship of amphibian activity to rainfall in general at select sites, including the hurricane rains of 2005. Marc Minno: Were any of the species found affected in a positive way or a negative way? Which species may be harmed by these hydration projects? CPI response: As has been stated, results regarding the effect of augmentation on amphibians in this study are
Appendix G.
inconclusive and we cannot say definitively which species may have been harmed or helped in this study.
Appendix H.
Appendix H. Amphibian augmentation database. An excel file (Assessment of Amphibian Response to Wetlands Augmentation Database 2003-2008.xls) was provided as an attachment with this document. The file provided all the field data collected during the post-augmentation phase of this study. Data for the pre-augmentation portion of this study was previously submitted to SJRWMD by the University of Florida contractors (Franz and Means 2001).