62
ASSESSMENT OF CLIMATE AND ENERGY POLICIES OF MAJOR EMITTING COUNTRIES Background Study

ASSESSMENT OF CLIMATE AND ENERGY POLICIES OF MAJOR EMITTING COUNTRIES
This background study is a publication by
PBL Netherlands Environmental Assessment Agency
Mailing addressPO Box 303142500 GH The HagueThe Netherlands
Visiting addressOranjebuitensingel 62511VE The HagueT +31 (0)70 3288700
www.pbl.nl/en
December 2013
Background Study


Assessment of climate and energy policies of major emitting countries

2 | Ruimtelijke opgaven in beeld. Achtergronden bij de Ex-ante evaluatie Structuurvisie Infrastructuur en Ruimte
The project was financed by the European Commission, Directorate General Climate Action (Service contract no.
07.1303/2011/605838/SER/CLIMA.A.4), and the Dutch Ministry of Infrastructure and the Environment.
This publication can be downloaded from: www.pbl.nl/en.
Parts of this publication may be reproduced, providing the source is stated, in the form: Roelfsema, M. et al. (2013), Assessment of
climate and energy policies of major emitting countries, The Hague: PBL Netherlands Environmental Assessment Agency.
PBL Netherlands Environmental Assessment Agency is the national institute for strategic policy analyses in the fields of the
environment, nature and spatial planning. We contribute to improving the quality of political and administrative decision-making,
by conducting outlook studies, analyses and evaluations in which an integrated approach is considered paramount. Policy relevance
is the prime concern in all our studies. We conduct solicited and unsolicited research that is both independent and always
scientifically sound.
Assessment of climate and energy policies of major emitting countries© PBL Netherlands Environmental Assessment AgencyThe Hague, 2013ISBN: 978-94-91506-57-4PBL publication number: 1096
Corresponding [email protected]
AuthorsMark Roelfsema1, Michel den Elzen1, Niklas Höhne2,3, Andries Hof1, Nadine Braun2, Hanna Fekete2, Hannes Böttcher4, Ruut Brandsma2, Julia Larkin2
1 PBL Netherlands Environmental Assessment Agency2 Ecofys Germany3 Wageningen University and Research Centre4 Institute for Applied Systems Analysis (IIASA)
SupervisorPieter Boot
English-language editingChristien Ettema, Annemieke Righart
GraphicsDurk Nijdam, PBL Beeldredactie
Production coordinationPBL Publishers
LayoutMartin Middelburg, VijfKeerBlauw

3 |
Contents
Assessment of climate and energy policies of major emitting countries 4Main findings 4Summary 5
1 Introduction 91.1 Objective 91.2 Background 9
2 Methodology and data 112.1 General methodology 112.2 Methodology per policy type 13
3 Analysis of the domestic policies of individual countries 193.1 Argentina 193.2 Australia 203.3 Brazil 223.4 Canada 253.5 China 263.6 Egypt 283.7 European Union 293.8 India 303.9 Indonesia 323.10 Japan 343.11 Malaysia 353.12 Mexico 363.13 Russia 383.14 Saudi Arabia 403.15 South Africa 413.16 South Korea 423.17 Turkey 433.18 Ukraine 453.19 United States 46
4 Conclusions 50
References 55

4 | Assessment of climate and energy policies of major emitting countries
Assessment of climate and energy policies of major emitting countries
Many of the major greenhouse gas emitting countries have planned and/or implemented domestic mitigation policies, such as carbon taxes, feed-in tariffs, or standards. This study analyses whether the most effective national climate and energy policies are sufficient to stay on track for meeting the emission reduction proposals (pledges) that countries made for 2020.
Main findings
• The pledges have induced efforts in all countries to plan and implement national climate and energy policies.
• Domestic policies of India, China and Russia are projected to lead to lower emission levels than those pledged.
• The national legally binding policy frameworks of Australia and the EU are likely to deliver reductions according to the countries’ unconditional pledges, but are not expected to achieve the conditional ones.
• For Japan, South Korea, Brazil, Indonesia and South Africa, the situation is rather unclear. Japan’s emission reductions by 2020 largely depend on the country’s new energy plan following the Fukushima accident, which is still under discussion. Whether South Korea will achieve its unconditional pledge depends on the final design and implementation of the agreed emissions trading system. Uncertainty in both historical and future emissions from land use, land-use change and forestry (LULUCF) has made it difficult to make a valid assessment for Indonesia in particular, but also for Brazil. South Africa’s policies have not yet been
implemented, and the final design of a carbon tax is still under discussion, therefore it also was very difficult to make a quantitative assessment for this country.
• The policies adopted by Canada, the United States and Mexico are projected to reduce the 2020 emission levels, but additional policies are probably needed to deliver their pledges in full. Emission levels projected for the United States for 2020 are lower than previously assumed, due to economic decline, low natural gas prices and the implementation of various policies, but are still likely to be higher than would be needed to achieve the pledge. Both the United States and Mexico are developing additional measures that could bring emissions closer to the pledged level. Although Argentina has policies in place, these are not expected to lead to large emission reductions.
• Turkey, Egypt, Saudi Arabia and Malaysia have not made international pledges. Turkey’s policies, if implemented, are expected to lead to emission levels below the business-as-usual (BAU) scenario. Egypt and Saudi Arabia have renewable energy policies in place that are likely to lead to lower emission levels compared to the BAU scenario. Malaysia’s energy efficiency target could lead to emission reductions, but still would require supporting measures to become effective.
• The analysis also has shown that countries are implementing policies and/or setting targets in a number of varying areas, to varying degrees; all of the major greenhouse gas emitting countries have set renewable energy targets, many have recently implemented efficiency standards for cars, and new emission trading systems are emerging.

5Summary |
Summary
Since the climate negotiations in Copenhagen (2009), many countries have submitted pledges consisting of quantitative economy-wide greenhouse gas emission reduction targets and mitigation actions for 2020. This report provides an estimate of how much the most effective domestic climate policies in nineteen major emitting countries and regions contribute to reducing greenhouse gas emissions – with the aim to assess whether these countries and regions are on track to meeting their pledges. The effectiveness of policies depends on their projected impact on greenhouse gas reductions and on the degree to which supporting regulatory and economic policy instruments are in place. Our assessment focussed on selected domestic policies; side effects of other energy policies (such as on shale gas development) were not taken into account. The impact of domestic policies on greenhouse gas emissions was estimated based on three methods: (i) the PBL FAIR policy model, using business-as-usual (BAU) projections of the PBL IMAGE land-use and TIMER energy models, as in OECD (2012), (ii) bottom-up calculations by Ecofys for different subsectors, supplemented with calculations for land-use policies using the IIASA forestry model G4M, and iii) literature data, including the Climate Action Tracker (CAT)1 of Ecofys, PIK, and Climate Analytics, and various national studies. Particularly for larger countries, implementation barriers, domestic legislation, and other policy instruments were taken into account in the assessment of the impact of policies. The quantification of the pledges was performed with the FAIR model (Den Elzen et al., 2013).
Our assessment shows that the pledges have induced efforts in all countries to plan and implement national climate and energy policies (see Table S.1), and that these policies are likely to deliver emission reductions. We estimate that in some countries climate policies will result in greater emission reductions than targeted by these countries’ international mitigation commitments. However, most other countries will have to implement further policies to achieve their pledges. Table S.1 gives an overview of our evaluation.A few trends emerge regarding policy measures. All major countries have set renewable energy targets, many of which are supported by national policies. Several countries have recently implemented efficiency standards for cars (e.g. the United States, Canada) or the electricity sector (e.g. Russia). Policies related to new technologies such as Carbon Capture and Storage (CCS) are still in their infancy, and in their current form not expected to lead to considerable reductions by 2020. Finally, new emissions trading systems are emerging that cover several sectors, for instance in the EU, Australia and South Korea.
India, China, Russia and Ukraine are likely to achieve (or overachieve) their international pledges, partly thanks to their implemented policy portfolios. The EU’s national legally binding policy framework is likely to deliver the emission reductions required for the EU to meet its unconditional pledge. However, planned EU policies for achieving additional reductions are not yet sufficient for meeting the conditional pledge. Similarly, we project that Australia’s national legally binding framework will deliver the emission reductions required to meet Australia’s unconditional pledge, but additional policies would be needed to achieve the conditional pledges.
The situation is rather unclear for Japan, South Korea, Brazil, Indonesia and South Africa. Japan’s emission reductions by 2020 depend to a large extent on the country’s new energy plan after the Fukushima accident, which is still under discussion. Whether South Korea will achieve its unconditional pledge depends on the final design and implementation of the agreed emissions trading system. Uncertainty in both historical and future emissions from land use, land-use change and forestry (LULUCF) makes it difficult to make a valid assessment for Indonesia in particular, but also for Brazil. South Africa’s policies have not yet been implemented, and a carbon tax is still under discussion without having the final design specified, therefore it was very difficult to make a quantitative assessment for this country.
Turkey, Egypt, Saudi Arabia and Malaysia do not have international pledges. Turkey’s policies, if implemented, are expected to lead to emission levels below BAU. Egypt and Saudi Arabia have renewable energy policies that are likely to lead to lower emission levels compared to BAU. Malaysia’s energy efficiency target could lead to emission reductions, but still requires supporting measures to become effective.
We project that the climate and energy policies of Canada, the United States, Mexico, South Africa and Argentina will have a mitigating effect on 2020 emission levels, but these countries will probably need to develop and implement additional policies to deliver their pledges in full. Expected emissions of the United States in 2020 are lower than previously assumed, due to economic decline, low natural gas prices and implementation of various policies, but are still likely to be higher than needed to achieve the pledge. Both the United States and Mexico are developing additional measures that could bring emissions closer to the pledged level. Although Argentina has policies in place, these are not expected to lead to large emission reductions. Table S.1 gives an overview of the policy evaluations for the individual countries.

6 | Assessment of climate and energy policies of major emitting countries
Table S.1 Overview of evaluation of climate and energy policies of major emitting countries and regions
Country (2010 greenhouse gas emissions)
Pledge (projected 2020 emissions if pledge is achieved)
Mitigation actions with the highest impact2
Result (implemented policies)
China(10.5 GtCO2 eq)
• 40% to 45% reduction in CO2 emissions per GDP, relative to 2005 levels
• 15% share of non-fossil energy• Forestry target (12.9–13.8 GtCO2 eq)
• CO2 / energy intensity targets• Non-fossil energy target• Renewable energy capacity
targets
Likely to meet its pledge, but rapid greenhouse gas emission increase up to 2020 (12.8–14.8 GtCO2 eq)
United States(6.8 GtCO2 eq)
• 17% below 2005 levels (6.0 GtCO2 eq)
• CO2 standard for new fossil power plants
• Car standards• State renewable energy targets• California ETS• Biofuel target
Emissions expected to be lower than estimated in earlier US publications, which can be partly attributed to policies. Emissions still expected to be above pledged level(6.3–6.5 GtCO2 eq)
EU (4.7 GtCO2 eq)
• 20% below 1990 levels (unconditional)
• 30% below 1990 levels (conditional)
(3.9–4.4 GtCO2 eq)
• Comprehensive policy portfolio including emissions trading system, renewable energy targets and support, energy-efficiency policy
Likely to meet its unconditional pledge. Planned policies would result in further emission reductions , but not enough to meet conditional pledge(4.5 GtCO2 eq)
India (2.5 GtCO2 eq)
• 20–25% reduction in CO2 emissions per GDP, relative to 2005 levels
(3.5–3.7 GtCO2 eq)
• Renewable energy targets• Efficiency in industry (PAT
scheme)
Expected to meet its pledge, but uncertainty in projections is high (2.7–3.8 GtCO2 eq)
Brazil (2.3 GtCO2 eq)
36–39% below BAU levels(2.0–2.1 GtCO2 eq)
• Pledge anchored in national law, forestry policy
• Grazing land management• Renewable energy targets
The high share of emissions from LULUCF and the high uncertainty in projections makes it difficult to predict whether Brazil will meet its pledge(1.5–2.6 GtCO2 eq)
Russia (2.2 GtCO2 eq)
• 15–25% below 1990 levels(2.5–2.8 GtCO2 eq)
• Energy efficiency plan• Renewable energy target• Reduction plan for gas flaring
Likely to meet pledge: BAU emissions are projected to be lower than pledged emission level(2.1–2.5 GtCO2 eq)
Indonesia (1.4–1.8 GtCO2 eq)
• 26–41% below BAU levels(1.7–2.2 GtCO2 eq)
• Forestry measures• Renewable energy target• Biofuel target
High uncertainty in emissions from LULUCF makes it difficult to determine the ambition level of the pledge and whether the pledge will be achieved(1.5–2.2 GtCO2 eq)
Japan (1.3 GtCO2 eq)
• 25% below 1990 levels (1.0 GtCO2 eq)
• Not available (the new energy plan will be released in 2013)
Japan’s energy policy will change significantly as a result of the Fukushima accident. At this point it is therefore uncertain whether Japan will meet its pledge(n/a)
Saudi Arabia(0.8 GtCO2 eq)
No pledge • Renewable energy target Policies still under discussion(0.8 GtCO2 eq)
Mexico (0.7 GtCO2 eq)
• 30% below BAU levels(0.7 GtCO2 eq)
• Framework climate law with pledge
• Renewable energy target• Forestry target
Unlikely to meet its pledge with currently implemented policies. New policy strategy (still under development) could lead to emission reductions closer to pledge(0.8 GtCO2 eq)

7Summary |
Country (2010 greenhouse gas emissions)
Pledge (projected 2020 emissions if pledge is achieved)
Mitigation actions with the highest impact2
Result (implemented policies)
Canada (0.7 GtCO2 eq)
17% below 2005 levels(0.6 GtCO2 eq)
• Car standards• Power plant standard• Subnational ETS
Unlikely to meet its pledge with currently implemented policies(0.7–0.8 GtCO2 eq)
South Korea (0.7 GtCO2 eq)
30% below BAU level(0.5 GtCO2 eq)
• ETS planned (precursor TMS until 2015)
• Renewable energy target
Unclear whether pledge will be met with current and planned policies. Much will depend on the effectiveness of the national emissions trading scheme, which South Korea will launch in 2015(0.6–0.7 GtCO2 eq)
Australia (0.5 GtCO2eq)
5% below 2000 levels (unconditional)15–25% below 2000 levels (conditional)(0.4–0.5 GtCO2 eq)
• Comprehensive carbon pricing mechanism (ETS)
• Renewable energy targets supported by Renewable Energy Scheme (credit mechanism)
• Power plant standard
Likely to meet its unconditional pledge with currently implemented policies; but uncertainty is relatively high due to the uncertain future of climate policy (opposition parties announced to repeal the carbon pricing mechanism)(0.5–0.6 GtCO2 eq)
South Africa (0.5 GtCO2 eq)
34% below BAU level(0.4–0.6 GtCO2 eq)
• Renewable energy target, including supporting policy instruments (feed-in tariff)
Unlikely to meet its pledge with currently implemented policies, due to implementation difficulties(0.6–0.7 GtCO2 eq)
Ukraine(0.4 GtCO2 eq)
20% below 1990 levels(0.7 GtCO2 eq)
• Feed-in scheme• Energy intensity target
Likely to meet its pledge(0.4–0.7 GtCO2 eq)
Turkey(0.4 GtCO2 eq)
• No pledge • Renewable energy target• Energy intensity target
If implemented, Turkey’s policies could lead to reductions below BAU(0.4–0.5 GtCO2 eq)
Argentina(0.3 GtCO2 eq)
• No pledge • Renewable energy target• Biofuel target• Forestry target
Impact of policies is expected to be small, as Argentina already has a high share of low carbon fuels in BAU(0.4 GtCO2 eq)
Egypt(0.3 GtCO2 eq)
• No pledge • Renewable energy target supported by Feed-in tariff
Policy could reduce emissions compared to BAU, but emissions will still increase due to high energy demand(n/a)
Malaysia(0.2 GtCO2 eq)
• No pledge • Renewable energy targetEfficiency target
Efficiency target could result in significant emission reductions if implemented and backed up with supporting measures(0.3 GtCO2 eq)
8 | Assessment of climate and energy policies of major emitting countries
This assessment is subject to a number of caveats. First of all, it covers only the most effective national climate and energy policies and therefore does not provide a complete assessment of all policies. This could lead to underestimation of the total impact of all policy efforts to reduce emissions. In the United States, for instance, subnational policies could contribute significantly to emission reductions. Secondly, existing policies may change and new policies may be implemented. This implies that our assessment is explicitly limited to the current state of affairs3. Thirdly and finally, this report does not show whether the current domestic policies are on track to limiting temperature increase to 2 °C as indicated in the Cancún agreements made within the United Nations Framework Convention on Climate Change (UNFCCC). A previous PBL report (Den Elzen et al., 2012) showed that most major economies have submitted quantitative economy-wide emission reduction proposals for 2020 to the UNFCCC, sometimes subject to conditions. Several of these countries, for instance Mexico, South Africa, South Korea, Brazil, Japan and Norway, have selected their reduction targets in light of the ranges necessary to limit global temperature increase to 2 °C4. However, even if all UNFCCC pledges are achieved, the resulting 2020 emission levels will still be too high to meet the 2 °C target (UNEP, 2012).
N0tes1 http://www.climateactiontracker.org/.
2 Only the most important policies were analyzed.
3 End of year 2012.
4 http://www.climateactiontracker.org/.

9Introduction |
ONE
Introduction
1.1 Objective
Many countries are implementing climate and energy policies. The aim of this report is to quantify the effect of these policies on greenhouse gas emissions, in order to assess whether countries are on track to achieve their voluntary pledges under the Cancún agreements to reduce greenhouse gas emissions by 2020. This report is a follow-up of the PBL report Analysing the emission gap between pledged emission reductions under the Cancún Agreements and the 2 °C climate target, which analysed the effect of the pledges on the emission gap assuming that the pledges would be achieved (Den Elzen et al., 2012). The latter assumption is the subject of research of the present report, which analyses how much the most effective domestic climate policies in nineteen major emitting countries and regions contribute to reducing greenhouse gas emissions and thus to achieving the pledges. These policies were selected based on expert knowledge of policy makers and climate policy analysts, and the literature. As only the most effective policies were assessed, this report does not give a quantitative assessment of the complete climate and energy policy portfolio of each country, but it does give a good impression of the current status of policy implementation per country.
1.2 Background
Climate negotiations take place within the United Nations Framework Convention on Climate Change (UNFCCC). Following the Conference of Parties (COP) held in Copenhagen in 2009, which resulted in the Copenhagen Accord (UNFCCC, 2009), 42 Annex I Parties (developed countries) submitted quantified economy-wide emission reduction targets for 2020. In addition, as of to date 55 non-Annex I Parties (developing countries) submitted so-called nationally appropriate mitigation actions (NAMAs) for inclusion in the Appendices to the 2009 Copenhagen Accord (UNFCCC, 2009). The emission targets and mitigation actions have not changed significantly since early 2010, and were ‘anchored’ in the Cancún Agreements (UNFCCC, 2010a, b, c) in December 2010.
In December 2011, at the annual UNFCCC conference in Durban, South Africa, the international community established a new body intended to negotiate and develop a new protocol for a global agreement. This body, the Ad Hoc Working Group on the Durban Platform for Enhanced Action (ADP), is to work out this agreement (which should take effect in 2020) by 2015. This decision did not change the ambition levels of the reduction proposals established in Cancún in 2010.
However, during the 2012 UNFCCC conference in Doha it was agreed, in the context of the ADP, that the possibility of raising ambition before 2020 could be part of the 2015

10
ON
E
| Assessment of climate and energy policies of major emitting countries
agreement, in addition to the main goal of reducing emissions after 2020. But as of to date, no specific changes have been made to the voluntary reduction pledges for 2020; international climate policy still relies on the 2010 Cancún Agreements. In the context of the 1997 Kyoto Protocol, the second commitment period (2013–2020) was established. But already in 2011, Canada, Russia, Japan, and New Zealand announced that they would not take on new commitments in the second commitment period. Moreover, the United States has never ratified the Kyoto Protocol. The remaining Annex I parties, consisting of Australia, Belarus, the EU and its member states, Kazakhstan, Monaco, Norway, Switzerland and Ukraine, did agree on a second commitment period of the Kyoto Protocol with quantified emission reduction commitments.
The current pledges are not enough to stay on a least-cost emission pathway for 2°C: they are estimated to result in an emission gap of 8 to 13 GtCO2 eq by 2020, for a likely chance of limiting average global temperature rise to 2 °C (Höhne et al., 2012; UNEP, 2012a). However, policy actions are being implemented in a growing number of countries and have shown to be effective at reducing emissions, even though some of these policies are primarily carried out for reasons other than climate change mitigation (UNEP, 2012). In 2012 there was limited progress in climate legislation in developed countries, but modest to significant changes have been made in several developing countries (Townshend et al., 2013).
The question now arises whether major emitting countries are on track to achieve the pledges they have made. This report provides a preliminary assessment to answer this question, by analysing the emission reduction effects of selected climate and energy policies of 19 major emitting countries and regions, and comparing the resulting emissions to the pledged levels. This immediately shows one of the caveats of this study: our assessment does not cover the full range of policies. Furthermore, as the policy field is subject to constant change, our assessment provides only a snapshot of the state of affairs at the end of 2012. Nonetheless, it gives a good impression of where countries are currently heading in terms of greenhouse gas emissions in 2020.

11Methodology and data |
TWO
Methodology and data
2.1 General methodology
To analyse the effect of domestic policies on greenhouse gas emissions we collected data and estimated the emission reductions using different methods. These methods are described in this section.Our assessment focused on quantifying the effect of economy-wide, regional and sectoral climate and energy policies (see Figure 2.1). These policies have been induced not only by the pledges made within the international climate agreements, but often also by other objectives, such as saving money, reducing air pollution, improving health, creating jobs, and energy security (UNEP, 2012). Our study only assessed the impact of these policies in the context of the emission reduction pledges.
Where relevant, we assessed the effectiveness of these policies by analysing the supporting regulatory and economic policy instruments. The effectiveness of implementation depends on the projected impact on greenhouse gas reductions and on the degree to which supporting policy instruments are in place. Examples of supporting policy instruments are emissions trading systems, standards and feed-in tariffs. Where necessary we analysed domestic legislation to assess whether domestic policies are anchored in laws. Developing countries sometimes need international finance to implement policies. We accounted for implementation barriers such as lack of policy instruments (legislation, external finance), as these barriers decrease the
probability and thus the effectiveness of policy implementation. Furthermore, we classified policies as implemented or planned, based on expert judgement and literature on national policies.In order to assess the effect of the most effective policies we compared the policy pathways (projected emission levels after policy implementation) to business-as-usual (BAU) projections and the pledge pathways (Figure 2.2).
Business-as-usual (BAU) emission projections: These reference pathways present likely emission trends in the absence of climate policy. This information is often provided as a range including projections from different models and literature sources, reflecting uncertainties related to future social, economic and technological developments. Often, it is not possible to present scenarios with the complete absence of policies, as over time the impact of policies on greenhouse gas emissions is difficult to separate from other developments.
Pledge pathways: The pledge pathways present likely emission trends if the pledges are achieved. They were constructed using the present emission reduction commitments and available clarifications provided by the Parties. The emission levels resulting from achievement of the pledges were based on Den Elzen et al. (2013a) and Hof et al. (2013). Their evaluations of the pledges are updates compared to Den Elzen et al. (2012) and include the most recent developments in the UNFCCC negotiations. Moreover, they include an update of emission trends until 2010. For developed countries, the

TWO
12 | Assessment of climate and energy policies of major emitting countries
pledge pathways were calculated starting from reductions relative to the emission levels in the base year used for the pledge (1990 or other). Starting from this level the pathways for the subsequent period up to 2020 were derived. For developing countries, the pathways were calculated as direct reductions from current emissions, up to the targeted levels defined relative to BAU projections for 2020.
Policy pathways: The analysis of the impact of policies consisted of two steps. First we selected the most effective policies for the 19 countries and regions included in this study. Next, the impact of these policies was calculated based on model calculations and literature research. The most effective policies per country were selected by assessing the effectiveness of a large range of climate and energy policies using expert judgement, based on interviews with climate policy analysts and
national experts, and review of the literature. Based on this assessment we made a selection of the most effective implemented and planned policies for each country. The impact of each of these policies on emissions was calculated using the methodology described in Section 2.2 and the country pages. Where relevant, these calculations accounted for policy implementation barriers by assuming that only part of the target would be achieved. For each selected policy, the impact on emissions was projected using three methods:
(i) the policy evaluation module of the PBL FAIR policy model;
(ii) bottom-up calculations by Ecofys (energy sector) and IIASA (agriculture and forestry sector);
(iii) literature research.
Figure 2.1Policy framework applicable to the analysis of domestic actions
Source: PBL, 2013
Pledge Domestic climate / energy policies Policy instruments
• Regional level• Sectoral level• Economy wide
• Regulatory (e.g. legislation, standards)• Economic (e.g. �nance, permits)
• Implemented• Plannend
pbl.n
l
Figure 2.2BAU emissions, and emissions as a result of pledges andimplementation of most e�ective domestic policies
Source: Ecofys, PBL, 2013
pbl.n
l
BAUImplemented policies
Planned policies
Pledge
Past emissions
2010 2020
GHG emissions

13Methodology and data |
TWO
TWO
The policy evaluation module of the PBL FAIR policy model (Den Elzen et al., 2011; Den Elzen et al., 2014) is a spread sheet tool including bottom-up calculations, making use of the PBL/IIASA business-as-usual (BAU) projections for energy and emissions of all Kyoto greenhouse gases, except CO2 emissions from land-use change. These projections were developed for the OECD Environmental Outlook (OECD, 2012), and were calculated using the PBL energy model TIMER (Van Vuuren et al., 2011) and the PBL land-use model IMAGE (Bouwman et al., 2006), based on GDP projections of the OECD (2012). Data on CO2 emissions from LULUCF (e.g. deforestation) of non-Annex I countries were based on the IIASA forestry model G4M (Kindermann et al., 2008). The projections were harmonised to historical 1990–2010 emissions from the UNFCCC National Inventory Submissions, Common Reporting Format Tables for Annex I countries, the EDGAR database (JRC/PBL, 2012) and the National Communications for non-Annex I countries. Energy statistics, such as primary energy consumption and electricity production until 2010, were based on IEA (2012a). To assess the effect on emissions, the PBL FAIR policy model first determined the emission level resulting from implementation of the policy by adjusting assumptions that apply to BAU projections, and then compared this level to these BAU projections. The assessment varied according to policy type (e.g. renewable energy target, car standard): see Section 2.2 for a detailed description.
Bottom-up calculations by Ecofys were used for different subsectors, making use of emission projections by the countries themselves, if available. Furthermore, data on energy-related CO2 emissions were taken from projections by the World Energy Outlook of IEA (2011) (hereafter WEO 2011), and data on non-CO2 greenhouse gas emissions from US EPA projections (EPA, 2006). The calculations by Ecofys were supplemented with calculations for land-use policies using the IIASA forestry model. To assess the effect on emissions either literature studies were used or own calculations, which are described in Section 2.2. The most important literature sources included the Climate Action Tracker (CAT) (Ecofys & Climate Analytics, 2011, 2012), the GLOBE Climate Legislation Study (Townshend et al., 2011), and the REN21 report (REN21, 2011). Specific literature sources used for individual countries are cited in the country sections of Chapter 3. More detailed descriptions per policy type can be found in Section 2.2. Bottom-up calculations by IIASA were based on the BAU projections from the forestry model G4M (Kindermann et al., 2008), by changing assumptions from these BAU projections.
There are only a few differences between the PBL and Ecofys methods (i and ii) for calculating the impact of
different policy instruments and targets on emission reduction. The most important difference is that the Ecofys calculations used multiple data sources, whereas the PBL calculations were based only on TIMER and G4M/GLOBIOM projections. Both methods started with BAU emission projections and developed policy emission pathways from there. As for the third method, the selection of literature consisted of finding relevant information on policy pathways for specific countries. For some countries the literature search also included BAU projections, or additional policies to compare to our selection of most effective policies. In some cases the search only included information on specific sectors.
2.2 Methodology per policy type
This section describes in more detail the PBL and Ecofys methods used to project the emission reductions resulting from the most effective climate and energy policies of major emitting countries and regions (Table 2.1).
Primary energy supply. Primary energy supply refers to the supply of energy at the source, or supply of crude energy which has not been subjected to any conversion or transformation process1. Primary energy supply for combustible resources used in power plants (e.g. fossil fuels, biomass) can be measured directly, but this is not possible for electricity produced from non-combustible sources (e.g. wind, solar, nuclear). For these latter sources, there are two major accounting methods for determining the equivalent primary energy supply: the physical energy content method (IEA method) and the substitution method (BP method); see IPCC (2011), Martinot et al. (2007), and IEA (2012b) for more details. These two accounting methods assume different efficiency ratios for calculating primary energy supply from secondary energy (electricity) production. The IEA method counts the electricity produced from renewable sources as primary energy supply, while the BP method calculates an equivalent primary energy supply that would have been necessary to produce this electricity in a fossil-fuel power plant. The difference between the methods is the (virtual) energy loss in a power plant (Martinot et al., 2007). In this study, PBL always used the IEA method, whereas Ecofys projections depended on the method used (EIA or BP) in the underlying studies.
Target year. Another important issue is how to handle policies with a target year different from the year 2020. For policies with a target year after 2020, we estimated a target for 2020 by linear interpolation between 2010 and the target year. For example, the renewable mix target of Mexico for 2023 was linearly interpolated between 2023

14 | Assessment of climate and energy policies of major emitting countries
TWO
and 2010 to derive a target for 2020, which was used as a starting point for the calculations to assess the effect of this policy. For policies with a target year before 2020, we first calculated emissions and energy projections until the target year, and then assumed a BAU emission trend for the remaining years until 2020. For example, the effect of China’s energy intensity target for 2015 on emissions in 2020 was calculated by constructing a target scenario in which the energy intensity target is met in 2015, and a BAU energy intensity trend is assumed for the remaining years.
Renewable energy targetsRenewable energy targets aim for a specific amount of renewable energy supply in the target year. There are two types of renewable energy targets: renewable mix targets, which aim for a specific share of renewable energy supply in the total energy mix, and renewable capacity targets, which aim for a specific amount of installed renewable power capacity, usually defined by type of renewable technology. A renewable capacity target only applies to the electricity sector, but a renewable mix target can apply to all sectors.
Table 2.1 Overview of major domestic policies per country analysed in this study
Australia Emissions Trading System Indonesia Forestry policy
Renewable mix target (electricity) Renewable mix target (primary energy)
Renewable energy target
Renewable Portfolio Standard Biofuel target
Power plant standard Japan (unknown)
Argentina Renewable target (electricity) Malaysia Renewable capacity target
Biofuel quota Efficiency target
Forestry target Mexico Renewable mix target (electricity)
Brazil Forestry policy Forestry policy
Grazing land management Russia Gas-flaring target
Renewable capacity target Renewable mix target (primary energy)
Renewable mix target (electricity) Energy intensity target
Canada Car standard South Africa Renewable capacity target
Power plant standard Feed-in tariff
Emissions Trading System (subnational) South Korea Emissions trading system
China Emission intensity target Renewable mix target (primary energy)
Energy intensity target Saudi Arabia Renewable mix target (electricity)
Renewable mix target (primary energy) Turkey Renewable mix target (electricity)
Renewable capacity target Energy intensity target
Egypt Renewable target (electricity) Ukraine Feed-in tariff
Feed-in-tariff Energy-intensity target
EU Emissions trading system United States Renewable mix target (electricity) (subnational)
Renewable mix target (primary energy) Car standard
Energy efficiency target Power plant standard
India Renewable mix target (electricity) Emissions trading system (California)
Renewable capacity target Biofuel quota
Renewable Portfolio Standard (PAT Scheme)

15Methodology and data |
TWO
TWO
Renewable mix targetsThe effect of renewable mix targets was calculated based on the difference between the projected share of energy use from renewable resources in the BAU scenario versus the scenario in which the renewable mix target is achieved, using emission factors per unit of primary energy supply. If the target applied to electricity generation, a similar method was used.Renewable energy can be measured either in terms of primary energy supply or in terms of electricity generation (which is a form of secondary energy supply). The difference between the two is that primary energy supply includes energy use outside the electricity sector and accounts for energy losses in power plants within the electricity sector. The first step in the calculations was to determine the energy mix in the target scenario (i.e. the scenario in which the renewable mix target is achieved). If the target does not specify which renewable resources should be included in the energy mix, we assumed that the share of each renewable energy resource within the renewable mix would be the same as in the BAU scenario. Similarly, if the target does not specify which non-renewable resources should be replaced, we assumed that the share of each non-renewable resource within the non-renewable mix would be the same as in the BAU scenario. In the second and final step, the emission level after implementation of the target was calculated for each energy carrier using emission factors per unit of primary energy supply. The emission factors for renewable energy were assumed to be zero. In these calculations nuclear energy was not considered a renewable energy source, except when countries specified this (China, for instance, has defined its renewable target as a non-fossil target, which implies that nuclear energy is included).
There are three differences between the PBL and Ecofys calculations for projecting the effect of renewable mix targets. The first difference relates to the accounting method for primary energy supply. The PBL calculations are based on PBL TIMER projections, which in turn are based on the IEA accounting method for primary energy supply. The IEA and PBL TIMER accounting method differ only in the conversion ratio used for nuclear energy: IEA assumes a ratio of 33% based on heat loss, whereas the PBL TIMER model assumes a ratio of 100% based on (the absence of) electricity loss. The Ecofys calculations use primary energy supply projections from national plans or the WEO 2011, and thus use the primary energy accounting method underlying these projections. The second difference between the PBL and Ecofys calculations is in the change in nuclear energy use between the BAU scenario and the target scenario. The PBL calculations assume substitution of nuclear energy by renewable energy, whereas the Ecofys calculations
assume that the use of nuclear energy does not change between the two scenarios. Finally, if the target is defined in terms of electricity generation, the PBL calculations first determined the primary energy supply for each energy resource using the TIMER accounting method for primary energy supply before applying emission factors per unit of primary energy supply. The Ecofys calculations used emission factors per unit of electricity generation.
The effect of renewable targets was calculated in our study for Australia, Brazil, China, EU, India, Indonesia, Mexico, Russia, South Korea, and US states have renewable mix targets.
Renewable capacity targetsThe effect of renewable capacity targets was calculated by estimating the reduction in primary energy supply from fossil fuel resources in the target scenario compared to the BAU scenario, by replacing the fossil fuel resources with renewable resources, using emission factors per unit of primary energy supply.
A renewable capacity target aims for a specific amount of installed renewable power capacity in the target year, specified by type of renewable resource (e.g. solar, wind). Brazil, China, India and South Africa have renewable capacity targets.
To estimate the effect of renewable capacity targets on emissions, the PBL method first calculated the additional installed capacity per type of renewable resources compared to BAU projections. The electricity production from this additional renewable capacity was calculated using load factors for each renewable technology from the TIMER model. (A load factor is defined as the electricity generated in one year divided by the electricity that would have been generated if the power plant had operated at maximum capacity for the entire year (Blok, 2006)). The PBL method assumed that the additional installed renewable capacities would replace coal-fired power plants. The subsequent reduction in primary energy supply from coal was calculated by using the efficiency of coal-fired power plants. Finally, the emission reduction was calculated based on the emission factors per unit of primary energy supply from coal.
The Ecofys calculations were based on a slightly different method. First, the new energy mix in the target scenario was determined based on the electricity production from the additional renewable capacities, using information on load factors from national studies or Beurskens et al. (2011). This approach implies that renewable technologies can replace different types of fossil-fuel power plants, instead of only coal-fired plants (as assumed in the PBL

16 | Assessment of climate and energy policies of major emitting countries
TWO
calculations). Next, the emission reduction was calculated based on emission factors per unit of electricity generation.
Intensity targetsTwo types of intensity targets can be distinguished: emission intensity targets and energy intensity targets. Our calculations assumed that intensity targets would not affect GDP trends.
Emission intensity targetsGreenhouse gas emission intensity targets aim to reduce emissions per unit of economic output (real GDP) in a specific year, compared to a base year. Some countries (e.g. China, India2) have emission intensity targets. As these targets aim to reduce greenhouse gas emissions per unit of GDP, the effect of intensity targets on emission levels depends on future GDP growth: higher economic growth implies a higher target emission level. Based on GDP projections, we determined the effect of these targets by calculating the emission levels corresponding to the emission intensity targets, assuming that GDP trends would not be affected by the intensity targets. By comparing these emission levels to BAU emission projections we determined the expected emission reductions.
Energy intensity targetsEnergy intensity targets aim to reduce primary energy supply per unit of economic output (real GDP), in a specific year, compared to a base year. The effect of energy intensity targets was calculated based on GDP projections, BAU trends in primary energy use, and emission factors per unit of primary energy supply. China, Russia and Ukraine have energy intensity targets. The effect of these targets was determined by first calculating the primary energy supply level in a scenario in which the energy intensity target is achieved, again assuming that GDP is not affected by the target. Next, the emission target level was calculated using emission factors per unit of primary energy supply.
Power plant standardsPower plant standards are usually set at the level of best available technology and are stated in terms of CO2 emissions per unit of generated electricity. We estimated the effect of power plant standards by calculating the difference in emissions per unit of generated electricity between BAU projections and the scenario in which all new plants meet the standard.
Power plant standards set a limit on CO2 emissions per unit of generated electricity within a specific period. This performance standard is usually based on the best
system of emission reduction that has been adequately demonstrated (Lashof et al., 2012), the so-called best available technology (BAT). The United States and Canada have set power plant standards based on natural gas combined-cycle (NGCC) plants or power plants capable of carbon capture and storage. Power plant standards can apply to new (United States, Canada) or existing (Australia) fossil fuel power plants.
The PBL calculations used the BAU projections from the TIMER energy model. The existing or new coal-fired power plants in these projections were replaced by power plants that satisfy the specified BAT standards. Assuming that the same amount of electricity is generated, the primary energy supply for the new power plants in the target scenario was calculated by applying the efficiencies of the specified BAT power plants. The emission reductions were calculated using emission factors per unit of primary energy supply.
Ecofys calculations were based on the assumption that, under the power plant standard, no new coal-fired power plants are built but only natural gas-fired power plants. Therefore, the expected capacity increase of coal-fired power plants in the BAU scenario had to be determined first. Subsequently, the electricity generated by these plants was calculated assuming an average operating time for coal-fired power plants of 7,500 hours/year3; emissions from new coal-fired plants were calculated using coal emission factors per unit of generated electricity. For estimating the effect of the standard, we compared these emissions with the emissions that would be produced if all new coal-fired plants were to be replaced by natural gas-fired power plants.
Feed-in tariffThe impact of feed-in tariffs on installed renewable capacity was calculated based on the relationship between subsidy level and growth of installed renewable capacity, estimated from historical data for Germany and Spain. Furthermore, barriers such as difficult grid access, lack of long-term perspective, and lack of clear regulations were taken into account. The calculation of the effect of the resulting installed renewable capacities on emission reduction was the same as for renewable capacity targets.
A feed-in tariff (FIT) is an energy-supply policy aimed at supporting the development of new renewable power generation (Cory et al., 2009). The most common FIT policy provides a fixed rate per kilowatt hour (e.g. USD/kWh) for the electricity produced by a specific renewable technology (e.g. wind power, solar PV), for a guaranteed period of time (Blok, 2006). The rate is usually based on

17Methodology and data |
TWO
TWO
the generation cost of each specific technology and is generally higher than expected electricity prices. South Africa and Ukraine introduced feed-in tariffs.The impact of feed-in tariffs was calculated by first estimating the impact of feed-in tariffs on the growth of installed renewable capacity, and then calculating the emission reduction resulting from this growth in the same way as was done for renewable capacity targets.
A calculation tool was developed by Ecofys to estimate the growth of installed renewable capacity resulting from a FIT scheme. The tool includes two main calculation steps. First the FIT is compared with the generation costs found in the literature. Based on an analysis of the relationship between FIT level and growth of installed renewable capacity from historical data for Germany and Spain, the annual growth rate for each renewable technology is estimated to be equal to
(1)
whereg = annual growth rate of installed capacityF = Feed-in tariff for technology (per kWh)C = Average costs per technology found in
literature (per kWh)
This relationship assumes that a policy starts to be effective when the feed-in tariff is at least 10% higher than the average costs. If this is the case, the annual growth rate of installed capacity is proportional to the level of support above 1.1 times the costs. If the support is twice the costs, the annual growth rate is 100%.
In the second step of the calculation, a ‘barrier factor’ (0 < f <1) is determined through expert judgement and based on the following considerations that are weighted differently:
• Is grid access 100% ensured?• What is the long-term perspective (20 years)?• Are clear regulations available to guarantee the
purchase price?
If there are no implementation barriers, the annual growth rate (Equation 1) is unaffected. Otherwise a barrier factor is determined as described above, and multiplied with the annual growth rate. As a final step, the estimated growth rate is multiplied with installed capacity values from WEO 2011 for the starting year and extrapolated to 2020.
Emissions trading systemEmission reductions resulting from emissions trading systems (ETS) were determined by applying the proposed emission caps to the sectors covered by the ETS, taking into account implementation barriers.
In an emissions trading system (ETS), allowances to emit greenhouse gases are issued or auctioned to companies. Companies are required to hold a number of allowances equivalent to their emissions. In this way an emission cap is set. The national cap is set as a percentage reduction compared to a historical year or BAU level. Australia, the EU, South Korea and the United States have set up emission trading systems.
Emission reductions resulting from an ETS were determined by applying the emission cap to the sectors covered by the ETS. Based on expert judgement, a barrier factor was calculated to account for barriers to reaching the target, such as flaws in emission measurement, reporting or verification (‘MRV’), and lack of enforcement of the system. It was assumed that the ETS would not affect emissions of sectors not covered by the ETS.
Fuel efficiency standard for carsThe effect of fuel efficiency standards for cars was calculated in two different ways. The Ecofys method was based on replacing all cars that do not meet the new efficiency standards with cars that do, where the replacement rate was based on the average life time of cars. The PBL method made use of the TIMER transport model; here, the effect on emissions was calculated by running a scenario with improved car standards, taking into account the higher purchase costs of such cars.
Fuel efficiency standards for cars aim to increase fuel efficiency by requiring a minimum miles-per-gallon performance of new cars within a specific period.
The effect of fuel efficiency standards for cars on emission reduction was calculated by two methods: the Ecofys method was based on the replacement rate of cars, whereas the PBL method was based on the TIMER transport model. Of the countries included in this assessment, the United States and Canada have set fuel efficiency standards.
Ecofys calculations were based on BAU projections for travel distance and emissions, derived from national studies or other literature. An assumption was made for the expected life time of cars to determine an average annual replacement rate for cars. It was assumed that the average distance travelled with replaced cars would be the same as the average total. The calculation started with the year when the standard comes into effect. The
=− 1 − 0.1
0.9

18 | Assessment of climate and energy policies of major emitting countries
TWO
travelled distance of the existing car stock was decreased with the replacement rate, assuming a homogeneous age structure of existing cars. The removed cars were replaced with new cars built in that year, which satisfy the car standard. We assumed a linear improvement of the fuel efficiency for these cars so that the standard would be achieved in the target year. These new cars remained in the car stock for a period equal to the expected life time. The emissions of old cars, i.e. cars built before the starting year were calculated with an average emission factor per kilometre as used in the BAU projections. The emissions of new cars were based on the new car standard. These steps were repeated for all the following years until 2020.
The PBL calculations were based on running a target scenario in the TIMER transport model (Girod et al., 2012). Compared to the BAU scenario, two settings were changed (for details, see Deetman et al., 2012). First, the efficiency for gasoline cars and trucks was set equal to the fuel efficiency standard. Second, the purchase cost of these cars was adjusted based on costs found in the literature. These adjustments led to different car technologies in the scenario with efficiency standards, compared to BAU projections, resulting in different transport emissions. The emission reductions resulting from the implementation of the fuel efficiency standard were calculated by comparing these emissions to BAU projections.
Biofuel targetsThe emission reduction effect of biofuel targets was calculated by two methods. The PBL method used the TIMER transport model, while the Ecofys method was based on substituting energy use from gasoline or diesel with energy from biofuels, using different emission factors from the literature.
A biofuel target sets a mandatory minimum volume or share of biofuels to be used in the total transportation fuel supply. The effect of biofuel targets on emission reduction was calculated by two methods. The Ecofys method was based on substituting energy use from gasoline or diesel with energy from biofuels, using different emission factors from the literature. The PBL method used the TIMER transport model. Of the countries included in our assessment, only Indonesia has set biofuel targets.
Ecofys calculations were based on national projections. It was assumed that the additional use of biofuels would replace gasoline and diesel (i.e. that total fuel/energy use is the same in the BAU and biofuel scenarios). The emissions from gasoline and diesel use were compared with emissions from biofuels; both were calculated using
IPCC emission factors (IPCC, 2007). According to these emission factors, biofuels do not lead to direct emissions but may cause indirect emissions through land-use change and deforestation.
PBL calculations were based on running a target scenario using the TIMER transport model (Girod et al., 2012). Deetman et al. (2012) presents a more detailed description of the method. It was assumed that the biofuel target would apply to passenger cars only. For the biofuel target scenario, the model used different shares of fuels per vehicle type, leading to different emission levels compared to BAU projections.
Energy efficiency targetsEnergy efficiency targets aim to reduce primary energy supply or electricity consumption in a specific year, compared to either historical base year levels or BAU projections. The effect of energy-efficiency targets aimed at reducing primary energy supply was calculated by applying the targeted reduction to historical levels or BAU trends in primary energy supply, and using emission factors per unit of primary energy supply. The effect of energy-efficiency targets aimed at reducing electricity consumption was calculated by a similar method, in which the equivalent reduction in primary energy supply was calculated first, using the appropriate accounting method.
Energy efficiency targets are comparable to energy intensity targets, but instead of energy use reduction per unit of GDP they aim at absolute energy use reduction. Of the countries included in our assessment, only the EU has set energy-efficiency targets. Calculations of the emission reduction effect of energy-efficiency targets were similar to those for energy intensity targets (as described earlier in this section). PBL and Ecofys calculations differed only for energy-efficiency targets defined in terms of electricity consumption: the PBL method first determined the primary energy supply for each energy resource using the TIMER accounting method for primary energy supply before applying emission factors per unit of primary energy supply, whereas the Ecofys calculations used emission factors per unit of electricity generation.
Notes1 http://www.iea.org/aboutus/faqs/energyefficiency/.
2 India pledged an intensity target, but has not yet included
this in its domestic policies.
3 This can be converted to the load factor as defined in the
paragraph on renewable capacity targets; given that a (non-
leap) year has 8760 hours (see Blok (2006)).

19Analysis of the domestic policies of individual countries |
THREE
Analysis of the domestic policies of individual countries
This chapter describes the most effective domestic climate policies for 19 major emitting countries and regions, and their expected effect on greenhouse gas emissions in 2020. Where applicable, these results are compared with the reduction pledges submitted in the context of the UNFCCC climate negotiations.
3.1 Argentina
Argentina did not submit an economy-wide greenhouse gas emission reduction pledge as part of the Cancún Agreements. The emission reduction effect of Argentina’s climate policies– consisting of a renewable energy target, a biofuel target, and a forestry target – is projected to be small, as Argentina has an already high share of low carbon fuels in the BAU scenario.
Pledge. Argentina did not submit an economy-wide emission reduction pledge to the UNFCCC; the submitted NAMA consists of a list of measures that cannot be translated into a pledged emission level (UNFCCC, 2011b).
Baseline. The BAU emissions are expected to be between 390 MtCO2 eq and 400 MtCO2 eq (see Table 3.1). The high end of this range is based on the BAU presented in the Second National Communication to the UNFCCC (Government of Argentina, 2007) and the low end on an adjustment of this BAU for emissions from electricity production. This adjustment was made based on own calculations of electricity production and emission
factors, using historical data for Argentina from IEA and emission projections for Latin America from WEO (2011) (assuming these are representative for Argentina).
Main policies. The three main policies in this assessment for Argentina are the renewable electricity target, the biofuel quotas, and the forestry target.
Argentina’s renewable energy target aims at 8% renewable electricity generation by 2016, excluding large hydropower (Generación Eléctrica a partir de Fuentes Renovables).1 This target is supported by tendering out a certain capacity of renewable energy each year and purchasing the produced quantity for the following 15 years. However, Argentina has made little progress toward this target (The Pew Charitable Trusts, 2010). If this target is achieved, it will lead to a greenhouse gas reduction within the electricity sector by about 10% against BAU. This modest impact can be explained by the already high share of natural gas in Argentina’s electricity mix in the BAU scenario; replacing natural gas by renewable energy has relatively low impact.
Argentina introduced quotas for biodiesel (5% of diesel) as well as for ethanol (5% of gasoline) in the transport sector, starting in 2010, as mandated by Law #26,093 in 2006. We assumed that these quotas still apply in 2020. In order to support this policy, Argentina established tax exemptions for biofuel producers, a fixed price for biofuels, as well as export and import tax exemptions for

THRE
E
20 | Assessment of climate and energy policies of major emitting countries
biofuels. The impact on emissions of these quotas is projected to be small, however, as natural gas vehicles, which are not affected by the biofuel quota, and have a large share in the Argentinean vehicle fleet. Furthermore, the actual emission reductions on account of biofuels depend on the emission intensity of their production and whether land-use change is avoided (Timilsina, 2010).
The Ley del bosque is a forestry law that establishes minimum requirements for environmental protection in order to afforest, reforest and make use of native forests in a sustainable way. It also establishes a body and criteria for the distribution of funds for the protection of native forests. Quantification of expected emission reductions that can be associated with the policy is not possible, because there are several difficulties in the implementation of this law, and because there is insufficient data on the actual total areas of the different forest protection categories and their distribution.
Conclusion. Argentina’s expected emission level in 2020, taking into account the emission reductions resulting from the renewable electricity target and biofuel quotas, is around 385 MtCO2eq, which is only slightly lower than expected BAU projections. This cannot be compared to a
pledged level as Argentina did not submit a pledge to the UNFCCC.
3.2 Australia
Policies implemented in Australia are projected to reduce emissions to a level between the unconditional and conditional pledge levels (5%–25% below 2000 levels). However, these reductions strongly depend on the implementation of Australia’s carbon pricing mechanism, which is subject to political uncertainty due to lack of bipartisan support.
Pledge. Australia has pledged to decrease its emissions by 5%, 15%, or 25% below its 2000 emission level, including emissions from afforestation, reforestation and deforestation (ARD emissions) (Grassi et al., 2012). This should result in emissions between 390 and 505 MtCO2 eq in 2020 (see Table 3.2). The higher (15% and 25%) reduction targets are conditional on specific conditions related to international action. Recently, the conditions for the 15% target have been raised: it is now conditional on strong international financing and a technology cooperation framework (UNFCCC, 2012).
Figure 3.1
1990 1995 2000 2005 2010 2015 20200
100
200
300
400
500Emissions, excluding land use (Mt CO2 eq per year)
pbl.n
l
History
Business-as-usualprojections (range)Implemented policies (range)
Policies: Renewable mix target (electricity), biofuel target,forestry target
Impact climate policies on greenhouse gas emissions for Argentina
Table 3.1 Argentina: 2020 BAU emissions and emissions after implementation of most effective domestic policies
In MtCO2 eq BAU Pledge Implemented policies
Minimum 390 n/a* 385
Maximum 400 n/a 385
* not applicable

21Analysis of the domestic policies of individual countries |
THRE
E
THREE
Role LULUCF in pledge. Our assessment of Australian policies is based on assumptions on Afforestation, Reforestation and Deforestation (ARD) in 2020, as ARD emissions are part of the target. Given that LULUCF emissions strongly declined between 1990 and 2000, and that Australia projects a further decline by 2020, the minimum contribution of LULUCF to meet the pledges appears to be about 19% and 7% relative to Australia’s 1990 and 2000 emission levels, respectively (Grassi et al., 2012).2 A further 3% potential contribution was estimated from additional actions (Den Elzen et al., 2012; Grassi et al., 2012).
Baseline. BAU emissions (excluding LULUCF) increased by around 30% between 1990 and 2010, and are projected to increase in the absence of climate policy to 615–650 MtCO2eq, based on several studies (Australian Government, 2010, 2011a; Climate Analytics & Ecofys, 2011) and PBL TIMER/IMAGE projections.
Main policies. The main climate policies are provided by the Clean Energy Future Plan (Australian Government, 2011a), which was accepted by the House of Representatives on October 18, 2011. According to the
Climate Action Tracker country assessment report (Ecofys & Climate Analytics, 2011) and the Treasury modelling report (Australian Government, 2011c), the Clean Energy Future Plan has the potential to become the cornerstone instrument for low carbon development in Australia. If fully implemented, the plan could achieve the low (unconditional) pledge of 5% reduction compared to 2000 emissions, but only with substantial enhancement it could lead to meeting the more ambitious pledges (15–25% reduction). The plan includes the implementation of Australia’s carbon pricing mechanism, a renewable electricity target, energy-efficiency measures, and measures in the Agriculture Forestry and Other Land Use (AFOLU)3 sector.
The carbon pricing mechanism is introduced through an emissions trading system. It is the main policy instrument in the clean energy plan4, but lacks bipartisan support, casting doubt over its political durability (Jotzo, 2012). Around 500 of the highest emitters in Australia, covering around 60% of Australia’s greenhouse gas emissions, are required to pay for their emissions in this carbon pricing system. Not all sectors are directly involved; agriculture, landfill and light road vehicles are excluded from the carbon pricing mechanism. Therefore the main effects
Figure 3.2
1990 1995 2000 2005 2010 2015 20200
100
200
300
400
500
600
700Emissions, excluding land use (Mt CO2 eq per year)
pbl.n
l
History
Business-as-usualprojections (range)Pledge (range)Implemented policies (range)Planned policies, additional impact (range)
Policies: Emission trading system,renewable mix target (electricity), power plant standard
Impact climate policies on greenhouse gas emissions for Australia
Table 3.2 Australia: 2020 BAU emissions, pledged emissions, and emissions after implementation of most effective domestic policies
In MtCO2 eq BAU Pledge Implemented policies
Implemented and planned policies
Minimum 615 390 475 450
Maximum 650 505 645 630

22 | Assessment of climate and energy policies of major emitting countries
THRE
E
will come from the energy supply and industry sectors. The system started on 1 July 2012. As part of our assessment, we used results from the Australian Treasury, which modelled the carbon price under different assumptions (Australian Government, 2011c). The core policy scenario in their analysis is based on the low pledge of 5% emission reduction below 2000 levels, as well as a carbon price of USD 29/tCO2 eq in 2020.
Two other instruments from the clean energy plan specifically target the energy supply sector, which is the main source of CO2 emissions in Australia. These instruments are the renewable target for electricity production and the power plant standard.
As stated in the Clean Energy Future Plan, the Australian Government has set a target to achieve 20% of electricity production in 2020 from renewable sources. This target should be achieved through the Renewable Energy Target Scheme introduced in 2009, which aims to install 45 TWh of renewable capacity by 2020. This target scheme could be very effective as it includes a high penalty for non-compliance, but some administrative barriers (such as spatial planning regulation) would need to be removed for the scheme to be successful. The impact of this target is therefore uncertain; we project that it could lead to a share of renewable energy in electricity generation of 16%5 to 20% by 2020. This would lead to an emission reduction of 35 to 50 MtCO2 eq based on emission projections from the Australian Treasury (Australian Government, 2011c), or a reduction of only 5 MtCO2 eq according to the PBL TIMER model, in which the BAU trajectory already includes a relative high share of biomass in electricity production.
The power plant standard is an energy-efficiency measure introduced in the electricity sector to close down around 2000 MW of inefficient coal-fired electricity production plants. Replacing them by gas power plants will increase the efficiency of electricity production and decrease CO2 emissions by 5 to 12 MtCO2 based on PBL FAIR calculations, Ecofys calculations (Climate Analytics & Ecofys, 2011), and an Australian Government (2011b) study.
Overlap. Both the power plant standard and the renewable target fully overlap with the policy to implement the emissions trading system (ETS). Our analysis shows that the total reductions from these measures are lower than those expected from the ETS.
Other measures are energy savings initiatives in the building sector, and car efficiency standards in the transport sector. These measures are unrelated to electricity use in the carbon price scheme, and are
estimated to lead to around 9 MtCO2 additional reductions. As was discussed above, all other measures in the energy supply and industry sectors (reductions in non-CO2 emissions) will not lead to additional reductions above those expected from the carbon pricing scheme.
AFOLU – LULUCF potential. The total forest sink of Australia could be substantial compared to the emissions in other sectors. However, the sink included in the Forestry Management (FM) reference level, against which improved management effects can be compared, is small because the forest area included in the FM reference level is only 10% of total forest area. Therefore, improved FM could potentially contribute to additional emission reductions of about 1% of total emissions in 2000 (Grassi et al., 2012), equal to around 5 MtCO2 eq.
Conclusion. The total emission level after implementation of current climate and energy policies is projected to be between 475 and 645 MtCO2 eq (see Table 3.2). When taking into account the estimated reductions resulting from planned policies in the building and transport sectors, the projected level decreases to between 450 and 630 MtCO2 eq. This translates into a reduction to a level between the least and most ambitious targets of Australia’s pledge. This assessment depends on assumptions on ARD emission projections in 2020; additional LULUCF and agricultural mitigation actions could further increase reductions.
3.3 Brazil
Estimates of the effects of Brazil’s pledges and policies on 2020 emission levels are uncertain, as the targets relate to uncertain emissions projections, especially for deforestation. The projected total BAU emissions, including from LULUCF, range from 2,480 to 3,235 MtCO2
eq in 2020. Deforestation policies are expected to reduce emissions by 560–890 MtCO2 eq; grassland policies could lead to an additional reduction of 45–50 MtCO2 eq. The result of the renewable energy policy is expected to be small.
Pledge. Brazil has pledged to reduce its emissions by 36% to 39% compared to BAU projections in 2020. The pledge will be implemented in accordance with the principles and provisions of the UNFCCC (UNFCCC, 2011b) and is conditional to international financing. It was originally proposed in November 2009 and submitted to the Copenhagen Accord on 29 January 2010. Brazil has secured this pledge in a national law (National Decree No. 7390, December 2010).

23Analysis of the domestic policies of individual countries |
THRE
E
THREE
The pledge includes specific measures related to deforestation, agriculture and energy. Emission reductions resulting from these measures, as projected by Brazil, are given in Table 3.4. According to our assessment, Brazil’s total emission level will be between 1,975 and 2,070 MtCO2 eq in 2020 if the country meets its pledge (see Table 3.3).
Baseline. Brazil did not specify a BAU projection with its pledge, but in 2009 the Ministry of the Environment6 published a projection in which the 2020 BAU level was estimated at 2,704 MtCO2 eq. However, during the Bangkok workshop in April 2011, Brazil clarified that its reduction targets were to be compared against BAU levels as published in its national law, i.e. National Decree No. 7390 of December 2010 (Government of Brazil, 2010). These BAU emissions are 3,235 MtCO2 eq by 2020, i.e.
significantly higher than those previously reported. Our assessment is based on BAU projections (including LULUCF) between 2,480 and 3,235 MtCO2 eq in 2020 (see Table 3.4). The higher end of this range is based on national projections, while the lower end is based on PBL/IIASA projections.Main policies. The largest emission reductions in Brazil are to be expected from the agricultural and forestry sectors. There are several policies that affect emissions in these sectors. The Federal Decree nº 7390 includes two forestry sector plans. In our calculations we assumed that both plans will be fully implemented, but the planned revision of the Forestry code (Law 4.771/1965) could seriously undermine this.
The Action Plan for Deforestation Prevention and Control in the Legal Amazon (PPCDAm) calls for an 80% reduction in the annually deforested area in the Amazon
Figure 3.3
1990 1995 2000 2005 2010 2015 2020
0
500
1000
1500
2000
2500
3000
3500Emissions, including land use (Mt CO2 eq per year)
pbl.n
l
Historic LULUCF CO2 emission data from EDGAR database
Business-as-usualprojections (range)
Pledge (range)
Implemented policies (range)
Policies: Forestry policy, grazing land management, renewable capacity target, renewable mix target (electricity)
Impact climate policies on greenhouse gas emissions for Brazil
1990 1995 2000 2005 2010 2015 2020
0
500
1000
1500
2000
2500
3000
3500
pbl.n
l
Historic LULUCF CO2 emission data from IIASA G4M/GLOBIOM model
Table 3.3 Brazil: 2020 BAU emissions, pledged emissions, and emissions after implementation of most effective domestic policies
In MtCO2 eq BAU Pledge Implemented policies
Minimum 2,480 1,975 1,500
Maximum 3,235 2,070 2,630
Note: levels include LULUCF CO2 emissions.

24 | Assessment of climate and energy policies of major emitting countries
THRE
E
by 2020, compared to the historical average from 1996–2005. According to national projections, based on annually deforested area and assuming a constant average biomass density (484 tCO2/ha), this would avoid 760 MtCO2 of emissions by 2020. The Action Plan for Deforestation Prevention and Control in the Cerrado region (PPCerrado) calls for a 40% reduction in the annually deforested area in the savannahs, compared to the historical average from 1999 to 2008. When assuming a constant biomass density (206 tCO2/ha) in the savannah, this measure would avoid about 130 MtCO2 eq of emissions by 2020 compared to national projections.
Historical emissions due to deforestation differ among data sources. Figure 3.3 shows two different historical pathways, where the left graph is based on the EDGAR database and the right graph is based on the G4M/GLOBIOM model from IIASA. The non-LULUCF emissions are the same for both graphs, but the LULUCF emissions differ considerably. For example, LULUCF emissions in 2005 according to EDGAR are more than 500 MtCO2 eq lower than according to the IIASA model, indicating the large uncertainty in historic data for LULUCF.
Based on the national BAU projection of 1,400 MtCO2 eq, the total projected reduction in forestry emissions will be
about 890 MtCO2 eq by 2020. However, based on IIASA’s BAU projection (1,070 MtCO2 eq), the emission reduction resulting from the abovementioned policy measures would be much lower: 560 MtCO2 eq in 2020. Brazil belongs to the short list of non-Annex I countries (besides India and Mexico) that currently have suitable capacities and long experience in forest inventories and monitoring (Romijn et al. 2012). Based on satellite information, Brazil can track deforestation events at real time and with high accuracy. Therefore uncertainties in historical emissions are likely to decrease. Future projections are uncertain because of methodological differences between national and international models (Groen et al., 2013)
Apart from action plans to curb deforestation, Brazil announced policies to restore grazing land, in order to increase productivity and carbon storage in grasslands. According to Brazil these policies should achieve an emission reduction of 83 to 104 MtCO2 eq (UNFCCC, 2011b). However, according to IIASA calculations, a reduction of this size would require additional management actions for approximately 15% to 25% of total Brazilian pasture area, assuming a constant and generic carbon sequestration rate. This is about twice the pasture area targeted by the policies, implying that Brazil might have overestimated the average sequestration potential. We
Table 3.4 Brazil’s projections of pledged emission reductions and BAU emissions in 2020
National projection in the National Decree No. 7390 (2010)
Nationally Appropriate Mitigation Actions (NAMAs)
business as usual (MtCO2 eq)
reduction (MtCO2 eq)
reduction (% of BAU)
Land-use-related CO2 emissions 1,404 887 63%
Agriculture/livestock 730
Energy 868 234 27%
Industry and Waste 234
Other greenhouse gas emissions 1,832 281–372 15–20%
Total greenhouse gas emissions 3,236 1,168–1,259 36.1–38.9%
Table 3.5 Emission reductions resulting from deforestation control policies in the Amazon and Cerrado, comparing national estimates and IIASA estimates
Deforestation 2020 Emission factor per ha
Annual projected emissions in 2020
Avoided emissions due to policy,
in 2020
Remaining emissions
in 2020
Unit Ha tC/ha MtCO2/y MtCO2/y MtCO2/y
National estimate 3,523,500 98 1,271* 887 384
IIASA estimate 1,982,708 110 803 561 242
* Or 1,404 MtCO2/y, when including emissions from Mata Atlântica, Caatinga and Pantanal.

25Analysis of the domestic policies of individual countries |
THRE
E
THREE
therefore assumed that policies targeted at grassland restoration will only realize 50% of the expected emission reductions, resulting in a reduction of 40 to 50 MtCO2 eq by 2020.
In addition to measures related to land use , Brazil states in its 10 Year National Energy Expansion Plan (hydro, RES)7 that the country will triple its use of ‘new’ energy (excluding large hydro) by 2020: from 9 GW of wind and biomass energy and small hydropower in 2010, to 27 GW by 2020. This would result in a 16% share of renewable electricity by 2020. If these targets are achieved, they would result in an emission reduction of 0 to 40 MtCO2 eq by 2020. The low end is based on the PBL-TIMER BAU projections that include an already large share of biomass-based electricity production. The high end is based on Ecofys calculations using WEO 2011 projections.
Conclusion. Overall, the effects of Brazil’s policies on emission reductions are uncertain, as LULUCF BAU emission projections themselves are very uncertain and represent the largest part of emissions. The uncertainty is expected to decrease in the near future as deforestation monitoring is improving in Brazil. Our current analysis shows that the 2020 emission level after implementation of climate and energy policies could end up either above or below the pledged emission level (see Figure 3.3). The contribution of renewable energy policy to achieving the pledge is expected to be small.
3.4 Canada
Canada’s main climate policies are expected to lead to only minor emission reductions. For 2020 we project an emission level of 720–780 MtCO2 eq, which is not far below the BAU projection of 745–785 MtCO2 eq (excluding LULUCF). Canada’s main policy is a fuel efficiency standard for cars, which is harmonised with US standards and introduced in two phases. As the first phase of the efficiency standard is already incorporated in the national BAU projection, the impact of the standard on CO2
emissions is projected to occur mainly after 2020. Another policy is the carbon standard for coal-fired power plants. This standard is projected to have only a small effect on 2020 emissions levels, as it does not affect existing power plants.
Pledge. Canada has pledged to reduce its emissions by 17% below 2005 levels, mirroring the target proposed by the United States. Canada’s pledge is conditional on the passing of domestic legislation. The emission target level is 610 MtCO2 eq, compared to the 2005 level of 740 MtCO2
eq.
Baseline. BAU emissions are projected at 745 to 785 MtCO2 eq by 2020. According to Canada’s 2011 Emission Trends Report, BAU emissions would reach 785 MtCO2 eq in 2020 (Environment Canada, 2011). This figure has been revised downwards to 745 MtCO2 eq in the 2012 Emission Trends Report (Environment Canada, 2012a), due to a stronger than expected effect of the economic recession, methodology updates, and accounting for forestry emissions and implemented policies. The PBL TIMER BAU projection is 760 MtCO2 eq.
Role LULUCF. Canada has very large forest areas and therefore a potentially large uptake of CO2; hence accounting rules for LULUCF have a significant effect on emission projections. For Canada, LULUCF may contribute credits up to about 9 MtCO2 (1.6 % of 1990 emissions), based on the LULUCF accounting rules as agreed in Durban (Grassi et al., 2012). Significant uncertainties are linked to natural disturbances, but the impact of these disturbances on forest management may be excluded according to the rules agreed in Durban. The Environment Canada (2012a) published a higher estimate of LULUCF credits, of about 25 MtCO2 (about 4 % of 1990 emissions). These reductions are not included in Table 3.6, which only contains emissions excluding LULUCF.
Main policies. The most important national climate policies include a fuel efficiency standard for light-duty vehicles and a carbon standard for coal-fired power plants.
The fuel efficiency standard for light-duty vehicles is harmonised with US standards, and introduced in two phases. The first phase covers the 2012–2016 period, and the second phase, with higher standards, the 2017–2025 period. A draft standard for heavy-duty trucks was published in April 2012, but as its status is not yet clear it has not been included in this assessment. The first phase of the light-duty vehicle standards has already been included in the BAU emission projection of Environment Canada. If the second phase of this standard is implemented and harmonised with US standards, it will target an average emission intensity of 163 g CO2/mile (101 g CO2/km) by 2025. According to Ecofys calculations, which are based on travel distance and transport emissions from Environment Canada (2012b) for ground transport, the second phase is not likely to already have a big impact in 2020. PBL calculations, based on running a policy scenario in the PBL TIMER transport model for the first and second phase, show an emission reduction of 20 to 40 MtCO2 eq compared to the PBL TIMER BAU. This reduction is higher than the reduction calculated by Ecofys, because the PBL TIMER BAU projections do not include the first phase of the fuel efficiency standard.
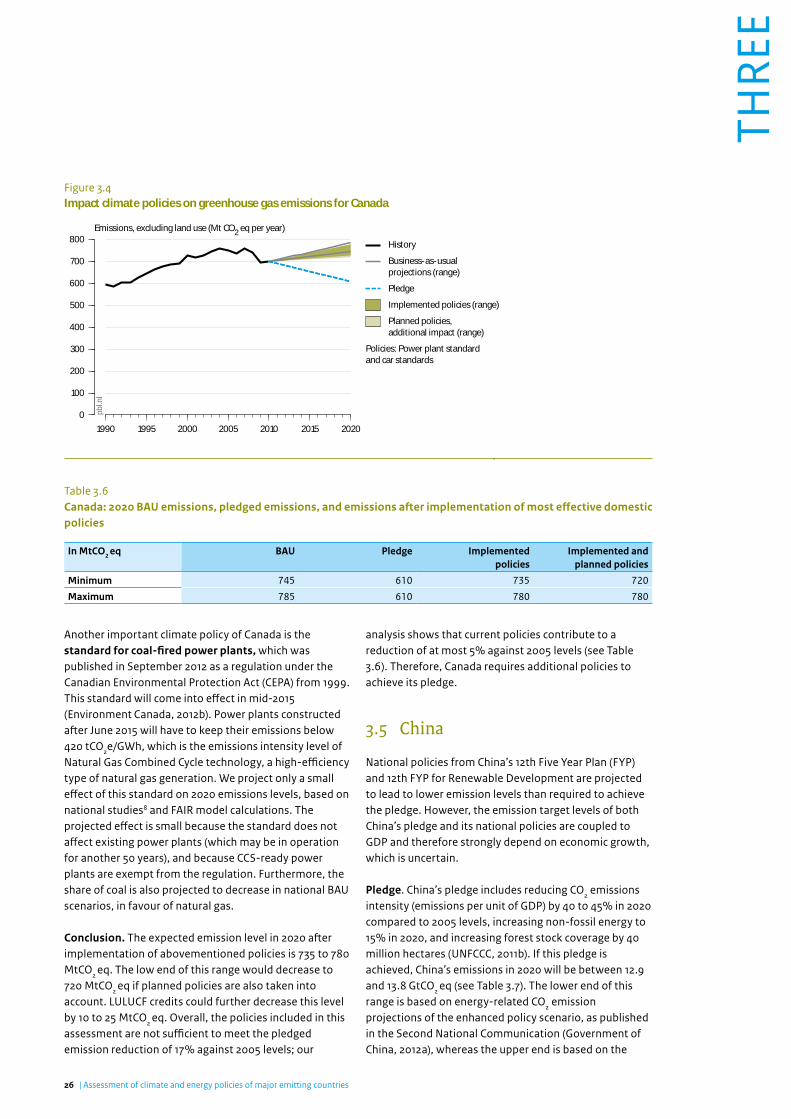
26 | Assessment of climate and energy policies of major emitting countries
THRE
E
Another important climate policy of Canada is the standard for coal-fired power plants, which was published in September 2012 as a regulation under the Canadian Environmental Protection Act (CEPA) from 1999. This standard will come into effect in mid-2015 (Environment Canada, 2012b). Power plants constructed after June 2015 will have to keep their emissions below 420 tCO2e/GWh, which is the emissions intensity level of Natural Gas Combined Cycle technology, a high-efficiency type of natural gas generation. We project only a small effect of this standard on 2020 emissions levels, based on national studies8 and FAIR model calculations. The projected effect is small because the standard does not affect existing power plants (which may be in operation for another 50 years), and because CCS-ready power plants are exempt from the regulation. Furthermore, the share of coal is also projected to decrease in national BAU scenarios, in favour of natural gas.
Conclusion. The expected emission level in 2020 after implementation of abovementioned policies is 735 to 780 MtCO2 eq. The low end of this range would decrease to 720 MtCO2 eq if planned policies are also taken into account. LULUCF credits could further decrease this level by 10 to 25 MtCO2 eq. Overall, the policies included in this assessment are not sufficient to meet the pledged emission reduction of 17% against 2005 levels; our
analysis shows that current policies contribute to a reduction of at most 5% against 2005 levels (see Table 3.6). Therefore, Canada requires additional policies to achieve its pledge.
3.5 China
National policies from China’s 12th Five Year Plan (FYP) and 12th FYP for Renewable Development are projected to lead to lower emission levels than required to achieve the pledge. However, the emission target levels of both China’s pledge and its national policies are coupled to GDP and therefore strongly depend on economic growth, which is uncertain.
Pledge. China’s pledge includes reducing CO2 emissions intensity (emissions per unit of GDP) by 40 to 45% in 2020 compared to 2005 levels, increasing non-fossil energy to 15% in 2020, and increasing forest stock coverage by 40 million hectares (UNFCCC, 2011b). If this pledge is achieved, China’s emissions in 2020 will be between 12.9 and 13.8 GtCO2 eq (see Table 3.7). The lower end of this range is based on energy-related CO2 emission projections of the enhanced policy scenario, as published in the Second National Communication (Government of China, 2012a), whereas the upper end is based on the
Figure 3.4
1990 1995 2000 2005 2010 2015 20200
100
200
300
400
500
600
700
800Emissions, excluding land use (Mt CO2 eq per year)
pbl.n
l
History
Business-as-usualprojections (range)PledgeImplemented policies (range)Planned policies, additional impact (range)
Policies: Power plant standard and car standards
Impact climate policies on greenhouse gas emissions for Canada
Table 3.6 Canada: 2020 BAU emissions, pledged emissions, and emissions after implementation of most effective domestic policies
In MtCO2 eq BAU Pledge Implemented policies
Implemented and planned policies
Minimum 745 610 735 720
Maximum 785 610 780 780

27Analysis of the domestic policies of individual countries |
THRE
E
THREE
calculated emission level associated with a 40% intensity reduction, using the 7% annual GDP growth published in the same national communication. Both projections are supplemented with industry-related CO2 and non-CO2 greenhouse gas emissions from the PBL/IIASA BAU, as described in Den Elzen et al. (2013a). We assumed that the impact of the non-fossil target was also taken into account in the enhanced policy scenario, as the National Communication mentions that the range for this scenario includes policies and measures to be taken during the 12th FYP period (2011–2015) and 13th FYP period (2016–2020) (Government of China, 2012a, p. 75).
Baseline. The BAU emission levels taken into account in our analysis range from 14.1 to 17.4 GtCO2 eq in 2020 (Table 3.7). These BAU emission projections are based on:• projections from the Current Policies Scenario of the
2011 World Energy Outlook (IEA, 2011), supplemented with cement emission projections from CDIAC (2013), non-CO2 historical emissions data from EDGAR (JRC/PBL, 2012) , combined with GDP growth rates projected by US EPA (EPA, 2006). This leads to a BAU emission level of 14.1 GtCO2 eq by 2020. The WEO 2011 projections already include implementation of measures from the 12th FYP and the non-fossil target for 2020
• PBL TIMER/IMAGE projections (15.9 GtCO2 eq by 2020)
• projections from the Second National Communication by China (Government of China, 2012a), supplemented with PBL TIMER/IMAGE projections for industry-related CO2 and CH4, N2O and F-gas emissions (17.4 GtCO2 eq in 2020).
Main policies. National climate policies in China are developing fast. Our assessment includes the most recent economy-wide climate and energy policies for the 2011–2015 period, as established in the 12th FYP and the 12th FYP for Renewable Energy Development. An energy cap is presently being discussed, but was not officially acknowledged at the time of our analysis, and is therefore not included. The same holds for pilot ETS schemes at the regional level, and an emission control target defined in terms of industrial value added.
The 12th Five Year Plan was published in March 2011, and includes translations of the voluntary international commitments (pledges) into domestic policies (Wang, 2012). It contains the following climate and energy targets: (i) a CO2 intensity target aimed at a 17% decrease in carbon dioxide emissions per unit of GDP, between 2011 and 2015; (ii) A non-fossil target aimed at increasing the share of non-fossil fuels (including nuclear) in primary energy consumption from 8.3% in 2010 to 11.4% by 2015; (iii) An energy-intensity target aimed at a
Figure 3.5
1990 1995 2000 2005 2010 2015 20200
2000
4000
6000
8000
10000
12000
14000
16000
18000Emissions, excluding land use (Mt CO2 eq per year)
pbl.n
l
History
Business-as-usualprojections (range)Pledge (range)Implemented policies (range)
Policies: CO2 and energy intensity targets, non-fossil target, renewable capacity target
Impact climate policies on greenhouse gas emissions for China
Table 3.7 China: 2020 BAU emissions, pledged emissions, and emissions after implementation of most effective domestic policies
In MtCO2 eq BAU Pledge Implemented policies
Minimum 14,095 12,930 12,769
Maximum 17,430 13,835 14,763

28 | Assessment of climate and energy policies of major emitting countries
THRE
E
16% decrease in primary energy consumption per unit of GDP, between 2011 and 2015. These targets have been analysed for the year 2015 using the BAU projections as described above, except for the National Communication, which did not contain enough detail on energy projections. The CO2 intensity and energy intensity targets for 2015 are achieved in all of the BAU projections. Achieving the non-fossil target by 2015 will lead to a further reduction of 150 to 240 MtCO2 eq compared to the PBL TIMER and ERI BAU projections, respectively. As the policies from the 12th FYP are already included in the WEO 2011 Current Policies Scenario, the non-fossil target does not lead to reductions against the WEO BAU projections.
We also analysed the effect of planned renewable capacities, for which the targets were increased more than twofold for some technologies in the 12th Five Year Plan for renewable energy development (Government of China, 2012b), compared to the previous version from 2007. The 12th FYP also contains targets for 2020; the installed renewable energy capacity target for 2020 aims at 290 GW of hydropower, 100 GW of wind power, 20 GW of solar power and 13 GW of biomass power. Additionally, the 12th FYP contains targets for increasing solar thermal water heating (820 million m2 collector area by 2020) and use of biofuels (2 million tonnes ethanol, 10 million tonnes biodiesel by 2020). The plan also contains targets for biogas and geothermal heat, but these are not included in our analysis. Achieving the renewable capacities target will lead to a 1,020 MtCO2 eq emission reduction compared to the PBL TIMER BAU projections, and an additional 160 MtCO2 eq reduction if the solar hot water target is achieved. The biofuel target was analysed using the PBL TIMER transport model, and leads to a projected reduction of 40 MtCO2 eq compared to BAU projections.
Uncertainty. The effect of the different policies on emission reductions compared to BAU projections is uncertain for several reasons. First, historical emissions are uncertain, as for example illustrated recently by Guan et al. (2012). Despite this uncertainty, it is known that emissions in China have increased faster than previously expected, and reached around 11 GtCO2 eq in 2010 (JRC/PBL, 2012). Second, BAU projections are uncertain, as is illustrated by the large range of BAU emissions in 2020, with a difference of 3.3 GtCO2 eq between the highest and lowest projection (see Table 3.7, Figure 3.5). Third, the effect of CO2 intensity targets and energy intensity targets depends on future GDP growth. Higher economic growth would make it easier to achieve the intensity target, assuming BAU emissions are not or relatively less affected by this higher GDP growth. The National Communication assumes an annual GDP growth of 7%
between 2010 and 2020, while the WEO 2011 assumes an annual growth of 7.9% for this period. A 1% higher growth rate would increase the targeted emission level of the CO2 intensity target by about 1 GtCO2 eq (Den Elzen et al., 2013a).
Conclusion. With its present and planned national policies, China could reduce its emissions beyond levels needed for reaching its pledge. This reduction is mainly driven by the renewable capacity targets defined in the 12th FYP for Renewable Energy Development. However, as the pledged reductions are coupled to GDP, the resulting emission level strongly depends on economic growth, which is uncertain. This also holds for the intensity targets from the 12th FYP.
3.6 Egypt
If Egypt implements its planned feed-in tariff, the renewable target for electricity production will reduce greenhouse gas emissions below BAU levels. However, emissions from energy supply will still increase compared to 2010 levels, due to the expected high growth of demand.
Pledge. Egypt did not submit an emission reduction pledge to the UNFCCC.
Baseline. Egypt has not published a BAU projection that covers emissions from all sectors. Therefore our assessment focused on the electricity sector only. The BAU emission level for the electricity sector in 2020 is projected to be between 140 and 190 MtCO2 eq (see Table 3.8), based on the WEO 2011 and the Second National Communication of Egypt9, respectively. The first estimate uses emissions from electricity production data and emission factors per unit of produced electricity from the IEA CO2 emissions database (2011). The second estimate starts with historical UNFCCC data10 from 1990 to 2006 and uses emission growth rates from the electricity sector until 2020, as published in the National Communication.
Main policies. Egypt has a national renewable energy target of 20% electricity generation in 2020, as described in their Second National Communication. If fully implemented, this target could reduce emissions from the electricity sector to a level between 120 and 140 MtCO2 eq, based on the IEA CO2 emissions database (2011) and the National Communication, respectively. To achieve this, Egypt would need to implement its planned feed-in tariff, as soon and as effectively as possible.

29Analysis of the domestic policies of individual countries |
THRE
E
THREE
3.7 European Union
The EU is enforcing its national legally binding framework, which is expected to come very close to delivering the emission reductions needed to achieve the unconditional 20% greenhouse gas reduction pledge by 2020.
Pledge. The EU has an unconditional target of 20% emission reduction below 1990 levels, and a 30% reduction target conditional on other Parties contributing their fair share to a cost-effective global emission reduction pathway.
Baseline. The European Union has published greenhouse gas emission trends and projections (EEA, 2012) including BAU projections from the Primes/Gains models. These project a 2020 emission level of 15% below 1990 levels, i.e. 4,720 MtCO2 eq (see Table 3.9).
National policies. The EU is enforcing its national legally binding framework to deliver its unconditional 20% greenhouse gas reduction pledge by 2020. Emission projections published by the European Environment Agency (EEA, 2012) show that the EU is close to meeting its 20% reduction target MtCO2 eq with currently
implemented national measures, achieving a 19% reduction or 4,500 MtCO2 eq in 2020. Currently planned policies would not be sufficient to meet the conditional pledge of 30% reduction below 1990 levels in 2020. These measures include an ETS, renewable energy targets and support, energy efficiency policies, and CO2 standards for light-duty vehicles. When accounting for the effect of these planned measures, the 2020 emission level is projected to be 4,200 MtCO2 eq (Table 3.9). To further reduce this level to 3,900 MtCO2 eq (required to meet the 30% conditional target), the EU would need to develop and implement additional policies and measures beyond the policies currently planned by Member States. In 2011, the EU emission level was approximately 4,600 MtCO2 eq, according to the EEA.
Figure 3.6
1990 1995 2000 2005 2010 2015 20200
50
100
150
200Emissions from energy supply (Mt CO2 eq per year)
pbl.n
l
History
Business-as-usualprojections (range)Implemented policies (range)
Policies: Renewable mix target (electricity)
Impact climate policies on greenhouse gas emissions for Egypt
Table 3.8 Egypt: 2020 BAU emissions and emissions after implementation of most effective domestic policies (emissions from energy supply only)
In MtCO2 eq BAU Pledge Implemented policies
Minimum 140 n/a 120
Maximum 190 n/a 140

30 | Assessment of climate and energy policies of major emitting countries
THRE
E
3.8 India
The emission level targeted by India’s pledge strongly depends on GDP growth. The domestic actions can either lead to considerable reductions or to emissions above the lower bound of current BAU projections. In both cases, we project that India is likely to achieve its pledge if it successfully implements its national policies, consisting of renewable energy targets and the PAT scheme for energy efficiency.
Pledge. India pledged to reduce CO2 emission intensity (emissions per unit GDP) by 20% to 25% in 2020, compared to 2005 levels (excluding emissions from the agricultural sector). The Indian Government presented a ‘Determined Effort’ scenario, in which the country could achieve 23% to 25% emission intensity reduction compared to 2005 levels, based on average annual GDP growth rates of 8% and 9% (Planning Commission Government of India, 2011). We used the information of these scenarios together with an 8% annual GDP growth to estimate emission levels resulting from the 20% to 25% intensity targets. This resulted in an emission target level of between 3,510 and 3,745 MtCO2 eq for 2020 (see Table 3.10).
Baseline. Our analysis included BAU projections from two national studies. The first is from the Planning Commission of the Government of India (2011), which has published BAU scenarios based on average annual GDP growth rates of 8% and 9%, assuming a constant emission intensity at the 2005 level. The emission levels resulting from these assumptions are between 4,570 and 5,250 MtCO2 eq in 2020. The second national study is from the Climate Modelling Forum in India, which published a comparison of several climate modelling studies with regard to India (Climate Modelling Forum India, 2009). The BAU range in this study is between 3,175 and 5,250 MtCO2 eq. In addition to these two national studies, our analysis included BAU projections from the PBL TIMER model and calculations by Ecofys. The PBL BAU projection for 2020 is 3,850 MtCO2 eq. Ecofys calculated a BAU level of 3,155 MtCO2 eq, based on UNFCCC historic data that were extrapolated using WEO 2011 growth rates until 2020. In conclusion, BAU projections for 2020 from the different models differ between 3,155 and 5,250 MtCO2
eq.
Main policies. In 2008, India launched a National Action Plan on Climate Change (NAPCC). The NAPCC provides eight national missions on sustainable development in key areas (Indian Government, 2008). The two missions
Table 3.9 EU27: 2020 BAU emissions, pledged emissions, and emissions after implementation of most effective domestic policies
In MtCO2 eq BAU Pledge Implemented policies
Implemented and planned policies
Minimum 4,720 3,900 4,500 4,170
Maximum 4,720 4,440 4,500 4,170
Figure 3.7
1990 1995 2000 2005 2010 2015 20200
1000
2000
3000
4000
5000
6000Emissions, excluding land use (Mt CO2 eq per year)
pbl.n
l
History
Business-as-usualprojectionsPledge (range)Implemented policies
Impact climate policies on greenhouse gas emissions for the EU-27

31Analysis of the domestic policies of individual countries |
THRE
E
THREE
that directly impact greenhouse gas emissions are the National Mission for Enhanced Efficiency (NMEE) and the National Solar Mission (NSM). The market-based mechanism Perform Achieve and Trade (PAT) is part of the NMEE. The NAPCC also sets a renewable electricity target for 2020. These policies from the NAPCC were included in our analysis. In addition, we included the Strategic Plan for New and Renewable Energy Sector (Indian Government, 2011), which covers the 2011–2017 period and contains detailed targets on the electricity sector. India also proposed a coal tax, but it is on hold and moreover, it is unclear whether it would be effective in reducing emissions, as the proposed tax is set at a very low level. Therefore the coal tax was not included in our analysis.
Capacity targets for renewable electricity. The Strategic Plan for New and Renewable Energy Sector (2011–2017) contains capacity targets for wind, solar and biomass. The targets for 2017 are 27.3 GW wind, 4 GW solar, 5 GW biomass (agricultural waste and cogeneration) and 5 GW other renewable energy. The plan also contains aspirations for 2022, of the Ministry of New and Renewable Energy, which is responsible for the National Solar Mission NAPCC. These targets for 2022 are 38.5 GW wind, 20 GW solar, 7.3 GW biomass and 6.6 GW other renewable energy. Assuming these capacity targets will
be reached, they would reduce emissions by about 60 MtCO2 eq, according to both PBL and Ecofys calculations.
Renewable electricity target. The NAPCC introduced a dynamic renewable target set at 5% renewable electricity production in 2010 (excluding hydro power), to increase by 1% each year until 2020, resulting in a 15% share of renewable energy in 2020. This target was reconfirmed in the 2nd National Communication (Indian Government, 2012b). A market-based mechanism was introduced to address this goal, using so-called Renewable Energy Certificate (REC) schemes. The expected emission reductions from this target are between 140 and 200 MtCO2 eq, where the lower bound is based on Ecofys calculations and WEO 2011 BAU projections, and the higher bound is based on BAU projections from the PBL TIMER model.
Energy efficiency scheme (PAT): The Perform, Achieve and Trade (PAT) scheme was introduced as one of the four pillars of the National Mission on Enhanced Energy Efficiency (NMEE), which is part of the NAPCC. The PAT scheme was agreed upon by the Indian Government on 30 March 2012. The scheme aims to improve energy efficiency in large industries and the power sector through a market based mechanism. It covers facilities that together account for around 45% of the total energy
Figure 3.8
1990 1995 2000 2005 2010 2015 20200
1000
2000
3000
4000
5000
6000Emissions, excluding land use (Mt CO2 eq per year)
pbl.n
l
History
Business-as-usualprojections (range)Pledge (range)Implemented policies (range)
Policies: Renewable mix target (electricity), renewable capacitytarget, renewable portfoliostandard
Impact climate policies on greenhouse gas emissions for India
Table 3.10 India: 2020 BAU emissions, pledged emissions, and emissions after implementation of most effective domestic policies
In MtCO2 eq BAU Pledge Implemented policies
Minimum 3,155 3,510 2,655
Maximum 5,250 3,745 3,795

32 | Assessment of climate and energy policies of major emitting countries
THRE
E
consumed in India. The target is set to reach 5% energy consumption reduction below BAU projections in the industry sector in 2015. The Ecofys study includes results found in national reports and own calculations. In the national studies done by the Ministry of Power it is estimated that the PAT scheme will have an energy saving potential of 6.7 MToe (280 PJ) per year (Indian Government, 2012a), resulting in CO2 emissions reductions in the order of 25 Mt, annually, by 2015. Assuming BAU trends for the period between 2015 and 2020 for electricity production, this results in a 50 MtCO2
eq reduction in 2020 compared to BAU projections from WEO 2011. Assuming that continuation of the PAT scheme implies at least constant emission levels between 2015 and 2020, the Ecofys study concludes that the total reduction will be between 350 and 395 MtCO2 eq by 2020. PBL calculations only assed the effects for 2015 and show a 20 MtCO2 eq reduction by 2015.
Overlap between policies. Because improved energy efficiency leads to lower energy consumption, the effect of the energy efficiency scheme overlaps with the renewable electricity target. The Ecofys calculations show that the overlap between the renewable targets and the PAT scheme for the power sector is small (around 5 MtCO2
eq in 2020). The PBL study assumed an overlap of 25% .
Conclusion. Our analysis shows that the 2020 emission level after implementation of the renewable energy and efficiency policies is likely to be below the pledged emission targets (Figure 3.8). The uncertainty of future emissions and impacts of policies in India is large because both BAU emission projections and GDP developments are uncertain.
3.9 Indonesia
Indonesia’s emission reductions resulting from the policies assessed in this study are smaller than the uncertainty around emissions from land use changes and forestry (which also include peat lands). Therefore, the emissions remaining after implementation of these policies could not be determined. For the energy sector, the renewable targets set for 2020 and 2025 are expected to lead to small emission reductions compared to BAU projections.
Pledge. Indonesia submitted an unconditional pledge to reduce emissions by 26% from its BAU emission projections. At the Bangkok conference (April 2011) Indonesia also submitted a high pledge of 41%, conditional on international support. The 2020 emission target resulting from the pledges would be between 1.7 and 2.2 GtCO2 eq, including LULUCF emissions, based on
the BAU projection in the Second National Communication (Indonesian Government, 2010).
Baseline. BAU emissions by 2020 including LULUCF are projected at 1,585 according to PBL/IIASA and at 2,950 MtCO2 eq according to the Second National Communication (Table 13). The BAU emissions excluding LULUCF and peat emissions are less uncertain, with PBL TIMER projecting 990 MtCO2 eq and Indonesia’s Second National Communication 1,300 MtCO2 eq. Indonesia’s LULUCF emissions are mainly originating from deforestation and peat lands; The BAU in 2020 from the Second National Communciation includes peat land emissions of about 1.0 GtCO2 eq, besides peat fire emissions of about 0.5 GtCO2 eq. IIASA does not provide own projections of peat land emissions. The IIASA BAU projections for deforestation emissions is 155 MtCO2 eq, which is much lower than the 900 MtCO2 eq projected in the Second National Communication.
Main policies. Indonesia has several policies in place for the LULUCF sector. Our assessment included two policies on logging, and one on controlling peat land fires. For the energy sector, we included the renewable targets for 2020 and 2025, which fully overlap with the biofuel target set for 2025.
Indonesian land-use emissions are mainly the result of deforestation and peat land destruction. There are many factors causing deforestation and forest degradation in Indonesia. These include (i) forest fires, (ii) illegal logging, (iii) forest encroachment, (iv) forest conversion for establishment of agricultural plantations, transmigration areas and new districts, (v) development of new rice fields, and (vi) large-scale mining activities. The first three factors are defined as unplanned deforestation and the remaining factors as planned deforestation (Indonesian Government, 2010). We looked into two policies that address both types of deforestation: a reduction in illegal logging through FLEGT measures, and a reduction in legal logging through forest conservation initiatives.
Under the Forest Law Enforcement, Governance and Trade (FLEGT) programme, Indonesia has a ‘Voluntary Partnership Agreement’ with the EU, guaranteeing to export only legally harvested timber to the EU. This is a step to halt illegal logging and to decrease emissions from land use and forestry. Illegal logging seems to be the major cause of greenhouse gas emissions. Indonesia’s forest area encompasses around 134 million hectares with an area under production of around 61.5 million hectares (46%). We assumed that the production area is most vulnerable for illegal logging. Current illegal logging volumes are estimated to be between 20 and 50 Mm3

33Analysis of the domestic policies of individual countries |
THRE
E
THREE
annually, estimated as the difference between timber demand and current production (Luttrell et al., 2011). We translated this into an affected area of 200,000 to 500,000 hectares annually, assuming a yield of 100 m3 per hectare11. Probably only a fraction of this timber is exported. However, a successful implementation of FLEGT will decrease (local) demand for illegal timber and thus reduce illegal logging all over Indonesia. In our calculations we assumed that about 50% of the areas affected by illegal logging are deforested and lose their carbon stock. The remaining area is likely to be degraded after illegal extraction of wood, but will also regrow to some degree. We further assumed that all illegal logging is banned by the policy, which is an optimistic assumption. In our analysis, the emission reductions as a result of FLEGT are based on emission factors of 500–700 tCO2 eq/ha, based on the IIASA G4M model and two national studies (DNPI, 2009; Ministry of Finance, 2009).
Our calculations show that FLEGT could contribute to emission reductions of 70 to 130 MtCO2 eq by 2020.
Reduce legal logging. Indonesia and Norway signed the Oslo Pact, which will pay Indonesia up to USD 1 billion to reduce carbon emissions by advancing forest conservation initiatives. As part of the deal, Indonesia must halt the licensing of new agricultural plantations and logging concessions on peat lands and natural forest for two years. Clearing and logging must instead be directed to non-forest ‘degraded’ lands and to existing concessions. As this logging ban is currently limited to two years and the implementation is not fully guaranteed it is impossible to quantify effects of this policy on 2020 emissions. Due to the fact that the most threatened forests are excluded the effect is likely to be very small or even zero.
Figure 3.9
1990 1995 2000 2005 2010 2015 2020
0
500
1000
1500
2000
2500
3000Emissions, including land use (Mt CO2 eq per year)
pbl.n
l
Historic LULUCF CO2emissions from IIASA G4M/GLOBIOM modely
Business-as-usual projections (range)
Pledge (range)
Implemented policies (range)
Policies: Forestry policies, renewable mix target (primary energy), biofuel target
Impact climate policies on greenhouse gas emissions for Indonesia
1990 1995 2000 2005 2010 2015 2020
0
500
1000
1500
2000
2500
3000
pbl.n
l
Historic LULUCF CO2emissions from Second National Communication
Table 3.11 Indonesia: 2020 BAU emissions, pledged emissions, and emissions after implementation of most effective domestic policies
In MtCO2 eq BAU Pledge Implemented policies
Minimum 1,585 1,770 1,465
Maximum 2,950 2,185 2,200
Note: levels include LULUCF CO2 and peat emissions.

34 | Assessment of climate and energy policies of major emitting countries
THRE
E
Control peatland fires. In 2005 a quarter of Indonesia’s total emissions was attributed to peat fires. While the ignition of such fires is hard to suppress and severity to a large degree depends on climatic factors, degraded peat swamp forests are clearly the most vulnerable. Risks for Indonesia that might lead to inefficient policies and thus higher emissions in 2020 are manifold. The largest is natural disturbance. In West Kalimantan, between 1989 and 2008 fire was the primary proximate cause of deforestation for 93% of the deforested area and contributed to 69% of net carbon emissions of the region. By 2007–2008, oil palm plantations directly caused 27% of total deforestation and 40% of peatland destruction. According to estimates by Carlson et al. (2012), prohibiting conversion of intact and logged forest and peatland to oil palm would reduce emissions only 4% below BAU, because of continued uncontrolled fire. Protecting logged forests would achieve greater carbon emissions reductions (21%) than protecting intact forests alone (9%), and is therefore critical for mitigating carbon emissions. The above estimates of emission reductions resulting from forestry and land use policies are based on selected isolated policies. Their success depends on the adoption of other policies and good governance in related sectors. Furthermore, the development of global markets is important as well, as e.g. the FLEGT policy strongly builds on market forces. Because of the high uncertainty, we assumed that peatland emissions would not be reduced.
Renewable energy target. According to the National Energy Policy12, 13, Indonesia has a target of 15% renewable energy sources by 2020. More frequently quoted is a share of 17%, including a 2% share of liquefied coal, which does entail greenhouse gas emissions. In the Second National Communication, Indonesia reaffirms this target, but postpones it to the year 2025. The Ecofys calculations show that the renewable target would result in an emission reduction of around 80 MtCO2 eq by 2020, based on emission and energy use projections from the Indonesian Energy Outlook. The PBL calculations, based on the PBL TIMER model, project an emission reduction of around 50 MtCO2 eq by 2020. According to the national policy description, renewable energy sources would replace mainly oil, which has lower emissions per kWh produced than coal, and would not reduce the share of electricity generated by coal-fired plants.
One policy aimed at achieving the renewable energy target is the biofuel quota, which aims at a 15% share of biofuels in all transportation fuels by 2025. The target is supported by the Biofuel Price Subsidy, which guarantees a certain price and obliges the national oil company to purchase the products of national biofuel producers. Transport emissions are expected to increase drastically,
due to the very high demand expected for transportation in the coming decade. If the quota is enforced successfully, this law would reduce emissions of the transport sector by 5–15 MtCO2 eq, based on Ecofys calculations. The lower estimate assumes that the emission factor for biofuels is 80% of that of gasoline, while is the higher estimate assumes that biofuels do not entail greenhouse gas emissions (based on EPA (2010b)). For comparison, the biofuel target was also analysed with the new PBL TIMER transport model (Girod et al., 2012), resulting in an emission reduction of around 30 MtCO2 eq against BAU projections in 2020. As the renewable energy target includes assumptions on increased use of biomass, the emission reductions resulting from the biofuel target overlap with the those from the renewable energy target.
Conclusion. The projected 2020 emission level after implementation of Indonesia’s forestry policies, policies on controlling peat land fires, and renewable energy targets is between 1,465 and 2,200 MtCO2 eq (Table 3.11). Although this would imply that Indonesia could meet its pledge, the uncertainty in emissions from the forestry sector is larger than the reductions projected by our analysis. Therefore it is not possible to determine the remaining emissions after implementation of policies.
3.10 Japan
Japan’s climate and energy policies are likely to change significantly due to the Fukushima accident; a new energy plan is expected to be released in 2013. Therefore, it was not possible to make an assessment of Japan’s domestic policies at the time of this report.
Pledge and baseline. Although Japan does not participate in the second commitment period of the Kyoto Protocol, it will continue to reduce greenhouse gas emissions in accordance with its Cancún Pledge (World Bank, 2012). Japan pledged a conditional 25% reduction by 2020 relative to 1990 levels, which would result in a total emission of 950 MtCO2 eq by 2020. Compared to the expected BAU emissions of 1,245 to 1,340 MtCO2 eq, this is quite ambitious.
Main policies. Whether Japan can meet its pledge depends to a large extent on its future energy plan, which at the time of our assessment was still under discussion. The plan is due to be released in spring 2013. A potential phase out of nuclear power would imply a redesign of Japan’s energy market and require high investments to still meet the pledge.

35Analysis of the domestic policies of individual countries |
THRE
E
THREE
3.11 Malaysia
Malaysia did not submit an international emission reduction pledge, but has two important national policies: a renewable capacity target and an efficiency target. The renewable target is projected to have only limited impact on emissions, but the energy efficiency target could lead to significant emission reductions, if fully implemented and backed up with supporting measures.
Baseline. Malaysia did not submit an international emission reduction pledge. According to the Second National Communication (Malaysian Government, 2011), the 2020 BAU emission level is 340 MtCO2 eq. This BAU projection takes into account energy and waste emissions, which represent about 90% of total emissions, excluding emissions from LULUCF. The emissions from the industrial and agricultural sectors are based on UNFCCC historic data14 until 2000, and on the assumption that emission growth between 2000 and 2020 is equal to the growth of the energy and waste sectors.
Main policies. Our assessment covers two national policies for Malaysia, i.e. the renewable energy capacity target for 2020 and the planned energy efficiency target for 2030.
The National Renewable Energy Policy and Action Plan (Malaysian Government, 2008) sets a target of 2 GW renewable capacity installed in 2020, and 3.5 GW renewable capacity in 2030. The implementation of this target is supported by a feed-in tariff, which is secured in the 2011 Renewable Energy Bill. The implementation of the renewable capacity target has only moderate impact on emissions (a reduction of 1–8 MtCO2 eq in 2020), according to calculations by Ecofys using the Energy Outlook from the Asia Pacific Energy Research Centre (Asia Pacific Energy Research Centre, 2013)15 and according to the Ministry of Environment16. The reason is that the target translates into an increase of only 5% renewable generation, which is not enough to significantly contribute to meeting the increasing power demand, for which Malaysia is also adding conventional energy sources.
With its National Energy Efficiency & Conservation Master Plan, Malaysia aims to reduce final energy consumption by 10% until 2030, compared to BAU projections17. If fully implemented and backed up with supporting measures, this policy could lead to significant emission reductions of about 30 MtCO2 eq, based on emission and energy consumption projections from the Second National Communication.
Figure 3.10
1990 1995 2000 2005 2010 2015 20200
200
400
600
800
1000
1200
1400
1600Emissions, excluding land use (Mt CO2 eq per year)
pbl.n
l
History
Business-as-usualprojections (range)Pledge
Policies: Wait for energy plan to be published in 2013
Impact climate policies on greenhouse gas emissions for Japan
Table 3.12 Japan: 2020 BAU emissions, pledged emissions, and emissions after implementation of most effective domestic policies
In MtCO2 eq BAU Pledge Implemented policies
Minimum 1,245 950 n/a
Maximum 1,340 950 n/a

36 | Assessment of climate and energy policies of major emitting countries
THRE
E
Conclusion. The 2020 emission level after implementation of the two analysed policies is projected at around 285 MtCO2 eq, compared to 340 MtCO2 eq in the BAU scenario.
3.12 Mexico
Our own calculations indicate that, with currently implemented policies, Mexico will achieve emission reductions, but these are not sufficient to meet its conditional pledge of a 30% emission reduction by 2020 relative to BAU levels. However, according to two studies from the literature and the national BAU projection, Mexico could reduce its emissions halfway towards the level of the pledge.
Pledge. Mexico was one of the first developing countries to ratify the Kyoto Protocol and one of the first to adopt a long-term reduction target for 2050, consisting of a 50% emission reduction relative to 2000 levels. For 2020, it has pledged to reduce greenhouse gas emissions by 30% against national BAU emission projections (UNFCCC, 2011b). The 2020 emission level if the pledge is achieved will be around 670 MtCO2 eq (NCCS, 2013). Mexico’s pledge is conditional on adequate financial and
technological support from developed countries as part of a global agreement.
Baseline. The range of BAU emissions in our study is between 835 and 960 MtCO2 eq, including LULUCF emissions (Table 3.14). The high end of this range is presented in the National Climate Change Strategy (NCCS, 2013). The low end is based on projections by The Climate Action Tracker (Ecofys & Climate Analytics, 2012) and PBL. Mexico is in the process of updating its national projections until at least 2030, but this update has not been published yet.
Main policies. Mexico’s Special Programme on Climate Change (PECC) (SEMARNAT, 2009) lays out a strategy for implementing climate actions until 2012. In 2012 the General Law on Climate Change18 was adopted, which provides a solid institutional framework to support mitigation actions and sets several targets for 2020 and 2024. The first target is to achieve a 30% emission reduction by 2020 relative to BAU projections, which equals Mexico’s international pledge. The second target aims at a 35% share of electricity generated from clean energy sources by 2024. The third target aims at zero net carbon loss from forest ecosystems. This way, Mexico’s ambitious international Cancún pledge is now secured in a national climate law.
Figure 3.11
1990 1995 2000 2005 2010 2015 20200
50
100
150
200
250
300
350Emissions, excluding land use (Mt CO2 eq per year)
pbl.n
l
History
Business-as-usualprojectionsImplemented policies (range)Planned policies, additional impact
Policies: Renewable capacity target, energy efficiency target
Impact climate policies on greenhouse gas emissions for Malaysia
Table 3.13 Malaysia: 2020 BAU emissions, and emissions after implementation of most effective domestic policies
In MtCO2 eq BAU Pledge Implemented policies
Implemented and planned policies
Minimum 340 n/a 330 285
Maximum 340 n/a 335 285

37Analysis of the domestic policies of individual countries |
THRE
E
THREE
The renewable electricity target aims to achieve a 35% share of electricity generated from clean energy sources by 2024. In the Mexican Energy Outlook (Mexico, 2010), the projected share of renewable energy in BAU is 15% by 2020. Achieving a 29% share of renewable energy by 2020 (based on a linear path towards the 35% target in 2024) has limited impact on 2020 emission levels, because the renewable energy mainly replace natural gas, which has relatively low emissions. These calculations are based on energy consumption projections from the Mexican Energy Secretariat (2010) and WEO 2011 emission factors. The PBL calculations show a similar pattern. Therefore, the renewable electricity target is expected to reduce emissions only by 5 to 20 MtCO2 eq in 2020. In order to achieve this target, some financial incentives are in place together with the opportunity for the private sector to produce electricity and heat. We assumed that this target will be achieved before 2020, and therefore did not include implementation barriers in our calculations.
The forestry target, which is also part of the climate law, aims to achieve zero net carbon loss from forest ecosystems by 2020. The necessary emission reductions could come from the ProArbol programme and current REDD+ projects. The ProArbol programme has been set up to generate economic development through
valuation, conservation, restoration and sustainable production of forestry resources. It contains targets for reducing deforestation and forest degradation and for implementing reforestation projects. The expected emission reduction from these measures is between 20 and 30 MtCO2 eq, based on IIASA G4M model projections and the SEMERNAT presentation (see Footnote 32).
Additional policies. Our calculations project a 5% emission reduction against BAU from the most effective implemented policies (Figure 3.12). However, two other studies indicate that Mexico could achieve roughly half of the conditional pledge if all currently implemented policies are taken into account. According to a presentation by SEMARNAT19, Mexico could achieve reductions of about 130 MtCO2 eq with current policies, which is about half of what is needed to meet its pledge in 2020. Most of these reductions result from measures in the forestry sector, from measures addressing fugitive emissions in the oil and gas sectors, and from the sustainable cities programme that is targeting transport and waste emissions. SEMARNAT’s conclusion is confirmed by the Climate Action Tracker’s country report on Mexico.
Figure 3.12
1990 1995 2000 2005 2010 2015 20200
200
400
600
800
1000Emissions, including land use (Mt CO2 eq per year)
pbl.n
l
History
Business-as-usualprojections (range)PledgeImplemented policies (range)
Policies: Renewable mix target (electricity), forestry target
Impact climate policies on greenhouse gas emissions for Mexico
Table 3.14 Mexico: 2020 BAU emissions, pledged emissions, and emissions after implementation of most effective domestic policies
In MtCO2 eq BAU Pledge Implemented policies
Minimum 835 670 800
Maximum 960 670 845
Note: levels include LULUCF emissions.

38 | Assessment of climate and energy policies of major emitting countries
THRE
E
Conclusion. According to our assessment and most of all based on national and literature studies, Mexico’s currently implemented domestic policies could reduce emission levels to 800 to 845 MtCO2 eq by 2020 (see Figure 3.12). Additional policies are being planned, mostly within the framework of the new Low Emission Development Strategy.
3.13 Russia
Russia pledged an emission reduction of 15% to 25% relative to 1990 levels by 2020. Especially the low pledge can easily be achieved and could lead to surplus credits. The Russian State Program includes targets for energy efficiency and renewable electricity production. If fully implemented, the energy efficiency target could lead to a substantial decrease of emissions, but supporting policies are not yet in place. The effect of the renewable electricity target is expected to be much smaller. Russia’s gas flaring policy could lead to additional emissions reductions, but it is unclear whether this policy will be fully implemented. The implemented policies analysed in this assessment could together lead to an emission reduction of around 120 MtCO2 eq. Planned policies could further reduce emissions by an additional 100 MtCO2 eq.
Pledge. Russia pledged a greenhouse gas emission reduction of 15% to 25% relative to 1990 levels by 2020. The pledge is conditional on appropriate accounting of LULUCF and on the largest emitting countries taking on legally binding obligations. The pledge is not projected to lead to substantial reductions relative to BAU (see Figure 3.13). If achieved the pledge would result in a 2020 emission level ranging from about 2,515 to 2,850 MtCO2
eq, and could lead to surplus credits on top of the credits already retrieved from the first Kyoto period.
Baseline. Russia presented a BAU projection in its National Communication to the UNFCCC20. This communication contains a moderate and an innovative scenario, with 2020 BAU emission levels of 2,450 and 2,750 MtCO2 eq, respectively. The PBL BAU emission projection is close to the level of the moderate scenario (2,420 MtCO2 eq, see Table 3.15).
Role LULUCF. Russia has very large forest areas and therefore a potentially large uptake of CO2. Hence accounting rules for LULUCF have a significant effect on emission projections. Russia’s LULUCF credits in 2020 for afforestation, reforestation and deforestation are calculated following the LULUCF accounting rules as agreed in Durban, based on Grassi et al. (2012). For forest management, Russia’s proposed reference level is at 1990 levels, and substantial credits are expected even without
additional actions. A cap on forest management of 3.5% of the base year emissions is applied following the Durban rules. This implies that LULUCF may contribute credits up to about 110 MtCO2 (3.2% of 1990 emissions).
Main policies. Energy efficiency measures could lead to substantial greenhouse gas emission reductions in Russia. Renewable energy targets could also contribute to emission reductions. In order to improve its energy efficiency, Russia has passed several laws and rules (Townshend et al., 2013). The main programme, ‘Energy saving and energy efficiency improvement until 2020’, was developed in 2010. As part of this programme, Russia launched a mechanism for public–private partnerships in the field of energy efficiency and renewable energy sources. During 2010–2012 there were further discussions regarding additional state energy efficiency programmes, but so far none have been implemented.
With respect to energy efficiency, Russia committed to reduce energy intensity of GDP by 40% by 2020 compared to 2007 levels in its state programme ‘Energy Saving and Energy Efficiency until 2020’, which is supported by the federal law ‘on energy saving’ that was adopted in 2009. Without additional government support, the energy intensity of GDP is projected to decrease by 26.5% by 2020 compared to 2007, due to autonomous efficiency improvements and structural shifts in the energy market (Russian Energy Agency, 2011). These structural shifts are not incorporated in our PBL TIMER projections, which are based on energy use from WEO 2011, combined with GDP projections from the Fifth National Communication and the World Bank. Therefore a decrease of energy intensity by 26.5% leads to a reduction of 90 to 230 MtCO2 eq compared to PBL and WEO 2011 BAU emissions. As it appears that no additional measures are currently in place to achieve the 40% energy intensity reduction target, we assumed that this target will be backed by additional policies that are still in the planning phase. These planned policies would result in 400 to 530 MtCO2
eq reductions compared to BAU projections.
In 2009, the government published a decree for enhancing energy efficiency21 through renewable energy (Ministry of Natural Resources Russian Federation, 2010), which called for an increase in the share of renewable energy sources in the power mix to 4.5% by 2020, excluding hydro. This target only leads to small emission reductions (20 to 65 MtCO2 eq), because an almost similar share of renewable energy is achieved in the BAU scenario of PBL TIMER and WEO 2011. In the Ecofys calculations, the renewable energy target was assumed to overlap with the energy intensity target, and therefore no additional reductions were assumed. In the PBL calculations the targets were assumed to be mutually exclusive.

39Analysis of the domestic policies of individual countries |
THRE
E
THREE
Reduce emissions from gas flaring. Russia is one of the most important oil and gas producers in the world. In January 2009, a government decree was adopted aimed at reducing emissions from gas flaring. A 5% limit for gas flaring has been set for 2012 and subsequent years with fines being imposed if this threshold is exceeded. The 5% limit can also be reformulated as a 95% minimum utilization of Associated Petroleum Gas (APG). In 2005, CO2 emissions from flaring in Russia were approximately 150 MtCO2. As it is unclear what the BAU projections from the World Energy Outlook and national communications assume on flaring reductions, we made our own APG utilization BAU projections. Our calculations assumed that no autonomous improvement on APG utilization will take place, and used crude oil production projections as a proxy for APG utilization projections. Taking into account these projections and PBL TIMER projections on losses in the oil production, the full implementation of the 5% limit would result in emission reductions between 130 and 230 MtCO2 eq in 2020. However, a study carried out by Pöyry Management Consulting (Norway) concludes that it is unlikely that Russia will reach its 95% utilization goal within the next three to five years. In spite of increased fees for excessive flaring, it is often cheaper to pay the fines than to utilize more APG. Complex
technological, economic and political factors impede increased APG utilization. While many existing oil fields are located in remote areas without infrastructure and technological solutions for APG utilization, new oil fields are planned in even more remote areas, without access to gas transportation systems. Consequently, more efficient APG utilization will require large investments and pose limitations on oil production. Due to these implementation barriers, we assumed that only half of the target will be achieved, leading to reductions of 65 to 115 MtCO2 eq.
Conclusion. Russia’s energy efficiency, renewable energy, and gas flaring policies could reduce total emission levels to 2,085 to 2,455 MtCO2 eq by 2020 (Table 3.15). This implies that Russia will achieve its pledged level of emissions, which is not surprising, considering that the pledge is easily achievable and could even lead to new surplus credits by 2020 for the low pledge (Den Elzen et al., 2012). When compared to BAU projections, the implemented policies could lead to emission reductions of around 10%. Planned policies could further reduce emissions by another 10%.
Figure 3.13
1990 1995 2000 2005 2010 2015 20200
500
1000
1500
2000
2500
3000
3500Emissions, excluding land use (Mt CO2 eq per year)
pbl.n
l
History
Business-as-usualprojections (range)Pledge (range)Implemented policies (range)Planned policies, additional impact (range)
Policies: Energy intensity target (implemented/planned), renewable mix target (primary energy), gas flaring target
Impact climate policies on greenhouse gas emissions for Russia
Table 3.15 Russia: 2020 BAU emissions, pledged emissions, and emissions after implementation of most effective domestic policies
In MtCO2 eq BAU Pledge Implemented policies
Implemented and planned policies
Minimum 2,420 2,515 2,085 1,780
Maximum 2,750 2,850 2,455 2,155

40 | Assessment of climate and energy policies of major emitting countries
THRE
E
3.14 Saudi Arabia
Saudi Arabia did not submit an international pledge, but does have a renewable energy target. Policies to achieve this target are still being discussed. If these policies would be fully implemented, emissions from the electricity sector by 2020 would be stabilized at 2009 levels, but total emissions would still increase.
Pledge. Saudi Arabia did not submit an international emission reduction pledge.
Baseline. No national BAU projections have been published by Saudi Arabia. To analyse Saudi Arabia’s climate policies, we projected BAU emissions using historical emissions data from the Second National Communication (Presidency of Meteorology and Environment Saudi Arabia, 2011) and emissions growth data for the Middle East region from WEO 2011. According to this projection, BAU emissions will increase from 440 MtCO2 eq in 2008 to 795 MtCO2 eq by 2020.
Main policies. In 2009, the Saudi Arabian Government announced a target to increase the share of renewable energy in electricity generation to 23% over the next 20 years. There was no renewable electricity production in
2009. Various new implementation policies are under discussion, including a feed-in scheme and a grant-based scheme.
In order to quantify the effect of this target on emissions, a BAU projection for energy use and emissions from the electricity sector was constructed. This projection was based on historical electricity consumption data from IEA and electricity production data from the Saudi Arabia Ministry of Water and Electricity22, assuming that electricity growth during 2009 to 2020 will be equal to the average growth in the 1990–2009 period, but with an annual decrease of 0.1% due to demand side efficiency improvements. Losses in electricity production are also taken into account22, 23, 24. The resulting electricity mix in 2020 is 16% nuclear (as stated by Government), 1% geothermal and waste, 25% renewable energy, 24% oil and 34% natural gas. Emission factors for specific fuels were taken from IPCC Guidelines; country specific emission factors for electricity generation were based on IEA.
Conclusion. The renewable energy target could reduce emissions significantly, but its implementation status is still unclear. If fully implemented, planned policies could stabilize emissions from the electricity sector in 2020 at
Figure 3.14
1990 1995 2000 2005 2010 2015 20200
100
200
300
400
500
600
700
800Emissions, excluding land use (Mt CO2 eq per year)
pbl.n
l
History
Business-as-usualprojectionsPlanned policies
Policies: Renewable mix target (electricity)
Impact climate policies on greenhouse gas emissions for Saudi Arabia
Table 3.16 Saudi Arabia: 2020 BAU emissions, and emissions after implementation of most effective domestic policies
In MtCO2 eq BAU Pledge Implemented policies
Implemented and planned policies
Minimum 795 n/a 795 755
Maximum 795 n/a 795 755

41Analysis of the domestic policies of individual countries |
THRE
E
THREE
2009 levels (around 160 MtCO2 eq), which would equal an emission reduction of about 40 MtCO2 eq compared to BAU (Table 18). However, Saudi Arabia’s total emissions (including all sectors) are projected to increase compared to the 2009 level (Figure 3.14).
3.15 South Africa
South Africa has set a renewable electricity target of 10,000 GWh for 2013, to be achieved through a feed-in tariff. It has also set a long-term target of 24.5 GW installed renewable capacity in 2030. The feed-in tariff is promising, particularly because of the attractive rates for wind energy, but due to political and infrastructural circumstances the tariff so far has had no impact on renewable deployment in South Africa. Therefore the Ministry of Energy introduced a bidding process. We evaluated this as a planned policy, and assumed that only 60% of the target will be achieved due to lack of policy stability. The long-term target of 24.5 GW renewable capacity in 2030 is expected to have a slightly higher impact. Our analysis shows that, if both targets are achieved, it is possible for South Africa to achieve its pledge. However, uncertainties are large and policy
effectiveness strongly depends on implementation issues.
Pledge. South Africa has pledged to reduce its emissions by 34% below BAU by 2020, and by 42% by 2025 (UNFCCC, 2011b). The pledge is conditional on support provided by developed countries regarding financial resources, transfer of technology, and capacity building. If the high pledge is achieved, South Africa’s emissions would peak between 2020 and 2025, according to the government’s Long-Term Mitigation Scenarios (LMTS) (Scenario Building Team, 2007). The pledge results in an emission range from 390 to 570 MtCO2 eq in 2020, based on national projections (Government of South Africa, 2011b).
Baseline. BAU emissions projected in the LMTS report, as described by Winkler et al. (2011), reach 740 MtCO2 eq in 2020. This level has been revised to a range of 585 to 885 MtCO2 eq, with a median of 725 MtCO2 eq, in a white paper by the Department of Environmental Affairs (2011). This revised projection was adopted bythe ‘National Climate Change Response’ white paper (Government of South Africa, 2011a) and the Second National Communication25. The PBL BAU projections are at the low end of this range (see Table 3.17).
Figure 3.15
1990 1995 2000 2005 2010 2015 20200
100
200
300
400
500
600
700
800
900Emissions, excluding land use (Mt CO2 eq per year)
pbl.n
l
History
Business-as-usualprojections (range)Pledge (range)Implemented policies (range)
Policies: Renewable capacity target, feed-in-tariff
Impact climate policies on greenhouse gas emissions for South Africa
Table 3.17 South Africa: 2020 BAU emissions, pledged emissions, and emissions after implementation of most effective domestic policies
In MtCO2 eq BAU Pledge Planned policies
Minimum 585 390 560
Maximum 885 570 690

42 | Assessment of climate and energy policies of major emitting countries
THRE
E
Main policies. South Africa has the largest power generation sector of the African continent, and more than 90% of its electricity is generated from burning coal (Edkins, 2010). Therefore our analysis of climate and energy policies focused on this sector. The most promising policy is the renewable feed-in tariff (REFIT), which was implemented in 2009 and offers a tariff for wind energy that is higher than in Germany or Canada. REFIT should create an enabling environment to achieve the government target of 10,000 GWh of renewable energy production capacity in 2013, as stipulated in the White Paper on Renewable Energy (DME, 2003). However, due to political and infrastructural circumstances the tariff so far has had no impact on renewable deployment in South Africa. Because the REFIT scheme was not successful, the ministry of energy introduced a bidding process with the same target of 10,000 GWh in 2013 generated from renewable sources. We evaluated this target for 2013 as a planned policy and, based on expert judgement, assumed that only 60% of the target will be achieved in 2013 due to lack of policy stability. The resulting emission reduction was projected to be 11 to 17 MtCO2 eq, based on PBL and Ecofys calculations, respectively. The Ecofys calculations were based on projections from the literature (Greenpeace International, 2009) and assumed a load factor of 1500 hours (Beurskens et al., 2011). PBL calculations were based on TIMER projections for energy and emissions.
A second renewable capacity target was introduced as part of the Integrated Resource Plan (IRP) for Electricity (Government of South Africa, 2011c), initiated by the Department of Energy. This target aims at 17.8 GW of renewable capacity installed over the period 2010 to 2030, resulting in 24.5 GW installed renewable capacity in 2030. We assumed that this would not include additional installed nuclear energy. This target is to be implemented through extending the REFIT policy, additional funding for Solar PV, and introducing net metering for consumers (Government of South Africa, 2011c). Emission reductions by 2020 resulting from these planned policies are expected to be between 8 and 25 MtCO2, based on respectively the Ecofys and PBL calculations, assuming a linear increase in targeted renewable capacity between 2010 and 2030.
Conclusion. According to our projections, South Africa’s emissions after implementation of adopted policies will be between 560 and 690 MtCO2 eq by 2020, which means that South Africa could meet its international pledges. However, this is very uncertain due to implementation barriers and the fact that these adopted policies have yet to be implemented.
3.16 South Korea
South Korea introduced a green growth strategy to stimulate green technologies and industries. Based on this strategy South Korea pledged to reduce emissions by 30% compared to BAU levels in 2020. The green growth strategy is supported by renewable targets for 2020 and 2030, which were introduced in the 2010 National Basic Energy Plan. South Korea also plans to launch a national emissions trading system (ETS) in 2015. It is not yet clear what percentage of total national emissions will be covered by this system, and how emission allowances will be allocated. The Target Management System (TMS), a precursor of the ETS, currently covers 60% of total emissions. According to our assessment, the ETS and the renewable target will have a significant impact on South Korea’s emissions. Achieving the international reduction pledge will depend on the final design and implementation of the ETS, and implementation of other policies.
Pledge. South Korea pledged to reduce emissions by 30% below its projected BAU emissions to a level of 545 MtCO2
eq in 2020. This is an unconditional pledge.
Baseline. South Korea presented a BAU projection in its Third National Communication to the UNFCCC (South Korean Ministry of Environment, 2012), including a 2020 BAU emission level of 775 MtCO2 eq. The PBL BAU emission projection for 2020 is 805 MtCO2 eq.
Main policies. South Korea declared its green growth plan26 a National Vision in 2008. The plan is backed by the Framework Act on Low Carbon and Green Growth, which was passed by the National Assembly in 2010. The key objectives are to reduce greenhouse gas emissions and to encourage green technologies and industries. In 2011 the Korean Government announced a greenhouse gas reduction target of 30% relative to BAU emissions in 2020. The National Basic Energy Plan supports the green growth plan and contains energy efficiency and renewable energy targets. Our assessment focused on the renewable energy target and the impending Emissions Trading System (ETS).
In May 2012, South Korea approved legislation announcing the implementation of a National Emissions Trading System, to be launched in 2015 and covering all installations with emissions higher than 25 ktCO2e/year. South Korea already introduced a Target Management System (TMS) in 2012, as an instrument for preparing the national ETS system. The absolute emission cap of the ETS is to be in line with the international emission reduction pledge of 30% against BAU projections. It is not yet clear what percentage of total national emissions will

43Analysis of the domestic policies of individual countries |
THRE
E
THREE
be covered by the ETS and how emission allowances will be allocated. The present TMS covers 60% of emissions. Based on Yong-Gun Kim (2012) we assumed that the ETS will cover a similar share, and that the covered sectors will have the same reduction target as the economy as a whole. As it is not yet clear whether a comprehensive MRV27 system will be in place, we assumed that the ETS will meet only 90% of its reduction target. The emission reductions expected from the ETS are between 133 and 142 MtCO2 eq by 2020, based on national projections and PBL TIMER projections.
The long-term renewable target, introduced in the National Basic Energy Plan (Ministry of Knowledge Economy, South Korea, 2010), is set to 11% renewable energy in 2030. This target is to be realised by the five-year action plan, which includes a target for 2020 aimed at increasing the share of renewable energy to 6.1% (UNEP, 2010). This target is expected to decrease emissions between 32 and 50 MtCO2 eq by 2020, according to Ecofys and PBL calculations, respectively. In order to achieve this target, South Korea initiated several programmes, such as the current feed-in tariff system. The feed-in tariff is to be replaced by Renewable Portfolio Standards (RPS), which will mandate large power utilities to use a certain amount of renewable energy. The Ecofys
calculations assumed the renewable target to be additional to the ETS, while the PBL calculations assumed an overlap of 40%, based on expert judgement.
Conclusion. The ETS and renewable target together could achieve emission reductions of about 20% against BAU projections in 2020. These reductions would be a big step towards achieving the pledged emission level. The energy efficiency measures that are part of the energy plans could lead to further reductions. Therefore, with additional policies targeting the sectors not covered by the ETS, South Korea would be heading in the right direction towards achieving its international pledge.
3.17 Turkey
Although Turkey did not submit an international pledge, it does have a renewable electricity target and an energy intensity target. If effective policies are implemented to achieve these targets, they could lead to emissions below BAU projections in 2020.
Pledge. Turkey is the only Annex I country and the only OECD country that has not submitted a mitigation pledge.
Figure 3.16
1990 1995 2000 2005 2010 2015 20200
100
200
300
400
500
600
700
800
900Emissions, excluding land use (Mt CO2 eq per year)
pbl.n
l
History
Business-as-usualprojections (range)PledgeImplemented policies (range)
Policies: Emission trading system, renewable mix target (primary energy)
Impact climate policies on greenhouse gas emissions for South Korea
Table 3.18 South Korea: 2020 BAU emissions, pledged emissions, and emissions after implementation of most effective domestic policies
In MtCO2 eq BAU Pledge Implemented policies
Minimum 775 545 630
Maximum 805 545 675

44 | Assessment of climate and energy policies of major emitting countries
THRE
E
Baseline. The most recent national BAU projections can be found in the First Communication submitted to the UNFCCC (Ministry of Environment and Forestry, 2007), including a BAU emission level of 615 MtCO2 eq for 2020. The PBL BAU projection is based on more recent emission trends, and is 515 MtCO2 eq (Table 3.19).
Main policies. In 2005, Turkey passed the Law for the Utilization of the Renewable Energy Resources for the Electricity Energy Production. The main target of this law is to achieve a 30% share of renewable energy resources in the electricity production by 2023. This target was reconfirmed in the strategic plan for 2010–2014 from the Ministry of Energy and Natural Resources. We estimated the target for 2020 through linear interpolation between the 2023 target and the 2010 share of renewable sources in energy production. The targeted share represents 3% to 6% additional renewable energy in 2020 compared to BAU (based on PBL TIMER and the National Communication), which would result in an emission reduction of 10 to 40 MtCO2 eq.
Further reductions could result from the energy intensity target, aimed at reducing primary energy intensity by 20% in 2023, compared to the 2008 level. This target is sup-ported by the 2007 Energy Efficiency Law, which provides an institutional framework, allocates responsibilities,
and establishes various programmes targeting different sectors. The actual emission reductions will depend on various factors, especially GDP growth. Ecofys used three methods to project the effect of the energy intensity target on emissions. The first two were based on BAU energy projections from the National Communication, while the third was based on a presentation by the General Director-ate of Electrical Power Resources, Survey and Develop-ment Administration28. The first two methods used GDP data from the World Bank29. The difference between the first and second method is that the former followed BAU projections of energy consumption growth, whereas the latter assumed and 1% annual improvement of energy efficiency. Emission reductions projected by these three methods range from 90 to 150 MtCO2 eq compared to BAU emissions from the National Communication. Emis-sion reductions projected by PBL calculations are around 20 MtCO2 eq, assuming an average annual GDP growth of 5%.
Conclusion. If the targets assessed in this study are achieved, the expected emission level of Turkey in 2020 is 420 to 490 MtCO2 eq, compared to 515 to 615 MtCO2 eq in the BAU scenario (Table 3.19).
Figure 3.17
1990 1995 2000 2005 2010 2015 20200
100
200
300
400
500
600
700Emissions, excluding land use (Mt CO2 eq per year)
pbl.n
l
History
Business-as-usualprojections (range)Implemented policies (range)
Policies: Renewable mix target(electricity), energy intensity target
Impact climate policies on greenhouse gas emissions for Turkey
Table 3.19 Turkey: 2020 BAU emissions, and emissions after implementation of most effective domestic policies
In MtCO2 eq BAU Pledges Implemented policies
Minimum 515 n/a 420
Maximum 615 n/a 490

45Analysis of the domestic policies of individual countries |
THRE
E
THREE
3.18 Ukraine
As the range of Ukraine’s BAU emissions is large, it is difficult to assess the effect of its national climate and energy policies. Given that the pledged emission level is close to the upper limit of the BAU range, it is likely to be achieved through implementation of the feed-in scheme and targeted energy-efficiency improvements.
Pledge. Ukraine’s pledged emission level practically coincides with the upper limit of the projected BAU range (Table 3.20, Figure 3.18). Ukraine’s pledge to reduce emissions by 20% relative to 1990 levels is conditional on the following: (a) developed countries have an agreed position on the quantified emission reduction targets of Annex I Parties; (b) Ukraine maintains its status as a country with an economy in transition and the relevant preferences arising from such a status; (c) the existing flexibility mechanisms under the Kyoto Protocol are kept; (d) 1990 is kept as the single base year for calculating Parties’ commitments; (e) the provisions of Article 3, paragraph 13, of the Kyoto Protocol are used for the calculation of the quantified emission reductions of Annex I Parties under the Kyoto Protocol for the relevant commitment period.
Baseline. Ukraine presented a BAU projection in its Fifth National Communication to the UNFCCC (Ukraine, 2010), which shows a 2020 emission level of about 755 MtCO2 eq. This level would be around 670 MtCO2 eq if more recent trends on demand policies and efficiency improvements are included, based on WEO 2011 projections30. The PBL BAU projection, which has been updated with 2010 historical emissions, is around 445 MtCO2 eq (Den Elzen et al., 2012).
Role LULUCF. Ukraine’s LULUCF credits in 2020 for afforestation, reforestation and deforestation are calculated following the LULUCF accounting rules as agreed in Durban, based on Grassi et al. (2012). For forest management, Ukraine’s proposed reference level is the projected BAU emission level. This implies that LULUCF credits in 2020 will cover only 0.2% of 1990 emission levels.
Main policies. Ukraine introduced a feed-in tariff (FIT) scheme with fixed prices in 2008, the so-called ‘green tariff’ for electricity. The green tariff was introduced together with guaranteed grid connectivity for all renewable power generated under the FIT scheme. The current tariff for solar PV is 0.42€/kWh, while wind projects on average receive 0.11€/kWh. Due to lack of
Figure 3.18
1990 1995 2000 2005 2010 2015 20200
200
400
600
800
1000Emissions, excluding land use (Mt CO2 eq per year)
pbl.n
l
History
Business-as-usualprojections (range)PledgeImplemented policies (range)
Policies: Feed-in-tariff, energy intensity target
Impact climate policies on greenhouse gas emissions for Ukraine
Table 3.20 Ukraine: 2020 BAU emissions, pledged emissions, and emissions after implementation of most effective domestic policies
In MtCO2 eq BAU Pledge Implemented policies
Minimum 445 745 350
Maximum 755 745 660

46 | Assessment of climate and energy policies of major emitting countries
THRE
E
state support for solar projects, the total installed PV capacity in Ukraine was only 3.2 MW by the end of 2009. Moreover, all the solar capacity installed until 2009 is off the grid and for private use only. Administrative and bureaucratic barriers coupled with political unrest add to the current lack of government policies and are restricting growth of the industry. In our calculations we therefore assumed substantial barriers to the implementation of renewable energy, even though the tariffs are relatively high. Based on historical trends from Germany and Spain (see Section 2.2), we estimate that Ukraine’s FIT scheme will lead to 8% renewable electricity in 2020. Compared to National Communication and WEO 2011 BAU projections, this will lead to an emission reduction of 1 to 100 MtCO2 eq. The PBL estimate is at the high end of this range.
Energy efficiency. In 2006 Ukraine defined its ‘Energy Strategy to 2030’31 which was approved by the Cabinet of Ministers in 2006. This strategy promotes domestic energy production and alternative energy sources. The strategy calls for a 50% reduction below 2005 levels in energy intensity by 2030. Although it is not clear from the policy description whether this is a target or a potential, we assumed it to be a target that will be achieved through planned policies. However, according to our calculations this target will lead to only limited additional reductions (0 to 23 MtCO2 eq in 2020), because a strong decrease of the currently high emission intensity is expected also in the BAU scenario.
Conclusion. As the range of BAU emissions is large, it is difficult to assess the emission reduction effect of Ukraine’s targets and implemented and planned policies. Given that the pledged emission level is close to the upper limit of the BAU range, it is likely to be achieved through implementation of the present feed-in scheme and planned energy-efficiency improvements.
3.19 United States
The present US policies and targets analysed in our study will not be sufficient to reduce emissions as pledged to the UNFCCC (17% below 2005 levels, by 2020). The pledge, which applies to emissions including LULUCF, could still be achieved, depending on the accounting for LULUCF and on the implementation of additional (planned) policies. Emission projections for 2020 are lower than foreseen several years ago. The main reasons for this decrease are the economic recession and the replacement of coal by natural gas due to low natural gas prices.
Pledge. The United States has pledged a reduction target for 2020 of 17% relative to 2005 levels, in conformity with
anticipated energy and climate legislation. Although this specific legislation is still on hold in the Senate, the United States has reaffirmed its commitment (UNFCCC, 2011a). During the UNFCCC workshops about clarifying the pledged reductions of Annex I countries in Bonn (2011, 2012) and Bangkok (2011), the United States reconfirmed its pledge, and provided clarification on the scope and assumptions of the economy-wide target, which includes emissions and removals from LULUCF.
Role LULUCF. There is significant uncertainty surrounding the implications of the pledged target for reductions in industrial greenhouse gas emissions (all emissions excluding LULUCF), due to large uncertainties in the LULUCF emission estimate. Climate Action Tracker (CAT) shows that the pledged target would translate to a 3% increase in industrial emissions relative to 1990 levels if the LULUCF estimate is based on official data reported in 2009, or to a 3% decrease relative to 1990 levels if the LULUCF estimate is based on data published in 2010.
Baseline. The United States presented its Annual Energy Outlook (AEO), published by the Energy Information Administration (EIA), during the UNFCCC Bonn workshop in 2012. The AEO2012 emission projections show a 2020 CO2 emission level of 8% below 2005 levels (EIA, 2012). This is lower than foreseen several years ago: the AEO2005 projection for 2020 was 25% above 2005 levels. The main reasons for this difference are the economic recession and structural developments in the energy market, leading to a shift from coal to natural gas. These two factors explain roughly half of the projected emission decrease (CCS, 2011). The remaining decrease is due to implemented policies (see below). BAU emission levels in 2020 range from 6,615 to 7,250 MtCO2 eq (Table 3.21), which is 6% to 11% below 2005 levels. The low end of this range is based on AEO2012 projections (EIA, 2012) for CO2 emissions and US EPA (2006) projections for non-CO2 greenhouse gas emissions. The high end is based on WRI (Bianco et al., 2013). PBL BAU calculations, as developed for the OECD Environmental Outlook (OECD, 2012) and updated to the year 2010, are within this range. Compared to the BAU developed for the OECD, the transport emissions were updated using the new transport model (Girod et al., 2012). The PBL BAU projection for 2020 is higher than the AEO2012 projection because the latter does include recent trends such as the switch to natural gas and autonomous efficiency improvements (Burtraw and Woerman, 2012).
Main policies. At the UNFCCC workshop in Bonn in 2012, the United States presented its latest actions on state and regional levels, as well as regulations to control greenhouse gas emissions. The implemented policies that are expected to have the largest impact are the fuel

47Analysis of the domestic policies of individual countries |
THRE
E
THREE
economy standards (CAFE), the ‘New Source Performance Standard’, the state-level renewable energy targets, and the California Emissions Trading System (ETS). The impact of these policies on US emissions in 2020 is discussed below.
Fuel economy standards (CAFE). Two types of fuel efficiency standards have been introduced; one for light-duty vehicles (passenger cars and light trucks), which was adopted in June 2012, and one for medium- and heavy-duty vehicles (freight trucks, busses and tractors). These CAFE standards are based on the ‘Energy Independence and Security Act of 2007’.
The introduction of the light-duty vehicle standards is divided into two phases. The first phase was implemented in 2012 and runs to 2017, while the second phase is planned for 2017–2025. The emission standard for light-duty vehicles applies to new cars and will increase from 29.7 to 34.1 miles per gallon (mpg) (12.8–14.9 km/l) by 2016 (EPA, 2010c), and to 55 mpg (23.2 km/l) by the end of phase two (EPA, 2011)32, as presented in the 2012 UNFCCC workshop in Bonn.33 The measures from the first phase have been incorporated in the projections of the US EPA since 2009. The effect of the second phase on 2020 emission levels is estimated at 29 MtCO2 eq below
BAU emission levels (EPA, 2011). This represents 1.5% of total emissions from the transport sector in 2005, and 0.5% of total BAU emissions. The Ecofys calculations found a similar reduction. Because the second phase does not start until 2017, its effect on 2020 levels is limited.
The planned standards for medium- and heavy-duty trucks are expected to decrease emissions in 2020 by 10% to 20% compared to total BAU transport emissions, according to the US presentation at the 2012 Bonn workshop34. This equals a reduction of 40 to 80 MtCO2 eq (EIA, 2012). The same order of magnitude was found in the EPA regulatory impact analysis (EPA, 2010a).
The PBL model calculations included both fuel efficiency standards, for light-duty vehicles (phase one and two) and medium- and heavy-duty vehicles. The calculations accounted for possible vehicle mix changes caused by the expected higher costs of meeting these standards. The resulting reductions are projected at around 400 MtCO2
eq. This is larger than the reduction projected by the AEO. However, the projected 2020 emission level after implementation of the CAFE standards is similar between PBL and AEO calculations.
Figure 3.19
1990 1995 2000 2005 2010 2015 20200
1000
2000
3000
4000
5000
6000
7000
8000Emissions, excluding land use (Mt CO2 eq per year)
pbl.n
l
History
Business-as-usualprojections (range)PledgeImplemented policies (range)
Policies: Power plant standard, car standards, regional renewable mix targets, California ETS
Impact climate policies on greenhouse gas emissions for the USA
Table 3.21 United States: 2020 BAU emissions, pledged emissions, and emissions after implementation of most effective domestic policies
In MtCO2 eq BAU Pledges Implemented policies
Minimum 6,615 5,965 6,315
Maximum 7,250 5,965 6,465

48 | Assessment of climate and energy policies of major emitting countries
THRE
E
Other relevant targets for the US transport sector are the biofuel targets. If these are included with the fuel efficiency standards, the expected total emission reduction for the transport sector in 2020 is between 190 and 230 MtCO2 eq, based on Ecofys calculations using the methodology described in Section 2.2. A PBL estimate is not available..
As for the electricity sector, an important policy is the ‘New Source Performance Standard’. This standard introduces an emission limit of 450 gCO2 per kWh for new fossil fuel power plants with a capacity above 25 MW, starting in 2013. This is an ambitious standard and far more stringent than standards proposed by other countries (Australia, for instance, proposed a standard of 700–800 gCO2 eq/kWh). The standard can be achieved either by natural gas combined cycle (NGCC) generation plants or by coal-fired generation plants using carbon capture and storage (CCS). However, because of the low natural gas price, the expectation is that most new power plants will be gas-fired anyway (also in BAU). Therefore the emission reductions expected from this standard compared to BAU are not very large: between 100 and 180 MtCO2 eq, according to PBL and ECOFYS calculations, respectively (where the latter were based on EPA (2012)).
Renewable energy targets. Many states have set renewable targets for electricity production, which add up to a 14% renewable share at the national level in 2020. However, the renewable share in BAU projections according to EIA (EIA, 2012) is also 14%. PBL TIMER BAU projections show similar results. Therefore, no additional emission reductions are expected from these targets.
California ETS. The ETS cap for 2020 is set to 1990 emission levels. In the beginning (2013), the system will only apply to the electricity sector and large industries; transportation will be included from 2015. The ETS encompasses a mandatory greenhouse gas reporting programme; every facility emitting 25 ktCO2e or more is required to submit annual reports of greenhouse gas emissions to EPA. The emission data will be publicly disclosed. To quantify the effect of this ETS, we assumed a range of 90% to 100% effectiveness of the system. Both Ecofys and PBL calculations project an emission reduction of around 80 MtCO2 eq by 2020.
Other implemented and planned policies such as appliance and lighting efficiency standards, and the Energy Star building standards, have also been analysed by Ecofys. These policies are projected to lead to small additional emission reductions in 2020.
Conclusion. Based on Ecofys and PBL calculations, the consolidated range of US emissions after implemented
policies is 6,315–6,465 MtCO2 eq in 2020 (see Table 3.21). This equals a reduction of 10% to 11% compared to 2005 levels, which is less than the pledged reduction (17% below 2005 levels by 2020). Thus, according to our analysis the currently implemented US policies are not sufficient to achieve the pledge. Two other studies (Bianco et al., 2013; Burtraw and Woerman, 2012) support this conclusion, but also show that the United States could achieve its pledge if additional (planned) policies are implemented. For example, Bianco et al. (2013), in a WRI report on US policies, conclude that efficiency standards for existing power plants could close the gap with the pledge by 50%. This policy could reduce CO2 emissions from existing power plants by 26% from 2005 levels by 2020 (Lashof et al., 2012). Furthermore, Burtraw and Woerman (2012) show that including additional (planned) policies, such as the Regional Greenhouse Gas Initiative, state-level energy efficiency programmes, and power plant standards for existing power plants, could reduce US emissions almost to the pledged level.

49Analysis of the domestic policies of individual countries |
THRE
E
THREE
Notes1 http://energia3.mecon.gov.ar/contenidos/verpagina.
php?idpagina=3065.
2 For Australia the situation is complex, due to the fact that its
targets (-5% for the low pledge and -25% for the high
pledge) are relative to 2000, and include ARD emissions (140
MtCO2 eq in 1990, 71 MtCO2 eq in 2000 and 34 MtCO2 eq in
2020) (Grassi et al., 2012). The contribution of LULUCF to the
2020 pledges can be expressed in terms of: (i) expected
minimum contribution (due to the foreseen decreasing
trend of net LULUCF emissions): 19.0% and 6.6% relative to
1990 and 2000, respectively; and (ii) potential additional
contribution: about 3% more than the minimum.
3 This combines the LULUCF and agriculture sector.
4 climatechange.gov.au.
5 A recent NGO report (http://www.climate-connect.co.uk/
Home/?q=node/2057) indicates that Australia would be able
to achieve a 16 to 17% share of renewable energy by 2020.
6 http://www.mma.gov.br/estruturas/182/_arquivos/
cenarioemissoes_182.pdf.
7 http://www.epe.gov.br/PDEE/20120302_2.pdf, p. 31.
8 https://tsapps.nist.gov/notifyus/docs/wto_country/CAN/
full_text/pdf/CAN344%28english%29.pdf.
9 http://unfccc.int/resource/docs/natc/egync2.pdf.
10 http://unfccc.int/di/DetailedByParty.do.
11 The average growing stock in Indonesian forests is about
120 m3 according to the FAO Forest Resource Assessment
2010 (FAO, 2010). Not all the standing volume is suitable for
timber and commercially attractive. We assumed that 20 m3
consists of slash material, lower quality timber and harvest
losses, while 100 m3 per hectare could potentially be
extracted and traded as timber and energy wood.
12 http://faolex.fao.org/docs/pdf/ins64284.pdf.
13 http://indonesien.ahk.de/fileadmin/ahk_indonesien/PAST_
EVENTS/RENERGY2011/MONDAY/3_-_IRES_METI_German-
Indonesian_RE_Days.pdf.
14 From http://unfccc.int/di/DetailedByParty.do.
15 http://aperc.ieej.or.jp/file/2013/2/22/Investment_
Supplement.pdf.
16 http://www.egnret.ewg.apec.org/meetings/egnret34/
Malaysia%20RE%20Development%20by%20Ministry%20
of%20Energy.pdf.
17 See http://www.unep.org/climatechange/mitigation/sean-
cc/Portals/141/doc_resources/4th_Regional_Network_
meeting/S6_Malaysia.pdf.
18 http://gaceta.diputados.gob.mx/Gaceta/61/2012/
abr/20120412-IV.html.
19 Presentation of National Institute of Ecology (Mexico) at
Workshop Enhanced Action Towards Effective Mitigation
Goals: Issues & Strategies, Seoul, South-Korea, September
2012.
20 http://unfccc.int/di/DetailedByParty/Event.do?event=go#,
accessed on 18 June 2012.
21 In this case defined as ‘energy intensity’, see http://
wupperinst.org/uploads/tx_wupperinst/energy_efficiency_
definition.pdf for different definitions.
22 http://www.mowe.gov.sa/(X(1)A(EL86_G05zgEkAAAAN
mYyMmI5YzctOTg1Ni00MDU4LWE5Y2ItNWEzYjZiNmQxMjY
2tj6xV612ou2dEAww4K3Z0MDPni81)S(b5cpkwjveraa
sumgq3maabfo))/English/electricitysectorstats.aspx?AspxA
utoDetectCookieSupport=1.
23 http://www05.abb.com/global/scot/scot316.nsf/
veritydisplay/f90e53733342b472c125786400519e97/$file/
saudi%20arabia.pdf.
24 Enerdata, http://www.enerdata.net/.
25 http://unfccc.int/resource/docs/natc/zafnc02.pdf.
26 http://www.greengrowth.go.kr/.
27 Measurement Reporting and Verification.
28 http://siteresources.worldbank.org/EXTENERGY2/
Resources/4114199-1276110591210/Turkey.pdf.
29 http://data.worldbank.org/indicator/NY.GDP.MKTP.PP.KD.
30 Ecofys calculations.
31 http://www.esbs.kiev.ua/en/energy-sector-cooperation-
and-reforms/ukraine-s-energy-strategy-to-2030.
32 For details see: http://www.nhtsa.gov/
Laws+&+Regulations/CAFE+-+Fuel+Economy/
Model+Years+2012-2016:+Final+Rule.
33 http://unfccc.int/files/bodies/awg-lca/application/
pdf/20120517_usa_0940.pdf.
34 http://unfccc.int/files/bodies/awg-lca/application/
pdf/20120517_usa_0940.pdf.

50
FOU
R
| Assessment of climate and energy policies of major emitting countries
Conclusions
The aim of this report was to analyse how much the most effective domestic climate policies of major emitting countries would contribute to reducing greenhouse gas emissions, with the aim to assess whether these countries are on track to meeting their pledges to the UNFCCC. For 19 major emitting countries and regions we first selected the most effective climate and energy policies based on expert judgement and literature review, and then analysed the expected emission reductions using our own model calculations as well as projections published in the literature.
Climate and energy policies are being introduced regularly. After we completed our analysis, China started pilot ETS projects, planned an energy cap and introduced an emission control target per unit of industrial added value of carbon dioxide emissions, while India released its new 12th Five Year Plan1 and Mexico submitted its Fifth National Communication to the UNFCCC2, to name just a few. This shows that the assessment of domestic policies is an ongoing process and that this report is considered as a starting point.
Our assessment shows that the pledges have induced efforts in all countries to plan and implement national climate and energy policies. All major countries have set renewable targets and many countries have introduced supporting policy instruments. Several countries have recently implemented efficiency standards for cars (e.g. the United States, Canada). Many countries and regions,
such as the EU, South Korea, Australia and California, are implementing emissions trading systems.
Most countries with a large share of land-use emissions have land-use policies in place. Assessing the effect of their pledges on emissions poses a big challenge, as emission projections vary widely. Although there is notable success in land-use emission reduction due to law enforcement (e.g. Brazil), we observe that underlying drivers of land-use emissions are not adequately addressed at this moment.
The policies analysed in our report are likely to deliver emission reductions. We estimate that for some countries these policies will deliver greater emission reductions than required by these countries’ international mitigation commitments. In other countries, further policies have to be implemented to ensure that pledges will be met in 2020. Figures 22 and 23 and Table 3.22 summarize the evaluations of individual countries.
India, China, Russia and Ukraine are likely to achieve their international pledges. The EU’s national legally binding policy framework is likely to deliver the emission reductions required for the EU to meet its unconditional pledge. Although the EU is planning various policies which would deliver additional mitigation, additional policies will have to be developed and implemented if the EU is to achieve its conditional pledge. Similarly, we project that Australia’s national legally binding framework will deliver the emission reductions required

51Conclusions |
FOU
R
FOUR
for Australia to meet its unconditional pledge, but additional policies will be needed to achieve its conditional pledge.
The situation is rather unclear for Japan, South Korea, Brazil, Indonesia and South Africa. Japan’s emission
reductions by 2020 depend to a large extent on the country’s new energy plan after the Fukushima accident, which is still under discussion. Whether South Korea will achieve its unconditional pledge depends on the final design and implementation of the agreed emissions trading system. Uncertainty in emissions from LULUCF
Figure 4.1
Australia
Brazil
Canada
China
EU-27
India
Indonesia
Japan
Mexico
Russia
South Africa
South Korea
Ukraine
USA
2000 6000 10000 14000 18000Emissions, excluding land use (Mt CO2 eq per year)
BAU
PledgeDomestic actions (implemented)range BAUrange Pledgerange Domestic actions
Countries with pledges: BAU emissions, pledged emissions and emissions after implementation of policies, 2020
Figure 4.2
Argentina
Egypt
Malaysia
SaudiArabia
Turkey
0 200 400 600 800Emissions, excluding land use (Mt CO2 eq per year)
BAU
Domestic actions (implemented)range BAUrange Domestic actions
Countries without pledges: BAU emissions and emissions after implementation of policies, 2020

52 | Assessment of climate and energy policies of major emitting countries
FOU
R
Table 4.1 Overview of evaluation of climate and policies of major emitting countries
Country (2010 greenhouse gas emissions)
Pledge (projected 2020 emissions if pledge is achieved)
Mitigation actions with the highest impact3
Result (implemented policies)
China(10.5 GtCO2 eq)
• 40% to 45% reduction in CO2 emissions per GDP, relative to 2005 levels
• 15% share of non-fossil energy• Forestry target (12.9–13.8 GtCO2 eq)
• CO2 / energy intensity targets• Non-fossil energy target• Renewable energy capacity
targets
Likely to meet its pledge, but rapid greenhouse gas emission increase up to 2020 (12.8–14.8 GtCO2 eq)
United States(6.8 GtCO2 eq)
• 17% below 2005 levels (6.0 GtCO2 eq)
• CO2 standard for new fossil power plants
• Car standards• State renewable energy targets• California ETS• Biofuel target
Emissions expected to be lower than estimated in earlier US publications, which can be partly attributed to policies. Emissions still expected to be above pledged level(6.3–6.5 GtCO2 eq)
EU (4.7 GtCO2 eq)
• 20% below 1990 levels (unconditional)
• 30% below 1990 levels (conditional)
(3.9–4.4 GtCO2 eq)
• Comprehensive policy portfolio including emissions trading system, renewable energy targets and support, energy-efficiency policy
Likely to meet its unconditional pledge. Planned policies would result in further emission reductions , but not enough to meet conditional pledge(4.5 GtCO2 eq)
India (2.5 GtCO2 eq)
• 20–25% reduction in CO2 emissions per GDP, relative to 2005 levels
(3.5–3.7 GtCO2 eq)
• Renewable energy targets• Efficiency in industry (PAT
scheme)
Expected to meet its pledge, but uncertainty in projections is high (2.7–3.8 GtCO2 eq)
Brazil (2.3 GtCO2 eq)
36–39% below BAU levels(2.0–2.1 GtCO2 eq)
• Pledge anchored in national law, forestry policy
• Grazing land management• Renewable energy targets
The high share of emissions from LULUCF and the high uncertainty in projections makes it difficult to predict whether Brazil will meet its pledge(1.5–2.6 GtCO2 eq)
Russia (2.2 GtCO2 eq)
• 15–25% below 1990 levels(2.5–2.8 GtCO2 eq)
• Energy efficiency plan• Renewable energy target• Reduction plan for gas flaring
Likely to meet pledge: BAU emissions are projected to be lower than pledged emission level(2.1–2.5 GtCO2 eq)
Indonesia (1.4–1.8 GtCO2 eq)
• 26–41% below BAU levels(1.7–2.2 GtCO2 eq)
• Forestry measures• Renewable energy target• Biofuel target
High uncertainty in emissions from LULUCF makes it difficult to determine the ambition level of the pledge and whether the pledge will be achieved(1.5–2.2 GtCO2 eq)
Japan (1.3 GtCO2 eq)
• 25% below 1990 levels (1.0 GtCO2 eq)
• Not available (the new energy plan will be released in 2013)
Japan’s energy policy will change significantly as a result of the Fukushima accident. At this point it is therefore uncertain whether Japan will meet its pledge(n/a)
Saudi Arabia(0.8 GtCO2 eq)
No pledge • Renewable energy target Policies still under discussion(0.8 GtCO2 eq)
Mexico (0.7 GtCO2 eq)
• 30% below BAU levels(0.7 GtCO2 eq)
• Framework climate law with pledge
• Renewable energy target• Forestry target
Unlikely to meet its pledge with currently implemented policies. New policy strategy (still under development) could lead to emission reductions closer to pledge(0.8 GtCO2 eq)

53Conclusions |
FOU
R
FOUR
makes it difficult to make a valid assessment for Indonesia in particular, but also for Brazil, even though the latter has long experience in forest inventories and monitoring (Romijn et al., 2012) and therefore can track deforestation events with high accuracy. South Africa’s policies have not yet been implemented, and a carbon tax is still under discussion without having the final design
specified, therefore it was very difficult to make a quantitative assessment for this country.
Turkey, Egypt, Saudi Arabia and Malaysia do not have international pledges, but their policies are likely to reduce emissions below BAU emission levels (although for Malaysia this will largely depend on the implementation of supporting measures). We project that
Country (2010 greenhouse gas emissions)
Pledge (projected 2020 emissions if pledge is achieved)
Mitigation actions with the highest impact2
Result (implemented policies)
Canada (0.7 GtCO2 eq)
17% below 2005 levels(0.6 GtCO2 eq)
• Car standards• Power plant standard• Subnational ETS
Unlikely to meet its pledge with currently implemented policies(0.7–0.8 GtCO2 eq)
South Korea (0.7 GtCO2 eq)
30% below BAU level(0.5 GtCO2 eq)
• ETS planned (precursor TMS until 2015)
• Renewable energy target
Unclear whether pledge will be met with current and planned policies. Much will depend on the effectiveness of the national emissions trading scheme, which South Korea will launch in 2015(0.6–0.7 GtCO2 eq)
Australia (0.5 GtCO2eq)
5% below 2000 levels (unconditional)15–25% below 2000 levels (conditional)(0.4–0.5 GtCO2 eq)
• Comprehensive carbon pricing mechanism (ETS)
• Renewable energy targets supported by Renewable Energy Scheme (credit mechanism)
• Power plant standard
Likely to meet its unconditional pledge with currently implemented policies; but uncertainty is relatively high due to the uncertain future of climate policy (opposition parties announced to repeal the carbon pricing mechanism)(0.5–0.6 GtCO2 eq)
South Africa (0.5 GtCO2 eq)
34% below BAU level(0.4–0.6 GtCO2 eq)
• Renewable energy target, including supporting policy instruments (feed-in tariff)
Unlikely to meet its pledge with currently implemented policies, due to implementation difficulties(0.6–0.7 GtCO2 eq)
Ukraine(0.4 GtCO2 eq)
20% below 1990 levels(0.7 GtCO2 eq)
• Feed-in scheme• Energy intensity target
Likely to meet its pledge(0.4–0.7 GtCO2 eq)
Turkey(0.4 GtCO2 eq)
• No pledge • Renewable energy target• Energy intensity target
If implemented, Turkey’s policies could lead to reductions below BAU(0.4–0.5 GtCO2 eq)
Argentina(0.3 GtCO2 eq)
• No pledge • Renewable energy target• Biofuel target• Forestry target
Impact of policies is expected to be small, as Argentina already has a high share of low carbon fuels in BAU(0.4 GtCO2 eq)
Egypt(0.3 GtCO2 eq)
• No pledge • Renewable energy target supported by Feed-in tariff
Policy could reduce emissions compared to BAU, but emissions will still increase due to high energy demand(n/a)
Malaysia(0.2 GtCO2 eq)
• No pledge • Renewable energy targetEfficiency target
Efficiency target could result in significant emission reductions if implemented and backed up with supporting measures(0.3 GtCO2 eq)

54 | Assessment of climate and energy policies of major emitting countries
FOU
R
policies of Canada, the United States and Mexico will have a mitigating effect on 2020 emission levels, but these countries will probably need to develop and implement additional policies to deliver their pledges in full. Expected US emissions in 2020 are lower than previously assumed, due to the economic recession, low natural gas prices and implementation of various policies. However, projected US emissions for 2020 are still higher than needed to achieve the country’s pledge. Both the United States and Mexico have measures in the pipeline that could bring their emissions closer to the pledged levels. Table 4.1 summarizes the policy evaluations for individual countries.
Finally, Figure 4.3 shows the combined 2020 emissions of all countries analysed in this study (excluding Japan, for which no assessment could be made), comparing the BAU emissions, pledged emissions, and emissions after policy implementation. The uncertainty in BAU emissions is large: combining the lowest projections results in a 2020 emission level of about 40 GtCO2 eq, compared to 48 GtCO2 eq when the highest projections are combined. The combined pledged emission levels show a much smaller range: between 35.6 GtCO2 eq and 38.4 GtCO2 eq (Hof et al., 2013a). The range of combined emissions after implementation of the most effective domestic policies is much larger, due to both uncertainty in BAU emissions and uncertainty in the effectiveness of policies. The most optimistic projection is that these policies result in a combined emission level of 35 GtCO2 eq, which would be
an overachievement of the combined pledges. However, the least optimistic projection, 41 GtCO2 eq, falls within the range of combined BAU emissions. It should also be noted that, overall , the pledges are projected to result in global 2020 emissions above the level of cost-optimal emission pathways to achieve the 2 °C target in the long run (Hof et al., 2013; UNEP, 2012b). From Figure 4.3, it can be concluded that the same holds for the projected emissions after implementation of domestic policies.
In conclusion, our study shows that implemented and planned national climate policies do (or will) have a mitigating effect on greenhouse gas emissions, but that more action is needed to achieve the international pledges of most countries in this assessment.
Notes1 http://www.12thplan.gov.in/.
2 http://unfccc.int/resource/docs/natc/mexnc5s.pdf.
3 Only the most important policies were analyzed.
Figure 4.3
Business-as-usual Pledges Domestic policies0
10
20
30
40
50Gt CO2 eq
pbl.n
l
Range in emission level of all countries analysed in this report, 2020
Note: this figure does not include emissions of Japan, for which no assessment could be made. The countries (excluding Japan) analysed in this report were responsible for 70% of global greenhouse gas emissions in 2010.

55References |
References
Asia Pacific Energy Research Centre (2013). APEC Energy Demand and Supply Outlook 5th Edition. http://aperc.ieej.or.jp/publications/reports/outlook.php.
Australian Government (2010). Australia’s Fifth National Communication on Climate Change.
Australian Government (2011a). An overview of the Clean Energy Legislative Package, http://www.cleanenergyfuture.gov.au/wp-content/uploads/2012/05/CEF-overview_Apr2012.pdf.
Australian Government (2011b). Securing a clean energy future: http://www.cleanenergyfuture.gov.au/clean-energy-future/our-plan/securing-a-clean-energy-future-insummary/#content04.
Australian Government (2011c). Strong growth, low pollution Modelling a carbon price. Treasury: http://archive.treasury.gov.au/carbonpricemodelling/content/report/downloads/Modelling_Report_Consolidated_update.pdf.
Beurskens LWM, Hekkenberg M and Vethman P. (2011). Renewable energy projections as published in the national renewable energy action plans of the European Member States - Covering all 27 EU Member States with updates for 20 Member States. Netherlands Energy Research Centre (ECN), European Environment Agency (EEA).
Bianco NM, Litz FT, Meek KI and Gasper R. (2013). Can the US get there from here? Using existing federal laws and state action to reduce greenhouse gas emissions. World Resource Institute, http://www.wri.org/publication/can-us-get-there-from-here.
Blok K. (2006). Energy Analysis. Techne Press, Amsterdam, The Netherlands.
Bouwman AF, Kram T and Klein Goldewijk K (2006). Integrated modelling of global environmental change. An overview of IMAGE 2.4. PBL Netherlands Environmental Assessment Agency, The Hague/Bilthoven, The Netherlandsavailable: www.pbl.nl\image .
Burtraw D and Woerman M. (2012). An Assessment of US Progress towards its Pledge on Climate Change Mitigation. ECP Paper. European Climate Platform.
Byravan S and Rajan SC. (2012). An evaluation of India’s National Action Plan on Climate Change. Centre for Development and Finance (CDF), IFMR Research, http://www.indiaclimatemissions.org/download.php?id=download/NAPCC%20Evaluation.pdf.
Carlson KM, Curran LM, Ratnasari D, Pittman AM, Soares-Filho BS, Asner GP, Trigg SN, Gaveau DA, Lawrence D and Rodrigues HO. (2012). Committed carbon emissions, deforestation, and community land conversion from oil palm plantation expansion in West Kalimantan, Indonesia. Proceedings of the National Academy of Sciences of the United States of America 109: 7559–7564.
CCS (2011). Explaining the Decline in AEO GHG Emissions Forecasts. Center for Climate Strategies Washington D.C., www.climatestrategies.us.
CDIAC (2013). Carbon Emissions: Time Series Globa Data - Preliminary 2010 & 2011 Global and National Estimates.
Climate Analytics & Ecofys (2011). Assessment of Australia‘s policies impacting its greenhouse gas emissions profile. Climate Analytics, Ecofys and the Potsdam Institute for Climate Impact Research (PIK).
Climate Modelling Forum India (2009). India’s GHG emissions profileResult of five climate modelling studies.
Cory K, Couture T and Kreycik C. (2009). Feed-in tariff policy: design, implementation, and RPS policy interactions. National Renewable Energy Laboratory (NREL).
Deetman S, Hof AF and Van Vuuren DP. (2012). Deep greenhouse gas emission reductions: a global bottom-up model approach, Energ Policy 55, pp. 152–164.
Den Elzen MGJ, Hof AF and Mendoza Beltran A, Grassi G, Roelfsema, M, Van Ruijven,, B, Van Vliet, J, Van Vuuren, DP. (2011) The Copenhagen Accord: Abatement costs and carbon prices resulting from the submissions. Environmental Science & Policy 14:28–39.
Den Elzen MGJ, Hof AF and Roelfsema M. (2013). Analysing the greenhouse gas emission reductions of the mitigation action plans by non-Annex I countries by 2020. Energy Policy 56:633–643.
Den Elzen MGJ, Roelfsema M, Hof AF, Böttcher H and Grassi G. (2012). Analysing the emission gap between pledged emission reductions under the Cancún Agreements and the 2 °C climate target. PBL Netherlands Environmental Assessment Agency, The Hague/Bilthoven, The Netherlands, www.pbl.nl\en.
Den Elzen MGJ, Hof AF, Mendoza Beltran A, Roelfsema M and Van Vliet J. (forthcoming, 2014) Climate policy (FAIR), in: IMAGE 3.0, Integrated Model to Assess the Global Environment Version 3.0 Complete model overview & recent scenario results. PBL Netherlands Environmental Assessment Agency, The Hague/Bilthoven, The Netherlands.

56 | Assessment of climate and energy policies of major emitting countries
Department of Environmental Affairs (2011). Explanatory note: Defining South Africa’s Peak, Plateau and Decline Greenhouse Gas Emission Trajectory. Pretoria, South Africa.
DME (2003). White paper on renewable energy. DME Department of Minerals and Energy, Pretoria, South Africa.
DNPI (2009). Indonesia’s greenhouse gas abatement cost curve, interim report, September. DNPI (Dewan Nasional Perubahan Iklim, National Council on Climate Change), http://forestclimatecenter.org/files/2009-08-27%20Indonesian%20%20National%20Council%20on%20Climate%20Change%20-%20Press%20Release.pdf
Ecofys & Climate Analytics (2011). Assessment of Australia‘s policies impacting its greenhouse gas emissions profile. Climate Analytics, Ecofys and the Potsdam Institute for Climate Impact Research (PIK), www.climateanalytics.org/.
Ecofys & Climate Analytics (2012). Assessment of Mexico’s policies impacting its greenhouse gas emissions profi le. Climate Analytics, Ecofys and the Potsdam Institute for Climate Impact Research (PIK), www.climateanalytics.org/.
Edkins M, Marquard A, and Winkler H. (2010). South Africa’s renewable energy policy roadmaps.
EEA (2012). Greenhouse gas emission trends and projections in Europe 2012 - Tracking progress towards Kyoto and 2020 targets. European Environment Agency, EEA Report No 6/2012, http://www.eea.europa.eu/publications/ghg-trends-and-projections-2012.
EIA (2012). Annual Energy Outlook 2012 with Projections to 2035. U.S. Energy Information Administration (EIA), Department of Energy (DOE), Energy Information Administration, Washington, DC, http://www.eia.gov/forecasts/aeo/pdf/0383%282012%29.pdf.
Environment Canada (2011). Canada’s emission trend. Minister of the Environment, Canada, http://www.ec.gc.ca/Publications/E197D5E7-1AE3-4A06-B4FC-CB74EAAAA60F%5CCanadasEmissionsTrends.pdf.
Environment Canada (2012a). Canada’s emission trend. Minister of the Environment, Canada, http://www.ec.gc.ca/Publications/253AE6E6-5E73-4AFC-81B7-9CF440D5D2C5%5C793-Canada%27s-Emissions-Trends-2012_e_01.pdf.
Environment Canada (2012b). Canada’s Emissions Trends.EPA (2006) Global Mitigation of Non-CO2 Greenhouse
Gases. United States Environmental Protection Agency (EPA), Washington, D.C., USA.
EPA (2010a). Draft Regulatory Impact Analysis Proposed Rulemaking to Establish Greenhouse Gas Emissions Standards and Fuel Efficiency Standards for Medium- and Heavy-Duty Engines and Vehicles. United States Environmental Protection Agency, Washington, D.C., USA,.
EPA (2010b). EPA Lifecycle Analysis of Greenhouse Gas Emissions from Renewable Fuels. http://www.epa.gov/otaq/renewablefuels/420f10006.pdf.
EPA (2010c). Final Rulemaking to Establish Light-Duty Vehicle Greenhouse Gas Emission Standards and Corporate Average Fuel Economy Standards: Regulatory Impact Analysis. United States Environmental Protection Agency (EPA), Washington, D.C., USA, http://www.epa.gov/otaq/climate/regulations/420r10009.pdf.
EPA (2011). Proposed Rulemaking for 2017-2025 Light-Duty Vehicle Greenhouse Gas Emission Standards and Corporate Average Fuel Economy Standards. United States Environmental Protection Agency (EPA), Washington, D.C., USA, http://www.epa.gov/otaq/climate/documents/420d11004.pdf.
EPA (2012). Regulatory Impact Analysis for the Proposed Standards of Performance for Greenhouse Gas Emissions for New Stationary Sources: Electric Utility Generating Units.
FAO (2010). Global Forest Resources, Assessment 2010. Food and Agricultural Organization of the United Nations (FAO), Rome, Italy, http://www.fao.org/forestry/fra/fra2010/en/.
Girod B, Van Vuuren DP and Deetman S. (2012a). Global travel within the 2°C climate target. Energy Policy 45:152–166.
Government of Brazil (2010). DECREE No. 7390, 9 December 2010. http://www.planalto.gov.br/ccivil_03/_Ato2007-2010/2010/Decreto/D7390.htm.
Government of Argentina (2007). 2da Comunicación Nacional de la República Argentina a la Convención Marco de las Naciones Unidas sobre Cambio Climático.
Government of China (2012a). China 12th Five Year Plan for Renewable Energy Development (2011-2015). China National Energy Administration, China National Renewable Energy Centre.
Government of China (2012b). The second national communication on climate change of the People’s Republic of China. National Development and Reform Commission, http://unfccc.int/resource/docs/natc/chnnc2e.pdf.
Government of South Africa (2011a). National Climate Change Response White Paper. Pretoria, South Africa, http://rava.qsens.net/themes/theme_emissions/111012nccr-whitepaper.pdf.
Government of South Africa (2011b). Defining South Africa’s peak, plateau and decline greenhouse gas emission trajectory.
Government of South Africa (2011c). Integrated Resource Plan for Electricity, 2010–2030, Revision 2, final report: http://www.energy.gov.za/IRP/irp%20files/IRP2010_2030_Final_Report_20110325.pdf.

57References |
Grassi G, Den Elzen MGJ, Hof AF, Pilli R and Federici S. (2012). The role of land use, land use change and forestry accounting rules in achieving Annex I reduction pledges Climatic change letters http://dx.doi.org/10.1007/s10584-012-0584-4.
Greenpeace, European Renewable Energy Council (2009). Energy [r]evolution. A Sustainable South Africa Energy Outlook. http://www.greenpeace.org/africa/Global/africa/downloads/ER-final-south_africa_lr.pdf.
Groen, TA, Verkerk, PJ, Böttcher, H, Grassi, G, Cienciala, E, Black, K.G, Fortin, M, Blujdea, V. (2013) What causes differences between national estimates of forest management carbon emissions and removals compared to estimates of large-scale models? Environmental Science and Policy 33:222–232.
Guan D, Liu Z, Geng Y, Lindner S and Hubacek K. (2012). The gigatonne gap in China’s carbon dioxide inventories. Nature Climate Change 2:672–675.
Hof AF, Den Elzen MGJ and Roelfsema M. (2013). The effect of updated pledges and business-as-usual projections, and new agreed rules on expected global greenhouse gas emissions in 2020. Environmental Science & Policy 33:308–319.
Höhne N, Taylor C, Elias R, Den Elzen MGJ, Riahi K, Chen C, Rogelj J, Grassi G, Wagner F, Levin K, Massetti E and Xiusheng Z. (2012). National greenhouse gas emissions reduction pledges and 2 °C: comparison of studies. Clim Policy 12:356-377.
IEA (2011). World Energy Outlook 2011. International Energy Agency, Paris, France.
IEA (2012a). Energy Statistics and Balances. International Energy Agency, Paris.
IEA (2012b). Renewables information 2012. International Energy Agency.
Indian Government (2008). National Action Plan on Climate Change. Prime Minister’s Council on Climate Change, http://www.indiaclimateportal.org/the-napcc.
Indian Government (2011). Strategic Plan for New and Renewable Energy Sector for the period 2011-17. Ministry of New and Renewable Energy, http://mnre.gov.in/file-manager/UserFiles/strategic_plan_mnre_2011_17.pdf.
Indian Government (2012a). PAT, Perform, Achieve and Trade. Ministry of Power, http://beeindia.in/schemes/documents/nmeee/pat/PAT%20Booklet.pdf.
Indian Government (2012b). Second National Communication to the United Nations Framework Convention on Climate Change.
Indonesian Government (2010). Indonesia Second National Communication Under The United Nations Framework Convention on Climate Change (UNFCCC). Ministry of Environment.
IPCC (2007). 2006 IPCC Guidelines for National Greenhouse Gas Inventories.
IPCC (2011). IPCC Special Report on Renewable Energy Sources and Climate Change Mitigation. Cambridge University Press, Cambridge, United Kingdom and New York, NY, USA.
Jotzo F. (2012). Australia’s carbon price. Nature Climate Change 2:475–476.
JRC/PBL (2012). EDGAR version 4.2 FT2010. Joint Research Centre of the European Commission/PBL Netherlands Environmental Assessment Agency, http://edgar.jrc.ec.europa.eu/index.php.
Kindermann G, Obersteiner M , Sohngen B, Sathaye H , Andrasko K, Rametsteiner E , Schlamadinger B, Wunder S, Beach R. (2008) Global cost estimates of reducing carbon emissions through avoided deforestation. Proceedings of the National Academy of Sciences of the United States of America 105:10302-10307.
Lashof DA, Yeh S, Doniger D, Carter S and Johson L. (2012). Closing the Power Plant Carbon Pollution Loophole: Smart Ways the Clean Air Act Can Clean Up America’s Biggest Climate Polluters - NRDC REPORT December 2012. National Resources Defense Council (NRDC).
Luttrell, C, Obidzinski, K, Brockhaus M, Muharrom E, Petkova E, Wardell A, Halperin, J. (2011) Lessons for REDD+ from measures to control illegal logging in Indonesia. Center for International Forestry Research (CIFOR), Bogor, Indonesia.
Malaysian Government (2008). National Renewable Energy Policy & Action Plan. Sustainable Energy Developent Authority Malaysia, http://seda.gov.my/go-home.php?omaneg=00010100000001010101000100001000000000000000000000&s=31.
Malaysian Government (2011). Second National Communication to the UNFCCC. Ministry of natural resources and environment Malaysia, http://www.nre.gov.my/Environment/Documents/SECOND%20NATIONAL%20COMMUNICATION%20TO%20THE%20UNFCCC%20%28NC2%29.pdf.
Martinot E, Dienst C, Weiliang L and Qimin C. (2007). Renewable energy futures: targets, scenarios and pathways. The Annual Review of Environment and Resources 32:205-239.
Mexico Secretaria de Energía (2010). Prospectiva del sector electrico (2010–2025).
Ministry of Knowledge Economy, South Korea (2010). The 5th Basic Plan for Long-term Electricity Supply and Demand (2010-2014).
Ministry of Environment and Forestry, Turkey (2007). First national communication communication of Turkey on climate change.

58 | Assessment of climate and energy policies of major emitting countries
Ministry of Finance, Indonesia (2009). Ministry of Finance Green Paper: Economic and Fiscal Policy Strategies for Climate Change Mitigation in Indonesia. Ministry of Finance and Australia Indonesia Partnership, Jakarta, www.fiskal.depkeu.go.id/webbkf/siaranpers/siaranpdf%5CGreen%20Paper%20Final.pdf.
Ministry of natural resources, Russian Federation (2010). FIFTH NATIONAL COMMUNICATION RUSSIAN FEDERATION.
NCCS (2013). National Climate Change Strategy. 10-20-40 Vision. Mexico: Federal Government of Mexico.
OECD (2012) OECD Environmental Outlook to 2050. OECD, Paris.
Planning Commission Government of India (2011). Low Carbon Strategies for Inclusive Growth: An Interim Report. Interim Report of the Expert Group on Low Carbon Strategies for Inclusive Growth, New Delhi, India, http://moef.nic.in/downloads/public-information/Interim%20Report%20of%20the%20Expert%20Group.pdf.
Presidency of Meteorology and Environment Saudi Arabia (2011). Second National Communication - KINGDOM OF SAUDI ARABIA.
REN21 (2011). Renewables 2011 Global Status Report, report. REN21-The Renewable Energy Policy Network for the 21st Century, Paris: REN21 Secretariat, http://www.ren21.net/Portals/97/documents/GSR/REN21_GSR2011.pdf.
Romijn E, Herold M, Kooistra L, Murdiyarso D and Verchot L. (2012). Assessing capacities of non-Annex I countries for national forest monitoring in the context of REDD+. Environmental Science and Policy 19-20:33–48.
Russian Energy Agency (2011). PPP Instruments for Energy Efficiency in Russia. http://www.unescap.org/esd/Energy-Security-and-Water-Resources/energy/trade_and_cooperation/cooperation/gbd4/documents/Session2_C_Olga_ULASAVICH.pdf.
Scenario Building Team (2007). Long Term Mitigation Scenarios. Strategic Options for South Africa. Technical Summary, Department of Environment, Affairs and Tourism, Pretoria, South Africa.
SEMARNAT (2009). Programa especial de cambio climático 2009-2012. Mexico D.F.: SEMARNAT. http://www.semarnat.gob.mx/programas/Documents/PECC_DOF.pdf.
South Korea. Ministry of Environment (2012). Korea’s Third National Communication under the United Nations Framework Convention on Climate Change. Low Carbon, Green Growth. Government of South Korea: http://unfccc.int/resource/docs/natc/kornc3.pdf.
The Pew Charitable Trusts (2010). Who’s winning the clean energy race? http://www.pewenvironment.org/uploadedFiles/PEG/Publications/Report/-clenG20-Report-2012-Digital.pdf
Timilsina GR and Shrestha A. (2010). How much hope should we have for biofuels? Energy 36 (4), 2055-2069.
Aybar R, Collins M, Landesman T, Nachmany M, Pavese C. (2013). The GLOBE Climate Legislation Study, THIRD EDITION, A Review of Climate Change Legislation in 33 Countries. Globe International, World Summit of Legislators, London School of Economics and Political Science.
Townshend T, Fankhauser S and Matthews A. (2011). The GLOBE Climate Legislation Study, Continued progress on mandates, but the emission challenge remains. Globe International, World Summit of Legislators, London School of Economics and Political Science.
Ukraine (2010). Ukraine’s Fifth National Communication under the United Nations Framework Convention on Climate Change (in Russian). http://unfccc.int/resource/docs/natc/ukr_nc5rev.pdf.
UNEP (2010). Overview of the republic of Korea’s national strategy for green growth, http://www.unep.org/PDF/PressReleases/201004_unep_national_strategy.pdf.
UNEP (2012). The emissions gap report 2012. United Nations Environment Programme (UNEP), http://www.unep.org/publications/ebooks/emissionsgap2012/.
UNFCCC (2009). Copenhagen Accord. Retrieved 15 March 2010, from http://unfccc.int/resource/docs/2009/cop15/eng/l07.pdf.
UNFCCC (2010a). Communications received from Parties in relation to the listing in the chapeau of the Copenhagen Accord. Retrieved 29 November 2011, from http://unfccc.int/meetings/items/5276.php.
UNFCCC (2010b). Information provided by Parties relating to Appendix I of the Copenhagen Accord. Retrieved 29 November 2011, from http://unfccc.int/home/items/5264.php.
UNFCCC (2010c). Information provided by Parties relating to Appendix II of the Copenhagen Accord. Retrieved November 29, 2011, from http://unfccc.int/home/items/5265.php.
UNFCCC (2011a). Compilation of economy-wide emission reduction targets to be implemented by Parties included in Annex I to the Convention. FCCC/SB/2011/INF.1/Rev.1, http://unfccc.int/resource/docs/2011/sb/eng/inf01r01.pdf.
UNFCCC (2011b). Compilation of information on nationally appropriate mitigation actions to be implemented by Parties not included in Annex I to the Convention. FCCC/AWGLCA/2011/INF.1, http://unfccc.int/resource/docs/2011/awglca14/eng/inf01.pdf
UNFCCC (2012). Quantified economy-wide emission reduction targets by developed country Parties to the Convention: assumptions, conditions, commonalities and differences in approaches and comparison of the level of emission reduction efforts, UNFCCC document FCCC/TP/2012/5, http://unfccc.int/resource/docs/2012/tp/05.pdf

59References |
Van Vuuren DP, Stehfest E and Den Elzen MGJ. (2011). RCP2.6: Exploring the possibility to keep global mean temperature increase below 2 °C. Climatic Change 109:95–116.
Wang W. (2012). Overview of climate change policies and prospects for carbon markets in China. Les Cahiers de la chaire economie du climate, http://www.chaireeconomieduclimat.org/wp-content/uploads/2012/07/12-07-10-Cahier-ID-n18-Wang.pdf 18.
Winkler H, Hughes A, Marquard A, Haw M and Merven B. (2011). South Africa’s greenhouse gas emissions under business-as-usual: The technical basis of ‘Growth without Constraints’ in the Long-Term Mitigation Scenarios. Energy Policy 39:5818–5828.
World Bank (2012). State and Trends of the Carbon Market 2012. The World Bank, Washington, DC, www.carbonfinance.org.
Yong-Gun Kim (2012). Emissions Trading Scheme for Low-Carbon Green Growth in Korea. Korea Environment Institute. http://unfccc.int/files/bodies/awg-lca/application/pdf/20120517_korea_1117.pdf.

ASSESSMENT OF CLIMATE AND ENERGY POLICIES OF MAJOR EMITTING COUNTRIES
This background study is a publication by
PBL Netherlands Environmental Assessment Agency
Mailing addressPO Box 303142500 GH The HagueThe Netherlands
Visiting addressOranjebuitensingel 62511VE The HagueT +31 (0)70 3288700
www.pbl.nl/en
December 2013
Background Study


