Assessment of correlations between NDE parameters and tube structural integrity for PWSCC at U-bends S. Bakhtiari, T. W. Elmer, Z. Zeng and S. Majumdar Nuclear Engineering Division Argonne National Laboratory 35 th EPRI Steam Generator Nondestructive Evaluation and Tube Integrity Workshop Clearwater Beach, FL, USA July 18–20, 2016 Program Manager: Matthew Rossi Work Sponsored by the US Nuclear Regulatory Commission
Transcript
Assessment of correlations between NDE
parameters and tube structural integrity
for PWSCC at U-bends
S. Bakhtiari, T. W. Elmer, Z. Zeng and S. Majumdar Nuclear Engineering Division Argonne National Laboratory
35th EPRI Steam Generator Nondestructive Evaluation and Tube Integrity Workshop Clearwater Beach, FL, USA July 18–20, 2016
Program Manager: Matthew Rossi
Work Sponsored by the US Nuclear Regulatory Commission
Work Sponsored by the US Nuclear Regulatory Commission
2
Under the SG tube integrity and inspection program at ANL, research is being conducted to assess the ability of eddy current (EC) inspection techniques to detect and characterize flaws in SG tubes
Cracking has been observed in the U-bend region of SG tubes
Detection and characterization of SCC in small radius U-bends could be challenging due to such factors as – Large background noise associated with tube geometry
variations (ovalization and change in wall thickness)
– Non-uniform probe motion and coupling
Studies are being conducted at ANL on inspection techniques and integrity models for U-bends
Background
Detachable flexible rotating probe with a mid-range +PointTM probe
Tube ovalization
Wall thickness
Work Sponsored by the US Nuclear Regulatory Commission
3
Objective of NDE related research activities
– Evaluate the ability of EC inspection techniques to detect and size flaws
• Focus of recent studies on PWSCC in U-bend region of SG tubes
• Utilize data and results from past studies by industry on ODSCC at U-bends
– Provide experimental data for tube structural integrity studies
• NDE results to help guide laboratory sample production and testing
• Evaluation of predictive models for tube structural integrity based on NDE data
Approach — Evaluation of correlations between NDE parameters and tube structural integrity
– Perform EC inspection and analyze data at different stages of the flaw manufacturing process
– Obtain data from structural integrity tests on U-bend tube specimens
– Evaluate potential correlations between independent variables associated with EC estimates of crack size and tube failure pressure
Objective & Approach
Destructive examination of flawed tube
Work Sponsored by the US Nuclear Regulatory Commission
4
Assessment of correlations between NDE parameters and tube
structural integrity
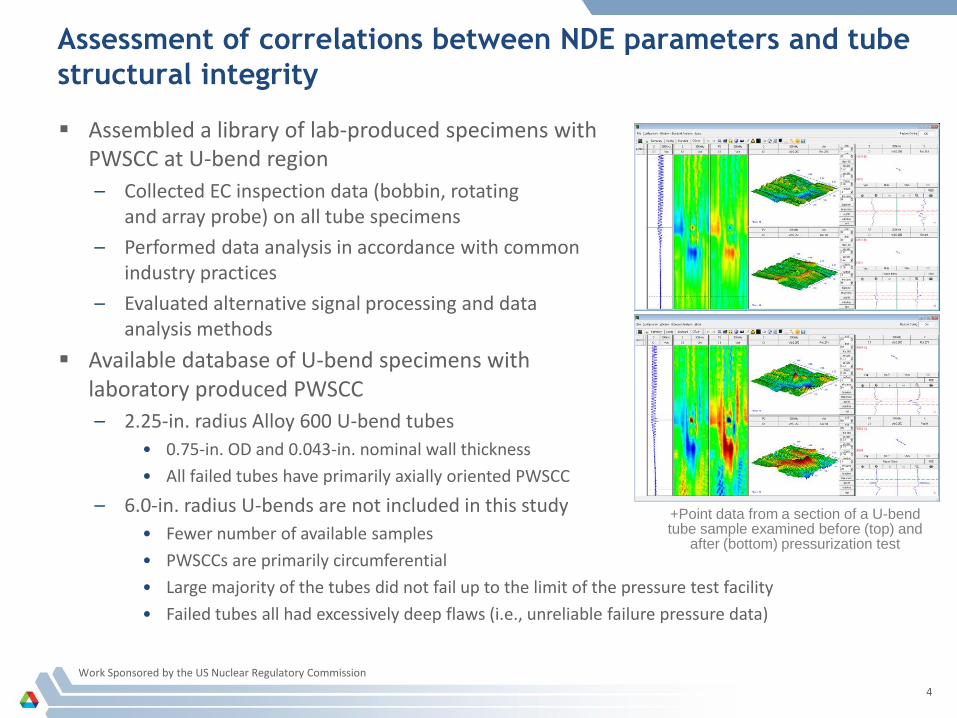
Assembled a library of lab-produced specimens with PWSCC at U-bend region
– Collected EC inspection data (bobbin, rotating and array probe) on all tube specimens
– Performed data analysis in accordance with common industry practices
– Evaluated alternative signal processing and data analysis methods
Available database of U-bend specimens with laboratory produced PWSCC
– 2.25-in. radius Alloy 600 U-bend tubes
• 0.75-in. OD and 0.043-in. nominal wall thickness
• All failed tubes have primarily axially oriented PWSCC
– 6.0-in. radius U-bends are not included in this study
• Fewer number of available samples
• PWSCCs are primarily circumferential
• Large majority of the tubes did not fail up to the limit of the pressure test facility
• Failed tubes all had excessively deep flaws (i.e., unreliable failure pressure data)
+Point data from a section of a U-bend tube sample examined before (top) and
after (bottom) pressurization test
Work Sponsored by the US Nuclear Regulatory Commission
5
Assessment of correlations between NDE parameters and tube
structural integrity (Contd.)
Eddy current examination of specimens
– Data collected with flexible U-bend +PointTM rotating probe
– PWSCC sizing results based on manual analysis of data
• Results based on analysis of EC inspection data collected following termination of flaw manufacturing process
• Analysis performed on unprocessed data
• Signals measurements were made with a priori knowledge of intended flaw locations and by using historical comparisons
• Measurements could be subjective due to influence of large background noise, particularly for smaller radius bends and low amplitude signals (low S/N)
Work Sponsored by the US Nuclear Regulatory Commission
Work Sponsored by the US Nuclear Regulatory Commission
8
Assessment of correlations between NDE parameters and tube
structural integrity
Correlation curves were generated for failure pressure vs. different sizing parameters obtained from analysis of +PointTM data
– Independent variables included estimates of maximum amplitude (voltage), maximum depth, length, and depth*length
– Different criteria were used in selecting the candidate flaw for failure
– All PWSCCs within the U-bend region which failed were included in the analyses
Correlation of failure pressure with Depth*Length parameter. Correlation of failure pressure with Voltage parameter.
Work Sponsored by the US Nuclear Regulatory Commission
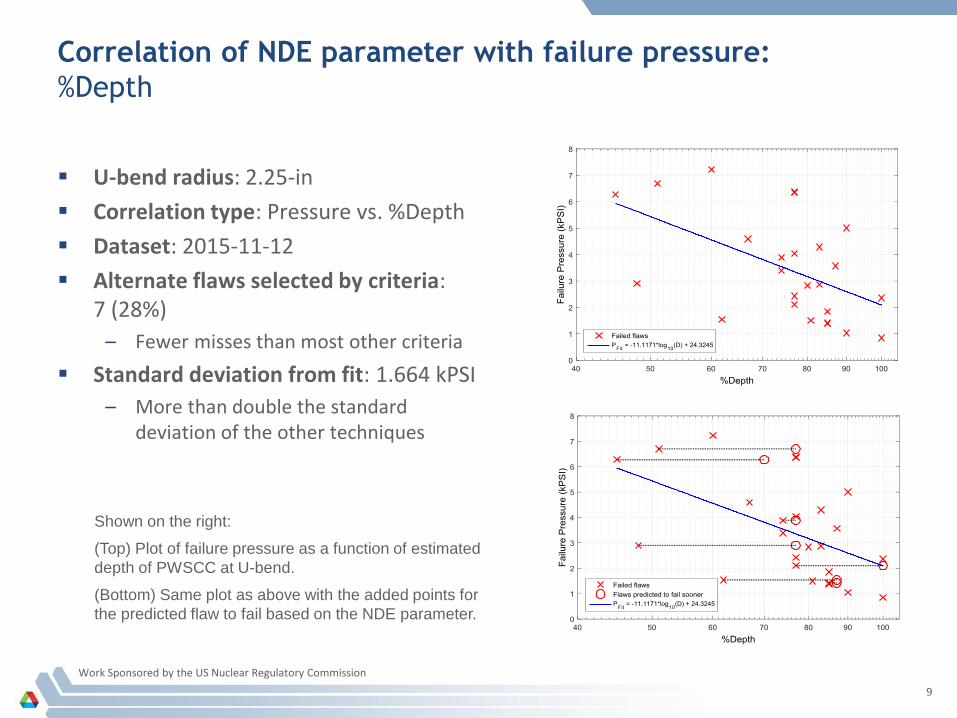
U-bend radius: 2.25-in
Correlation type: Pressure vs. %Depth
Dataset: 2015-11-12
Alternate flaws selected by criteria: 7 (28%)
– Fewer misses than most other criteria
Standard deviation from fit: 1.664 kPSI
– More than double the standard deviation of the other techniques
Correlation of NDE parameter with failure pressure:
%Depth
9
Shown on the right:
(Top) Plot of failure pressure as a function of estimated
depth of PWSCC at U-bend.
(Bottom) Same plot as above with the added points for
the predicted flaw to fail based on the NDE parameter.
Work Sponsored by the US Nuclear Regulatory Commission
U-bend radius: 2.25-in
Correlation type: Pressure vs. Length
Dataset: 2015-11-12
Alternate flaws selected by criteria: 13 (52%)
– Worst selection criteria
Standard deviation from fit: 0.78 kPSI
– One of the better standard deviations in the final dataset
10
Correlation of NDE parameter with failure pressure:
Length
Shown on the right:
(Top) Plot of failure pressure as a function of estimated
length of PWSCC at U-bend.
(Bottom) Same plot as above with the added points for
the predicted flaw to fail based on the NDE parameter.
Work Sponsored by the US Nuclear Regulatory Commission
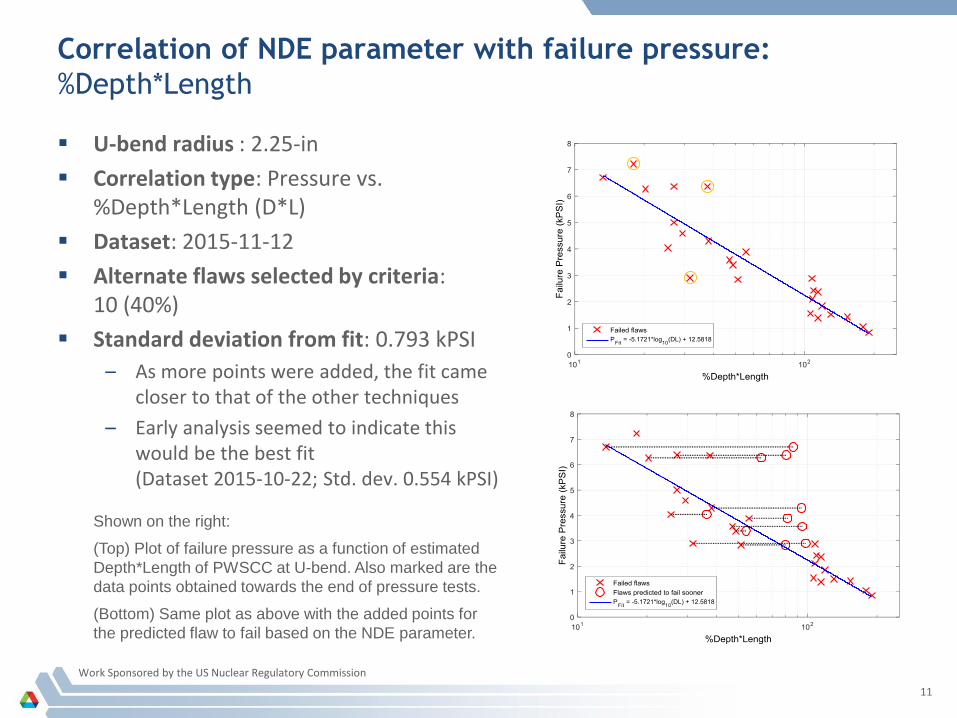
U-bend radius : 2.25-in
Correlation type: Pressure vs. %Depth*Length (D*L)
Dataset: 2015-11-12
Alternate flaws selected by criteria: 10 (40%)
Standard deviation from fit: 0.793 kPSI
– As more points were added, the fit came closer to that of the other techniques
– Early analysis seemed to indicate this would be the best fit (Dataset 2015-10-22; Std. dev. 0.554 kPSI)
Correlation of NDE parameter with failure pressure:
%Depth*Length
11
Shown on the right:
(Top) Plot of failure pressure as a function of estimated
Depth*Length of PWSCC at U-bend. Also marked are the
data points obtained towards the end of pressure tests.
(Bottom) Same plot as above with the added points for
the predicted flaw to fail based on the NDE parameter.
Work Sponsored by the US Nuclear Regulatory Commission
U-bend radius : 2.25-in
Correlation type: Pressure vs. %Depth*Length (Depth selected)
Dataset: 2015-11-12
Alternate flaws selected by criteria: 7 (28%)
– Fewer overall misses than D*L as selector
For a subset of flaws, 4 (16%), alternate selection criteria is less conservative than the main parameter
– These are cases in which using D*L would have been more conservative than depth as the selection criteria
– Tighter fit than D*L as selector
Correlation of NDE parameter with failure pressure:
%Depth*Length (Depth as selection criteria)
12
Shown on the right:
(Top) Plot of failure pressure as a function of estimated Depth*Length of PWSCC at U-bend.
(Bottom) Same plot as above with the added points for the predicted flaw to fail based on the NDE parameter.
Work Sponsored by the US Nuclear Regulatory Commission
U-bend radius: 2.25-in
Correlation type: Pressure vs. %Depth*Length (Amplitude selected)
Dataset: 2015-11-12
Alternate flaws selected by criteria: 6 (24%)
Standard deviation from fit: 0.793 kPSI
– As data accumulated, the fit came more in line with other criteria
Correlation of NDE parameter with failure pressure:
%Depth*Length (Amplitude as selection criteria)
13
Shown on the right:
(Top) Plot of failure pressure as a function of estimated
Depth*Length of PWSCC at U-bend.
(Bottom) Same plot as above with the added points for
the predicted flaw to fail based on the NDE parameter.
*The SCC that failed at ~3.5 kPSI was discussed on Slide 6.
Work Sponsored by the US Nuclear Regulatory Commission
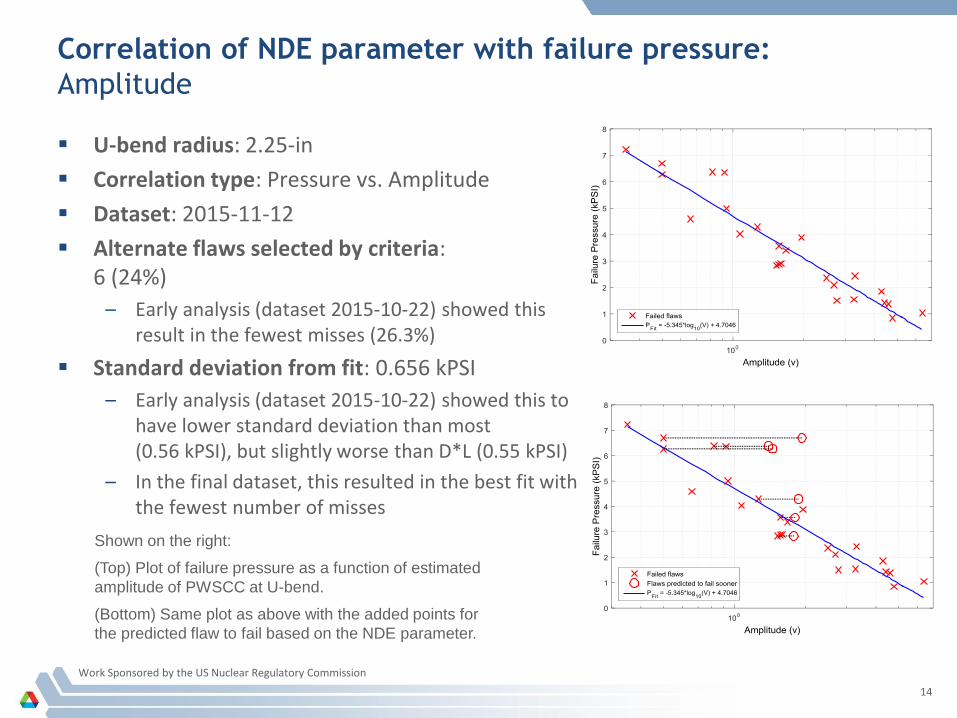
U-bend radius: 2.25-in
Correlation type: Pressure vs. Amplitude
Dataset: 2015-11-12
Alternate flaws selected by criteria: 6 (24%)
– Early analysis (dataset 2015-10-22) showed this result in the fewest misses (26.3%)
Standard deviation from fit: 0.656 kPSI
– Early analysis (dataset 2015-10-22) showed this to have lower standard deviation than most (0.56 kPSI), but slightly worse than D*L (0.55 kPSI)
– In the final dataset, this resulted in the best fit with the fewest number of misses
Correlation of NDE parameter with failure pressure:
Amplitude
14
Shown on the right:
(Top) Plot of failure pressure as a function of estimated
amplitude of PWSCC at U-bend.
(Bottom) Same plot as above with the added points for
the predicted flaw to fail based on the NDE parameter.
Work Sponsored by the US Nuclear Regulatory Commission
15
Concluding Remarks
Preliminary results indicate
– Among the NDE parameters examined so far, amplitude (Vpp) and Depth*Length of PWSCC at U-bend obtained from analysis of +PointTM data exhibited the highest degrees of correlation with tube failure pressure (rupture or burst)
– Voltage, both as the selection parameter and the independent variable, produced the highest degree of correlation with tube structural integrity
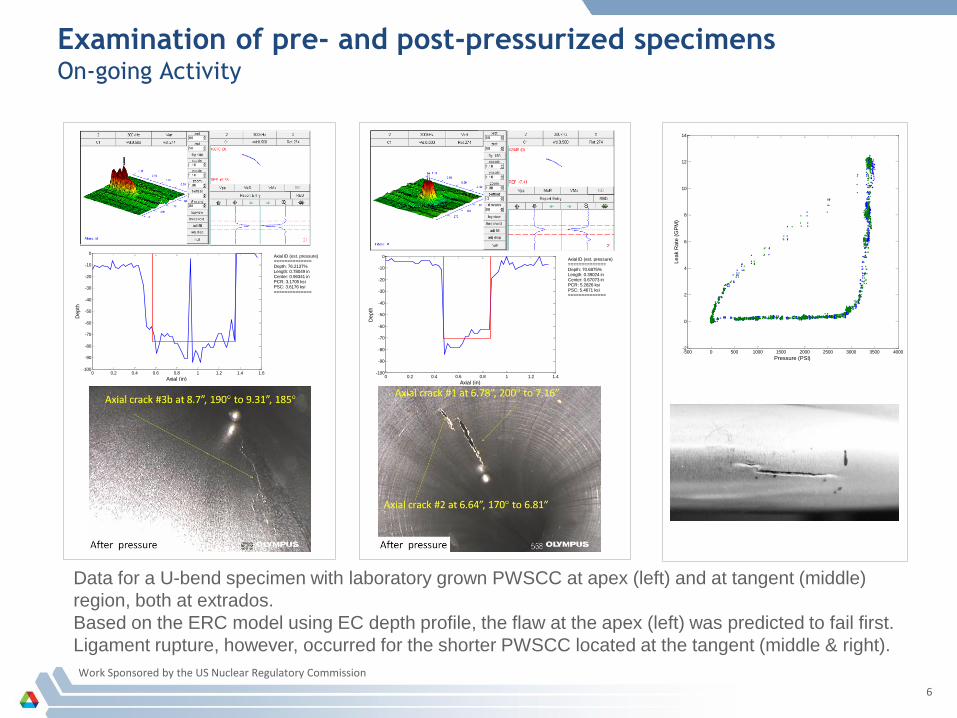
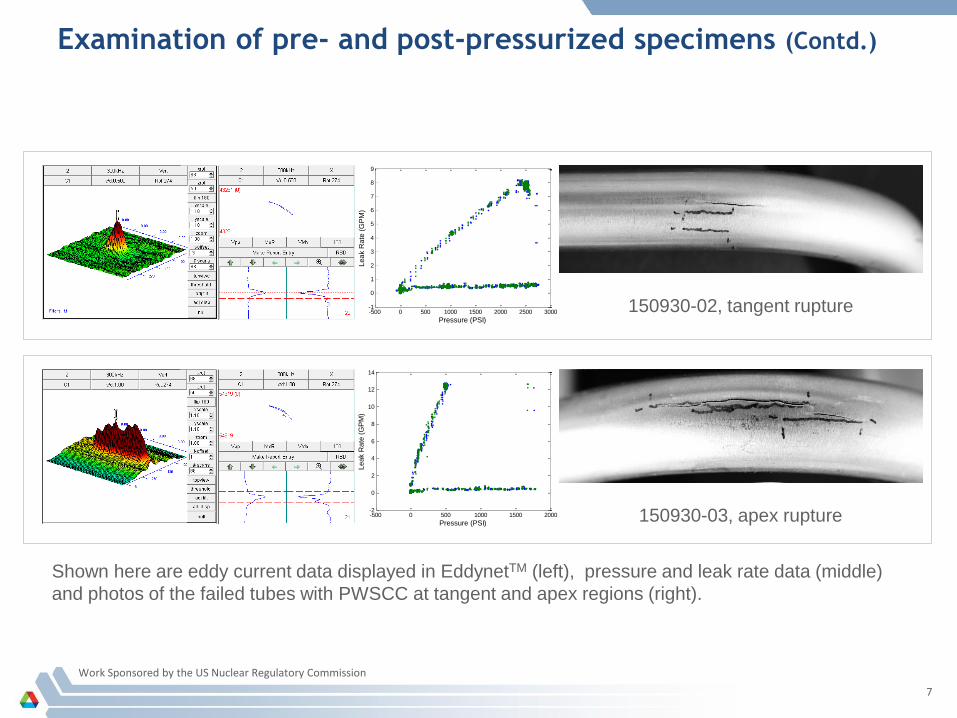
– In some cases, a smaller flaw (based on signal amplitude) at tangent failed before a larger flaw at apex
• No visible difference between flaw morphologies
• This phenomenon is currently being investigated
Follow-on and future studies
– Further evaluate the results once destructive examination of the specimens is completed
– Examine EC data collected with other probes
– Evaluate the reliability of correlations using a more statistically significant dataset
– Examine correlation of alternative NDE parameters with tube structural integrity