K O N K U K U N I V E R S I T Y 19 July 2012 Assessment of Future Climate Change Impacts on Snowmelt and the Stream Water Quality in a Mountainous Watershed using SWAT KIM, Saet-Byul* Graduate Student SHIN, Hyung-Jin/ Park, Min-Ji KIM, Seong-Joon Professor Dept. of Civil & Environmental System Eng. Konkuk University, South Korea
Transcript
K O N K U K U N I V E R S I T Y K O N K U K U N I V E R S I T Y
19 July 2012
Assessment of Future Climate Change Impacts on Snowmelt and
the Stream Water Quality in a Mountainous Watershed
using SWAT
KIM, Saet-Byul* Graduate Student
SHIN, Hyung-Jin/ Park, Min-Ji
KIM, Seong-Joon
Professor
Dept. of Civil & Environmental System Eng. Konkuk University, South Korea
2012년 한국수자원학회 학술발표회 2012 International SWAT Conference
K O N K U K U N I V E R S I T Y
Earth Information Engineering Lab.
Contents
I. Introduction
II. Material and Methods Study watershed Terra MODIS data for snow cover detection SWAT model and the snowmelt theory Climate change scenarios
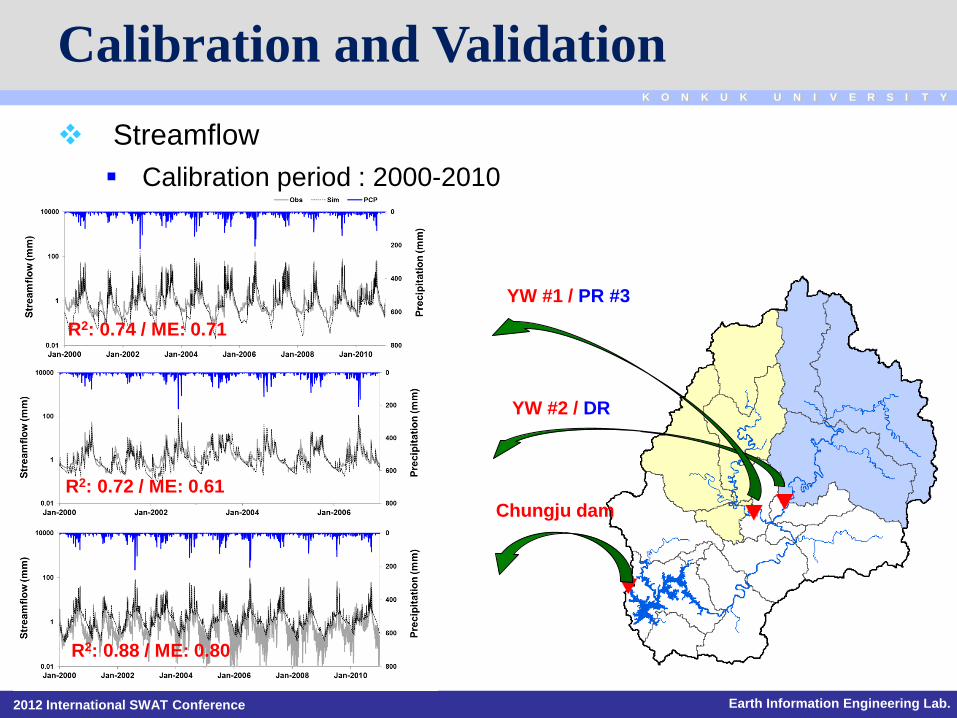
III. Results and Discussion SWAT snow depletion parameter SWAT calibration and validation Climate change impact on snowmelt and stream water quality
IV. Summary and Conclusion
2012년 한국수자원학회 학술발표회 2012 International SWAT Conference
2012년 한국수자원학회 학술발표회 2012 International SWAT Conference
K O N K U K U N I V E R S I T Y
Earth Information Engineering Lab.
Korea Seasons
Winter (December – February) Winter lasts from December to mid-March. It can be bitterly cold and dry during this time
due to the influx of cold Siberian air. Heavy snow in the northern and eastern parts of
Korea. Winters can be extremely cold with the minimum temperature dropping below
−20 °C in the inland region of the country: in Seoul, the average January temperature
range is −7 °C to 1 °C (19 °F to 33 °F). January is the coldest month. Snow piled up and
the snow is starting to melt in January especially in the mountain. It is a perfect time to
have fun in the snow. One of the most polular winter activities is skiing.
2012년 한국수자원학회 학술발표회 2012 International SWAT Conference
K O N K U K U N I V E R S I T Y
Earth Information Engineering Lab.
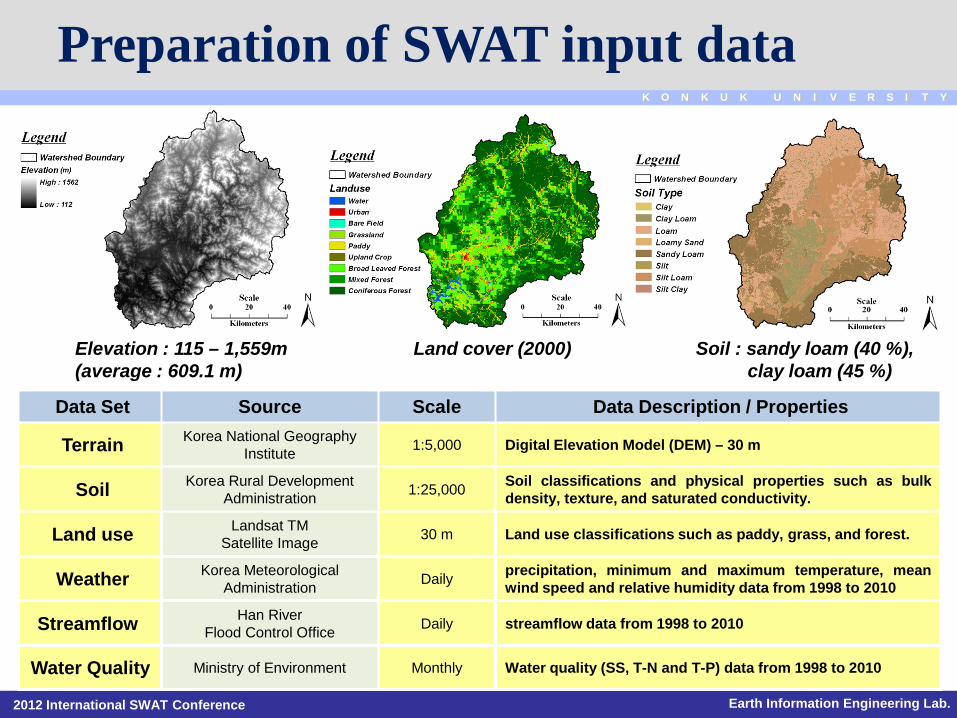
Study Watershed
Chungju Dam watershed
Watershed area : 6,642.0 km2 (heavy snowfall area : about 40%) Annual average snow depth : 80.9 cm Annual average precipitation : 1,359.5 mm Annual average temperature : 9.4 ℃ Forest area : 88.5 % (5573.1 km2) Latitude range : 36.8 °N ~ 37.8 °N Longitude range : 127.9 °E ~ 129.0 °E
Outlet / CD
YW#2
Legend
Legend
YW#1
Lake
2012년 한국수자원학회 학술발표회 2012 International SWAT Conference
K O N K U K U N I V E R S I T Y
Earth Information Engineering Lab.
SWAT Model Description
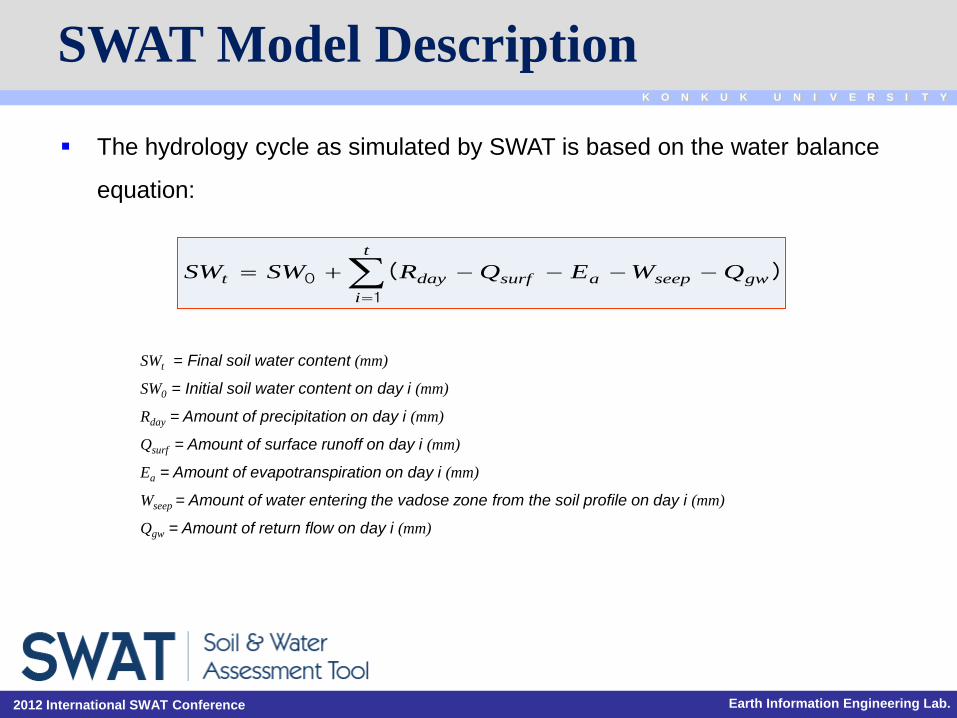
The hydrology cycle as simulated by SWAT is based on the water balance
equation:
)(
1
0 gwseepasurf
t
idayt QWEQRSWSW −−−−+= ∑
=
SWt = Final soil water content (mm)
SW0 = Initial soil water content on day i (mm)
Rday = Amount of precipitation on day i (mm)
Qsurf = Amount of surface runoff on day i (mm)
Ea = Amount of evapotranspiration on day i (mm)
Wseep = Amount of water entering the vadose zone from the soil profile on day i (mm)
Qgw = Amount of return flow on day i (mm)
2012년 한국수자원학회 학술발표회 2012 International SWAT Conference
K O N K U K U N I V E R S I T Y
Earth Information Engineering Lab.
SWAT Model Description Mass balance equation
In SWAT, snowmelt hydrology is realized on an HRU (Hydrologic
Response Unit) basis.
The mass balance for the snowpack is computed as:
SNO = The water content of the snow pack on a given day (mm H2O)
Rday = The amount of precipitation on a given day (mm H2O)
Esub = The amount of sublimation on a given day (mm H2O)
SNOmlt = The amount of snowmelt on a given day (mm H2O)
mltsubday SNOERSNOSNO −−+=
2012년 한국수자원학회 학술발표회 2012 International SWAT Conference
K O N K U K U N I V E R S I T Y
Earth Information Engineering Lab.
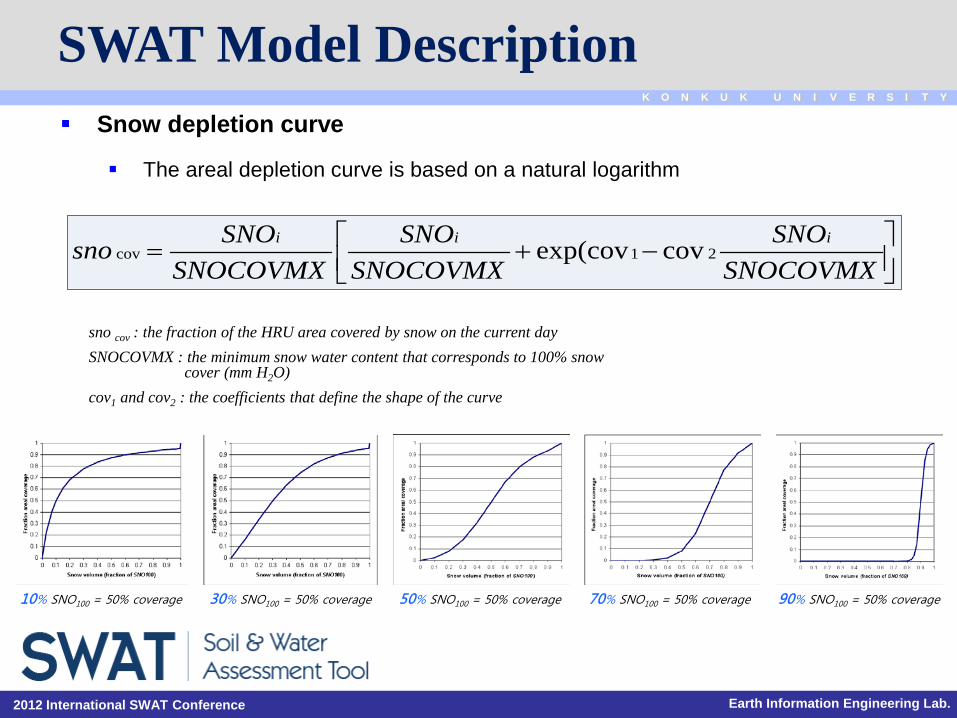
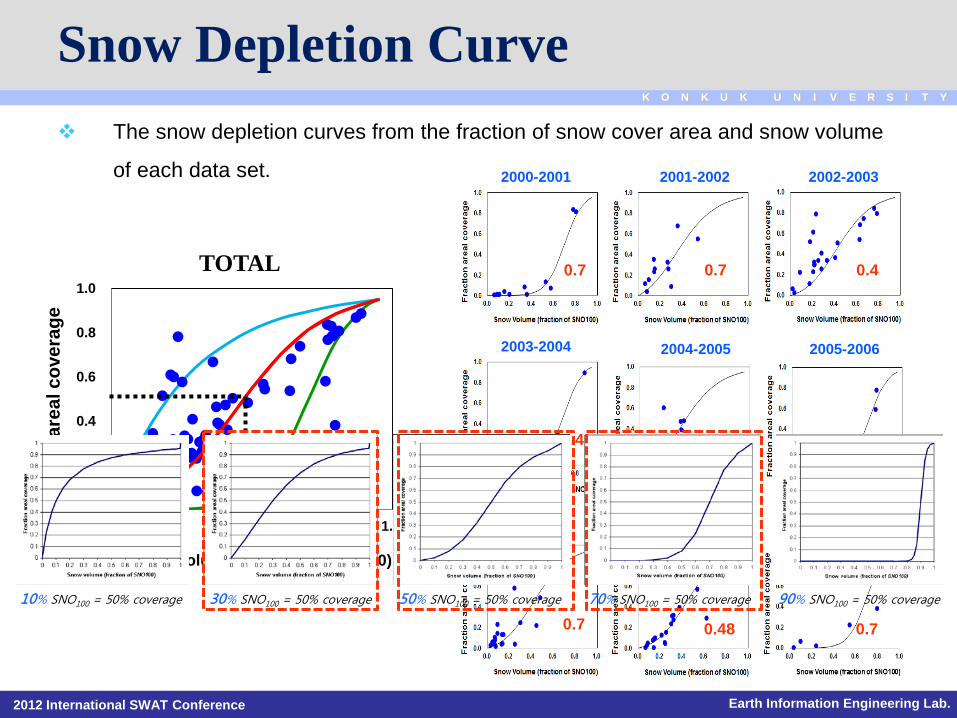
SWAT Model Description Snow depletion curve
The areal depletion curve is based on a natural logarithm
sno cov : the fraction of the HRU area covered by snow on the current day SNOCOVMX : the minimum snow water content that corresponds to 100% snow cover (mm H2O) cov1 and cov2 : the coefficients that define the shape of the curve
Q : Streamflow, QR : Runoff ratio, QRA : Runoff ratio for annual period (Nov-Oct) , QRS : Runoff ratio for snowmelt period (Nov-Apr) , and RMSE : Root mean square error.
2012년 한국수자원학회 학술발표회 2012 International SWAT Conference
K O N K U K U N I V E R S I T Y
Earth Information Engineering Lab.
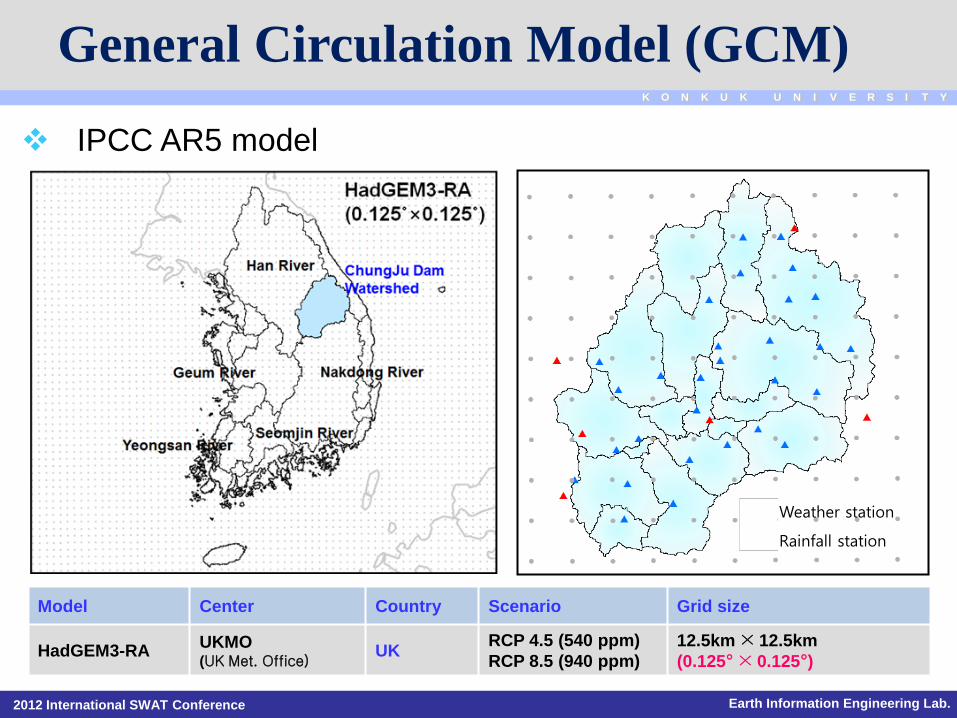
General Circulation Model (GCM)
IPCC AR5 model
Model Center Country Scenario Grid size
HadGEM3-RA UKMO (UK Met. Office)
UK RCP 4.5 (540 ppm) RCP 8.5 (940 ppm)
12.5km × 12.5km (0.125° × 0.125°)
Weather station Rainfall station
2012년 한국수자원학회 학술발표회 2012 International SWAT Conference
K O N K U K U N I V E R S I T Y
Earth Information Engineering Lab.
Bias correction Before correction
After correction
2012년 한국수자원학회 학술발표회 2012 International SWAT Conference
K O N K U K U N I V E R S I T Y
Earth Information Engineering Lab.
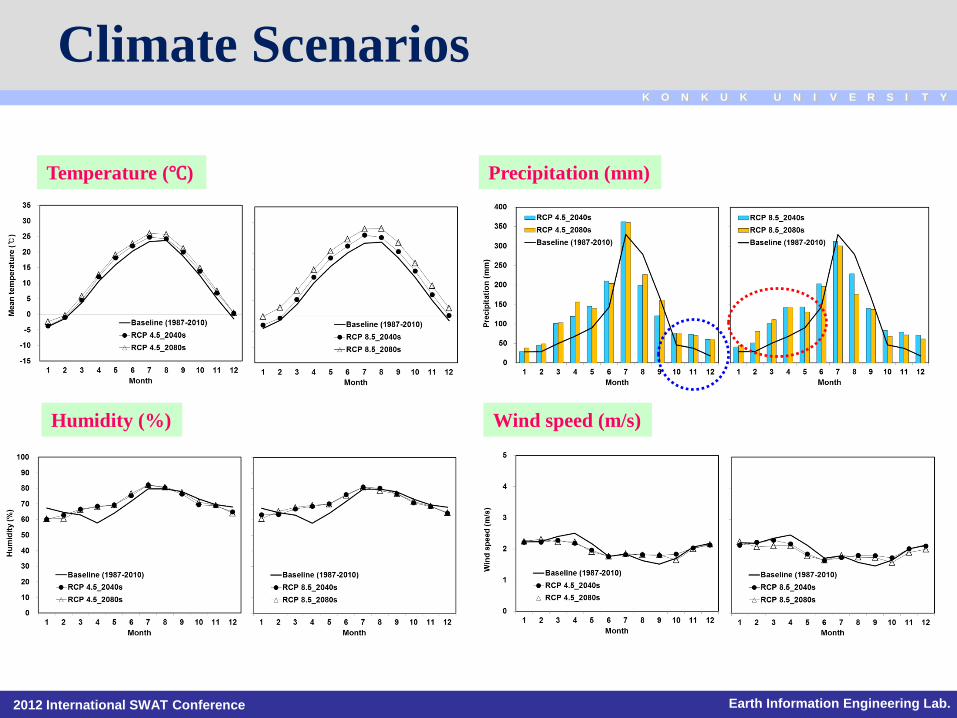
Climate Scenarios
Temperature (℃)
Humidity (%)
Precipitation (mm)
Wind speed (m/s)
2012년 한국수자원학회 학술발표회 2012 International SWAT Conference
2012년 한국수자원학회 학술발표회 2012 International SWAT Conference
K O N K U K U N I V E R S I T Y
Earth Information Engineering Lab.
Climate Change Impact on Snowmelt(Nov- Apr)
Change of future monthly snowmelt and streamflow
Snowmelt
Streamflow
• Big change in 2040 March • Advanced by the future
temperature increase
• Increased up to 55.4mm in 2040s
RCP8.5 and 55.9mm in 2080s
RCP8.5 scenario
RCP 4.5 RCP 8.5
2012년 한국수자원학회 학술발표회 2012 International SWAT Conference
K O N K U K U N I V E R S I T Y
Earth Information Engineering Lab.
Climate Change Impact on Water Quality
Runoff Characteristics of Nonpoint Source Pollution Loads
• The future sediment load showed general tendency of increase during snowmelt period. • The future T-N & T-P loads showed clear increase in November, March, and April. • Especially, the reason of future T-P decrease in Jan. and Feb. can be interpreted as follows: By the water temperature increase in the future, the soluble phosphorus concentration (solP)
in the stream may be decreased by the uptake of inorganic P by algae. In addition, the organic phosphorus mineralization rate and the organic phosphorus settling rate can be adjusted to the water temperature in the direction of decreasing solP.
2012년 한국수자원학회 학술발표회 2012 International SWAT Conference
K O N K U K U N I V E R S I T Y
Earth Information Engineering Lab.
Summary and Conclusion This study tried to determine the SWAT snow depletion characteristics and
assess future climate change impacts on snowmelt and the stream water quality for a mountainous watershed using SWAT
The average value of SWAT SNO50COV was 0.47 in Chungju Dam watershed.
The average runoff during snowmelt period (November-April) was 12.6 % for the full period (November to October).
The future snowmelt and streamflow increased up to 141.0%, 154.7% respectively, and the future melt was advanced compared to present.
The future SS, T-N, and T-P loads also increased except January and February of some scenarios.
For further information, please contact:
Kim, Saet-Byul Graduate student, Dept. of Civil & Environmental System Engineering, Konkuk University


![alum.sharif.edualum.sharif.edu/~zmansoori/Contents/Responsive Design...ñ n Z } v ] À ] P v Z D v } } ] ³ Q [ u u \ \ u ^ j \ k \ h \ \ \ Q Q j o k ^ m k o k p i « k l l e n](https://static.documents.pub/doc/80x56/5fcd94c8731dd178ed48cbd7/alum-zmansooricontentsresponsive-design-n-z-v-p-v-z-d-v-.jpg)


