Assessment of groundwater contamination in an industrial city, Sialkot, Pakistan
Rizwan Ullah, Riffat Naseem Malik and Abdul Qadir*
Environmental Biology, Department of Plant Sciences, Quaid-i-Azam University, Islamabad, PO 4600, Pakistan.
Accepted 7 October, 2009
Contamination of groundwater due to heavy metals is one of the most important concerns that have received attention at regional, local and global levels because of their toxicological importance in ecosystems and impact on public health. The present study was designed to assess the quality of groundwater in relation to heavy metal pollution and its implication on human health. The groundwater quality of Sialkot, an industrial city of Pakistan, was evaluated using water samples collected from 25 localities during October-November 2005. Twenty-two physiochemical parameters including pH, Electric Conductivity (EC), Total Dissolved Solids (TDS), Salinity, Temperature, Turbidity, Sulfate (SO4) Chloride (Cl), Total Hardness, Iodide, Fluoride, Ferric (Fe+3), Nitrate (NO3), Manganese (Mn), Total Chlorine, Alkalinity, Zinc (Zn), Lead (Pb), Iron (Fe), Copper (Cu), Nickel (Ni) and Chromium (Cr) were recorded. The results were compared with standard guidelines of World Health Organization (WHO) and Pakistan Standard Quality Control Authority (PSQCA) for groundwater quality. Cluster Analysis (CA) grouped all sites into four zones based on spatial similarities and dissimilarities of physiochemical properties. Zone 1 was highly contaminated with high level of turbidity; EC, TDS, SO4, Cl, total hardiness, Zn, Pb and Fe concentrations were above the permissible levels of WHO and PSQCA. Cr+6 was detected in nineteen sampling sites and its concentration ranged between 0.01 - 0.30 mg/L. Factor Analysis (FA) and Discriminant Analysis (DA) revealed significant variables including pH, EC, TDS, SO4, NO3, Cl, Total Hardness, Iodide, Total Chlorine, Fluoride, alkalinity, Pb, Fe and Mn which are responsible for variations in groundwater quality and affect water chemistry. The results revealed that the groundwater of the study area cannot be considered of good quality as it is highly turbid (57% of total sites) with high level of Zn, Fe and Pb, which were above WHO and PSQCA permissible limits. The spatial distribution maps of water quality parameters were produced using Geographic Information System (GIS). The distribution maps served as important information to understand ecological status of the groundwater systems and for the identification of groundwater quality parameters with concentration above the allowable limits of WHO and to find out potential areas where water treatment plants/technologies can be targeted in Sialkot. Key words: Groundwater, Sialkot, spatial map, tanneries, heavy metals, Pakistan.
INTRODUCTION About 50% of all the under groundwater used in urban areas of developing countries is derived from wells, springs and bore holes and more than 1000 million inhabitants in Asia and 150 million in Latin America rely on such resources (Clarke et al., 1995). The dependence on groundwater is increasing in most of the arid and semi arid regions of the world as a result of vagaries of mon- *Corresponding author. E-mail: [email protected] Tel: 0092 300 5500907.
soon and scarcity of surface water (Uma and Egboka, 1985; Madsen and Ghiorse, 1993; Foster et al., 1999; Sundary et al., 2005). This is particularly true for Pakistan which is one of the world’s most arid countries and has been viewed as water stressed and is likely to be water scarced in near future (Hamazah et al., 1997). The combination of lower precipitation and higher evaporation is also diminishing water quantities of its rivers, lakes and groundwater. The water scarcity situation is further aggravated due to extended droughts and non-deve-lopment of additional water resources. Consequently, per capita water availability has been decreased from 5600
430 Afr. J. Environ. Sci. Technol. to 1000 m3/annum (Hamazah et al., 1997). The current drought conditions in the country have devastated livelihoods in its semi-arid regions and left millions of people with no option but to drink brackish water particularly in Sindh Province. It is also reported that in Baluchistan Province, the underground aquifers are dropping at 3.5 m annually and will run out in 15 years (Sajjad and Rahim, 1998). Furthermore, increased popu-lation growth, urbanization and the continued industrial development, in last ten years have resulted in excessive usage of its water resources in particular groundwater (Khahlown et al., 2002) and increased pollution which is one of the main threat to water resources (Ahmed and Ali, 2000). Decline of water quality in general, and groundwater in particular is of great concern (Qadir et al., 2008). It has been reported that the water quality of major cities such as Sialkot, Gujarat, Faisal Abad, Karachi, Qasur, Peshawer, Lahore, Rawalpindi and Shekhupura is deteriorating because of unchecked disposal of untreated municipal and industrial wastewater and excessive use of fertilizers and insecticides (Bhutta et al., 2002). The surface and groundwater contamination has become one of the main sources of health related problem (Hashmi and Shahab, 1999; Sial and Mehmood, 1999; Jurate and Sillanpää, 2006). About 2.3 billion people suffer from diseases linked to dirty water worldwide (UN World Water Development Report, 2003). According to the World Health Organization, every year more than 2.2 million people from developing countries die from diseases associated with the lack of access to safe drinking water and inadequate sanitation (Global Water Supply and Sanitation Assessment, 2000; Report WHO). Some 60% of all infant mortality worldwide is linked to infectious and parasitic diseases, most of them are water-related. The number of patients admitted in hospitals of Pakistan with water borne diseases has increased about 200% in the last two decades. The National Conservation Strategy (NCS) report indicated that about 40% of deaths are related to water-borne diseases. About 25 to 30% of all hospital admissions are connected to water-borne bacterial and parasitic conditions, with 60% of infant deaths associated with the same infections. Drinking and bathing in polluted water are the most common routes for the spread of diseases with symptoms like abdominal pain, hair loss, numbness in hands, loss of appetite, eye infections, irritation of skin and fever. It has been reported that the number of cancer patients have also increased in particular in Sindh Province. According to Tahir and Bhatti (1994), 20 to 40% beds are occupied in the hospitals of Pakistan by patients suffering from water and sanitation problem related diseases such as cholera, typhoid, dysentery, hepatitis, giardiasis, cryptosporidiosis and guinea worm infections. Ahmad (2000) concluded that drinking water contaminated due to tanneries effluents caused over 82% diseases of the bowel like dysentery, cholera, typhoid and other ailments in Sialkot and its surrounding areas. Since a substantial faction of the rural population depends on natural water bodies for
daily water requirements for themselves and the livestock, serious health and material losses can be expected in the down stream areas of Sialkot as tannery effluent has residual effects that can transmit into food chain (Ahmad, 2000).
Sialkot has been known as Pakistan’s largest support, as is known as a city full of industries such as leathers goods producing along with leather related industries, textile metallurgical and pharmaceutical industries. The surface and groundwater of Sialkot has been degraded due to rapid industrialization along with urbanization and agricultural activities in its surroundings areas (Qadir et al., 2008). An estimated discharge of effluent from only tanneries is approximately 1.1 million liters per day (Dawn, 2006). All the industrial units consume large amount of water which, together with dissolved toxic substances (acids, base or toxic chemical compounds and heavy metals) after processing is discharged into nearby agricultural lands, ponds, open ditches, rivers, streams and open land. Toxic effluents percolate down into the soil resulting in aquifer contamination, polluting potable water supplies. Open unlined drains and dumping sites of urban and industrial waste, agricultural runoff and flooding during monsoon season are other most hazardous polluting source of groundwater contamination. Because of the importance of this industrialized city, it is important to assess and monitor the environmental conditions and quality and quantity of its water resources. As there are no preliminary reports or detailed study available regarding the assessment of groundwater quality and spatial distribution of heavy metal of the study are, the present study was designed to investigate and assess the groundwater quality in term of its contamination and its implication on human health. The study will provide information regarding the spatial distribution of important physical-chemical parameters and heavy metals which affect water chemistry. The spatial distribution maps will also be produced using GIS for important physio-chemical variables to understand groundwater quality and ecological status of the groundwater systems. The results of this study will enhance the understanding of the identification of the possible sources of groundwater contamination and will offer a valuable tool for reliable management of groundwater. Study area This study was conducted in the Sialkot city which is located between 32� 24� - 32�37� N and 73�59� - 75�02�E. Gujrat District and the State of Jammu and Kashmir lie in the North whereas Gujranwala District is situated on its West. Narowal District touches Sialkot in the South. The average annual rainfall is 950 mm in its catchments area. Major share of rains is received in monsoon period. Climate is hot and humid during summer and cold during winters. June and July are the hottest months when maximum temperature reaches above 40°C. The temperature during winter may drop to 4°C. Main crops are wheat and rice. Among vegetables, potato, turnip, garlic, cauliflower, peas and onion are commonly cultivated whereas citrus and guava are main fruits in
Sialkot. Major industries comprises leather products units along with surgical instruments, beverages, diesel engines, drugs and pharmaceuticals, iron and steel rolling mills and textile garments units. There are over 264 tanneries, 244 lather garments/products manufacturing units, 900 leather sports good manufacturing units, 57 rice husking units and 14 flour mills present in Sialkot. Most of the industries are scattered in and around the city. Leather tanning is one of the leading foreign exchange earning industry in Pakistan. In 1998 - 1999, the exports of leather and leather goods reached over US $520 million, making it the third largest export earning industry in Pakistan. Industrial and municipal waste, agricultural runoff and atmospheric deposition are the major threats to ecological integrity and deterioration of its surface water quality (Qadir et al., 2008). Among these, the untreated discharges of municipal and industrial effluents are of the most importance. A total of 3229 industrial units have been established in Sialkot and more units are expected to be established in the near future. A total of 52 million liters per day of wastewater along with 1.1 million wastes from tanneries (Qadir et al., 2008) is discharged into Nullah Aik and Palkhu, sewerage drains, ponds and open agricultural lands. According to another estimates, each tannery in Sialkot District generates 547 - 814 m3/day volume of wastewater (ETPI, 1998). The Sialkot city and industrial units have no wastewater treatment facilities. This large volume of industrial and urban waste has been considered major threat to ground and surface waters of the study area (Qadir et al., 2008). Sampling and chemical analysis A boring well inventory survey was carried out for assessment of water quality of Sialkot city and 25 sampling sites were selected in urban area namely: Cleaner Production Centre (CPC), PICIC Bank, Ghodhpur, Malkay Kalan, Noul More, Adalat Gharah, Shah Pura, Akbarabad, Iqbal Park, Pul Aik, Talwaran Mughlan, Cantt-1, Pakpura, Burth Both, Puly Toop Khana, Railway Station, Sardar Beghum Hospital, Charagh Pura, Haji Pura, Small Industry Zone, Fateh Gharh Agency, Ehsan Sports, Duburgi, Euga Sports and Adha (Figure 1). Global Positioning System (Gamin GPS 12) and topographic sheets from Survey of Pakistan were used for geographical location and for the selection of representative hand pumps for groundwater sampling. Water samples were taken with pre-cleaned plastic polyethylene bottles. Water samples from hand pumps were collected after pumping the water for 10 min. Sampling, preservation and transportation of water samples were as per standard method (APHA, 1998). Groundwater samples were analyzed for 22 parameters such as pH, Electric Conductivity (EC), Total Dissolved Salts (TDS), Salinity, Temperature, Turbidity, SO4, Cl, Total Hardness, Iodide, Fluoride, Fe+3, NO3, Mn, Total Chlorine, Alkalinity, Zn, Pb, Fe, Cu, Ni and Cr (Table 1a). Water quality parameters viz, Temperature, pH, EC, TDS and Hexavalent chromium (Cr+6) were measured on the site whereas other parameters were determined in the Environmental Biology Laboratory, at Quaid-i-Azam University, Islamabad. The water samples were preserved by adding 1 ml of nitric acid (Analytical grade) at pH <2 and stored at 4°C (to minimize deterioration prior to chemical analysis) for the analysis of metal ion concentrations. All the analyses were carried out according to the standards of APHA (1998). Chemicals and standard solutions used in the study were obtained from Sigma/Fluka and were of analytical grade.
Water pH was determined using portable pH meter (Thermo Orien 240A). TDS (mg/L) and EC (µS/cm) were measured by conductivity meter (Hi 8033 Hanna Hungry). Salinity Meter (Salinity Refractometer, 0.100 ppt W/ATC 300011) was used to measure salinity. SO4, Cl, Iodides, Fluoride, Fe+3, Arsenic, and Total Chlorine were measured using Spectrophotometer (HACH DR/4000). Turbidity (NTU) was measured using Turbidimeter (HACH Model 2100A). NO3 were determined spectrophotometrically using the
Ullah et al. 431 Ammonium molybdenum method (Allen et al., 1974). Cl- was
measured titrometerically with AgNO3. Water hardness (mg/L) was calculated by given equation (APHA, 1992) as
Hardness = (Ca x 2.497) + (Mg x 4.118)
The amount of dissolved Ca and Mg in water was used to determine the total hardness. The water samples for total metal analysis were digested on hot plate in Environmental Biology Laboratory (EBL) at Quaid-i-Azam University, Islamabad using mixture of nitric and perchloric acids (USEPA, 1990). Analysis for metals such as Fe, Pb, Zn, Cu, Cr and Mn (Table 1b) was carried out using a Fast Sequential Atomic Absorption Spectrometer (Varian FS 240AA). The metal standards prepared were checked with standard reference material obtained from Fluka, and the deviation found was insignificant. Average values of three replicates were taken for each determination. Standard Reference Material (SRM) of National Institute and Technology (NIST) and internal reference materials were used for precision, quality assurance and control (QA/QC) for selected metal measurements. The precision of analytical procedures, expressed as the relative standard deviation, ranged from 5 - 10%. Each analysis was repeated in triplicate and the mean value was used in statistical analyses. The results of water quality parameters were compared with standard guidelines developed by various international agencies such as World Health Organization (WHO, 1996) and Pakistan Standard Quality Control Authority (PSQCA). CA was performed to extract information regarding the spatial similarities or dissimilarities between sampling sites based on physiochemical parameters water quality parameters. FA/PCA and DA were employed for determination of the latent factors which explain the structure of the total dataset and important parameters that influence the quality of the groundwater. The statistical software package Statistica (ver. 6.0) for Windows was used for all statistical analyses. Spatial maps of important parameters identified using FA/PCA and DA were produced for their spatial distribution. RESULTS AND DISCUSSION Cluster analysis and spatial distribution of water quality zones CA grouped the sampling sites into clusters (called Zones in this study) on the basis of similarities within a zone and dissimilarities between different zones. The results of CA helped in interpreting the data and indicating patterns of similar objects (Sing et al., 2004). Unweighted pair-group average method was used as a clustering technique (at level of Dlink/Dmax=20) to identify the Zones in the data and Euclidean distance was used as a distance matrix.
Four zones were identified using CA (Figure 2). Zone 1 consisted of highly polluted sites viz., 11 and 24 (site Talwaran Mughlan and site Adha) and was characterized by large amount of TDS (299 - 335 mg/L), EC (1153 - 1163 uS/cm), SO4 (310-320 mg/L) and Cl (110 - 155 mg/L). This zone was restricted to those places which were very close to stagnant ponds and seasonal nullahs receiving large volume of effluents and sewage waste throughout the year. Site 11 has a stagnant water pond in which pollutants from urban, industrial waste and agricultural runoff during monsoon are discharged. It is likely that seepage and infiltration of pollutants from this
432 Afr. J. Environ. Sci. Technol.
PakistanAfgh anis ta n
India
China
Iran
Ar abian s ea
Ind ian held Jam mu and Kashm ir
R iver C henab
Riv er T av i
R iver Chenab
M a ralla Hea dworks
Nullah A ik
Nullah P alkhu
B egow ala dra in
Ja ourin out fa ll Nul lah Bhaid
SialkotUgo ki
W azir abadBego wa la
Bh opa lwa la
Sam brial
W ain s m all H eadw ork s
Ne il wa h N
u llah
Tan wah N
u llah
Mara lla R
av i L i nk Canal
Upper C
henab
Ca
nal
City/To wnDistr ict b ound aryW orking boun daryNallahCanalR iver
10 0 10 20km
N
EW
S
Study area
7410 7420 7440 7450 7500
60 70 80
60 70 80
7430
30 30
3250
3240
3230
3220
3250
3240
3230
3220
7410 7420 7430 7440 7450 7500
1. Cleaner Production
Centre (CPC) 2. PICIC Bank 3. Ghodhpur 4. Malkay Kalan 5. Noul More 6. Adalat Gharah 7. Shah Pura 8. Akbarabad 9. Iqbal Park 10. Pul Aik 11. Talwara Mughla 12. Cantt-1 13. Pakpura, 14. Burth Both 15. Puly Toop 16. Khana 17. Railway Station 18. Sardar Beghum
Hospital 19. Charagh Pura 20. Haji Pura 21. Small Industry Zone 22. Fateh Gharh Agency 23. Ehsan Sports 24. Duburgi 25. Saga Sports 26. Adha
Figure 1. Location of study area showing water sampling sites.
pond affect the quality and purity of groundwater at this site. Site 24 is situated in a densely populated area and surface water channels (seasonal nullahs) pass nearby, receiving pollutants from untreated urban sewage. There are no sewage and industrial effluents treatment to plants
for the whole Sialkot District, and untreated waste is disposed directly into open drains/spaces, streams and rivers. These effluents contain toxic substances which percolate down to increase the salt contents in aquifer, resulting in high values of EC, TDS and heavy metals
Ullah et al. 433
Table 1a. Basic descriptive statistic of studied parameters.
contamination. EC values varied between 171 - 1163 �S/cm in all study sites (Table 1, Figure 3 and 4) but they were recorded highest in zone 1. EC is a measure of salt content of water in the form of ions (Laluraj and Gopinath, 2006), it depends on the ionic strength of the water and relates to the nature of various dissolved substances, their actual and relative concentration, and the temperature at which the measurement is made. EC also provides a rapid and convenient means for estimating the concentration of electrolytes and gives information about all the dissolved minerals. EC of most fresh waters is normally in the range of 50 - 500 mS/cm. Groundwater always has higher EC levels when compared with surface water (Tahir and Bhatti, 1994). When comparison was made with the international guidelines, values of EC in zone 1 exceeded the WHO recommended guidelines of 1000 �S/cm. Similar results were obtained by Sajjad and Rahim (1998). They investigated chemical quality of groundwater of Rawalpindi/Islamabad where EC increas-
ed as water moved from adjoining recharge areas of Margalla and Murree hills towards centre of the basin. EC increased from less than 400 �S/cm near the mountains to a maximum of 1200 �S/cm in the centre of the basin. High pH and TDS had also been reported from Amritsar, Ropar, Toanasa and Nangal (India) similar to the present study. The study of Tahir et al. (1998) also showed higher concentrations of NO3, Fe and Na in groundwater samples from the rural areas of Rawalpindi District (Pakistan) covering Gujar Khan, Kahuta, Murree, Rawalpindi and Taxila tehsils.
Zone 2 consisted of eight sites (7, 8, 10, 12, 16, 17, 22 and 23) with higher concentrations of Mn, Fe, Total Hardness and Fluorides. Fluorides were the main pollutant present in each site in comparison to the other metals. Presence of fluorides can be attributed to anthropogenic activities. Most of the sites of this zone were restricted to marginal areas of the city. This zone runs parallel to the Nullah Aik tributary of River Chenab.
Zone 4 Zone3 Zone 2 Zone 1 Figure 2. Classification of sampling sites into four zones using CA.
±Std. Dev.±Std. Err.Mean
Sampling Region
EC
us/
cm
100
300
500
700
900
1100
1300
1 2 3 4
Figure 3a. Spatial variation of parameters identified by DFA in four sampling zones; EC.
Generally, levels of measured parameters were low in this zone in comparison to other zones. This could be related to the dilution and recharging effect from Nullah
Aik (CPC, 2005). In groundwater, fluorine is mainly present as simple fluoride ions and is capable of forming complexes with silicon and aluminium; it is believed to
Ullah et al. 435
±Std. Dev.±Std. Err.Mean
Sampling Region
TD
S m
g/l
100
200
300
400
500
600
700
1 2 3 4
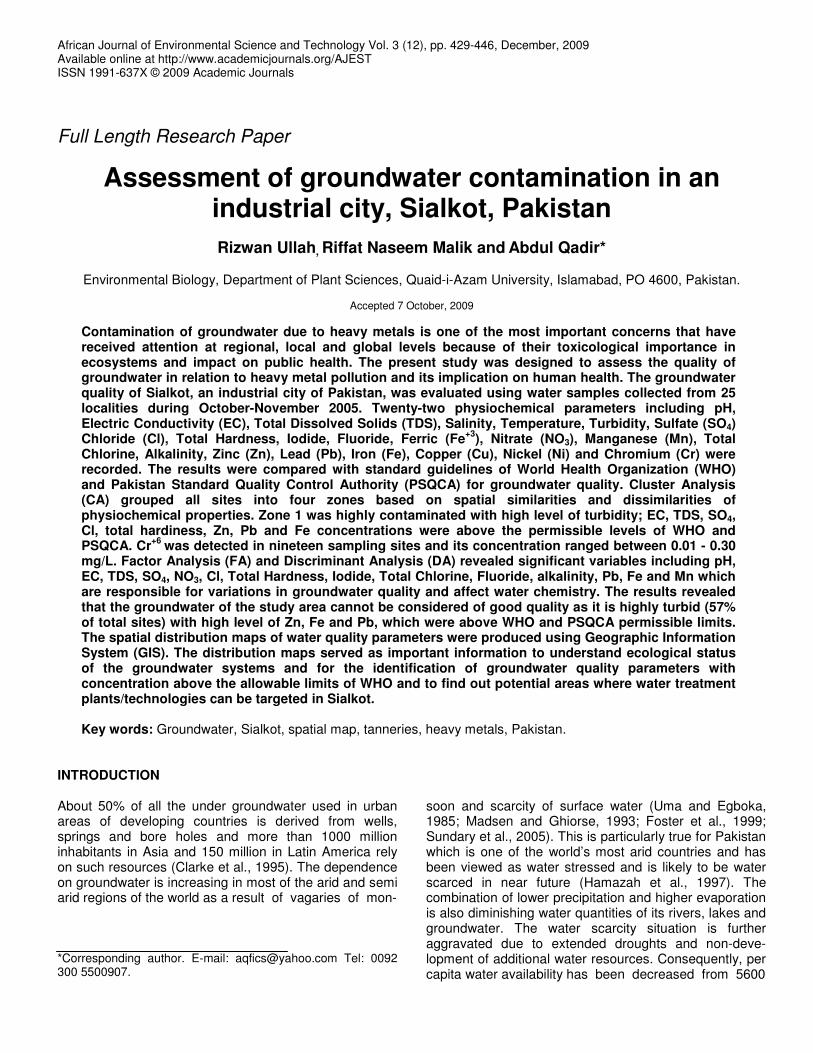
Figure 3b. Spatial variation of parameters identified by DFA in four sampling zones; TDS.
±Std. Dev.±Std. Err.Mean
Sampling Region
Turb
idity
NT
U
-40
-20
0
20
40
60
80
100
120
140
1 2 3 4
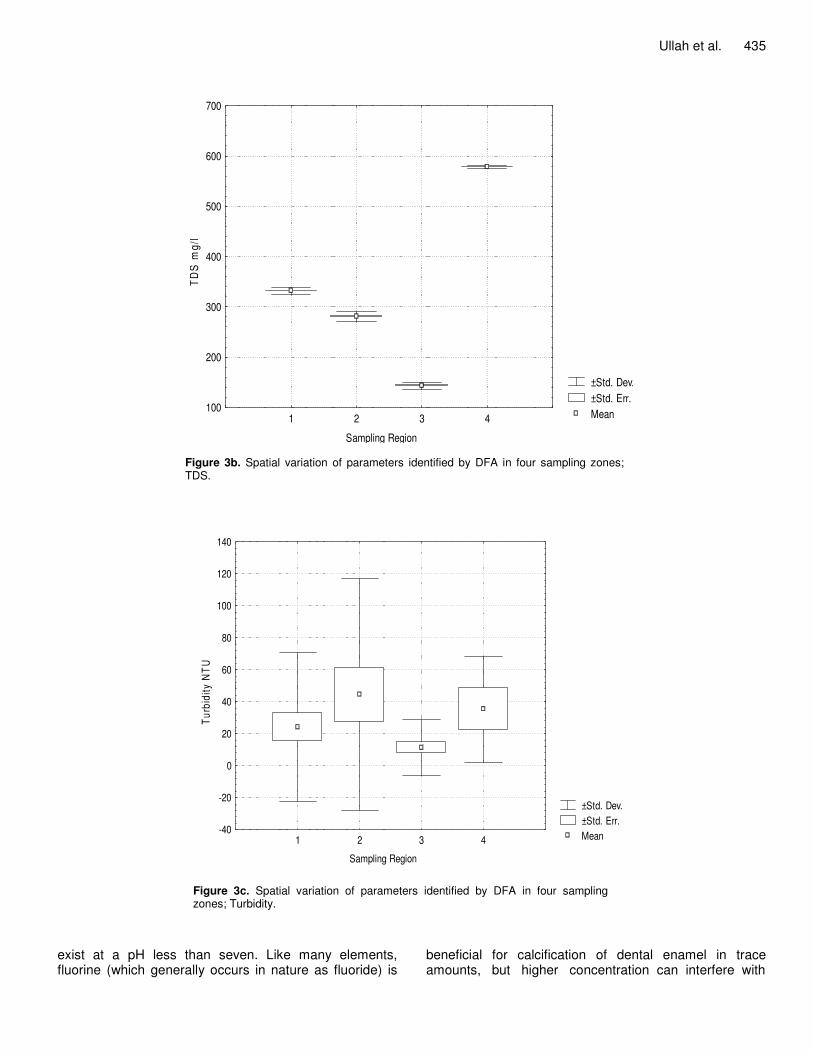
Figure 3c. Spatial variation of parameters identified by DFA in four sampling zones; Turbidity.
exist at a pH less than seven. Like many elements, fluorine (which generally occurs in nature as fluoride) is
beneficial for calcification of dental enamel in trace amounts, but higher concentration can interfere with
436 Afr. J. Environ. Sci. Technol.
±Std. Dev.±Std. Err.Mean
Sampling Region
Sul
phat
es m
g/l
-20
40
100
160
220
280
340
1 2 3 4
Figure 3d. Spatial variation of parameters identified by DFA in four sampling zones; SO4.
±Std. Dev.±Std. Err.Mean
Sampling Region
Fe +
3 m
g/l
-0.02
0.04
0.10
0.16
0.22
0.28
0.34
1 2 3 4
Figure 3e. Spatial variation of parameters identified by DFA in four sampling zones; Fe.
calcium metabolism in bones and teeth, causing dental or skeletal fluorosis (Fordyce et al., 2007). One of the main concentration in drinking water for calcification of dental enamel. However, it causes dental and skeletal fluorosis if it is in high concentration. High concentration in drinking water is associated with cancer and high intake causes
acute effects like crippling, renal and thyroid disorder in human beings. The fluoride concentration in the present study ranged between 0.4 - 1.0 (mg/L). It was found between 0.59 - 0.99 mg/L in Zone 2 which was similar to the study in Muvattupuzha River Basin, India conducted by Laluraj and Gopinath (2006). Ishaque and Khan (2001)
Ullah et al. 437
±Std. Dev.±Std. Err.Mean
Sampling Region
Nitr
ates
mg/
l
-1
1
3
5
7
9
11
1 2 3 4
Figure 3f. Spatial variation of parameters identified by DFA in four sampling zones; NO3.
±Std. Dev.±Std. Err.Mean
Sampling Zone
Cr (
mg/
l)
-4
-2
0
2
4
6
8
10
12
1 2 3 4
Figure 3g. Spatial variation of parameters identified by DFA in four sampling zones; Cr.
surveyed for the prevalence of dental carries and oral hygiene habits of children in Quetta, Pakistan and found a high level of fluorescence in the population due to excessive fluoride through drinking water intake.
Ashley and Burelym (1995) also recorded higher concentration of >1.5 mg/L in Rift valley, Ethiopia. The fluoride contents in the present study were considered
not harmful for drinking water quality as its concen-tration was within the guideline of WHO of 1.5 mg/l.
The Zone 3 was made up of the five sites viz: 4, 5, 6, 18, and 21 which were situated in low habitation areas with low pH value and high concentration of Fe in comparison to other zones. The groundwater was slightly acidic and pH ranged between 6.72 - 6.94. Fe concen-
438 Afr. J. Environ. Sci. Technol.
Figure 4a. Spatial distribution of parameters identified by DFA; EC.
Figure 4b. Spatial distribution of parameters identified by DFA; TDS.
Ullah et al. 439
Figure 4c. Spatial distribution of parameters identified by DFA; Turbidity.
Figure 4d. Spatial distribution of parameters identified by DFA; Fe.
440 Afr. J. Environ. Sci. Technol.
Figure 4e. Spatial distribution of parameters identified by DFA; NO3.
Figure 4f. Spatial distribution of parameters identified by DFA; SO4.
Ullah et al. 441
Figure 4g. Spatial distribution of parameters identified by DFA; Cr.
tration was found between 0.12 - 0.75 mg/L. The concentration of fluorides (0.54 -0.89 (mg/L) were also recoded high in comparison to Zones 1 and 4.
The Zone 4 consisted of ten sites viz: 1, 2, 3, 9, 13, 14, 15, 19, 20 and 25 with higher concentrations of NO3, TDS, EC, alkalinity and salinity. These sites were situated in densely inhabited areas. The concentration of NO3 (7.6 - 9.9 mg/L) was recorded highest in this zone in comparison to other zones. Identification of parameters which affects water quality The rotated FA results along with eigen values and percentage variance are presented in Table 2 where statistically significant parameters are highlighted in bold numbers (according to Malinowski test of significance). The first eigen value of 6.45 accounted for 29.30% of the total variance whereas second and third eigen values of 3.99 and 2.27 accounted for 18.15 and 10.32% of the total variance, respectively. The rest of the eigen values each constituted less than 10% of the total variance. The first factor (VF1) is characterized by high loading of EC, TDS, SO4, Cl, Total Chlorine, Iodide and total Hardness. VF1 revealed pollutants origin from agricultural runoff and waste disposal activity from urban areas. The second factor (VF2) accounted for 18.15% of the total variance
and was associated significantly with high positive loading of fluorides while significant negative loading on NO3 and alkalinity. This factor accounted for hardness of the water. VFs 3 - 6 was characterized by the dominance of one variable each, such as Pb (VF 3), pH and turbidity (VF4 and 5) and Mn (VF6) and together accounted for 30.98% of the total variance. DA separated seven important para-meters (EC, TDS, Turbidity, SO4, NO3, Fe, and Cr+6) for the assessment of groundwater quality. Discriminant functions (DFs) and Classification (CMs) obtained from the standard, forward stepwise and backward stepwise modes of DA are given in Table 3. The standard and forward stepwise mode discriminated 22 and 20 discriminant parameters respectively, rendered the corresponding Classification Matrix (CMs), assigning 100% cases correctly. The backward stepwise mode DA also gave same CMs with 100% correct assignation using only 7 discriminant para-meters (EC, TDS, Turbidity, SO4, Fe, NO3 and Cr). DA also provided information regarding differences in water quality of all zones identified by CA. There were significant differences observed among four zones expressed in terms of 7 discriminating parameters and hence DA rendered a considerable data reduction method. Box and Whisker plots of significant discri-minating parameters identified by spatial DA (backward mode) were constructed to evaluate the association of these parameters with spatial variation in groundwater quality (Figure 3 and 4). Trends
442 Afr. J. Environ. Sci. Technol.
Table 2. Loadings of experimental variables on significant components. Loading >0.7 are marked significant.
for Turbidity, Cr, Fe+3 and NO3 suggested high load of suggested vast differences in pollution load in four zones, while EC and SO4 showed decreasing trends from Zones 1 - 4 and increasing trend in Zones 2 and 4. Comparison with standard guidelines of groundwater quality and implication with human health
The concentration of TDS was found significantly (P = 0.05) different between four zones. The range of TDS varied between 135.1 - 581.0 mg/L. Maximum TDS value was recorded in Zone 1 and the minimum in Zone 2. In case of Zones 3 and 4, maximum values of TDS were 280 and 332 mg/L, respectively. Only the values of TDS in Zone 1 exceeded the permissible limited of the PSQCA (100 - 500 mg/L). The level of TDS in groundwater increased due to high concentration of salts (Din et al., 1997). A study conducted in neighboring cities of study area by PCRWR also recorded high values of TDS viz., 1157, 1176 and 1415 mg/L for Gujrat, Gujranwala and Kasur Cities, Pakistan. These values were beyond the internationally accepted water quality standards. The
results of the present investigation were in agreement with the study conducted in Amirtsar, Ropar and Patyala, India (Anonymous, 1995) and study conducted by Tahir and Bhatti (1994) that high level of TDS and total hardness in underground water was due to discharge from polluting industries and untreated wastes. The pH of the groundwater was in the permissible limits of PSQCA. The chemical and biological properties of water are affected by pH and suitable pH levels have been reported to reduce the corrosion and also helpful in management of water and wastewater treatment processes (Ahmed and Ali, 2000). Turbidity in the present study ranged between 0.47 -197NTUs. Maximum turbidity value of197NTUs was recorded in Zone 1, whereas minimum value of turbidity 0.47NTUs in Zone 2. In Zones 1, 3 and 4 the water was found turbid and exceeded the WHO guidelines of 5NTUs. The results also showed that the groundwater of 57% of the sites was turbid whereas 43% of the sites had the turbidity less than 1.6 NTUs. Khahlown et al. (2005) also found similar results working on groundwater quality of Gujarat District, Pakistan. The present results were also in accordance with findings of Tahir and Bhatti (1994). Turbidity is mainly caused by the
Ullah et al. 443
Table 3. Classification functions for DA of spatial variation in groundwater quality of Sialkot city.
scattering of light in all directions due to un- dissolved substances. The turbidity of water is very important parameter in water treatment process to calculate the quantity of coagulants and provides an estimate of un-dissolved substances. This study highlighted that the groundwater was highly turbid at 13 sites and can not be considered safe for drinking purposes. Cl is widely available in the form of NaCl, KCl and CaCl2 salts. It is also discharged through effluents of chemical industries, oil well operation, sewage
discharge and irrigation leachates. Daily dietary intake for adults is 9 mg/kg of body weight. Total obligatory loss of chloride per day is approximately 530 mg. About 88% of chloride in the body is extra cellular. A normal 70 kg human body contains about 81.7 grams of chloride and 40 litres of water. Taste threshold levels for NaCl, KCl and CaCl2 in water are 210, 310, 222 mg/l, respectively. Average intake from drinking water is approximately 100 mg/day. The results also indicated that the concentration of CI was higher
in Zone 1 in comparison to other zones. All the sampling sites of the present study met the permissible limit of WHO guidelines for Chlorides. The values of total hardness of the groundwater at four sites (11, 18, 20 and 24) exceeded standards set by Environmental Protection Agency, Pakistan. The concentration of total hardness was significantly (P = 0.05) different between the zones. Highest concentration (average concentra-tion of 317 mg/l) was regarded in Zone 1 (sites 11 and 24) and lowest in Zone 2 (average concentra-
444 Afr. J. Environ. Sci. Technol. tion of 317 mg/l). One of the possible sources of hardness is calcium and magnesium, which are present in many minerals like limestone including chalk (CaCO3). Extremely hard water may lead to increased incidence of utolithiasis. Hard water may possess laxative properties due to the association of magnesium with the sulphate ion. A number of studies have demonstrated that there was statistically significant negative correlation between water hardness and cardiovascular disease. However, a variety of other diseases were correlated with hardness of water. These included nervous system disorders, anencephaly, prenatal mortality and various types of cancer. In areas with very hard water, household pipes get choked with deposited material. Hard water also deposits incrustations on kitchen utensils as well as increases soap consumption. Such water can thus be both a nuisance and an economic burden to the consumer. A hardness level of about 100 mg of CaCO3 per litre provides an acceptable balance between corrosion and problem of incrustation.
The concentration of Pb was found between 0.11 - 0.81 mg/L (Table 1). Maximum Pb concentration (0.81 mg/L) was recorded whereas minimum Pb concentration was 0.112 mg/L. The value of Pb in all zones exceeded the WHO and PSQCA guidelines of 0.01 mg/L. The concentration of Pb was significantly varied between the zones (P = 0.1). Pb is a serious cumulative body poison that can cause chronic health effects such as brain and nerve damage, kidney damage, digestive disturbance, blood disorders and hypertension (SDWF, 2003). No health data were available in Sialkot which can be used to relate to the effect of Pb contamination on health The Pb concentration was found even higher in comparison to maximum concentration of Pb (0.4 ppm) in surface water of Liyari River, Pakistan which received discharge of untreated effluent by more than 300 tanneries in its surrounding areas and from untreated urban sewage (Sami-uz-Zaman et al., 2001). The range of Fe varied between 0.004 - 0.828 mg/L (Table 1). A total of 56% sites exceeded the permissible limit of WHO (0.3mg/l) with an average values of 0.46 mg/l. The Fe concentration was not significantly different (P = 0.05) between the zones. The results also showed that in comparison to neighboring cities of Sialkot like Gujrat, Lahore and Kasur, Fe contents in this study were found lower (Sajjad and Rahim, 1998; Tahir, 1989; Tahir et al., 1998; Khahlown et al., 2002, 2005). The concentration of Zn and Cu in all zones met the WHO guidelines. The range of Cr varied between 0.001-0.300 mg/L (Table 1). Highest Cr concentration of 0.260 and 0.300 mg/L was measured in two sampling sites (site 17 and 18). In comparison to other sites Cr was either absent or below the WHO guidelines. Cr concentration in sites 17 and 18 was in excess of the permissible limit of WHO guidelines of 0.05 mg/l. These sites were located near tanneries. Thus the presence of Cr can be related with tanning industries. A study conducted by PCRWR (2007), Sami-uz-Zaman et al. (2001) and Khahlown et al. (2005) recorded the high-
est level of Cr in Gujrat (1.1 mg/L), Lahore (1.7 mg/L) and Kasur (2.01 mg/L) cities of Pakistan which are famous because of leather producing goods and tanneries. Usually Cr used in Leather tanneries is in the form of Cr+3 (Trivalent). During leather processing Cr+3 is converted into Cr+6. The presence of Cr+6 in groundwater may also come from industrial wastes of leather industries and tanneries. In the present study Cr was found in groundwater. There are over 264 tanneries operating in study area. A study conducted by Singh et al. (1993) in Ludhiana, India indicated high concentration of Cr+6 due to industrial effluents, which were exposed to environ-ment without treatment. In Ludhiana city (India) high concentration of Cr (0.200 mg/L) was found in comparison to this study (Singh et al., 1993). The study highlights that industrial effluents and their untreated discharge are one of the most important concerns of the Sialkot City. Similar results were recorded in Owerri, Nigeria where water of the top phretic aquifer was degraded due to industrial effluents discharged without any treatment (Uma and Egboka, 1985). As no data are available for the city of Sialkot which could be used to predict that Cr contamination, as main cause of various illness, is related with contaminated water. Diseases related to digestive, excretory, respiratory and repro-ductive system have been reported due to excessive intake of Cr (PCRWR, 2007). The results of this study indicated the need to conduct a detailed study of Cr contamination and its effects on human health. Conclusion and Recommendations Groundwater is one of the main sources of drinking water and irrigation in and around the Sialkot city. Its quality is getting deteriorated due to untreated discharge of industrial and urban effluent. The urban population relies on dug wells, boreholes, hand pumps and tube wells for all their groundwater requirements. The uncontrolled disposal of industrial and urban wastes and the use of chemical substances in agriculture (fertilizers, herbicides and pesticides) are the primary causes of the groundwater contamination. The results considered that the groundwater of the study area in general cannot be considered of good quality because it is turbid (57% of total sites) and its Fe, Pb are above the permissible levels set by WHO (1996). Zone 1 was highly turbid with EC (578.5 us/Cm), TDS (558.50), SO4 (312.50), Cl (148), total hardness (317), Zn (0.38 mg/l), Pb (0.45 mg/l), Fe (0.02 mg/l), all above the permeable levels set by WHO (1996) and PSQCA. Zone 2 was least affected zone; however, all the sites in this zone were found to have high level of Zn, Pb and about 60% sites were turbid with high level of Fe3. Two sites were found to contain high concentration of Cr+6, indicating contamination from tanning industries. This study also presents the useful-ness of Multivariate Statistical Techniques in groundwater quality assessment, identification of significant parame-
ters to get better information about source of pollution. The CA performed on the groundwater parameters analysis in this study revealed the existence of four zones of sites with analogous characteristics. Two of these corresponded to zones located in the industrial areas of the city. FA indicates that the parameters viz., EC, TDS, Turbidity, Fe and Cr responsible for water quality variations related to contaminated surface water, leaching from industrial waste sites. The analytical results of sampling sites, monitored in this study irrespective of pollution source, revealed that groundwater from these sites required further purification to ensure its suitability for human consumption. The study highlights the dire need to control heavy metals contamination of groundwater and if this issue is left unattended to, this will pose problems to provide safe drinking water for human beings. The results of this study stress the need for environmental awareness, adequate regulations and proper management of waste sites by the local municipal authorities. There is a need to check industrial water pollution by implementing strictly the pollution control laws and strict control on the disposable of untreated effluents around the industries needs to be enforced. High concentration of heavy metals and other hazardous substances in the groundwater quality in the country in general and Sialkot City in particular need to be evaluated. ACKNOWLEDGEMENTS The authors would like to thank Pakistan Environmental Protection Agency and Cleaner production centre, Sialkot for water quality analysis. REFERENCES Ahmad M (2000). Participatory Decision Making for Sustainable
Industrial Development: The case of the stranded communities in the tannery clusters in Sialkot, Pakistan. Retrieved August 8, 2000, fromhttp://www.cpp.org.pk/etpiartcl/Aug-00(EN)01.pdf
Ahmed K, Ali W (2000). Evaluation of Ravi River Water Quality. Pakistan J. Drainage Water Manage. 4: 10-15.
Allen SE, Parkinssons HMJA, Ouarmby C (1974). Chemical Analysis Ecological Material. Blackwell Scientific Publication, Oxford, UK.
Anonymous (1995). Report on Monitoring of bacteriological, health related and aesthetic quality of under groundwater in the cities of Ludhiana, Jalandhar Amritsar, Ropar and Nangal. Punjab Pollution Control Board, Patiala, India.
APHA (1992). Standard Methods for the examination of water and wastewater’ 18th, 20th ed., Am. Public Health Assoc. Washington, DC, USA.
APHA (1998). ‘Standard methods for the examination of water and wastewater’, 20th ed., Am. Public Health Assoc., Washington, DC, USA.
Ashley RP, Burelym MJ (1995). Controls on the occurrence of fluoride in groundwater in the Rift valley of Ethiopia. In: Nash H, McCall GJH (eds.), Groundwater Quality, Chapman and Hall, London, USA.
Bhutta MN, Ramzan M, Hafeez CA (2002). GroundWater Quality and Availability in Pakistan, Proceedings of Seminar on Strategies to Address the Present and Future Water Quality Issues, March 6-7, 2002. Pakistan Council of Res. in Water Resources. Islamabad, Pakistan.
Ullah et al. 445 Clarke R, Lawrence AR, Foster SSD (1995). Groundwater a threatened
resource. UNEP Environ. Library, 15pp. CPC (2005). Let the water be clean. Water- two million people are
dying for it. CPC News Bull. a joint project of TDAP, NORAD and PGMEA. Cleaner Production Centre, Sialkot, Pakistan.
Daily Dawn (2006). No step taken to check tanneries’ pollution. pp 12, March 26. Retrieved August 8, 2006, from www.DAWN.com.
Din M, Hussain FH, Naila A, Shabbir H, Rana NN, Anwar K, Saeed D, Zumra S (1997). The Quality Assessment of Drinking Water Supplied to Islamabad, Environmental Pollution. (Proceedings of Third National Symposium on Modern Trends in Contemporary Chem., Islamabad, Pakistan).
ETPI (1998). ‘The Leather Sector: Environmental Report, Federation of Pakistan Chamber of Pakistan, retrieved on 10-05-07 from www.cpp.org.pk/etpirpt/LeatherSectorReport.pdf.
Fordyce FM, Vrana K, Zhovinsky E, Povoroznuk V, Toth G, Hope BC, Iljinsky U, Baker J (2007). A health risk assessment for fluoride in Central Europe. Environ. Geochem. Health, 29: 23-102.
Foster SSD, Morris BL, Lawrence AR, Chilton PJ (1999). Groundwater impacts and issues in developing cities an introductory review. (In Proceeding of IAH XXVII congress ‘groundwater in then urban environment’( II/ IAH Int. contributions of hydrogeol. Nottingham).
Global water supply and sanitation assessment report (2000). Retrived in February, 8, 2007 from http://www.who.int/water_sanitation_health/monitoring/globalassess/en/.
Hamazah A, Addullah MP, Sarmani S, Johari MA (1997). Chemical and Bacteriological monitoring of drinking water from an urbanized water catchment drainage basin. Environmental Monitoring and Assessment, 44, 327-328.
Hashmi SK, Shahab S (1999). The Need for Water Quality Guide Lines for Pakistan. (In Proceedings: Water Resources Achievements and Issues in 20th Century and Challenges for Next Millennium. Pakistan Council of Res. in Water Resources, Islamabad, Pakistan.
Jurate V, Sillanpää M (2006). Chemical evaluation of potable water in Eastern Qinghai Province, China: Human health aspects. Chemical evaluation of potable water in Eastern Qinghai Province, China: Human health aspects. Environment International, 32, 80-86.
Ishaque M, Khan AA (2001). Prevalence of Dental Caries and Oral Hygiene Habits of Children in Quetta, Pakistan. Pakistan Oral and Dental J. 21: 1-5.
Khahlown MA, Tahir MA, Ashraf M (2002). Water Quality Issues and Status in Pakistan. In Proceedings: Seminar on Strategies to Address the Present and Future Water Quality Issues. Pakistan Council of Res. in Water Resources. Islamabad.
Khahlown MA, Tahir MA, Rasheed H, Bhatti KP (2005). Water Quality Status. In Proceeding of Pakistan Council of Res. in Water Resources, Ministry of Sci. Technol. Government of Pakistan, Islamabad.
Laluraj CM, Gopinath G (2006). Assessment of seasonal variation of groundwater quality of Pheretic aquifer – A river basin system. Environmental Monitoring and Assessment, 117: 45-57.
Madsen EL, Ghiorse WC (1993). Groundwater Microbiology: subsurface ecosystem processes. In Aquatic Microbiology, An Ecology Approach (ed. T.E. Ford), (pp. 167-5215). Blackwell, Boston.
PCRWR (2007). Water Quality Report, Water Quality Report 2003-2004 (n.d). Retrieved from, http://www.pcrwr.gov.pk/wq_phase2_report/wq_phase2_chap5.htm
Qadir A, Malik RN, Hussain SZ (2008) Spatio-temporal variations in water quality of Nullah Aik-tributary of the river Chenab, Pakistan. Environmental Monitoring and Assessment, 140: 43-59.
Sajjad M, Rahim S (1998). Chemical Quality of Groundwater of Rawalpindi/Islamabad. In Proceeding of 24th WEDC Conference: Sanitation and Water for All, Islamabad. Pakistan.
Sami-uz-Zaman A, Yousafzai AHK, Zahid, R, Akhtar S, Kashif R (2001). Investigation on Actual Contaminated Conditions by the Industrial Toxic Substances in Karachi, Pak-EPA, JICA & OECC.
SDWF (2003). Drinking Water Quality and Health. Safe Drinking Water Foundation. Retrived on August 2006, from hppt://www.safewater.org/members/teachers/water %20 and %20 health.com.
Sial JK, Mehmood S (1999). Water Pollution from Agriculture and Indus-
446 Afr. J. Environ. Sci. Technol.
try. Proceedings: Water Resources. In Proceeding of Achievements and Issues in 20th Century and Challenges for Next Millennium. Pakistan Council of Res. in Water Resources, Islamabad, Pakistan.
Singh KP, Dhami AS, Kansal BD, Ahuja BS, Goyal AK (1993). Trace elements levels in Drinking Water Scenario of Ludhiana Area. Indian J. Environ. Prot., 13: 603-612.
Singh KP, Malik A, Mohan D, Sinha S (2004). Multivariate statistical techniques for the evaluation of spatial and temporal variations in water quality of Gomti River (India) a case study. Water Res., 38: 3980-3992.
Sundary SA, Panda U, Nayak C, Dinabandhu B (2005) Multivariate Statistical Techniques for the evaluation of Spatial and temporal variation in water quality of Mahanadi river, estuarine System (India). Dept. Chem. SCS Autonomous college, 752001 puni, Orissa, India.
Tahir MA (1989). Pollution Problems in the Water Supply Systems of Islamabad and Rawalpindi. Pakistan Council of Res. in Water Resources, Islamabad (Un-published).
Tahir MA, Bhatti MA (1994). Survey of Drinking Water Quality in the Rural Areas of Rawalpindi District. In Proceeding of Pakistan Council of Res. in Water Resources, Islamabad.
Tahir MA, Chandio BA, Abdullah M, Rashid A (1998). Drinking Water
Quality Monitoring in the Rural Areas of Rawalpindi. In Proceeding of National Workshop on Quality of Drinking Water. Pakistan Council of Res. in Water Resources. Islamabad, Pakistan.
USEPA (1990). Recommended protocols for measuring conventional water quality variables and metals in fresh water of the Puget Sound, 1200 6th Avenue Seattle, WA 98101, Retrieved from http//ww.psat.wa.gov/Publications/protocols/protocol_pdfs/ freshwater.pdf.
Uma KO, Egboka BCE (1985). Water resources of Owerri and its environs. Imo State. Nigeria. Niger. J. Mineral Geol., 22: 57-62.
WHO (1996). Guidelines for Drinking-Water Quality, Recommendation, Vol. 1, 16-17.