Submitted to: The Division Chief Project Finance Division Caribbean Development Bank P.O. Box 408, Wildey St. Michael, Barbados Tel.: (246) 431-1600; Fax: (246) 426-7269 S Su ub bm mi i t t t t e e d d b by y: : Kairi Consultants Limited 14 Cochrane Street, Tunapuna Trinidad and Tobago, W. I. Tel.: (868) 663-2677; Fax: (868) 663-1442 E-mail: [email protected]August 2006
Transcript
Submitted to: The Division Chief Project Finance Division Caribbean Development Bank P.O. Box 408, Wildey St. Michael, Barbados Tel.: (246) 431-1600; Fax: (246) 426-7269 SSuubbmmiitttteedd bbyy:: KKaaiirrii CCoonnssuullttaannttss LLiimmiitteedd 1144 CCoocchhrraannee SSttrreeeett,, TTuunnaappuunnaa TTrriinniiddaadd aanndd TToobbaaggoo,, WW.. II.. TTeell..:: ((886688)) 666633--22667777;; FFaaxx:: ((886688)) 666633--11444422 EE--mmaaiill:: mmaaiill@@kkaaiirrii..ccoomm AAuugguusstt 22000066
DRAFT REPORT: Volume II – Macro-Economic and Social Analysis of St. Lucia ii
TABLE OF CONTENTS
LIST OF TABLES.................................................................................................................................................... III LIST OF FIGURES.................................................................................................................................................. IV ACRONYMS .............................................................................................................................................................V EXECUTIVE SUMMARY.................................................................................................................................... VII 1.0 INTRODUCTION.......................................................................................................................................1 2.0 INTERNATIONAL AND MACRO-ECONOMIC CONTEXT............................................................2
2.1 SPECIAL AND DIFFERENTIAL .....................................................................................................................2 2.2 VULNERABILITY .........................................................................................................................................2 2.3 CHANGING TRADE ACCESS .......................................................................................................................3 2.4 GENERAL ECONOMIC PERFORMANCE ......................................................................................................6 2.5 FISCAL OPERATIONS ................................................................................................................................10 2.6 DONORS AND PARTNERS .........................................................................................................................12 2.7 REMITTANCES ..........................................................................................................................................13 2.8 NARCO-TRAFFICKING..............................................................................................................................14
3.0 SOCIO-ECONOMIC AND POLITICAL CONTEXT..........................................................................15 3.1 POPULATION AND DEMOGRAPHICS........................................................................................................15 3.2 LABOUR ....................................................................................................................................................17 3.3 ECONOMIC STRATEGY AND PLANNING ..................................................................................................17 3.4 MANAGING THE POLITY..........................................................................................................................19
DRAFT REPORT: Volume II – Macro-Economic and Social Analysis of St. Lucia iii
LIST OF TABLES Table 2.1 Natural Disasters in St Lucia (1960 to 2004) .......................................................................... 3
Table 2.2: Windward Island Banana Exports ......................................................................................... 4
Table 2.3: GDP by Economic Sector at Factor Cost in Constant Prices - 1990 (EC$ mn) ................. 6
Table 2.4: St Lucia Manufacturing Production Current Prices (EC$000) ........................................... 7
Table 2.5: Visitor Arrivals by Category................................................................................................... 7
Table 2.6: Agriculture contribution to GDP at Factor Cost in Constant Prices - 1990 (EC$mn) ..... 8
Table 2.7: Central Government Revenue 1999-2005 (EC$ mn) .......................................................... 10
Table 2.8: Current Expenditure by Economic Classification (EC$Mn) ............................................ 11
Table 2.9: Capital Expenditure by Source of Funding (EC$Mn) ....................................................... 11
Table 2.10: Official Debt - as at December 2005 (EC$000) .................................................................. 12
Table 2.11: Distribution of External Debt - Selected Creditors (EC$Mn) as at December 2005 .... 13
Table 2.12: Central Government External Debt by Social Sector Development Program (Loans)....................................................................................................................................... 13 Table 3.1: Summary Demographic Aggregates – St. Lucia 1981-2003.............................................. 16
Table 3.4: Employed by Industry Group and Gender ........................................................................ 18
DRAFT REPORT: Volume II – Macro-Economic and Social Analysis of St. Lucia iv
LIST OF FIGURES Figure 2.1: Banana Exports (1992-2003) for the Windward Islands and St Lucia ............................. 5
DRAFT REPORT: Volume II – Macro-Economic and Social Analysis of St. Lucia v
ACRONYMS ACP - Africa, Caribbean and Pacific BNTF - Basic Needs Trust Fund CARE - Centre for Adolescent Rehabilitation and Education CARICOM - Caribbean Community CBI - Caribbean Basin Initiative CBO(s) - Community Based Organisation(s) CDB - Caribbean Development Bank CET - Common External Tariff CFCs - Chlorofluorocarbons CIDA - Canadian International Development Agency CRED - Center for Research on the Epidemiology of Disasters CSME - Caribbean Single Market and Economy DFID - UK Department of International Development DOTS - EC - Eastern Caribbean EC - European Commission ECTEL - Eastern Caribbean Telecommunications Authority EDF - European Development Fund EIB - European Investment Bank EM-DAT - Emergency Disasters Data Base EU - European Union FAO - Food and Agriculture Organisation FGT - Foster-Greer-Thorbecke GDP - Gross Domestic Product GOSL - Government of St Lucia HIV/AIDS - Human Immunodeficiency Virus/ Acquired Immunodeficiency
Syndrome HDI - Human Development Index HBS - Household Budgetary Survey IBRD - International Bank for Reconstruction and Development ICC - International Cricket Council IDB - Inter-American Development Bank ILO - International Labour Organisation LUCELEC - St. Lucia Electricity Services Ltd MDGs - Millennium Development Goals MoSSaiC - Management of Slope Stability in Communities NAFTA - North American Free Trade Area NAT - National Assistance Team
DRAFT REPORT: Volume II – Macro-Economic and Social Analysis of St. Lucia vi
NELP - National Learning and Enrichment Programme NGO(s) - Non-Government Organisation(s) NIC - National Insurance Corporation OECD - Organization for Economic Cooperation and Development OECS - Organisation of Eastern Caribbean States OFDA - USAID's Office of Foreign Disaster Assistance OPSR - Office of Private Sector Relations PPA - Participatory Poverty Assessment PRF - Poverty Reduction Fund PROUD - Programme for the Rationalisation of Unplanned Developments PSIP - Public Sector Investment Programme PWDs - Persons with Disabilities RC - Roman Catholics REDIP - Rural Economic Diversification Incentives Project SEDU - Small Enterprise Development Unit SFA - Special Framework of Assistance SIDS - Small Island Developing State(s) SLBC - St Lucia Banana Corporation SLBGA - St Lucia Banana Growers Association SMEs - Small and Medium Sized Enterprises SPICES - SLC - Survey of Living Conditions SLADA - St. Lucia Agricultural Diversification Agency Ltd SLBGA - St. Lucia Banana Growers Association TFRs - Total Fertility Rates TRP - Textbook Rental Programme UNDP - United Nations Development Programme UNECLAC - United Nations Economic Commission in Latin America and the
Caribbean UNESCO - United Nations' Educational, Scientific and Cultural Organization UNIFEM - United Nations’ Development Fund for Women UNODC - United Nations Office on Drugs and Crime VAT - Value Added Tax WIAP - Windward Islands Action Plan WIBDECO - Windward Islands Banana Development and Exporting Company WINBAN - Windward Islands Banana Grower’s Association WTO - World Trade Organisation
DRAFT REPORT: Volume II – Macro-Economic and Social Analysis of St. Lucia vii
EXECUTIVE SUMMARY
11..00 IINNTTRROODDUUCCTTIIOONN St. Lucia achieved independence from Britain in 1979 and has a bicameral parliamentary system, the model adopted by the majority of the English speaking Caribbean countries on their becoming independent nations. It is the largest country in terms of population among the Organisation of Eastern Caribbean States (OECS), which is a political sub-grouping linking the Windward and Leeward Islands. Through the OECS, the independent States of the Eastern Caribbean have sought to bring some greater level of political coordination among themselves, and have broached the idea of political union among themselves. They have been in a Monetary Union even before attaining formal political independence and are committed to achieve Economic Union in 2008, St. Lucia is a member of the Association of Caribbean States that links most of the Caribbean states and others around the Caribbean littoral. St. Lucia, on becoming independent, became a member of the United Nations and its respective bodies, and has been a beneficiary of support from some of these – UNDP, UNECLAC, FAO, UNESCO and ILO - to name a few. It is signatory to a range of conventions of International Society and has sought to abide by the goals set for the international community in respect of such areas as the Millennium Development Goals (MDGs), and the Kyoto Protocol in respect of Global Climate Change. Like Dominica, it was colonised by the French for part of its colonial past, and that has remained evident in the family names and the names of places on the island. Since independence, St. Lucia has cultivated a special relationship with France and French-speaking countries in Africa; its proximity to Martinique is exploited by its citizens in respect of trade and employment both informally and formally. In terms of its economic relations, CARICOM is the most important regional grouping. It is a member of the African, Caribbean and Pacific (ACP) grouping which links Europe to some of the ex-colonies, in a trade relationship that has accorded them trade privileges and market access, mainly for their primary products. It has also been involved, along with the rest of the CARICOM States in the discussions and negotiations relating to the formation of the Free Trade Area of the Americas, which has been effectively put on hold as a result of the stance taken more recently by certain Governments in South America.
DRAFT REPORT: Volume II – Macro-Economic and Social Analysis of St. Lucia 2
The economic and social reality of St. Lucia has been shaped in large measure by its relationship with the rest of the world. In the colonial period, like other parts of the Commonwealth Caribbean, it was a tropical appendage of Britain whose entire raison d’etre derived from its capacity to supply primary raw materials to the Britain. St. Lucia has remained the archetypical Commonwealth Caribbean country, and continues to be linked to the international economy by its exports of primary products. The Government has sought, since political independence in 1979, to diversify the inherited economic structure, by developing alternative sources of foreign exchange earnings for its export-propelled platform. In that regard, there was some early success, as light manufacturing and tourism emerged as viable activities outside of export agriculture. By the end of the decade of the 1980s, the country had achieved a rate of growth that would have been considered reasonable by most standards, and, in that regard, it was the lead economy among the Windward Islands. Bananas had continued to contribute to the GDP with good prices and rising output, and the newer sectors had added to employment, income and export earnings. 2.1 SPECIAL AND DIFFERENTIAL Of crucial importance in the growth of the economy in the latter half of the twentieth century was the success of St. Lucia and others in winning and sustaining trade preferences, especially for its exports, in particular its traditional exports. Within the fora of CARICOM and through regional and international groupings of which it became a member, the country has lent its voice in the shaping of international and regional society. Like the rest of the Commonwealth Caribbean, it has been concerned about small size and viability in the increasingly globalised international economy. Since the 1970s, Commonwealth Caribbean countries had successfully marshalled arguments for their being accorded what has come to be called special and differential status by way of:
• Preferential access for their exports; • The maintenance of non-reciprocal protection; and • Longer adjustment periods within which to implement liberalisation.
While there is differential tenacity within the regional movement in the pursuit of this strategy of special pleading, there is no doubt that as a region, countries have been able to win grudging support that has been translated into tangible assistance from time to time. 2.2 VULNERABILITY There is now wider recognition of the relevance of the vulnerability index which encapsulates the volatility of earnings of most Small Island Developing States (SIDS), and their lack of economic resilience. Vulnerability derives from three main areas – economic exposure,
DRAFT REPORT: Volume II – Macro-Economic and Social Analysis of St. Lucia 3
remoteness and insularity and susceptibility to environmental events and hazards. According to Briguglio (1995), the defining characteristic of SIDS is their inability to shelter themselves from forces outside of their control1. Clearly, St. Lucia is an acute case of economic exposure: it was once described as having built a ‘tripod’ as its foundation for its export platform through banana exports, light manufactures and tourism. Two of the legs have weakened in recent years – bananas, and light manufactures - with the result that tourism has become the main stay of its foreign exchange earning sector. It has good locational advantages unlike some other SIDS in the mid Pacific, which lie outside of the trade routes with high traffic. However, it is highly susceptible to environmental events. The experience of recent years has underlined the high degree of vulnerability of the Caribbean to hurricanes of higher intensity: Hurricanes Ivan in 2004 and Katrina in 2005 have forcibly awakened a wide swathe of Caribbean society and its littoral to the reality of climate change. Table 2.1 provides some sense of the impacts of disasters.
Table 2.1 Natural Disasters in St Lucia (1960 to 2004)
Source: EM-DAT: The OFDA/CRED International Disaster Database, www.em-dat.net -Université Catholique de Louvain - Brussels - Belgium2
2.3 CHANGING TRADE ACCESS St. Lucia enjoyed access to markets in the North Atlantic for some of its manufactures. The Caribbean Basin Initiative (CBI), CaribCan (with Canada) and ACP-EU, all provided trade privileges that were used in greater or lesser degree. The formation of the North American Free Trade Area (NAFTA), and the push on the part of a number of Central American countries and the Dominican Republic to take advantage of the CBI led to the displacement of the Eastern Caribbean as a competitive location for labour intensive manufacturing. By the middle of the decade of the 1990s, the decline had set in for its manufacturing sector. The mid 1990s brought the first reverses in the banana industry as well. The unification of Europe led to the adoption of measures on the part of the European countries to gravitate to a seamless approach to the treatment of the imports of bananas from traditional producers in the 1 Briguglio, L. ‘Small Island Developing States and their Economic Vulnerabilities,’ World Development, Vol. 23, No. 9, 1995. 2The information on natural disasters presented here is taken from EM-DAT: The OFDA/CRED International Disaster Database. In order for a disaster to be entered into the database at least one of the following criteria has to be fulfilled: 10 or more people reported killed; 100 people reported affected; a call for international assistance; declaration of a state of emergency
DRAFT REPORT: Volume II – Macro-Economic and Social Analysis of St. Lucia 4
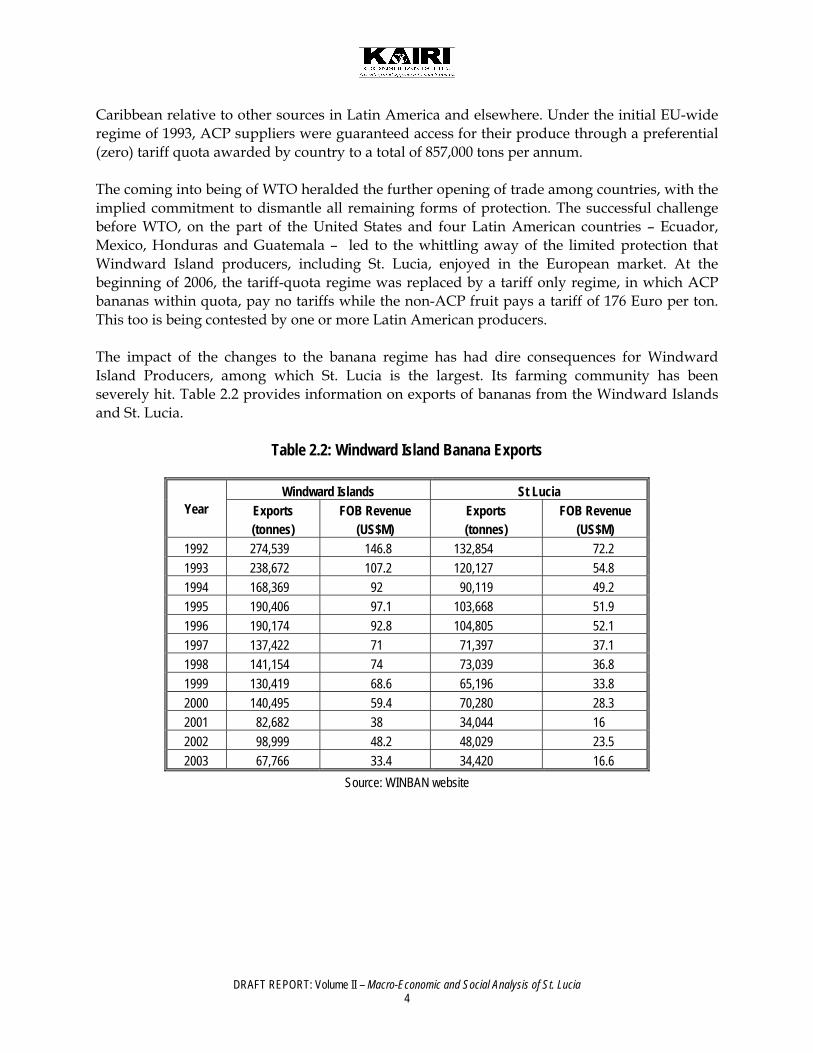
Caribbean relative to other sources in Latin America and elsewhere. Under the initial EU-wide regime of 1993, ACP suppliers were guaranteed access for their produce through a preferential (zero) tariff quota awarded by country to a total of 857,000 tons per annum. The coming into being of WTO heralded the further opening of trade among countries, with the implied commitment to dismantle all remaining forms of protection. The successful challenge before WTO, on the part of the United States and four Latin American countries – Ecuador, Mexico, Honduras and Guatemala – led to the whittling away of the limited protection that Windward Island producers, including St. Lucia, enjoyed in the European market. At the beginning of 2006, the tariff-quota regime was replaced by a tariff only regime, in which ACP bananas within quota, pay no tariffs while the non-ACP fruit pays a tariff of 176 Euro per ton. This too is being contested by one or more Latin American producers. The impact of the changes to the banana regime has had dire consequences for Windward Island Producers, among which St. Lucia is the largest. Its farming community has been severely hit. Table 2.2 provides information on exports of bananas from the Windward Islands and St. Lucia.
FIGURE 2.1: BANANA EXPORTS (1992-2003) FOR THE WINDWARD ISLANDS AND ST LUCIA
BOX 2.1: ADJUSTMENT AND BANANAS Attempts were made by Regional and International donors to manage the transition of the banana industries in the Windward Islands. Baseline studies funded by the Caribbean Development Bank, EC, DFID and UNDP (and later France), were expected to lead to the restructuring, modernization and commercialisation of the Windward Islands banana industry. The resulting Windward Islands Action Plan (WIAP) of 1999, developed inter alia, a Divestment Plan for government and other shareholdings in the Windward Islands Banana Development and Exporting Company (WIBDECO) to individual farmers, the design of social recovery programmes developed for displaced banana growers, and an Industry Strategy to a achieve a competitive, sustainable and efficient marketing structure. WIBDECO later elaborated a document entitled Proposals for the Development of a Modern Sustainable Windward Islands Banana Industry in 2001. Article 186 of the Lomé IV Convention provided compensation for loss of export earnings on certain agricultural products on which countries' economies are dependent and which are affected by fluctuations in price or quantity or both. The Windward Islands, including Dominica, Grenada, St. Lucia and St. Vincent and the Grenadines all qualified for assistance under the STABEX mechanism, which was part of the European Development Fund (EDF). Since 1995, a significant portion of the STABEX allocations for each of the Windward Islands has been operated by direct transfer to the budgets of the Government, with the intention that funds be used to target capital investments within the overall national Public Sector Investment Programme (PSIP) of each country. In an effort to streamline and simplify instruments of cooperation, horizontal instruments have been developed within the EDF as part of Economic Partnership Agreements. In 1999, another instrument was created to provide assistance to ACP Banana producers in the transitory period - the Special Framework of Assistance (SFA). Using funds from the EC budget (as opposed to the European Development Fund): the SFA offers further assistance to ACP banana producing countries, in their efforts to enhance competitiveness, diversify the agricultural sector, upgrade human resources; and to create safety nets for former producers.
DRAFT REPORT: Volume II – Macro-Economic and Social Analysis of St. Lucia 6
2.4 GENERAL ECONOMIC PERFORMANCE Table 2.3 shows the more recent performance of the economy of St. Lucia. GDP in constant prices fell in 2000 and 2001, after modest increases at the end of the decade of the 1990s. In real terms, there was a 13 per cent increase in output between 1998 and 2003. Manufacturing fluctuated and grew by less than the average – ten per cent over the period. There was considerable adjustment within manufacturing as well, with exports falling. In other words, to the extent that there was an increase in manufacturing, this would have been due to an expansion in production serving the domestic market, for example, food and drink. Since this is very small, the room for expansion on the basis of domestic demand is severely limited. On the other hand, if the largest sub-sector – food processing – could upgrade on the basis of a domestic market, it is not impossible for the sector to enter international competition. Table 2.4 shows the most recent performance of the Manufacturing Sector.
Table 2.3: GDP by Economic Sector at Factor Cost in Constant Prices - 1990 (EC$ mn)
DRAFT REPORT: Volume II – Macro-Economic and Social Analysis of St. Lucia 7
Table 2.4: St Lucia Manufacturing Production Current Prices (EC$000)
Commodities Manufactured 2001 2002 2003 2004 2005 Food Beverage and Tobacco 50,985 60,053 64,261 69,099 78,002 Wearing Apparel 1,933 1,465 1,011 1,039 906 Textiles 1,773 4,847 7,235 .. .. Corrugated paper & paper board, Containers of Paper and Paper Board 16,548 21,207 20,040 20,661 19,717 Other Paper and Paperboard 3,597 2,228 1,790 1,472 1,851 Wood and Wood Products 1,929 1,927 25,579 81 69 Electrical Products 17,637 25,369 18,477 24,529 28,279 Basic Industrial Chemicals 339 426 409 836 1,288 Other Chemicals 3,399 4,741 5,044 4,813 6,904 Plastic Products 3,064 3,157 3,014 3,296 3,443 Rubber Products 787 684 572 742 724 Printed Material 2,590 2,763 2,779 3,048 2,936 Metal Products 4,800 4,283 6,190 7,757 9,444 Copra and Copra Derivatives 8,573 4,057 4,683 4,837 3,090 Total manufacturing 118,003 137,204 138,084 142,211 156,652 Tourism, as represented in large measure by Hotels and Restaurants, was the lead export-oriented sector and grew by 25 per cent over the period, and has been the prime mover of the entire economy. There has been a rebound in the industry following the impact of September 11, 2001, but the country has to contend with increasing competition within the Caribbean region. The increased reliance on tourism exacerbates volatility in economic activity, as the experience of September 11, 2001 illustrates. Table 2.5 provides information on arrivals of visitors over the more recent past, as well as estimated expenditures by tourists, which grew by 26 per cent over the period.
DRAFT REPORT: Volume II – Macro-Economic and Social Analysis of St. Lucia 8
The issue of grave significance in the performance of the economy, having regard to its structure, has been the decline in the Agricultural Sector and of the Banana Industry in particular, since the middle of the last decade. While there were attempts made at diversification of agriculture, the size of exports of non-banana agriculture and the level of growth were miniscule relative to bananas, in the first place: indeed, the non-banana agriculture also declined. This has had the effect of shrouding the agricultural communities in St. Lucia in a pall of doom and gloom. Exports and production of non-banana agriculture came no where near replacing bananas in terms of employment and production as shown in Table 2.6 below.
Table 2.6: Agriculture contribution to GDP at Factor Cost in Constant Prices - 1990 (EC$mn)
There is the recognition, with hindsight, that the agreement to privatize the banana industry was not accompanied with the level of planning necessary to treat with the fall-out arising therefrom. The broader social implications were not properly factored into the equation. Several banana companies emerged on the scene, all fighting among themselves to the detriment of the interests of farmers in the long-run. Among the farmers there existed the lingering expectation that the Government would intervene in the final analysis, to protect them. This did not happen. Nor was there put in place the institutional and regulatory regime necessary to manage the arrangements between the production of bananas and sale in the international market place, when the emerging companies proved inadequate to the task of managing the structural adjustment that the industry needed to undergo to face the challenge of a more open regime of competition in the markets in which St. Lucian bananas were sold. The most recent review of the economy, the Economic Review 2005, points to the further declines in the agricultural sector in 2005. In respect of bananas, this was attributed to three factors:
• Destruction of banana fields especially in the Roseau Valley on the passing of Hurricane Ivan in September 2004;
DRAFT REPORT: Volume II – Macro-Economic and Social Analysis of St. Lucia 9
• Difficulties in the management of the leaf spot disease partly because of insufficient funds to purchase material used to control the disease;
• Higher input prices and loss in income to farmers because of crop damage during the hurricane, led to general deterioration in field maintenance.
The performance of the non-traditional agricultural sector was in no way better, and there was a decline for the fifth consecutive year, with purchases by supermarkets and hotels falling by double digits on the previous year. Concomitant with the failure to deal with downward adjustment in respect of banana production was the difficulty in developing the mechanisms for diversification into other agriculture. The average age of farmers is well into the fifties. Few are prepared to adopt the different mindset necessary in the development of an alternative agriculture. The continuing difficulty in the sector guarantees that it will remain unattractive to younger people. This seems to have created a vicious cycle in agriculture, where as decline becomes the order of the day, there is even greater discouragement to those in agriculture, and to those who might have contemplated entry into the sector. For example, tree crop agriculture one of the areas of diversification in St. Lucia - requires stringent laws and their strict enforcement to deal with the problem of praedial larceny. This is quite apart from the ‘tech packs’ that are necessary to assist farmers in other areas of agriculture that are different from bananas and require different technical regimes for production. In addition, there is the challenge of consolidation of acreages against the backdrop of inheritance rules that contribute to fragmentation. A Survey of ex-farmers conducted in 2004 by the Department of Statistics) for the National Insurance Corporation found that of a total of 656 persons, the vast majority had been in bananas, 80 per cent had been in farming for more than 10 years, 39 per cent were unemployed compared to the national average of 22 per cent, and 90 per cent had primary level education or less3. With this profile, there would have been need for significant investments along with other short-term support to allow such persons to deal with the fall-out of the restructuring of the banana industry and in preparing them to enter on alternative pursuits, whether in agriculture or in other sectors. In the first half of 2006, there is evidence that the economy has been growing, with Tourism and Construction in the lead. The stimulus to the Construction Sector came in 2005 with a number of developments related to the ICC Cricket World Cup tournament planned for 2007. This, along with road and other infrastructure development, has created a boom in Construction, strong enough for the Prime Minister to warn of inflationary pressures deriving from shortage of some types of labour and of materials. While loan financing from the Caribbean Development Bank and the World Bank supports some of this development, there is concurrent grant funding from the EU for financing agriculture and economic diversification to manage the adjustment taking place in the banana industry in the face of the reduction of protection.
3 Central Statistical Office and National Insurance Corporation, ‘Survey of Ex-Farmers,’ July 2004.
DRAFT REPORT: Volume II – Macro-Economic and Social Analysis of St. Lucia 10
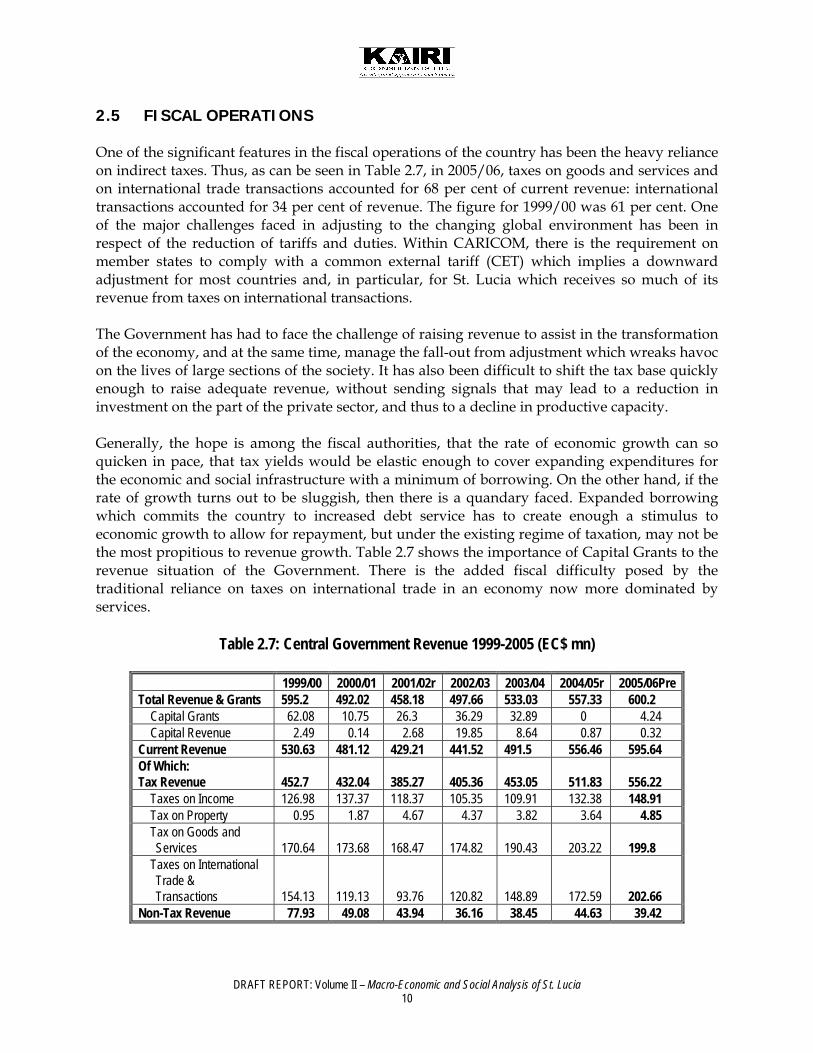
2.5 FISCAL OPERATIONS One of the significant features in the fiscal operations of the country has been the heavy reliance on indirect taxes. Thus, as can be seen in Table 2.7, in 2005/06, taxes on goods and services and on international trade transactions accounted for 68 per cent of current revenue: international transactions accounted for 34 per cent of revenue. The figure for 1999/00 was 61 per cent. One of the major challenges faced in adjusting to the changing global environment has been in respect of the reduction of tariffs and duties. Within CARICOM, there is the requirement on member states to comply with a common external tariff (CET) which implies a downward adjustment for most countries and, in particular, for St. Lucia which receives so much of its revenue from taxes on international transactions. The Government has had to face the challenge of raising revenue to assist in the transformation of the economy, and at the same time, manage the fall-out from adjustment which wreaks havoc on the lives of large sections of the society. It has also been difficult to shift the tax base quickly enough to raise adequate revenue, without sending signals that may lead to a reduction in investment on the part of the private sector, and thus to a decline in productive capacity. Generally, the hope is among the fiscal authorities, that the rate of economic growth can so quicken in pace, that tax yields would be elastic enough to cover expanding expenditures for the economic and social infrastructure with a minimum of borrowing. On the other hand, if the rate of growth turns out to be sluggish, then there is a quandary faced. Expanded borrowing which commits the country to increased debt service has to create enough a stimulus to economic growth to allow for repayment, but under the existing regime of taxation, may not be the most propitious to revenue growth. Table 2.7 shows the importance of Capital Grants to the revenue situation of the Government. There is the added fiscal difficulty posed by the traditional reliance on taxes on international trade in an economy now more dominated by services.
Table 2.7: Central Government Revenue 1999-2005 (EC$ mn)
1999/00 2000/01 2001/02r 2002/03 2003/04 2004/05r 2005/06Pre Total Revenue & Grants 595.2 492.02 458.18 497.66 533.03 557.33 600.2 Capital Grants 62.08 10.75 26.3 36.29 32.89 0 4.24 Capital Revenue 2.49 0.14 2.68 19.85 8.64 0.87 0.32 Current Revenue 530.63 481.12 429.21 441.52 491.5 556.46 595.64 Of Which: Tax Revenue 452.7 432.04 385.27 405.36 453.05 511.83 556.22 Taxes on Income 126.98 137.37 118.37 105.35 109.91 132.38 148.91 Tax on Property 0.95 1.87 4.67 4.37 3.82 3.64 4.85 Tax on Goods and
Services 170.64 173.68 168.47 174.82 190.43 203.22 199.8 Taxes on International
DRAFT REPORT: Volume II – Macro-Economic and Social Analysis of St. Lucia 11
Table 2.8 shows the inexorable rise in recurrent expenditure, pushed in large measure by the need for the Government to expand services in such areas as education, health, and the social services. Recurrent expenditure in 2005/06 was 22 per cent of GDP, underlying the fact that Government is a large player in the domestic economy. In the financing of capital expenditure the Government has had to rely heavily on loans and grants. This is evident in Table 2.9 which shows that local revenue has declined in respect of the financing of capital. This has translated itself into the debt situation reflected in Table 2.10.
Table 2.8: Current Expenditure by Economic Classification (EC$Mn)
Table 2.9: Capital Expenditure by Source of Funding (EC$Mn)
Current Expenditure 383.20 400.24 439.82 474.67 482.79 512.65 100.00 21.71
DRAFT REPORT: Volume II – Macro-Economic and Social Analysis of St. Lucia 12
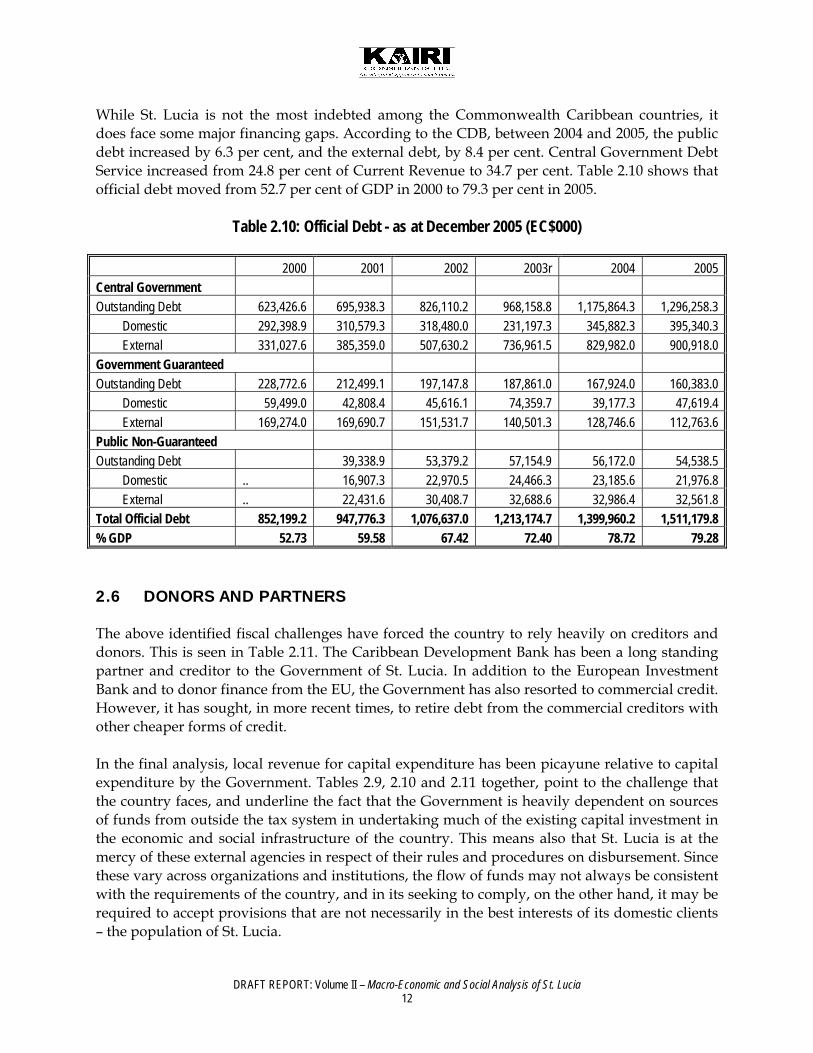
While St. Lucia is not the most indebted among the Commonwealth Caribbean countries, it does face some major financing gaps. According to the CDB, between 2004 and 2005, the public debt increased by 6.3 per cent, and the external debt, by 8.4 per cent. Central Government Debt Service increased from 24.8 per cent of Current Revenue to 34.7 per cent. Table 2.10 shows that official debt moved from 52.7 per cent of GDP in 2000 to 79.3 per cent in 2005.
Table 2.10: Official Debt - as at December 2005 (EC$000)
2000 2001 2002 2003r 2004 2005 Central Government Outstanding Debt 623,426.6 695,938.3 826,110.2 968,158.8 1,175,864.3 1,296,258.3
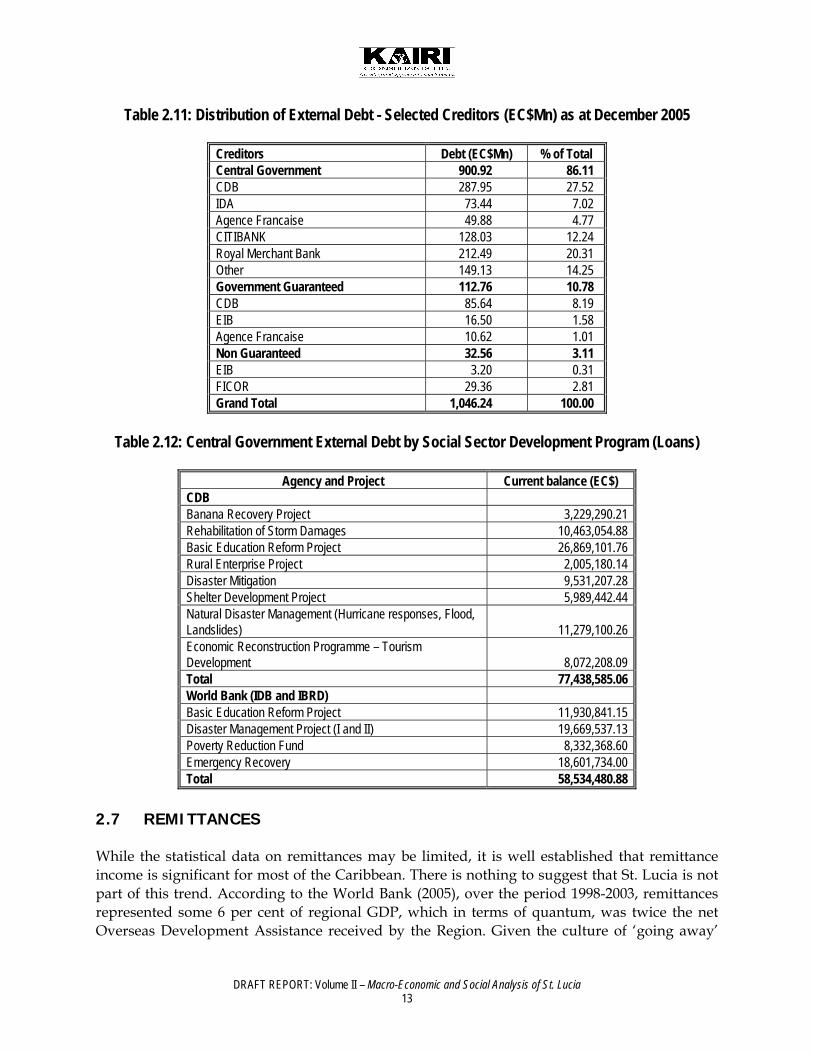
Total Official Debt 852,199.2 947,776.3 1,076,637.0 1,213,174.7 1,399,960.2 1,511,179.8 % GDP 52.73 59.58 67.42 72.40 78.72 79.28 2.6 DONORS AND PARTNERS The above identified fiscal challenges have forced the country to rely heavily on creditors and donors. This is seen in Table 2.11. The Caribbean Development Bank has been a long standing partner and creditor to the Government of St. Lucia. In addition to the European Investment Bank and to donor finance from the EU, the Government has also resorted to commercial credit. However, it has sought, in more recent times, to retire debt from the commercial creditors with other cheaper forms of credit. In the final analysis, local revenue for capital expenditure has been picayune relative to capital expenditure by the Government. Tables 2.9, 2.10 and 2.11 together, point to the challenge that the country faces, and underline the fact that the Government is heavily dependent on sources of funds from outside the tax system in undertaking much of the existing capital investment in the economic and social infrastructure of the country. This means also that St. Lucia is at the mercy of these external agencies in respect of their rules and procedures on disbursement. Since these vary across organizations and institutions, the flow of funds may not always be consistent with the requirements of the country, and in its seeking to comply, on the other hand, it may be required to accept provisions that are not necessarily in the best interests of its domestic clients – the population of St. Lucia.
DRAFT REPORT: Volume II – Macro-Economic and Social Analysis of St. Lucia 13
Table 2.11: Distribution of External Debt - Selected Creditors (EC$Mn) as at December 2005
Creditors Debt (EC$Mn) % of Total Central Government 900.92 86.11 CDB 287.95 27.52 IDA 73.44 7.02 Agence Francaise 49.88 4.77 CITIBANK 128.03 12.24 Royal Merchant Bank 212.49 20.31 Other 149.13 14.25 Government Guaranteed 112.76 10.78 CDB 85.64 8.19 EIB 16.50 1.58 Agence Francaise 10.62 1.01 Non Guaranteed 32.56 3.11 EIB 3.20 0.31 FICOR 29.36 2.81 Grand Total 1,046.24 100.00
Table 2.12: Central Government External Debt by Social Sector Development Program (Loans)
Agency and Project Current balance (EC$)
CDB Banana Recovery Project 3,229,290.21 Rehabilitation of Storm Damages 10,463,054.88 Basic Education Reform Project 26,869,101.76 Rural Enterprise Project 2,005,180.14 Disaster Mitigation 9,531,207.28 Shelter Development Project 5,989,442.44 Natural Disaster Management (Hurricane responses, Flood, Landslides) 11,279,100.26 Economic Reconstruction Programme – Tourism Development 8,072,208.09 Total 77,438,585.06 World Bank (IDB and IBRD) Basic Education Reform Project 11,930,841.15 Disaster Management Project (I and II) 19,669,537.13 Poverty Reduction Fund 8,332,368.60 Emergency Recovery 18,601,734.00 Total 58,534,480.88
2.7 REMITTANCES While the statistical data on remittances may be limited, it is well established that remittance income is significant for most of the Caribbean. There is nothing to suggest that St. Lucia is not part of this trend. According to the World Bank (2005), over the period 1998-2003, remittances represented some 6 per cent of regional GDP, which in terms of quantum, was twice the net Overseas Development Assistance received by the Region. Given the culture of ‘going away’
DRAFT REPORT: Volume II – Macro-Economic and Social Analysis of St. Lucia 14
even by way of temporary migration, households manage to increase income by having members join the work-force of the metropole with which Caribbean people have remained connected since the Post World War II period. In addition to seeking entry to the metropolitan economies to the north, there has been nearer targets for temporary or permanent migration in search of employment: Trinidad and Tobago, and Barbados would attract a few, but in more recent times, Martinique has been an important target for St. Lucians seeking short-term employment mainly as unskilled labour. The relative proximity to Martinique allows for such workers to commute regularly between St. Lucia and Martinique. 2.8 NARCO-TRAFFICKING According to the State Department of the United States, St. Lucia is a well-used trans-shipment site for cocaine from South America to the United States and Europe.4 The south and south-west coast of the island is an area of high activity with go-fast boats from Venezuela primarily, making drop-offs. This is also the area through which marijuana is imported from St. Vincent. There is also substantial growing of marijuana in St. Lucia, though not on the scale that has developed in St. Vincent. According to one informed respondent, there has emerged an underground economy that supplies a continuous stream of income from a perennial crop to participants. The Lion of Judah paper is a standard import item and is available in most small shops and is used in wrapping marijuana leaves. A survey done on Secondary Schools by the Drug Control Unit suggested that use among secondary school students is widespread enough to be alarming and even primary schools students are involved in rolling leaves for their parents who seek to generate an income by producing and selling marijuana. In 2003, UNODC reported that illicit drug exports constituted 3.4 per cent of legal GDP of Caribbean countries, which was the highest in the world5. St. Lucia is a market as well as a transshipment site, for illicit drugs and this creates a problem in respect of the orientation of young people to requirements for pursuits in the formal economy. In recognition of the enormity of the challenge before it, and the limited resources available to withstand the narco-trafficking industry, St. Lucia is a signatory to the Shipriders’ Agreement with the United States allowing its Coast Guard to operate in the waters of the country, with officers from St. Lucia on board their vessels. Operation CARIBE VENTURE has been one of the programmes mounted by the US Coast Guards in association with the authorities in St. Lucia.6 The problem of narco-trafficking is that, just as ‘bad money drives out good’, the growth of narco-trafficking can submerge legitimate business and economic activities, and render them unattractive, especially to persons in the lower income brackets. Falling detection rates in respect of crime has tended to make illegal activity so much more rewarding.
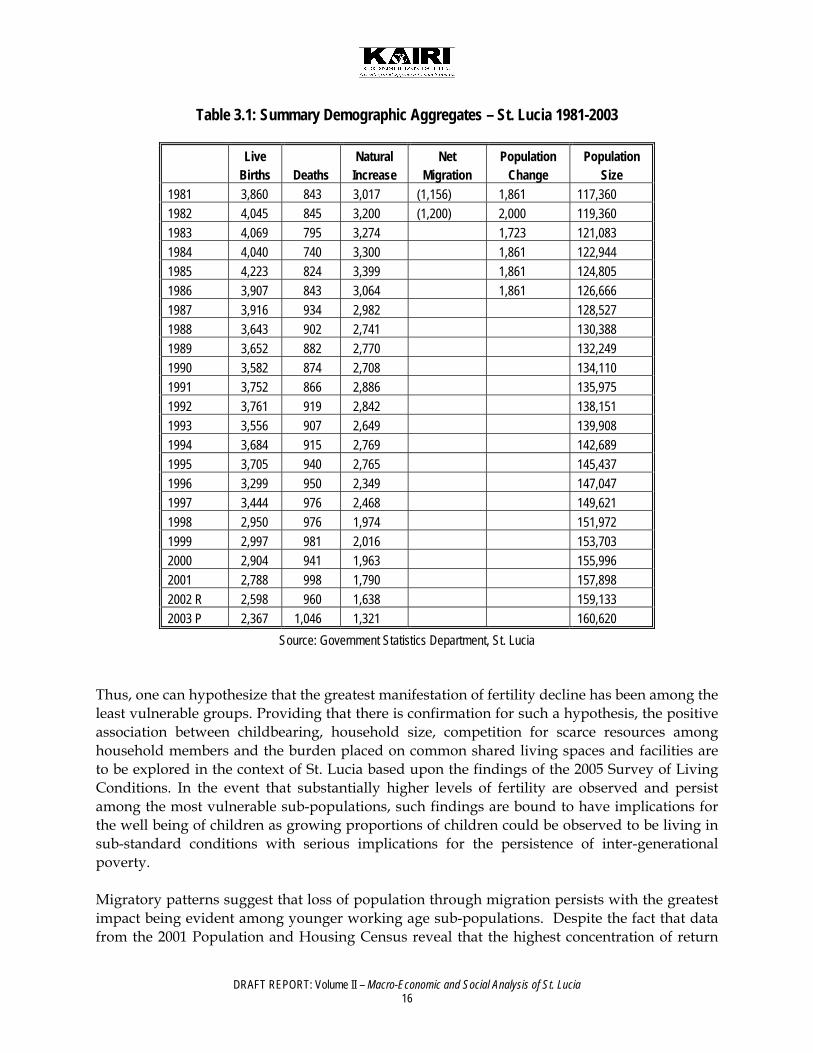
3.1 POPULATION AND DEMOGRAPHICS In 1946, the population of St. Lucia was in the vicinity of 70,113 based on census enumeration undertaken in that year. During the early Post-World War II years, the island’s population experienced rapid growth. By the beginning of the new millennium, the population of St. Lucia had more than doubled its size in 1946. During the latter half of the 20th century, such increases in the size of St. Lucia’s population were largely due to natural increase triggered by high levels of fertility that were characteristic of women’s childbearing experiences. According to Ebanks (1985), total fertility rates (TFRs) in St. Lucia had attained magnitudes of 6.9 live births per woman in 1960, 6.8 in 1970 and 4.0 in 1980. Thus, it was not until 1980 that appreciable fertility decline was attained despite being sustained at a relatively high level. Between 1950 and 1980, Guengant (1986) reveals that net emigration from St. Lucia amounted to more than half (57.5%) of the island’s natural increase suggesting that more phenomenal population growth during that period was checked by emigration which acted as a safety valve, not only for St. Lucia but also for a number of other Anglophone Caribbean territories. Table 3.1 shows that natural increase has been declining between 1981 and 2003. Such a decline is a function of the decline in the number of live births and increase in the number of deaths that have become evident in St. Lucia over the period. Thus, the decline in the number of live births coupled with increasing longevity of life at virtually all ages and the prospect of lower loss due to net emigration or even net immigration among elderly sub-populations 60 years and over would have contributed to the aging of the population of St. Lucia. Such an aging process would inflate the annual number of deaths as greater proportions of the island’s population would be in older age groups that are subject to greater risk of mortality. During the 1990s, fertility levels declined and during the early years of the twenty-first century, the St. Lucia’s TFR is shown to be 2.2 and closely approximating replacement level fertility (Population Reference Bureau, 2004). Given observed fertility trends in developing countries such as those within the Caribbean, it is expected that fertility levels in St. Lucia will decline further and be sustained at a level below that which is characteristic of replacement level fertility.
DRAFT REPORT: Volume II – Macro-Economic and Social Analysis of St. Lucia 16
Table 3.1: Summary Demographic Aggregates – St. Lucia 1981-2003
Source: Government Statistics Department, St. Lucia Thus, one can hypothesize that the greatest manifestation of fertility decline has been among the least vulnerable groups. Providing that there is confirmation for such a hypothesis, the positive association between childbearing, household size, competition for scarce resources among household members and the burden placed on common shared living spaces and facilities are to be explored in the context of St. Lucia based upon the findings of the 2005 Survey of Living Conditions. In the event that substantially higher levels of fertility are observed and persist among the most vulnerable sub-populations, such findings are bound to have implications for the well being of children as growing proportions of children could be observed to be living in sub-standard conditions with serious implications for the persistence of inter-generational poverty. Migratory patterns suggest that loss of population through migration persists with the greatest impact being evident among younger working age sub-populations. Despite the fact that data from the 2001 Population and Housing Census reveal that the highest concentration of return
DRAFT REPORT: Volume II – Macro-Economic and Social Analysis of St. Lucia 17
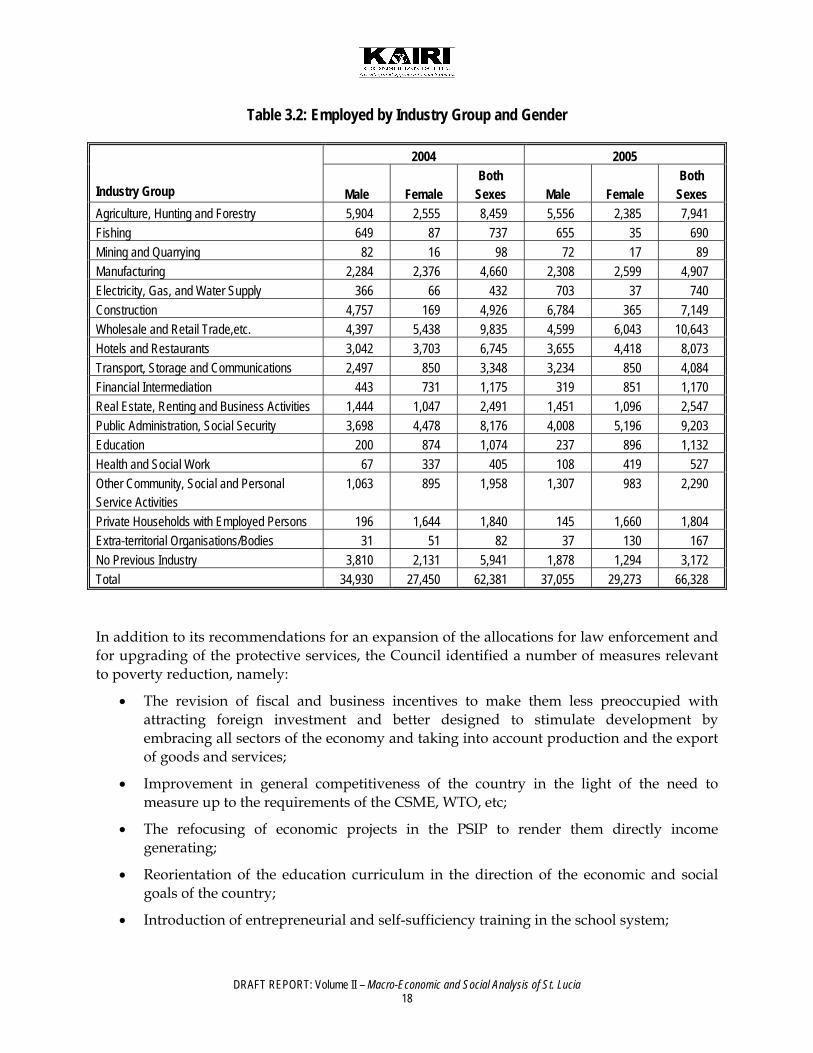
migrants was in the age group 20-54 years, it is also likely that St. Lucia, like many other Caribbean countries, has been experiencing a wave of return migration due principally to the retirement of St. Lucian nationals who migrated in the 1960s and actively participated in metropolitan labour markets throughout their adult lives. Such a process is likely to have its greatest impact upon older working age sub-populations aged 45 years and over and may be most pronounced among persons 60 years and over. Moreover, given the long history and continuous flow of persons abroad, the culture of migration is well entrenched and, as a complement, there has been the flow of remittances back to the country. In addition, any sharp decrease in economic activity is likely to spark the response of migration as households seek to manage by widening their theatre of economic activity. St. Lucia has experienced high rates of internal migration from rural to urban areas and there is likely to have been a comparable effort at emigration, to the extent that St. Lucians could overcome any barriers put in the way by receiving countries. 3.2 LABOUR Unemployment has shown some decline in more recent times; in 2005 unemployment was estimated at 17 per cent, which was much lower than over 20 per cent that was recorded in the latter years of the 1990s. Investment in physical infrastructure and the expansion of the room stock have resulted in an increase in employment. However, while economic expansion brings employment in its wake, the segmentation of the labour market results in differential access to jobs between the genders. As Table 1.12 illustrates, the expansion of employment in Construction has not brought much change to the employment status of women. Thus, single parent female headed households would not have derived fewer benefits from the increase in employment. 3.3 ECONOMIC STRATEGY AND PLANNING In the midst of the sluggish or declining growth in the early part of the current decade, the Government established, in September 2002, the National Economic Council, through which the social partners were brought together to identify policies and initiatives that could accelerate the economic advancement of St. Lucia through an integrated development planning approach. In its inaugural report, it proposed three development targets:
• Increased Domestic Production • Poverty Reduction • Crime Abatement7
7 National Economic Council, ‘Toward an Integrated Economic Development Strategy,’ Inaugural Report, 2005.
DRAFT REPORT: Volume II – Macro-Economic and Social Analysis of St. Lucia 18
Table 3.2: Employed by Industry Group and Gender
2004 2005
Industry Group Male Female Both
Sexes Male Female Both
Sexes Agriculture, Hunting and Forestry 5,904 2,555 8,459 5,556 2,385 7,941 Fishing 649 87 737 655 35 690 Mining and Quarrying 82 16 98 72 17 89 Manufacturing 2,284 2,376 4,660 2,308 2,599 4,907 Electricity, Gas, and Water Supply 366 66 432 703 37 740 Construction 4,757 169 4,926 6,784 365 7,149 Wholesale and Retail Trade,etc. 4,397 5,438 9,835 4,599 6,043 10,643 Hotels and Restaurants 3,042 3,703 6,745 3,655 4,418 8,073 Transport, Storage and Communications 2,497 850 3,348 3,234 850 4,084 Financial Intermediation 443 731 1,175 319 851 1,170 Real Estate, Renting and Business Activities 1,444 1,047 2,491 1,451 1,096 2,547 Public Administration, Social Security 3,698 4,478 8,176 4,008 5,196 9,203 Education 200 874 1,074 237 896 1,132 Health and Social Work 67 337 405 108 419 527 Other Community, Social and Personal Service Activities
1,063 895 1,958 1,307 983 2,290
Private Households with Employed Persons 196 1,644 1,840 145 1,660 1,804 Extra-territorial Organisations/Bodies 31 51 82 37 130 167 No Previous Industry 3,810 2,131 5,941 1,878 1,294 3,172 Total 34,930 27,450 62,381 37,055 29,273 66,328 In addition to its recommendations for an expansion of the allocations for law enforcement and for upgrading of the protective services, the Council identified a number of measures relevant to poverty reduction, namely:
• The revision of fiscal and business incentives to make them less preoccupied with attracting foreign investment and better designed to stimulate development by embracing all sectors of the economy and taking into account production and the export of goods and services;
• Improvement in general competitiveness of the country in the light of the need to measure up to the requirements of the CSME, WTO, etc;
• The refocusing of economic projects in the PSIP to render them directly income generating;
• Reorientation of the education curriculum in the direction of the economic and social goals of the country;
• Introduction of entrepreneurial and self-sufficiency training in the school system;
DRAFT REPORT: Volume II – Macro-Economic and Social Analysis of St. Lucia 19
• Development of programmes to increase value-added from agri-products and from agro-linkages; and
• The promotion of cottage industries for export/import substitution with targeted incentives especially in non-traditional areas such as culture and services.
It is not clear to what extent these specific recommendations have been accepted. However, the current budget (2006-07) of the Government entitled ‘From Recovery to Expansion’, covers in myriad ways the issues of expansion of domestic production, of poverty reduction and crime abatement. This suggests that there has been substantial convergence between the Government and the National Economic Council on the factors contributing to the weakening of the economy in the first few years of the decade and on the strategy that needs to be pursued in increasing the rate of growth. 3.4 MANAGING THE POLITY Representative government is well institutionalised in St. Lucia. The House of Assembly and the Senate constitute the legislature of the country. There is a multi-party democracy, with two main parties in place. There is the occasional rise to prominence of independent candidates or smaller groupings that eventually become absorbed in one or the other main parties. In the early years of independence, the country did face schism in its politics, with a ruling party splitting over issues of strategy, and ideology. While there are occasional crossings of the floor, the basic two party structure ensures that there is a formal opposition party in place. The legislature is male dominated: at the last general elections, two women were elected for the party securing the majority, and both were given Cabinet positions. The Head of State is the Queen of England and her representative is the Governor General who is also female. The current ruling party, the St. Lucia Labour Party, was re-elected to a second term in office in 2002. It had won by a landslide in 1997, defeating the United Workers Party that had been in power for a number of terms. There are no major ideological differences separating the two main parties, and political contests tend to be dominated at times, by personality issues. In spite of its title, the party in power is not an arm of any formal labour organization. Although the Government of St. Lucia remains an important actor in the economic life of the country, there is a vibrant private sector comprised of domestic and foreign interests and a wide range of small and medium sized enterprises. The Government is committed to free operation of market forces and has set in place an Office of Private Sector Relations – OPSR – which provides assistance to the private sector, and is the mechanism through which it maintains close relations with it. On the matter of decentralization of political administration, there has been little real movement in spite of the announced intention to develop local governance structures and to endow them with certain powers. This issue has been the subject of formal study with the support from the CDB, and recommendations have been developed on the modalities of implementing local government reform.
DRAFT REPORT: Volume II – Macro-Economic and Social Analysis of St. Lucia 20
There are local councils, but these are appointed by the Government. Their role is limited to such issues as the management of garbage disposal, of cemeteries, public baths and toilets and other minor functions. However, this appointive structure has not prevented the growth of independent CBOs with executives that are elected by their members, and which exercise considerable influence in the geographic areas in which they operate. The Laborie Planning Committee and the Soufriere Foundation are two such examples. One major recent issue in the politics of St. Lucia was the matter of abortion and pro-choice. One member of the Government withdrew from the party over the matter and resigned her seat to force a by-election. She subsequently lost at the polls in seeking a new mandate from constituents, and as well, the candidate of the party in power. This suggests that the electorate has concerned itself with issues facing the population, rather than with personality issues. Meanwhile, the strong Catholic lobby has called for the excommunication of the Governor General for sanctioning the legalization of abortion by assenting to Clause 166 of the revised Criminal Code in 2004. The Clause provides for abortion on the grounds of rape, incest or in the interest of protecting the mother’s health or life. St. Lucians seem divided on the issue, but it remains a moot point whether it will be an election issue at the next constitutionally due elections later in 2006. The Government has had to face other challenges in recent times. The 36 per cent increase in international oil prices in 2005 relative to 2004 created problems for the Government in the regulation of taxi fares. In a situation where private minibuses provide most of the public transportation, the Government has a vested interest in ensuring that transportation costs are not subject to rapid escalation in prices. It seems that the man in the street has come to accept that the matter of oil prices is decidedly beyond the control of the Government, which can, for its part, argue that it is investing in the search for alternatives sources of energy, including geo-thermal energy, and is introducing measures to reduce the dependence on fossil fuels. There are no daily newspapers, but there are a couple of weekly and thrice weekly publications, which air the views of a wide cross-section of the population. There are also a number of privately run radio stations, catering to a wide range of audiences. A number of programmes in Creole, enjoy a listener-ship among those sections of the society that feel greater comfort in speaking Creole – mainly elderly rural residents. There are also talk-shows which have considerable audience, and which provide avenues for critique and outright criticism of the Government. The Government introduced legislation in 2003 which was deemed to be draconian in some quarters in that it provided for the incarceration of anyone who knowingly publishes false news with the intention of creating harm to the society. Whatever the legislation in place, St. Lucians seem not to have any fear of censorship and there is open discussion on most matters that excite public interest. St. Lucia has followed Trinidad and Tobago in the development of Calypso as an art form, which serves a role in social commentary, which can be as caustic as it is witty and, with the use of double entendre, can escape the reach of laws on libel and even of censorship. It is not
DRAFT REPORT: Volume II – Macro-Economic and Social Analysis of St. Lucia 21
unknown for calypsoes to carry some of the most severe of criticism of actions by a Government. Roman Catholicism remains the dominant religion of St. Lucia, but has to contend with the rise of evangelical and other Christian denominations that have come in mainly from the United States. Tele-evangelical programmes attract a substantial audience as well. While still influential, especially in the area of education, the Roman Catholic Church is no longer the dominant force that it was in the 20th century. There is a small Rastafarian movement which has become attractive to some of the youth of the island. While there is no formal evidence of African religion, some occult practices are attributed to retentions of forms of worship and cultural practices that the slaves brought with them, and which slavery did not succeed in fully in eradicating. There are at least a couple of areas in which there is considerable divergence between the formal observance of international conventions and the actual provisions within the country for the implementation of these conventions. One relates to the provisions in place to give effect to the rights of persons with disabilities. The country is still at some considerable distance from the implementation of the United Nations Standard Rules on the Equalization of Opportunities for Person with Disabilities (PWDs), which creates the possibility that as much as 10 per cent of the population is not allowed the achievement of their fullest potential in their nation.8 Another area is the observance of the conventions of the International Labour Organisation (ILO). The country has ratified some 28 conventions of the ILO. There is debate among the social partners as to the degree to which the country is abiding by these conventions: to start with, the matter of the financing of attendance at the annual meetings of the ILO seems to be undecided. The legislative agenda tend to lag behind the formal acceptance of conventions, and this may work negatively for those in the lowest socio-economic categories. There has been some advance in social legislation in recent times and some updating of legislation relating to adoption. Issues relating to gender are handled by a Department of Gender Affairs in the Ministry of Health, Human Services, Family Affairs and Gender. However, there are still elements of the law that do not accord equal rights in respect of property to married women vis-à-vis their husbands. Domestic violence is a problem in the society, and so is child abuse but there is evidence that the authorities are currently taking vigorous steps to combat both problems.
8 The National Council of and Persons with Disabilities indicates that 6.6 per cent of the population of St. Lucia is comprised of PWDs. Most expert opinion suggests that 10 per cent of most human populations would suffer some type of disability.