Atmospheric Transmission from a 4- 7 Light Source to a 2- r Receiver Israel Cantor This survey report points out the progress and insufficiencies in the assessment and prediction of atmospher- ic effects on thermal radiation from an effective point source in the troposphere to a 2 -7r sr receiver at the ground. Major findings of investigators during the past two decades are summarized, which also provide ad- ditional conclusions. Complicated transmission problems can, futhermore, be treated theoretically by as- suming model type atmospheres and solving the radiation transfer equation by an available technique such as the Monte Carlo method. Some of the major results of this method are also presented. 1. Introduction A major problem in combat operations and civil defense in a nuclear environment is the inability to assess and predict the atmospheric and environmen- tal effects on thermal radiation from a nuclear air detonation to a target. Although significant prog- ress has been made in the past two decades, this problem presently lacks an adequate solution due to insufficient data for determining conclusive trans- mittance-vs-distance relationships under different atmospheric and environmental conditions. This re- port will survey the main results of the efforts of var- ious investigators in this field during the past 20 years or so. Furthermore, this survey will be con- fined to a 4-7r or effective point light source within the troposphere, i.e., up to about 15,240-m altitude, and a 2-7r or plane receiver at the ground. The basic radiation transfer equation describes the relationship between the initial total thermal inten- sity propagating through the atmosphere and that incident on some target or receiver at some distance D from the nuclear fireball as Q = FWTt / 4tD 2 , where Q is the thermal intensity at the target (gen- erally expressed in calories/cm 2 ), F is the thermal efficiency of the nuclear weapon or that fraction of The author is with U.S. Army Electronics Command, Atmo- spheric Sciences Laboratory, Fort Monmouth, New Jersey 07703. Received 18 October 1972 the total yield (TNT equivalent) emitted as thermal energy, W is the total yield of the weapon in calories, D is the source-to-target straight-line distance in centimeters (cm), and Tt is the atmospheric total transmission factor. (All the symbols are defined in Table I.) This report is concerned mainly with the atmospheric parameter Tt. The total transmission factor Tt can be simply ex- pressed as Tt = Td(l + H), where Td' X D 2 = Td and Td = exp(-aD) is the di- rect atmospheric transmission factor including the square of the distance D attenuation; a is the atmo- spheric direct-light attenuation coefficient between the source and the target, which is determined by the air molecules plus aerosol scattering and absorp- tion properties; H is a ratio of indirect intensity to direct intensity, i.e., the transmittance enhancement factor. The parameter Td is related to the meteorological range V by the expression V = (3.9)/a. This expression can also be denoted as VID = constant/aD in terms of the meteorological range per unit dig- tance that is inversely proportional to the optical thickness aD. The direct intensity component of H is a relatively simple function of aD or D/ V. Due also to the indirect component, however, H becomes a complicated function of additional pa- rameters, namely (1) a or D; (2) cloud conditions; (3) ground or surface conditions; and (4) source-tar- get-surroundings geometry. 1482 APPLIED OPTICS / Vol. 12, No. 7 / July 1973
Transcript
Atmospheric Transmission from a 4- 7 Light Sourceto a 2- r Receiver
Israel Cantor
This survey report points out the progress and insufficiencies in the assessment and prediction of atmospher-ic effects on thermal radiation from an effective point source in the troposphere to a 2 -7r sr receiver at theground. Major findings of investigators during the past two decades are summarized, which also provide ad-
ditional conclusions. Complicated transmission problems can, futhermore, be treated theoretically by as-suming model type atmospheres and solving the radiation transfer equation by an available technique suchas the Monte Carlo method. Some of the major results of this method are also presented.
1. Introduction
A major problem in combat operations and civildefense in a nuclear environment is the inability toassess and predict the atmospheric and environmen-tal effects on thermal radiation from a nuclear airdetonation to a target. Although significant prog-ress has been made in the past two decades, thisproblem presently lacks an adequate solution due toinsufficient data for determining conclusive trans-mittance-vs-distance relationships under differentatmospheric and environmental conditions. This re-port will survey the main results of the efforts of var-ious investigators in this field during the past 20years or so. Furthermore, this survey will be con-fined to a 4-7r or effective point light source withinthe troposphere, i.e., up to about 15,240-m altitude,and a 2-7r or plane receiver at the ground.
The basic radiation transfer equation describes therelationship between the initial total thermal inten-sity propagating through the atmosphere and thatincident on some target or receiver at some distanceD from the nuclear fireball as
Q = FWTt / 4tD2 ,
where Q is the thermal intensity at the target (gen-erally expressed in calories/cm2 ), F is the thermalefficiency of the nuclear weapon or that fraction of
The author is with U.S. Army Electronics Command, Atmo-spheric Sciences Laboratory, Fort Monmouth, New Jersey 07703.
Received 18 October 1972
the total yield (TNT equivalent) emitted as thermalenergy, W is the total yield of the weapon in calories,D is the source-to-target straight-line distance incentimeters (cm), and Tt is the atmospheric totaltransmission factor. (All the symbols are defined inTable I.) This report is concerned mainly with theatmospheric parameter Tt.
The total transmission factor Tt can be simply ex-pressed as
Tt = Td(l + H),
where Td' X D2 = Td and Td = exp(-aD) is the di-rect atmospheric transmission factor including thesquare of the distance D attenuation; a is the atmo-spheric direct-light attenuation coefficient betweenthe source and the target, which is determined bythe air molecules plus aerosol scattering and absorp-tion properties; H is a ratio of indirect intensity todirect intensity, i.e., the transmittance enhancementfactor.
The parameter Td is related to the meteorologicalrange V by the expression
V = (3.9)/a.
This expression can also be denoted as
VID = constant/aD
in terms of the meteorological range per unit dig-tance that is inversely proportional to the opticalthickness aD. The direct intensity component of His a relatively simple function of aD or D/ V.
Due also to the indirect component, however, Hbecomes a complicated function of additional pa-rameters, namely (1) a or D; (2) cloud conditions;(3) ground or surface conditions; and (4) source-tar-get-surroundings geometry.
1482 APPLIED OPTICS / Vol. 12, No. 7 / July 1973
Table I. Symbols
Q Total thermal intensity incident on the target(denoted in this report in units of calories/cm2)
F Fraction of the total yield of the nuclear weapon(TNT equivalent) that is emitted as thermalradiation
W Total energy yield of the nuclear weapon (ex-pressed in calories)
Tt, T27r Total atmospheric transmittance as commonlydefined by Tt or T2 7r =
(It/Io) . (D2/Do2)
such that Tt = 1 at D = Do, or, as denoted in thereport, T = Td(1 + H)
It eTotal thermal intensity at distance DIo Total thermal intensity at unit distance from the
sourceD Source-to-target straight-line distanceDo Unit distance from the sourceTd Direct atmospheric transmittance, including the
square of the distance attenuation, as defined by
Td = exp(-aD)
such that Td = I at D = Doa The direct exponential attenuation coefficient
defined by
Id = Io exp (-aD) (D2/Do 2)
(denoted in this report in units of km-')H Indirect thermal intensity - direct thermal
intensityV Meteorological (met.) range where V = 3.9/aaD Optical thickness, optical depth, or optical path,
which is a measure of the optical turbidity ofthe atmosphere
A Albedo or the ratio of the quantity of thermalradiation reflected by a body to the quantityincident upon it
h Source height or altitudesecO Geometry parameter denoted by D/ht1 Elapsed time from beginning of nuclear detona-
tiont' max Elapsed time from beginning of nuclear dentona-
tion to the occurrence of the second thermalmaximum
T(r) Total thermal transmissivity of a blackbodysource whose radiation distribution as a functionof wavelength corresponds to a temperature r
Ts(seco, r) Scattered thernal transmissivity as a function ofseco and r
N(X,, r) Fraction of the total thermal radiation emittedby a blackbody at temperature in the ithwavelength interval
F(Xi, seco) Scattered radiation flux incident on a 2-7r receiverin the ith wavelength interval and at a slantrange corresponding to seco
T,,(X, secO) Water vapor transmittance in the ith wavelengthinterval and at a slant range corresponding tosecO
H.O.B. Effective source altitude or height of burst ofnuclear weapon
II. Discussion
A. Test Results of Transmission MeasurementsThe following section of this survey will summa-
rize the empirical relationships that have been es-tablished by a number of researchers investigatingthe atmospheric attenuation of light from a pointsource and employing a wide field of view receiver.For those cases where receivers of less than 90° fieldof view were used, extrapolation by the investigatorhas been applied. To permit a more effective com-parison of the results, Tt or T2,r is derived in terms ofthe general expression of
T = exp(-aD)(1 + H)
under different atmospheric and environmental con-ditions. Comparisons of H vs aD are also included.
A summary of the quantitative transmittance re-sults of tests conducted by various investigators inthe field is included in Table II. Most of the resultsapply to much the same general atmospheric and en-vironmental conditions, i.e., cloudless skies, light orno haze conditions, and low or negligible groundalbedo. Such results are shown in Fig. 1, except forcurve 8, which includes fog and through-cloudstransmission.
Gibbons's" theoretical results for a hazy atmo-sphere, i.e., curve 1 of Fig. 1, are also included forcomparative purposes. His theoretical relationshipsshow that
H = scattered-in radiation/direct radiation
= 27rgKaD exp(aD)f f {[B(o) exp -o+ o+
(R + R2)aD] sin4 cos4ldR2d/R 2,
where g = the surface albedo effect, K is a propor-tionality constant for a specific type of atmosphere,B(0) is the phase or angular scattering function, aDis the optical path or thickness,
R ri/D and R2 r2 /D,
where r1 is the distance from the source to the scat-tering volume, r2 is the distance from the scatteringvolume element to the receiver, D is the distance be-tween the source and receiver, i = angle betweenthe scattered ray into the receiver and the straight-line distance between the source and receiver, and T= one-half of the receiver field of view. For a hazyatmosphere Gibbons derives the phase function B(4)= 1 + 9 cos16(0/2).
The several quantitative results obtained with thesource between overcast skies and a ground of highalbedo are graphically shown in Fig. 3. Peak trans-mittances exceeding that under vacuum conditions,or in a nonattenuating atmosphere, appear as a nor-mal occurrence for relatively short horizontal ranges.It is especially noteworthy that transmittances ashigh as 300% may occur under such atmospheric and
July 1973 / Vol. 12, No. 7 / APPLIED OPTICS 1483
Table II. Summary of Transmission Measurements
Investigator & General weather &organization Test area environment conditions Quantitative results
Ref. 1, U.S. NavalResearch Lab
Ref. 2, U.S. NavalResearch Lab
Ref. 3, U.S. NavalRadiological DefenseLaboratory
Ref. 4, U.S. NavalRadiological DefenseLaboratory
Ref. 5, U.S. ArmyElectronics Command
Ref. 6, TechnicalOperations Inc.
Ref. 7, U.S. ArmyElectronics Command
Ref. 8, University ofMiami
Ref. 9, DefenseDefense ExperimentalEstablishment
Ref. 10, U.S. ArmyElectronics Command
Chesapeake Bay
Chesapeake Bay
San Francisco Bay
Yucca Flats, Nevada
New Jersey
New England
Greenland Ice Cap
Florida Everglades
Porton, England
Wisconsin-LakeMichigan
Clear skies, hazy, low surface albedo,source to receiver distances (D)< 16 km. Horizontal pathmeasurements near water surface.
Cloudless and generally low met.range conditions, low surfacealbedo D < 3 km. Horizontalwater surface.
Clear skies, hazy, low surface albedo,D < 30 km. Horizontal pathmeasurements near water surface.
Clear skies, good to excellent met.ranges, low ground albedo D < 30km. Horizontal path measure-ments near ground surface.
Clear skies, hazy, low and highground albedo D < 3 km. Slantpath measurements with source150 m above ground level receiver.
Haze, fog, through clouds, low andhigh ground albedo, D < 15 km.Short range, slant path measure-ments from air to ground.
Clear skies, cloudy, fog patches,water fog, ice fog, and snow, highground albedo, D < 7 km. Hori-zontal path measurements withsource 30 m above ground levelreceiver.
Clear skies, hazy cloudy, low groundalbedo, D S 12 km. Horizontalpath measurements near groundlevel.
Haze, mist, fog, clouds, low and highground albedo, D < 30 km. Hori-zontal path measurements nearground level.
Clear skies, haze, light snow, clouds,low and high ground albedo. Airto ground, long range slant pathmeasurements.
T2, (Extrapolated) = exp (-aD){l +0.5[exp(aD)-1] } where aD < 2.4.NOTE: 2-7r= subscript refers to a2-7r sr or a 180° planar field of viewreceiver.
(1) T2, = exp(-aD)[1 + 21 exp(0.96aD)] for the low albedo case, where0.60 <aD < 1.2.
(2) T2, = exp(-aD)[1 + 6.8 exp(2.8aD)] for the high albedo casewhere 0.60 < aD < 1.2.
(3) T 2 = exp(-aD)[l + 6.8 exp(2.8aD)] for the low and high albedocases where 0 < aD < 0.60C2lea exp(-aD)(1 + .3e0x5Del -m.eD)
See Fig. 2. No well defined, singleexpression could be determined dueto frequent local weather instabilities.Some evidence present, however, ofhigh enhancement factors in the pres-ence of clouds and a high groundalbedo.
T2,, exp(-aD)[exp(0.58aD)}, whereH = exp(0.58aD) - 1 and 0.025km- < a < 0.11 km-' for the clearskies case. No transmission equationcould be determined for cloudy skiesdue to a lack of cloud. uniformity inthe local area.
T,6-= exp(-aD)[exp(0.55aD)], whereH = exp(0.55aD) - 1 and 0.40 km-'
a < 8.0 km for the cloudless lowalbedo case. In presence of cloudsand high ground albedo the enhance-ment factor reaches peak value ofabout 500% (Fig. 3).
T2,, = exp(-aD)[exp(aD/2)], where H= exp(aD/2) - 1 and 0.02 km-' <a 0.20 km-' for clear skies andhaze conditions. In the presence ofclouds and high ground albedo theenhancement factor reaches a peakvalue of about 500% (Fig. 3).
a Derived by I. Cantor from the data obtained by Hiser et al.
1484 APPLIED OPTICS / Vol. 12, No. 7 / July 1973
11 hELD OF VIEW RECEIVER /INITE .iIT
10
2' 3
2
24
a04
'- I--'-
In a
/ LEGEND
i. Gibbons (Theoretica)2. G ibbons Empirica - San Francisco Bay Area)3. Gibbons (Empirical - Nevada Desert Area)4. Stewart & Curcio (Seni-Empirical - Chesapeake
Bay Area)5. Duncan Semi-Empirical - Chesapeake Bay Area)6. Cantor (Empirical - New Jersey)7. Lane Empirical - orton, England)B. E dridge & Johnson (SemI-Empirica1 - New England)9. 1-ser & Cantor (Empirical - Florida Everglades)
I0. Cahill t a). (Semi-Empirical - Curve 2 ofCah11 Curves)
11. Cantor & Petrie (Empirical - Wisconsin)
1.5 2.0 Z. JD 3.5 0aD (OPTICAL THICKNESS)
Fig. 1. H vs aD (for various environments).
0D
ARCTIC GREENLANO(iV A.9-1.oI FOG V. 0.8 m
Vie2 FOG PATCHES, OVERCAST 0.6 km
3 8/1 CLOUDS ATLIGHT GROUND FOG, V 1.5
4 FOG+LIGHT SNOW, V- 0.8 km
5 ICE FOGV km
6 ICE FOG, V .5 - 3 km
7 CLEAR, V > 20 O
NEW JERSEY (IV)
8 NO CLOUDS, HAZY A 0.2V = 12 k IOC .- DEC)
9 NO CLOUDS, HAZY. A;O.5v 8 (JAN.-FEB.)
II ___ I I a I I I
1.0 2.0 3.0 4.0 5 0a X D (OPTICAL THICKNESS)1
Fig. 2. H vs aD for Greenland and New Jersey.
ground conditions. The geometry between source,clouds, ground, and target, as well as the attenua-tion properties of the atmosphere, affect the rela-tionship of the transmittance vs distance.
B. Theoretical and Semi-Empirical EvaluationsThis section of the report is an attempt to summa-
rize the recent theoretical and semi-empirical as-pects concerning the atmospheric transmission for apoint source.
Transmission of thermal radiation through theearth's atmosphere is largely dependent on the con-centration and size distribution of suspended liquidand solid particles in the troposphere, called aero-sols. The extent to which these aerosols are presentdepends largely on meteorological and climatic con-ditions. In addition, large concentrations of watervapor in the troposphere significantly affect the NIRtransmission. Such parameters can be convenientlyexpressed for model atmospheres as has been done intabular form later in the report.
1. J. P. Cahill, et al.12
Four model atmospheres are derived for the fol-lowing with distances 30 km and with the sourcelocated at the surface, 1.5 km, and 9 km above thesurface.
(a) Wet tropics-cloudless, moderate to high me-teorological ranges and low surface albedo.
GI 616ONS et of "UENPIRICAL)SOURCE HEIGHT AT 2 METERS ()MET. RANGE > 25 km
GROUND ALREDO-O.Io LANE
9) (EMPIRICAL)
SOURCE HEIGHT AT R METERS ()mEr. RANGE ABOUT 6km
GROUND ALBEDOO.9O CANTOR PETRIW(1
01EMPIRICAL)
SOURCE HEIGHT AT 510 METERS (m)jOml. RANGE >25 km
GROUND ALREDO-0.6+ LITE-M CODE"()
MODEL AFTERNOON TROPICAL ATMOSPHERESOURCE HEIGHT AT I km
MS. RANGE - 25 kmGROUND ALUEDO * 0.9
CODE)
HORIZONTAL RANGE km)
Fig. 3. Cloud effects on total transmittance.
July 1973 / Vol. 12, No. 7 / APPLIED OPTICS 1485
.9
!I-
S
M2Mt=;MI?t:9t;�1_
Mt�
M
t
10
ID
0
WT WTWT DRY DRYTROPICS TEMPERATE TEMPERATE ARCTIC
MDD.RANGE (Mi) 10 2 10 50
ALBEDOII 20 0 20 100
PPTE H2O(CM) 14 14 0.5 0.5
(3 / EFF BURST ALT 1.5 km
0.5 10 1.5 2.0 2.5 3.0 3.5aX D (OPTICAL THICKNESS)
4.0
Fig. 4. H vs aD (derived from Cahill et al.).
(b) Wet temperate-cloudless, low meteorologicalrange, and low surface albedo.
(c) Dry temperate-cloudless, moderate. meteoro-logical range, and low surface albedo.
(d) Dry arctic-snow surface or 100% cloud un-dercast, moderate to high meteorological ranges, andhigh surface albedo.
Figure 4 shows a plot of H vs aD for four modelatmospheres as derived by Cahill et al. from theirtransmission vs horizontal range curves for the situa-tion involving a 1.5-km height source and a ground-based target. Curve 2 of Fig. 4 is also included forcomparison purposes in Fig. 1.
2. Gibbons's Simplified Formula,13 the URS Com-puter Program, 14 and LITE Code15
Gibbons's generalized formulas are greatly simpli-fied versions of his previous investigations, which arederived to apply to three basic cases:
Case A: H.O.B. (height of burst or source alti-tude) 0.4 km wherein
T2,= exp(-2S/V)(1 + 1.4/V),
where S = slant range, and V = met. range atground level and assumed in this case to be = 2/a,where a is the direct attenuation coefficient for 0.65A. This equation can then be expressed as
T2r= exp(-aD)(1 + 0.7aD),
which is to apply for cloudless skies, low surfacealbedo, and S = 72 km. This is essentially the sameequation obtained in the San Francisco Bay area andshown in Fig. 3.
Case B: H.O.B. 0.4 km (cloudless skies,ground-level met. range = 19 km, low surface albe-do):
T2 = exp[ - (ah)S/h],
where exp(-ah) is the optical thickness of a verticalpath from the surface level to an altitude h for 0.65-puwavelength and where S/h is a dimensionless param-eter depending on the ratio of the slant path to thesource altitude. Therefore,
T2,, = exp(-ah x constant),
which neglects the discrete scattering properties ofdifferent atmospheres.
Case C: Atmospheric situations other than thatof Case A or Case B, i.e., those not involving clearsky conditions, were classified by Gibbons in threegeneral categories, namely (1) off-surface cloud orhaze layer with the fireball below it, (2) off-surfacecloud or fog or haze layer with the fireball above it,and (3) off-surface cloud or haze layers with the fire-ball between them. For such conditions, modifyingconstants are applied that depend on the general at-mospheric category, ground-level met. range, andwhether a low or high surface albedo is present.
These Gibbons's formulas are applied in the URSComputer Program. Comparisons with LITE code'5results reveal significant differences.
3. LITE Codes'5"16"17
Monte Carlo methods designated as LITE-I,LITE-il, and LITE-III codes were developed duringthe 1964-1967 period'5 "16 to study the atmosphericeffects on the transport of light under different at-mospheric and environmental conditions. LITE-Icode treats monochromatic light transfer from apoint source in a scattering-type atmosphere, LITE-II treats a planar light source in a scattering-typeatmosphere, and LITE-Il treats a point light sourcein a scattering-and-absorbing-type atmosphere. Thecodes have been written in both ALGOL and FOR-TRAN IV languages.
The codes show sufficient flexibility to calculatemultiple scattering and absorption effects in any re-alistic, parallel-layered atmosphere in which air den-sity and aerosol size distribution vary independentlyand arbitrarily with altitude. In addition, provisionsare included for taking reflections of the ground andclouds into effect with an albedo method.
Some comparisons of the LITE I code calculationswith the measurements show the feasibility of MonteCarlo code techniques toward the solution of compli-cated transmission problems in real atmospheres.For example, Wells et al. of Ref. 14, i.e., Fig. 2 and3 of volume 1 (not included in this report), show theresults of such a comparison. Their results, i.e., in
1486 APPLIED OPTICS / Vol. 12, No. 7 / July 1973
20
4zlToa: z
Z Sa a
"I-
. a:en (a
. @ I * I t | * IO . . . . x . . .V _
0.1
0.6
40.5
DIRECT0.4
0.3
GISBONS
0.2
0 2 4 6 8 10 12 14 16 IS 20 22 24 26 28SEC e * S/h
Fig. 5. Atmospheric transmission for an air burst.
Fig. 2, are compared with field test total transmis-sion measurements in Wisconsin involving clearskies, partially covered snow surface, high meteoro-logical range, and a low altitude source. The calcu-lated falloff slope of the total transmittance withslant range is in good agreement with the measureddata. Moreover, the authors's calculations, i.e., Fig.3, are also compared with Wisconsin field tests in-volving similar atmospheric and ground conditionsas in Fig. 2, but with the addition of overcast cloudsnear and above the source. Close agreement isshown between the calculated and measured totaltransmittance values.
Figures 5 and 6 reveal the extent of the variationbetween Gibbons's simplified transmission formulasand that computed by the Monte Carlo LITE-I code.The semiempirical equation proposed by Gibbons,i.e.,
T2, = exp[ - (ah) secd]
(where secO = S/h with S being the slant range be-tween source and target and h the source altitude),is evaluated using the same mean free path distanceah between the ground and the source as is used inthe LITE-I calculations for a wavelength of 0.65 ,where
ah = fh=07m a(h)dh.
The LITE-III calculations are applied to the fol-lowing thirteen source wavelengths: 0.35, 0.45, 0.55,
0.7, 0.9, 1.07, 1.22, 1.39, 1.61, 1.88, 2.2, 2.85, and 3.5g over source altitudes of 1 km, 9 km, and 50 km andhorizontal ranges of 0 km, 15 km, 30 km, 60 km, and90 km. The results of the calculations are then inte-grated over source wavelength distributions forblackbody sources with temperatures T between 2000K and 9000 K to determine the transmittance as afunction of blackbody temperature. The transmit-tances are then integrated over blackbody tempera-ture and power emission distributions for a represen-tative nuclear weapon air burst. Calculations aremade using nuclear weapon graphical fireball datapresented by Cahill et al.'2 The characteristic timedistributions of the fireball temperatures are definedas a function of scaled time t/t'max, where t'max isthe elapsed time from nuclear detonation to the oc-currence of the second thermal maximum. The re-lationship applied is of the following form: T(-) =cT1(71) + C2T2(T2) + . . . cT,7(i-n) wherein T(-) isthe transmissivity for the wavelength distribution atblackbody temperature and the constants are thefraction of the emitted radiation during the time in-terval when the source has a maximum temperatureof max-
The transmittances of the scattered thermal radia-tion T for different slant ranges are computed bythe LITE-III code from the relationship,
i2=8
T,(secO,T) = 4D 2 ZN(xj, r) F(X, secG)i1 -1
for each of the maximum blackbody temperaturesindicated in the Cahill et al. T(r) expression. D =slant range between source and receiver, N(Ai,(r) isthe fraction of the radiation flux emitted by a black-
I
, 1
i
Fig. 6. Transmittance vs horizontal range (Wells et al.).
July 1973 / Vol. 12, No. 7 / APPLIED OPTICS 1487
: ~~~~~~~~~~~~~~///
-~~~~~~~1 4.0K
I 2 121 K
/-1~~~~~~~~~~X/,'
9 5y,' 20.1 /
// ~~~4. 32. 2 Km
> ^t S~~~~. 48.3 Km
- |E0 aEOoJ
2 4 6I , ,I I I I i
8 10 12 14 Is 0
a X D (Opti
I I I I I I A
2 4 6
cal Thickness)a 10 12 14 16
Fig. 7. H vs aD (A = 0.45,u) (derived from Wells et al.).
body at temperature r in each of eight selected wave-length intervals varying from 0.20 ku to 4.0 A. Thequantity F(Xi, secO) is the scattered radiation fluxreaching a receiver with a 2-7r or 180 degree field ofview, i.e., flat plate type receiver, at a given rangefor light radiation with wavelengths in the ith wave-length interval.
The direct transmittance for maximum blackbodytemperature r and slant range D = 0.8 secO is com-puted by use of the expression:
i2=14
To(secO, )!= E IN(Xi, r),exp[-ah(X / secO)]Tw5(XisecO)1,i,-1
where N(Xi,-7) is the fraction of the radiation fluxemitted by a blackbody at maximum temperature -rin the ith wavelength interval, (ah) is the extinctionor attenuation mean free path distance from groundlevel to the source altitude, neglecting water vaporabsorption, and T(X 1,sec6) is the transmissionthrough the water vapor along the source-receiverslant range for the ith wavelength interval and slantrange corresponding to secO. Fourteen wavelengthintervals, from 0.2 A to 4.0 A, are used for evaluatingthe direct transmission.
The large differences that occur between Gibbons'and the LITE-I code transmission results are due to
1488 APPLIED OPTICS / Vol. 12, No. 7 / July 1973
10
, 1
1=
- -
C-
1
100
ALIEN- 0
I
the omission of the scattering-in component in theGibbons simplified formula for H.O.B. >0.4 km.This effect would be particularly significant for allheights of burst about 0.4 km with relatively lowmet. ranges and also for cases where the met. rangesare good and where ground zero distances are longer.This is evident in Fig. 5 and 6.
Graphs of H vs aD (Figs. 7 and 8), derived fromthe LITE-I code computations,' 5 reveal the sharpdependence of H on aD as well as on the wavelengthand the distance. The computations are made withthe following considerations: The cross sections forRayleigh scattering and ozone absorption are takenfrom Elterman' 8 plus the addition of aerosol parti-cles with number densities of 300, 4600, and 9200
104
.02
101
I,
particles per cubic centimeter at sea level air densityand a size distribution as defined in Diermendjien'sHaze C model for continental aerosols. The verticaldistribution of the aerosol particle concentration wasassumed to be the same as that formulated by Elter-man9 from field measurements reported by Penndorfand by Chagnon and Junge.
Figure 9 shows H vs aD applying the LITE-IIIcode,'7 for several of the model atmospheres de-scribed by Collins et al.' 6 Tables III, IV, and V in-dicate the average characteristics of such atmo-spheres. A common shape, showing a steep rise fora relatively small optical thickness, followed by aless steep rise with increasing optical thickness, ischaracteristic of these curves. No curves are shown
l03
W/
- X ' /// ~2C50' SOURCE ALT
' jt /88// / ~2. 121 l N1I I / , / 'L 20.1 lil
' /1//,/ ~~~~4. 32. 2 KN
AlB EDO .9
P~~~~~~~~~~~~~~~~~
F , , , s , ,~~~~~~~
.2
m0
0 2 4 6 8 I 12 14 16 0 2a D (OPTICAL THICKNESS )
/X
/1
4
- ~ ~~~I !
/ / /
I /
I //
I
4 6 a 10 12 14 i6
Fig. 8. Hvs aD (X = 0.70 u) (derived from Wells et al.).
July 1973 / Vol. 12, No. 7 / APPLIED OPTICS 1489
- - -l E E E
ti
l
Table IV. Model Atmosphere (Collins et al.16)Midlatitude (450N)
Table V. Model Atmosphere (Collins et al.16) Arctic
(1) Surface met. range of 200 km.(2) Snow-covered surface to 0.80 neutral reflectance in the 0.40-
0.90-, range. From 0.90 ,u to about 4 u assume a monotoni-cally decreasing reflectance coefficient with increasing wave-length so that at 0.9ju the reflectance = 0.80 and at 3 u = 0.01.
(3) Rayleigh distribution with negligible absolute humidity.(4) Assume following altitude distribution:
Altitude
Size distribution profile
Haze: vertical distribution according to the Elterman model andwith two assumed, prevailing haze concentrations and met.ranges during morning and afternoon:
Morning AfternoonN(r) ;: r-1-5 N(r) r-5Ground met. range 3 km Ground met. range 25 km
for the low met. range models since insufficient cal-culations are available. In the case of a high met.range model, it is noteworthy that the rise is verysteep up to an optical thickness of about 0.4, where-as beyond about 0.5 there is little change. More-over, variations in ground albedo can account forvariations in H of as much as about 75% as evidentfrom the arctic case at an optical thickness of about0.4.
Further results from the LITE-I code calculationsare indicated in Fig. 10-15. They show the signifi-cance of essential parameters such as scattering crosssection, cloud height, albedo, wavelength, and dis-tance. Figure 3, shown previously, compares someLITE-III code results for clouds with the empiricaltransmission results of Gibbons, Lane, Cantor, and
1490 APPLIED OPTICS / Vol. 12, No. 7 / July 1973
1 0.1
z0
I-
-
zhI
z
R
1'
2
o 0.1 0.2 0.3 0.4 0.5ATTENUATION COEFFICIENT (km-')
Fig. 10. Variation of 4irD2 times scattered and total intensitieswith aerosol cross section for several ground ranges: 0.45-ju light
Fig. 12. Variation of 4rD2 times the direct and total intensitieswith horizontal range for various aerosol scattering models: 0.45-i
light (LITE-I code) (Wells et al.).
0.6 0.7
Fig. 11. Variation of 47rD2 times scattered and total intensitieswith aerosol cross section for several ground ranges: 0.70-Y light
(LITE-I code) (Wells et al.).
Petriw. The further importance of the relative posi-tion of the point source with respect to the base ofthe cloud overcast as well as the met. range betweenthe cloud base and the ground surface is indicated inFig. 3. However, it is particularly noteworthy thatpeak transmission values of about 300% can occurunder a proper combination of cloud and groundalbedo conditions. This would signify a value ofabout 500% for the H factor with the effective met.range of about 30 km.
The LITE codes display further versatility in
0 10 20 30 40HORIZONTAL RANGE Imn)
so
ERSRS
60 70
Fig. 13. Variation of 4rD2 times the direct and total intensitieswith horizontal range for various aerosol scattering models: 0.70-A
light (LITE-I code) (Wells et al.).
July 1973 / Vol. 12, No. 7 / APPLIED OPTICS 1491
I0' ~ ~ I
AEROSOL SCATTERING MODELo HAZE MO HAZE C
\ RAJLEIGH
GROUNDD ALBEDO.0SOURCE ALTITUDE 808 MEERSRECEIVER ALTITUDE * 6 TERS
TOTAL
SOU E
DIRECT S SLANT RANGE
SOURCE ALTITU RECEIVER
GROUND HORIZONTk RANGE
l - ~ - - - -
, GROUND ALBEDO * 0.0- SCATTERED GROUND RANGE (km)
4
20
4848
2 0.1 0.2 0.3 0.4 0.5 0.6 0.7I ITOTAL -
4
12
203248
AEROSOL SCATTERING MODELIJHAZE C
RAYLEIGH
GROUN ALBEDO- 0.0SOURCE ALTITUIDE. 808 METRECEIVER ALTITUDE * 6 METE
DIRECT,
'0 -_ __ _ __ _ ____ ____
4, , . . , . .
21121
IIIIIIoIIE
I
t:
z
mI
lb1.
't
I
,^o
IIIIIIIffIIIE
I'_
zw
z
L.2I'_
I
_ GROID ALBEDO = 0.0iE_ SOUR E ALTITU E = 808 hi _RECEIVER ALTIUDE = 6 m
HORIZONTAL RANGE DRECTkm 1INTENSITY
>_ t ~~~~~~~~~4 B5T5NIO' E ID-_ (P.- c e photo)
12 2.ajXW'
*10-@° _ ~ 20
32 .40B10-12
48 1. 24 B IO-
10-1.0 _ 2// ~0 IO@ 2 3 4K 6 7
CLOUD BASE HEIGHT (km)
Fig. 14. Dependence of the scattered intensities from a pointisotropic 0.55-u source on cloud base height (Wells et al.).
being readily able to take into account the differentorientations of the receiver with respect to thesource. The significance of this orientation parame-ter, as well as the source altitude parameter, isshown by Wells et al. 17
4. Riley's General Transmission EquationsA mathematical analysis by Riley' 9 of the field
work of Eldridge and Johnson," Gibbons et al.,413'20 Lane,9 and Cantor and Petriw,7 resulted in thefollowing approximated expressions:
a = f( V, overcast height, climatic region);= a varying coefficient that depends on clear
sky, cloudy, high or low overcast, fog, and/or snow conditions;
-y = a varying coefficient that depends on clearsky conditions, degree and height of cloudi-ness, and ground fog;
k = F( V, overcast or nonovercast conditions).
The transmission is, as normally defined, the ratioof the total irradiance at a certain distance from anisotropic source, in the presence of a scattering andan absorbing medium, to the irradiance from thesource at the same distance in a nonattenuating me-dium or vacuum.
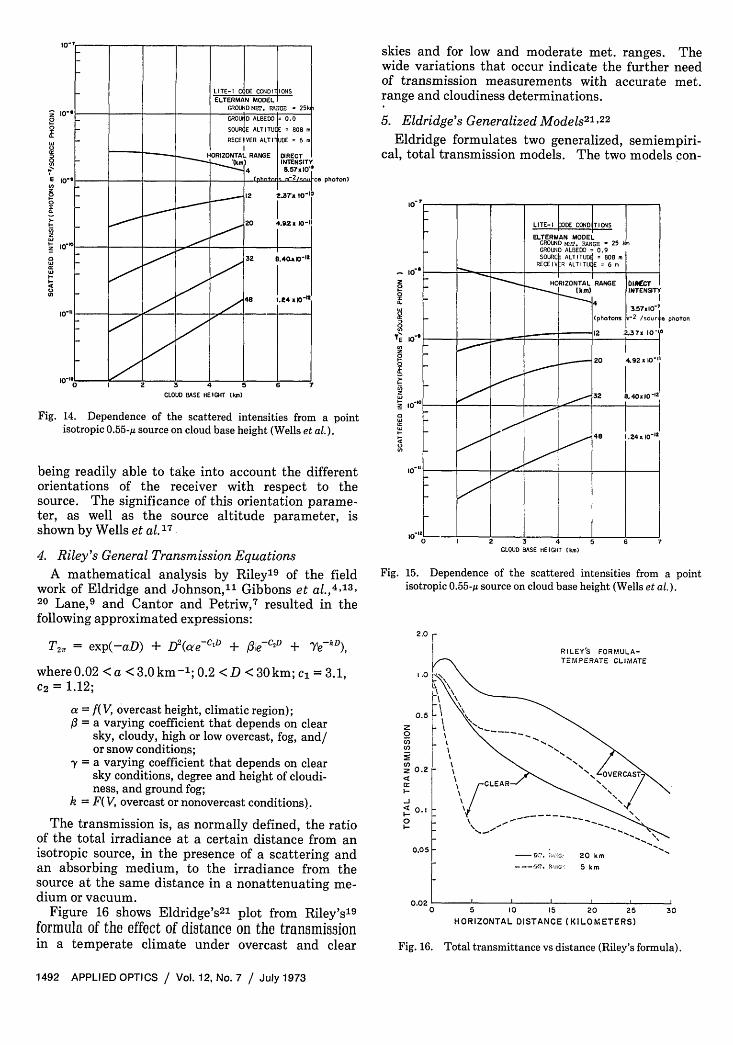
Figure 16 shows Eldridge's2' plot from Riley's'9
formula of the effect of distance on the transmissionin a temperate climate under overcast and clear
skies and for low and moderate met. ranges. Thewide variations that occur indicate the further needof transmission measurements with accurate met.range and cloudiness determinations.
5. Eldridge's Generalized Models21 22
Eldridge formulates two generalized, semiempiri-cal, total transmission models. The two models con-
Fig. 15. Dependence of the scattered intensities from a pointisotropic 0.55-,u source on cloud base height (Wells et al.).
2.0
I .0
0.5z0U)U,0
z 0.2CO
Ix 0.1I-
0
0.05
0.020 5 10 15 20 25
HORIZONTAL DISTANCE (KILOMETERS)30
Fig. 16. Total transmittance vs distance (Riley's formula).
1492 APPLIED OPTICS / Vol. 12, No. 7 / July 1973
,. |
lo0
z
0< I -2
r,_
1
0 10 20 30 40 50DISTANCE 1 KILOMETERSI
Fig. 17. Total transmittance vs distance (Eldridge's haze mod-els).
sist of a hazy scattering medium with met. rangesgreater than 0.4 km and a foggy or cloudy scatteringmedium with met. ranges less than 1.0 km. Thehaze model is based on much of the same data asused by Riley, i.e., results of the following five re-searchers: Steward and Curcio,' Gibbons,3 Eldridgeand J. C. Johnson,6 Lane,9 and Riley.'9 The fogand cloud total transmission data of Eldridge andJohnson6 were used to determine the total transmis-sion model for fog or cloud. The experimental dataof Eldridge and Johnson, 2 3 Hewson,2 4 Neiburger, 2 5
and Atkins26 were used by Eldridge2l to determinethe magnitude of the fog or cloud model parameters.The last three sources of data, however, include thesun as a source and, therefore, are of limited valuefor point source applications.
The functions for the scattering coefficients aredependent on distance and the met. range that is ex-pressed in terms of the direct beam attenuation coef-ficient. For the transitional met. range region be-tween 0.4 km and 1.0 km, Eldridge points out that itis necessary to determine whether haze or fog orcloud prevails. Average values for the two modelsare recommended by Eldridge, however, should thisdetermination not be feasible.
Some of Eldridge's total transmission results areindicated in Fig. 17 as a function of distance througha homogeneous haze for several met. ranges varyingfrom 5 km to 40 km. The dashed curves refer to thecorresponding direct or collimated transmissions.Figure 18 shows the transmission vs distance
through a homogeneous fog or cloud for several met.ranges from 0.01 km to 0.5 km. The dashed curve isa reference to the direct transmission in haze for amet. range of 0.5 km. Figure 19 compares Eldridge'sresults in a hazy atmosphere of 20-km met. rangewith that of Riley's and Wells's LITE-IJI code calcu-lations wherein Wells applies the Elterman clear
1- ELDRIDGE'SFOG a CLOUD
10° MODELS
0.5 k (FOG OR CLOUD)
10C I
- \ \ 0.5 km sp0.001 kN
I- ~~~~~~~001 k.
I-
o ' 0.1m0.5 k MET. RANGE
IN HAZE
Io-3 IC I I _0 1.0 2.0 3.0
DISTANCE (KILOMETERS)
Fig. 18. Total transmittance vs distance (Eldridge's fog and cloudmodels).
1.0
0.5 - NX\\ MET. RANGE = 20 KILOMETERS
- WELLS' LTE-111 CODE
---- RILEY'S FORMULA
ELDRIDGE'S FORMULATION
0.2
\\ \
0.1
0.05 \, N
0.02-
0.01 C IL
0.01( ) 10 20 30 * 40 50
DISTANCE (KILOMETERS)
Fig. 19. Total transmission vs distance for different model atmo-spheres at a fixed ground met. range (Eldridge).
July 1973 / Vol. 12, No. 7 / APPLIED OPTICS 1493
standard atmosphere model, and Riley applies theempirical data for a temperate, cloudless environ-ment.
The very recent work of Wells and Bldttner2 7 pres-ents the results of Monte Carlo calculations of thescattering of the light emitted by point isotropicmonochromatic sources, i.e., 0.45-,u, 0.55-,u, and0.65-A wavelength sources in model atmosphereswith meteorological ranges of 3 km, 10 km, 25 km,and 50 km. The calculations were carried out forsource altitudes of 1 km, 2 km, 5 km, 20 km, and 80km with receiver altitudes at 0 km, 1 km, 2 km, 5km, and 10 km. The ground was treated as a Lam-bert reflector, and the scattered radiation was com-puted for ground albedos of 0.0, 0.1, 0.2, 0.3, 0.4, 0.5,0.6, 0.7, and 0.8. Scattered radiances were comput-ed as a function of the receiver polar and azimuthalangles, the ground albedo, and horizontal range forhorizontal ranges to 100 km.
Ill. ConclusionsThe following conclusions can be drawn from the
contents of this summary:(1) A relatively small spread of the transmission
enhancement factor curves, as shown in Fig. 1, oc-curs for a cloudless, hazy, scattering-type atmo-sphere for optical thicknesses up to about 0.8. Fair-ly accurate transmission predictions, i.e., within30%, can probably be made for this situation basedon optical thickness measurements with a white lightsource.
(2) Beyond an optical thickness of unity in acloudless, hazy atmosphere, however, multiple scat-tering becomes increasingly significant so that trans-mission prediction errors much greater than 30% canreadily occur.
(3) Overcast skies, particularly in the presence ofa high ground albedo, play a large role in enhancingthe total radiation reaching a target wherein trans-mittances as high as 300% and enhancement factorsas high as 500% may occur.* (4) The formulation of adequate transmissionequations for foggy and cloudy atmospheres requiresmore data.
(5) Absorbing-type atmosphere, such as occurs inmetropolitan areas where air pollution is common,requires much data.
(6) Atmospheres in which precipitation is occur-ring require additional data.
(7) The appraisal of the effects of topographicand large surface reflections requires additional data.
(8) The Monte Carlo LITE codes are useful toolsfor solving complex atmospheric transmission prob-lems once the atmosphere is properly identified andclassified by its significant parameters; namely, scat-tering and absorption cross sections vs altitude andwavelength, met. slant ranges, cloud conditions, andground albedos. With adequately known atmo-spheric parameters, the geometric aspects concerningthe source, target, and surroundings can then also betreated readily by the LITE codes.
(9) More effective transmission analyses could beprovided for different atmospheres and environmentsif parameters other than optical thickness are treat-ed, e.g., source height, slant range, met. slant range,ground and cloud albedo, effective wavelength,height and type of clouds (and to a lesser extent thecloud thickness), thickness and height of fog, densehaze, and precipitation with their size distributions.
(10) It will also be very useful in the long run ifsignificant correlations can be established betweenmet. slant range and ground or horizontal met.range. The ground level met. range, along withcloud and albedo conditions, may then be most con-veniently adopted as the most significant atmospher-ic and environmental parameters for determiningand predicting the total transmission under differentatmospheric and environmental conditions.
References1. H. S. Stewart and J. A. Curcio, J. Opt. Soc. Am. 42, 80
(1952).2. C. H. Duncan, "The Influence of Field of View on Measure-
ments of Atmospheric Transmission," Naval Research Labo-ratories Report 4917 (1957).
3. M. G. Gibbons, J. Opt. Soc. Am. 49, 702 (1959).4. M. G. Gibbons, J. R. Nichols, F. I. Laughridge, and R. L.
Rudkin, J. Opt. Soc. Am. 51, 633 (1961).5. I. Cantor, "Direct and Indirect Visible Radiation Yield from a
Point Source under Different Weather Conditions," U.S.Army Signal Research & Development Laboratory-2270(1962).
6. R. G. Eldridge and J. C. Johnson, J. Opt. Soc. Am. 52, 787(1962).
7. I. Cantor and A. Petriw, "Atmospheric Attenuation of LightRadiation from a Point Source in an Arctic Environment,"Tech Report ECOM-2453, Atmospheric Sciences Laboratory,U.S. Army Electronics Command, White Sands MissileRange, N. Mex. (1964).
8. H. W. Hiser, R. W. Robert, and C. L. Courtright, "Study ofLight Attenuation under Sub-Tropical Climatic Conditions,"Final Report, Contract DA36-039-AMC-03252E, University ofMiami (1966).
9. W. R. Lane, "A Summary of the Work on the AtmosphericAttenuation of Radiation at the Chemical Defense Experi-mental Establishment," Proceedings of the Meeting of PanelN2 in England, TTCP/N2/1/68, 25-29 March (1968).
10. I. Cantor and A. Petriw, Appl. Opt. 7, 1965 (1968).11. M. G. Gibbons, J. Opt. Soc. Am. 48, 550 (1958).12. J. 0. Cahill, H. P. Gauvin, and J. C. Johnson, "Effective
Transmission of Thermal Radiation from Nuclear Detona-tions in Real Atmospheres," Air Force Surveys in Geophysics144, Air Force Cambridge Research Laboratories-62-456(1962).
13. M. G. Gibbons, "Transmissivity of the Atmosphere for Ther-mal Radiation from Nuclear Weapons," U.S. Naval Radiolog-ical Defense Laboratory, San Francisco, Calif. (1966), AD641481.
14. C. Colvin and S. Martin, "Computer Program for EstimatingFree-Field Thermal Radiation Characteristics," ContractDASA 01-67-C-0103, Final Report URS Corp., Burlingame,Calif. (1967), AD 826160.
15. M. B. Wells, D. G. Collins, and K. Cunningham, "LightTransport In the Atmosphere," Vol. 1, Monte Carlo Studies,Vol. 2, Machine Codes for Calculations of Aerosol Scatteringand Absorption Coefficients, Vol. 3, Utilization Instructions
1494 APPLIED OPTICS / Vol. 12, No. 7 / July 1973
for the LITE Codes, Contract DA28-043-AMC-00240(E), Ra-diation Research Associates, Inc., Fort Worth, Texas (1966).
16. D. G. Collins, K. Cunningham, and M. B. Wells, "MonteCarlo Studies of Light Transport," Interim Report 2, Con-tract DA28-043-AMC-00240(E), Radiation Research Asso-ciates, Inc., Fort Worth, Texas (1967).
17. M. B. Wells, D. G. Collins, and J. D. Marshall, "Monte CarloCalculations of the Transmission of Thermal Radiation fromNuclear Detonations in Model Atmospheres," Contract DA28-043-AMC-00240(E), Final Report, Radiation Research Asso-ciates, Inc., Fort Worth, Texas (1969).
18. L. Elterman, "Atmospheric Attenuation Model 1964 in theUltraviolet, Visible and Infrared Regions for Altitudes to 50km," Air Force Cambridge Research Laboratories Environ-mental Research Papers 46 (1964).
19. G. F. Riley, "Empirical Determination of Scattered LightTransport through the Lower Atmosphere," Air Force Cam-bridge Research Laboratories Environmental Research Papers287 (1968).
20. M. G. Gibbons, F. I. Laughridge, J. R. Nichols, and N. A.Krause, "Transmission and Scattering Properties of a Nev-
ada Desert Under Cloudy Conditions," J. Opt. Soc. Am. 52,33 (1962).
21. R. G. Eldridge, "Some Recent Total Transmission Studies,"in Proceedings of the Meeting of Panel N2 TTCP/N2/1/68,England, 25-29 March (1968).
22. R. G. Eldridge, "A Long Range Thermal Transmission For-mula for Thermal Transfer," WP-2058, 2526 to be publishedby the Mitre Corp., Bedford, Mass.
23. R. G. Eldridge and J. C. Johnson J. Opt. Soc. Am. 48, 463(1958).
24. E. W. Hewson, Quart. J. Roy. Meteorol. Soc. 69, 47 (1943).25. M. Neiburger, J. Meteor. 6, 98 (1949).26. W. R. G. Atkins, Quart. J. Roy. Meteorol. Soc. 77, 659 (1951).27. M. B. Wells and W. G. Blattner, "Sky Brightness Calcula-
tions for 450, 550, and 650 nm Wavelength Point IsotropicSources in Model Atmospheres," Vol. 1: Description of Cal-culations, Vol. 2: Radiance Data for 450 nm WavelengthLight, Vol. 3: Radiance Data for 550 nm Wavelength Light,Vol. 4: Radiance Data for 650 nm Wavelength Light, Vol. 5:Scattered and Unscattered Flux Data. Contract N 60921-71-C-0053, Radiation Research Associates, Inc., Fort Worth, Texas(1972).
When crystals are grown on a substrate the structure of the substrate is often recognizable in their finalform. The photograph, taken at the Philips Research Laboratories, Eindhoven, The Netherlands, showshow crystal growth of this type can be controlled by deliberately giving the substrate a particular patternor structure. The forest of pillar-shaped crystals was produced by depositing cesium-iodide vapor on aflat gauze substrate. The mesh structure of the gauze governs the growth pattern of the entire crystal
forest. (Specimen prepared by A. L. N. Stevels and A. D. M. de Pauw; photograph by H. B. Haanstra.)