183
A t oll Gettin g Started-UMTS Version 3.1.0 Forsk China May 2011 Microwave Links WiMAX/BWA TD-SCDMA CDMA2000 1xRTT/EV-DO LTE UMTS/HSPA GSM/GPRS/EDGE Version 3.1

8/12/2019 Atoll Getting Started Umts 310 en v1 130228020806 Phpapp02
http://slidepdf.com/reader/full/atoll-getting-started-umts-310-en-v1-130228020806-phpapp02 1/183
AtollGetting Started-UMTS
Version 3.1.0
Forsk China
May 2011
Microwave Links
WiMAX/BWATD-SCDMA
CDMA2000 1xRTT/EV-DO
LTE
UMTS/HSPA
GSM/GPRS/EDGE
Version 3.1

8/12/2019 Atoll Getting Started Umts 310 en v1 130228020806 Phpapp02
http://slidepdf.com/reader/full/atoll-getting-started-umts-310-en-v1-130228020806-phpapp02 2/183
Atoll Getting Started UMTS Version 3.1.0
Table of Contents
1 Introduct ion .............................................................................................................. 4 2 Installation ................................................................................................................ 5 3 Sequence of operations .......................................................................................... 9
3.1 New project ................................................................................................ 12 3.2 Import of 3D maps ..................................................................................... 14
3.2.1 Import of heights map ......................................................................... 15 3.2.2 Import of clutter map ........................................................................... 16 3.2.3 Import of vector map ........................................................................... 20
3.3 Setting a coordinate system ...................................................................... 25 3.4 Network data setting .................................................................................. 30
3.4.1 Import of the Sites table ...................................................................... 31 3.4.2 Antenna parameters setting................................................................ 37 3.4.3 Transmitters parameters setting ......................................................... 42
3.4.3.1 Transmitters table ........................................................................ 42 3.4.3.2 Global Parameters ...................................................................... 46
3.4.4 Cells parameters setting ..................................................................... 49 3.4.5 Import and export ............................................................................... 53
3.4.5.1 Import Access database .............................................................. 53 3.4.5.2 Export to Access database .......................................................... 55
3.4.6 Add new sites ..................................................................................... 56 3.4.6.1 Add new sites one by one ........................................................... 56 3.4.6.2 Add a group of sites .................................................................... 57 3.4.6.3 Template management ................................................................ 59
3.5 Propagation model ..................................................................................... 61 3.5.1 SPM propagation model ..................................................................... 61
3.5.1.1 Import of CW measurement ........................................................ 61 3.5.1.2 Automatic calibration of the SPM model ..................................... 68 3.5.1.3 Model validation with CW measurements ................................... 72 3.5.1.4 Set the propagation model for each transmitter .......................... 77
3.5.2 Cost-Hata model ................................................................................. 79 3.5.2.1 Import of CW measurements ...................................................... 79 3.5.2.2 Automatic calibration of the Cost-Hata model ............................. 79 3.5.2.3 Cost-Hata model properties ........................................................ 82
3.6 Propagation matrix calculation ................................................................... 85 3.6.1 Preliminary work ................................................................................. 85
3.6.1.1 Resolution of predictions and receiver altitude ............................ 85 3.6.1.2 Setting the Computation Zone ..................................................... 86
3.6.2 Propagation and prediction studies calculation ................................... 92 3.6.2.1 Best server prediction ................................................................. 93 3.6.2.2 Coverage by Signal Level prediction ........................................... 96
© Forsk 2010 2/183

8/12/2019 Atoll Getting Started Umts 310 en v1 130228020806 Phpapp02
http://slidepdf.com/reader/full/atoll-getting-started-umts-310-en-v1-130228020806-phpapp02 3/183
Atoll Getting Started UMTS Version 3.1.0
3.6.2.3 Overlapping Zones prediction ..................................................... 99 3.6.2.4 Force calculation ....................................................................... 101 3.6.2.5 Prediction template management .............................................. 101
3.7 Simulation ................................................................................................ 103 3.7.1 Traffic model ..................................................................................... 103
3.7.1.1 Services .................................................................................... 103 3.7.1.2 Mobility Types ........................................................................... 105 3.7.1.3 Terminals ................................................................................... 106 3.7.1.4 User Profiles .............................................................................. 108 3.7.1.5 Environments ............................................................................ 108
3.7.2 Creating Traffic Maps .........................................................................110 3.7.2.1 User profile Traffic map .............................................................. 111 3.7.2.2 User profile traffic map - User profile densities ........................... 116 3.7.2.3 Sector traffic map -Throughputs in uplink and downlink ............. 118 3.7.2.4 Sector traffic map - Total number of users (All activity statuses) 124 3.7.2.5 Sector traffic map - number of users per activity status ............. 124 3.7.2.6 User density traffic map (no. of users/km2) ............................... 124
3.7.3 Simulation ......................................................................................... 131 3.8 Point analysis tool .................................................................................... 135
3.8.1 Profile ............................................................................................... 136 3.8.2 Reception ......................................................................................... 137 3.8.3 AS Analysis....................................................................................... 137 3.8.4 SC Collisions .................................................................................... 139 3.8.5 Details............................................................................................... 139
3.9 Other prediction studies ........................................................................... 140 3.9.1 Prediction parameters setting ........................................................... 140 3.9.2 Standard prediction studies .............................................................. 143 3.9.3 HSDPA ............................................................................................. 145 3.9.4 HSUPA ............................................................................................. 155 3.9.5 Dual-Cell HSDPA Modeling .............................................................. 161
3.10 Neighbours Allocation .............................................................................. 165 3.10.1 Automatic allocation ......................................................................... 165
3.11 Scrambling Codes Allocation ................................................................... 169 3.12 Other features .......................................................................................... 175
3.12.1 User configuration function ............................................................... 175 3.12.2 Store methods for path loss matrices ............................................... 178
4 Tips and tr icks ...................................................................................................... 179
© Forsk 2010 3/183

8/12/2019 Atoll Getting Started Umts 310 en v1 130228020806 Phpapp02
http://slidepdf.com/reader/full/atoll-getting-started-umts-310-en-v1-130228020806-phpapp02 4/183
Atoll Getting Started UMTS Version 3.1.0
1 Introduction
This document explains the entire process from the import of network data in Atoll to the
production of prediction studies. The purpose of this document is to give an overall
understanding for radio engineers, who never use Atoll.
This document does not explain the algorithm and don’t give detailed explanation. The
user may find in the “Technical Reference Guide” and “User Manual” the concrete
algorithm and the detailed explanation of parameters.
The user may find all projects and map data in the CDROM, which was provided with this
document.
This document describes how to get started using the Atoll version 3.1.0.
© Forsk 2010 4/183
8/12/2019 Atoll Getting Started Umts 310 en v1 130228020806 Phpapp02
http://slidepdf.com/reader/full/atoll-getting-started-umts-310-en-v1-130228020806-phpapp02 5/183
Atoll Getting Started UMTS Version 3.1.0
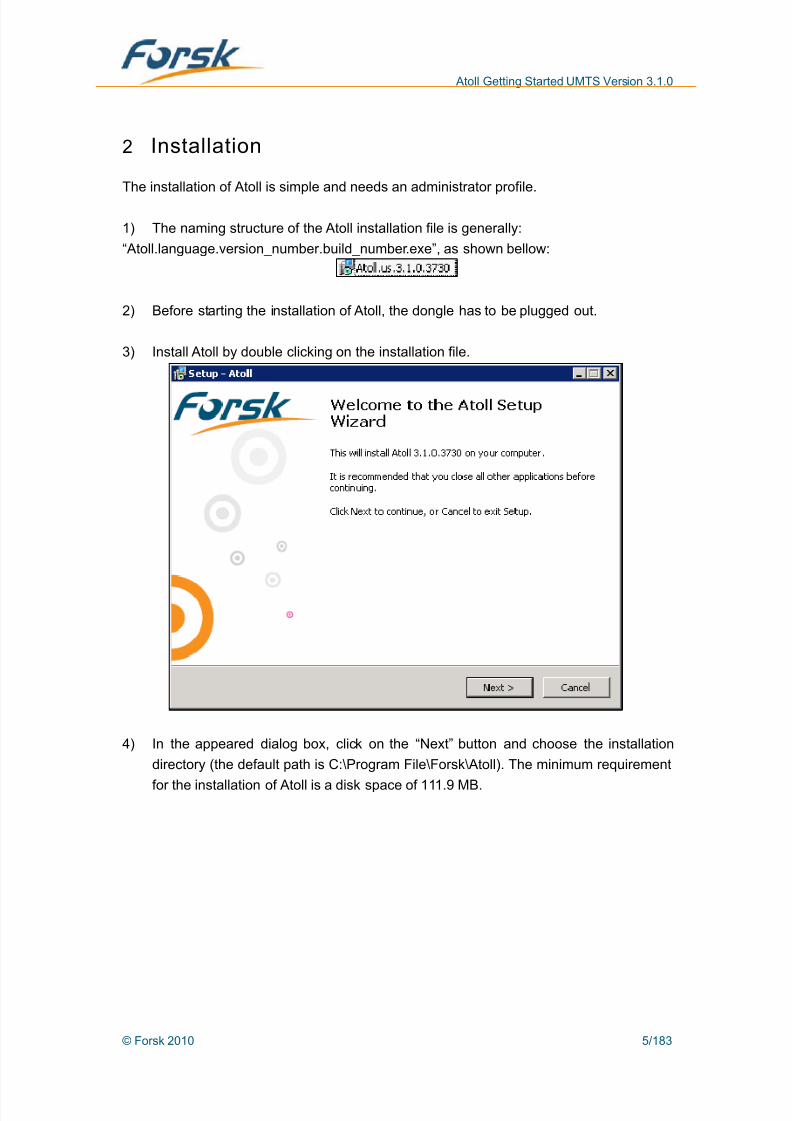
2 Installation
The installation of Atoll is simple and needs an administrator profile.
1) The naming structure of the Atoll installation file is generally:
“Atoll.language.version_number.build_number.exe”, as shown bellow:
2) Before starting the installation of Atoll, the dongle has to be plugged out.
3) Install Atoll by double clicking on the installation file.
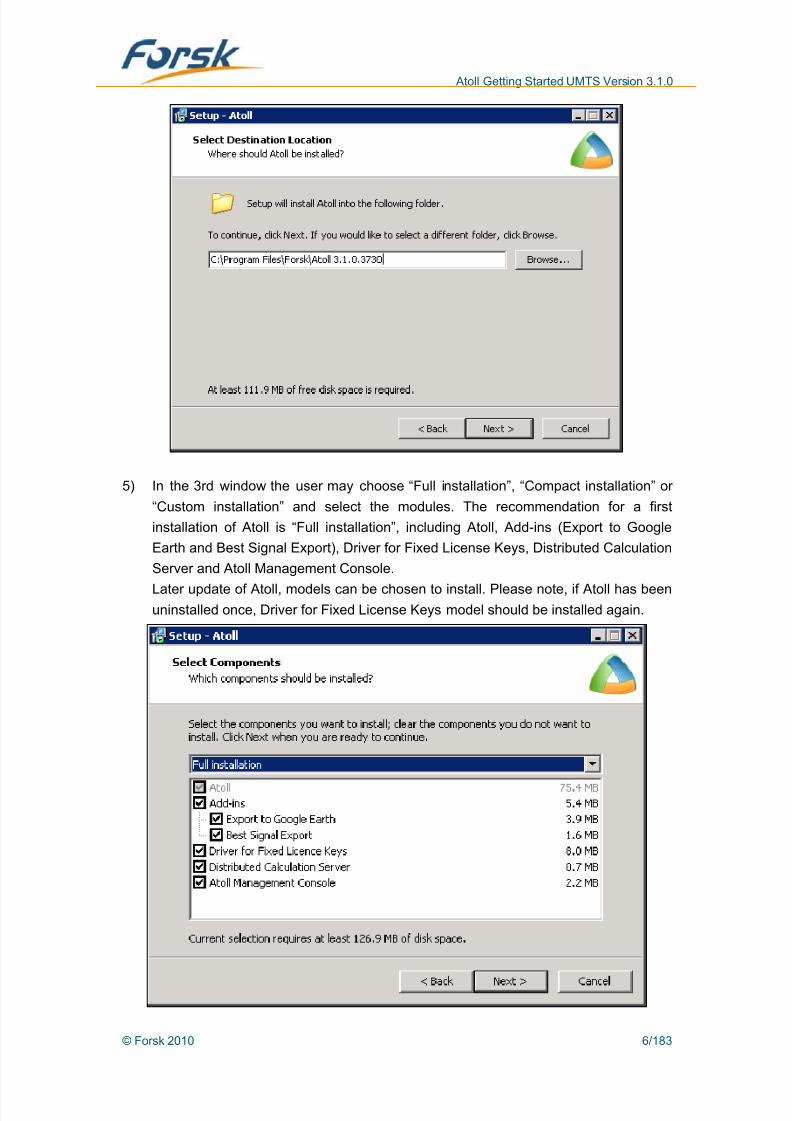
4) In the appeared dialog box, click on the “Next” button and choose the installation
directory (the default path is C:\Program File\Forsk\Atoll). The minimum requirement
for the installation of Atoll is a disk space of 111.9 MB.
© Forsk 2010 5/183
8/12/2019 Atoll Getting Started Umts 310 en v1 130228020806 Phpapp02
http://slidepdf.com/reader/full/atoll-getting-started-umts-310-en-v1-130228020806-phpapp02 6/183
Atoll Getting Started UMTS Version 3.1.0
5) In the 3rd window the user may choose “Full installation”, “Compact installation” or
“Custom installation” and select the modules. The recommendation for a first
installation of Atoll is “Full installation”, including Atoll, Add-ins (Export to Google
Earth and Best Signal Export), Driver for Fixed License Keys, Distributed Calculation
Server and Atoll Management Console.
Later update of Atoll, models can be chosen to install. Please note, if Atoll has beenuninstalled once, Driver for Fixed License Keys model should be installed again.
© Forsk 2010 6/183

8/12/2019 Atoll Getting Started Umts 310 en v1 130228020806 Phpapp02
http://slidepdf.com/reader/full/atoll-getting-started-umts-310-en-v1-130228020806-phpapp02 7/183
Atoll Getting Started UMTS Version 3.1.0
6) In the 4th window, fill in the “Domain”, “Username” and “Password” fields. If the user
doesn’t choose previously “Distributed Calculation Server”, then he doesn’t need to
fill in any information.
7) Click on the “Next” button to start the installation of Atoll. After the installation, the
computer needs to be restarted.
© Forsk 2010 7/183

8/12/2019 Atoll Getting Started Umts 310 en v1 130228020806 Phpapp02
http://slidepdf.com/reader/full/atoll-getting-started-umts-310-en-v1-130228020806-phpapp02 8/183
Atoll Getting Started UMTS Version 3.1.0
8) Plug in the dongle.
Atoll users need to pay attention for the following 3 points:
(1) It is recommended to plug in/out dongle when computer is shutting down.
(2) If it is not necessary, don’t change the computer date when using Atoll.
(3) If it still can not find the USB dongle driver after installed Atoll, please find andinstall the Sentinel Driver on Atoll installation path or download it as below:
http://www.safenet-inc.com/support/tech/sentinel.asp#
© Forsk 2010 8/183

8/12/2019 Atoll Getting Started Umts 310 en v1 130228020806 Phpapp02
http://slidepdf.com/reader/full/atoll-getting-started-umts-310-en-v1-130228020806-phpapp02 9/183
Atoll Getting Started UMTS Version 3.1.0
3 Sequence of operations
This following document presents how to establish an Atoll UMTS project and to carry out
coverage predictions, simulations and production of reports:
(1) Start a new project
(2) Import of 3D maps
(3) Setting the coordinate system
(4) Import of network data
(5) Propagation model selection and calibration
(6) “Best Server” and “Signal Level” coverage predictions
(7) Traffic Modeling
(8) Monte-Carlo simulation
(9) Calculation of other prediction studies(10) Production of reports
The operation flow chart is represented in the following figure (dashed line frames may be
chosen or not).
© Forsk 2010 9/183

8/12/2019 Atoll Getting Started Umts 310 en v1 130228020806 Phpapp02
http://slidepdf.com/reader/full/atoll-getting-started-umts-310-en-v1-130228020806-phpapp02 10/183
Atoll Getting Started UMTS Version 3.1.0
Drawing of the computation zone
N
Y
Essential data collection Propagation model selection
Import of 3D maps
Choice of coordinate system
Import of antenna patterns
Setting of BTS Equipments
and Channel Elements
Setting of the prediction properties
Cells table
Transmitter table
Site table
Transmitter
equipments (TMA,
feeder, BTS)
CW drive test
Model calibration
SPM model
selected?
Adjustment of
s ecial arameters
Best server
coverage
prediction
Start
© Forsk 2010 10/183

8/12/2019 Atoll Getting Started Umts 310 en v1 130228020806 Phpapp02
http://slidepdf.com/reader/full/atoll-getting-started-umts-310-en-v1-130228020806-phpapp02 11/183
Atoll Getting Started UMTS Version 3.1.0
Y
Y
N
Traffic model
adjustment
Traffic map
setting
N
Traffic modeling
User profiles
WCDMA
parameters setting
Environment
Terminals
Mobility
Services Monte-Carlo simulation
Does the traffic
model satisfy?
Calculation
Neighbour allocation
Calculation of other predictions
Commit of the simulation results
Export the calculation results
Do the calculation
results satisfy?
Scrambling code allocation
© Forsk 2010 11/183

8/12/2019 Atoll Getting Started Umts 310 en v1 130228020806 Phpapp02
http://slidepdf.com/reader/full/atoll-getting-started-umts-310-en-v1-130228020806-phpapp02 12/183
Atoll Getting Started UMTS Version 3.1.0
3.1 New project
After opening Atoll, click on or select File->Open.
The project templates dialog box will appear. Choose “UMTS HSPA” template.
Atoll opens a blank UMTS project. The new project already includes the default antenna
database.
© Forsk 2010 12/183
8/12/2019 Atoll Getting Started Umts 310 en v1 130228020806 Phpapp02
http://slidepdf.com/reader/full/atoll-getting-started-umts-310-en-v1-130228020806-phpapp02 13/183
Atoll Getting Started UMTS Version 3.1.0
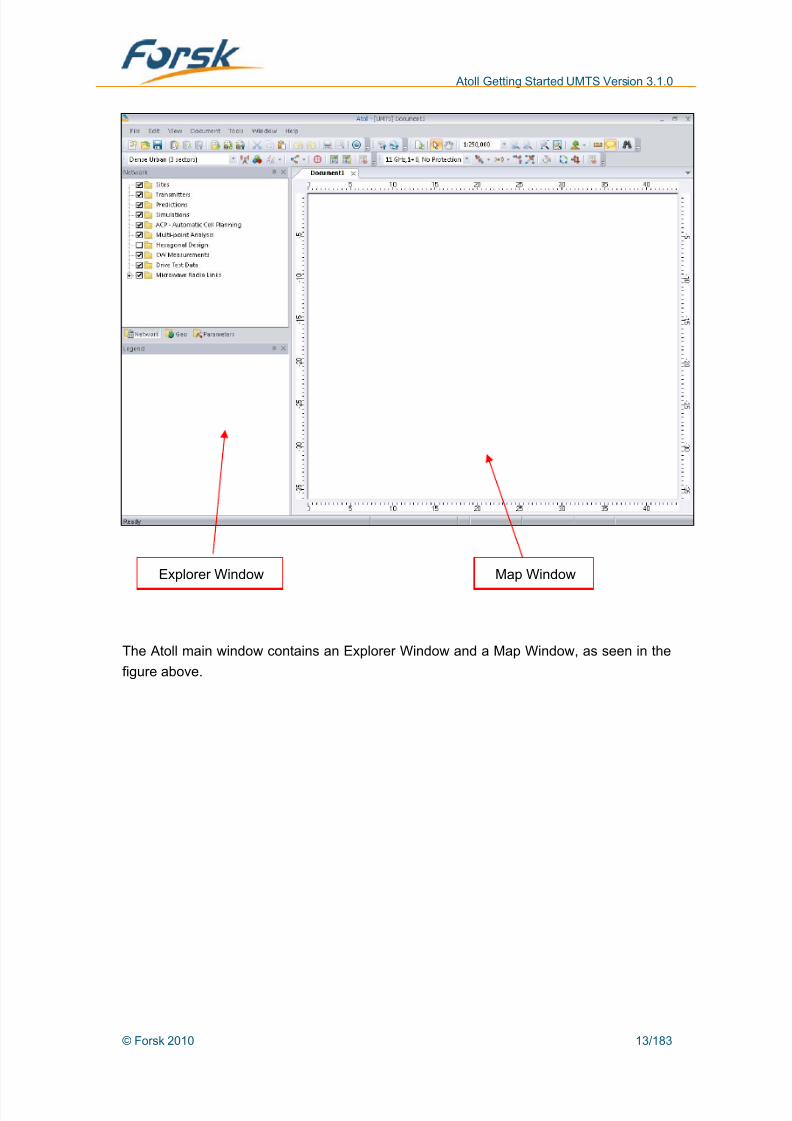
Explorer Window Map Window
The Atoll main window contains an Explorer Window and a Map Window, as seen in the
figure above.
© Forsk 2010 13/183

8/12/2019 Atoll Getting Started Umts 310 en v1 130228020806 Phpapp02
http://slidepdf.com/reader/full/atoll-getting-started-umts-310-en-v1-130228020806-phpapp02 14/183
Atoll Getting Started UMTS Version 3.1.0
3.2 Import of 3D maps
In the main tool bar, select “File->Import”.
In the appeared “Open” dialog box browse the geographical map folder.
© Forsk 2010 14/183

8/12/2019 Atoll Getting Started Umts 310 en v1 130228020806 Phpapp02
http://slidepdf.com/reader/full/atoll-getting-started-umts-310-en-v1-130228020806-phpapp02 15/183
Atoll Getting Started UMTS Version 3.1.0
Generally the following data maps need to be imported in Atoll: heights (map of the
altitude above sea level), clutter classes (type of land used) and vector (vector maps). The
order of import is not important, but, for this document, the following order will be used:
heights->clutter->vectors.
3.2.1 Import of heights map
1) In the “Open” dialog box, select the “Geo_Data\Brussels\Heights” folder in the
CDROM. Select the “index” document and click on “Open”
2) In the appeared “Data Type” dialog box, click on the “Altitudes” button and click “OK”.
© Forsk 2010 15/183

8/12/2019 Atoll Getting Started Umts 310 en v1 130228020806 Phpapp02
http://slidepdf.com/reader/full/atoll-getting-started-umts-310-en-v1-130228020806-phpapp02 16/183
Atoll Getting Started UMTS Version 3.1.0
3) After the map import, the following figure appears. The “heights” map is automatically
put on the left side in the explorer window under the “Geo” tab named “Digital Terrain
Model”
3.2.2 Import of c lut ter map
1) Select again “File->Import” in the main toolbar. In the “Open” dialog box, select the
“Geo_Data\Brussels\Clutterr” folder. Select the “index” document and click on “Open”
© Forsk 2010 16/183

8/12/2019 Atoll Getting Started Umts 310 en v1 130228020806 Phpapp02
http://slidepdf.com/reader/full/atoll-getting-started-umts-310-en-v1-130228020806-phpapp02 17/183
Atoll Getting Started UMTS Version 3.1.0
2) In the appeared “Data Type” dialog box, click on the “Clutter Classes” button and
click on “OK”
3) After the map is imported, the following figure appears. The clutter classes map is
automatically put on the left side in the explorer window under the “Geo” tab named
“Clutter Classes”
4) Double clicking on the “Clutter Classes” folder, open the “Clutter Classes properties”
dialog box for the setting of clutter parameters. Select the “Description” tab and click
on the bottom right “Refresh” button. Atoll will filter the clutter classes, which are notincluded into the clutter map. The following figure shows the filtered tab of clutter
© Forsk 2010 17/183

8/12/2019 Atoll Getting Started Umts 310 en v1 130228020806 Phpapp02
http://slidepdf.com/reader/full/atoll-getting-started-umts-310-en-v1-130228020806-phpapp02 18/183
Atoll Getting Started UMTS Version 3.1.0
classes.
The following parameters can be defined in the dialog box: Model Standard Deviation,
EC/Io Standard Deviation, DL and UL Eb/Nt Standard Deviation, Indoor Loss,
Orthogonality Factor, Indoor Loss, % Pilot Finger, Spatial Multiplexing Gain Factor
and Additional Transmit Diversity Gain.
Note: An additional indoor loss can now be defined per frequency band.
5) These values have to be set according to the customer network, if “Use only default
values” is chosen, Atoll will use default values for each clutter standard deviation.
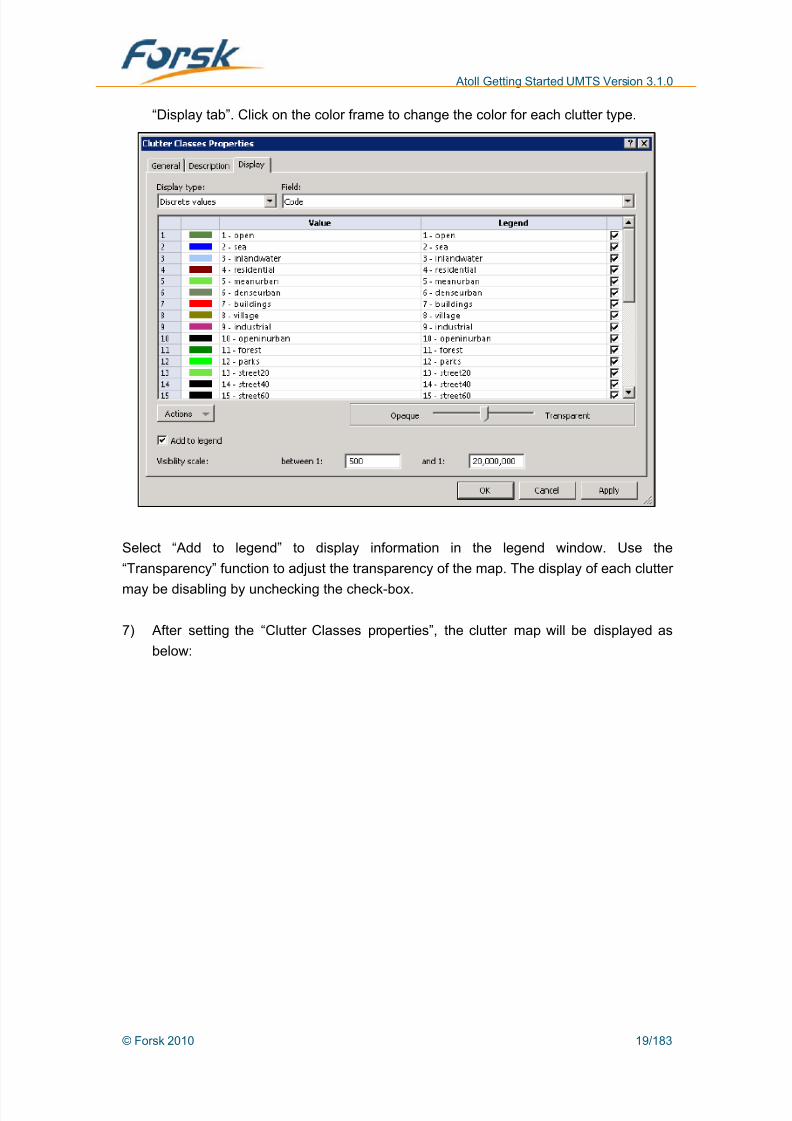
6) In the “Display” tab, adjust the display color of each clutter type. Pay attention to the“Display type” and the “Field”. The following figure is the suggested setting of
© Forsk 2010 18/183
8/12/2019 Atoll Getting Started Umts 310 en v1 130228020806 Phpapp02
http://slidepdf.com/reader/full/atoll-getting-started-umts-310-en-v1-130228020806-phpapp02 19/183
Atoll Getting Started UMTS Version 3.1.0
“Display tab”. Click on the color frame to change the color for each clutter type.
Select “Add to legend” to display information in the legend window. Use the
“Transparency” function to adjust the transparency of the map. The display of each clutter
may be disabling by unchecking the check-box.
7) After setting the “Clutter Classes properties”, the clutter map will be displayed as
below:
© Forsk 2010 19/183
8/12/2019 Atoll Getting Started Umts 310 en v1 130228020806 Phpapp02
http://slidepdf.com/reader/full/atoll-getting-started-umts-310-en-v1-130228020806-phpapp02 20/183
Atoll Getting Started UMTS Version 3.1.0
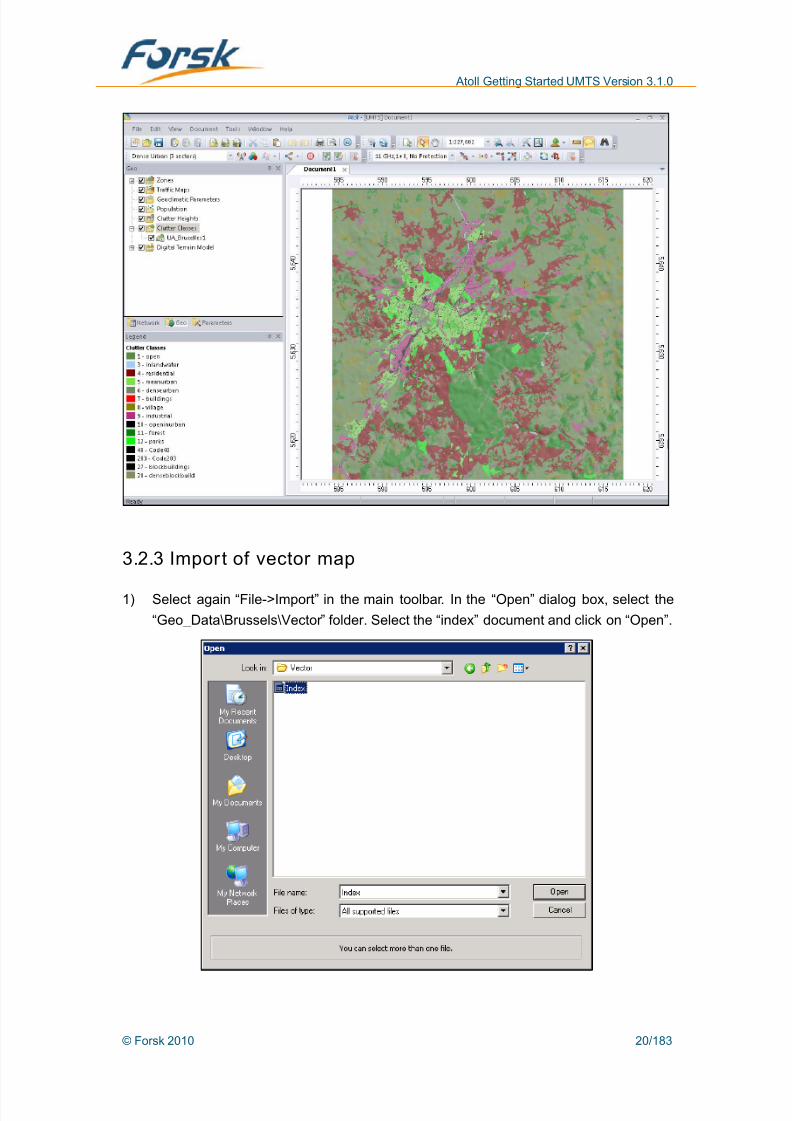
3.2.3 Import of vector map
1) Select again “File->Import” in the main toolbar. In the “Open” dialog box, select the
“Geo_Data\Brussels\Vector” folder. Select the “index” document and click on “Open”.
© Forsk 2010 20/183

8/12/2019 Atoll Getting Started Umts 310 en v1 130228020806 Phpapp02
http://slidepdf.com/reader/full/atoll-getting-started-umts-310-en-v1-130228020806-phpapp02 21/183
Atoll Getting Started UMTS Version 3.1.0
2) In the appeared “Data Type” dialog box, click on the “Vectors” button and click “OK”
3) In the appeared “Vector import” dialog box, use the default settings and click on the
“Import” button to import the map.
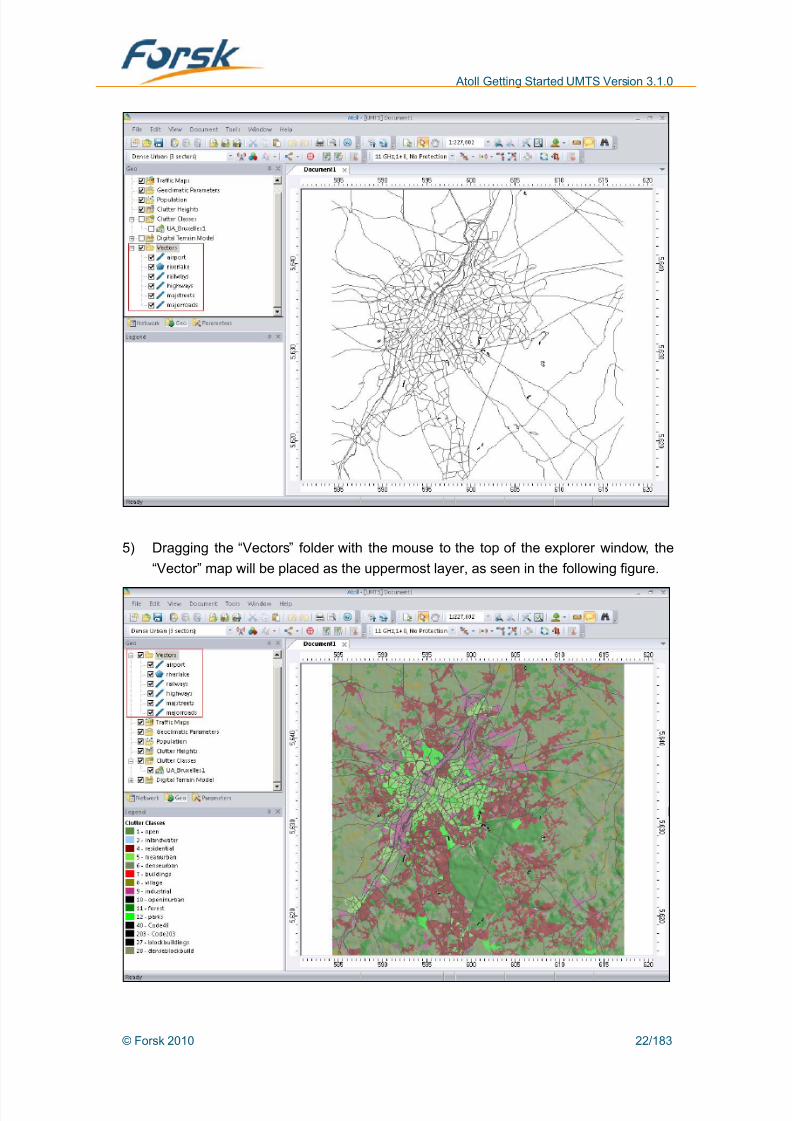
4) After the map import, the following figure appears. The vector map is automatically
put on the left side in the explorer window under the “Geo” tab named “Vectors”.
© Forsk 2010 21/183
8/12/2019 Atoll Getting Started Umts 310 en v1 130228020806 Phpapp02
http://slidepdf.com/reader/full/atoll-getting-started-umts-310-en-v1-130228020806-phpapp02 22/183
Atoll Getting Started UMTS Version 3.1.0
5) Dragging the “Vectors” folder with the mouse to the top of the explorer window, the
“Vector” map will be placed as the uppermost layer, as seen in the following figure.
© Forsk 2010 22/183

8/12/2019 Atoll Getting Started Umts 310 en v1 130228020806 Phpapp02
http://slidepdf.com/reader/full/atoll-getting-started-umts-310-en-v1-130228020806-phpapp02 23/183
Atoll Getting Started UMTS Version 3.1.0
6) Double clicking on “Airport” in the “Vectors” folder, open the “airport properties” dialog
box, and select the “Display” tab, as seen in the following figure.
7) Clicking on the vector line to open the “Display” dialog box to set the color and style
of the vector line.
© Forsk 2010 23/183

8/12/2019 Atoll Getting Started Umts 310 en v1 130228020806 Phpapp02
http://slidepdf.com/reader/full/atoll-getting-started-umts-310-en-v1-130228020806-phpapp02 24/183
Atoll Getting Started UMTS Version 3.1.0
8) As shown in the following figure, the color of the vector line is changed.
9) You may modify other vector files with the same operations as for the “airport” vector
file.
The following figure shows all the imported digital maps.
© Forsk 2010 24/183
8/12/2019 Atoll Getting Started Umts 310 en v1 130228020806 Phpapp02
http://slidepdf.com/reader/full/atoll-getting-started-umts-310-en-v1-130228020806-phpapp02 25/183
Atoll Getting Started UMTS Version 3.1.0
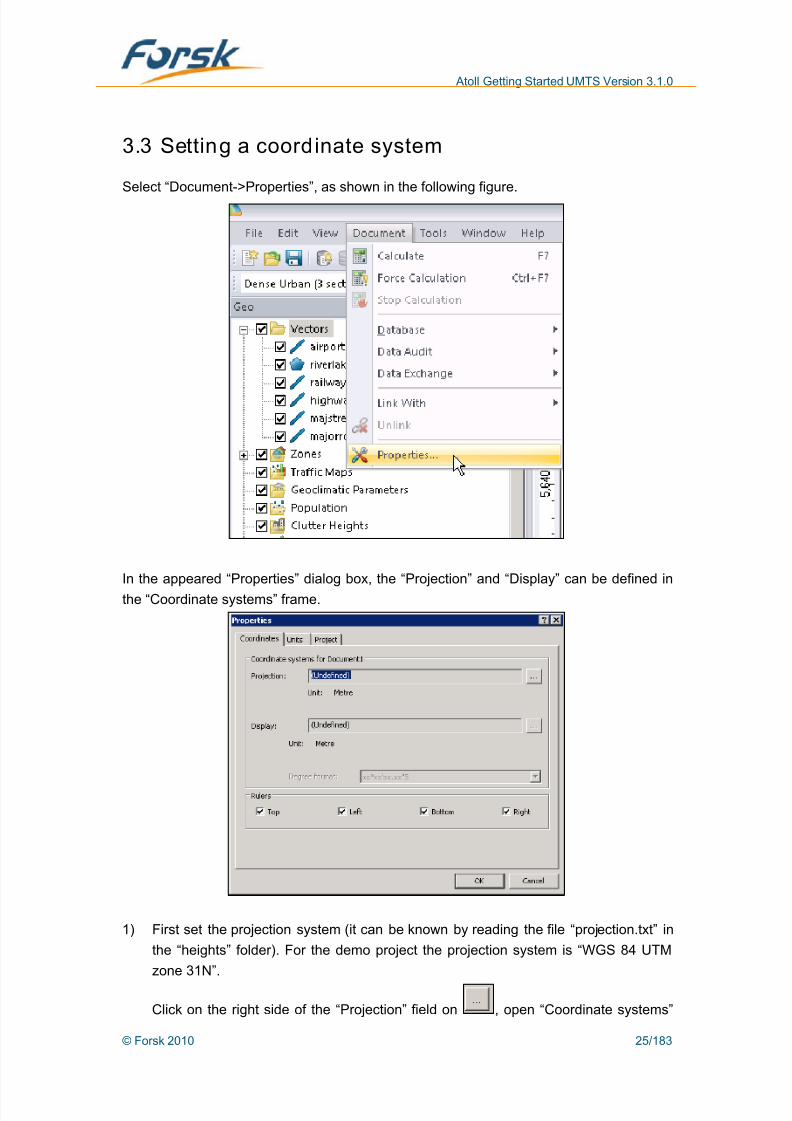
3.3 Setting a coordinate system
Select “Document->Properties”, as shown in the following figure.
In the appeared “Properties” dialog box, the “Projection” and “Display” can be defined in
the “Coordinate systems” frame.
1) First set the projection system (it can be known by reading the file “projection.txt” in
the “heights” folder). For the demo project the projection system is “WGS 84 UTM
zone 31N”.
Click on the right side of the “Projection” field on , open “Coordinate systems”
© Forsk 2010 25/183
8/12/2019 Atoll Getting Started Umts 310 en v1 130228020806 Phpapp02
http://slidepdf.com/reader/full/atoll-getting-started-umts-310-en-v1-130228020806-phpapp02 26/183
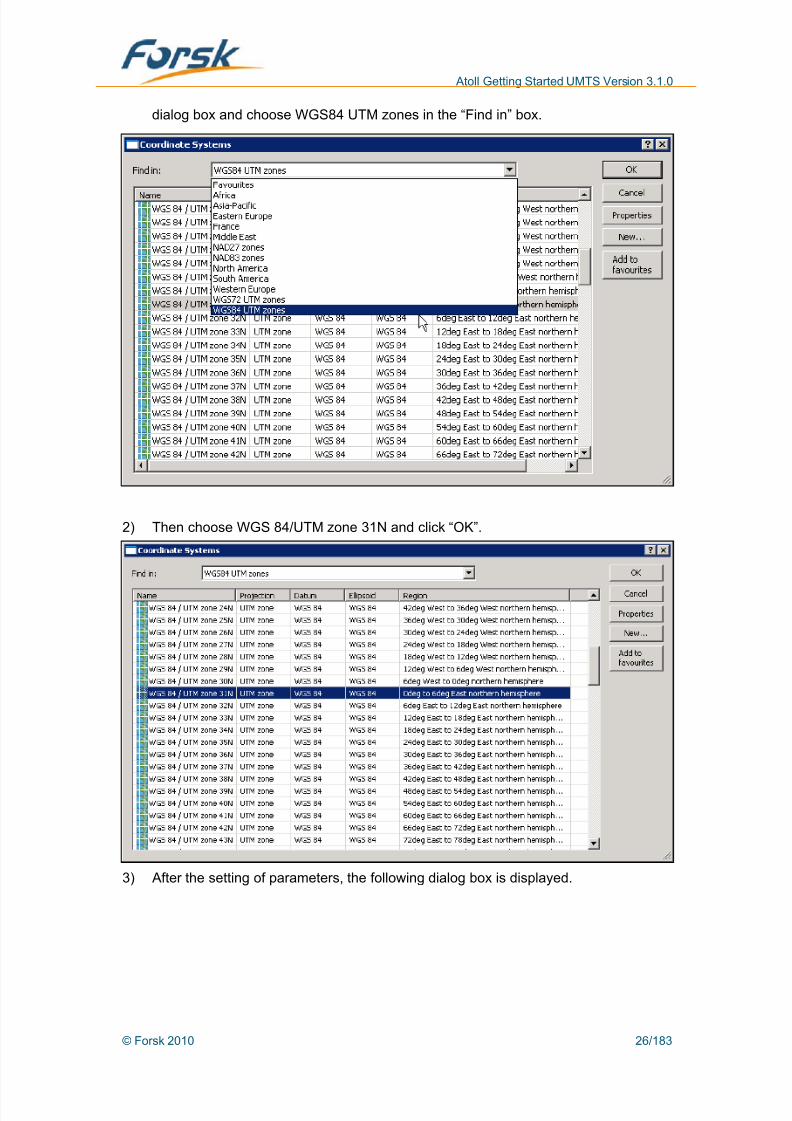
Atoll Getting Started UMTS Version 3.1.0
dialog box and choose WGS84 UTM zones in the “Find in” box.
2) Then choose WGS 84/UTM zone 31N and click “OK”.
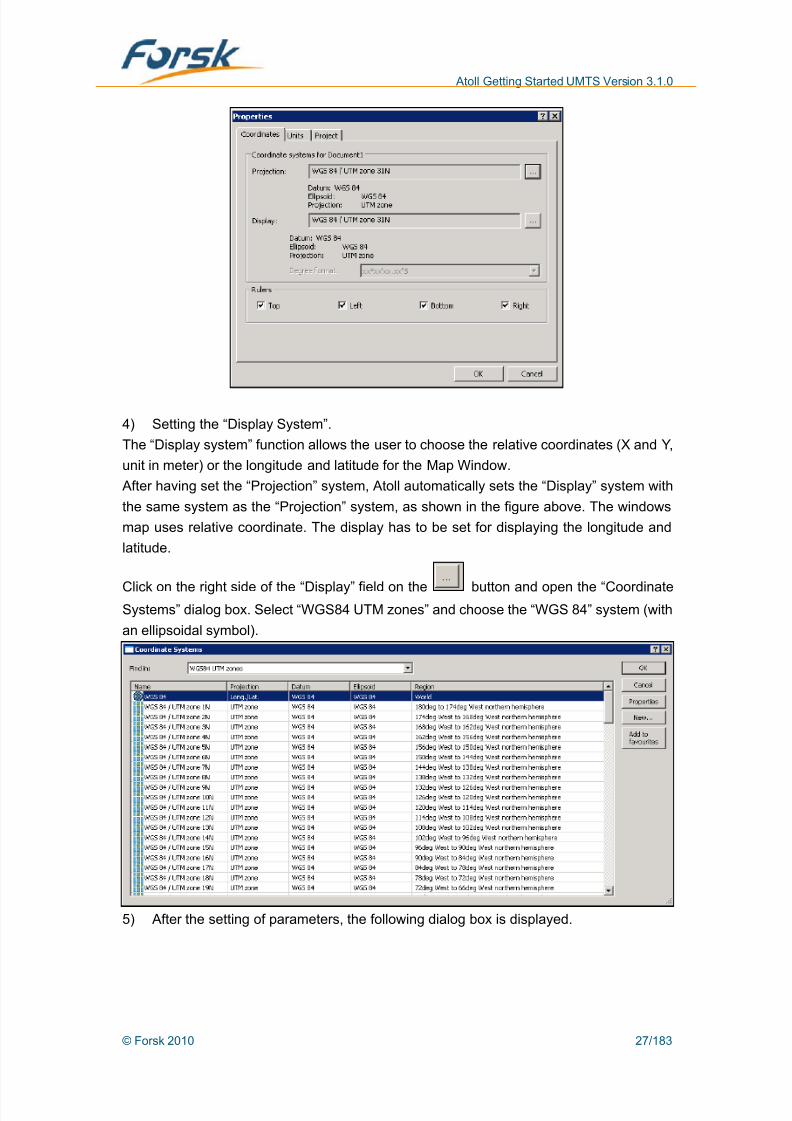
3) After the setting of parameters, the following dialog box is displayed.
© Forsk 2010 26/183
8/12/2019 Atoll Getting Started Umts 310 en v1 130228020806 Phpapp02
http://slidepdf.com/reader/full/atoll-getting-started-umts-310-en-v1-130228020806-phpapp02 27/183
Atoll Getting Started UMTS Version 3.1.0
4) Setting the “Display System”.
The “Display system” function allows the user to choose the relative coordinates (X and Y,
unit in meter) or the longitude and latitude for the Map Window.
After having set the “Projection” system, Atoll automatically sets the “Display” system with
the same system as the “Projection” system, as shown in the figure above. The windows
map uses relative coordinate. The display has to be set for displaying the longitude and
latitude.
Click on the right side of the “Display” field on the button and open the “CoordinateSystems” dialog box. Select “WGS84 UTM zones” and choose the “WGS 84” system (with
an ellipsoidal symbol).
5) After the setting of parameters, the following dialog box is displayed.
© Forsk 2010 27/183
8/12/2019 Atoll Getting Started Umts 310 en v1 130228020806 Phpapp02
http://slidepdf.com/reader/full/atoll-getting-started-umts-310-en-v1-130228020806-phpapp02 28/183
Atoll Getting Started UMTS Version 3.1.0
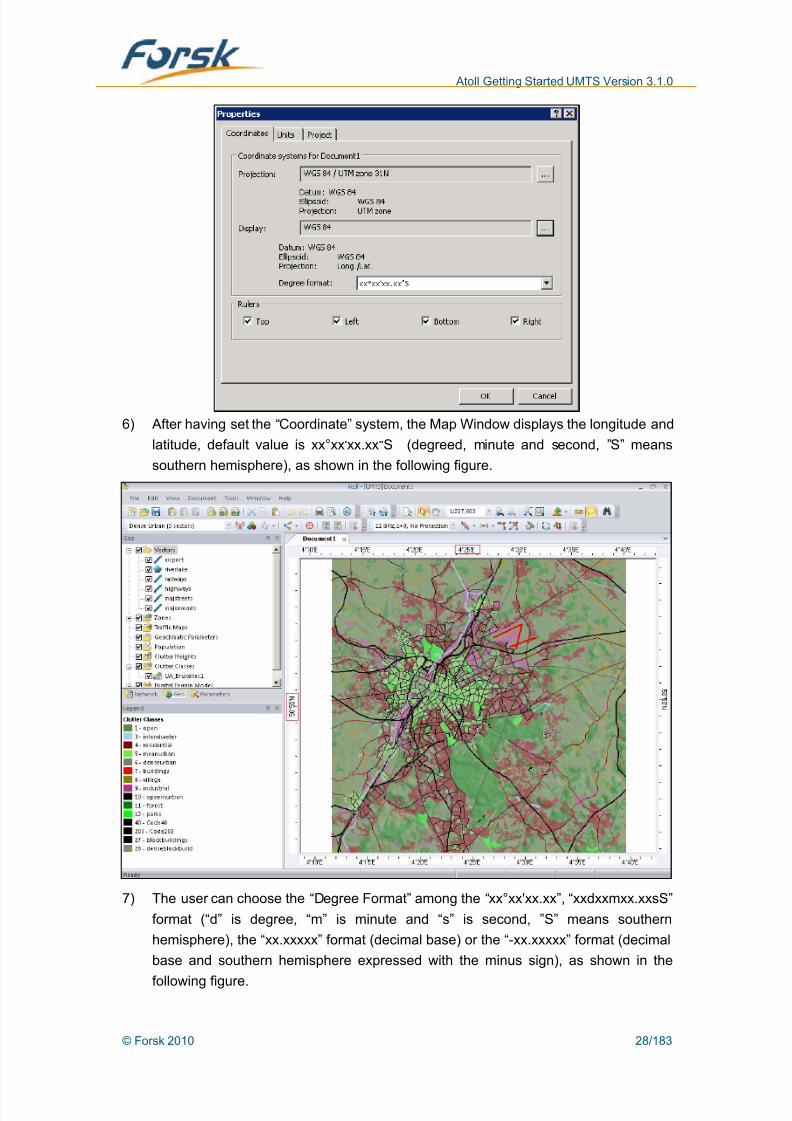
6) After having set the “Coordinate” system, the Map Window displays the longitude and
latitude, default value is xx°xx′ xx.xx″S (degreed, minute and second, ”S” means
southern hemisphere), as shown in the following figure.
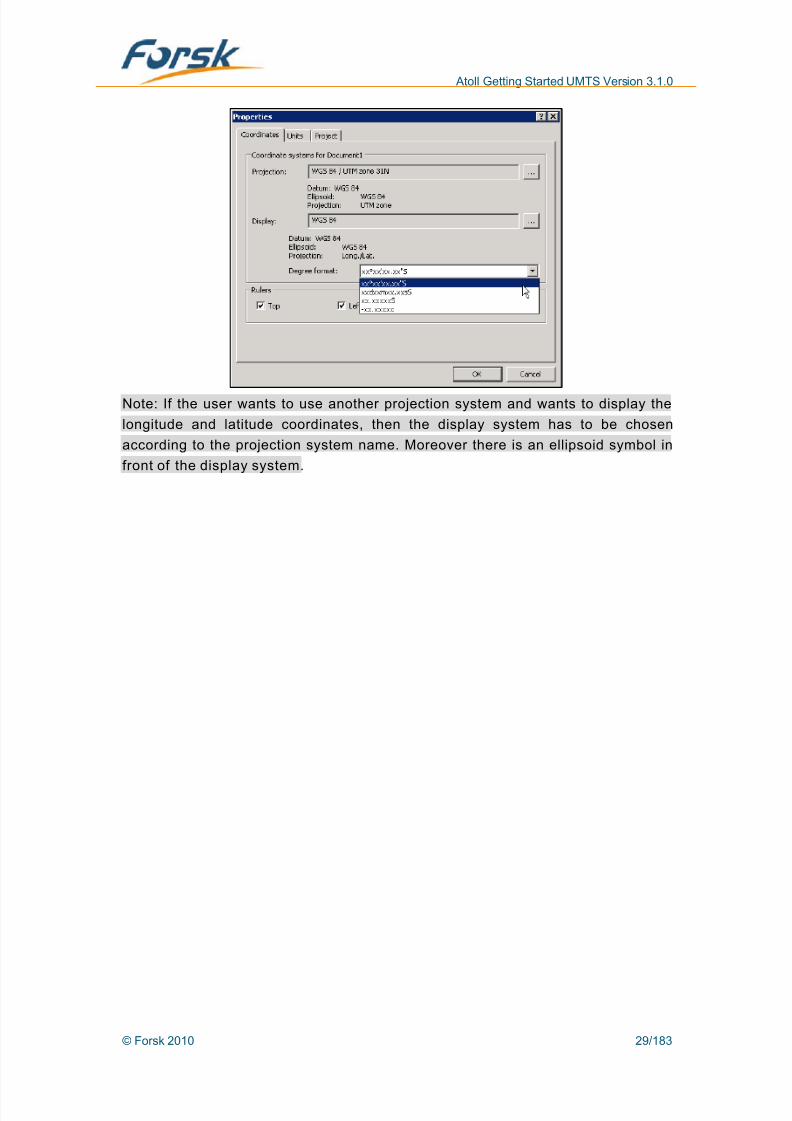
7) The user can choose the “Degree Format” among the “xx°xx'xx.xx”, “xxdxxmxx.xxsS”
format (“d” is degree, “m” is minute and “s” is second, ”S” means southern
hemisphere), the “xx.xxxxx” format (decimal base) or the “-xx.xxxxx” format (decimal
base and southern hemisphere expressed with the minus sign), as shown in the
following figure.
© Forsk 2010 28/183
8/12/2019 Atoll Getting Started Umts 310 en v1 130228020806 Phpapp02
http://slidepdf.com/reader/full/atoll-getting-started-umts-310-en-v1-130228020806-phpapp02 29/183
Atoll Getting Started UMTS Version 3.1.0
Note: If the user wants to use another projection system and wants to display the
longitude and latitude coordinates, then the display system has to be chosen
according to the projection system name. Moreover there is an ellipsoid symbol in
front of the display system.
© Forsk 2010 29/183

8/12/2019 Atoll Getting Started Umts 310 en v1 130228020806 Phpapp02
http://slidepdf.com/reader/full/atoll-getting-started-umts-310-en-v1-130228020806-phpapp02 30/183
Atoll Getting Started UMTS Version 3.1.0
3.4 Network data setting
The setting of a WCDMA project in Atoll can be done for two different cases:
(1) The network is already deployed or the network data, including site location,
antenna patterns and so on, already exist.
(2) The network is not deployed and the user starts the network planning with site
placement in the planning tool.
The following part introduces the first case.
All data have to be prepared in Excel, before importing them. Atoll needs an Excel
document with network data including sites, antennas, transmitters and cells.
All necessary data for the setup of the Brussels project are in the“UMTS_Brussels_Network.xls” document in the “Reference_Data\Network_Data” folder.
The “UMTS_Brussels_Network.xls” document has 5 worksheets. The network data are
contained in the first 4 worksheets and the others will be introduced later.
The import of the network data must be done by a certain order. In Atoll, the order follows
the explorer window order. The following figure shows the order for the introduction of the
network data:
Sites->Antennas->Transmitters->Cells.
© Forsk 2010 30/183

8/12/2019 Atoll Getting Started Umts 310 en v1 130228020806 Phpapp02
http://slidepdf.com/reader/full/atoll-getting-started-umts-310-en-v1-130228020806-phpapp02 31/183
Atoll Getting Started UMTS Version 3.1.0
3.4.1 Import of the Sites table
1) Open the “UMTS_Brussels_Network.xls” document and select the “UMTS network -
Sites” sheet. We have provided two sets of coordinate data.
On the left side there are the relative coordinates and on the right side there are
coordinates with longitude and latitude.
If the WGS 84 display system has been previously chosen (display mode with longitude
and latitude), the coordinate located on the right side of the sheet must be selected.
Note: If the display system is set with longitude and latitude, then the longi tude and
latitude data should be transform in decimal base value.
© Forsk 2010 31/183
8/12/2019 Atoll Getting Started Umts 310 en v1 130228020806 Phpapp02
http://slidepdf.com/reader/full/atoll-getting-started-umts-310-en-v1-130228020806-phpapp02 32/183
Atoll Getting Started UMTS Version 3.1.0
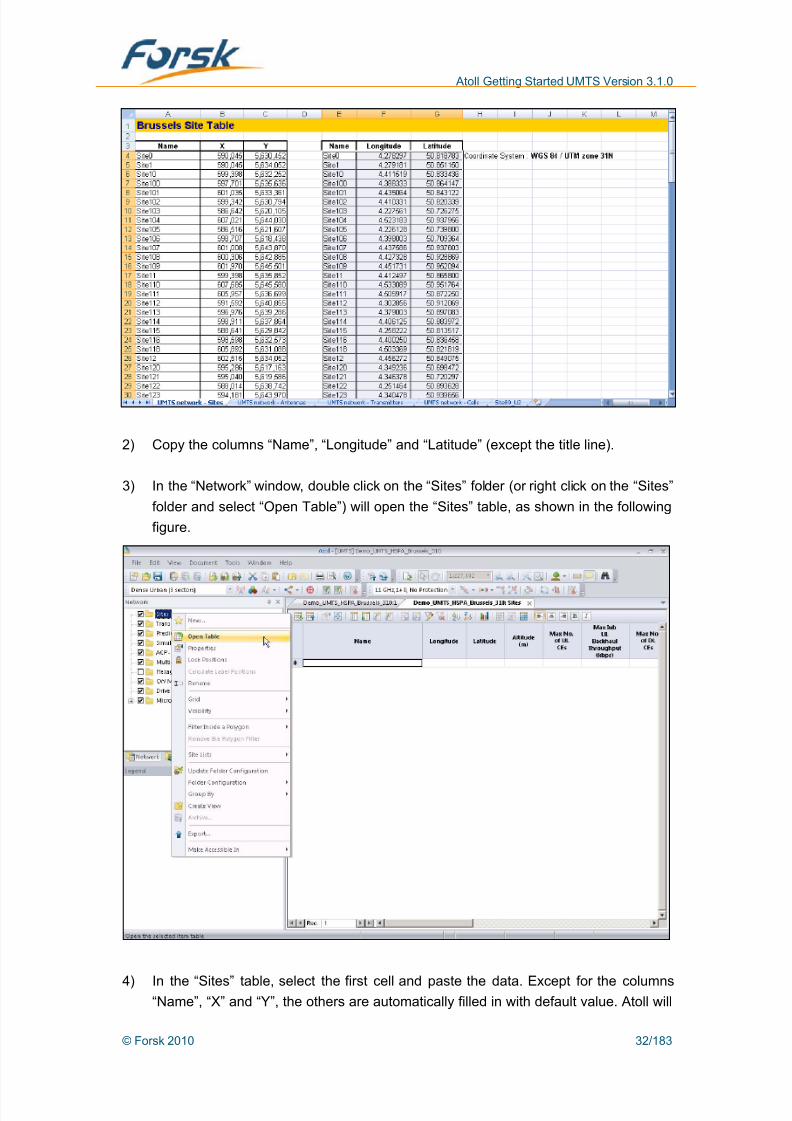
2) Copy the columns “Name”, “Longitude” and “Latitude” (except the title line).
3) In the “Network” window, double click on the “Sites” folder (or right click on the “Sites”
folder and select “Open Table”) will open the “Sites” table, as shown in the following
figure.
4) In the “Sites” table, select the first cell and paste the data. Except for the columns“Name”, “X” and “Y”, the others are automatically filled in with default value. Atoll will
© Forsk 2010 32/183

8/12/2019 Atoll Getting Started Umts 310 en v1 130228020806 Phpapp02
http://slidepdf.com/reader/full/atoll-getting-started-umts-310-en-v1-130228020806-phpapp02 33/183
Atoll Getting Started UMTS Version 3.1.0
transform automatically the longitude and latitude form decimal format to minutes
and seconds system.
The imported sites will be put in the “Sites” folder of the “Network” window with an
alphabetic order, as shown in the following figure.
5) If the user wants to delete one or several sites, he can delete them in the “Sites” table
or directly in the “Network” window.
In the “Sites” table, click on the left grey cell of the line, which contains the site you
want to delete, select the entire line, and push the keyboard “delete” button.
In the “Network” window, right click on the site you want to delete and select “delete”
in the menu, as shown in the following figure.
© Forsk 2010 33/183

8/12/2019 Atoll Getting Started Umts 310 en v1 130228020806 Phpapp02
http://slidepdf.com/reader/full/atoll-getting-started-umts-310-en-v1-130228020806-phpapp02 34/183
Atoll Getting Started UMTS Version 3.1.0
6) After the input of “Sites” data, the Map Window is automatically updated with the new
sites. In the following figure, a black circle represents a site.
7) Open the “Sites” properties dialog box (right click on the “Sites” folder and select“properties”) to change the display attributes, as shown in the following figure.
© Forsk 2010 34/183

8/12/2019 Atoll Getting Started Umts 310 en v1 130228020806 Phpapp02
http://slidepdf.com/reader/full/atoll-getting-started-umts-310-en-v1-130228020806-phpapp02 35/183
Atoll Getting Started UMTS Version 3.1.0
Choosing “Unique” allows only a unique color for the display of sites. Choosing “Discrete
values” or “Value intervals” allows colors selection according to certain characteristics. By
default, a site is represented by a black circle.
If necessary, the symbol and color of sites can be changed, by selecting “Properties” inthe “Actions” dialog box. The appeared “Display” window allows the selection of color and
symbol.
8) Site Equipment Setting. Open the Site Equipment Table on Network Settings ->
Radio Resource Management on Parameters Window to define site equipment.
© Forsk 2010 35/183

8/12/2019 Atoll Getting Started Umts 310 en v1 130228020806 Phpapp02
http://slidepdf.com/reader/full/atoll-getting-started-umts-310-en-v1-130228020806-phpapp02 36/183
Atoll Getting Started UMTS Version 3.1.0
© Forsk 2010 36/183
8/12/2019 Atoll Getting Started Umts 310 en v1 130228020806 Phpapp02
http://slidepdf.com/reader/full/atoll-getting-started-umts-310-en-v1-130228020806-phpapp02 37/183
Atoll Getting Started UMTS Version 3.1.0
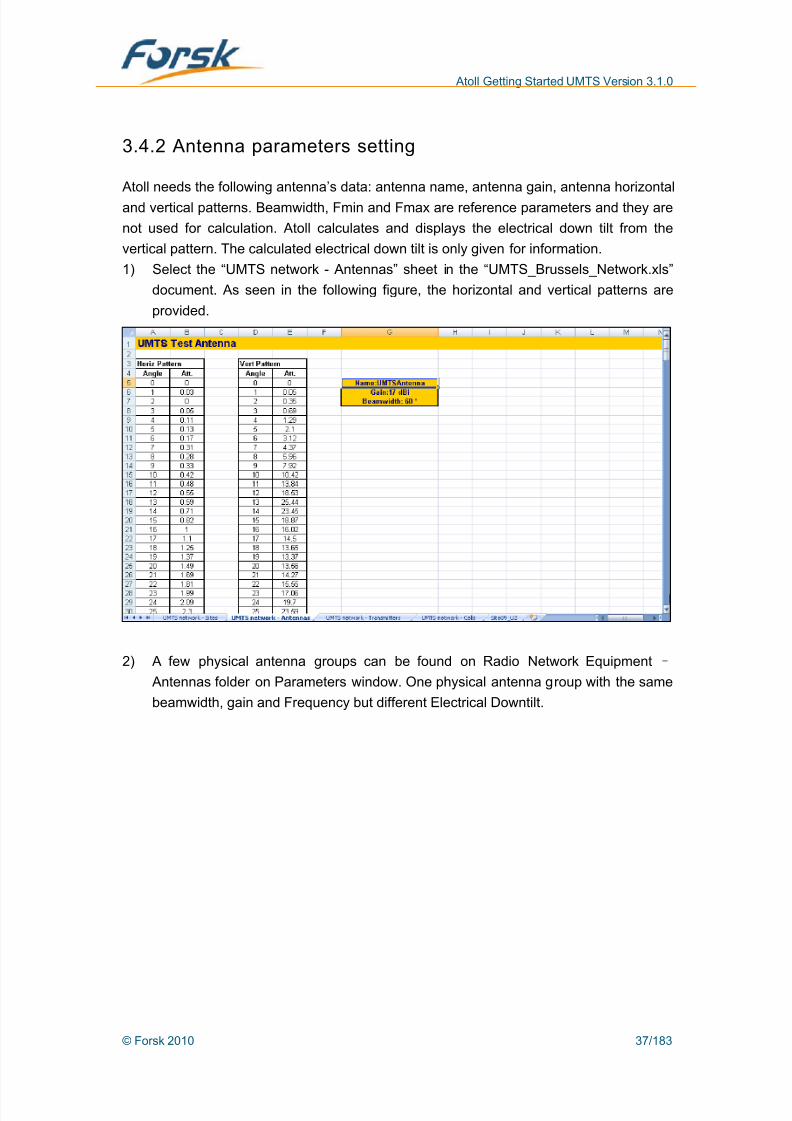
3.4.2 Antenna parameters setting
Atoll needs the following antenna’s data: antenna name, antenna gain, antenna horizontal
and vertical patterns. Beamwidth, Fmin and Fmax are reference parameters and they are
not used for calculation. Atoll calculates and displays the electrical down tilt from the
vertical pattern. The calculated electrical down tilt is only given for information.
1) Select the “UMTS network - Antennas” sheet in the “UMTS_Brussels_Network.xls”
document. As seen in the following figure, the horizontal and vertical patterns are
provided.
2) A few physical antenna groups can be found on Radio Network Equipment –
Antennas folder on Parameters window. One physical antenna group with the same
beamwidth, gain and Frequency but different Electrical Downtilt.
© Forsk 2010 37/183

8/12/2019 Atoll Getting Started Umts 310 en v1 130228020806 Phpapp02
http://slidepdf.com/reader/full/atoll-getting-started-umts-310-en-v1-130228020806-phpapp02 38/183
Atoll Getting Started UMTS Version 3.1.0
Right click on the “Antennas” folder in the Explorer Window and select “New” in the
context menu, as shown in the following figure.
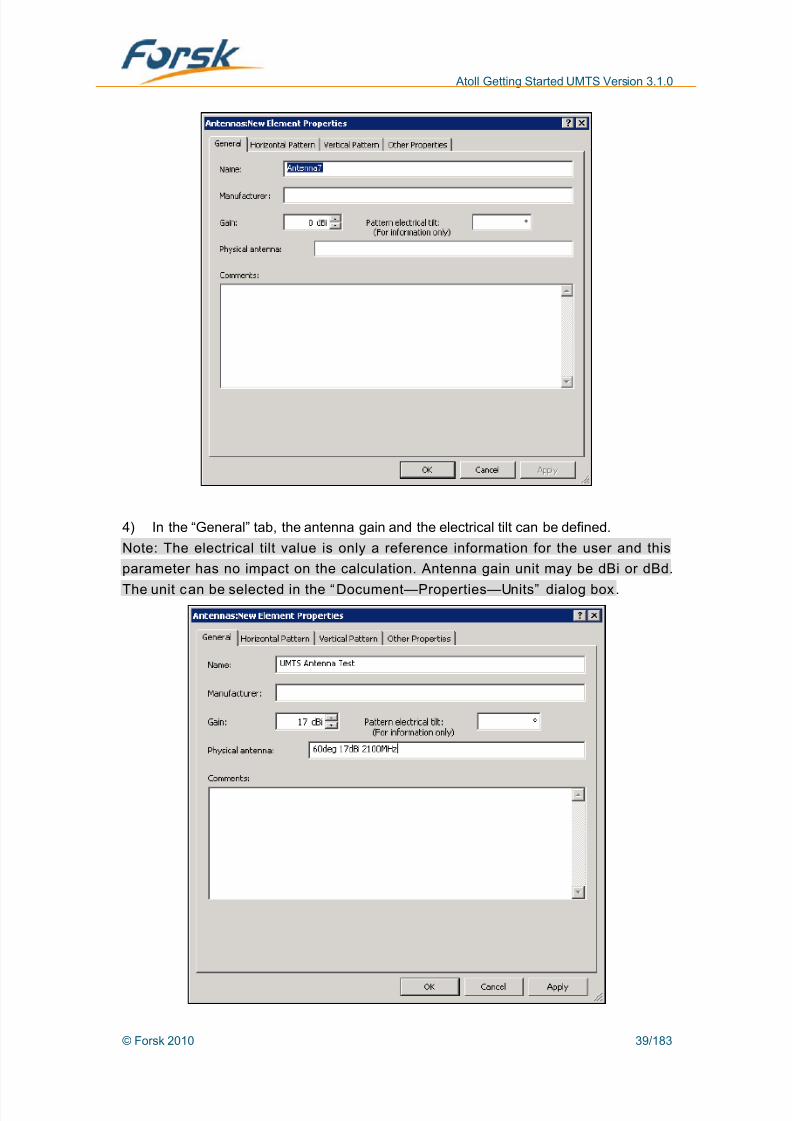
3) In the “Antennas New element properties” dialog box, the following tabs are available:
“General”, “Horizontal pattern”,”Vertical pattern” and “Other properties”.
© Forsk 2010 38/183
8/12/2019 Atoll Getting Started Umts 310 en v1 130228020806 Phpapp02
http://slidepdf.com/reader/full/atoll-getting-started-umts-310-en-v1-130228020806-phpapp02 39/183
Atoll Getting Started UMTS Version 3.1.0
4) In the “General” tab, the antenna gain and the electrical tilt can be defined.
Note: The electrical tilt value is only a reference information for the user and this
parameter has no impact on the calculation. Antenna gain unit may be dBi or dBd.
The unit can be selected in the “Document—Properties—Units” dialog box.
© Forsk 2010 39/183

8/12/2019 Atoll Getting Started Umts 310 en v1 130228020806 Phpapp02
http://slidepdf.com/reader/full/atoll-getting-started-umts-310-en-v1-130228020806-phpapp02 40/183

8/12/2019 Atoll Getting Started Umts 310 en v1 130228020806 Phpapp02
http://slidepdf.com/reader/full/atoll-getting-started-umts-310-en-v1-130228020806-phpapp02 41/183
Atoll Getting Started UMTS Version 3.1.0
Note: Atoll allows you to enter antenna pattern attenuations for as many as 720
angles. Therefore, attenuation values can also be defined for angles other than
integer values from 0° to 359°. For example: 0, 0.5, 1, 1.5, 2, 2.5 … 359, 359.5.
7) Other parameters can be set in the “Other properties” tab, but it is only referenceinformation and it has no impact on the calculation.
8) A new antenna named “UMTS Antenna Test” can be found on “Physical Antenna:60deg 17dBi 2100MHz” on Antennas folder.
© Forsk 2010 41/183

8/12/2019 Atoll Getting Started Umts 310 en v1 130228020806 Phpapp02
http://slidepdf.com/reader/full/atoll-getting-started-umts-310-en-v1-130228020806-phpapp02 42/183

8/12/2019 Atoll Getting Started Umts 310 en v1 130228020806 Phpapp02
http://slidepdf.com/reader/full/atoll-getting-started-umts-310-en-v1-130228020806-phpapp02 43/183
Atoll Getting Started UMTS Version 3.1.0
3) After opening the “Transmitters” table in Atoll, you will discover that the number of
fields is larger than in the Excel file. It is because some of the parameters in Atoll
don’t need the input from the user but Atoll will automatically fill in default values. The
fields listed in the Excel document are those necessary parameters for thetransmitters.
Before copy/paste the Excel table in Atoll, the unnecessary columns have to be hidden. If
the user try to paste the data and that don’t match with the “Transmitters” tab, an error
message will be displayed. The following figure shows that the “Columns to be Displayed”
tab can be accessed under “Display Columns…”.
© Forsk 2010 43/183

8/12/2019 Atoll Getting Started Umts 310 en v1 130228020806 Phpapp02
http://slidepdf.com/reader/full/atoll-getting-started-umts-310-en-v1-130228020806-phpapp02 44/183
Atoll Getting Started UMTS Version 3.1.0
In the “Columns to be Displayed” tab, the unnecessary fields has to be unchecked for
hiding the corresponding column, as shown in the following chart. Finally the
“Transmitters” tab and the Excel tab have exactly the same columns.
4) Copy the transmitter’s data of the “UMTS network - Transmitters” sheet of the Excel
document (except the title line) and paste it in the “Transmitters” table in Atoll, as
shown in the following figure.
© Forsk 2010 44/183
8/12/2019 Atoll Getting Started Umts 310 en v1 130228020806 Phpapp02
http://slidepdf.com/reader/full/atoll-getting-started-umts-310-en-v1-130228020806-phpapp02 45/183
Atoll Getting Started UMTS Version 3.1.0
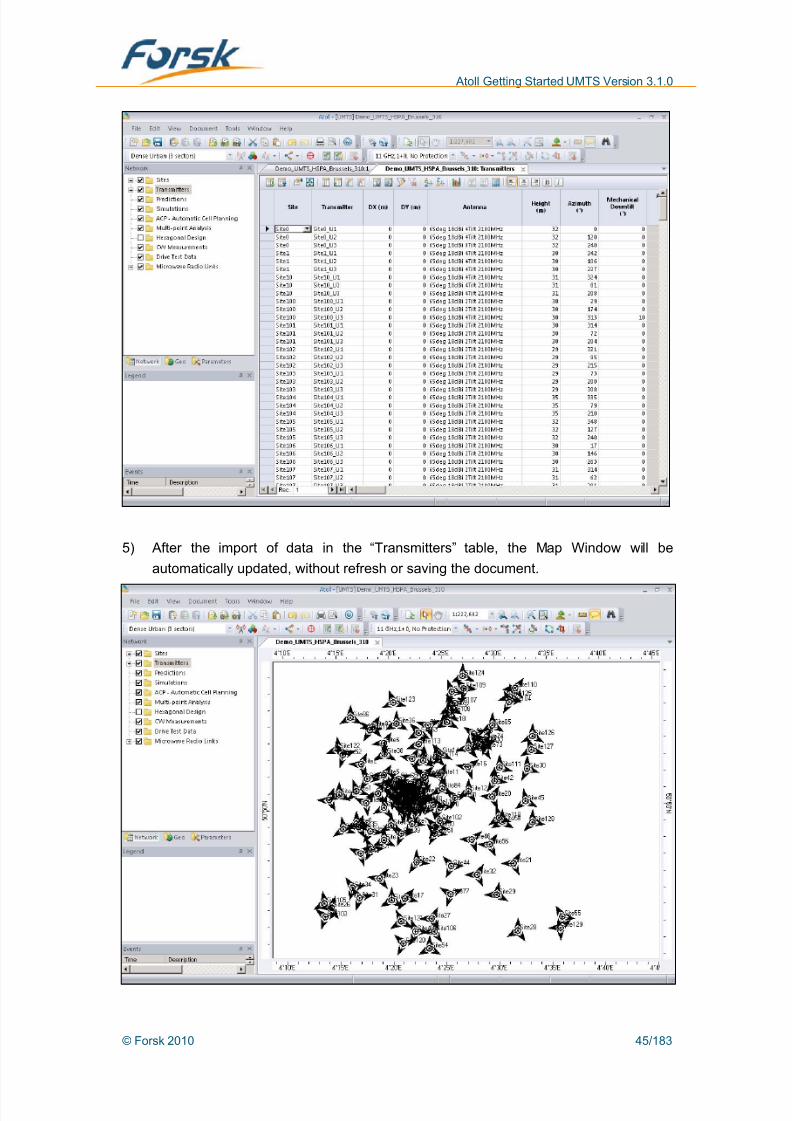
5) After the import of data in the “Transmitters” table, the Map Window will be
automatically updated, without refresh or saving the document.
© Forsk 2010 45/183

8/12/2019 Atoll Getting Started Umts 310 en v1 130228020806 Phpapp02
http://slidepdf.com/reader/full/atoll-getting-started-umts-310-en-v1-130228020806-phpapp02 46/183
Atoll Getting Started UMTS Version 3.1.0
6) The toolbar’s button may zoom in or zoom out the Map Window (left click will
zoom in and right click will zoom out). The toolbar’s button allows the user to
choose one region to be zoomed in.
7、 Pushing the toolbar’s button assigns automatically different colors for each
transmitter in order to differentiate them, as shown in the following figure.
3.4.3.2 Global Parameters
1) Right click on the “Network Settings” folder on “Parameters” window, open the
“Network Settings Properties” dialogue.Select the “Global Parameters” tab, as shown in the following figure.
© Forsk 2010 46/183

8/12/2019 Atoll Getting Started Umts 310 en v1 130228020806 Phpapp02
http://slidepdf.com/reader/full/atoll-getting-started-umts-310-en-v1-130228020806-phpapp02 47/183
Atoll Getting Started UMTS Version 3.1.0
The Global Parameters tab has the following options: DL Powers: define whether the power values on the downlink are Absolute or
Relative to Pilot. The power values affected are the synchronisation channel, other
common channel, HS-SCCH, and HSUPA powers defined in the cell properties, as
well as the minimum and maximum traffic channel powers per R99 radio bearer. Atoll
automatically converts the power values defined in the cell properties (i.e.,
synchronisation channel, other common channel, HS-SCCH, and HSUPA powers)
when you change the option. On the other hand, the values for the minimum and
maximum traffic channel powers have to be modified manually.
DL Load: define whether the total power values on the downlink are Absolute or a
percentage of the maximum power (% Pmax). Atoll automatically converts the total
power values when you change the option.
Interferences: define the method used to calculate interference on the downlink (I0
and Nt):
I0: Atoll will calculate I0 using the noise generated by all transmitters plus thermal
noise or you can select "Without pilot" and Atoll will calculate I0 using the total
noise less the pilot signal and orthogonal part of traffic channels and other
common channels.
Nt: Atoll will calculate Nt as the noise generated by all transmitters plus thermal
noise or you can select "Without useful signal" and Atoll will calculate Nt as thetotal noise less the signal of the studied cell.
© Forsk 2010 47/183

8/12/2019 Atoll Getting Started Umts 310 en v1 130228020806 Phpapp02
http://slidepdf.com/reader/full/atoll-getting-started-umts-310-en-v1-130228020806-phpapp02 48/183
Atoll Getting Started UMTS Version 3.1.0
Handoff: define the parameters used to model soft handoff on the uplink.
Default UL Macro-Diversity Gain: set a default value for the uplink gain due to
macro-diversity on soft and soft-soft handovers. If you clear the Shadowing taken
into account check box on the Condition tab when defining a coverage prediction
or during a point analysis, Atoll uses this value. If you select the Shadowing takeninto account check box on the Condition tab, Atoll calculates the UL
macro-diversity gain, based on the standard deviation value of Eb ⁄ Nt on the
uplink defined per clutter class.
+MRC in Softer/Soft: Atoll selects the serving cell during a softer/soft handover
by recombining the signal of co-site transmitters and multiplying the resulting
signal by the rake efficiency factor and then comparing this value to the signal
received at transmitters located on the other sites of the active set. Atoll chooses
the greatest value and multiplies it by the macro-diversity gain.
Compressed Mode: define the parameters related to compressed mode.
Compressed mode is used when a mobile supporting compressed mode is
connected to a cell located on a site with a compressed-mode-capable equipment
and either the pilot RSCP, or the received Ec ⁄ I0, or both of them are lower than the
defined activation thresholds.
RSCP Activation Threshold: select the RSCP Active check box and enter a
RSCP Activation Threshold.
Ec ⁄ I0 Activation Threshold: select the Ec ⁄ I0 Active check box and enter a Ec ⁄ I0
Activation Threshold.
Eb ⁄ Nt UL and DL Target Increase: When compressed mode is activated, Eb ⁄ Nt
requirements in UL and DL are increased. In order to take this into account, Atolladds UL and DL Eb ⁄ Nt target increase values to the UL and DL Eb ⁄ Nt
requirements set for each radio bearer.
HSDPA: define how total noise is calculated and how the CQI (Channel Quality
Indicator) is evaluated for HSDPA.
Nt: select "Total noise" and Atoll will calculate Nt as the noise generated by all
transmitters plus thermal noise or select "Without useful signal" and Atoll will
calculate Nt as the total noise less the signal of the studied cell.
CQI: select “Based on CPICH quality” and Atoll will measure the CQI based on
the pilot Ec ⁄ Nt or select “Based on HS-PDSCH quality” and Atoll will measure the
CQI based on the HS-PDSCH Ec ⁄ Nt. Depending on the option selected, you will
have to define either a CQI=f(CPICH Ec/Nt) graph, or a CQI=f(HSPDSCH Ec/Nt)
graph in the Properties dialogue of the terminal equipment. The calculated CQI
will be used to determine the best bearer.
© Forsk 2010 48/183
8/12/2019 Atoll Getting Started Umts 310 en v1 130228020806 Phpapp02
http://slidepdf.com/reader/full/atoll-getting-started-umts-310-en-v1-130228020806-phpapp02 49/183
Atoll Getting Started UMTS Version 3.1.0
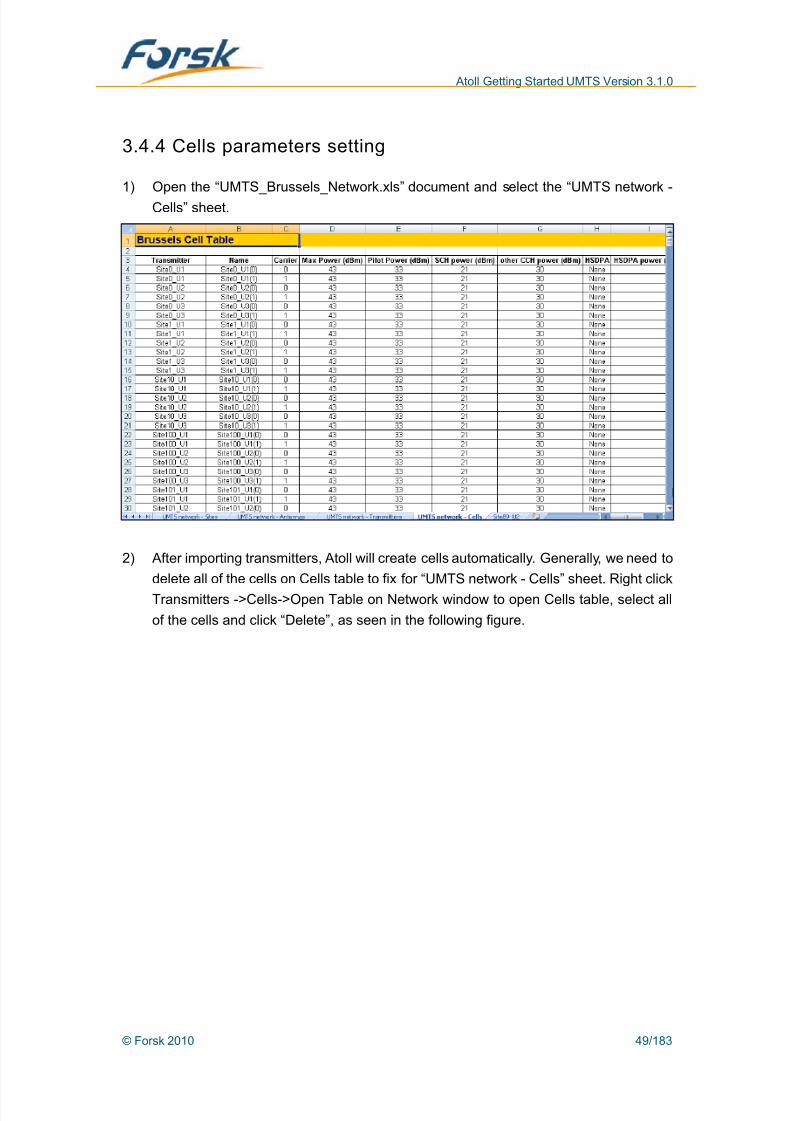
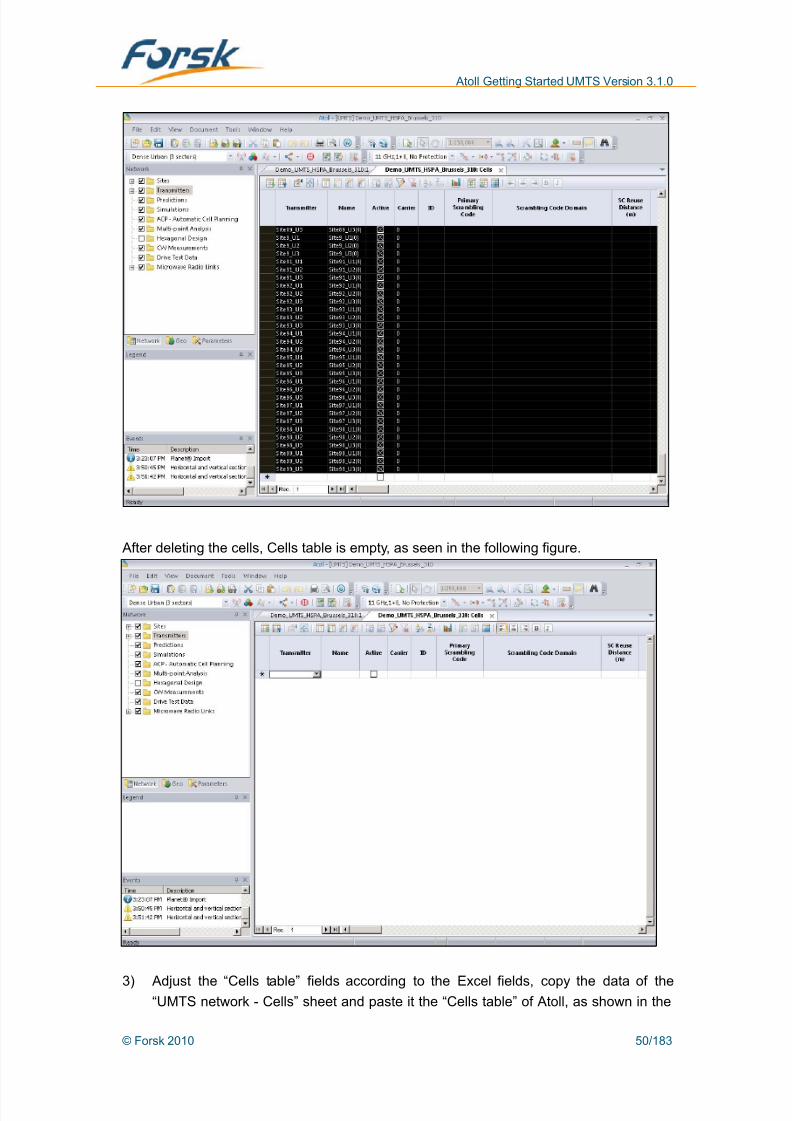
3.4.4 Cells parameters setting
1) Open the “UMTS_Brussels_Network.xls” document and select the “UMTS network -
Cells” sheet.
2) After importing transmitters, Atoll will create cells automatically. Generally, we need to
delete all of the cells on Cells table to fix for “UMTS network - Cells” sheet. Right click
Transmitters ->Cells->Open Table on Network window to open Cells table, select all
of the cells and click “Delete”, as seen in the following figure.
© Forsk 2010 49/183
8/12/2019 Atoll Getting Started Umts 310 en v1 130228020806 Phpapp02
http://slidepdf.com/reader/full/atoll-getting-started-umts-310-en-v1-130228020806-phpapp02 50/183
8/12/2019 Atoll Getting Started Umts 310 en v1 130228020806 Phpapp02
http://slidepdf.com/reader/full/atoll-getting-started-umts-310-en-v1-130228020806-phpapp02 51/183

8/12/2019 Atoll Getting Started Umts 310 en v1 130228020806 Phpapp02
http://slidepdf.com/reader/full/atoll-getting-started-umts-310-en-v1-130228020806-phpapp02 52/183
Atoll Getting Started UMTS Version 3.1.0
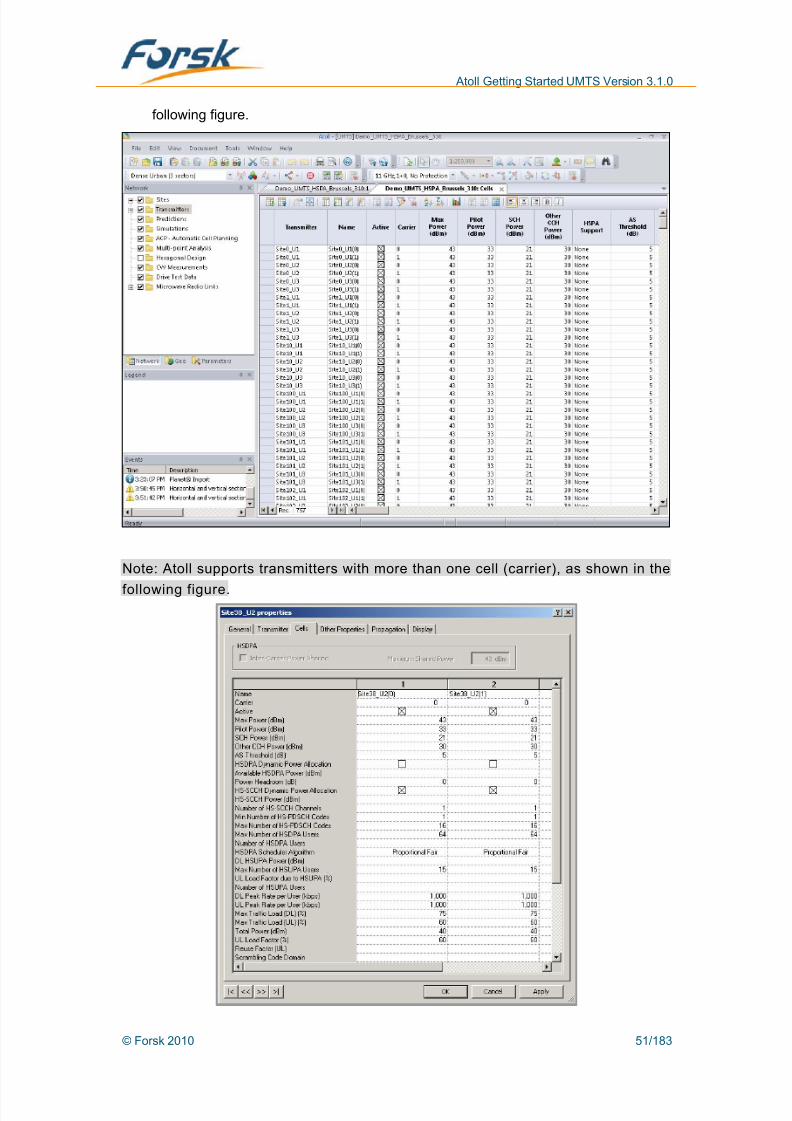
4) The “Name” field in the “Cells” table may be set according to the user preference. In
Atoll, the default name is set as: “Transmitter_name (0)”, where “0” is the carrier
number.
5) Frequency Bands:
To open the “Frequency Bands” dialogue, select “Network Settings->Frequencies->
Bands” on “Network” window.
Open the “Frequency Band” dialogue. Define the central frequency, the first carrier, the
last carrier and the bandwidth. By default the first carrier is 0 and the last carrier is 2, so
there are 3 carriers. The frequency of the carrier 0 is the central frequency. This frequency
is use for the calculation of the pathloss matrices. The frequency of the carrier 1 is the
central frequency + 5MHz. Atoll UMTS supports multi-frequency band, by adding a new
frequency band in the last line of the “Frequency Band” dialog box.
Define TMA, Feeders, Transmitter Equipment and Repeater Equipment under Radio
Network Equipment folder on Parameters window.
© Forsk 2010 52/183

8/12/2019 Atoll Getting Started Umts 310 en v1 130228020806 Phpapp02
http://slidepdf.com/reader/full/atoll-getting-started-umts-310-en-v1-130228020806-phpapp02 53/183
Atoll Getting Started UMTS Version 3.1.0
3.4.5 Import and export
The stand alone mode does not need to connect any external database, but it can be
convenient to import/export network data from/to a database.
3.4.5.1 Import Access database
1) Please find the “Brussels_UMTS.mdb” document in the
“Reference_Data\Access_Database” folder in the CDROM. This document is an
Access database file, containing the Brussels network data (but it does not contain
the map data).
2) In Atoll, select “File->New->From an Existing Database”, as shown in the following
figure.
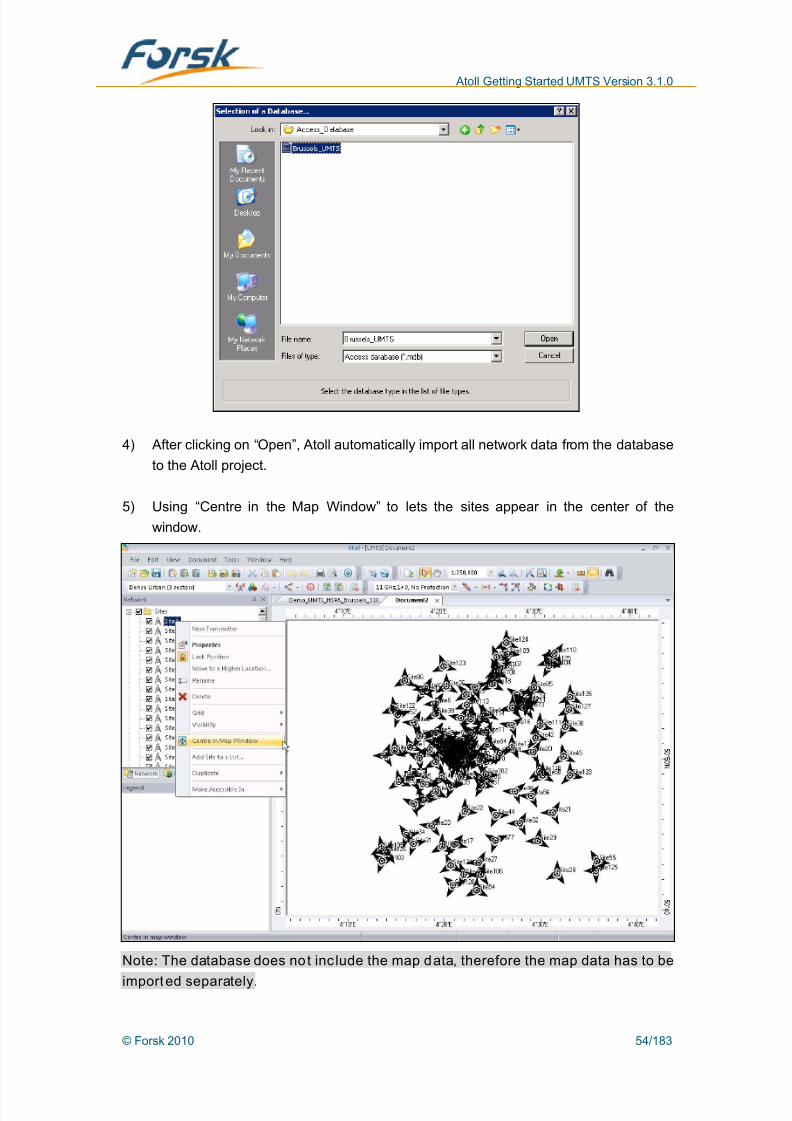
3) In the browsing window select the “Brussels_UMTS.mdb” document from the
CDROM.
© Forsk 2010 53/183
8/12/2019 Atoll Getting Started Umts 310 en v1 130228020806 Phpapp02
http://slidepdf.com/reader/full/atoll-getting-started-umts-310-en-v1-130228020806-phpapp02 54/183
Atoll Getting Started UMTS Version 3.1.0
4) After clicking on “Open”, Atoll automatically import all network data from the database
to the Atoll project.
5) Using “Centre in the Map Window” to lets the sites appear in the center of the
window.
Note: The database does not inc lude the map data, therefore the map data has to be
imported separately.
© Forsk 2010 54/183
8/12/2019 Atoll Getting Started Umts 310 en v1 130228020806 Phpapp02
http://slidepdf.com/reader/full/atoll-getting-started-umts-310-en-v1-130228020806-phpapp02 55/183
Atoll Getting Started UMTS Version 3.1.0
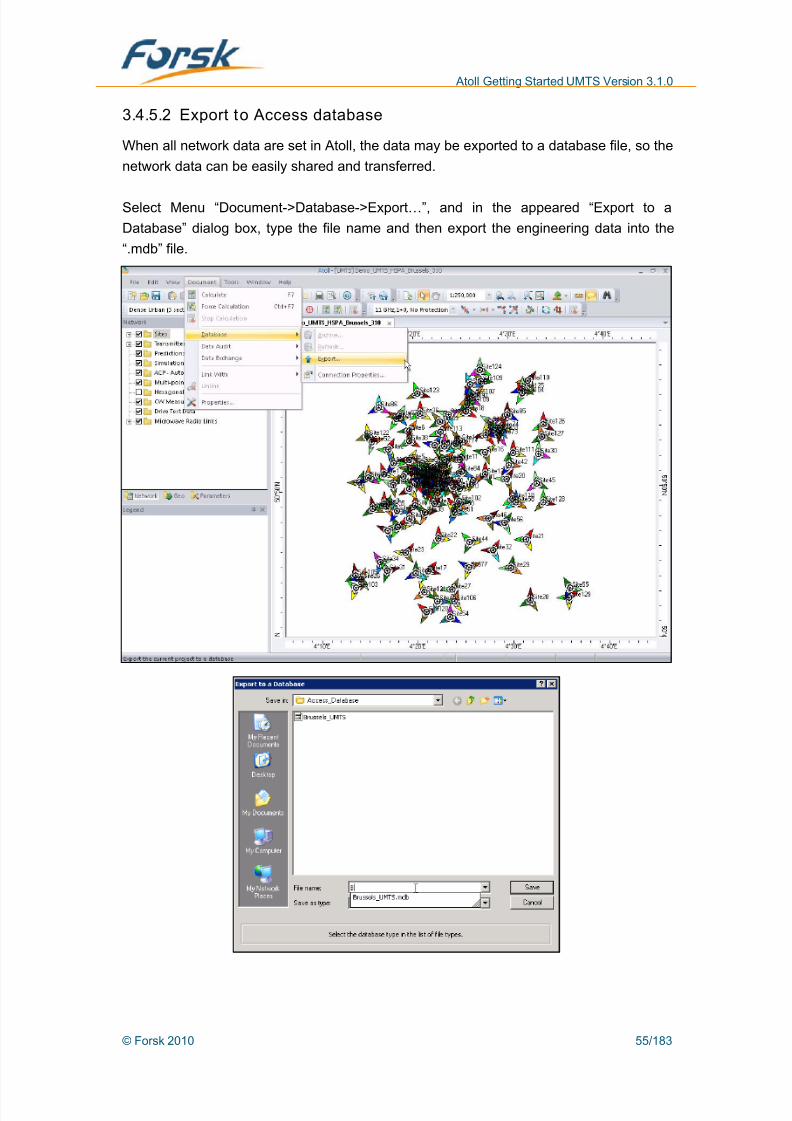
3.4.5.2 Export to Access database
When all network data are set in Atoll, the data may be exported to a database file, so the
network data can be easily shared and transferred.
Select Menu “Document->Database->Export…”, and in the appeared “Export to a
Database” dialog box, type the file name and then export the engineering data into the
“.mdb” file.
© Forsk 2010 55/183
8/12/2019 Atoll Getting Started Umts 310 en v1 130228020806 Phpapp02
http://slidepdf.com/reader/full/atoll-getting-started-umts-310-en-v1-130228020806-phpapp02 56/183
Atoll Getting Started UMTS Version 3.1.0
3.4.6 Add new sites
The steps for importing the network data into Atoll have been introduced above. Atoll
provides also another method to add new sites directly in the Map Window.
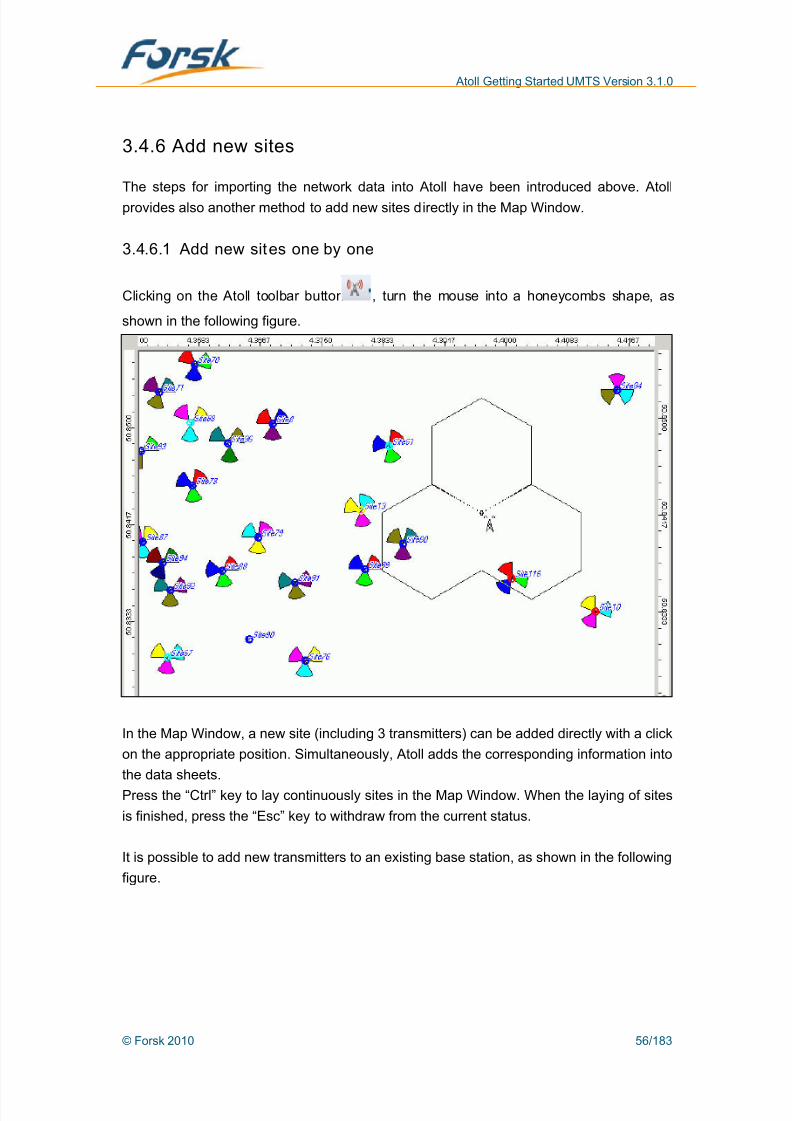
3.4.6.1 Add new sites one by one
Clicking on the Atoll toolbar button , turn the mouse into a honeycombs shape, as
shown in the following figure.
In the Map Window, a new site (including 3 transmitters) can be added directly with a click
on the appropriate position. Simultaneously, Atoll adds the corresponding information into
the data sheets.
Press the “Ctrl” key to lay continuously sites in the Map Window. When the laying of sites
is finished, press the “Esc” key to withdraw from the current status.
It is possible to add new transmitters to an existing base station, as shown in the following
figure.
© Forsk 2010 56/183

8/12/2019 Atoll Getting Started Umts 310 en v1 130228020806 Phpapp02
http://slidepdf.com/reader/full/atoll-getting-started-umts-310-en-v1-130228020806-phpapp02 57/183
Atoll Getting Started UMTS Version 3.1.0
Do not select “Hexagonal Design” in the Network tab, will hide the honeycomb shape of
the new sites.
3.4.6.2 Add a group of sites
Click on the Atoll toolbar button , then a polygonal symbol will be added behind the
cursor.
Then draw a polygon in the Map Window to add a new group of sites inside the selected
region. Sites will be automatically layed inside the region according to a certain inter-site
distance, as seen in the following figure.
After drawing the polygon, the following figure will appear.
© Forsk 2010 57/183

8/12/2019 Atoll Getting Started Umts 310 en v1 130228020806 Phpapp02
http://slidepdf.com/reader/full/atoll-getting-started-umts-310-en-v1-130228020806-phpapp02 58/183
Atoll Getting Started UMTS Version 3.1.0
Similarly, Atoll will add the corresponding information to the new sites into the data sheets.
If the user wants to delete a group of sites, it can be done in the “Site” table as explain
above or more quickly through the following operations:Right click on a group of the “Hexagonal Design” folder and select “Delete”, then the entire
group of sites will be deleted.
© Forsk 2010 58/183
8/12/2019 Atoll Getting Started Umts 310 en v1 130228020806 Phpapp02
http://slidepdf.com/reader/full/atoll-getting-started-umts-310-en-v1-130228020806-phpapp02 59/183
Atoll Getting Started UMTS Version 3.1.0
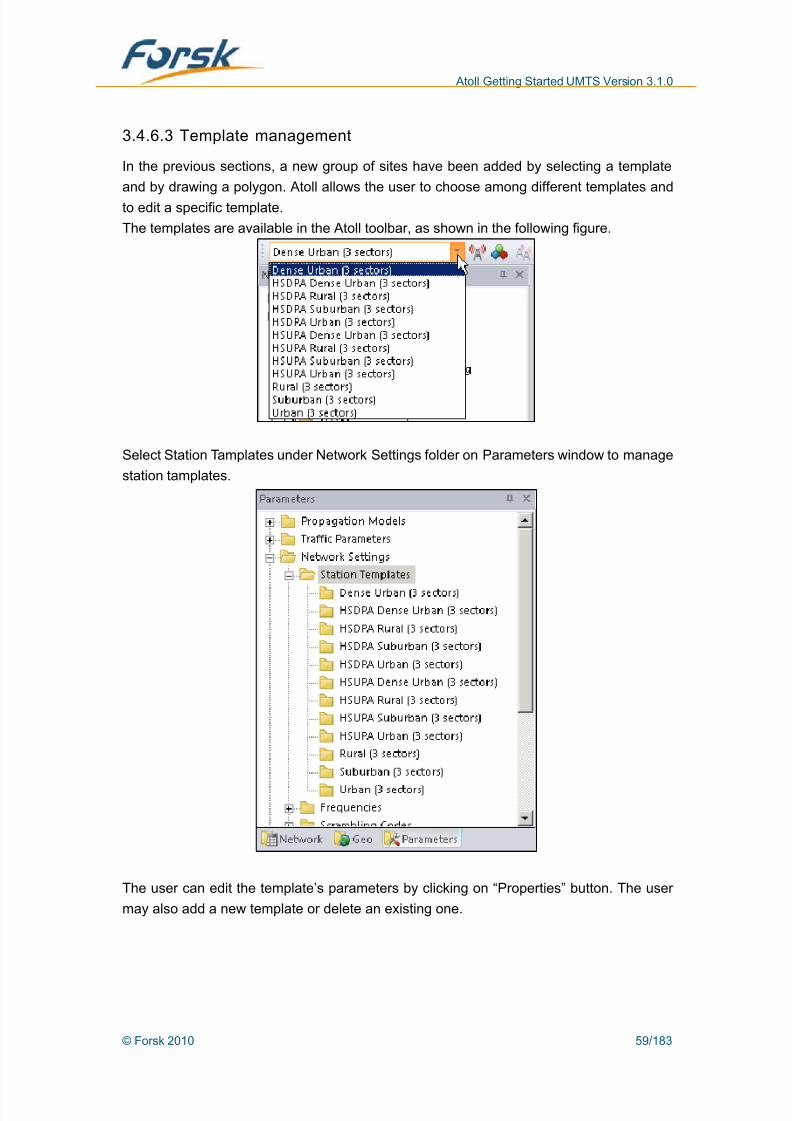
3.4.6.3 Template management
In the previous sections, a new group of sites have been added by selecting a template
and by drawing a polygon. Atoll allows the user to choose among different templates and
to edit a specific template.
The templates are available in the Atoll toolbar, as shown in the following figure.
Select Station Tamplates under Network Settings folder on Parameters window to manage
station tamplates.
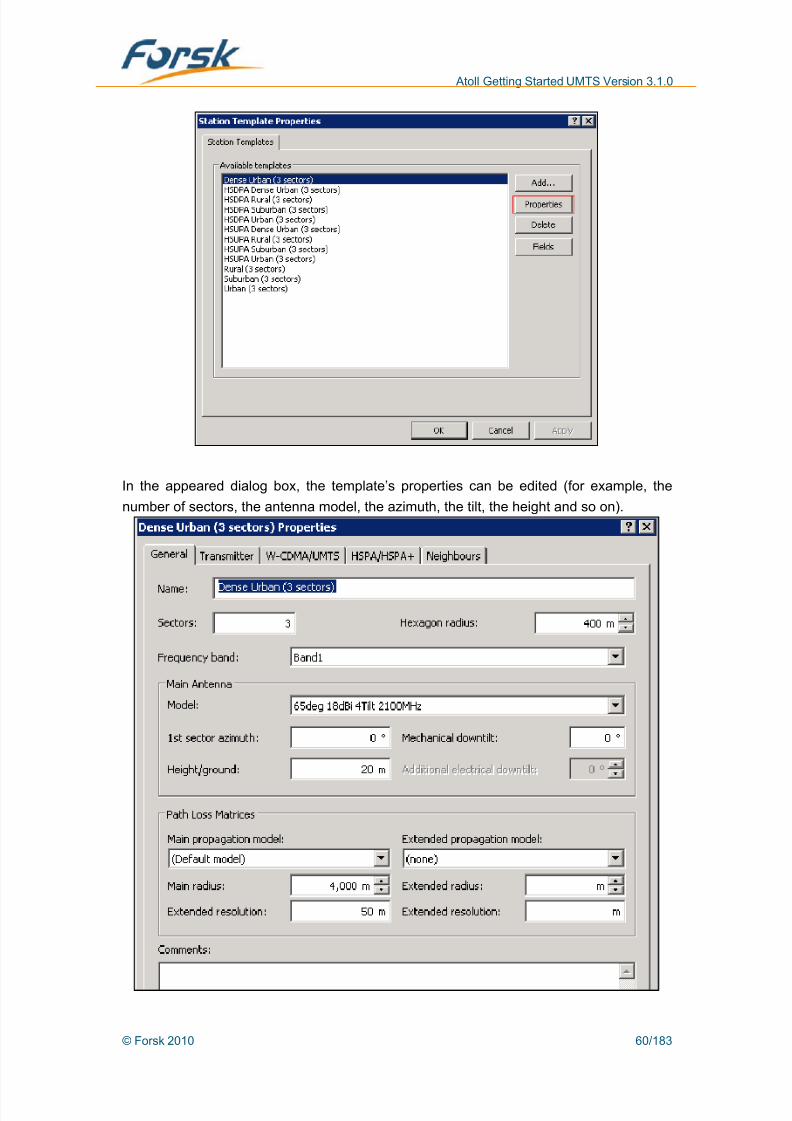
The user can edit the template’s parameters by clicking on “Properties” button. The user
may also add a new template or delete an existing one.
© Forsk 2010 59/183
8/12/2019 Atoll Getting Started Umts 310 en v1 130228020806 Phpapp02
http://slidepdf.com/reader/full/atoll-getting-started-umts-310-en-v1-130228020806-phpapp02 60/183
Atoll Getting Started UMTS Version 3.1.0
In the appeared dialog box, the template’s properties can be edited (for example, the
number of sectors, the antenna model, the azimuth, the tilt, the height and so on).
© Forsk 2010 60/183

8/12/2019 Atoll Getting Started Umts 310 en v1 130228020806 Phpapp02
http://slidepdf.com/reader/full/atoll-getting-started-umts-310-en-v1-130228020806-phpapp02 61/183
Atoll Getting Started UMTS Version 3.1.0
3.5 Propagation model
Atoll integrates many propagation models including Okuruma-Hata, Cost-Hata, SPM.
ITU370, ITU526, ITU 529, Longley-Rice, Erceg-Greenstein(SUI) and WLL models. The
following models are the most commonly used for UMTS projects: Okuruma-Hata,
Cost-Hata and SPM.
3.5.1 SPM propagation model
SPM (Standard Propagation Model) is a model originating from Planet and using K
parameters. The SPM model has also a relation with the Hata model. The SPM model
may be calibrated with CW measurements.
3.5.1.1 Import of CW measurement
Note: the CW measurements used by this document are just for the purpose of
helping the user to be familiar with the use of the software. The detailed
requirements for CW measurements (including data quantity) are described in the
SPM model calibration document, which can be provided upon request.
To import the measurements, there are 2 methods: Copy/Paste and import.
1) Copy/Paste method
(1) Open the “Site89_2 survey” worksheet in the “UMTS_Brussels_Network.xls”
document. This worksheet provides the measurements corresponding to the
“Site89_2” cell with the longitude, the latitude and the received signal level for each
sampling point
(2) In Atoll, right click on the “CW Measurements” folder in the “Network” window, and
© Forsk 2010 61/183

8/12/2019 Atoll Getting Started Umts 310 en v1 130228020806 Phpapp02
http://slidepdf.com/reader/full/atoll-getting-started-umts-310-en-v1-130228020806-phpapp02 62/183
Atoll Getting Started UMTS Version 3.1.0
select “New” in the context menu, as shown in the following figure.
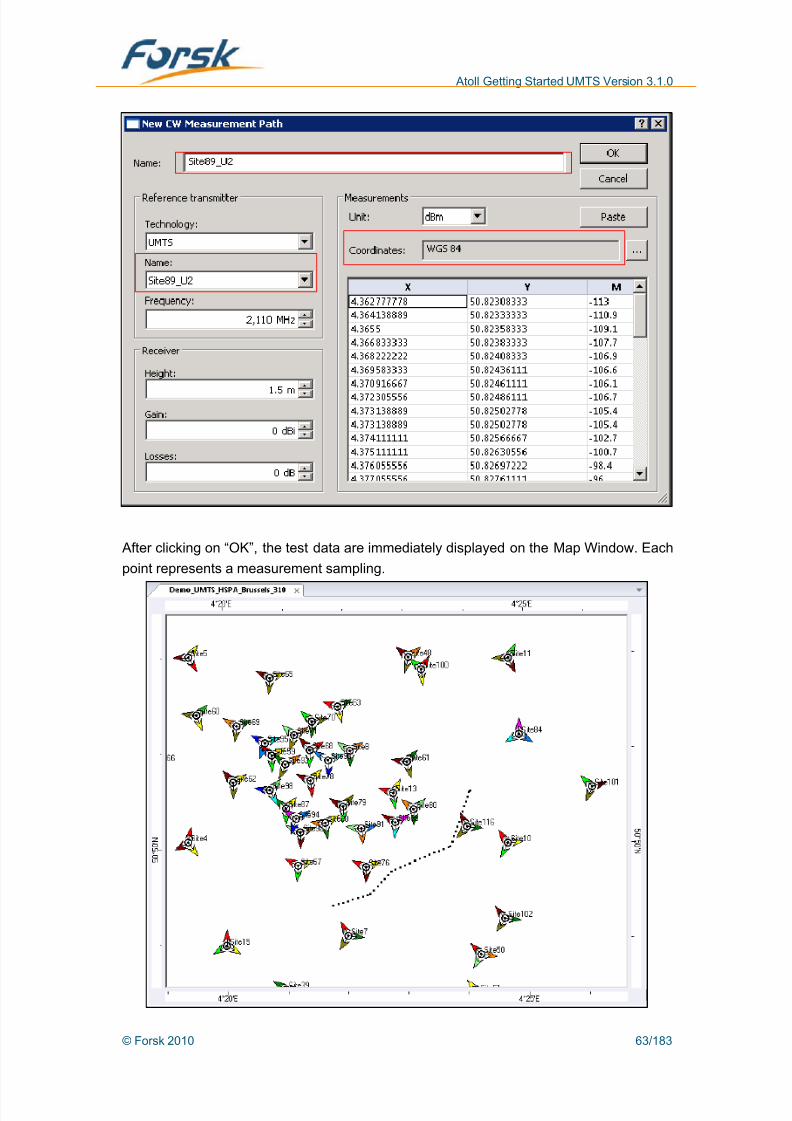
(3) In “New CW Measurement Path” dialog box, fill in the file name, the correspondingtransmitter, the receiver height. Then paste the Excel table data into the table, as
shown in the following figure.
Note: Set the coordinate system with “ WGS84” corresponding to the projection
system use in the Excel tab.
© Forsk 2010 62/183
8/12/2019 Atoll Getting Started Umts 310 en v1 130228020806 Phpapp02
http://slidepdf.com/reader/full/atoll-getting-started-umts-310-en-v1-130228020806-phpapp02 63/183
Atoll Getting Started UMTS Version 3.1.0
After clicking on “OK”, the test data are immediately displayed on the Map Window. Each
point represents a measurement sampling.
© Forsk 2010 63/183

8/12/2019 Atoll Getting Started Umts 310 en v1 130228020806 Phpapp02
http://slidepdf.com/reader/full/atoll-getting-started-umts-310-en-v1-130228020806-phpapp02 64/183
Atoll Getting Started UMTS Version 3.1.0
2) Import method
(1) Atoll supports the formats .dat, .txt, .csv and .hd (PlaNET).
(2) Please find 3 .txt documents inside the “Reference_Data” folder of the CDROM.
(3) In Atoll, right click on “CW measurements” in the “Network” window and select“Import” as shown in the following figure.
(4) In the appeared “Open” dialog box, browse for the document to be imported. Atoll
supports the multi selection of files. Several measurements corresponding to the
same transmitter can be imported at the same time, but if the measurements
belong to different transmitters, then each measurement has to be imported
separately.
Provided test data corresponding to different transmitters, the measurements have to be
imported one by one.
© Forsk 2010 64/183

8/12/2019 Atoll Getting Started Umts 310 en v1 130228020806 Phpapp02
http://slidepdf.com/reader/full/atoll-getting-started-umts-310-en-v1-130228020806-phpapp02 65/183
Atoll Getting Started UMTS Version 3.1.0
(5) The appeared dialog box contains two tabs, “General” and “Setup”. In the
“General” tab, define the corresponding reference transmitter, the frequency and
receiver height, as shown in the following figure.
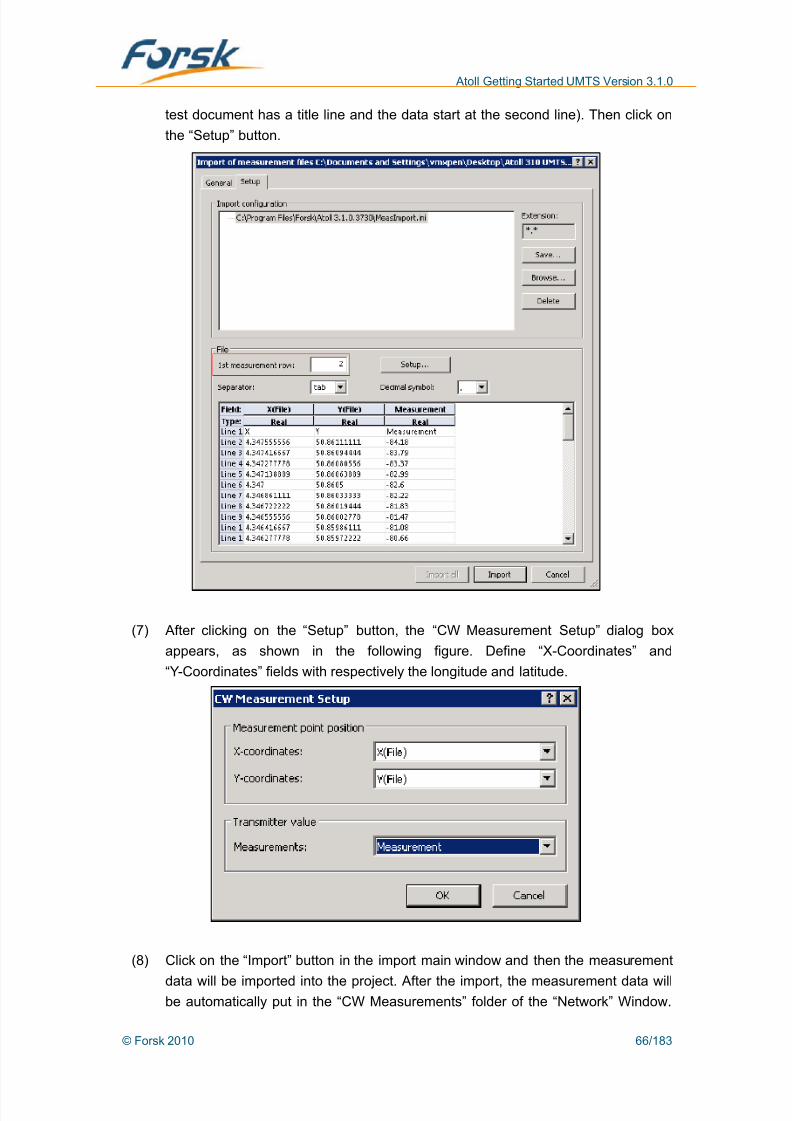
(6) In the “Setup” tab, fill in the “1st Measurement Row” field with 2 (because the drive
© Forsk 2010 65/183
8/12/2019 Atoll Getting Started Umts 310 en v1 130228020806 Phpapp02
http://slidepdf.com/reader/full/atoll-getting-started-umts-310-en-v1-130228020806-phpapp02 66/183
Atoll Getting Started UMTS Version 3.1.0
test document has a title line and the data start at the second line). Then click on
the “Setup” button.
(7) After clicking on the “Setup” button, the “CW Measurement Setup” dialog box
appears, as shown in the following figure. Define “X-Coordinates” and
“Y-Coordinates” fields with respectively the longitude and latitude.
(8) Click on the “Import” button in the import main window and then the measurement
data will be imported into the project. After the import, the measurement data willbe automatically put in the “CW Measurements” folder of the “Network” Window.
© Forsk 2010 66/183
8/12/2019 Atoll Getting Started Umts 310 en v1 130228020806 Phpapp02
http://slidepdf.com/reader/full/atoll-getting-started-umts-310-en-v1-130228020806-phpapp02 67/183
Atoll Getting Started UMTS Version 3.1.0
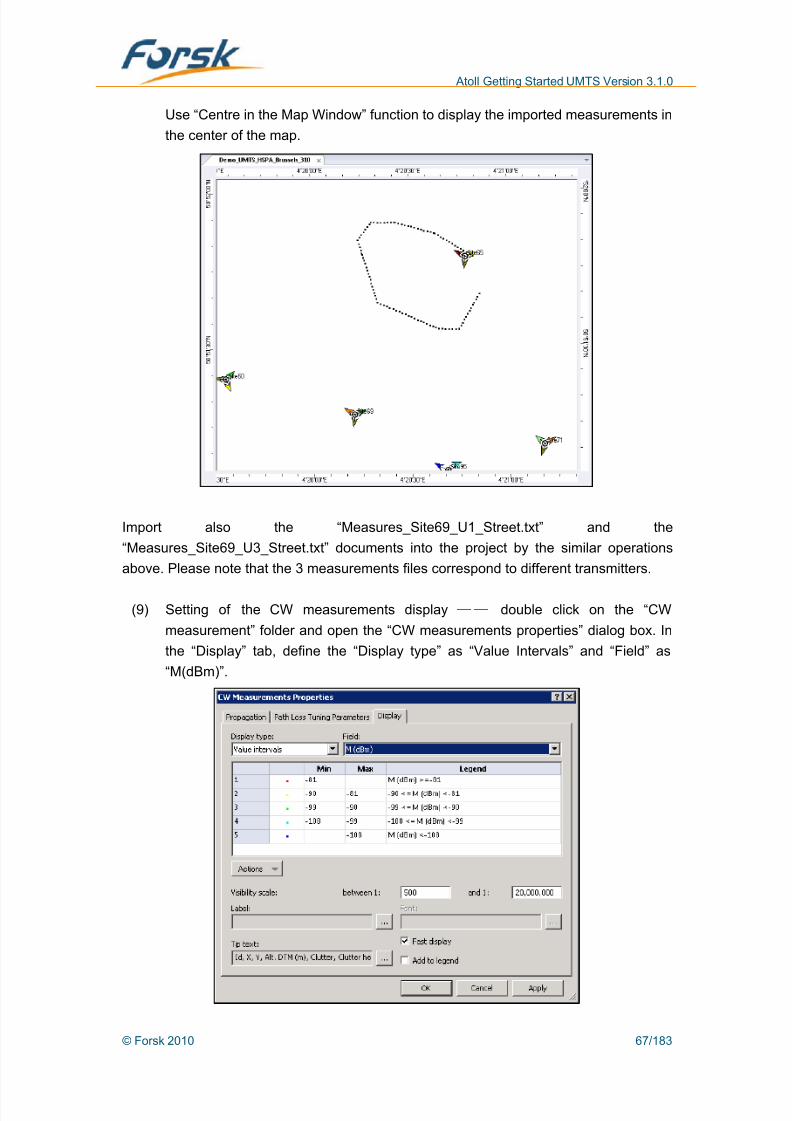
Use “Centre in the Map Window” function to display the imported measurements in
the center of the map.
Import also the “Measures_Site69_U1_Street.txt” and the
“Measures_Site69_U3_Street.txt” documents into the project by the similar operations
above. Please note that the 3 measurements files correspond to different transmitters.
(9) Setting of the CW measurements display —— double click on the “CW
measurement” folder and open the “CW measurements properties” dialog box. In
the “Display” tab, define the “Display type” as “Value Intervals” and “Field” as
“M(dBm)”.
© Forsk 2010 67/183

8/12/2019 Atoll Getting Started Umts 310 en v1 130228020806 Phpapp02
http://slidepdf.com/reader/full/atoll-getting-started-umts-310-en-v1-130228020806-phpapp02 68/183

8/12/2019 Atoll Getting Started Umts 310 en v1 130228020806 Phpapp02
http://slidepdf.com/reader/full/atoll-getting-started-umts-310-en-v1-130228020806-phpapp02 69/183
Atoll Getting Started UMTS Version 3.1.0
(3) In the appeared dialog box, select the K parameters that will be used for the
calibration. It is recommended not to select the K6 parameter.
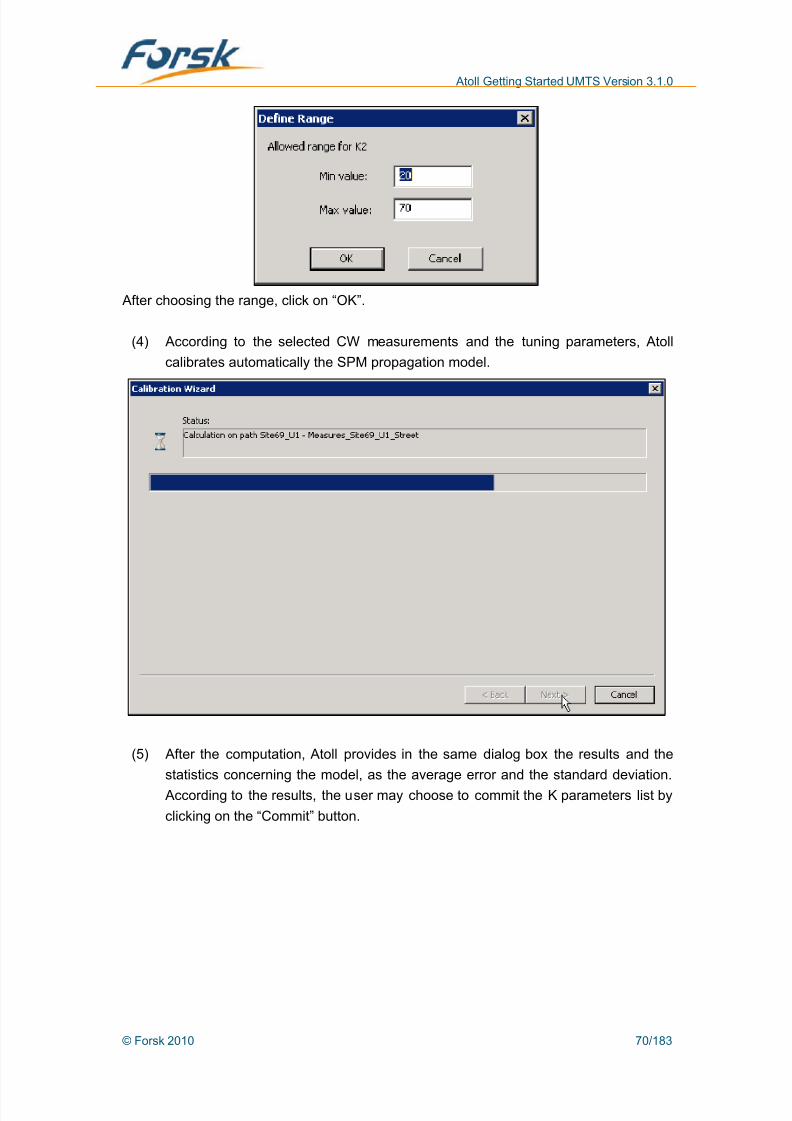
Double click on a K parameter or select a K parameter and click on “Define Range”, will
open the “Define Domain” dialog box, where the range of the K parameter can be defined,
as shown in the following figure. But generally it is recommended to keep the default
values defined above.
© Forsk 2010 69/183
8/12/2019 Atoll Getting Started Umts 310 en v1 130228020806 Phpapp02
http://slidepdf.com/reader/full/atoll-getting-started-umts-310-en-v1-130228020806-phpapp02 70/183
Atoll Getting Started UMTS Version 3.1.0
After choosing the range, click on “OK”.
(4) According to the selected CW measurements and the tuning parameters, Atoll
calibrates automatically the SPM propagation model.
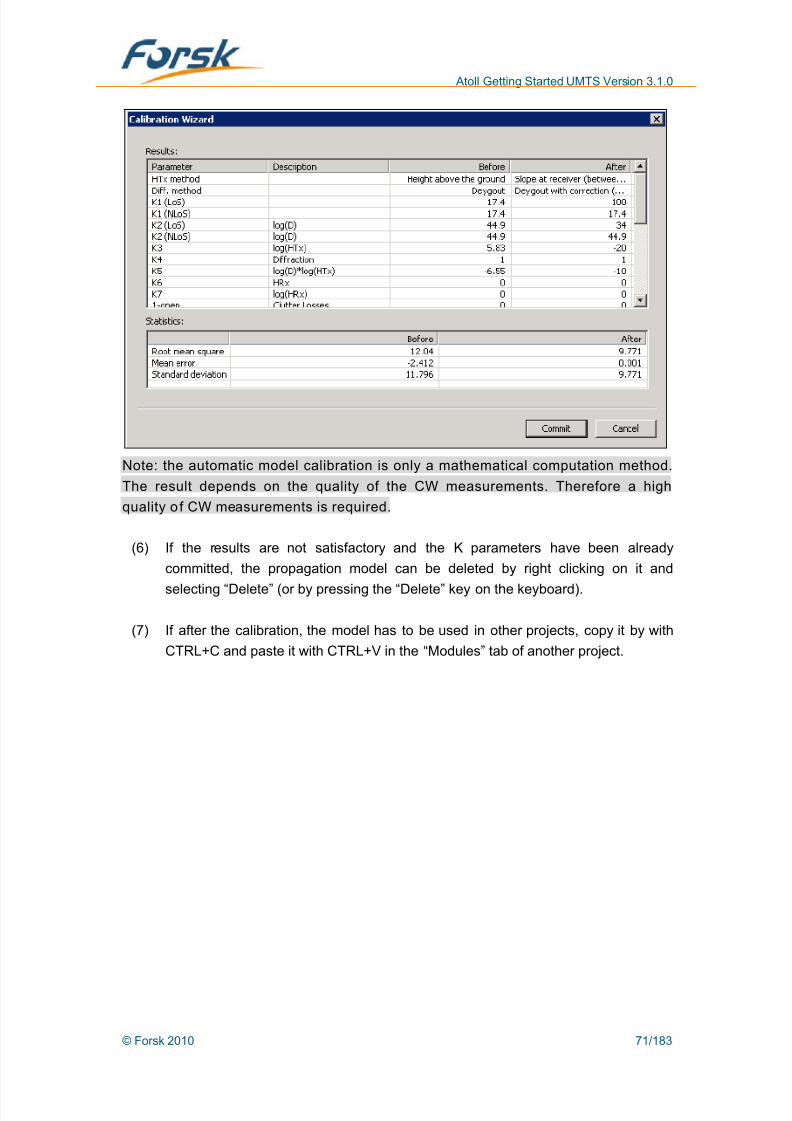
(5) After the computation, Atoll provides in the same dialog box the results and the
statistics concerning the model, as the average error and the standard deviation.
According to the results, the user may choose to commit the K parameters list by
clicking on the “Commit” button.
© Forsk 2010 70/183
8/12/2019 Atoll Getting Started Umts 310 en v1 130228020806 Phpapp02
http://slidepdf.com/reader/full/atoll-getting-started-umts-310-en-v1-130228020806-phpapp02 71/183
Atoll Getting Started UMTS Version 3.1.0
Note: the automatic model calibration is only a mathematical computation method.
The result depends on the quality of the CW measurements. Therefore a high
quality of CW measurements is required.
(6) If the results are not satisfactory and the K parameters have been already
committed, the propagation model can be deleted by right clicking on it and
selecting “Delete” (or by pressing the “Delete” key on the keyboard).
(7) If after the calibration, the model has to be used in other projects, copy it by with
CTRL+C and paste it with CTRL+V in the “Modules” tab of another project.
© Forsk 2010 71/183
8/12/2019 Atoll Getting Started Umts 310 en v1 130228020806 Phpapp02
http://slidepdf.com/reader/full/atoll-getting-started-umts-310-en-v1-130228020806-phpapp02 72/183
Atoll Getting Started UMTS Version 3.1.0
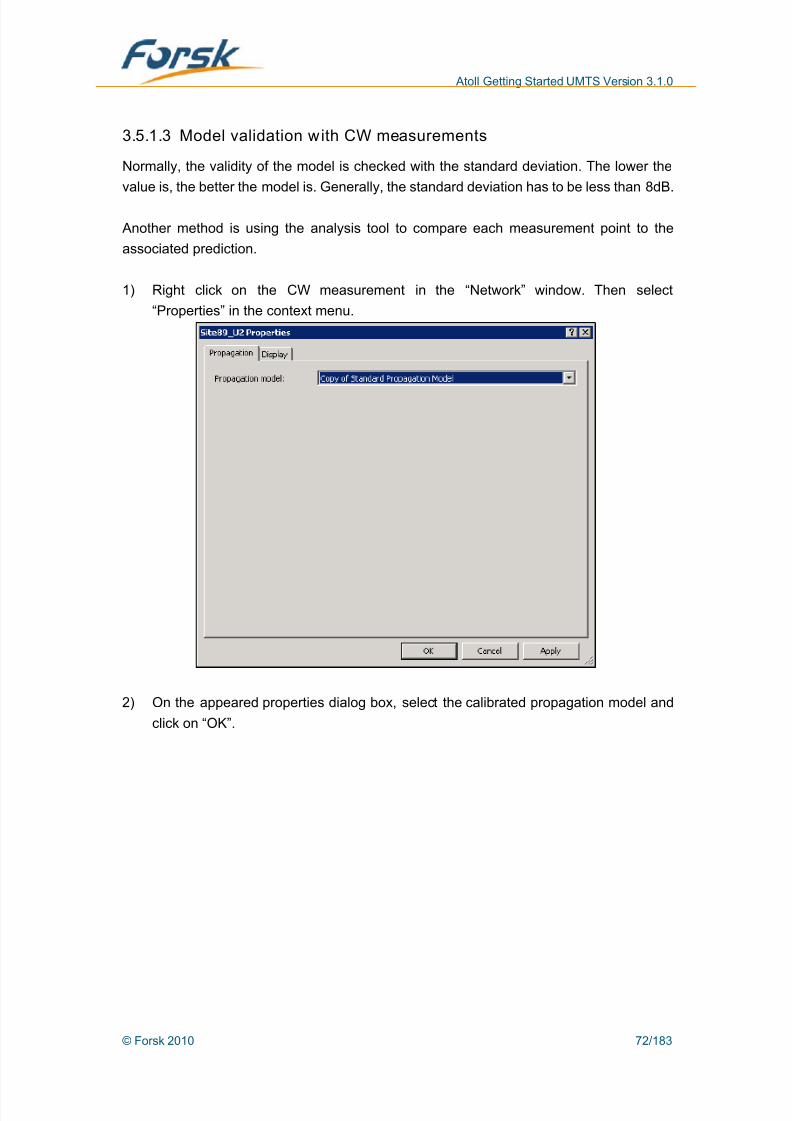
3.5.1.3 Model validation with CW measurements
Normally, the validity of the model is checked with the standard deviation. The lower the
value is, the better the model is. Generally, the standard deviation has to be less than 8dB.
Another method is using the analysis tool to compare each measurement point to the
associated prediction.
1) Right click on the CW measurement in the “Network” window. Then select
“Properties” in the context menu.
2) On the appeared properties dialog box, select the calibrated propagation model and
click on “OK”.
© Forsk 2010 72/183

8/12/2019 Atoll Getting Started Umts 310 en v1 130228020806 Phpapp02
http://slidepdf.com/reader/full/atoll-getting-started-umts-310-en-v1-130228020806-phpapp02 73/183
Atoll Getting Started UMTS Version 3.1.0
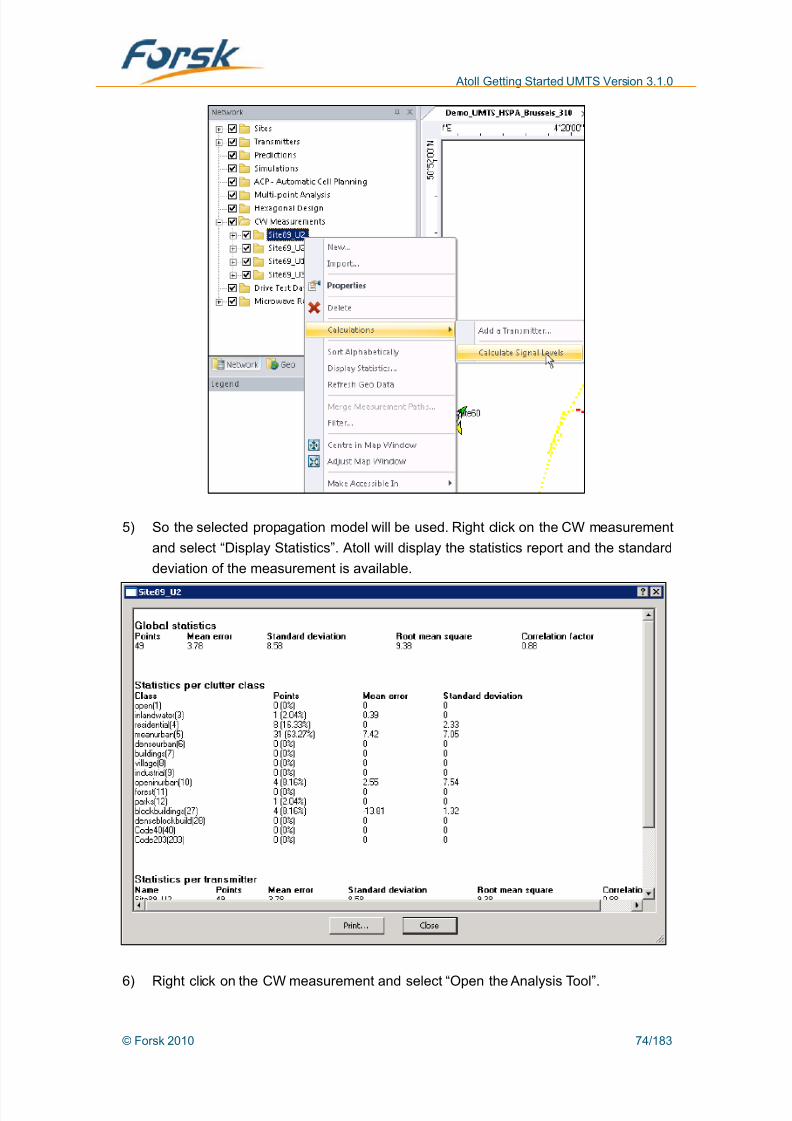
3) Right click on the CW measurement and select “Refresh Geo Data”.
4) Afterward right click on the CW measurement and select the “Calculations->
Calculate Signal Levels” function.
© Forsk 2010 73/183
8/12/2019 Atoll Getting Started Umts 310 en v1 130228020806 Phpapp02
http://slidepdf.com/reader/full/atoll-getting-started-umts-310-en-v1-130228020806-phpapp02 74/183

8/12/2019 Atoll Getting Started Umts 310 en v1 130228020806 Phpapp02
http://slidepdf.com/reader/full/atoll-getting-started-umts-310-en-v1-130228020806-phpapp02 75/183
Atoll Getting Started UMTS Version 3.1.0
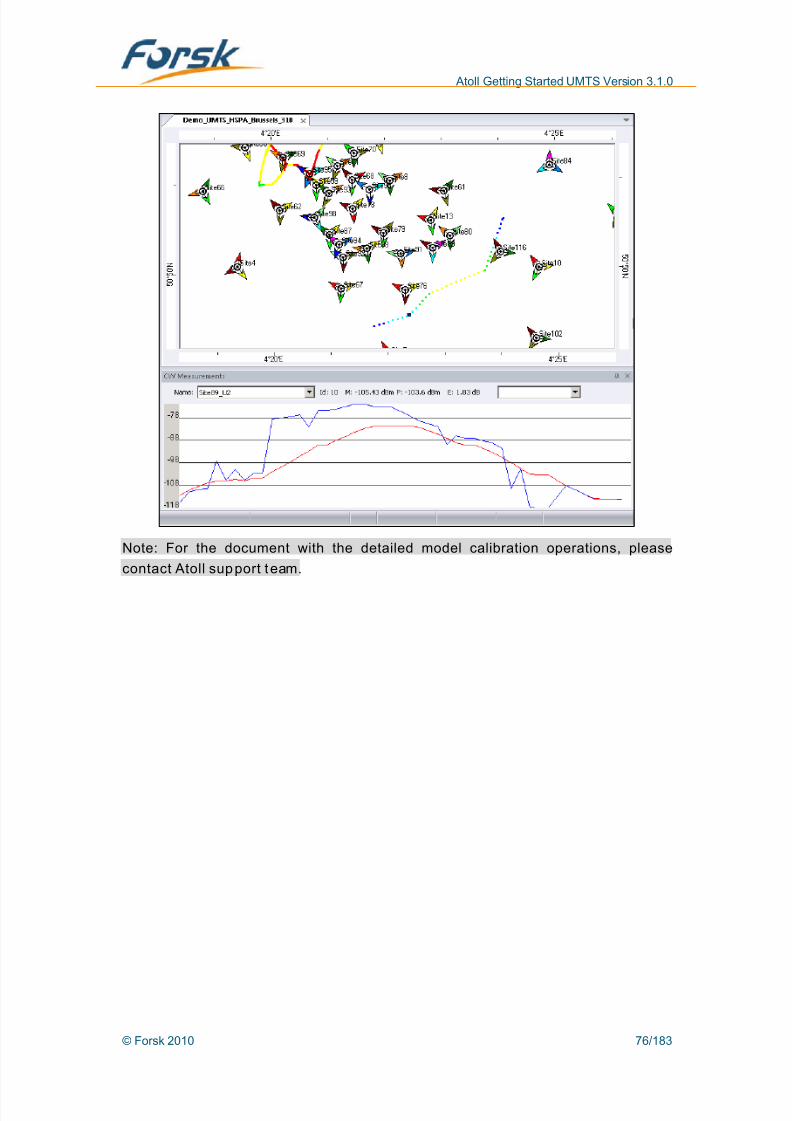
Atoll displays automatically the “CW measurements” window, as shown in the following
figure. With the cursor clicking in the “CW measurements” window and Atoll will
simultaneously represent the drive test position in the Map Window. For the selected point
Atoll provides the measurement value (M) and the predicted value (P). On the right of the
“CW measurements” window the user can add an additional result, as the difference
between M and P.
© Forsk 2010 75/183
8/12/2019 Atoll Getting Started Umts 310 en v1 130228020806 Phpapp02
http://slidepdf.com/reader/full/atoll-getting-started-umts-310-en-v1-130228020806-phpapp02 76/183
Atoll Getting Started UMTS Version 3.1.0
Note: For the document with the detailed model calibration operations, please
contact Atoll support team.
© Forsk 2010 76/183

8/12/2019 Atoll Getting Started Umts 310 en v1 130228020806 Phpapp02
http://slidepdf.com/reader/full/atoll-getting-started-umts-310-en-v1-130228020806-phpapp02 77/183
Atoll Getting Started UMTS Version 3.1.0
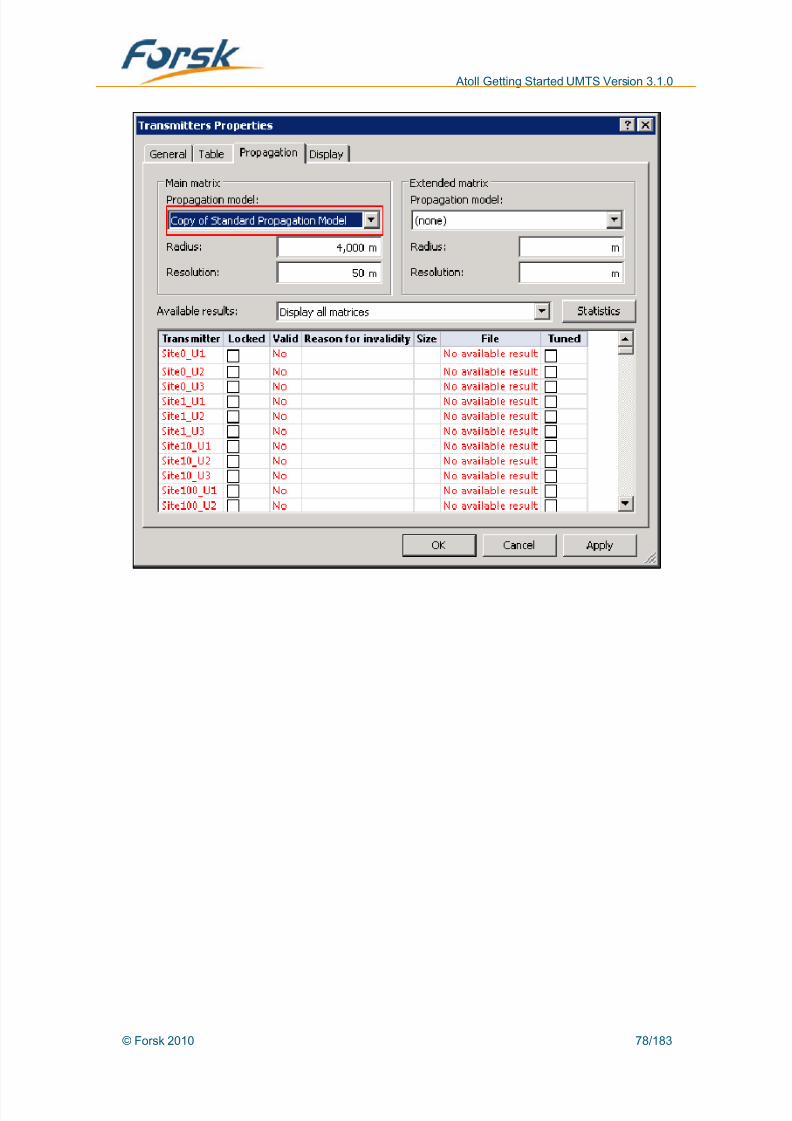
3.5.1.4 Set the propagation model for each transmit ter
After the calibration of the propagation model, open the “Transmitters” tab and select the
propagation model in pull-down menu of the “Main propagation model” field. The user may
use Ctrl + D.
If all transmitters use the same propagation model, then the quickest way is to define the
model in the “Transmitters properties” dialog box. In the “Propagation” tab, select the
propagation model and choose the radius and the resolution (Normally the resolution is
the same as the digital map).
© Forsk 2010 77/183
8/12/2019 Atoll Getting Started Umts 310 en v1 130228020806 Phpapp02
http://slidepdf.com/reader/full/atoll-getting-started-umts-310-en-v1-130228020806-phpapp02 78/183
Atoll Getting Started UMTS Version 3.1.0
© Forsk 2010 78/183
8/12/2019 Atoll Getting Started Umts 310 en v1 130228020806 Phpapp02
http://slidepdf.com/reader/full/atoll-getting-started-umts-310-en-v1-130228020806-phpapp02 79/183
Atoll Getting Started UMTS Version 3.1.0
3.5.2 Cost-Hata model
Okuruma-Hata and Cost-Hata use both the standard Hata formula. The Okuruma-Hata is
suitable for a frequency smaller than 1500MHz and Cost-Hata is suitable for a frequency
bigger than 1500MHz. So Cost-Hata will be used for a CDMA network.
Both Okuruma-Hata and Cost-Hata can be calibrated. The following paragraph introduces
only the calibration of the Cost-Hata model, but the calibration of the Okuruma-Hata model
is similar.
3.5.2.1 Import of CW measurements
Please refer to the paragraph 3.5.1.1.
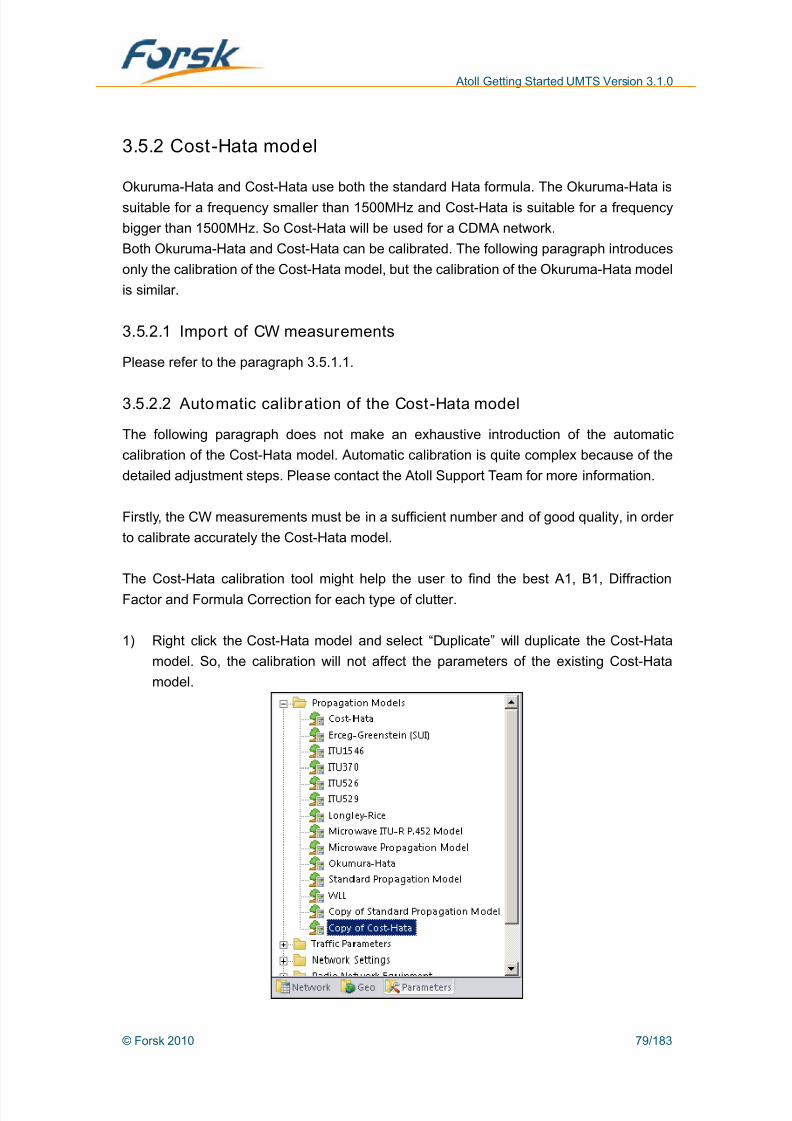
3.5.2.2 Automatic calibration of the Cost-Hata model
The following paragraph does not make an exhaustive introduction of the automatic
calibration of the Cost-Hata model. Automatic calibration is quite complex because of the
detailed adjustment steps. Please contact the Atoll Support Team for more information.
Firstly, the CW measurements must be in a sufficient number and of good quality, in order
to calibrate accurately the Cost-Hata model.
The Cost-Hata calibration tool might help the user to find the best A1, B1, Diffraction
Factor and Formula Correction for each type of clutter.
1) Right click the Cost-Hata model and select “Duplicate” will duplicate the Cost-Hata
model. So, the calibration will not affect the parameters of the existing Cost-Hata
model.
© Forsk 2010 79/183

8/12/2019 Atoll Getting Started Umts 310 en v1 130228020806 Phpapp02
http://slidepdf.com/reader/full/atoll-getting-started-umts-310-en-v1-130228020806-phpapp02 80/183
Atoll Getting Started UMTS Version 3.1.0
2) Double click on the folder “Copy of Cost-Hata” will open the properties dialogue. The
Cost-Hata propagation model can use an environment formula appropriate to each
clutter class when calculating. Furthermore, Cost-Hata propagation model can “add
diffraction loss” and take into account “limitation to free space loss”.
Add di ff rac tion loss: The Cost-Hata propagation model can take into account
losses due to diffraction, using a 1-knife-edge Deygout method, and using the ground
altitude given in the DTM. The diffraction can be weighted for each Hata environment
formula.
Limitation to free space loss: When using a Hata-based propagation model, it is
possible to calculate a theoretical path loss that ends up being lower than the free
space loss. In Atoll, you can define any Hata-based propagation model to never
calculate a path loss that is lower than the calculated free space loss per pixel.
3) Right click on the folder “Copy of Cost-Hata” and select “Calibration” will open the
calibration wizard. Select one or several CW measurement(s) and click “Next”, asshown in the following figure.
© Forsk 2010 80/183

8/12/2019 Atoll Getting Started Umts 310 en v1 130228020806 Phpapp02
http://slidepdf.com/reader/full/atoll-getting-started-umts-310-en-v1-130228020806-phpapp02 81/183
Atoll Getting Started UMTS Version 3.1.0
4) In the appeared dialogue select the parameters that Atoll will calibrate and click
“Next”, as shown in the following figure.
5) Atoll automatically calibrates the Cost-Hata model and displays the parameters
before and after the calibration. Atoll provides also the root mean square, the
average and the standard deviation before and after the calibration. According to the
results the user can choose to commit the result by clicking on the “Commit” button.
© Forsk 2010 81/183

8/12/2019 Atoll Getting Started Umts 310 en v1 130228020806 Phpapp02
http://slidepdf.com/reader/full/atoll-getting-started-umts-310-en-v1-130228020806-phpapp02 82/183
Atoll Getting Started UMTS Version 3.1.0
6) If a propagation model is not useful, it’s easy to delete it by right clicking on the
Cost-Hata model and select “Delete” or use the “Delete” key on the keyboard.
7) If the user wants to use the propagation model in another Atoll project, just copy the
existing propagation model with CTRL+C and then paste it in the new project with
CTRL+V.
3.5.2.3 Cost-Hata model properties
1) Double click on “Copy of Cost-Hata” in “Parameters” window (or right click on the
“Copy of Cost-Hata” icon and select “Properties”) will open the “Copy of Cost-Hata
properties” dialog box.
© Forsk 2010 82/183

8/12/2019 Atoll Getting Started Umts 310 en v1 130228020806 Phpapp02
http://slidepdf.com/reader/full/atoll-getting-started-umts-310-en-v1-130228020806-phpapp02 83/183
Atoll Getting Started UMTS Version 3.1.0
2) In the “Copy of Cost-Hata properties” dialog box, the propagation formula has to be
set for each kind of clutter. Click on the “Formulas” button on the bottom left for
checking “Copy of Cost-Hata” formulas and default values. The propagation
parameters have to be set according to the user experience.
3) Set the appropriate formula for each kind of clutter in the “Copy of Cost-Hata”
properties dialog box. The following figure is an example of the “Copy of Cost-Hata”
properties setting (the properties dialog box has to be set according to the user’s
network environment).
© Forsk 2010 83/183

8/12/2019 Atoll Getting Started Umts 310 en v1 130228020806 Phpapp02
http://slidepdf.com/reader/full/atoll-getting-started-umts-310-en-v1-130228020806-phpapp02 84/183
Atoll Getting Started UMTS Version 3.1.0
4) The next step is to set up the “Copy of Cost-Hata” model for all transmitters.
Right click on the ”Transmitter” folder on “Network” window, select “Properties”, and
open the “Transmitters properties” dialog box. In the appeared dialog box, select the
“Propagation” tab and select “Copy of Cost-Hata” for the propagation model, asshown in the following figure.
© Forsk 2010 84/183

8/12/2019 Atoll Getting Started Umts 310 en v1 130228020806 Phpapp02
http://slidepdf.com/reader/full/atoll-getting-started-umts-310-en-v1-130228020806-phpapp02 85/183
Atoll Getting Started UMTS Version 3.1.0
3.6 Propagation matrix calculation
3.6.1 Preliminary work
Before launching the calculation of the pathloss matrices, the following preliminary work
has to be done.
3.6.1.1 Resolution of predictions and receiver alti tude
The user needs also to set the resolution for coverage studies. This resolution may be
equal or lower than the map’s accuracy. The higher the resolution is the longer the
processing time is.
1) Right click on the “Predictions” folder of the “Network” window and select “Properties”(or double click directly on the “Prediction” folder).
2) In the “Predictions properties” dialog box, set the “Default resolution” value to 20m
(this will be the resolution for the following prediction studies). Clicking on “Private
Directory” allows the user to select the path loss document, which will be used to
store the pathloss matrices. The user can either select the “Embedded” option to
store the pathloss matrices in the current Atoll project, or select the “.\xxxxx.losses”
option to store the pathloss matrices in the external “.losses” folder which in the same
directory of the ATL file, or use the “Browse” option to select a folder to store the
pathloss matrices externally.
© Forsk 2010 85/183

8/12/2019 Atoll Getting Started Umts 310 en v1 130228020806 Phpapp02
http://slidepdf.com/reader/full/atoll-getting-started-umts-310-en-v1-130228020806-phpapp02 86/183
Atoll Getting Started UMTS Version 3.1.0
3.6.1.2 Setting the Computation Zone
If there is no computation zone defined, the pathloss matrices for all transmitters will be
calculated, based on the calculation radius and the signal threshold.
If the user wants to calculate the pathloss matrices only for a specific region, a
Computation Zone can either be imported or directly drawn in the Map Window.
1) Drawing the Computation Zone
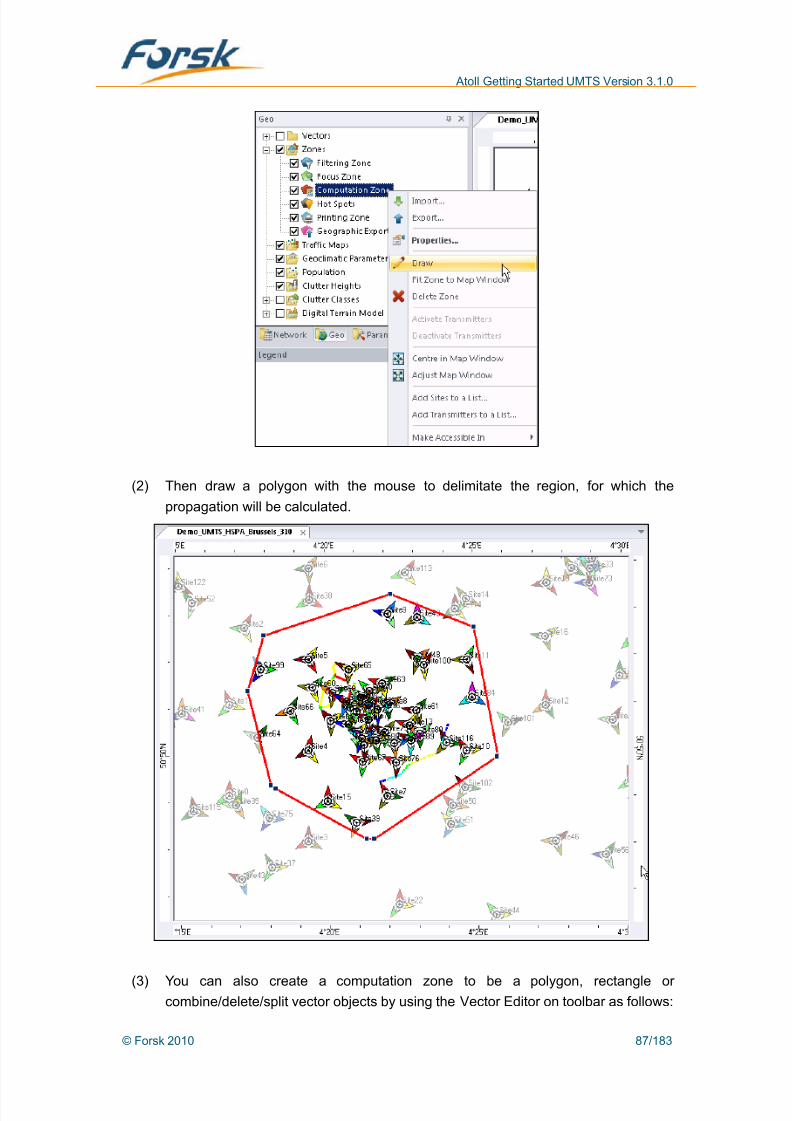
(1) Right click on “Computation Zone” in the “Geo” tab of Explorer Window and select
“Draw” in the context menu.
© Forsk 2010 86/183
8/12/2019 Atoll Getting Started Umts 310 en v1 130228020806 Phpapp02
http://slidepdf.com/reader/full/atoll-getting-started-umts-310-en-v1-130228020806-phpapp02 87/183
Atoll Getting Started UMTS Version 3.1.0
(2) Then draw a polygon with the mouse to delimitate the region, for which the
propagation will be calculated.
(3) You can also create a computation zone to be a polygon, rectangle orcombine/delete/split vector objects by using the Vector Editor on toolbar as follows:
© Forsk 2010 87/183

8/12/2019 Atoll Getting Started Umts 310 en v1 130228020806 Phpapp02
http://slidepdf.com/reader/full/atoll-getting-started-umts-310-en-v1-130228020806-phpapp02 88/183
Atoll Getting Started UMTS Version 3.1.0
2) Import of the Computation Zone
(1) Right click on “Computation Zone” in the “Geo” tab of the Explorer Window and
select “Import” in the context menu.
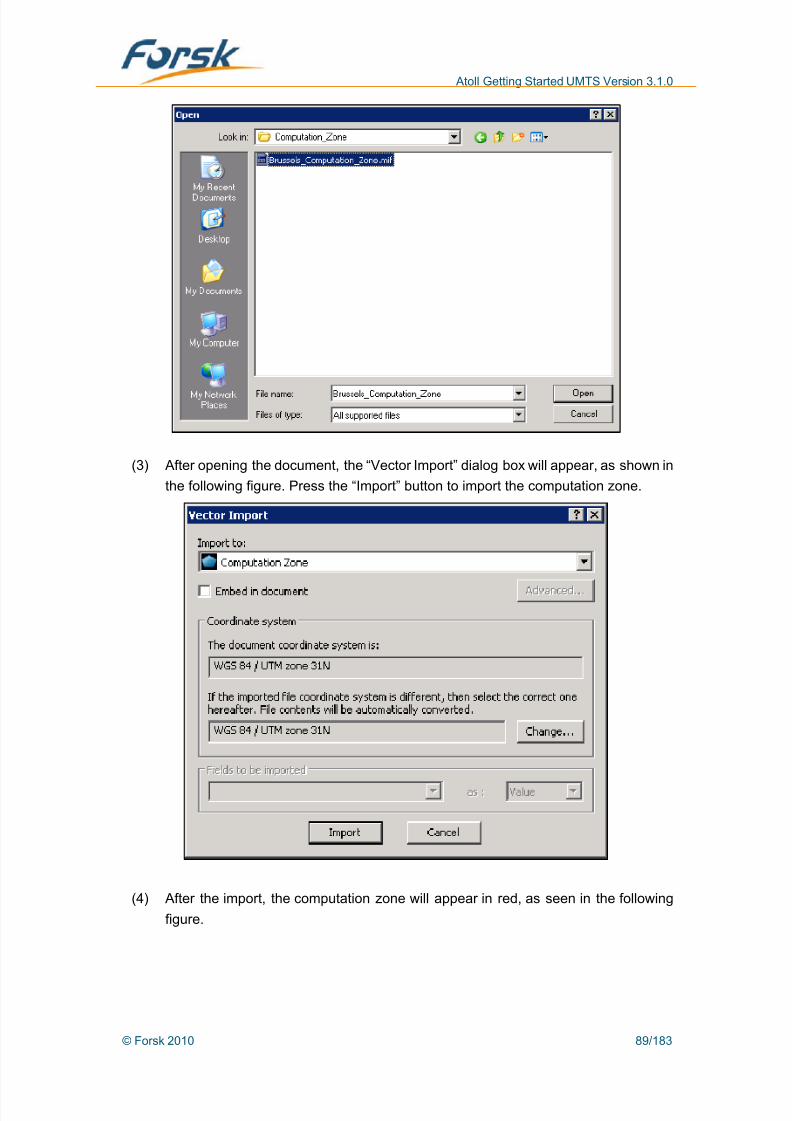
(2) In the appeared dialog box, browse for the “Reference_Data\Computation_Zone”
folder in the CDROM and open the “Brussels_Computation_Zone.mif” document.
© Forsk 2010 88/183
8/12/2019 Atoll Getting Started Umts 310 en v1 130228020806 Phpapp02
http://slidepdf.com/reader/full/atoll-getting-started-umts-310-en-v1-130228020806-phpapp02 89/183
Atoll Getting Started UMTS Version 3.1.0
(3) After opening the document, the “Vector Import” dialog box will appear, as shown in
the following figure. Press the “Import” button to import the computation zone.
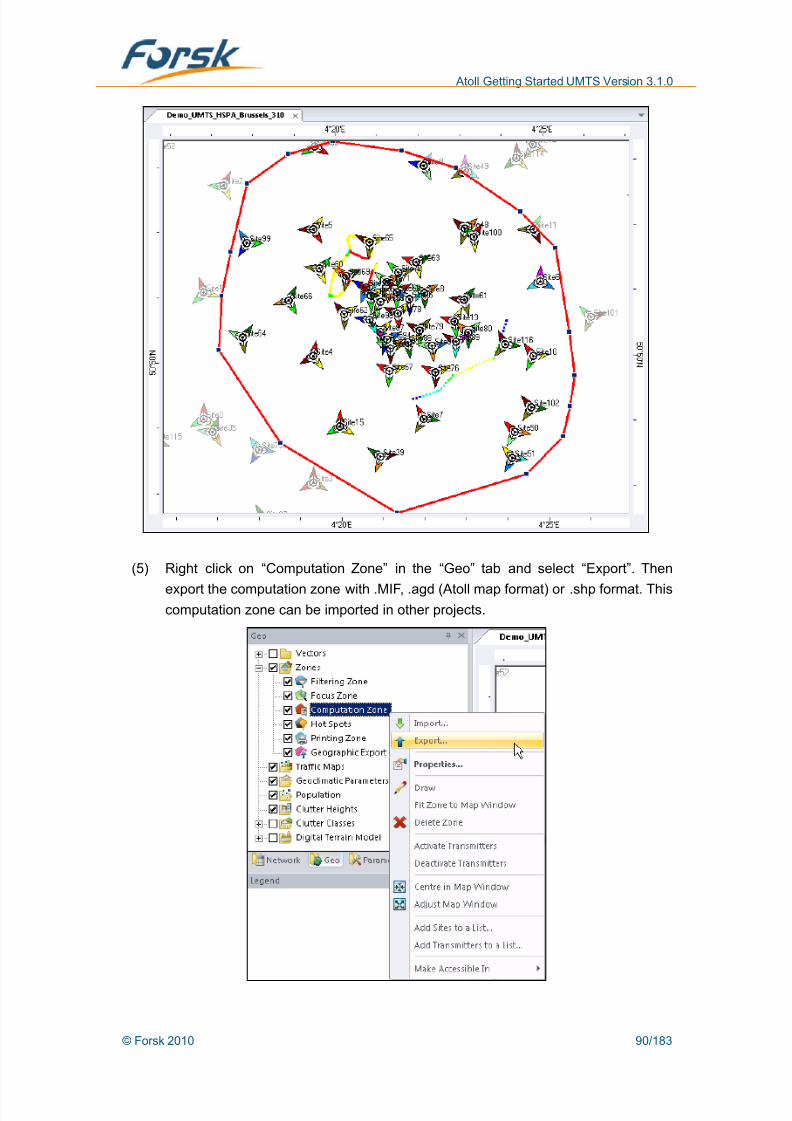
(4) After the import, the computation zone will appear in red, as seen in the following
figure.
© Forsk 2010 89/183
8/12/2019 Atoll Getting Started Umts 310 en v1 130228020806 Phpapp02
http://slidepdf.com/reader/full/atoll-getting-started-umts-310-en-v1-130228020806-phpapp02 90/183
Atoll Getting Started UMTS Version 3.1.0
(5) Right click on “Computation Zone” in the “Geo” tab and select “Export”. Then
export the computation zone with .MIF, .agd (Atoll map format) or .shp format. Thiscomputation zone can be imported in other projects.
© Forsk 2010 90/183

8/12/2019 Atoll Getting Started Umts 310 en v1 130228020806 Phpapp02
http://slidepdf.com/reader/full/atoll-getting-started-umts-310-en-v1-130228020806-phpapp02 91/183
Atoll Getting Started UMTS Version 3.1.0
© Forsk 2010 91/183
8/12/2019 Atoll Getting Started Umts 310 en v1 130228020806 Phpapp02
http://slidepdf.com/reader/full/atoll-getting-started-umts-310-en-v1-130228020806-phpapp02 92/183
Atoll Getting Started UMTS Version 3.1.0
3.6.2 Propagation and prediction studies calculation
The calculations in Atoll are divided in two parts, pathloss matrices calculation and
prediction study calculations.
Propagation calculation:
Calculation of the propagation loss of the link between each transmitter and
each pixel. The calculation results will be saved in the path loss matrices. The
pixel size is the transmitter calculation resolution.
Coverage study prediction
Atoll reads the data from the pathloss matrices, which was calculated
previously, and make a post processing to calculate and display the coverage
study.
If the pathloss matrices have been calculated and there is no modification on the RFparameters (e.g. the site location, the antenna model, the azimuth and so on), Atoll does
not automatically recalculate the pathloss matrices. If some of the RF parameters of some
transmitters are changed, Atoll will recalculate the pathloss matrices for these
transmitters.
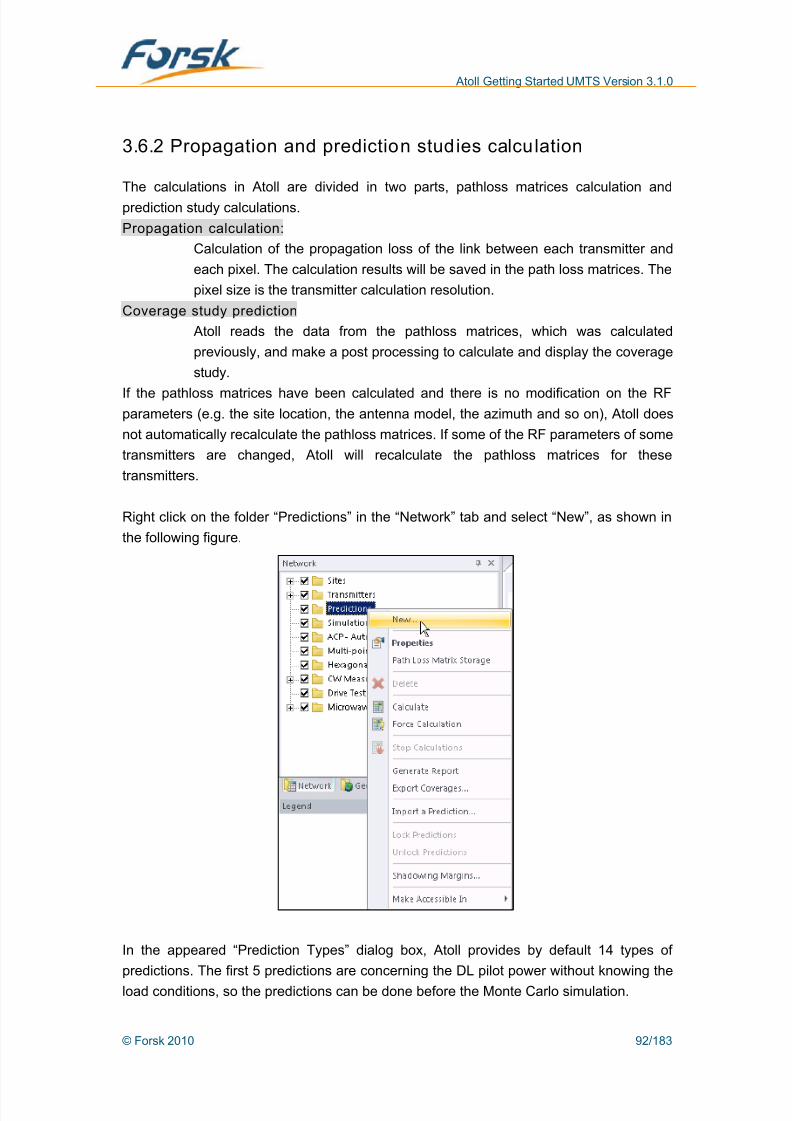
Right click on the folder “Predictions” in the “Network” tab and select “New”, as shown in
the following figure.
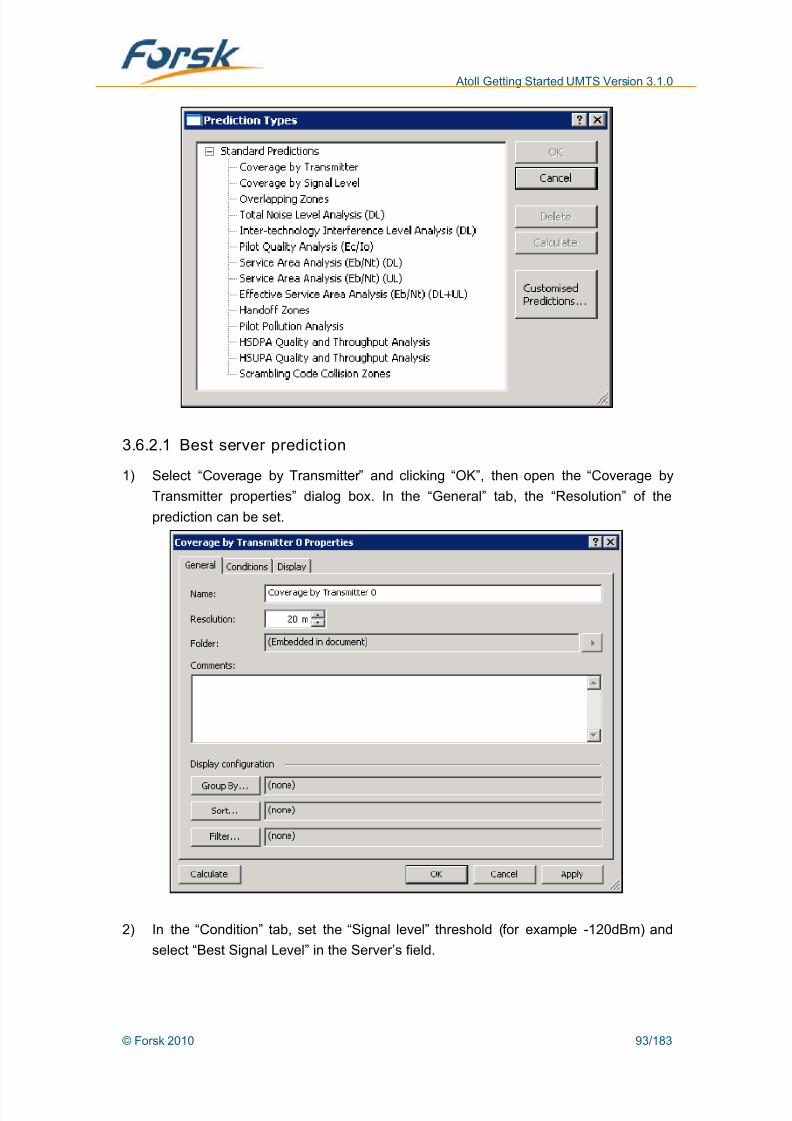
In the appeared “Prediction Types” dialog box, Atoll provides by default 14 types of
predictions. The first 5 predictions are concerning the DL pilot power without knowing the
load conditions, so the predictions can be done before the Monte Carlo simulation.
© Forsk 2010 92/183
8/12/2019 Atoll Getting Started Umts 310 en v1 130228020806 Phpapp02
http://slidepdf.com/reader/full/atoll-getting-started-umts-310-en-v1-130228020806-phpapp02 93/183
Atoll Getting Started UMTS Version 3.1.0
3.6.2.1 Best server predict ion
1) Select “Coverage by Transmitter” and clicking “OK”, then open the “Coverage by
Transmitter properties” dialog box. In the “General” tab, the “Resolution” of the
prediction can be set.
2) In the “Condition” tab, set the “Signal level” threshold (for example -120dBm) and
select “Best Signal Level” in the Server’s field.
© Forsk 2010 93/183

8/12/2019 Atoll Getting Started Umts 310 en v1 130228020806 Phpapp02
http://slidepdf.com/reader/full/atoll-getting-started-umts-310-en-v1-130228020806-phpapp02 94/183
Atoll Getting Started UMTS Version 3.1.0
The default value for the Cell Edge Coverage Probability is 75%. If the standard deviation
is set in the Clutter Classes properties, Atoll will use this value to calculate the Shadowing
Margin. Atoll supports Cell Edge Coverage Probability lower than 50%.
3) In the “Display” tab, define the display attributes, such as coverage transparency andso one.
© Forsk 2010 94/183
8/12/2019 Atoll Getting Started Umts 310 en v1 130228020806 Phpapp02
http://slidepdf.com/reader/full/atoll-getting-started-umts-310-en-v1-130228020806-phpapp02 95/183
Atoll Getting Started UMTS Version 3.1.0
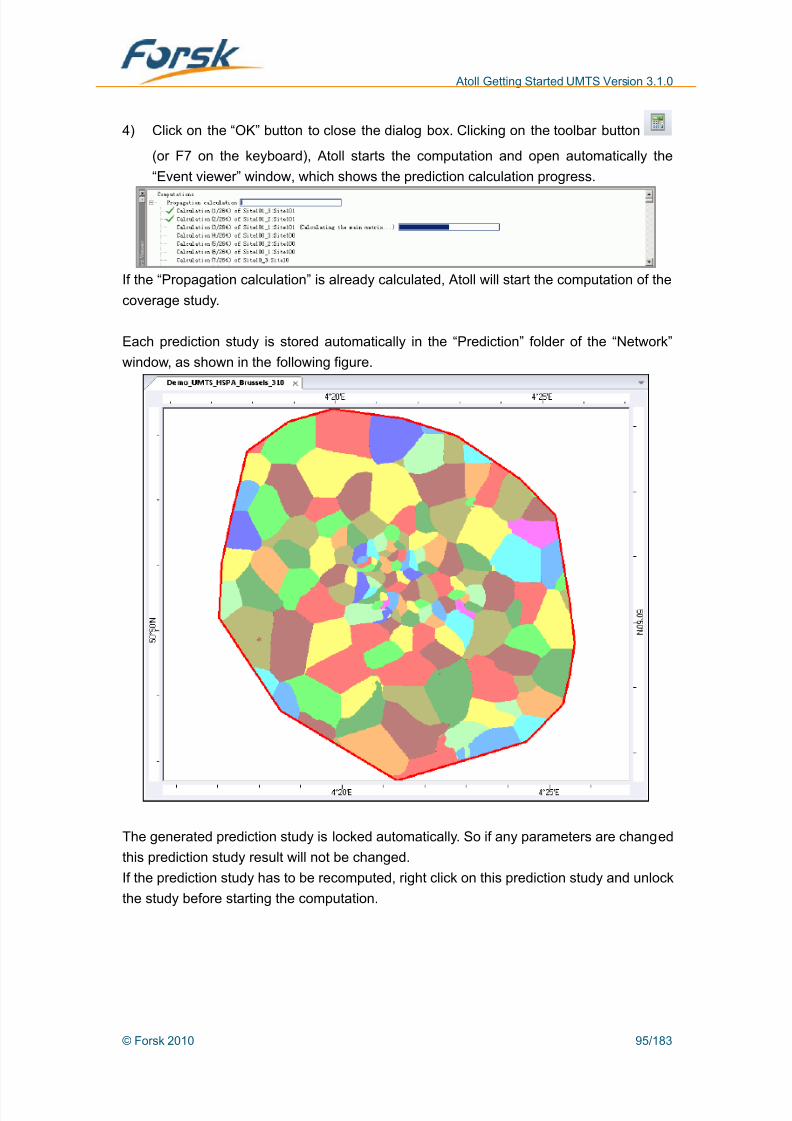
4) Click on the “OK” button to close the dialog box. Clicking on the toolbar button
(or F7 on the keyboard), Atoll starts the computation and open automatically the
“Event viewer” window, which shows the prediction calculation progress.
If the “Propagation calculation” is already calculated, Atoll will start the computation of the
coverage study.
Each prediction study is stored automatically in the “Prediction” folder of the “Network”
window, as shown in the following figure.
The generated prediction study is locked automatically. So if any parameters are changed
this prediction study result will not be changed.
If the prediction study has to be recomputed, right click on this prediction study and unlock
the study before starting the computation.
© Forsk 2010 95/183
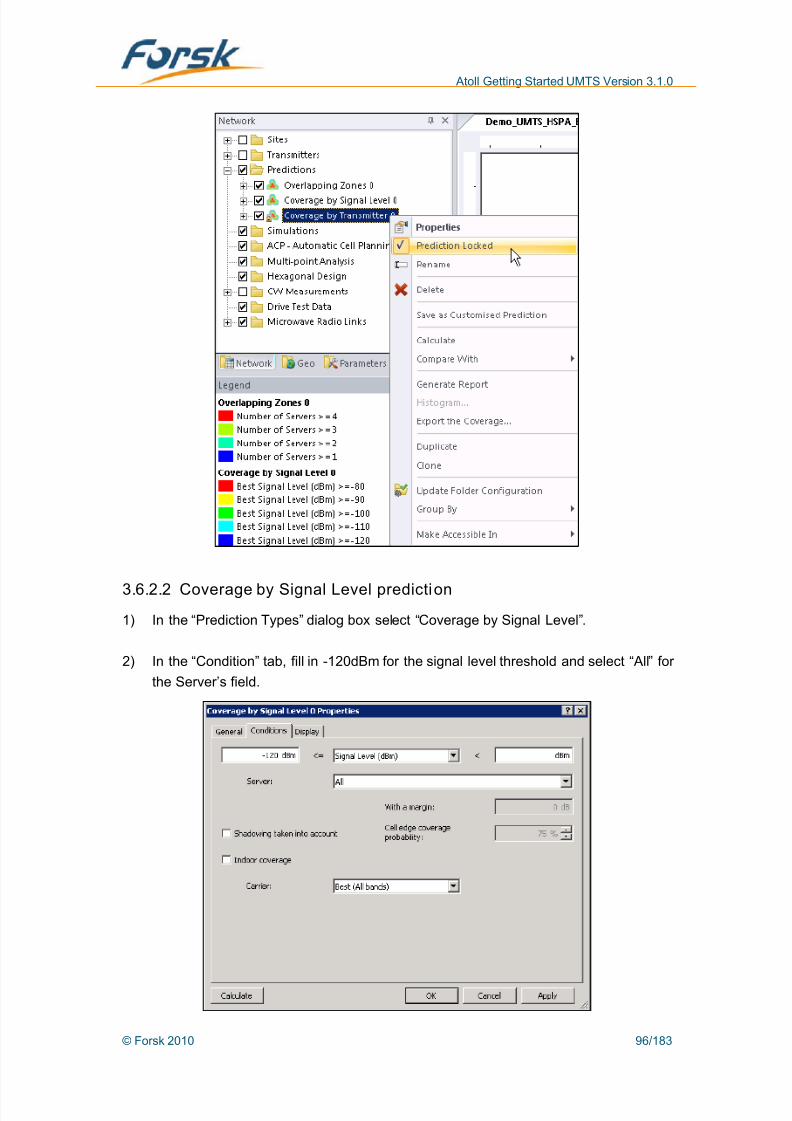
8/12/2019 Atoll Getting Started Umts 310 en v1 130228020806 Phpapp02
http://slidepdf.com/reader/full/atoll-getting-started-umts-310-en-v1-130228020806-phpapp02 96/183
Atoll Getting Started UMTS Version 3.1.0
3.6.2.2 Coverage by Signal Level prediction
1) In the “Prediction Types” dialog box select “Coverage by Signal Level”.
2) In the “Condition” tab, fill in -120dBm for the signal level threshold and select “All” for
the Server’s field.
© Forsk 2010 96/183
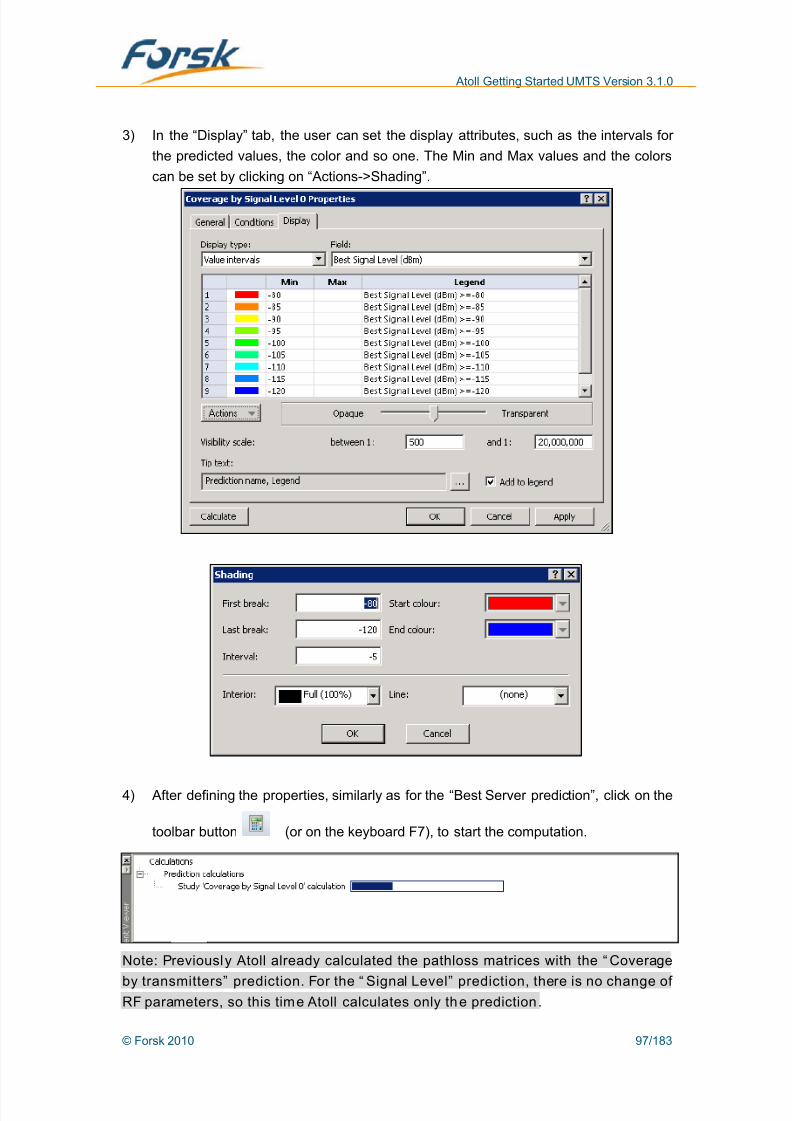
8/12/2019 Atoll Getting Started Umts 310 en v1 130228020806 Phpapp02
http://slidepdf.com/reader/full/atoll-getting-started-umts-310-en-v1-130228020806-phpapp02 97/183
Atoll Getting Started UMTS Version 3.1.0
3) In the “Display” tab, the user can set the display attributes, such as the intervals for
the predicted values, the color and so one. The Min and Max values and the colors
can be set by clicking on “Actions->Shading”.
4) After defining the properties, similarly as for the “Best Server prediction”, click on the
toolbar button (or on the keyboard F7), to start the computation.
Note: Previously Atoll already calculated the pathloss matrices with the “ Coverage
by transmitters” prediction. For the “ Signal Level” prediction, there is no change ofRF parameters, so this time Atoll calculates only the prediction.
© Forsk 2010 97/183

8/12/2019 Atoll Getting Started Umts 310 en v1 130228020806 Phpapp02
http://slidepdf.com/reader/full/atoll-getting-started-umts-310-en-v1-130228020806-phpapp02 98/183
Atoll Getting Started UMTS Version 3.1.0
5) The prediction of the coverage by signal level is represented in the following figure.
6) Selecting “View->Legend Window”, displays the legend in the Map Window.
© Forsk 2010 98/183
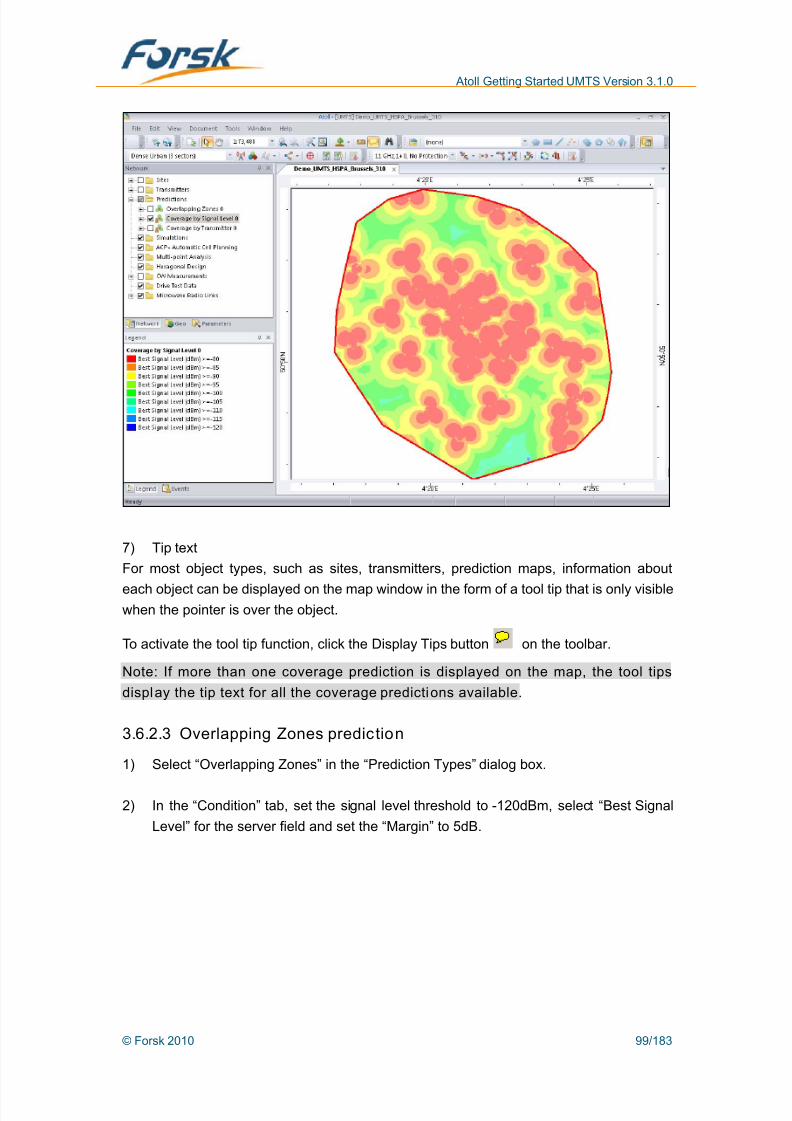
8/12/2019 Atoll Getting Started Umts 310 en v1 130228020806 Phpapp02
http://slidepdf.com/reader/full/atoll-getting-started-umts-310-en-v1-130228020806-phpapp02 99/183
Atoll Getting Started UMTS Version 3.1.0
7) Tip text
For most object types, such as sites, transmitters, prediction maps, information about
each object can be displayed on the map window in the form of a tool tip that is only visiblewhen the pointer is over the object.
To activate the tool tip function, click the Display Tips button on the toolbar.
Note: If more than one coverage prediction is displayed on the map, the tool tips
display the tip text for all the coverage predictions available.
3.6.2.3 Overlapping Zones prediction
1) Select “Overlapping Zones” in the “Prediction Types” dialog box.
2) In the “Condition” tab, set the signal level threshold to -120dBm, select “Best Signal
Level” for the server field and set the “Margin” to 5dB.
© Forsk 2010 99/183
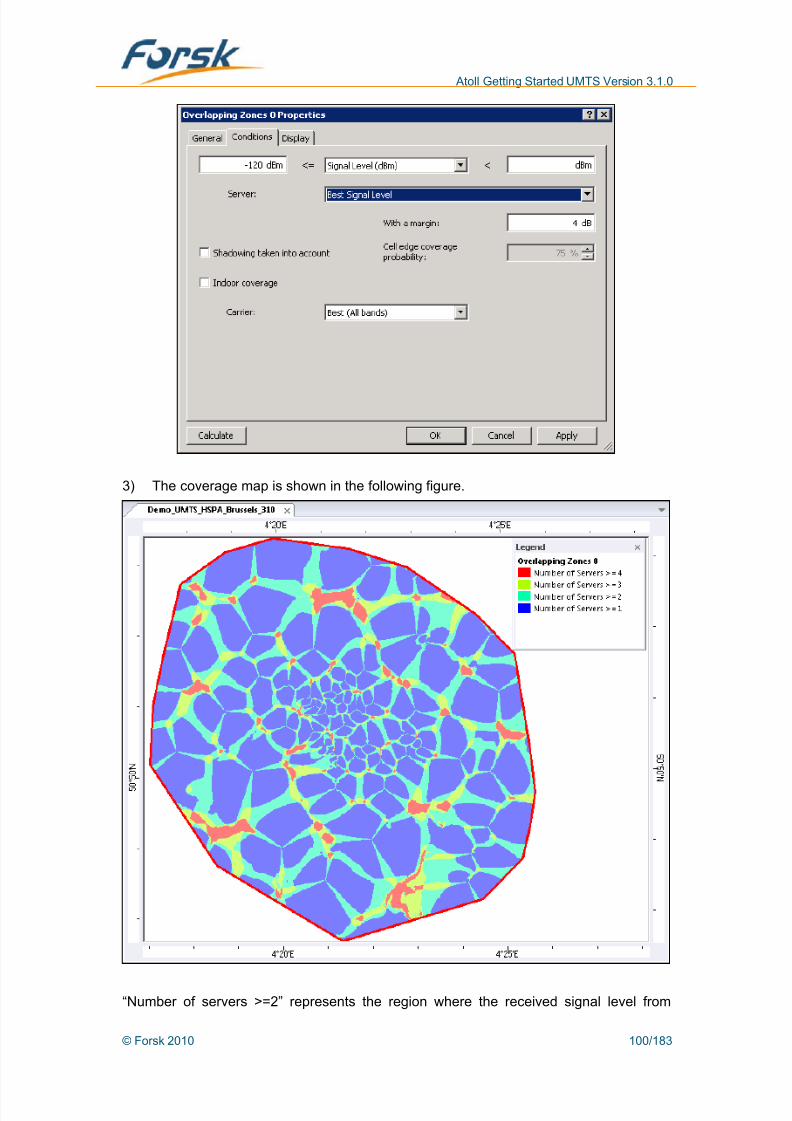
8/12/2019 Atoll Getting Started Umts 310 en v1 130228020806 Phpapp02
http://slidepdf.com/reader/full/atoll-getting-started-umts-310-en-v1-130228020806-phpapp02 100/183

8/12/2019 Atoll Getting Started Umts 310 en v1 130228020806 Phpapp02
http://slidepdf.com/reader/full/atoll-getting-started-umts-310-en-v1-130228020806-phpapp02 101/183
Atoll Getting Started UMTS Version 3.1.0
different pilots have a difference less than 5dB.
“Number of servers >=3” represents the region where the received signal level of 3
different pilots have a difference less than 5dB. And so one。
3.6.2.4 Force calculation
If there is no change in the RF parameters, Atoll won’t recalculate the pathloss matrices
before calculating a prediction. But Atoll also provides the “Force Calculation” function,
which can force the calculation of the pathloss for all transmitters.
Click on the toolbar button to force the recalculation of all path loss matrices.
3.6.2.5 Prediction template management
If the prediction default values don’t match the user’s need, Atoll allows the user to save a
prediction template in order to store the parameters setting.
1) Right click on a prediction study and choose “Save as a Customised Prediction”.
2) A “Save as” dialogue window will prompt up. Define the name and the path of the
XML file you would like to save, as shown in below the figure. By default, the storage
path is the installation folder of Atoll. All the customized prediction studies are savedin this Studies.XML file.
© Forsk 2010 101/183

8/12/2019 Atoll Getting Started Umts 310 en v1 130228020806 Phpapp02
http://slidepdf.com/reader/full/atoll-getting-started-umts-310-en-v1-130228020806-phpapp02 102/183
Atoll Getting Started UMTS Version 3.1.0
3) The prediction template will be added in the “Prediction Types” dialog box.
4) If you want to delete this template, select it and click “delete” button.
© Forsk 2010 102/183

8/12/2019 Atoll Getting Started Umts 310 en v1 130228020806 Phpapp02
http://slidepdf.com/reader/full/atoll-getting-started-umts-310-en-v1-130228020806-phpapp02 103/183
Atoll Getting Started UMTS Version 3.1.0
3.7 Simulation
3.7.1 Traffic model
The UMTS traffic model depends of the UMTS Parameters of the “Parameters” window:
“Environments”, “User Profiles”, “Terminals”, “Mobility Types” and “Services”.
3.7.1.1 Services
1) By default, Atoll provides 7 kinds of service types. Double clicking on the “Voice” type
will open the “Voice properties” dialog box.
© Forsk 2010 103/183
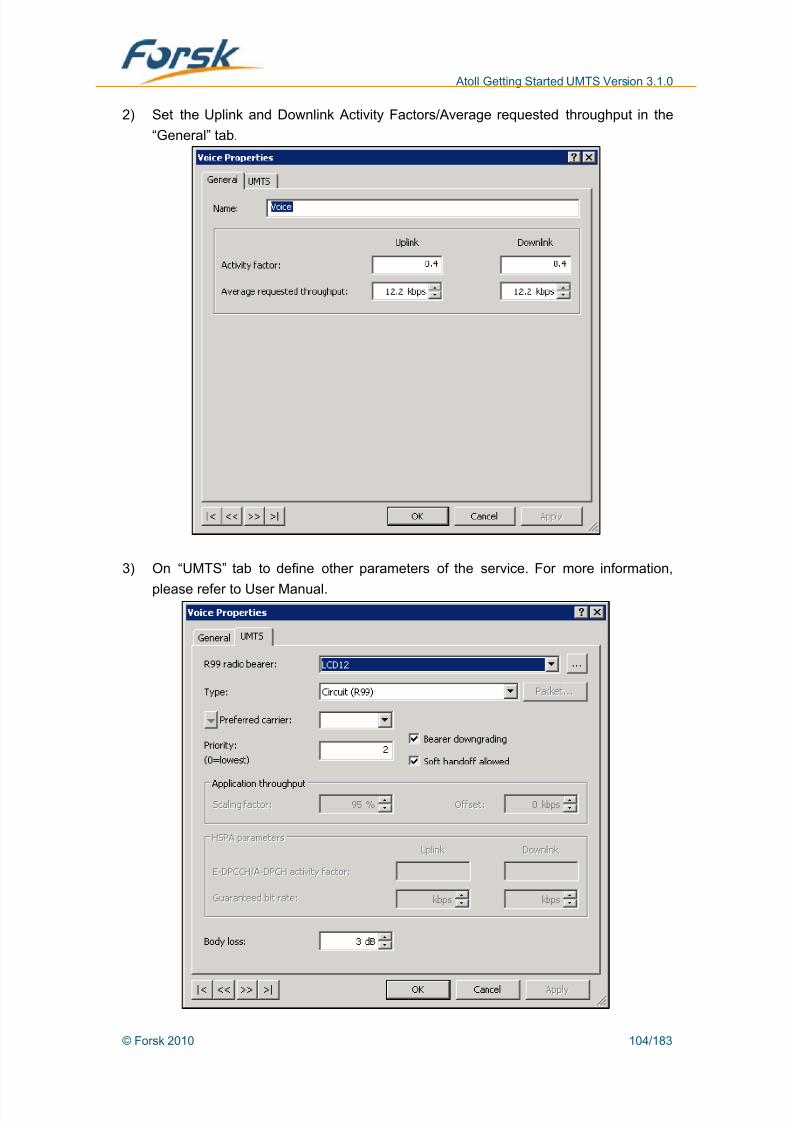
8/12/2019 Atoll Getting Started Umts 310 en v1 130228020806 Phpapp02
http://slidepdf.com/reader/full/atoll-getting-started-umts-310-en-v1-130228020806-phpapp02 104/183
Atoll Getting Started UMTS Version 3.1.0
2) Set the Uplink and Downlink Activity Factors/Average requested throughput in the
“General” tab.
3) On “UMTS” tab to define other parameters of the service. For more information,
please refer to User Manual.
© Forsk 2010 104/183

8/12/2019 Atoll Getting Started Umts 310 en v1 130228020806 Phpapp02
http://slidepdf.com/reader/full/atoll-getting-started-umts-310-en-v1-130228020806-phpapp02 105/183
Atoll Getting Started UMTS Version 3.1.0
4) R99 Radio Bearer. Click on the button on the right of the field “R99 Radio
Bearer”. In the appeared dialog box “LCD12 properties” define the Nominal Rate, the
Coding Factor, the Spreading Factor, the DPCCH/DPCH Power Ratio, the Min Allowed Downlink Traffic Channel Power and the Max Allowed Downlink Traffic
Channel Power.
5) The user can specify a new type of Service —— Right click on the “Services” folder,
select “New” and set up all the parameters in the appeared dialog box.
3.7.1.2 Mobility Types
1) Atoll provides by default 3 Mobility Types (the name depends of the speed). Double
clicking on the “50km/h” mobility opens the “50 km/h properties” dialog box.
2) In the “General” tab define the speed of mobility.
© Forsk 2010 105/183

8/12/2019 Atoll Getting Started Umts 310 en v1 130228020806 Phpapp02
http://slidepdf.com/reader/full/atoll-getting-started-umts-310-en-v1-130228020806-phpapp02 106/183
Atoll Getting Started UMTS Version 3.1.0
3) In the “UMTS” tab define the Ec/Io Threshold and the HS-SCCH Ec/Nt Threshold
according to the mobility.
4) The user can specify a new type of Mobility —— Right click on the “Mobility Types”
folder, select “New” and set up all the parameters in the appeared dialog box.
3.7.1.3 Terminals
1) Atoll provides 4 kinds of Terminals by default. Double click on “Mobile phone” and
open the “Mobile phone properties” dialog box.
2) In the “General” tab define the name.
© Forsk 2010 106/183

8/12/2019 Atoll Getting Started Umts 310 en v1 130228020806 Phpapp02
http://slidepdf.com/reader/full/atoll-getting-started-umts-310-en-v1-130228020806-phpapp02 107/183

8/12/2019 Atoll Getting Started Umts 310 en v1 130228020806 Phpapp02
http://slidepdf.com/reader/full/atoll-getting-started-umts-310-en-v1-130228020806-phpapp02 108/183
Atoll Getting Started UMTS Version 3.1.0
3.7.1.4 User Profiles
1) Atoll provides by default 2 kinds of user profiles. Double click one “Business User” to
open the open the “Business User properties” dialog box.
2) Various parameters can be set up in the “General” tab. For CS services, fill in the
“Terminal”, “Calls/hour” and “Duration” fields. For PS services, fill in the “Terminal”,
“Calls/hour”, “UL Volume (Kbytes) and “DL Volume (Kbytes)” fields.
3) The user can specify a new type of User Profile. Right click on the “User profiles”
folder, select “New” and set the parameters in the appeared dialog box.
3.7.1.5 Environments
1) Atoll provides by default 4 kinds of Environments (classify by clutter name). Double
click on “Dense Urban” and open the “Dense Urban properties” dialog box.
© Forsk 2010 108/183

8/12/2019 Atoll Getting Started Umts 310 en v1 130228020806 Phpapp02
http://slidepdf.com/reader/full/atoll-getting-started-umts-310-en-v1-130228020806-phpapp02 109/183
Atoll Getting Started UMTS Version 3.1.0
2) Various parameters can be set up in the “General” tab. For each kind of “User Profile”,
fill in the corresponding “Mobility” and “Density” fields.
3) In the “Clutter Weighting” tab, the user can specify a weight and an indoor
percentage for each clutter class. The higher the weight is, the higher the user
density is. If the weight is 0 for a specific clutter, then no user will be distributed on
this clutter.
© Forsk 2010 109/183
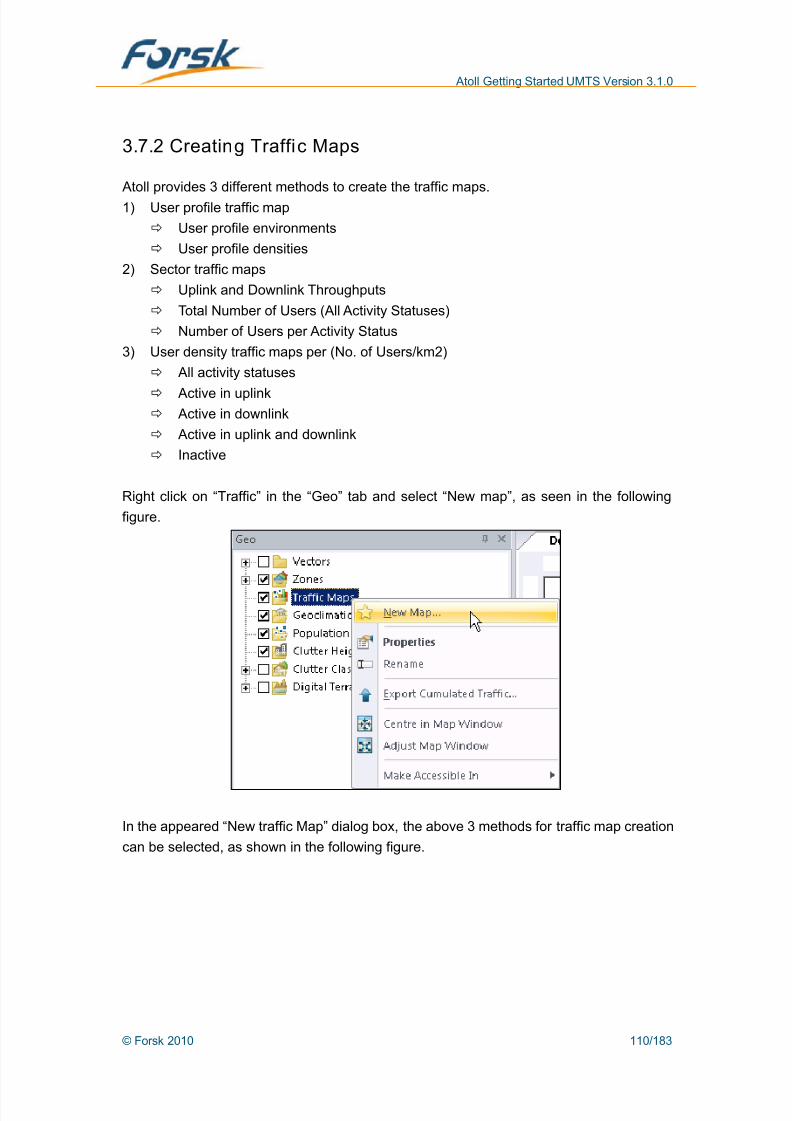
8/12/2019 Atoll Getting Started Umts 310 en v1 130228020806 Phpapp02
http://slidepdf.com/reader/full/atoll-getting-started-umts-310-en-v1-130228020806-phpapp02 110/183
Atoll Getting Started UMTS Version 3.1.0
3.7.2 Creating Traffic Maps
Atoll provides 3 different methods to create the traffic maps.
1) User profile traffic map
User profile environments
User profile densities
2) Sector traffic maps
Uplink and Downlink Throughputs
Total Number of Users (All Activity Statuses)
Number of Users per Activity Status
3) User density traffic maps per (No. of Users/km2)
All activity statuses
Active in uplink Active in downlink
Active in uplink and downlink
Inactive
Right click on “Traffic” in the “Geo” tab and select “New map”, as seen in the following
figure.
In the appeared “New traffic Map” dialog box, the above 3 methods for traffic map creation
can be selected, as shown in the following figure.
© Forsk 2010 110/183
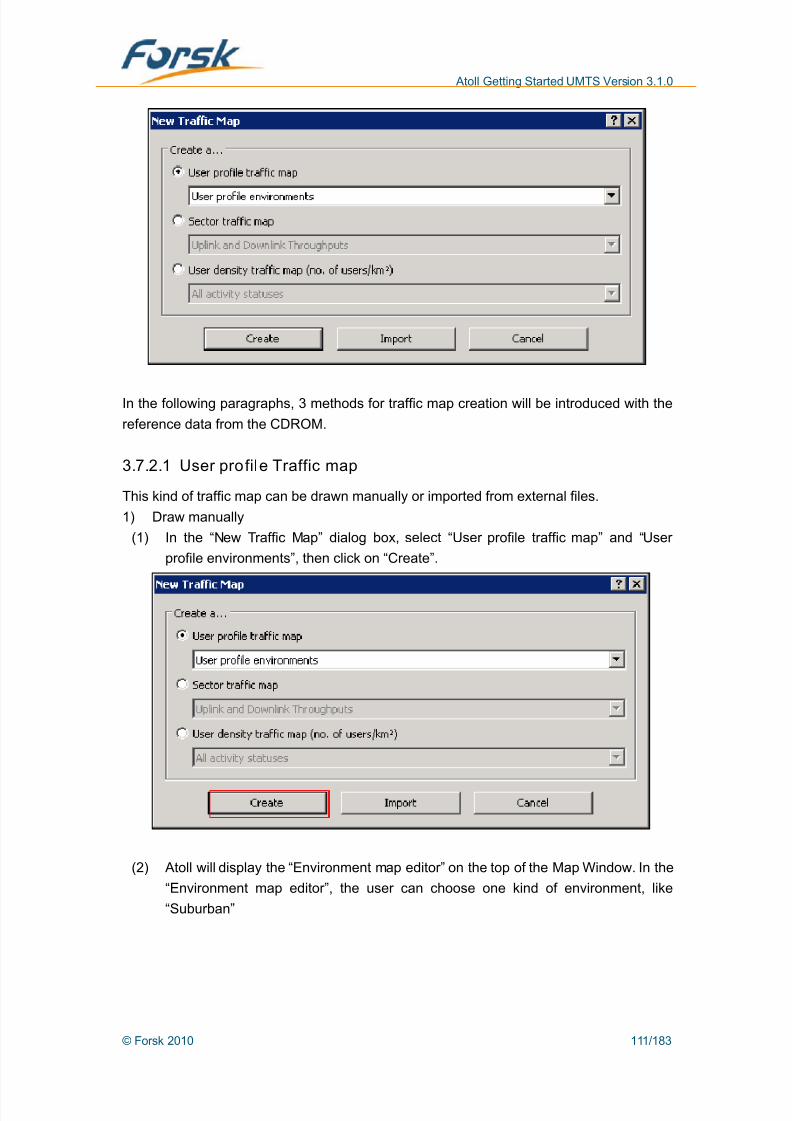
8/12/2019 Atoll Getting Started Umts 310 en v1 130228020806 Phpapp02
http://slidepdf.com/reader/full/atoll-getting-started-umts-310-en-v1-130228020806-phpapp02 111/183
Atoll Getting Started UMTS Version 3.1.0
In the following paragraphs, 3 methods for traffic map creation will be introduced with the
reference data from the CDROM.
3.7.2.1 User profile Traffic map
This kind of traffic map can be drawn manually or imported from external files.
1) Draw manually
(1) In the “New Traffic Map” dialog box, select “User profile traffic map” and “User
profile environments”, then click on “Create”.
(2) Atoll will display the “Environment map editor” on the top of the Map Window. In the
“Environment map editor”, the user can choose one kind of environment, like
“Suburban”
© Forsk 2010 111/183
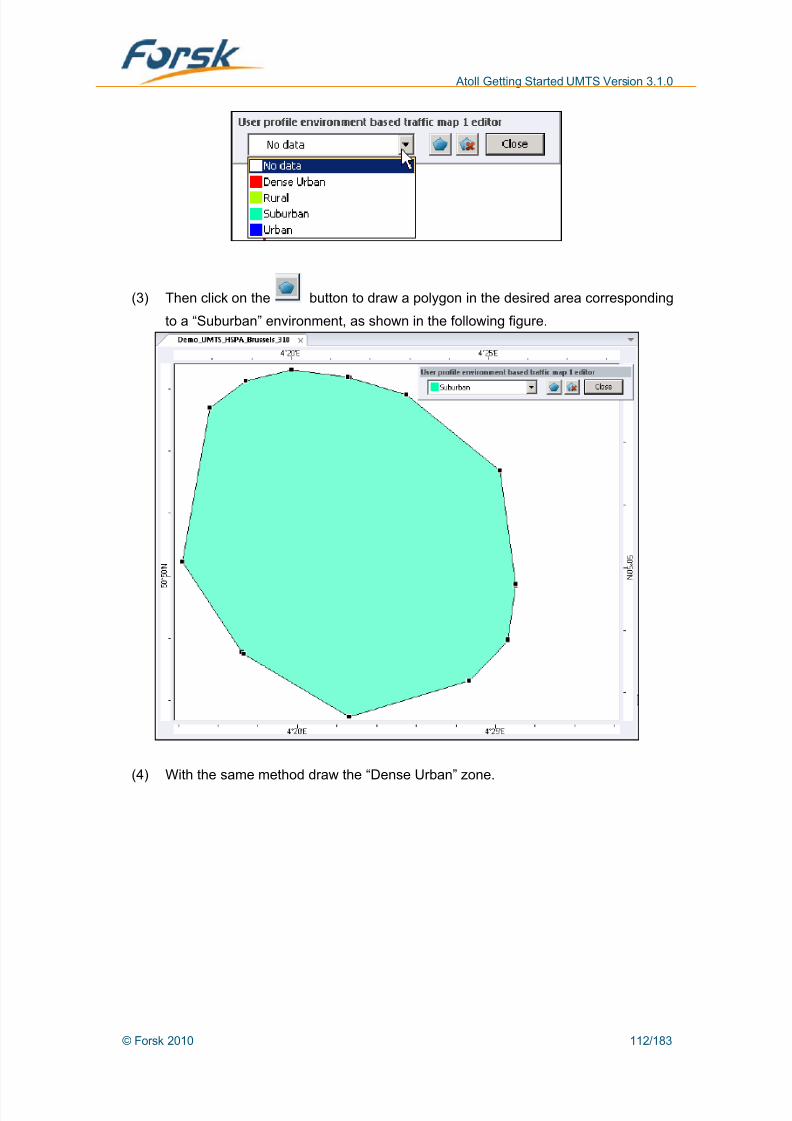
8/12/2019 Atoll Getting Started Umts 310 en v1 130228020806 Phpapp02
http://slidepdf.com/reader/full/atoll-getting-started-umts-310-en-v1-130228020806-phpapp02 112/183
Atoll Getting Started UMTS Version 3.1.0
(3) Then click on the button to draw a polygon in the desired area corresponding
to a “Suburban” environment, as shown in the following figure.
(4) With the same method draw the “Dense Urban” zone.
© Forsk 2010 112/183
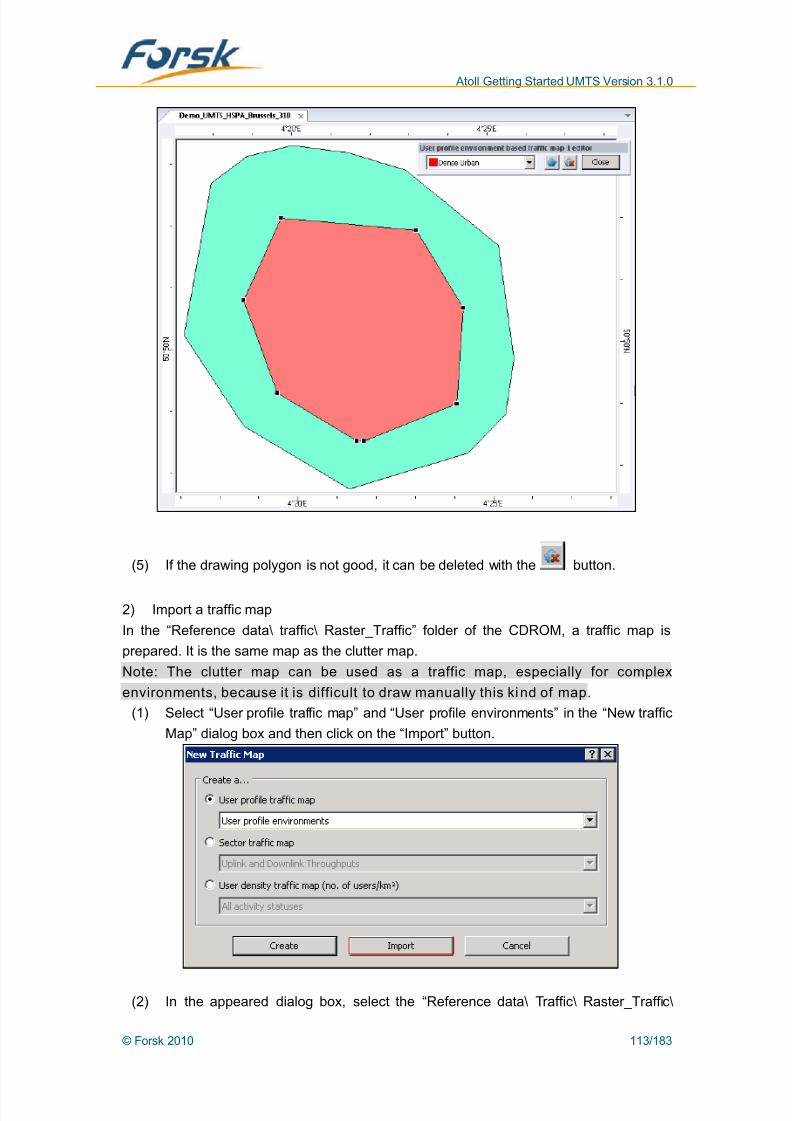
8/12/2019 Atoll Getting Started Umts 310 en v1 130228020806 Phpapp02
http://slidepdf.com/reader/full/atoll-getting-started-umts-310-en-v1-130228020806-phpapp02 113/183
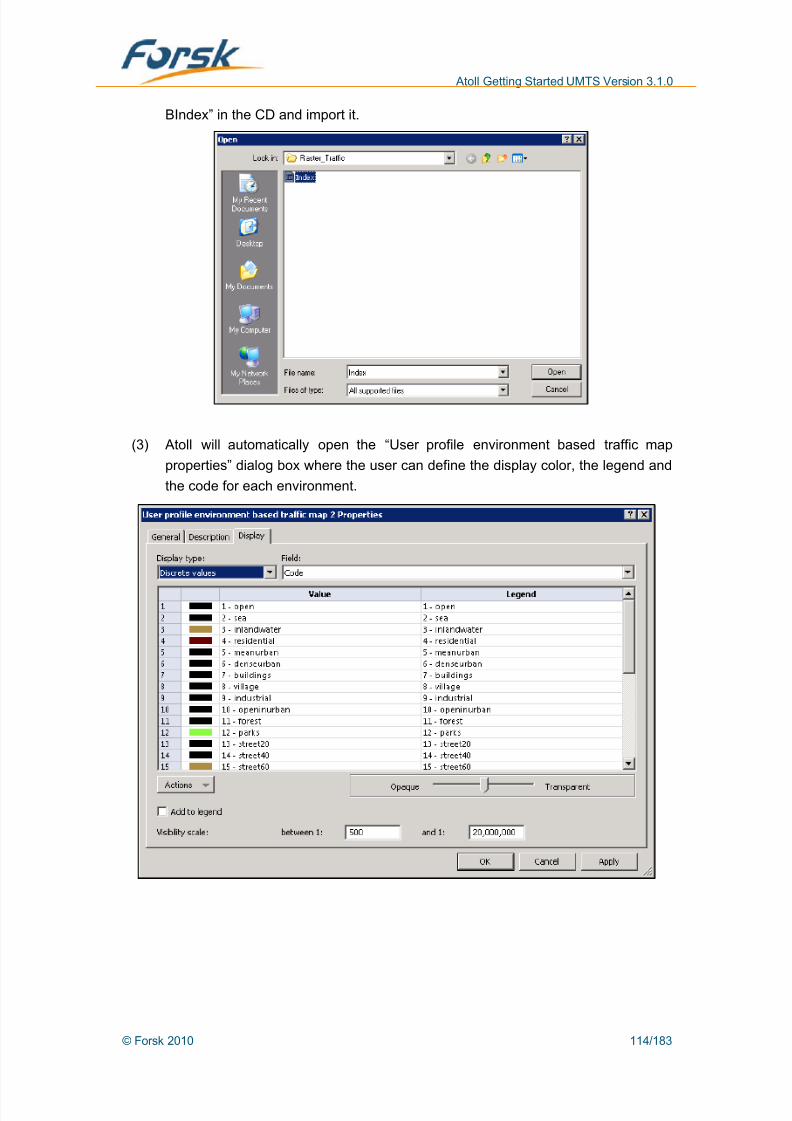
8/12/2019 Atoll Getting Started Umts 310 en v1 130228020806 Phpapp02
http://slidepdf.com/reader/full/atoll-getting-started-umts-310-en-v1-130228020806-phpapp02 114/183
Atoll Getting Started UMTS Version 3.1.0
BIndex” in the CD and import it.
(3) Atoll will automatically open the “User profile environment based traffic map
properties” dialog box where the user can define the display color, the legend and
the code for each environment.
© Forsk 2010 114/183
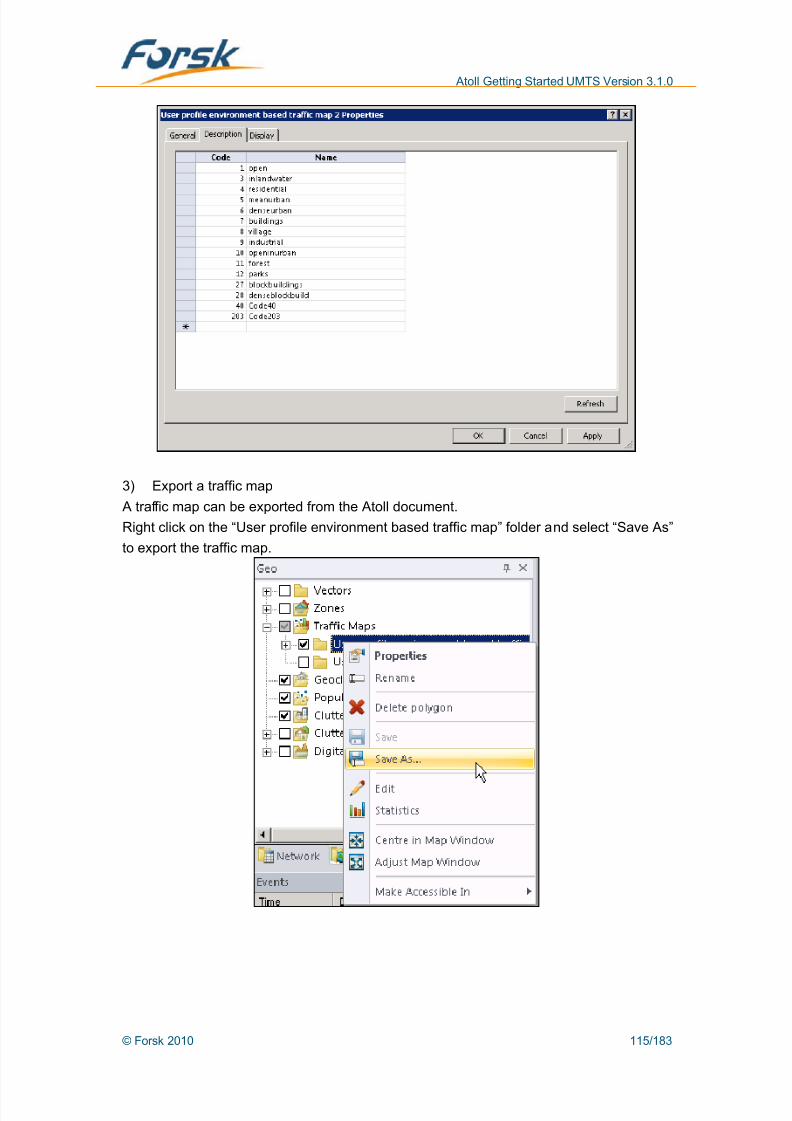
8/12/2019 Atoll Getting Started Umts 310 en v1 130228020806 Phpapp02
http://slidepdf.com/reader/full/atoll-getting-started-umts-310-en-v1-130228020806-phpapp02 115/183
Atoll Getting Started UMTS Version 3.1.0
3) Export a traffic map
A traffic map can be exported from the Atoll document.
Right click on the “User profile environment based traffic map” folder and select “Save As”
to export the traffic map.
© Forsk 2010 115/183

8/12/2019 Atoll Getting Started Umts 310 en v1 130228020806 Phpapp02
http://slidepdf.com/reader/full/atoll-getting-started-umts-310-en-v1-130228020806-phpapp02 116/183
Atoll Getting Started UMTS Version 3.1.0
3.7.2.2 User profile traff ic map - User profile densities
This kind of traffic map may also be drawn manually or imported from external files.
The drawing method is the same of the method introduced for the traffic map “Map Based
on Environments”. In the following part, the method for importing a traffic map from the CD
is introduced.
1) Select “User profile traffic map” and “User profile densities” in the “New Traffic Map”
dialog box and then click on the “Import” button.
2) In the appeared dialog box, select the
“Reference_Data\Traffic\Vector_Traffic\Airport\Airport_Building.mif” file from the
CDROM and import it.
© Forsk 2010 116/183

8/12/2019 Atoll Getting Started Umts 310 en v1 130228020806 Phpapp02
http://slidepdf.com/reader/full/atoll-getting-started-umts-310-en-v1-130228020806-phpapp02 117/183
Atoll Getting Started UMTS Version 3.1.0
3) After clicking “Open” button, define the coordinate system and click “Import” in the
“Vector Import” dialog box.
4) In the appeared dialog box, select the “Traffic” tab to define the indoor percentage
and the weight for each clutter.
© Forsk 2010 117/183
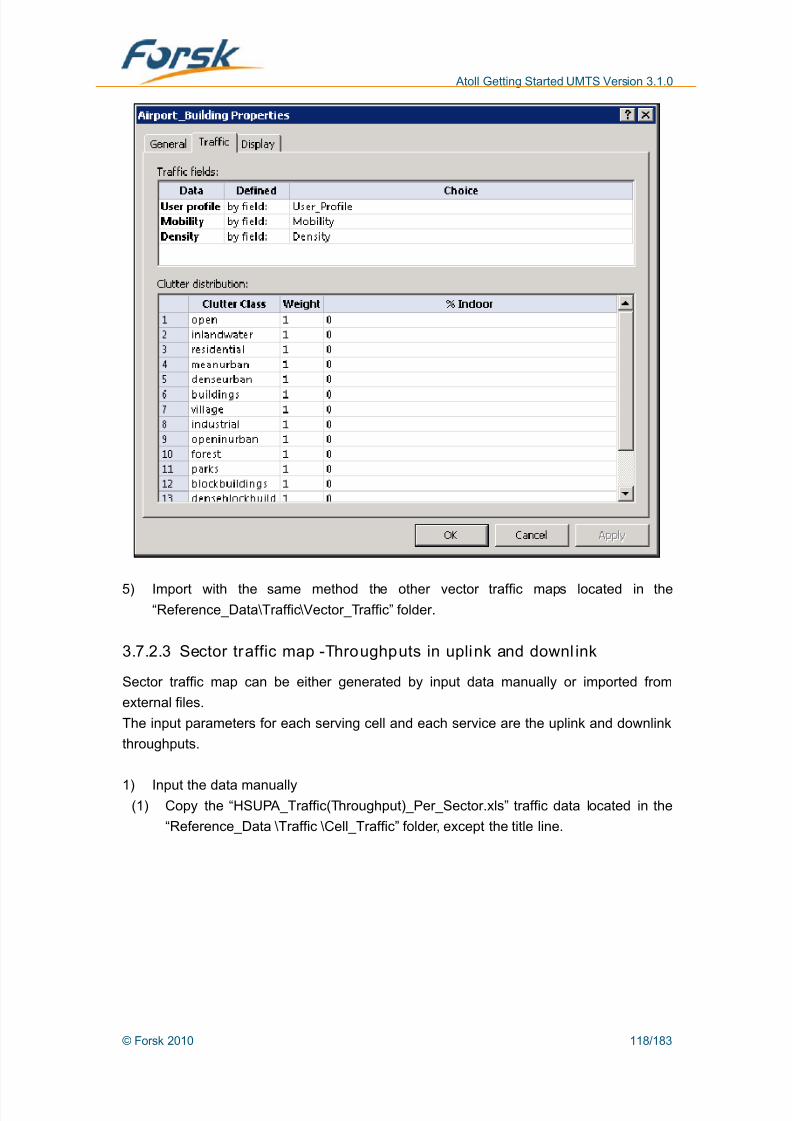
8/12/2019 Atoll Getting Started Umts 310 en v1 130228020806 Phpapp02
http://slidepdf.com/reader/full/atoll-getting-started-umts-310-en-v1-130228020806-phpapp02 118/183
Atoll Getting Started UMTS Version 3.1.0
5) Import with the same method the other vector traffic maps located in the“Reference_Data\Traffic\Vector_Traffic” folder.
3.7.2.3 Sector traffic map -Throughputs in uplink and downl ink
Sector traffic map can be either generated by input data manually or imported from
external files.
The input parameters for each serving cell and each service are the uplink and downlink
throughputs.
1) Input the data manually(1) Copy the “HSUPA_Traffic(Throughput)_Per_Sector.xls” traffic data located in the
“Reference_Data \Traffic \Cell_Traffic” folder, except the title line.
© Forsk 2010 118/183

8/12/2019 Atoll Getting Started Umts 310 en v1 130228020806 Phpapp02
http://slidepdf.com/reader/full/atoll-getting-started-umts-310-en-v1-130228020806-phpapp02 119/183
Atoll Getting Started UMTS Version 3.1.0
(2) Select “Sector traffic map” in the “New traffic Map” dialog box, select “Uplink and
Downlink Throughputs” and click on the “Create” button.
(3) In the appeared “Sector traffic map” dialog box, select an existing Coverage by
Transmitter prediction and paste the traffic values, as shown in the following figure.
© Forsk 2010 119/183
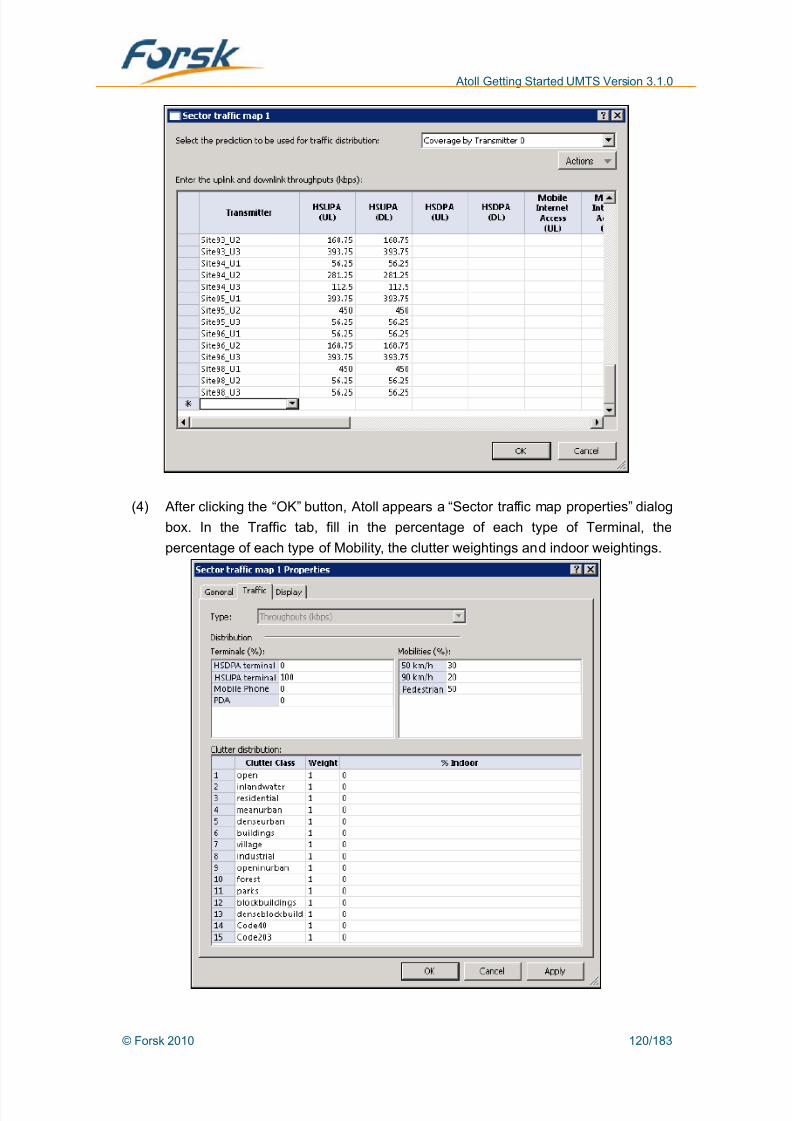
8/12/2019 Atoll Getting Started Umts 310 en v1 130228020806 Phpapp02
http://slidepdf.com/reader/full/atoll-getting-started-umts-310-en-v1-130228020806-phpapp02 120/183
Atoll Getting Started UMTS Version 3.1.0
(4) After clicking the “OK” button, Atoll appears a “Sector traffic map properties” dialog
box. In the Traffic tab, fill in the percentage of each type of Terminal, the
percentage of each type of Mobility, the clutter weightings and indoor weightings.
© Forsk 2010 120/183

8/12/2019 Atoll Getting Started Umts 310 en v1 130228020806 Phpapp02
http://slidepdf.com/reader/full/atoll-getting-started-umts-310-en-v1-130228020806-phpapp02 121/183
Atoll Getting Started UMTS Version 3.1.0
(5) After clicking on the “OK” button, the traffic map will be loaded on the Map Window.
Each best server zone defined by the selected Coverage by Transmitter prediction
will have a distributed traffic, as shown in the following figure.
(6) Create the other sector traffic maps “R99_Traffic(Throughput)_Per_Sector.xls” and
“HSDPA_Traffic(Throughput)_Per_Sector.xls” with the same method located in the
“Reference_Data\Traffic\Cell_Traffic” folder.
2) Import a traffic map
(1) Select “Sector traffic map” in the “New traffic Map” dialog box, select “Throughputs
in uplink and downlink” and click on the “Import” button.
© Forsk 2010 121/183
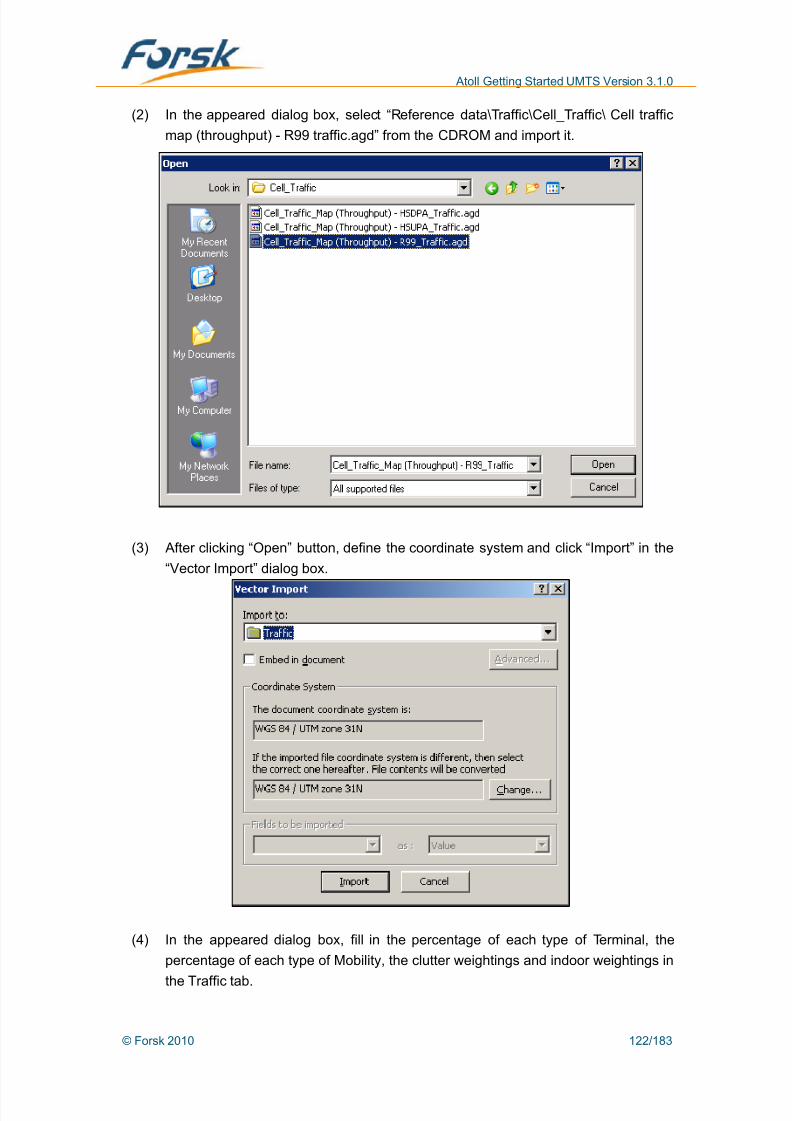
8/12/2019 Atoll Getting Started Umts 310 en v1 130228020806 Phpapp02
http://slidepdf.com/reader/full/atoll-getting-started-umts-310-en-v1-130228020806-phpapp02 122/183
Atoll Getting Started UMTS Version 3.1.0
(2) In the appeared dialog box, select “Reference data\Traffic\Cell_Traffic\ Cell traffic
map (throughput) - R99 traffic.agd” from the CDROM and import it.
(3) After clicking “Open” button, define the coordinate system and click “Import” in the
“Vector Import” dialog box.
(4) In the appeared dialog box, fill in the percentage of each type of Terminal, the
percentage of each type of Mobility, the clutter weightings and indoor weightings in
the Traffic tab.
© Forsk 2010 122/183

8/12/2019 Atoll Getting Started Umts 310 en v1 130228020806 Phpapp02
http://slidepdf.com/reader/full/atoll-getting-started-umts-310-en-v1-130228020806-phpapp02 123/183
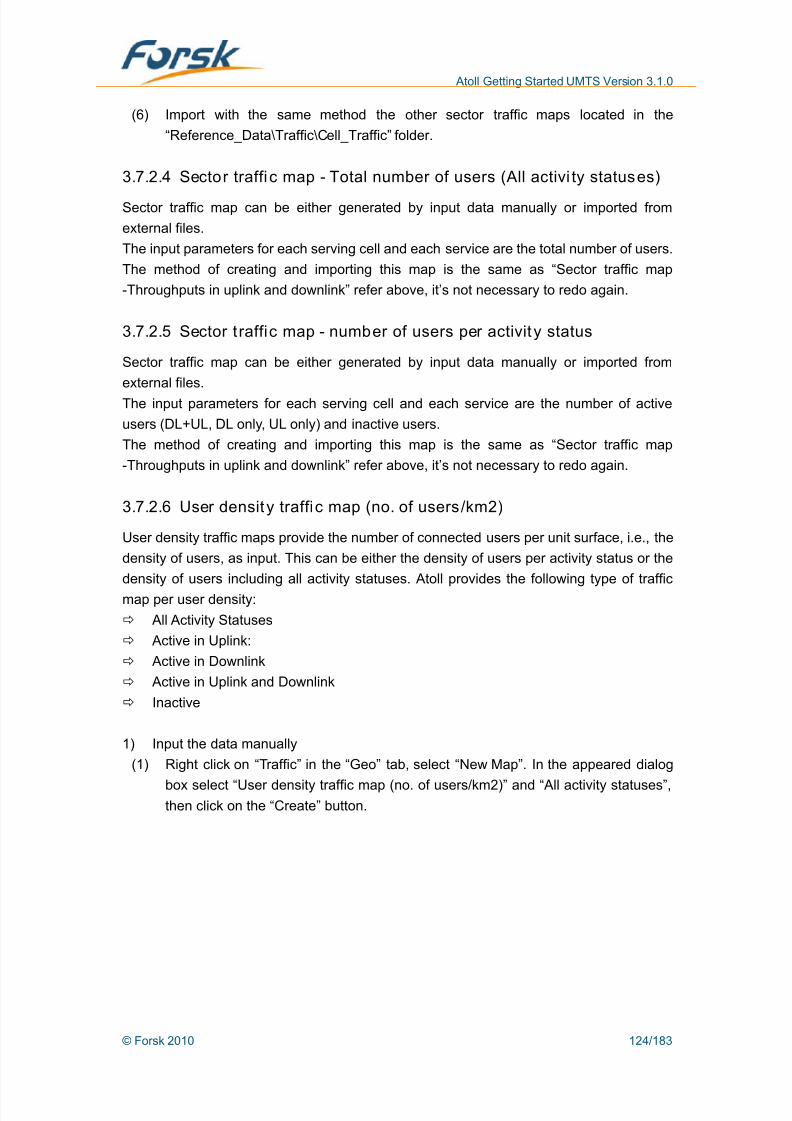
8/12/2019 Atoll Getting Started Umts 310 en v1 130228020806 Phpapp02
http://slidepdf.com/reader/full/atoll-getting-started-umts-310-en-v1-130228020806-phpapp02 124/183
Atoll Getting Started UMTS Version 3.1.0
(6) Import with the same method the other sector traffic maps located in the
“Reference_Data\Traffic\Cell_Traffic” folder.
3.7.2.4 Sector traffi c map - Total number of users (All activi ty statuses)
Sector traffic map can be either generated by input data manually or imported from
external files.
The input parameters for each serving cell and each service are the total number of users.
The method of creating and importing this map is the same as “Sector traffic map
-Throughputs in uplink and downlink” refer above, it’s not necessary to redo again.
3.7.2.5 Sector traffic map - number of users per activity status
Sector traffic map can be either generated by input data manually or imported from
external files.
The input parameters for each serving cell and each service are the number of active
users (DL+UL, DL only, UL only) and inactive users.
The method of creating and importing this map is the same as “Sector traffic map
-Throughputs in uplink and downlink” refer above, it’s not necessary to redo again.
3.7.2.6 User density traffic map (no. of users/km2)
User density traffic maps provide the number of connected users per unit surface, i.e., the
density of users, as input. This can be either the density of users per activity status or the
density of users including all activity statuses. Atoll provides the following type of traffic
map per user density:
All Activity Statuses
Active in Uplink:
Active in Downlink
Active in Uplink and Downlink
Inactive
1) Input the data manually
(1) Right click on “Traffic” in the “Geo” tab, select “New Map”. In the appeared dialog
box select “User density traffic map (no. of users/km2)” and “All activity statuses”,then click on the “Create” button.
© Forsk 2010 124/183

8/12/2019 Atoll Getting Started Umts 310 en v1 130228020806 Phpapp02
http://slidepdf.com/reader/full/atoll-getting-started-umts-310-en-v1-130228020806-phpapp02 125/183
Atoll Getting Started UMTS Version 3.1.0
) The “Density map” properties window will appear. Then define the distributions for(2
Terminals, Mobilities, Services and Clutter in the “Traffic” tab. In the “Display” tab,
the color of the traffic map can be defined. as shown in the following figure.
(3) Right click on “User density traffic map 1” in the “Traffic” folder and select “Edit”.
© Forsk 2010 125/183

8/12/2019 Atoll Getting Started Umts 310 en v1 130228020806 Phpapp02
http://slidepdf.com/reader/full/atoll-getting-started-umts-310-en-v1-130228020806-phpapp02 126/183
Atoll Getting Started UMTS Version 3.1.0
(4) The vector editor function will be activated and then the "New Polygon/New
Rectangle” feature can be used for drawing a new Traffic region in the Map
Window.
(5) Click “Esc” button to quit of editing. Double click on the Traffic region and in the
appeared dialog box define the corresponding Traffic Density.
© Forsk 2010 126/183

8/12/2019 Atoll Getting Started Umts 310 en v1 130228020806 Phpapp02
http://slidepdf.com/reader/full/atoll-getting-started-umts-310-en-v1-130228020806-phpapp02 127/183
Atoll Getting Started UMTS Version 3.1.0
2) Export of cumulated traffic maps
Cumulated traffic of all the traffic maps can be exported in bil and grd formats.
(1) Right click on the “Traffic” folder and select “Export Cumulated Traffic…”.
(2) In the appeared “Save As” dialog box enter a file name and click on the “Save”
button.
(3) Then in the appeared “Export” dialog box, define the area to export, the terminal,
the mobility type, the service, the traffic maps to consider and the direction, as
seen in the following figure.
© Forsk 2010 127/183

8/12/2019 Atoll Getting Started Umts 310 en v1 130228020806 Phpapp02
http://slidepdf.com/reader/full/atoll-getting-started-umts-310-en-v1-130228020806-phpapp02 128/183
Atoll Getting Started UMTS Version 3.1.0
The export of cumulated traffic map can be done with the following parameters and
options:
Region
Entire Project Area: export the cumulated traffic over the entire project.
Computation Zone: export the cumulated traffic contained by a rectangle
encompassing the computation zone, whether or not the computation zone is
visible.
Note: The exported density map will be a rectangle whatever the original map is
a polygon or rectangle, the area of the Computation Zone will be 0.
Resolution in meter
Density map resolution
Data to be exported in the cumulated traffic
Terminal: type of terminal that will be exported.
Service: service that will be exported.
Mobility: mobility type that will be exported.Note: A density map can not include CS and PS service, because the
© Forsk 2010 128/183

8/12/2019 Atoll Getting Started Umts 310 en v1 130228020806 Phpapp02
http://slidepdf.com/reader/full/atoll-getting-started-umts-310-en-v1-130228020806-phpapp02 129/183
Atoll Getting Started UMTS Version 3.1.0
computation methods of Act ive Users are different.
Activity
All Activity Statuses: export all users without any filter by activity status.
Uplink: Select export mobiles active in the uplink only.
Downlink: export mobiles active in the downlink only. Uplink/Downlink: export only mobiles with both uplink and downlink activity.
Inactive: export only inactive mobiles.
Traffic maps to be used
Select the traffic maps to be exported
3) Import the exported cumulated traffic maps into Atoll
(1) Right click on “Traffic” in the “Geo” tab and select “New map”. In the appeared
dialog box select “User density traffic map (no. of users/km2)” and “All activity
statuses”, then click on the “Import” button, as shown in the following figure.
(2) Then define the distributions for Terminals, Mobilities, Services and Clutter. In the
“Display” tab, the color of the traffic map can be defined.
© Forsk 2010 129/183

8/12/2019 Atoll Getting Started Umts 310 en v1 130228020806 Phpapp02
http://slidepdf.com/reader/full/atoll-getting-started-umts-310-en-v1-130228020806-phpapp02 130/183
Atoll Getting Started UMTS Version 3.1.0
(3) The Traffic Density map is put automatically in “User density traffic map #” in the“Traffic” folder.
© Forsk 2010 130/183
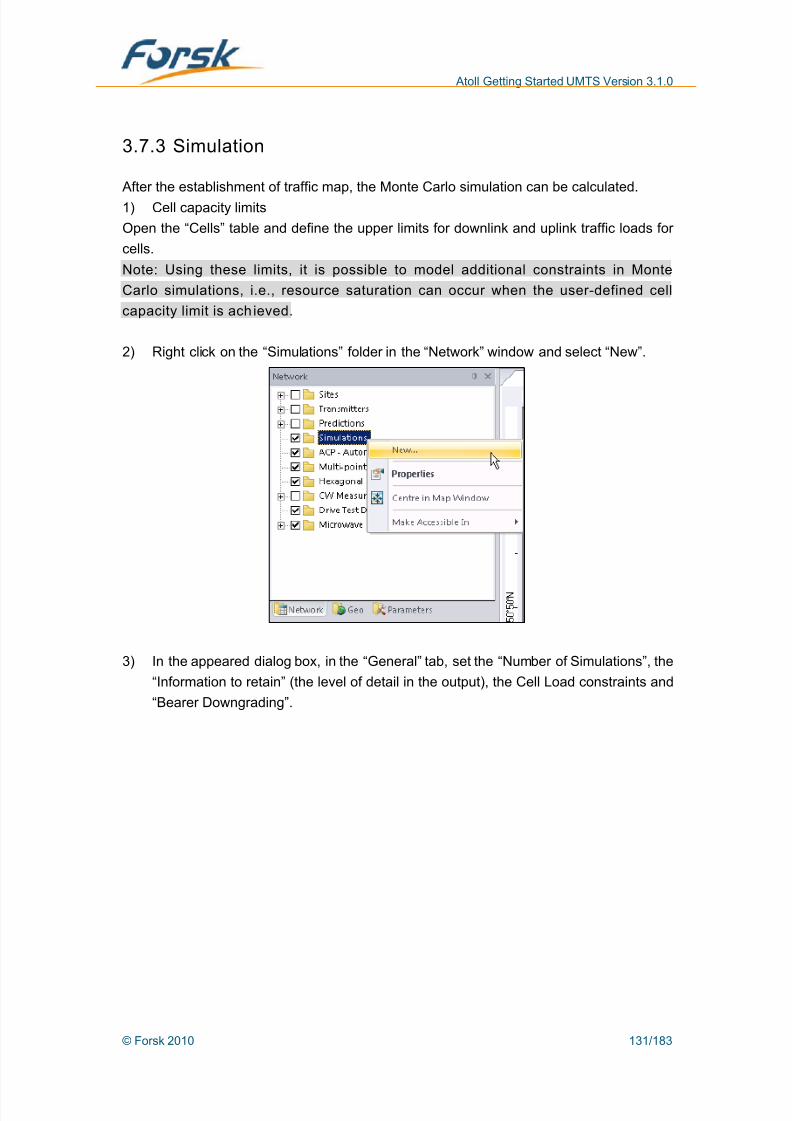
8/12/2019 Atoll Getting Started Umts 310 en v1 130228020806 Phpapp02
http://slidepdf.com/reader/full/atoll-getting-started-umts-310-en-v1-130228020806-phpapp02 131/183

8/12/2019 Atoll Getting Started Umts 310 en v1 130228020806 Phpapp02
http://slidepdf.com/reader/full/atoll-getting-started-umts-310-en-v1-130228020806-phpapp02 132/183
Atoll Getting Started UMTS Version 3.1.0
If downgrading is selected, when a constraint is not respected, user radio bearers withservices supporting bearer downgrading are downgraded. If the constraint is still not
satisfied after downgrading, users are rejected. If downgrading is not selected, users will
be rejected immediately, starting with users with the lowest service priority, if a constraint
can not be respected.
4) In the “Traffic” tab, select the traffic map which will be used for the simulation and the
“Global Scaling Factor”. For example select “User density traffic map 1”, as shown in
the following figure.
© Forsk 2010 132/183
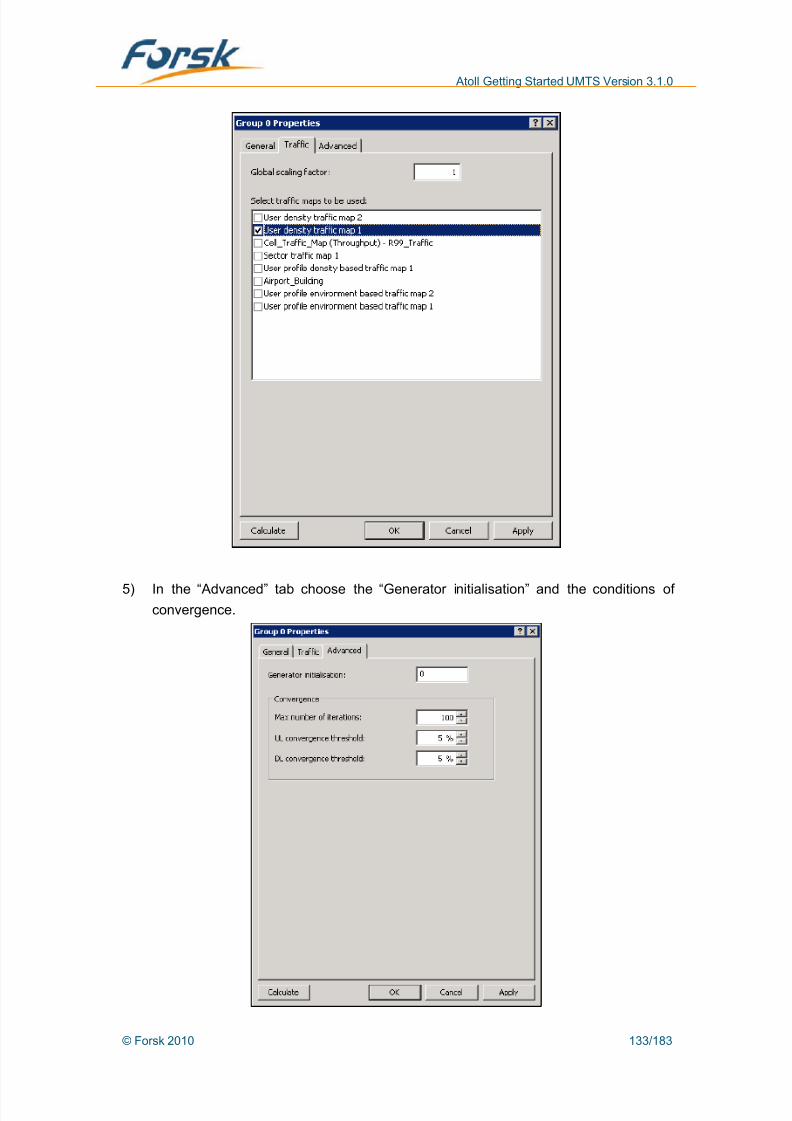
8/12/2019 Atoll Getting Started Umts 310 en v1 130228020806 Phpapp02
http://slidepdf.com/reader/full/atoll-getting-started-umts-310-en-v1-130228020806-phpapp02 133/183
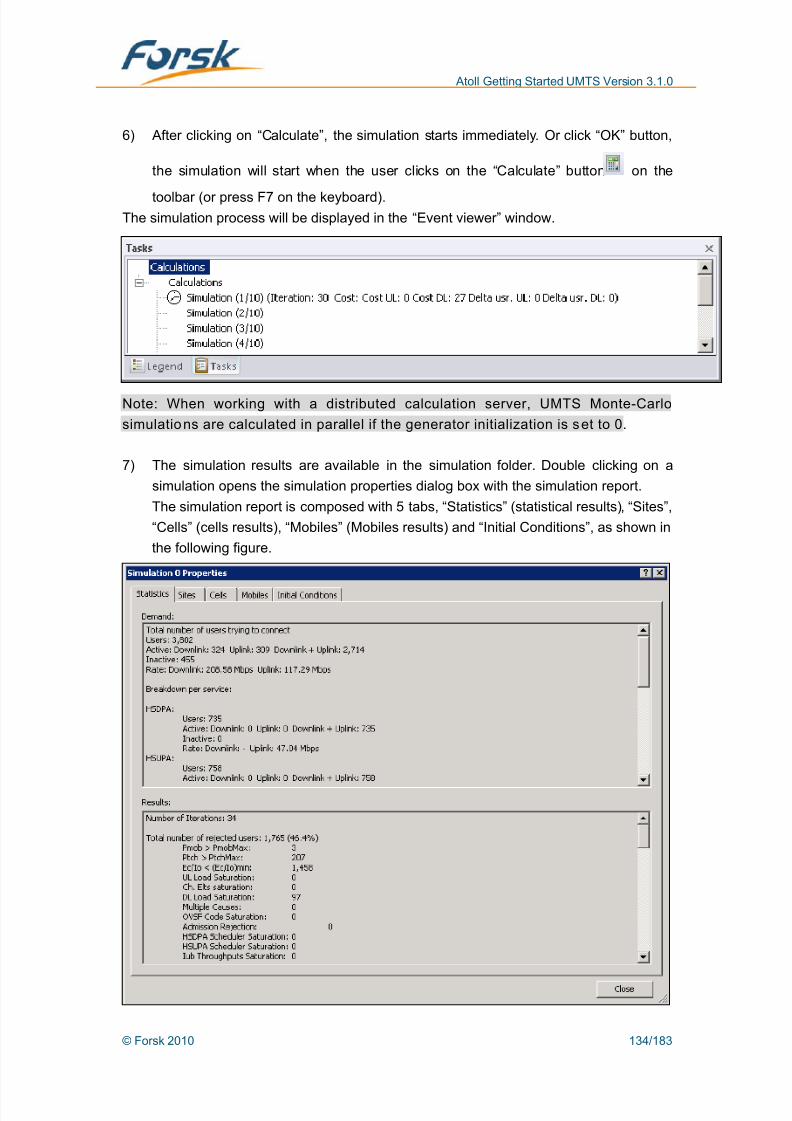
8/12/2019 Atoll Getting Started Umts 310 en v1 130228020806 Phpapp02
http://slidepdf.com/reader/full/atoll-getting-started-umts-310-en-v1-130228020806-phpapp02 134/183
Atoll Getting Started UMTS Version 3.1.0
6) After clicking on “Calculate”, the simulation starts immediately. Or click “OK” button,
the simulation will start when the user clicks on the “Calculate” button on the
toolbar (or press F7 on the keyboard).The simulation process will be displayed in the “Event viewer” window.
Note: When working with a distributed calculation server, UMTS Monte-Carlo
simulations are calculated in parallel if the generator initialization is set to 0.
7) The simulation results are available in the simulation folder. Double clicking on a
simulation opens the simulation properties dialog box with the simulation report.
The simulation report is composed with 5 tabs, “Statistics” (statistical results), “Sites”,
“Cells” (cells results), “Mobiles” (Mobiles results) and “Initial Conditions”, as shown in
the following figure.
© Forsk 2010 134/183

8/12/2019 Atoll Getting Started Umts 310 en v1 130228020806 Phpapp02
http://slidepdf.com/reader/full/atoll-getting-started-umts-310-en-v1-130228020806-phpapp02 135/183
Atoll Getting Started UMTS Version 3.1.0
8) Commit the results.
The Uplink and Downlink cell loads of each cell are calculated in Monte Carlo simulations
and the results are provided in the Cells tab.
Right click on a group of simulations and select “Average Simulation” in the context menuto open the average simulation report. Click on the “Commit Result” button in the Cells tab
to commit the cell loads into the Cells table. These values will be used in the prediction
studies introduced in the next section.
9) Simulation replay
A simulation can be replayed (right click on one simulation and select Replay).
3.8 Point analysis tool
Atoll provides a point analysis window to analyze the network performance.
Clicking on the toolbar icon or selecting “View->Point analysis”, opens the analysiswindow. The cursor turns into a circle representing the receiver. Put the receiver on the
Map Window, as shown in the following figure.
© Forsk 2010 135/183

8/12/2019 Atoll Getting Started Umts 310 en v1 130228020806 Phpapp02
http://slidepdf.com/reader/full/atoll-getting-started-umts-310-en-v1-130228020806-phpapp02 136/183
Atoll Getting Started UMTS Version 3.1.0
3.8.1 Profile
In the “Profile” tab, the user may analyze the terrain profile between the transmitter and
the receiver, the received signal level, the link budget and other information.
The desired transmitter (for the profile analysis) can be selected in the “Profile” window or
directly on the map. Atoll automatically displays the terrain profile between the selected
transmitter and the receiver.
In the “Profile” tab, the point to point signal power is real-time calculated.
Click on the “Link budget” button to open the “Link Budget” window, with the
information about the link budget between the transmitter and the receiver.
© Forsk 2010 136/183

8/12/2019 Atoll Getting Started Umts 310 en v1 130228020806 Phpapp02
http://slidepdf.com/reader/full/atoll-getting-started-umts-310-en-v1-130228020806-phpapp02 137/183
Atoll Getting Started UMTS Version 3.1.0
3.8.2 Reception
In the “Reception” tab, the received signal level values for the strongest transmitters are
given with bars. The received power values are calculated according with the stored path
loss matrices.
3.8.3 AS Analysis
In the “AS Analysis” tab, the received Ec/Io for the best server, the active set and the
others transmitters are given with bars.
© Forsk 2010 137/183

8/12/2019 Atoll Getting Started Umts 310 en v1 130228020806 Phpapp02
http://slidepdf.com/reader/full/atoll-getting-started-umts-310-en-v1-130228020806-phpapp02 138/183
Atoll Getting Started UMTS Version 3.1.0
The availability (“ ” means not available) for the pilot and the service in UL and DL are
calculated according to the selection of the receiver position, the Carrier, the Terminal, the
Service, the Mobility, the DL rate and UL rate.
Double click on a Transmitter to open the “Analysis Detail” window corresponding to this
transmitter.
© Forsk 2010 138/183

8/12/2019 Atoll Getting Started Umts 310 en v1 130228020806 Phpapp02
http://slidepdf.com/reader/full/atoll-getting-started-umts-310-en-v1-130228020806-phpapp02 139/183
Atoll Getting Started UMTS Version 3.1.0
3.8.4 SC Collisions
In the following example, the sites “Site76_U2” and “Site7_U2” have the same ScramblingCode and therefore produce Scrambling Code interferences.
3.8.5 Details
The “Details” tab gives the receiving power for all cells, as seen in the following figure.
© Forsk 2010 139/183

8/12/2019 Atoll Getting Started Umts 310 en v1 130228020806 Phpapp02
http://slidepdf.com/reader/full/atoll-getting-started-umts-310-en-v1-130228020806-phpapp02 140/183
Atoll Getting Started UMTS Version 3.1.0
3.9 Other prediction studies
In the 3.6 section, 14 kinds of coverage prediction studies were introduced. The following
11 prediction studies need uplink and downlink load conditions, which may be either
obtained by a Monte Carlo simulation or set manually.
The following coverage of Ec/Io (Pilot Reception Analysis (Ec/Io)) will be an example for
these 9 prediction studies.
3.9.1 Predict ion parameters setting
1) In the “Prediction Types” dialog box, select “Pilot Reception Analysis (Ec/Io)”.
2) In the appeared dialog box, select the “Condition” tab and define:
Using simulation result (it is recommended to select a group to use average
result of the group)
the Terminal
the Service
the Mobility
3) Define the display properties in the “Display” tab.
© Forsk 2010 140/183
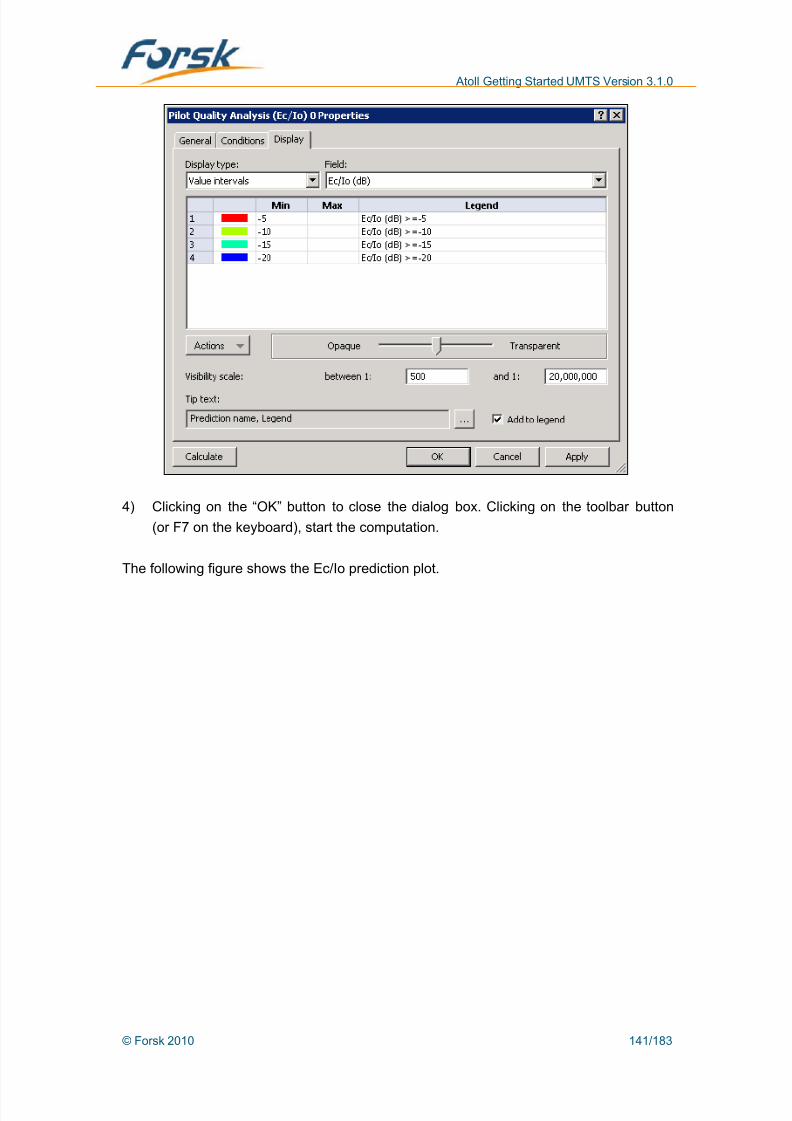
8/12/2019 Atoll Getting Started Umts 310 en v1 130228020806 Phpapp02
http://slidepdf.com/reader/full/atoll-getting-started-umts-310-en-v1-130228020806-phpapp02 141/183
Atoll Getting Started UMTS Version 3.1.0
) Clicking on the “OK” button to close the dialog box. Clicking on the toolbar button
he following figure shows the Ec/Io prediction plot.
4
(or F7 on the keyboard), start the computation.
T
© Forsk 2010 141/183
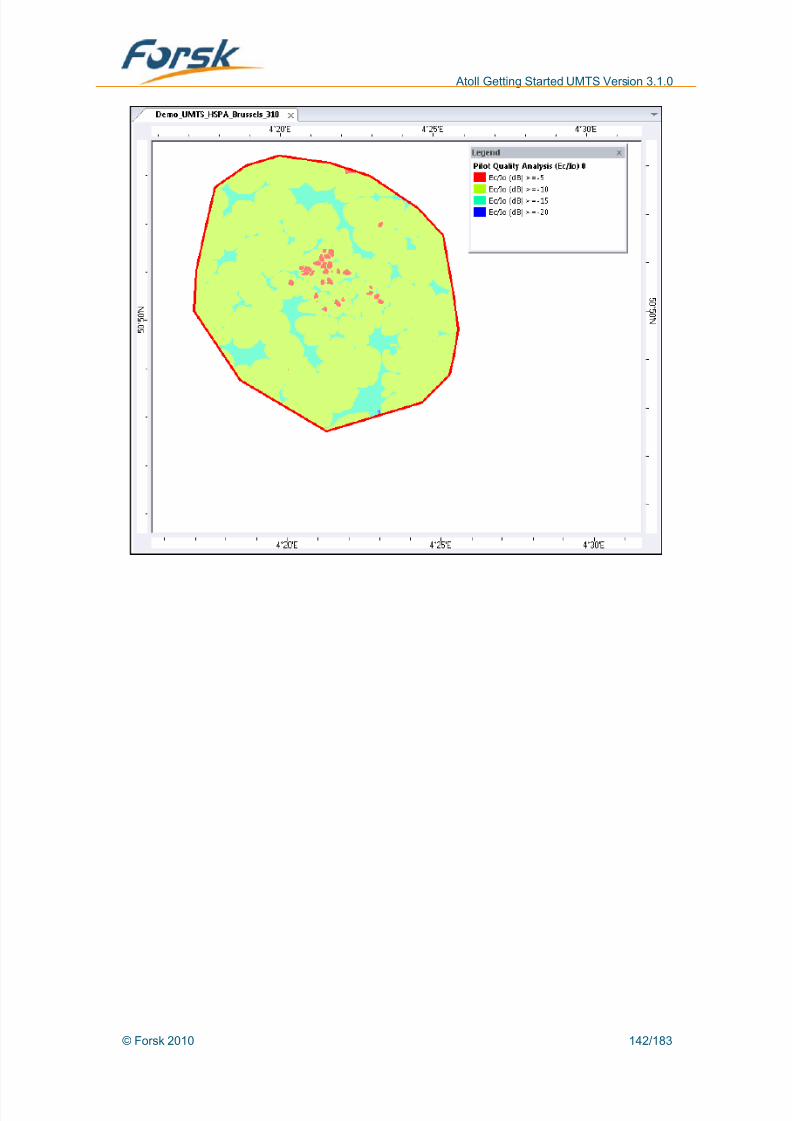
8/12/2019 Atoll Getting Started Umts 310 en v1 130228020806 Phpapp02
http://slidepdf.com/reader/full/atoll-getting-started-umts-310-en-v1-130228020806-phpapp02 142/183
Atoll Getting Started UMTS Version 3.1.0
© Forsk 2010 142/183

8/12/2019 Atoll Getting Started Umts 310 en v1 130228020806 Phpapp02
http://slidepdf.com/reader/full/atoll-getting-started-umts-310-en-v1-130228020806-phpapp02 143/183
Atoll Getting Started UMTS Version 3.1.0
3.9.2 Standard predict ion studies
Atoll provides 14 kinds of prediction study. Through the display setting the number of
prediction types provided by Atoll may reach several dozen to one hundred.
The following predictions are the most commonly used:
Prediction Types Displayed Values Coverage by Transmitter Transmitter
Coverage by Signal Level Signal Level (dBm, dBµV or dBµV/m)
Pathloss (dB)
Overlapping Zones Number of Servers
Total Noise level Analysis Minimum Noise Level Average Noise Level
Maximum Noise Level
Minimum Noise Rise
Average Noise Rise
Maximum Noise Rise
Pilot Quality Analysis (Ec/Io) Ec/Io
Ec/Io Margin
Reliability Level
Service Area Analysis (Eb/Nt) DL Eb/Nt Margin
Effective Eb/Nt
Maximum Eb/Nt
Required Power
Required Power Margin
Reliability Level
Rate
Service Area Analysis (Eb/Nt) UL Eb/Nt Margin
Effective Eb/NtMaximum Eb/Nt
Required Power
Required Power Margin
Rate
Effective Service Area Analysis (Eb/Nt)
(DL+UL)
Reliability Level
Handoff Zones Potential Active Transmitter Number
Pilot Pollution Analysis Polluter Number
Scrambling Code Collision Zones Zone covered by the same Scrambling Code
© Forsk 2010 143/183
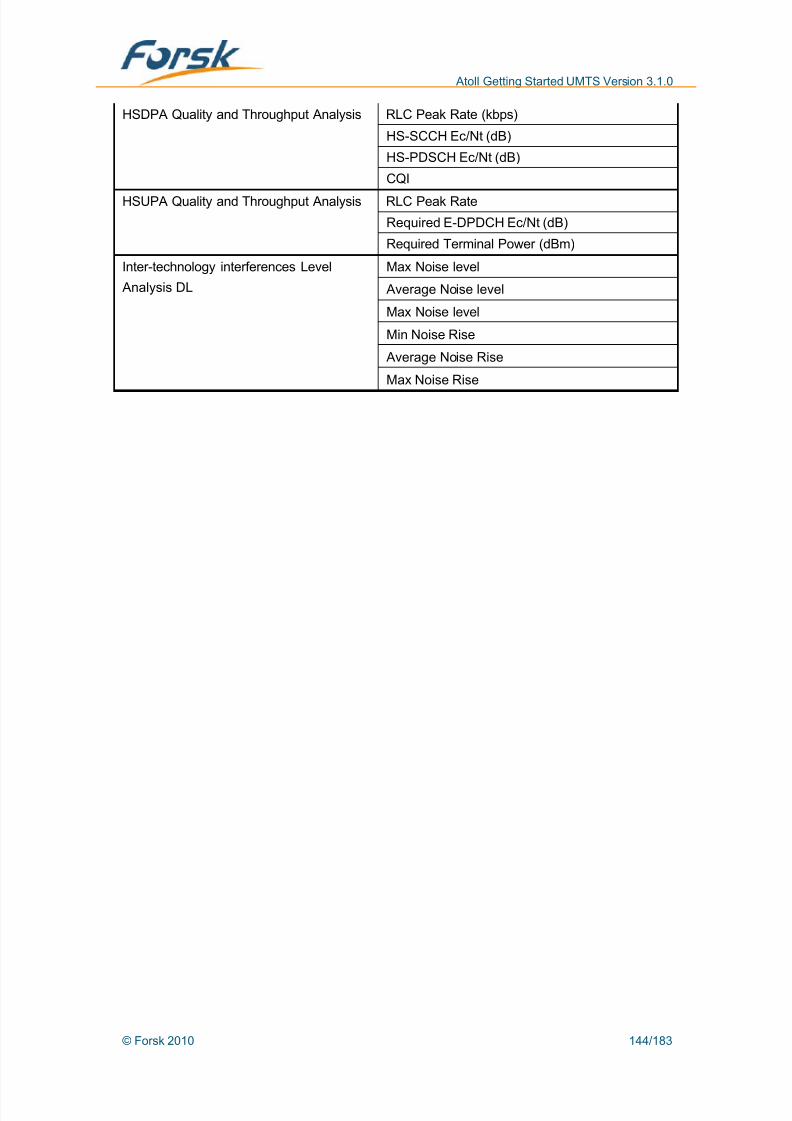
8/12/2019 Atoll Getting Started Umts 310 en v1 130228020806 Phpapp02
http://slidepdf.com/reader/full/atoll-getting-started-umts-310-en-v1-130228020806-phpapp02 144/183
Atoll Getting Started UMTS Version 3.1.0
HSDPA Quality and Throughput Analysis RLC Peak Rate (kbps)
HS-SCCH Ec/Nt (dB)
HS-PDSCH Ec/Nt (dB)
CQI
HSUPA Quality and Throughput Analysis RLC Peak Rate
Required E-DPDCH Ec/Nt (dB)
Required Terminal Power (dBm)
Inter-technology interferences Level
Analysis DL
Max Noise level
Average Noise level
Max Noise level
Min Noise Rise
Average Noise Rise
Max Noise Rise
© Forsk 2010 144/183

8/12/2019 Atoll Getting Started Umts 310 en v1 130228020806 Phpapp02
http://slidepdf.com/reader/full/atoll-getting-started-umts-310-en-v1-130228020806-phpapp02 145/183

8/12/2019 Atoll Getting Started Umts 310 en v1 130228020806 Phpapp02
http://slidepdf.com/reader/full/atoll-getting-started-umts-310-en-v1-130228020806-phpapp02 146/183
Atoll Getting Started UMTS Version 3.1.0
2) Right click the “Network Settings” folder on “Parameters” window select properties. In
the “Global Parameters” tab define the methods for the calculation of Nt and CQI.
© Forsk 2010 146/183

8/12/2019 Atoll Getting Started Umts 310 en v1 130228020806 Phpapp02
http://slidepdf.com/reader/full/atoll-getting-started-umts-310-en-v1-130228020806-phpapp02 147/183
Atoll Getting Started UMTS Version 3.1.0
Nt: You can select "Total noise" and Atoll will calculate Nt as the noise generated by
all transmitters plus thermal noise or you can select "Without useful signal" and Atollwill calculate Nt as the total noise less the signal of thestudied cell.
CQI: You can select “Based on CPICH quality” and Atoll will measure the CQI based
on the pilot Ec ⁄ Nt or you can select “Based on HS-PDSCH quality” and Atoll will
measure the CQI based on the HS-PDSCH Ec ⁄ Nt. Depending on the option selected,
you will have to define either a CQI=f(CPICH Ec/Nt) graph, or a CQI=f(HS-PDSCH
Ec/Nt) graph in the Properties dialogue of the terminal equipment. The calculated CQI
will be used to determine the best bearer.
3) Define HSDPA Ec/Nt threshold
Open the “50 km/h” mobility in the “Traffic Parameters” folder on the “Parameters”
window and define the HS-SCCH threshold, as shown in the following figure.
© Forsk 2010 147/183
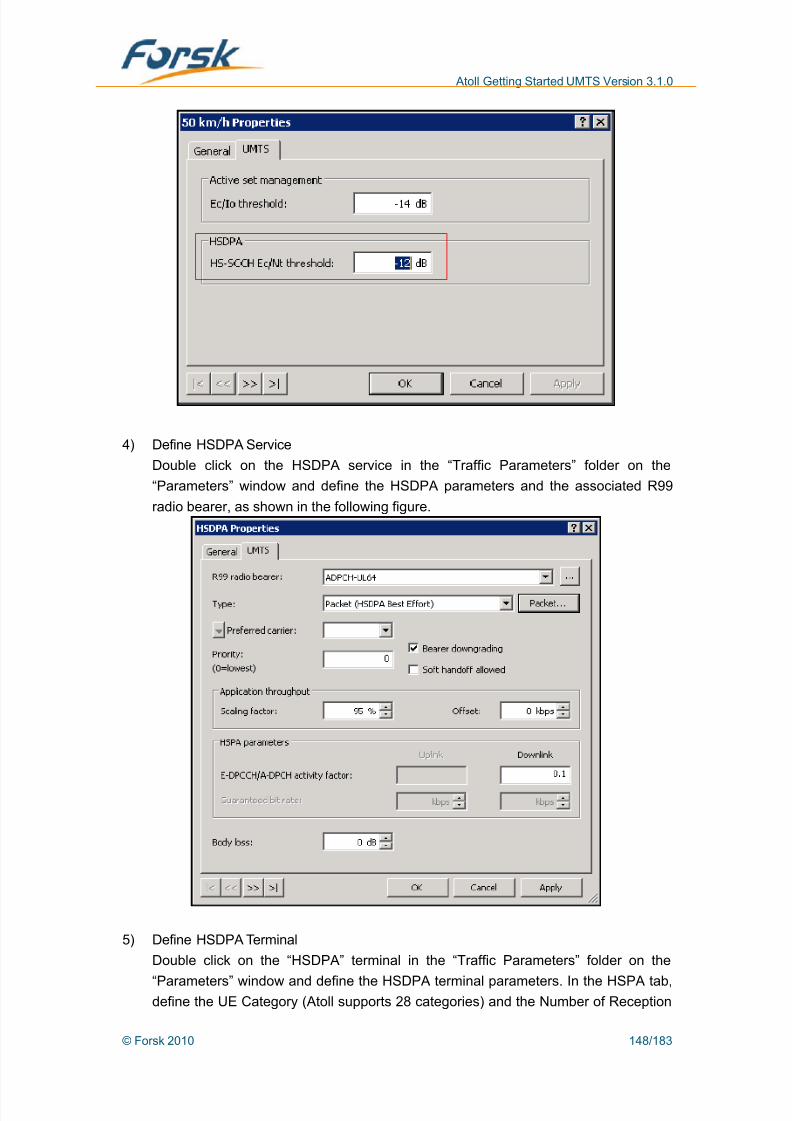
8/12/2019 Atoll Getting Started Umts 310 en v1 130228020806 Phpapp02
http://slidepdf.com/reader/full/atoll-getting-started-umts-310-en-v1-130228020806-phpapp02 148/183
Atoll Getting Started UMTS Version 3.1.0
4) Define HSDPA Service
Double click on the HSDPA service in the “Traffic Parameters” folder on the
“Parameters” window and define the HSDPA parameters and the associated R99
radio bearer, as shown in the following figure.
5) Define HSDPA Terminal
Double click on the “HSDPA” terminal in the “Traffic Parameters” folder on the
“Parameters” window and define the HSDPA terminal parameters. In the HSPA tab,define the UE Category (Atoll supports 28 categories) and the Number of Reception
© Forsk 2010 148/183
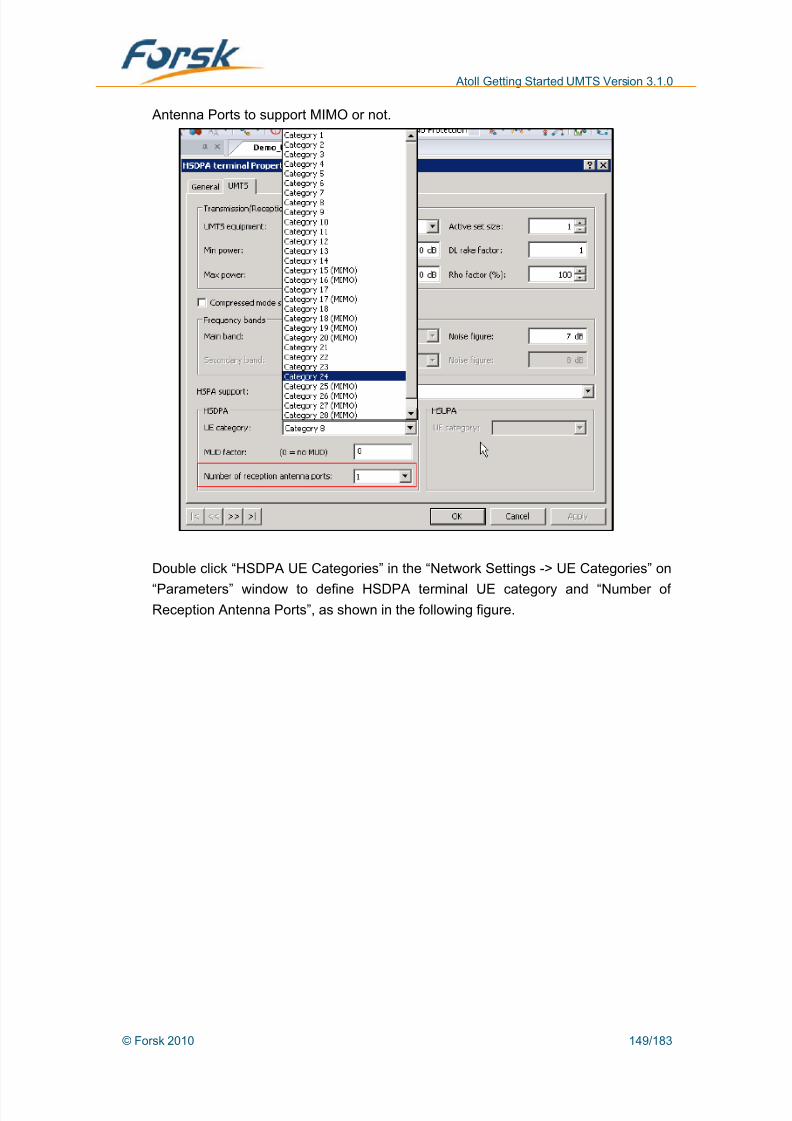
8/12/2019 Atoll Getting Started Umts 310 en v1 130228020806 Phpapp02
http://slidepdf.com/reader/full/atoll-getting-started-umts-310-en-v1-130228020806-phpapp02 149/183
Atoll Getting Started UMTS Version 3.1.0
Antenna Ports to support MIMO or not.
Double click “HSDPA UE Categories” in the “Network Settings -> UE Categories” on
“Parameters” window to define HSDPA terminal UE category and “Number ofReception Antenna Ports”, as shown in the following figure.
© Forsk 2010 149/183

8/12/2019 Atoll Getting Started Umts 310 en v1 130228020806 Phpapp02
http://slidepdf.com/reader/full/atoll-getting-started-umts-310-en-v1-130228020806-phpapp02 150/183
Atoll Getting Started UMTS Version 3.1.0
6) Define HSDPA Bearer Table and MIMO Table
Double click “HSDPA Radio Bearers” in the “Network Settings -> Radio Bearers” on
“Parameters” window to define HSDPA Bearers (Atoll supports 37 bearers). For eachHSDPA bearer, to define Transport Block Size, Number of Used HS-PDSCH
Channels, RLC Peak Rate and Modulation (Atoll supports QPSK, 16QAM and
64QAM). As shown in the following figure.
© Forsk 2010 150/183

8/12/2019 Atoll Getting Started Umts 310 en v1 130228020806 Phpapp02
http://slidepdf.com/reader/full/atoll-getting-started-umts-310-en-v1-130228020806-phpapp02 151/183
Atoll Getting Started UMTS Version 3.1.0
If network supports MIMO, double click “Standard” in the “Network Settings -> Reception
Equipment” on “Parameters” window to define MIMO table. As shown in the following
figure.
Note: To consider Additional MIMO gain in “Clutter Classes” properties on “Geo”window, Spatial Multiplexing Gain Factor and Additional Diversity Gain can be
© Forsk 2010 151/183
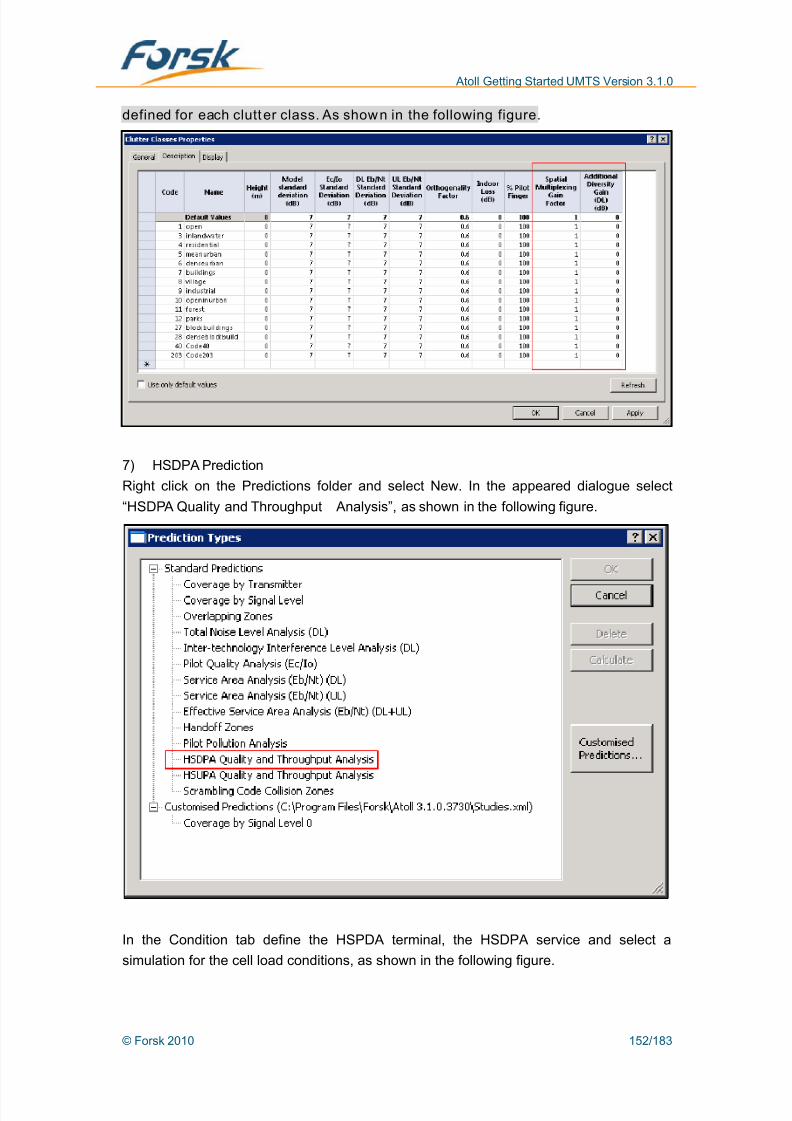
8/12/2019 Atoll Getting Started Umts 310 en v1 130228020806 Phpapp02
http://slidepdf.com/reader/full/atoll-getting-started-umts-310-en-v1-130228020806-phpapp02 152/183
Atoll Getting Started UMTS Version 3.1.0
defined for each clutter class. As shown in the following figure.
7) HSDPA Prediction
Right click on the Predictions folder and select New. In the appeared dialogue select
“HSDPA Quality and Throughput Analysis”, as shown in the following figure.
In the Condition tab define the HSPDA terminal, the HSDPA service and select a
simulation for the cell load conditions, as shown in the following figure.
© Forsk 2010 152/183
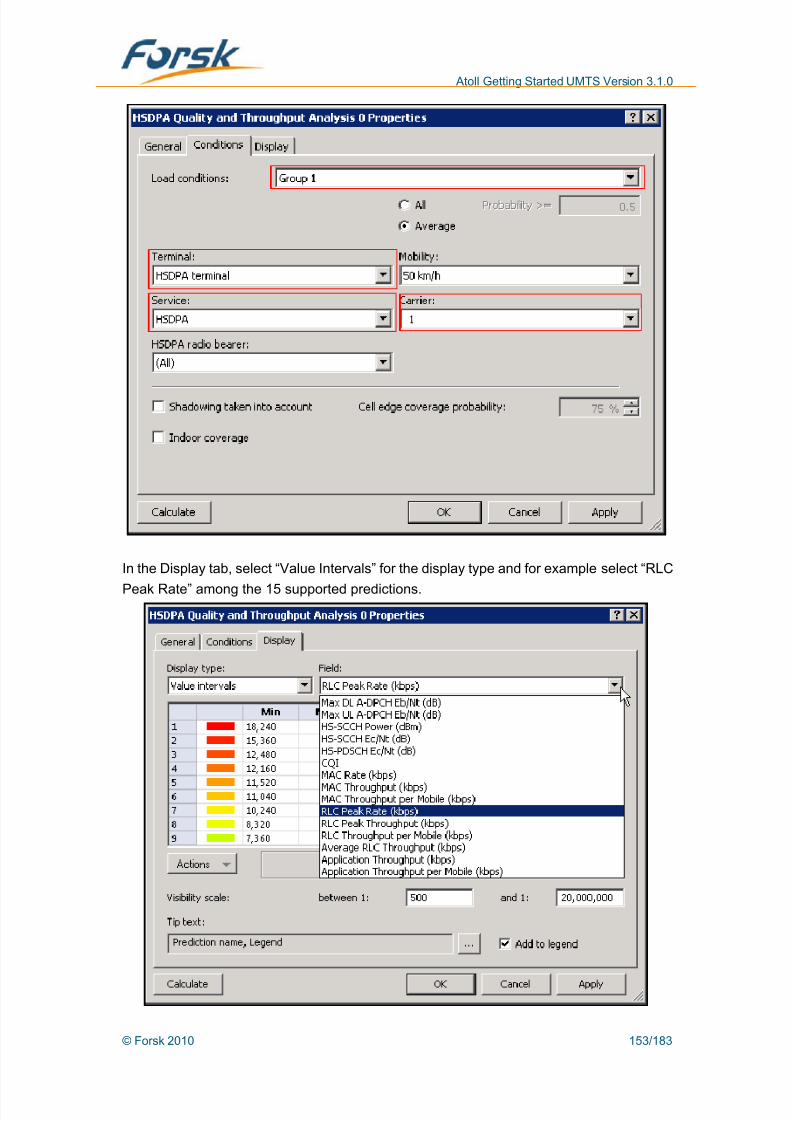
8/12/2019 Atoll Getting Started Umts 310 en v1 130228020806 Phpapp02
http://slidepdf.com/reader/full/atoll-getting-started-umts-310-en-v1-130228020806-phpapp02 153/183
Atoll Getting Started UMTS Version 3.1.0
In the Display tab, select “Value Intervals” for the display type and for example select “RLC
Peak Rate” among the 15 supported predictions.
© Forsk 2010 153/183

8/12/2019 Atoll Getting Started Umts 310 en v1 130228020806 Phpapp02
http://slidepdf.com/reader/full/atoll-getting-started-umts-310-en-v1-130228020806-phpapp02 154/183
Atoll Getting Started UMTS Version 3.1.0
Atoll will display the calculated “HSDPA RLC Peak Rate” in the map window, as shown in
the following figure.
© Forsk 2010 154/183
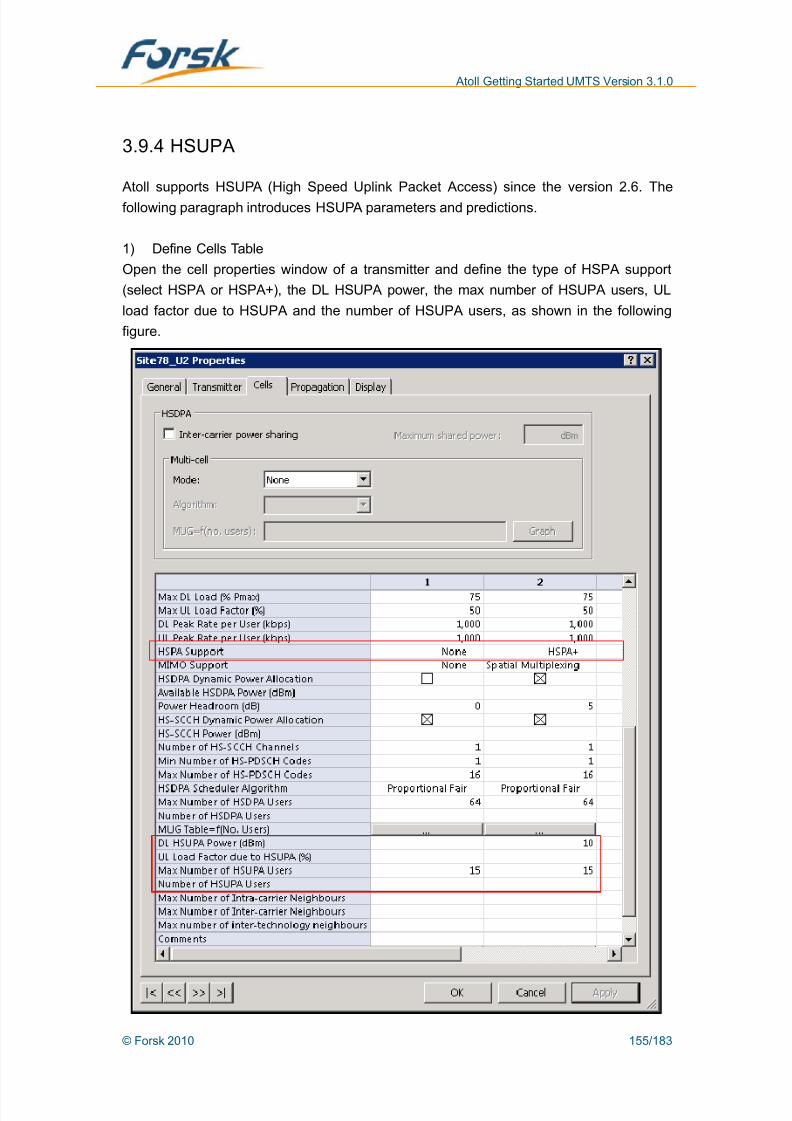
8/12/2019 Atoll Getting Started Umts 310 en v1 130228020806 Phpapp02
http://slidepdf.com/reader/full/atoll-getting-started-umts-310-en-v1-130228020806-phpapp02 155/183
Atoll Getting Started UMTS Version 3.1.0
3.9.4 HSUPA
Atoll supports HSUPA (High Speed Uplink Packet Access) since the version 2.6. The
following paragraph introduces HSUPA parameters and predictions.
1) Define Cells Table
Open the cell properties window of a transmitter and define the type of HSPA support
(select HSPA or HSPA+), the DL HSUPA power, the max number of HSUPA users, UL
load factor due to HSUPA and the number of HSUPA users, as shown in the following
figure.
© Forsk 2010 155/183

8/12/2019 Atoll Getting Started Umts 310 en v1 130228020806 Phpapp02
http://slidepdf.com/reader/full/atoll-getting-started-umts-310-en-v1-130228020806-phpapp02 156/183
Atoll Getting Started UMTS Version 3.1.0
2) Define HSUPA Service
Double click on the “HSUPA” service in the “Traffic Parameters” folder on the
“Parameters” window and define the HSUPA parameters and the associated R99 radio
bearer, as shown in the following figure.
3) Define HSUPA Terminal
Double click on the “HSUPA terminal” in the “Traffic Parameters” folder on the
“Parameters” window and define the HSUPA parameters. In the UMTS tab, define the UE
Category (Atoll supports 7 categories).
© Forsk 2010 156/183

8/12/2019 Atoll Getting Started Umts 310 en v1 130228020806 Phpapp02
http://slidepdf.com/reader/full/atoll-getting-started-umts-310-en-v1-130228020806-phpapp02 157/183
Atoll Getting Started UMTS Version 3.1.0
Double click “HSUPA UE Categories” in the “Network Settings -> UE Categories” on the
“Parameters” window to define “HSUPA User Categories”. In the appeared dialogue,
define for each HSUPA category, the max number of E-DPDCH, Min spreading factor,
Max block size for TTI 2ms and 10ms, the highest modulation and whether TTI 2ms issupported. As shown in the following figure.
© Forsk 2010 157/183
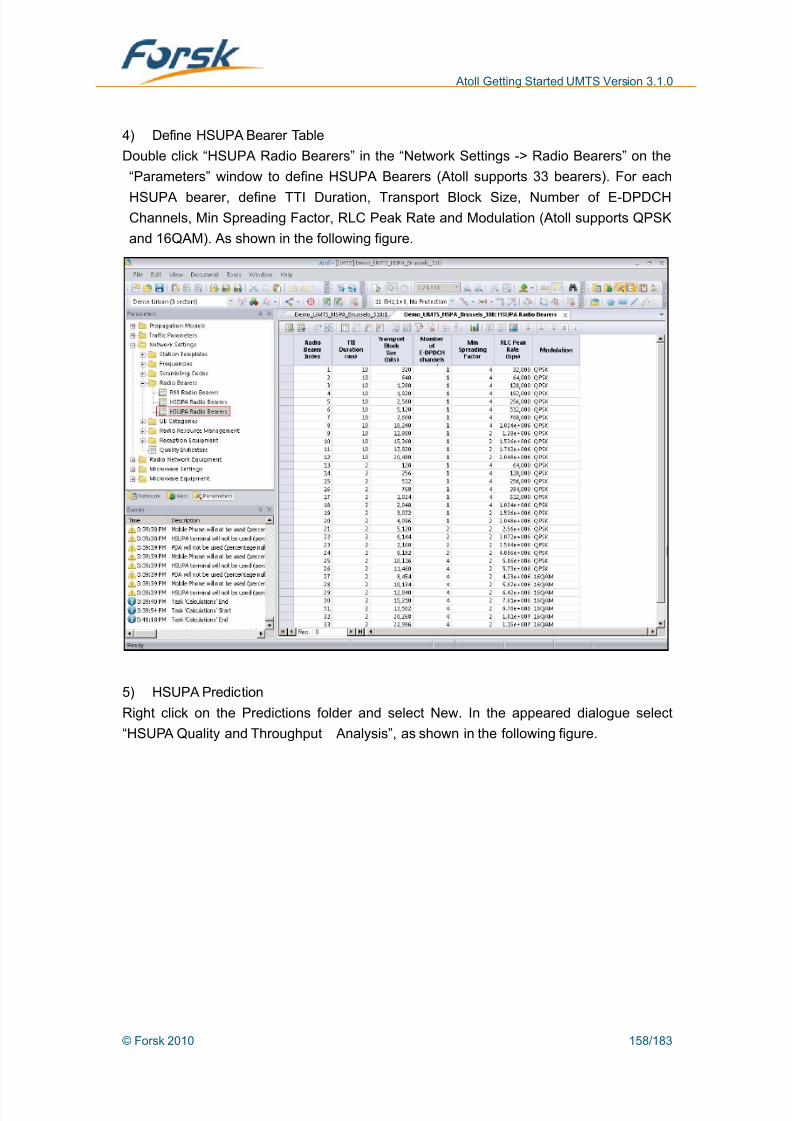
8/12/2019 Atoll Getting Started Umts 310 en v1 130228020806 Phpapp02
http://slidepdf.com/reader/full/atoll-getting-started-umts-310-en-v1-130228020806-phpapp02 158/183
Atoll Getting Started UMTS Version 3.1.0
4) Define HSUPA Bearer Table
Double click “HSUPA Radio Bearers” in the “Network Settings -> Radio Bearers” on the
“Parameters” window to define HSUPA Bearers (Atoll supports 33 bearers). For each
HSUPA bearer, define TTI Duration, Transport Block Size, Number of E-DPDCHChannels, Min Spreading Factor, RLC Peak Rate and Modulation (Atoll supports QPSK
and 16QAM). As shown in the following figure.
5) HSUPA Prediction
Right click on the Predictions folder and select New. In the appeared dialogue select
“HSUPA Quality and Throughput Analysis”, as shown in the following figure.
© Forsk 2010 158/183
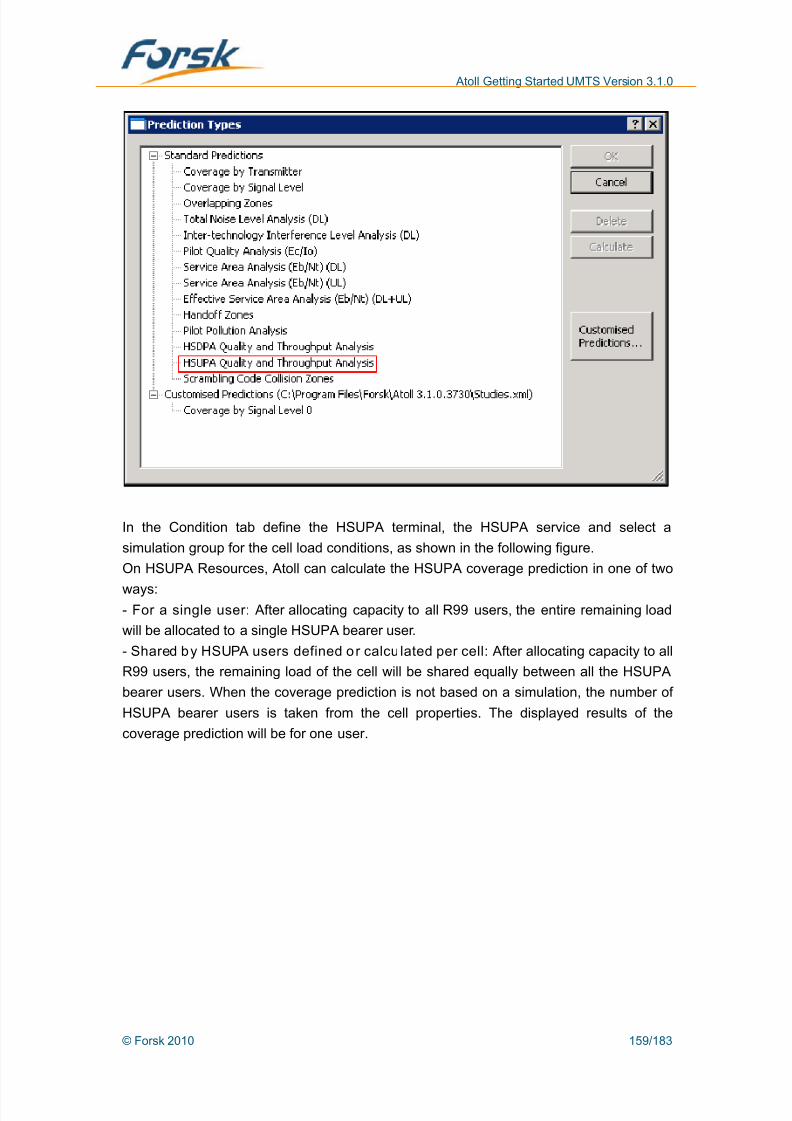
8/12/2019 Atoll Getting Started Umts 310 en v1 130228020806 Phpapp02
http://slidepdf.com/reader/full/atoll-getting-started-umts-310-en-v1-130228020806-phpapp02 159/183
Atoll Getting Started UMTS Version 3.1.0
In the Condition tab define the HSUPA terminal, the HSUPA service and select a
simulation group for the cell load conditions, as shown in the following figure.
On HSUPA Resources, Atoll can calculate the HSUPA coverage prediction in one of two
ways:- For a single user: After allocating capacity to all R99 users, the entire remaining load
will be allocated to a single HSUPA bearer user.
- Shared by HSUPA users defined or calcu lated per cell: After allocating capacity to all
R99 users, the remaining load of the cell will be shared equally between all the HSUPA
bearer users. When the coverage prediction is not based on a simulation, the number of
HSUPA bearer users is taken from the cell properties. The displayed results of the
coverage prediction will be for one user.
© Forsk 2010 159/183
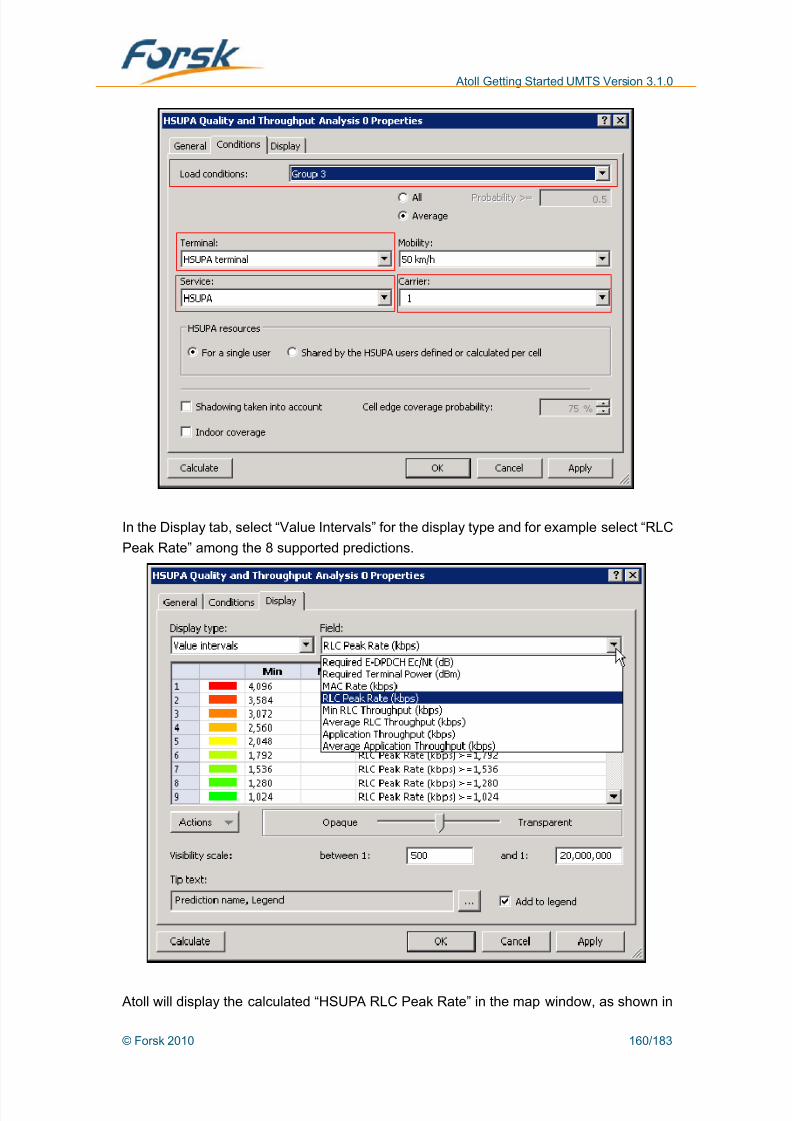
8/12/2019 Atoll Getting Started Umts 310 en v1 130228020806 Phpapp02
http://slidepdf.com/reader/full/atoll-getting-started-umts-310-en-v1-130228020806-phpapp02 160/183
Atoll Getting Started UMTS Version 3.1.0
In the Display tab, select “Value Intervals” for the display type and for example select “RLC
Peak Rate” among the 8 supported predictions.
Atoll will display the calculated “HSUPA RLC Peak Rate” in the map window, as shown in
© Forsk 2010 160/183

8/12/2019 Atoll Getting Started Umts 310 en v1 130228020806 Phpapp02
http://slidepdf.com/reader/full/atoll-getting-started-umts-310-en-v1-130228020806-phpapp02 161/183
Atoll Getting Started UMTS Version 3.1.0
the following figure.
3.9.5 Dual-Cell HSDPA Modeling
Atoll supports Dual-Cell HSDPA since the version 3.1. Transmitters can be defined to
support dual-cell HSDPA. HSDPA scheduling is carried out per transmitter. The capacities
and resources of two HSDPA cells are combined in order to serve HSDPA users. Dual-cell
HSDPA users can connect to two cells simultaneously on the HS-DSCH. Coverage
predictions and Monte Carlo simulations provide results for dual-cell HSDPA.
1) Select to support Deal-Cell on Transmitters table
Select “Dual-Cell” on “Mutil-cell mode” tab, and select one of algorithm methods on
“Algorithm” tab (Atoll supports Max C/I, Round Robin and Proportional Fair). The two cells
on the same transmitter must support HSDPA.
© Forsk 2010 161/183

8/12/2019 Atoll Getting Started Umts 310 en v1 130228020806 Phpapp02
http://slidepdf.com/reader/full/atoll-getting-started-umts-310-en-v1-130228020806-phpapp02 162/183
Atoll Getting Started UMTS Version 3.1.0
Note: The MUG graph is only available if you have set the peak HSDPA throughput
option in the atoll .ini file. For more info rmation, see the Administrator Manual.
2) Define Dual-Cell UE Category
Define the HSDPA terminal to support Dual-Cell UE category, and define which UE
category supports Dual-Cell on HSDPA UE Categories table (Atoll supports 8 UE
categories).
© Forsk 2010 162/183

8/12/2019 Atoll Getting Started Umts 310 en v1 130228020806 Phpapp02
http://slidepdf.com/reader/full/atoll-getting-started-umts-310-en-v1-130228020806-phpapp02 163/183
Atoll Getting Started UMTS Version 3.1.0
3) After simulation, select “Detail Display” by clicking the “Action” button on the “Moblies”
© Forsk 2010 163/183

8/12/2019 Atoll Getting Started Umts 310 en v1 130228020806 Phpapp02
http://slidepdf.com/reader/full/atoll-getting-started-umts-310-en-v1-130228020806-phpapp02 164/183
Atoll Getting Started UMTS Version 3.1.0
tab, then you can see one HSDPA user is connecting two HSDPA cells at the same
time.
© Forsk 2010 164/183

8/12/2019 Atoll Getting Started Umts 310 en v1 130228020806 Phpapp02
http://slidepdf.com/reader/full/atoll-getting-started-umts-310-en-v1-130228020806-phpapp02 165/183
Atoll Getting Started UMTS Version 3.1.0
3.10 Neighbours Allocation
Atoll provides both manual and automatic allocation of neighbours.
3.10.1 Automatic allocation
1) Right click on “Transmitters” in the “Network” window and select “Neighbours->
Intra-technology-> Automatic Allocation”.
2) In the appeared dialog box, define neighbor allocation conditions, click “Calculate” to
start allocation.
© Forsk 2010 165/183

8/12/2019 Atoll Getting Started Umts 310 en v1 130228020806 Phpapp02
http://slidepdf.com/reader/full/atoll-getting-started-umts-310-en-v1-130228020806-phpapp02 166/183
Atoll Getting Started UMTS Version 3.1.0
3) After calculation, the allocation result will display on the appeared dialog box. Click
“commit” button to commit the result to the Cells table.
© Forsk 2010 166/183

8/12/2019 Atoll Getting Started Umts 310 en v1 130228020806 Phpapp02
http://slidepdf.com/reader/full/atoll-getting-started-umts-310-en-v1-130228020806-phpapp02 167/183
Atoll Getting Started UMTS Version 3.1.0
4) Click on the toolbar icon , and then select one transmitter on the Map Window.
The neighbour relations will be displayed graphically, as shown in the following
figure.
Select the best server plot (Coverage by transmitter) and the neighbour areas are
automatically shown in the Map Window.
© Forsk 2010 167/183

8/12/2019 Atoll Getting Started Umts 310 en v1 130228020806 Phpapp02
http://slidepdf.com/reader/full/atoll-getting-started-umts-310-en-v1-130228020806-phpapp02 168/183
Atoll Getting Started UMTS Version 3.1.0
Note: The automatic neighbour allocation can allocate neighbours to multi-cell
transmitters. When there are more than one cell on the transmitter, clicking the
transmitter in the map window opens a context menu which enables to select the
desired cell.
5) Display all neighbor cells.
Right click on “Transmitters” in the “Network” window and select “Neighbours->
Intra-technology-> Open Table”.
© Forsk 2010 168/183

8/12/2019 Atoll Getting Started Umts 310 en v1 130228020806 Phpapp02
http://slidepdf.com/reader/full/atoll-getting-started-umts-310-en-v1-130228020806-phpapp02 169/183
Atoll Getting Started UMTS Version 3.1.0
3.11 Scrambling Codes Allocation
Atoll provides the Automatic Scrambling Code Allocation function.
1) Define Domains for the Scrambling Codes.
Double click “Domains” on the “Network Settings->Scrambling Codes” folder in the
“Parameters” window. In the appeared “Domains” dialogue, Scrambling Codes Domains
can be defined.
2) In the “Domain” properties dialog box, define for each Scrambling Code Group “Min”,
“Max” and “Step”.
3) In the “Cells” table define the “Scrambling code domain” for each cell.
© Forsk 2010 169/183

8/12/2019 Atoll Getting Started Umts 310 en v1 130228020806 Phpapp02
http://slidepdf.com/reader/full/atoll-getting-started-umts-310-en-v1-130228020806-phpapp02 170/183
Atoll Getting Started UMTS Version 3.1.0
4) Right click on the “Transmitters” folder and select “Primary Scrambling
Codes->Automatic Allocation”, as shown in the following figure.
© Forsk 2010 170/183

8/12/2019 Atoll Getting Started Umts 310 en v1 130228020806 Phpapp02
http://slidepdf.com/reader/full/atoll-getting-started-umts-310-en-v1-130228020806-phpapp02 171/183
Atoll Getting Started UMTS Version 3.1.0
5) In the “Primary Scrambling Codes” dialog box define the automatic allocation
properties parameters, as the “Default Reuse Distance” and the allocation strategy.
6) After defining the automatic allocation parameters, click on the “Calculate” button.
The result will be displayed in the same dialogue, as seen in the following figure.
© Forsk 2010 171/183
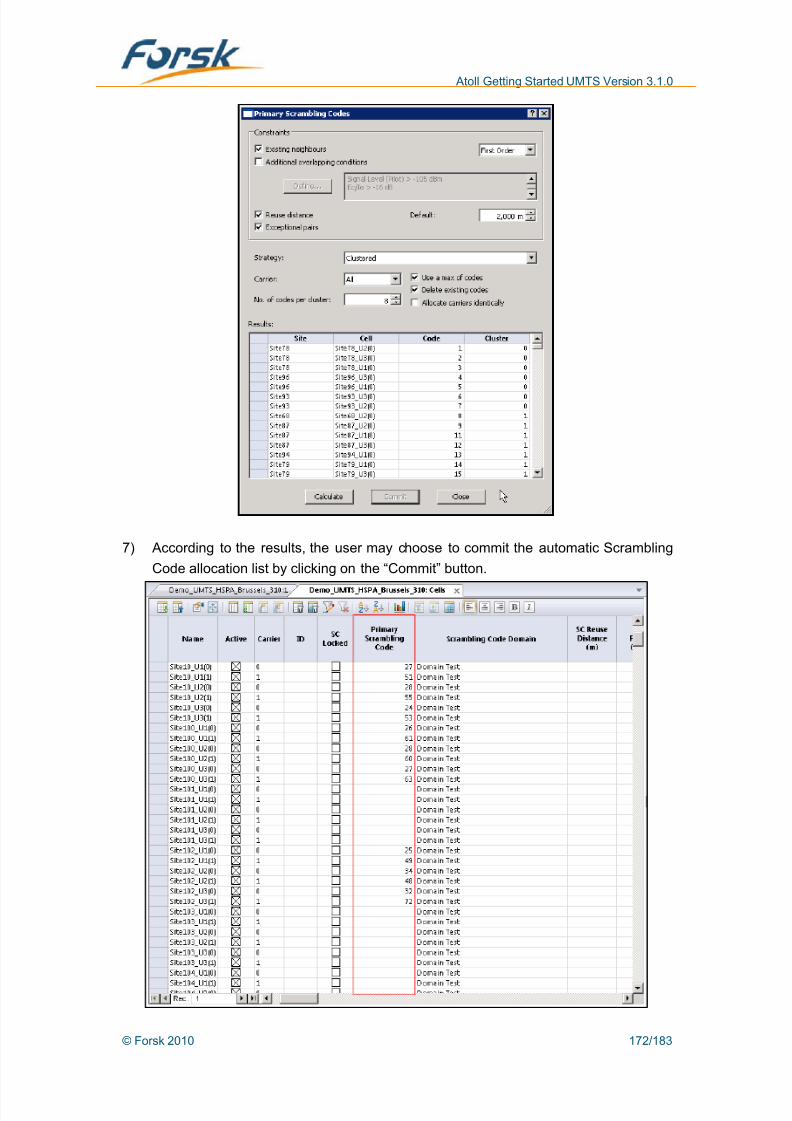
8/12/2019 Atoll Getting Started Umts 310 en v1 130228020806 Phpapp02
http://slidepdf.com/reader/full/atoll-getting-started-umts-310-en-v1-130228020806-phpapp02 172/183
Atoll Getting Started UMTS Version 3.1.0
7) According to the results, the user may choose to commit the automatic Scrambling
Code allocation list by clicking on the “Commit” button.
© Forsk 2010 172/183
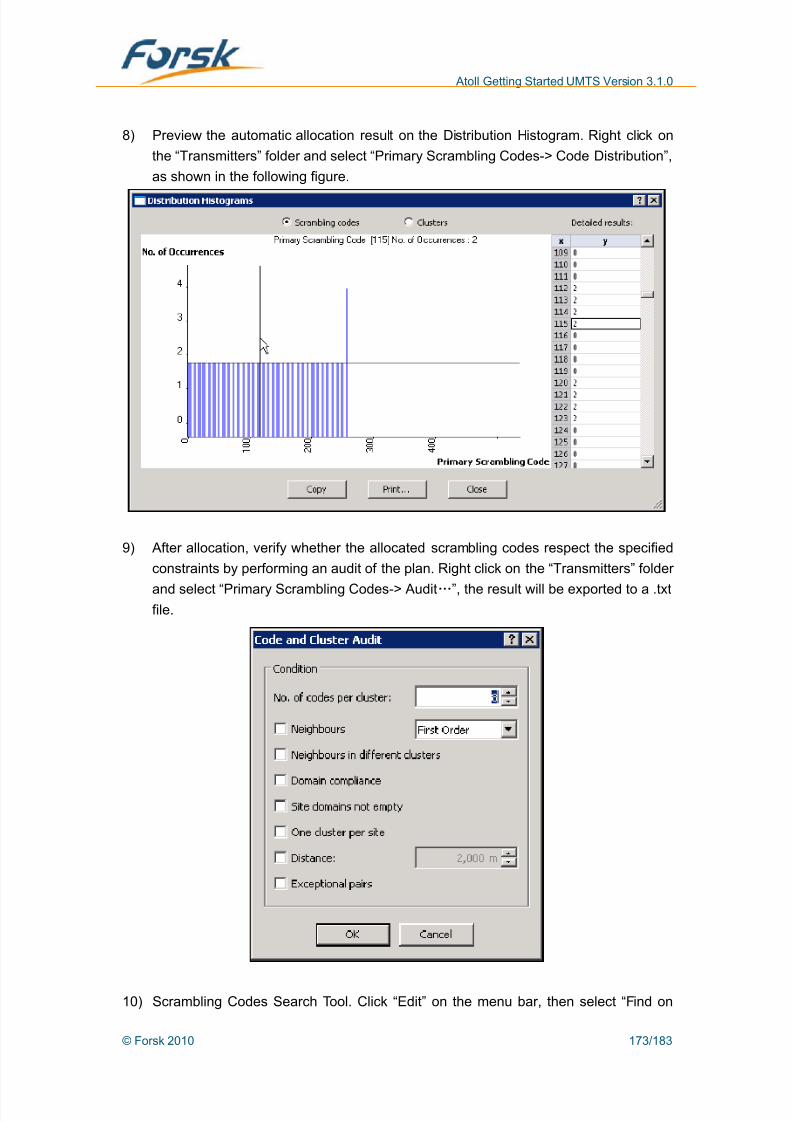
8/12/2019 Atoll Getting Started Umts 310 en v1 130228020806 Phpapp02
http://slidepdf.com/reader/full/atoll-getting-started-umts-310-en-v1-130228020806-phpapp02 173/183
Atoll Getting Started UMTS Version 3.1.0
8) Preview the automatic allocation result on the Distribution Histogram. Right click on
the “Transmitters” folder and select “Primary Scrambling Codes-> Code Distribution”,
as shown in the following figure.
9) After allocation, verify whether the allocated scrambling codes respect the specified
constraints by performing an audit of the plan. Right click on the “Transmitters” folder
and select “Primary Scrambling Codes-> Audit…”, the result will be exported to a .txtfile.
10) Scrambling Codes Search Tool. Click “Edit” on the menu bar, then select “Find on
© Forsk 2010 173/183
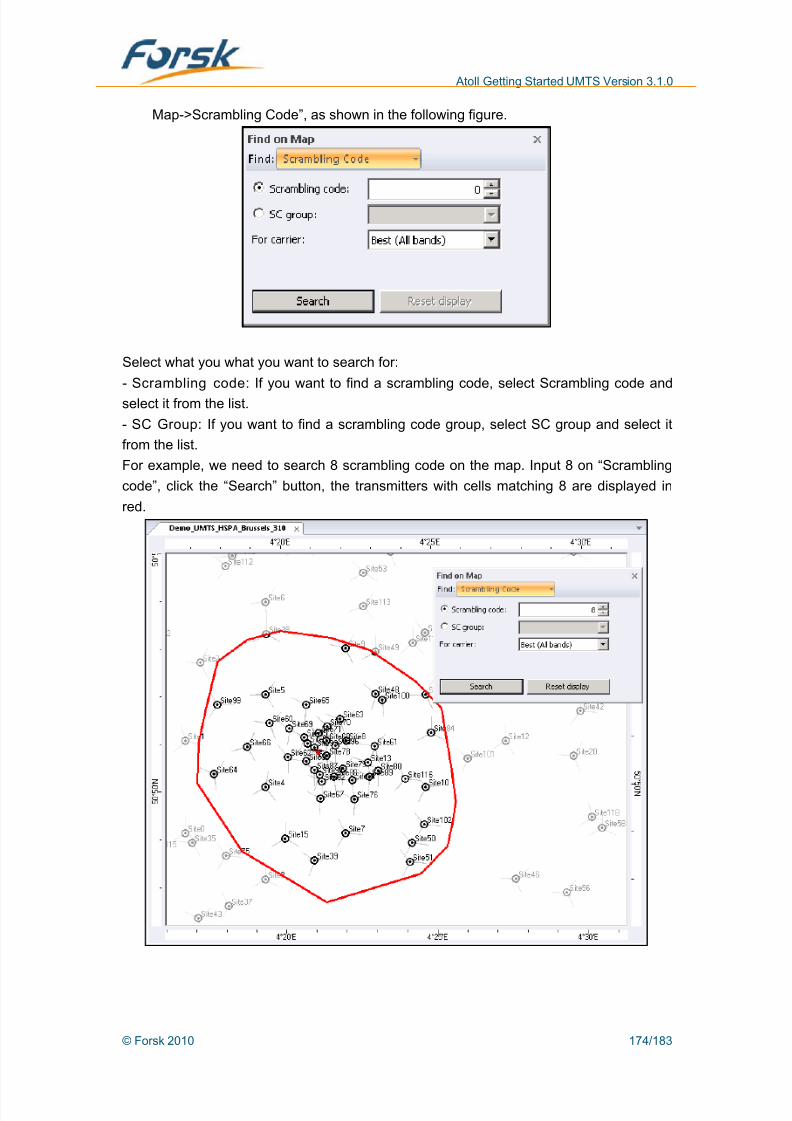
8/12/2019 Atoll Getting Started Umts 310 en v1 130228020806 Phpapp02
http://slidepdf.com/reader/full/atoll-getting-started-umts-310-en-v1-130228020806-phpapp02 174/183
Atoll Getting Started UMTS Version 3.1.0
Map->Scrambling Code”, as shown in the following figure.
Select what you what you want to search for:
- Scrambling code: If you want to find a scrambling code, select Scrambling code and
select it from the list.
- SC Group: If you want to find a scrambling code group, select SC group and select it
from the list.
For example, we need to search 8 scrambling code on the map. Input 8 on “Scrambling
code”, click the “Search” button, the transmitters with cells matching 8 are displayed in
red.
© Forsk 2010 174/183

8/12/2019 Atoll Getting Started Umts 310 en v1 130228020806 Phpapp02
http://slidepdf.com/reader/full/atoll-getting-started-umts-310-en-v1-130228020806-phpapp02 175/183
Atoll Getting Started UMTS Version 3.1.0
3.12 Other features
3.12.1 User configuration funct ion
The user configuration function allows the user to save the configuration of “Geographic
Data Set”, “Computation and Focus Zones”, “Folder Configuration”, “Automatic Neighbour
Allocation Parameters” and “Prediction List” into external file. This configuration file can be
used in the same project or other similar Atoll project in order to avoid redundant settings.
1) Save the user configuration: Select “Tools->User Configuration->Save”.
2) Select the information to be exported and click on the “OK” button. The project
configuration will be saved in a “.cfg” file.
© Forsk 2010 175/183
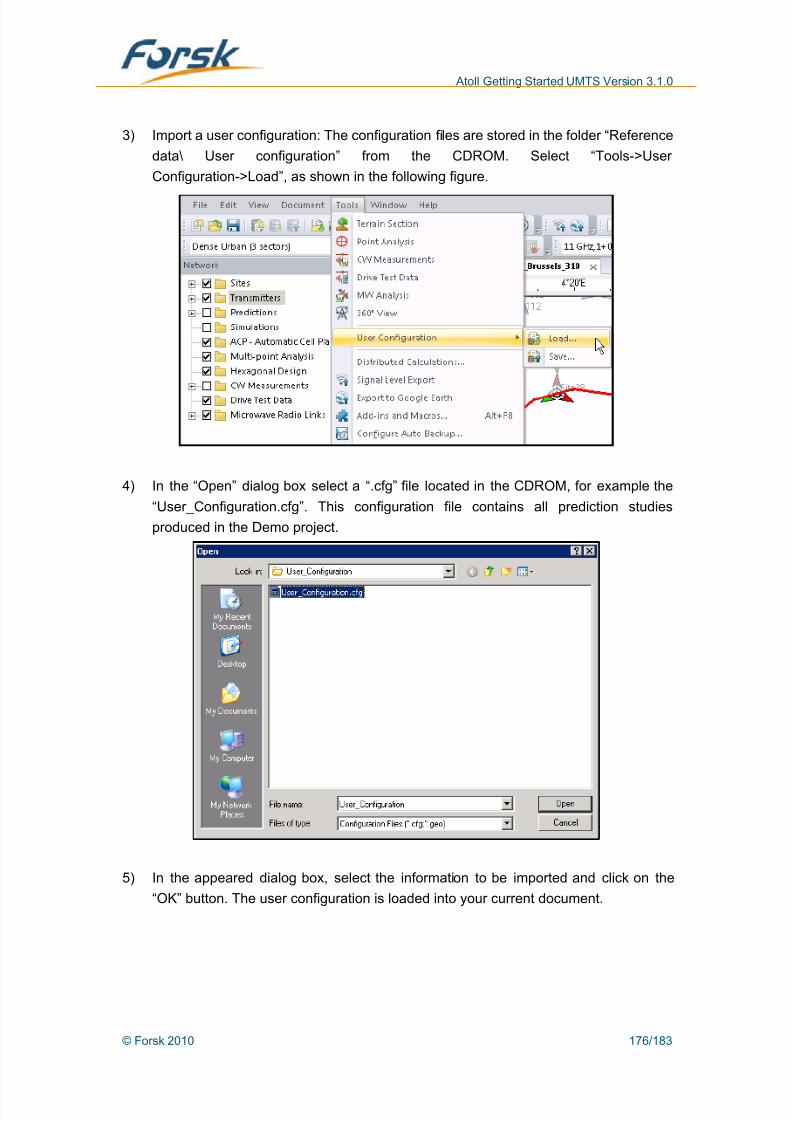
8/12/2019 Atoll Getting Started Umts 310 en v1 130228020806 Phpapp02
http://slidepdf.com/reader/full/atoll-getting-started-umts-310-en-v1-130228020806-phpapp02 176/183
Atoll Getting Started UMTS Version 3.1.0
3) Import a user configuration: The configuration files are stored in the folder “Reference
data\ User configuration” from the CDROM. Select “Tools->User
Configuration->Load”, as shown in the following figure.
4) In the “Open” dialog box select a “.cfg” file located in the CDROM, for example the
“User_Configuration.cfg”. This configuration file contains all prediction studies
produced in the Demo project.
5) In the appeared dialog box, select the information to be imported and click on the
“OK” button. The user configuration is loaded into your current document.
© Forsk 2010 176/183
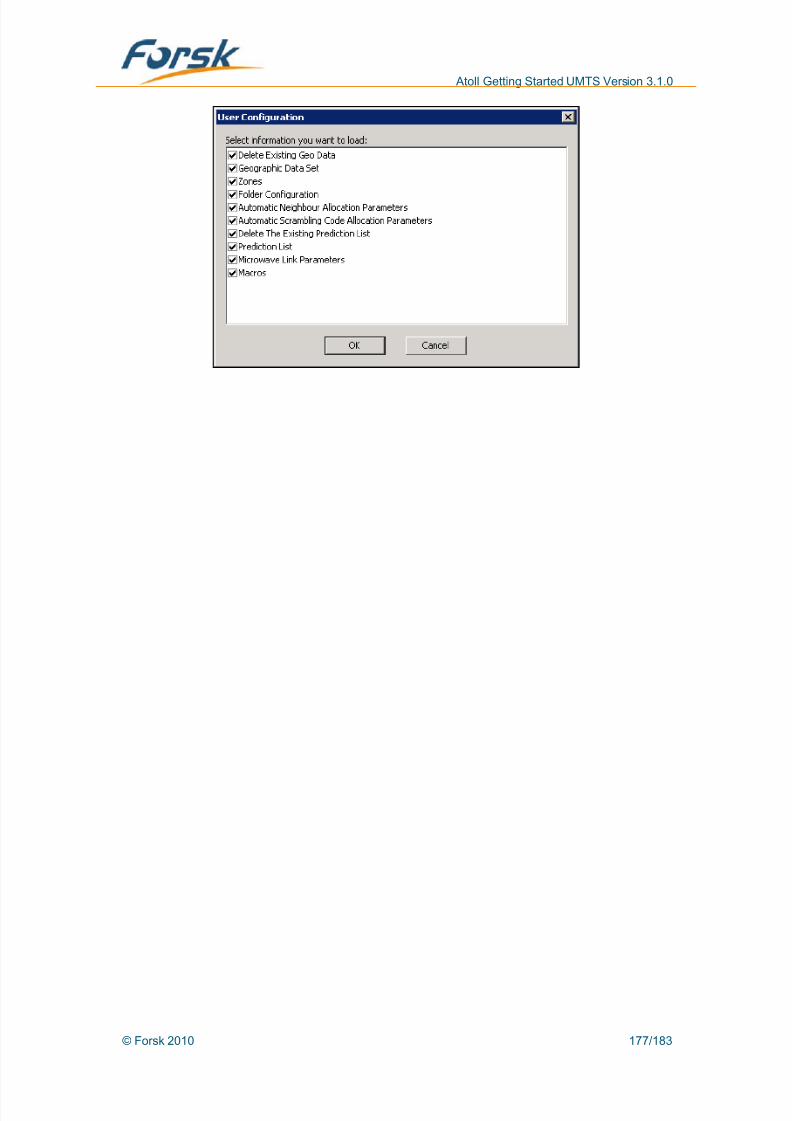
8/12/2019 Atoll Getting Started Umts 310 en v1 130228020806 Phpapp02
http://slidepdf.com/reader/full/atoll-getting-started-umts-310-en-v1-130228020806-phpapp02 177/183
Atoll Getting Started UMTS Version 3.1.0
© Forsk 2010 177/183
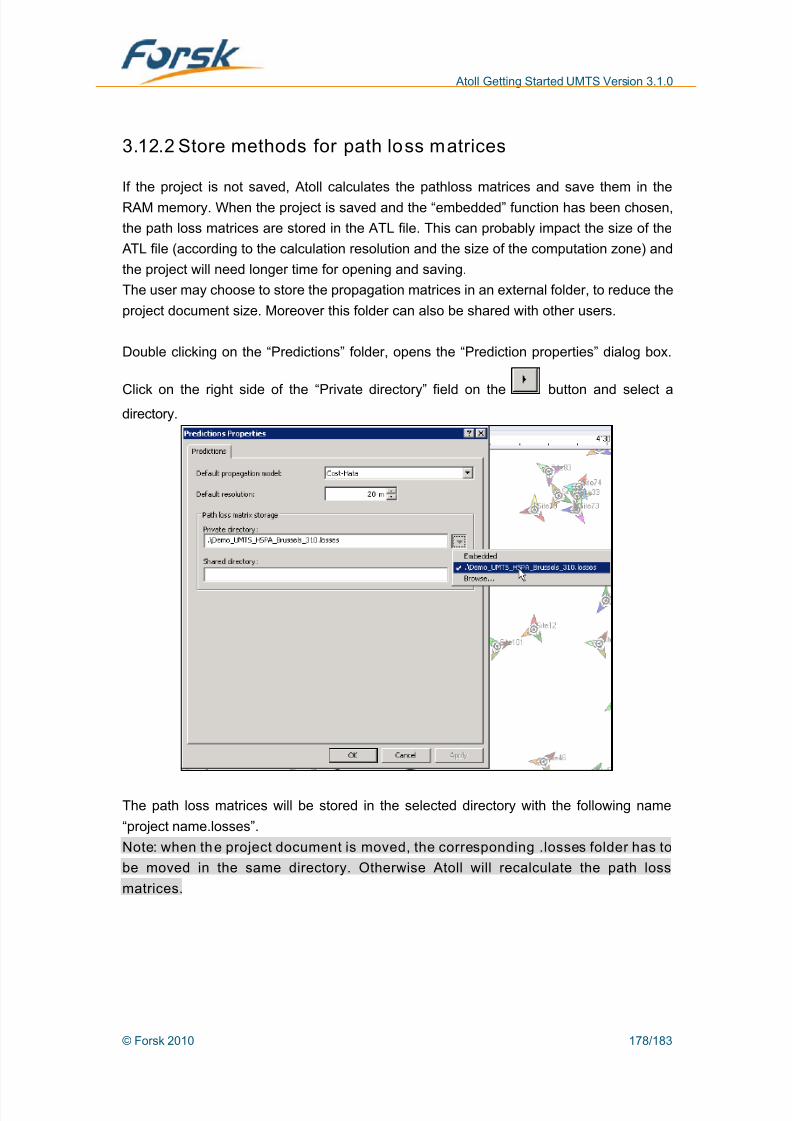
8/12/2019 Atoll Getting Started Umts 310 en v1 130228020806 Phpapp02
http://slidepdf.com/reader/full/atoll-getting-started-umts-310-en-v1-130228020806-phpapp02 178/183
Atoll Getting Started UMTS Version 3.1.0
3.12.2 Store methods for path loss matrices
If the project is not saved, Atoll calculates the pathloss matrices and save them in the
RAM memory. When the project is saved and the “embedded” function has been chosen,
the path loss matrices are stored in the ATL file. This can probably impact the size of the
ATL file (according to the calculation resolution and the size of the computation zone) and
the project will need longer time for opening and saving.
The user may choose to store the propagation matrices in an external folder, to reduce the
project document size. Moreover this folder can also be shared with other users.
Double clicking on the “Predictions” folder, opens the “Prediction properties” dialog box.
Click on the right side of the “Private directory” field on the button and select adirectory.
The path loss matrices will be stored in the selected directory with the following name
“project name.losses”.
Note: when the project document is moved, the corresponding .losses folder has to
be moved in the same directory. Otherwise Atoll will recalculate the path loss
matrices.
© Forsk 2010 178/183
8/12/2019 Atoll Getting Started Umts 310 en v1 130228020806 Phpapp02
http://slidepdf.com/reader/full/atoll-getting-started-umts-310-en-v1-130228020806-phpapp02 179/183
Atoll Getting Started UMTS Version 3.1.0
4 Tips and tricks
How to impor t geo data easily?
Drag and drop feature is available for any geo data object to import in ATOLL. To do this,
just select the accurate geo data file in your file explorer and drag it to ATOLL. The format
will be automatically detected by the tool.
This can also be made on PlaNET® index data file.
How to change globally a value for all the transmitters?
The right way to make global changes is to open the Transmitter table, modify the
contents in the first cell, select all the columns and then use the fill-down feature, available
in the Edit menu or with the shortcut ctrlD.
To select all the cells of the column, the easiest way is to select the first one, then selectthe last one holding the Shift button.
How to find easily a site on the map?
A search bar is available to find the location of sites on the map. The Search bar can be
opened or closed by selecting the Search bar command in the View menu. In the Search
bar, type the first characters of the site name in the Find site box. ATOLL displays a
scrolling list containing all the sites, which the name begins with this string of characters.
Then, either select the site in the list, or go on typing the site name to reduce the number
of sites in the list. After choosing the site in the list, ATOLL automatically centers the map
on the selected site. As in advanced filters, it is possible to use the “contains” (*string*)
and “begins with” (string*) criteria to search for sites which name contains or begins with
the given string.
How to be automatically placed in the Find site box?
Use the F3 shortcut to be automatically placed in the Find site box of the Search bar.
How to delete all sites and their transmitters in one shot (or a set of sites and
transmitters)?
The right way to delete all sites and their transmitters is to open the Sites table, select thefirst one and the last one holding the Shift button and use Suppr keyboard button. It is
recommended to close the Sites and Transmitters folders before deleting a large number
of sites and transmitters; otherwise the refresh of the explorer could take a long time.
How to access the properties of any object or group of objects?
In ATOLL, the properties of any object (geo data, sites, transmitters, measurements, etc…)
can be accessed from the associated context menu. This is reachable by right-clicking on
the considered object/group and choosing the properties command.
How to filter data rapidly?
© Forsk 2010 179/183

8/12/2019 Atoll Getting Started Umts 310 en v1 130228020806 Phpapp02
http://slidepdf.com/reader/full/atoll-getting-started-umts-310-en-v1-130228020806-phpapp02 180/183
Atoll Getting Started UMTS Version 3.1.0
The easiest way is to perform directly filters within the tables (popup menu available by
right-clicking in the table). OR and AND criteria can be easily handled:
Selecting cells in several columns and the option “Filtering by selection” in the popup
menu performs a AND filtering criterion
Selecting cells in several rows and the option “Filtering by selection” in the popupmenu performs a OR filtering criterion
To check which kind of dynamic criterion has been used by ATOLL, you can open
Transmitters/Properties/General tab and look at the advanced filter.
How to work only on “l ive” sites?
Let's assume there is a flag (user field) in Site table dedicated to the status of the site
(“live”, “on-built”, “planned”,…).
Filtering sites directly in the table with the popup menu (“Filtering by selection”) allows to
keep just “live” sites.
Filters on site are automatically performed on transmitters (“As site folder” is the default
configuration for Transmitter folder). Further simulations or predictions will be achieved
only on “live” sites.
How to use wildcard characters to filter text-format fields?
Wildcard characters such as “*” can be used when defining advanced filter criteria on
fields with text format.
Entering *string* enables you to filter objects which the chosen field contains the string of
characters.
Entering string* enables you filter objects which the chosen field begins with the string ofcharacters.
Example: How to display transmitters which are allocated a channel XX?
In the Transmitter table structure, there is a field “Channels” which contains a flat list of the
channels allocated to the transmitter. It is possible to define an advanced filter as follows:
Use the Advanced filter tab of the Filter dialog
(Transmitters/Properties.../General/Filter/Advanced filter):
Columns: select “Channels” in the list
Criteria: =* XX * (which means CONTAINS)
Only the transmitters with the channel XX are displayed.
The same filter can be managed at the level of any study by transmitter.
How to change globally the names of all the sites?
There is a Find/Replace feature in the Edit menu available when a table is opened. To
prefix all the sites with your name for example, select the first cell of the “name” column in
the Site table and use the Edit/Replace feature.
How to find easily an object by its name in a folder?
Open the folder and type the first letters of the object's name.
© Forsk 2010 180/183
8/12/2019 Atoll Getting Started Umts 310 en v1 130228020806 Phpapp02
http://slidepdf.com/reader/full/atoll-getting-started-umts-310-en-v1-130228020806-phpapp02 181/183
Atoll Getting Started UMTS Version 3.1.0
How to open or close rapidly a folder?
Shortcuts, available in standard Windows applications are available within ATOLL to open
or close the selected folder with shortcuts.
“Right arrow” and “Left arrow” respectively open and close the selected folder just like “+”
and “-” on the numeric keyboard.“*” on the numeric keyboard opens all the subfolders of the selected folder.
[Alt F4] may be used to quit Atoll rapidly when no modifications were made. If there are
modifications, you will be asked to save them anyway.
How to find easily an object in a table?
A Find feature is available in the Edit menu when a table is opened. To find an object in a
table, open the table and use the Find feature.
How to find easily an object on the map?
The “Centre map” feature allows the user to find on the map any object located into a
folder (site, transmitter, etc…). When choosing this command in the associated context
menu, the considered object is automatically displayed in the centre of the current
workspace.
How to customize the columns displayed in a table?
When a table is opened, you may use the “Display columns…” feature available in the
Format menu to choose which columns you want to keep within the table. This is useful to
customize reports on transmitters or import Excel-format data by matching columns on
both sides and copying-pasting into the table.
How to customize the table style?
When a table is opened, you may use features available in the Format menu in order to
customize the table style.
To change the title style, choose the Format title feature.
To modify the column style, select a column and use the Format columns feature.
You may also use the Align Left, Centre, Align Right, Bold and Italic features.
How to change globally display properties of objects (sites, vectors, measurement
points…)?
In the Display tab, select the whole table describing the display configuration and click on
the Modify button. In the Display window, you can choose a unique symbol for all the
objects.
How to predict s ignal level (received from a transmitter) on a road?
The easiest way consists in using measurement features. Let’s assume you have
previously imported a vector file. The procedure is divided into three steps:
Right click on a linear object and select the Element properties feature. In the
Geometry tab, copy the list of coordinates (ctrl-C). Right click on the Measurement folder and select the New feature. Give a name to
© Forsk 2010 181/183
8/12/2019 Atoll Getting Started Umts 310 en v1 130228020806 Phpapp02
http://slidepdf.com/reader/full/atoll-getting-started-umts-310-en-v1-130228020806-phpapp02 182/183
Atoll Getting Started UMTS Version 3.1.0
© Forsk 2010 182/183
the path, specify measurement unit, transmitter and receiver properties and finally
click on the Paste button. Then, click on OK to validate the path creation.
Open the path properties window. Choose a propagation model, click on Actions and
choose Calculate predictions. The signal level calculated on the path is displayed in a
related table (P(dBm) column). You may use the Measurements window to visualizethe signal level received from the selected transmitter on the path.
How to work on a set of sites selected by a polygon?
Let's assume polygons are available within ATOLL. Right-clicking on the polygon, you can
use it as the working zone or as a filtering polygon. Sites, transmitters and future
calculations are filtered with this polygon.
You can save the polygon filter as a configuration of the Site folder, and repeat this
operation with as many polygons as you wish.
Then, directly right-clicking on the Site folder, you will get all the available configurations
for the folder and be able to rapidly switch from one to another.
Configurations are saved in the ATL file but possibly also in database.
How to obtain a link budget?
Right-click anywhere in the Profile window opens a context menu. This menu allows you
to change receiver properties, gives the choice between signal level, pathloss or total
losses display, and offers a link budget. If the propagation model used by the selected
transmitter is a Standard Propagation Model, there is an additional feature, useful for
validation, called “Model details” providing detailed results along the profile.
How is it poss ible to display city po ints and their names on the map?With a vector format providing for each point an attribute containing the name.
Import the vector file within ATOLL and choose the field “name” as label (you can use any
field or list of fields in the same way).
Where can you define the default server for distributed computing?
In the Atoll.ini file:
[RemoteCalculation]
Servers=Workstation_1; Workstation_2
If the list is empty, computations are run locally.
You can display different areas or view different scales of the same document at the same
time thanks to the “Window->New” command. When selecting this command, a new Map
Window is created with exactly the same view as the current one. You can then modify
area and scale of both windows independently. For instance, with this feature you can
zoom in very close on two faraway sites without having to display everything between
them. You can also display an overview of the whole network and a small part of it with two
different scales.
Note: Items displayed in all map views depend on the explorer settings and are the
same in all windows, except if you have different scales for the windows and some
visibility settings according to scales.
8/12/2019 Atoll Getting Started Umts 310 en v1 130228020806 Phpapp02
http://slidepdf.com/reader/full/atoll-getting-started-umts-310-en-v1-130228020806-phpapp02 183/183
Atoll
Gett ing Started UMTSVersion 3.1.0


