Page 1
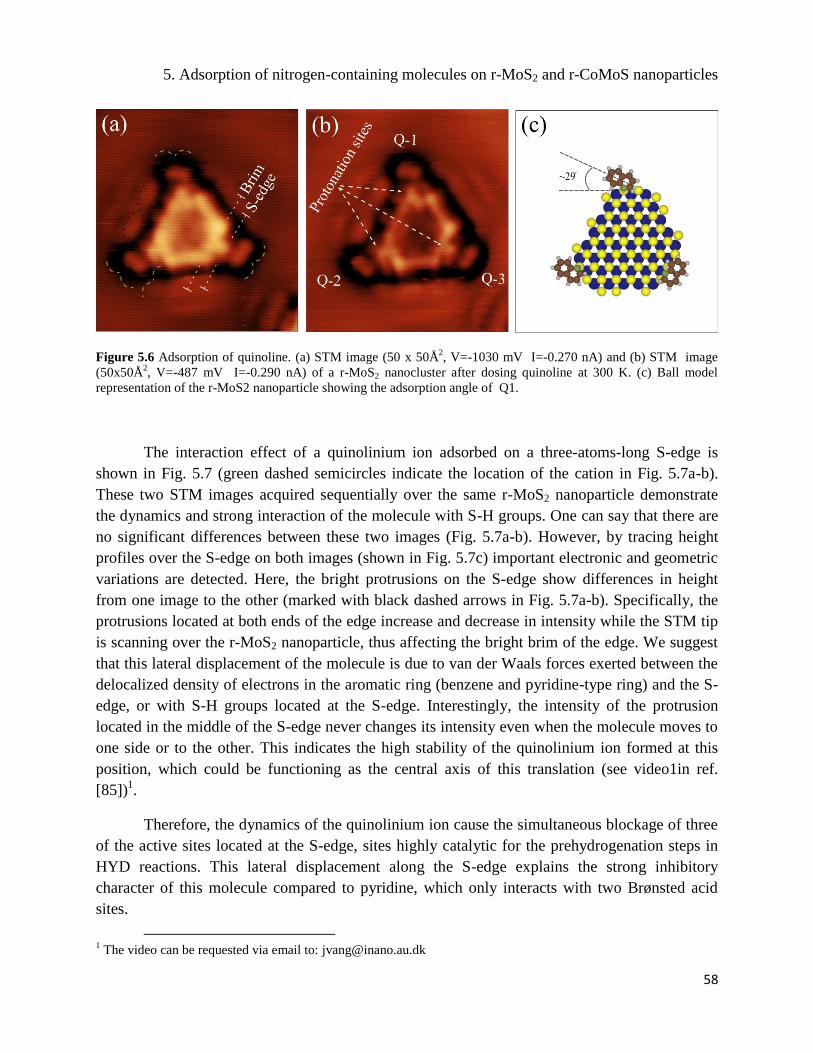
Atomic-scale investigation of the interaction
of organic molecules with MoS2-based
hydrotreating model catalysts
NORBERTO JOSÉ SALAZAR MOREIRA
Interdisciplinary Nanoscience Center (iNANO) and
Department of Physics and Astronomy
Aarhus University, Denmark
PhD thesis
June 2017
Page 2
ii
1
st edition
June 26, 2017
This thesis has been submitted to the Faculty of Science and
Technology at the University of Aarhus in order to fulfil the
requirements for obtaining a PhD degree in physics and
nanoscience. The work has been carried out under the
supervision of Associate Professor Jeppe Vang Lauritsen at
the Interdisciplinary Nanoscience Center (iNANO) and the
Department of Physics and Astronomy.
Page 3
iii. Abstract
The aim of this work is to provide new insight into the formation, activation and
reactivity of hydrotreating catalysts extensively used in the refinery for the conversion of heavy
feedstocks and for improving the quality of the final oil products. This is done through numerous
studies of the conversion of molybdenum oxides and metallic precursors into molybdenum
disulfide (MoS2), the active phase involved in most of the hydrotreating reactions, especially for
those dedicated to the removal of sulfur from various fuel fractions, commonly referred to as
hydrodesulfurization (HDS).
The evolution of the morphology, structure, and stoichiometry of molybdenum oxide on
Au(111) single crystal as a function of the annealing temperature is studied through the interplay
of X-ray photoelectron spectroscopy (XPS) and scanning tunneling microscopy (STM). The
progressive annealing steps in ultra high vacuum (UHV) largely vary the overall stoichiometry
of the system due to the thermal decomposition of the molybdenum oxide, which affects the
sulfidation and growth of MoS2 structures. The prerequisite for the efficient formation of MoS2
is that Mo stays in the highest oxidation state before sulfidation, whereas the presence of the
reduced MoOx phase impedes the MoS2 growth and leads to rather stable amorphous oxysulfide
phases.
The sulfidation in H2S atmosphere of molybdenum metal and bimetallic cobalt-
molybdenum clusters deposited on Au(111) facilitate instead the formation of well-dispersed
MoS2 and Co-promoted MoS2 nanoparticles over the surface. In this work, the morphology and
edge structure modification of the nanoparticles is demonstrated by exposing the catalysts in a
reductive H2 atmosphere at relative high pressures and temperature for our system. Crystal
reshaping of the MoS2 from triangles to truncated triangular-shape nanoparticles is rationalized
in terms of the relative ratio of edge free energies for MoS2 (γS/γMo) by a combined stabilization
and destabilization of the most stable low-index edges, which are usually the (1010) Mo-edge
and the (1010) S-edge, respectively. For the case of the hexagonal Co-promoted MoS2
nanoparticles, the absence of a morphology modification is explained by the already favorable
energy of the Co-promoted S-edges which is apparently not further affected by the reductive
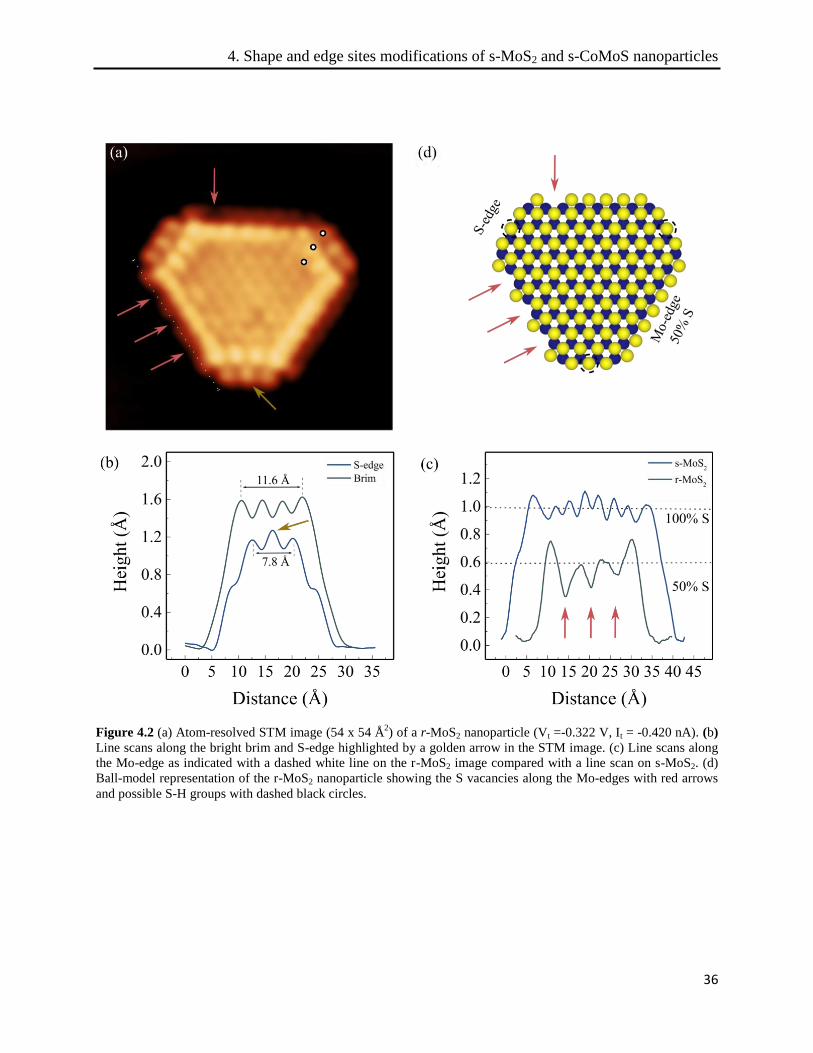
condition. It is observed a reduction of the sulfur coverage for the Mo-edge on both structures.
However, for the reduced MoS2 nanoparticles, it is shown that the new S-edge generated present
coverage of 100% S with the possible presence of S-H groups formed. Formation of S-H groups
Page 4
iv
on the S-edge for the reduced Co-promoted MoS2 nanoparticles is also proposed but for this edge
the sulfur coverage is reduced to 50%. The reduction of the nanoparticles in H2 reveals a variety
of possible active sites which indicates that the catalysts are now present in their active states for
HDS reactions.
These active sites are shown to be reactive with some of the typical sulfur heterocyclic
compounds present in real feeds as thiophene, dibenzothiophene (DBT) and 4,6-
dimethyldibenzothiophene (4,6-DMDBT). However, it is found that the active sites are also
commonly subject to occupancy by some other molecules present naturally in the oil feed that
inhibit the HDS reaction, like pyridine and quinoline. A detailed study of the adsorption sites for
these sulfur and nitrogen-containing molecules is present in this thesis.
In summary, the research in this PhD thesis elucidates some of the fundamental questions
regarded to the understanding of the active structures, preferable adsorption sites and
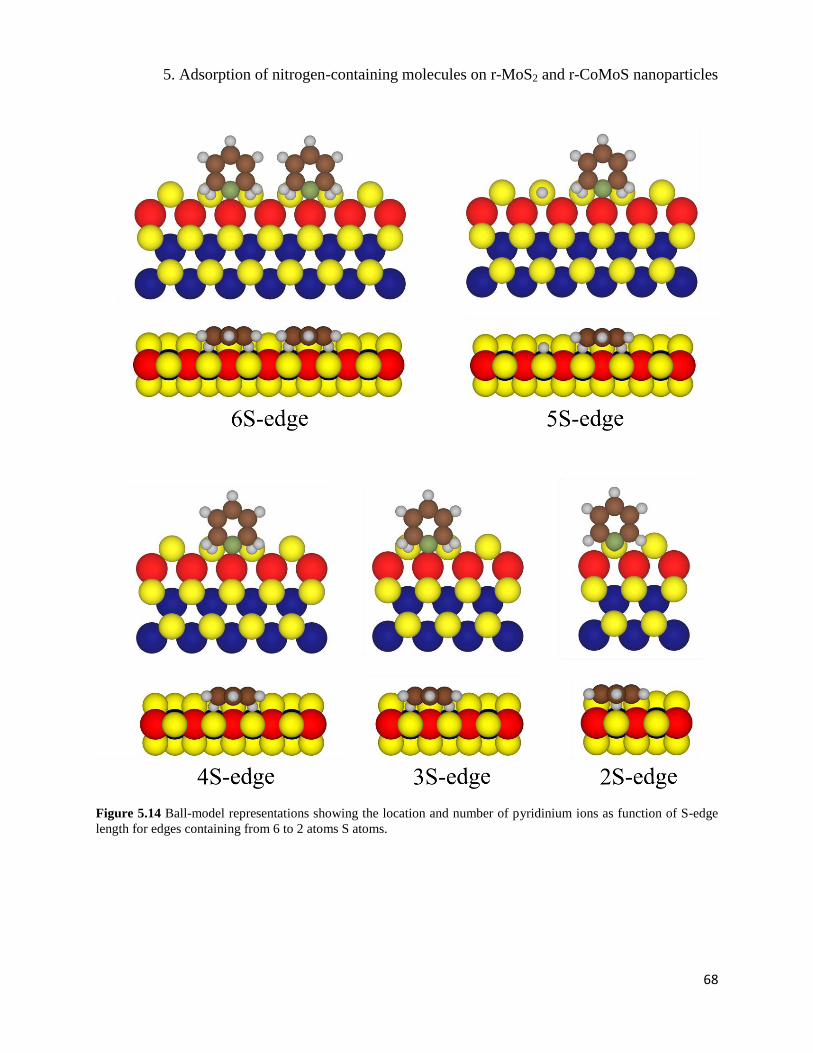
deactivation origin of the non-promoted and Co-promoted MoS2-based catalysts in HDS
reactions. These findings could potentially enable the improvement of the current catalysts or the
design of new catalyst on the molecular level for deep desulfurization, providing
environmentally more acceptable reformulated fuels.
Page 5
v. Resumé
Arbejdet præsenteret i denne ph.d. afhandling har til formål at give ny indsigt i
dannelsen, aktiveringen og reaktiviteten af de afsvovlingskatalysatorer, som bruges i vidt omfang
i raffinaderier til omdannelse af tunge råmaterialer og i forbedring af kvaliteten af det endelige
olie produkt. Dette er udført igennem talrige studier af omdannelsen fra molybdænoxider og
metaller til molybdændisulfid (MoS2). MoS2 er den aktive fase, som er involveret i de fleste
afsvovlingsreaktioner og særligt for dem som er dedikeret til at fjerne svovl fra forskellige
brændstofdele. Dette betegnes som hydro-afsvovling (HDS).
Udviklingen af morfologien, strukturen og støkiometrien som funktion af
opvarmningstemperatur af molybdænoxide på en Au(111) krystal er studeret ved hjælp af
komplementær teknikkerne røntgen fotoelektron spektroskopi (XPS) og skanning tunnel
mikroskopi (STM). Den gradvis stigende opvarmningstemperatur i ultra højt vakuum (UHV)
resulterer i store forskelle i den overordnede støkiometri af systemet på grund af den termiske
dekomponering af molybdænoxiden, hvilket influerer svovlingen og væksten af MoS2
strukturerne. Det er en forudsætning for en effektiv dannelse af MoS2, at molybdæn bliver i sit
højeste oxidationstrin forud for svovlingen, hvorimod tilstedeværelsen af den reducerede MoOx
fase hæmmer væksten af MoS2 og i stedet medfører dannelsen af stabile amorfe oxysulfider.
I stedet faciliterer svovlingen af metalliske molybdæn og bi-metalliske kobolt-molybdæn
klynger deponeret på Au(111) i en H2S atmosfære dannelsen af MoS2 og Co-promoteret MoS2
nanopartikler, som er fordelt jævnt på overfladen af Au(111). I dette studie er ændringen i
morfologi og kant-struktur for nanopartiklerne demonstreret, ved at udsætte katalysatoren for en
reduktiv H2 atmosfære ved relativ højt tryk og temperatur, sammenlignet med hvad der ellers er
muligt i UHV betingelser. Ændringen ses ved en krystalomformning af MoS2 fra trekanter til
trunkerede trekanter. Dette er forklaret ved det relative forhold mellem den frie energi for
kanterne i MoS2 (𝛾𝑆/𝛾𝑀𝑜), idet der sker en samtidig stabilisering og destabilisering af de mest
Page 6
vi
stabile lav-indeks kanter, som typisk er henholdsvis (1010) Mo kanten og (1010) S
kanten. I tilfældet for de sekskantede Co-promoterede MoS2 nanopartikler ses ingen ændring i
morfologien, hvilket forklares ved den energifavorable Co-promoteret S kant, som
tilsyneladende ikke påvirkes yderligere af de reduktive betingelser. Der er observeret en
reduktion af svovl-dækningsgraden på Mo kanten for begge strukturer, men for den reducerede
MoS2 nanopartikel viser det sig, at den nydannede S kant udviser en 100% S dækningsgrad, og
der er muligvis dannet S-H grupper. Det foreslås desuden, at der dannes S-H grupper på S kanten
for den reducerede Co-promoverede MoS2 nanopartikel, men for denne kant er dækningsgraden
af svovl reduceret til 50%. Reduktion af nanopartiklerne i H2 afdækker en lang række af mulige
aktive sæder, hvilket indikerer at katalysatorerne er i deres aktive tilstand i forhold til HDS
reaktioner.
Det er vist, at disse aktive sæder er reaktive i forhold til nogle af de typiske
heterocykliske svovl komponenter, som er tilstede i ægte råolie, såsom thiophene,
dibenzothiophene og 4,6 dimethyldibenzothiophene (4,6-DMDBT). Disse aktive sæder er dog
også ofte okkuperet af andre molekyler, såsom pyridine og quinolone, der ligeledes findes
naturligt i råolie, hvilket hæmmer HDS reaktionen. Der præsenteres et detaljeret studie af
adsorptionsstedet for disse svovl- og kvælstofholdige molekyler i denne ph.d. afhandling.
Forskningen opsummeret i denne ph.d. afhandling belyser nogle af fundamentale
spørgsmål vedrørende forståelsen af de aktive strukturer, foretrukne adsorptionssteder og årsagen
til deaktivering for både ikke-promoterede og Co-promoterede katalysatorer brugt i HDS
reaktioner. Disse resultater kan potentielt føre til en forbedring af de nuværende katalysatorer
eller til udviklingen af nye katalysatorer med henblik på den molekylære struktur til dyb
afsvovling, hvilket kan resultere i brændstoffer, der er mindre skadelige for miljøet.
Page 7
vii
v. List of publications
[I] Hydrogen-induced crystal reshaping and edge vacancy formation in MoS2 and Co-
Mo-S hydrodesulfurization catalysts. S. S. Grønborg, N. Salazar, A. Bruix, J. Rodriguez-
Fernandez, S. D. Thomsen, B. Hammer, J. V. Lauritsen. In preparation
[II] Atomic-scale insight into the inhibition dynamics of pyridine and quinoline molecules
on reduced MoS2 and CoMoS hydrodesulfurization catalysts. N. Salazar, S. B. Schmidt, J.V.
Lauritsen. In preparation
[III] Atomic-scale investigation of the adsorption of thiophene and dibenzothiophene on
reduced Co-promoted MoS2 catalyst. N. Salazar, S. Rangarajan, M. Mavrikakis, J.V. Lauritsen.
In preparation
[IV] Length-dependent adsorption of thiophene on reduced MoS2 catalyst. N. Salazar, S.
Rangarajan, J. Rodriguez-Fernandez, M. Mavrikakis, J.V. Lauritsen. In preparation
[V] Single-layer MoS2 formation by sulfidation of molybdenum oxides in different oxidation
states on Au(111). N. Salazar, I. Beiniki, J. V. Lauritsen. Physical Chemistry Chemical Physics, 19,
14020-14029, (2017).
Conference contributions
A. Visualizing the adsorption of sulfur and nitrogen-containing molecules on reduced
MoS2 and CoMoS hydrotreating catalysts. N. Salazar, S. Rangarajan, J. Rodriguez-Fernandez,
M. Mavrikakis, J.V. Lauritsen. 25th
North American Meeting (NAM) of the Catalysis Society,
Denver, Colorado, United States of America (2017). Oral presentation.
B. Scanning Probe Microscopy studies of the sulfidation of dispersed MoOx clusters. N.
Salazar, I. Beinik and J.V. Lauritsen. Molecular Aspects of Catalysis by Sulfides (MACS) VII,
Doorn, The Netherlands (2016). Poster presentation.
C. A KPFM study of reactive PVD grown single-layer MoS2 on Au(111). N. Salazar, I.
Beinik and J.V. Lauritsen. 18th
International Conference on Non-Contact Atomic Force
Microscopy, Cassis, France (2015). Poster presentation.
Page 8
viii
v. List of abbreviations
4,6 DMDBT 4,6-Dimethyl Dibenzothiophene
AFM Atomic Force Microscopy
CUS Coordinated Unsaturated Sites
DBT Dibenzothiophene
DDS Direct Desulfurization
DFT Density Functional Theory
EXAFS Extended X-ray Absorption Fine Structure
fcc face-centered cubic
hcp hexagonally close-packed
HDN Hydrodenitrogenation
HDO Hydrodeoxygenation
HDS Hydrodesulfurization
HER Hydrogen Evolution Reaction
HYD Hydrogenation
IRAS Infrared Absorption Spectroscopy
LDOS Local Density of States
MES Mössbauer Emission Spectroscopy
ML
RT
Monolayer
Room temperature
SPM Scanning Probe Microscopy
STM Scanning Tunneling Microscopy
TMS Transition-Metal Sulfides
UHV Ultra High Vacuum
XPS X-ray Photoelectron Specstroscopy
Page 9
ix
Contents
1 Introduction ............................................................................................................................. 1
1.1 Heterogeneous catalysis ........................................................................................................ 2
1.2 Hydrotreating catalysis .......................................................................................................... 3
1.3 Hydrodesulfurization ............................................................................................................. 5
1.4 The surface science approach ................................................................................................ 6
1.5 Research topics and outline ................................................................................................... 7
2 Methods ................................................................................................................................... 9
2.1 Scanning Tunneling Microscopy ......................................................................................... 10
2.1.1 The principle of STM ................................................................................................... 10
2.1.2 STM theory................................................................................................................... 12
2.2 X-ray Photoelectron Spectroscopy ...................................................................................... 13
2.3 Experimental setup .............................................................................................................. 15
2.4 Sample preparation .............................................................................................................. 16
2.4.1 The model support ........................................................................................................ 16
2.4.2 Synthesis of MoS2 nanoparticles .................................................................................. 18
2.4.3 Synthesis of CoMoS nanoparticles............................................................................... 18
2.4.4 Reduction of s-MoS2 and s-CoMoS nanoparticles ....................................................... 18
2.4.5 Dosing of molecules ..................................................................................................... 19
3 A hydrotreating model catalyst.............................................................................................. 21
3.1 Crystal structure of MoS2 .................................................................................................... 22
3.2 Structure of s-MoS2 nanoparticles ....................................................................................... 23
3.3 Morphology of s-MoS2 nanoparticles .................................................................................. 24
3.3.1 Edge structure of s-MoS2 nanoparticles ....................................................................... 25
Page 10
x
3.4 Morphology and edge structure of s-CoMoS nanoparticles ................................................ 26
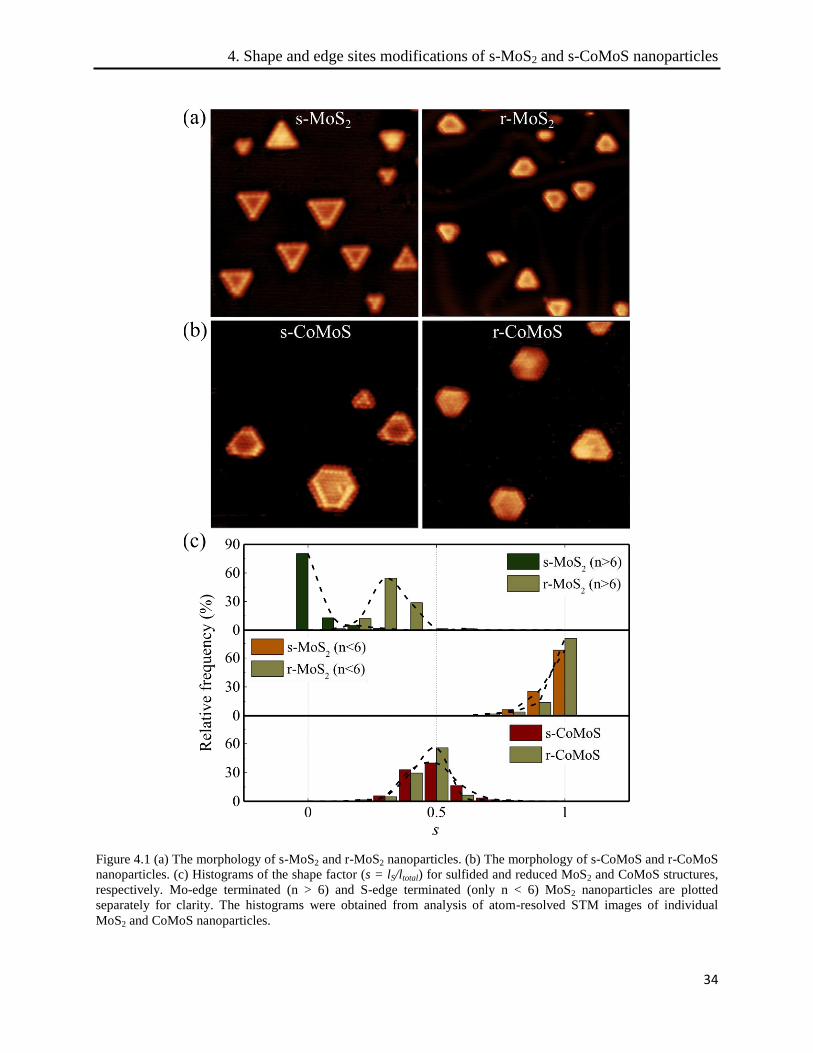
4 Shape and edge structure modifications of s-MoS2 and s-CoMoS nanoparticles ................. 31
4.1 Experimental details ............................................................................................................ 32
4.2 MoS2 and CoMoS nanoparticle reshaping ........................................................................... 33
4.2.1 Edge structure of r-MoS2 nanoparticles ....................................................................... 37
4.2.2 Edge structure of r-CoMoS nanoparticles .................................................................... 39
4.3 DFT calculations on r-MoS2 and r-CoMoS nanoparticles supported on Au(111) .............. 43
4.4 Conclusions ......................................................................................................................... 46
5 Adsorption of nitrogen-containing molecules on r-MoS2 and r-CoMoS nanoparticles ........ 47
5.1 Experimental details ............................................................................................................ 50
5.2 STM results ......................................................................................................................... 51
5.2.1 Adsorption of pyridine on reduced MoS2 nanoparticle ................................................ 51
5.2.2 Adsorption of quinoline on r-MoS2 nanoparticles ....................................................... 57
5.2.3 Adsorption of pyridine on r-CoMoS nanoparticles ...................................................... 59
5.2.4 Length-dependent adsorption of pyridinium ions on S-edges...................................... 64
5.2.5 Adsorption of quinoline on r-CoMoS nanoparticles .................................................... 69
5.3 Conclusions ......................................................................................................................... 71
6 Thiophene adsorption on r-MoS2 nanoparticles ................................................................... 73
6.1 Experimental details ............................................................................................................ 75
6.2 Sulfur vacancy coverage on r-MoS2 nanoparticles ............................................................. 75
6.3 Thiophene adsorption on the r-MoS2 nanoparticles ............................................................ 77
6.3.1 Sulfur vacancy evolution on the Mo-edges of r-MoS2 nanoparticles .......................... 79
6.3.2 Length-dependent adsorption of thiophene on Mo-edges ............................................ 80
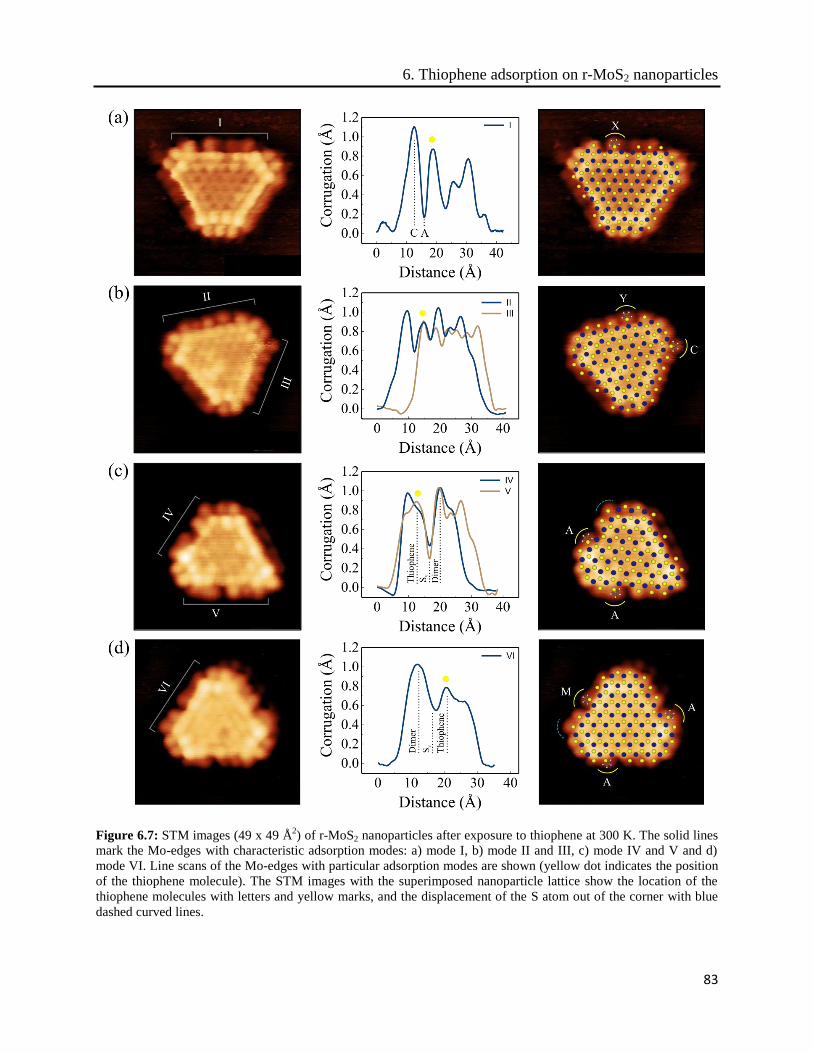
6.3.3 Morphological modifications on the Mo-edge ............................................................. 82
6.3.4 DFT calculations on the adsorption of thiophene on r-MoS2 nanoparticles ................ 86
6.3.5 Thiophene exposures at high substrate temperatures on r-MoS2 nanoparticles ........... 88
6.4 Summary.............................................................................................................................. 89
7 Adsorption of sulfur-containing molecules on r-CoMoS nanoparticles .............................. 91
7.1 Experimental details ............................................................................................................ 94
7.1.1 Adsorption of thiophene on r-CoMoS nanoparticles ................................................... 95
7.1.2 Adsorption of DBT on r- CoMoS nanoparticles ........................................................ 100
Page 11
xi
7.1.3 Dynamics of the DBT molecules on the S-edge ........................................................ 105
7.1.4 Adsorption of 4,6-DMDBT on r-CoMoS nanoparticles ............................................ 108
7.2 Conclusions ....................................................................................................................... 111
8 Single-layer MoS2 formation from MoOx precursors .......................................................... 113
8.1 Experimental...................................................................................................................... 114
8.1.1 Method I. Direct sulfidation ....................................................................................... 115
8.1.2 Method II. Reactive PVD ........................................................................................... 115
8.2 X-ray photoelectron spectroscopy of Mo oxide precursors .............................................. 116
8.3 Surface structure dependency on the annealing temperature ............................................ 118
8.3.1 Direct sulfidation of molybdenum oxide compounds on Au(111) ............................ 122
8.3.2 Reactive Physical Vapor Deposition of MoO3 in H2S ............................................... 124
8.3.3 Post-annealing in H2S ................................................................................................. 126
8.4 Summary............................................................................................................................ 127
9 Summary and outlook .......................................................................................................... 129
Acknowledgement ....................................................................................................................... 133
Appendices .................................................................................................................................. 135
Bibliography ............................................................................................................................... 139
Page 13
Chapter 1
1 Introduction
Today, catalysis really is the workhorse of chemical transformations in the industry with
more than 90% of the products produced in catalytic processes [1,2]. Environmental catalysis is
widely used in many relevant commercial sectors, with vast benefits for the protection of the
environment and for the improvement of society’s quality of life.
A catalyst is in general defined as [3]:
A substance that increases the rate of a reaction without modifying the overall
standard Gibbs energy change in the reaction; the process is called catalysis.
The aim of this introductory chapter is to motivate the work presented in this thesis. First
a general introduction to heterogeneous and hydrotreating catalysis is given. This general
introduction is followed by a surface science approach which has contributed to understand
many catalytic processes.
Page 14
1. Introduction
2
1.1 Heterogeneous catalysis
Catalysis is a process in which chemical reaction rates are sped up by the addition of a
substance (the catalyst) that is not consumed during the course of the reaction. The catalyst
provides an alternative reaction pathway for the chemical reaction by lowering the activation
energy, 𝐸𝑎, of the rate limiting steps, as described by the Arrhenius’ equation
𝑘 = A𝑒−𝐸𝑎/𝑘𝐵𝑇 (1.1)
where k is the reaction rate, 𝑘𝐵 is the Boltzmann constant and T is the absolute temperature. In
the case of heterogeneous catalysis, the phase of the catalyst differs from that of the reactants.
The catalytic process involves adsorption of reactants from a fluid or gas phase onto a solid
surface (the catalyst), diffusion, activation by weakening or breaking of bonds, surface reaction
of adsorbed species to form the product, and finally, desorption of the products into the fluid or
gas phase as illustrated in Fig. 1.1. The activation energy of the catalyzed reaction is overcome in
small steps of lower energy barriers than for the uncatalyzed reaction, thus the reaction rate k is
much larger for the catalytic reaction. A catalyst only increases the speed of a chemical reaction,
since the overall free energy change is the same for the uncatalyzed reaction compared to the
catalyzed reaction. If a reaction is thermodynamically unfavorable (increase in free energy), a
catalyst cannot make the reaction occur.
After the catalytic reaction, the catalyst is unaltered such that it is available for the next
reaction. However, it is crucial that the interaction between the catalytic surface and the reacting
species is not too weak, but also not too strong. According to the Sabatier principle [4], if the
interaction is too strong, the adsorbates will be unable to desorb from the surface. If the
adsorption is too weak, the catalyst will be unable to dissociate a bond. Both extremes result in
low reaction rates.
In heterogeneous catalysis, solids catalyze reactions of molecules in gas or solution.
Since the catalytic performance of the reactions depends on the surface of the catalyst, it is
desirable to maximize its contact area. An easy way to do this is through the use of small
particles, since the surface area is inversely proportional to the size of the particle.
Heterogeneous catalysts often consist of precious metals which, due to their scarcity, have a high
price, and it is thus advantageous to disperse the active phase as small nanoparticles on inert
supports such as silica, carbon or alumina, to keep manufacturing costs as low as possible.
Page 15
1. Introduction
3
Figure 1.1 Energy diagram of a heterogeneous catalyzed reaction versus the uncatalyzed reaction. The uncatalyzed
reaction pathway is direct with a higher activation energy compared to the catalytic reaction.
In the past, due to the lack of adequate analytical tools, a detailed fundamental
understanding of the underlying microscopic mechanisms of heterogeneous catalysis using small
particles was not available. Consequently, the development of catalytic materials and their
improvement were, to a large extent, based on costly and tedious trial-and-error experimentation.
Recently, modern techniques have provided valuable insights at the atomic scale, with significant
progress in the understanding of the active sites, the reaction mechanism, the origin of catalyst
poisoning and some other important relations between the preparation conditions and the
catalytic activity.
1.2 Hydrotreating catalysis
Hydrotreating refers to a variety of catalytic hydrogenation processes in which crude oil
is upgraded to fulfil the market requirements and environmental legislation. The hydrotreating
reactions represents some of the most important catalytic process, and the annual sales of
hydrotreating catalysts represent close to 10% of the total world market for catalysts [5]. In this
process, hydrogen is used to saturate unsaturated hydrocarbons (hydrogenation) and remove
heteroatoms, such as sulfur (hydrodesulfurization, HDS), nitrogen (hydrodenitrogenation, HDN),
Page 16
1. Introduction
4
oxygen (hydrodeoxygenation, HDO), and metals (hydrodemetallization, HDM) from different
petroleum streams in a refinery.
The catalytic removal of these impurities by hydrotreating has two main purposes: i)
completely avoid, after oil combustion, the release of sulfur dioxide (SOx) and nitric oxides
(NOx) into the atmosphere which may result in acid rain, and ii) prevent sulfur poisoning of other
catalysts in oil refineries and in the three-way car exhaust catalyst. The crude oil feedstocks
consist predominantly of hydrocarbons but, depending on their origin, they may present
moderately large concentrations of S, N and O heteroatoms. The contents which are subject to
removal through hydrotreating are shown in Table 1.1. Sulfur is invariably the most abundant
contaminant in petroleum crude.
. Table 1. Typical sulfur, nitrogen and oxygen impurity concentrations in various crudes. Adapted from ref. [5].
Arabian
Light
Arabian
Heavy
Ataka
(Indonesia)
Boscan
(Venezuela)
Sulfur (wt %)
1.8
2.9
0.07
5.2
Nitrogen (wt %)
0.1
0.2
<0.1
0.7
Oxygen (wt %)
<0.1
<0.1
<0.1
<0.1
In the hydrotreating process, the feedstock is mixed with compressed recycle gas and
make-up hydrogen, and it is then sent on to the reactor containing a bed of porous support pellets
(γ-Al2O3) (a schematic representation of the reactor unit is shown in Fig. 1.2). Typical operating
conditions are 300-400 °C and 50-70 bars. The active phase (the catalyst) is commonly obtained
by wetness impregnation of the support material with aqueous solutions of ammonium
heptamolybdate tetrahydrate ((NH4)6 Mo7O24·4H2O), followed by calcination at high temperature
to form molybdenum oxide (MoOx) [6]. Typically, small amounts of Co or Ni are added to the
molybdenum phase to promote its activity. The precursors are then transformed by treating the
catalyst in a mixture of H2S and H2, or in a liquid feed or sulfur-containing compounds and H2.
This reaction results in the formation of the active phase used in most of the hydrotreating
processes of oil crude feedstocks namely MoS2, in the form of nanoparticles highly dispersed
over the support [7,8].
Page 17
1. Introduction
5
Figure 1.2 Illustration of the reactor unit in industrial hydrotreating processes. Inside a large-scale reactor, porous
support pellets are present. The pellets typically consist of alumina on which the active phase is highly dispersed as
hexagonal MoS2 nanoparticles. Adapted from ref. [9].
1.3 Hydrodesulfurization
Hydrodesulfurization is a particular example of a hydrotreating process which has been
commonly used in the refining of crude oil for over 70 years. This process has been subject to
increased attention in recent years due to the stricter legislation imposed in the European Union
and the U.S. in order to reduce sulfur levels in transportation fuels. The legislation in the EU has,
for example, reduced the amount of sulfur in diesel to 350 ppm, 50 ppm and 10 pmm in the years
2000, 2005, and 2008, respectively [10]. Likewise, as shown in Fig. 1.3, several countries around
the world are implementing new regulations for higher quality fuels.
Recent regulations came into force in 2015 and they require shippers to switch from
marine residual fuels to lower-sulfur marine fuels. However, heavy fuel oil used in the shipping
industry contains on average 2700 times more sulfur that road fuels [10]. To comply with these
and future limits, the oil refiners are implementing operational and processing changes to reduce
sulfur levels. However, the conversion of more than 95% of all sulfur containing molecules in
the oil feed is difficult to reach. This is because refractory sulfur-containing molecules, which
react very slowly on the catalyst, are predominant in kerosene. The most important of these
refractory molecules are the benzo- and dibenzothiophenes structures (see Fig. 1.4). These
aromatic molecules can sterically hinder the sulfur atom and inhibit the direct interaction with
the catalyst surface. This effect is reflected in the HDS reactivity, which decreases for heavier
sulfur-containing compounds (see Fig. 1.4). Consequently, a large fraction of these aromatic
molecules are left in the final fuel product.
Page 18
1. Introduction
6
Figure 1.3 Global maximum on-road sulfur in gasoline as of June 2015. Adapted from ref. [11]
1.4 The surface science approach
Over the last decade, the research field of surface science has significantly contributed to
the understanding of heterogeneous catalysis at the atomic level. This approach based on the
study of a model system, i.e. a well-defined surface under ultra high vacuum (UHV) conditions,
allows the investigation of atomistic mechanisms through an arsenal of available surface
analytical tools. The benefits extracted from these models are the huge amount of new insight
into the chemistry and physics of surfaces, especially the contributions to the understanding of
catalytic processes. A remarkable example is the iron-based catalyst used for the synthesis of
NH3 [12], a catalytic process which dramatically impacts humans' ability to grow food.
However, the drawback is the relevant insight often lost when the technical catalyst, i.e.
the catalyst under real working conditions, characterized by high temperature and pressures, is
modeled by a perfect crystal structure. These disparities between catalysis and traditional surface
science are the so-called pressure and material gaps [13]. The pressure gap relates to the many
orders of magnitude difference in pressure for the HDS process (50-70 bars) and the model
system (10-10
mbar). The material gap relates to the gap between the single crystals used as a
model surface compared to the complex real catalyst. However, it is often questioned if UHV
can be extrapolated to realistic conditions. Recently, new implementations in some
Page 19
1. Introduction
7
characterization techniques, have allowed investigating the catalyst under conditions similar to
those used in the industrial processes [14-16].
Figure 1.4 HDS reactivity of various sulfur containing molecules found in crude oil as function of the sterical
hindrance. Adapted from ref. [17].
1.5 Research topics and outline
Detailed fundamental understanding of hydrotreating catalysts and hydrotreating reactions
have been, for many years, the subject of numerous investigations. Supported MoS2 promoted by
Co or Ni have been recognized as the main catalytically active components in industrial
catalysts. Furthermore, fundamental studies have been extensively conducted to elucidate the
active sites in HDS catalysts. However, it is in this field where there is more scientific debate,
since there is very little knowledge about how sulfur and nitrogen-containing molecules adsorb
on and interact with the catalyst.
The aim of this work is to elucidate the nature and location of the catalytic sites on the
active phase of MoS2-based catalysts at the atomic scale and reveal their reactivity with
hydrocarbon molecules present in crude oil feedstocks. In addition, fundamental insights into the
growth mechanism in relation to the formation of MoS2 from MoOx phases will also be provided
in this work. The main experimental techniques used throughout this thesis are the scanning
tunneling microscopy (STM) and X-ray photoelectron spectroscopy (XPS). The STM is indeed a
unique tool to obtain such knowledge, since it is capable of imaging the catalytic nanoparticles
and individual molecules with atomic resolution. The XPS technique is used here to obtain
Page 20
1. Introduction
8
chemical information about the stoichiometry and oxidation state of the precursors prior the
sulfidation to form MoS2. The outline of the thesis is the following:
Chapter 2 The principles behind the STM and XPS are described together with the
experimental setup and default experimental details.
Chapter 3 The main previous results on non-promoted and Co-promoted MoS2 nanoparticles
obtained in the SPM group are briefly summarized, as they form an important
foundation for the work presented in my thesis.
Chapter 4 The morphology and edge structure modifications of non-promoted and Co-
promoted MoS2 nanoparticles induced by molecular hydrogen at relative high
pressures and temperatures are investigated. It is shown that after the reductive
conditions, the nanoparticles appear to be a correct representation of their active
state during working HDS conditions.
Chapter 5 Pyridine and quinoline compounds are used as probe molecules for the active sites
on reduced non-promoted and Co-promoted MoS2 nanoparticles. It is shown that
the location of the active sites directly depends on the presence of S-H groups.
Moreover, the dynamics of the molecules suggest the possibility of two different
adsorption configurations on the same site or edge.
Chapter 6 Thiophene molecules are used to test the reactivity of the reduced MoS2
nanoparticles. It is shown that the adsorption of thiophene depends on the sulfur
vacancy location and edge length. Exposures of thiophene at high temperature
suggest the desulfurization of the molecule. Subsequently, the catalytic cycle of
MoS2 is tested by reducing the nanoparticles in hydrogen again.
Chapter 7 Thiophene, DBT and 4, 6-DMDBT molecules are further investigated on the
reduced Co-promoted MoS2 nanoparticles to gain insight on how the promoter
affects their adsorption.
Chapter 8 The transformation of MoOx precursors into the MoS2 phase through sulfidation
in H2S gas atmosphere in investigated in this chapter. It is shown that the
prerequisite for the efficient formation of MoS2 is that Mo stays in the highest
Mo6+
state before sulfidation, whereas the presence of the reduced MoOx phase
impedes the MoS2 growth. The results in this chapter are presented in the paper [V].
Page 21
Chapter 2
2 Methods
This chapter will present the methods that have been used in this research work. The
principles behind the scanning tunneling microscopy and X-ray photoelectron spectroscopy
techniques are described together with the experimental setup and default experimental details.
Page 22
2. Methods
10
2.1 Scanning Tunneling Microscopy
Scanning tunneling microscopy is the main characterization technique used in this thesis.
The breakthrough of STM in 1982 by Gerd Binning and Heinrich Rohrer [18,19] revolutionized
the possibilities to study and control matter at the nanoscale, which has been one of the most
important scientific challenges during the last decades. This powerful technique can provide
structural and electronic properties by acquiring real-space images of surfaces at atomic
resolution based on the quantum mechanical tunneling of electrons between a tip and a
conductive sample.
Unlike many other imaging techniques, STM has the great advantage of being able to
characterize local defects on surfaces and it is fundamental in catalysis research not only to
reveal the catalytically active sites, but also to control the morphology, chemical composition,
dimensionality and size of the industrial catalysts. Furthermore, the reactivity of the catalysts to
numerous reactive species can also be visualized in situ using this technique, thus opening a wide
range of possibilities of study in the area of surface science. Unfortunately, STM images often
reflect a complicated convolution of geometric and electronic features of the surface, which
complicates the direct interpretation of the images. It is therefore necessary in many cases to
resort to the computation of atomistic models based mainly on calculations and theoretical
simulations through Density Functional Theory (DFT) and Tesorff-Hamann formalisms for a
better interpretation of the STM images.
Although the principle of the method is simple, an interpretation of measured data is not
trivial. The tunneling current depends not only on the distance but also on the local density of
states (LDOS) of the tip and the sample, thus an STM image is a convolution of electronic states
and geometric surface structure. These electronic states can be accessed since the tunneling
depends on the bias polarity. As the tunneling current is proportional to the surface local density
states at the Fermi level energy and at a given tip position, the current can be generated by
unoccupied and occupied states by applying a negative and positive bias respectively [20].
2.1.1 The principle of STM
The basic working principle of STM is illustrated in Fig. 2.1. An atomically-sharp
conductive tip, made of tungsten in our set-up, is brought near a surface (within a few
angstroms). At such as short distances, the wave functions of the tip and the surface overlap
sufficiently to allow the electrons to tunnel across the vacuum gap that separates the tip from the
surface only if a small bias is applied. The direction of the resulting measurable current on the
Page 23
2. Methods
11
Figure 2.1 Illustration of the basic operating principle behind STM. The tip is raster-scanned over the surface with
the scanner tube. A feedback loop keeps the tunneling current between the tip and the surface constant during the
scanning, and an STM image is recorded as the height changes of the tip. The circular zoom-in schematically
illustrates the tunneling electrons. Adapted from ref. [9]
order of 1 nA will flow from the tip to the surface or vice-versa depending on the bias. When the
tip is negatively biased with respect to the sample, electrons can only tunnel from occupied states
of the tip into unoccupied states of the surface. On the other hand, at negative sample bias the
situation is reversed, the electrons tunnel from occupied states of the surface into unoccupied
states of the tip.
STM imaging is accomplished by attaching the conductive tip to piezoelectric
transducers (x, y and z-coordinates) located in the scanner tube, all of which are capable of
precisely moving the tip over the surface on the Angstrom-scale. The most widely used operation
mode is the so-called constant current mode, in which a feedback circuit regulates the tip-sample
spacing in such a way that the tunneling current is kept constant at each point during the surface
scan. Therefore, the tip is raster-scanned in the x and y directions, while the computer control
system collates the signals with the z piezo voltage used to regulate the tip height at every point,
one can topographically image a surface. Alternatively, an atomically-resolved STM image can
also be obtained in the constant height mode, where the tip moves above the surface at a constant
height without feedback control and it is the direct variations of the tunneling current recorded
that are converted into the real space image. In this mode the tip can be moved faster on the
surface than in the constant current mode, as there is no need for the feedback loop to move the
Page 24
2. Methods
12
scanner in the z direction due to the surface features under the tip. However, this mode can
provide useful information only for very flat surfaces.
The origin of the high resolution of STM is explained in a simple way by the exponential
dependence of the tunneling current on the tip-sample separation. If the distance between the tip
and the sample changes by just 1 Å, the tunneling current varies by an order of magnitude. This
exponential dependence gives STM its great sensitivity in the z-direction normal to the surface
with sub-angstrom precision vertically. The exponential z-distance dependence is also
responsible for the lateral atomic resolution since the entire tunneling current is localized at the
very point of the tip.
2.1.2 STM theory
In classical physics, an electron cannot overcome a rectangular potential barrier with a
height greater than the energy of the incident particle. Using the better approach of quantum
mechanics, the electrons can cross the small gap that separates the tip and the sample. In this
case, the electrons are tunneling across the gap exhibiting an exponential decay of the electron
wave function in the barrier and a vastly decreased probability on the other side of the barrier.
The calculation of the tunneling current that flows across the vacuum gap that separates
the tip from the sample is not an easy task and requires the development of more specific
theories for a better interpretation of STM images. Tersoff and Hamann [21] have formulated a
model for the theoretical calculation of the tunneling current based on Bardeen’s approach [22].
They used the effective tunneling matrix element 𝑀𝑠𝑡, where the two subsystems of sample and
tip are treated as separate entities described by their wavefunctions of 𝜓s and 𝜓t, respectively
and integrated over any surface lying within the barrier gap separating both components.
𝑀𝑠𝑡 =ħ2
2𝑚∫ (𝜓𝑡
∗ ∂𝜓𝑠
∂z− 𝜓𝑠
∂𝜓𝑡∗
∂z) 𝑑𝑆 (2.1)
Tersoff and Hamman used the tunneling matrix to describe the quantum
mechanical tunneling via the first-order time-dependent perturbation theory and found the
tunneling current to be given by:
I𝑡 =2𝜋𝑒
ħ𝑒𝑉 ∑ 𝑓(𝐸𝑡)[1 − 𝑓(𝐸𝑠 + 𝑒𝑉)]𝑠,𝑡 |𝑀𝑠𝑡|2𝛿(𝐸𝑡 − 𝐸𝑠) (2.2)
where 𝑒 is the electron charge, 𝑓(𝐸) is the Fermi function, V is the tunneling voltage, 𝛿(𝐸) is the
delta function, and 𝐸𝑡 and 𝐸𝑠 are the corresponding energies of the unperturbed states.
Page 25
2. Methods
13
Since the actual atomic structure of the tip is generally unknown, Tersoff and Hamman
assumed the tip state to be a spherically-symmetric s-wave and found that, in the limit of a small
sample-tip bias, the tunneling current is given by following expression:
I ∝ ∑ |𝜓𝑠(𝑟0 )|2𝛿(𝐸𝑠 − 𝐸𝐹)𝑠,𝑡 (2.3)
where 𝜓𝑠(𝑟0 ) is the local density of states (LDOS) at the Fermi energy level in the sample at the
center of the spherical tip. This means that STM images acquired at constant I and V i.e. constant
current mode, represent the contours of constant Fermi-level density states in the sample surface.
While in metals the LDOS generally coincide with the topography of the surface due to the large
electron delocalization, the density of energy levels in semiconductors varies noticeably with
sample bias. Basically, the tunneling of electrons is accomplished only by electronic transitions
from a range of energy levels of the surface and the tip and the tunneling current does not follow
any simple relation with respect to a local density of states at a certain energy level. Therefore
the interpretation of such materials must be done carefully since they present a convolution of
topography and electronic structures of the surface.
The strength of the Tersoff-Hamman theory resides in that it also explains the
exponential decrease of the surface wave functions into the vacuum gap, which implies an
exponential decay of the tunneling current by increasing the tip-sample distance
I ∝ 𝑉 ⋅ exp (−√8𝑚𝑒Φ
ћ𝑧) (2.4)
where 𝑚𝑒 is the mass of an electron, Φ is the average work function of the tip and the sample
and 𝑧 the tip-surface separation. This exponential dependence of the tunneling current on tip-
sample separation ensures the STM can obtain atomic resolution.
In this thesis, the STM technique is widely used to characterize locally the growth,
synthesis and reactivity of MoS2-based nanoparticles under different conditions and molecular
vapors. STM images were acquired with typical bias and current values of V= -800 ± 200mV
and It= -0.600 ± 0.200nA, respectively.
2.2 X-ray Photoelectron Spectroscopy
X-ray photoelectron spectroscopy is one of the major surface science techniques used in
catalysis. It provides information not only about the type and amount of elements present on the
sample, but also about their oxidation state and chemical surroundings. The use of
Page 26
2. Methods
14
complementary techniques is highly desirable in the area of surface science for a proper and
complete understanding of a particular problem.
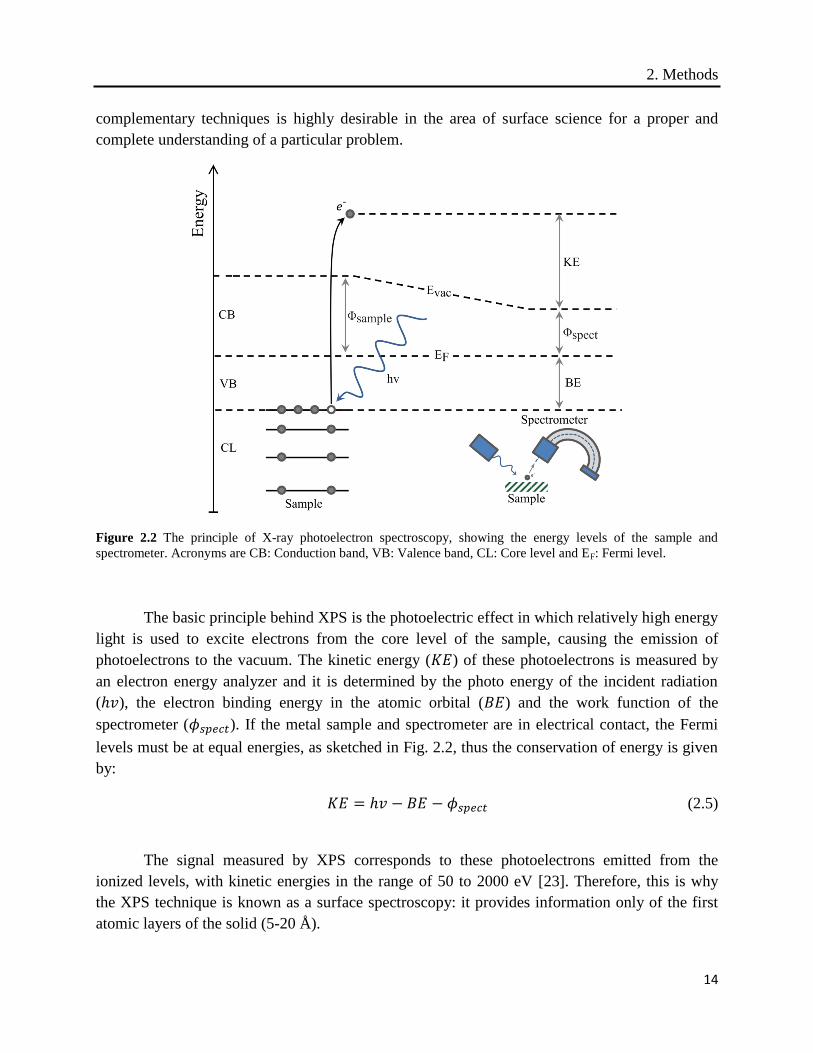
Figure 2.2 The principle of X-ray photoelectron spectroscopy, showing the energy levels of the sample and
spectrometer. Acronyms are CB: Conduction band, VB: Valence band, CL: Core level and EF: Fermi level.
The basic principle behind XPS is the photoelectric effect in which relatively high energy
light is used to excite electrons from the core level of the sample, causing the emission of
photoelectrons to the vacuum. The kinetic energy (𝐾𝐸) of these photoelectrons is measured by
an electron energy analyzer and it is determined by the photo energy of the incident radiation
(ℎ𝑣), the electron binding energy in the atomic orbital (𝐵𝐸) and the work function of the
spectrometer (𝜙𝑠𝑝𝑒𝑐𝑡). If the metal sample and spectrometer are in electrical contact, the Fermi
levels must be at equal energies, as sketched in Fig. 2.2, thus the conservation of energy is given
by:
𝐾𝐸 = ℎ𝑣 − 𝐵𝐸 − 𝜙𝑠𝑝𝑒𝑐𝑡 (2.5)
The signal measured by XPS corresponds to these photoelectrons emitted from the
ionized levels, with kinetic energies in the range of 50 to 2000 eV [23]. Therefore, this is why
the XPS technique is known as a surface spectroscopy: it provides information only of the first
atomic layers of the solid (5-20 Å).
Page 27
2. Methods
15
In XPS, the most commonly used anode materials in X-ray sources are Mg and Al, whose
principal photon energies are 1253.6 and 1486.6 eV, respectively. However, the X-ray emission
spectrum of these materials does not consist of a characteristic peak, but a more complex series
of lines including satellite X-ray peaks and a continuous background called Bremsstrahlung.
Each of the wavelengths of this emission gives rise to photoelectrons that emerge with a kinetic
energy defined by equation 2.5. This assumes that the photoemission process is elastic and for
each characteristic radiation a series of peaks that reflect the discrete binding energies of the
electrons present in the solid will be generated. However, part of this photoemission processes is
inelastic, since the photoelectrons undergo energy loss processes from their generation in the
atom until their detection in the spectrometer. The photoemission generated by the
Bremsstrahlung radiation gives rise to the general background that dominates the XP spectra.
These lines and background radiation can be removed by the use of a monochromator, which
reduces the X-ray line width and improves the resolution of the final spectra.
One of the initial observations in the XPS spectra was that an atom of the same element
can show peaks from the core levels with different binding energies in non-equivalent situations
in a solid. This difference in binding energies is called chemical shift and can be determined by
distinct situations: differences in the oxidation state of the atom, differences in the chemical
environment or by the position of the atom in the unit cell. In situations where the oxidation state
is the same, the chemical shift occurs when neighboring atoms increase or decrease the
electrostatic shielding around the nucleus of the studied atom. These variations in shielding result
in a greater or lower attraction of the nucleus and the core electrons, which produces a change in
the binding energy of the photoelectrons emitted from that atom. For example, if a titanium atom
is bound to a more electronegative atom such as oxygen, it would have some of its electrons
attracted to the oxygen, resulting in a less negative charge to interact with the nucleus and hence
increasing the binding energy due to the greater attraction between the nucleus and the remaining
electrons. This ability to distinguish between different oxidation states and chemical
environments is one of the major strengths of the XPS technique.
In this thesis, XPS is used to monitor the chemical evolution of the MoO3 after successive
annealing cycles and it is sulfidation using two different methods that will be discussed in
Chapter 8. This technique has also been used to check the cleanliness of the surfaces after the
sputtering and annealing cycles.
2.3 Experimental setup
The research presented in this thesis was performed at Aarhus University in the Orange
Lab and the Omicron Lab. The experiments were conducted in standard UHV chambers with a
base pressure of ~ 1.0 ⋅ 10-10
mbar. The STM images were acquired by using Aarhus-type STM
Page 28
2. Methods
16
[24]. XPS measurements were performed using Al Kα radiation from a source operated at 250 W
(SPECS XR 50 source). A hemispherical electron analyzer (SPECS Phoibos 100) was used to
record the XP spectra with the surface normal pointing in the direction of the analyzer.
Figure 2.3 STM images of the Au(111) surface (1600 x1600 Å2) obtained: (a) after Ar
+ sputtering (2 keV) at room
temperature for 30 minutes and (b) after heating to 850 K for 10 minutes. The insert (50 x 50 Å2) shows the
23 × √3 cell (indicated with a rectangle), in which the position of the topmost Au atoms are gradually shifted from
fcc to hcp sites.
2.4 Sample preparation
2.4.1 The model support
We have chosen to work on an Au(111) surface as a model support for the MoS2 and
CoMoS catalysts due to the advantages in terms of dispersion of the active catalyst material and
its rather chemically-inert surface [25] that makes it a good candidate for the studies shown in
this thesis. Technically, this surface also has the advantage that it is relatively easy to obtain a
clean flat and atomic surface.
The Au(111) surface is cleaned by repeated cycles of sputtering with 2 keV Ar+ for 30
minutes, followed by annealing to 850 K for 10 minutes, until no contamination is visible and
typical herringbone reconstruction is observed on the surface in the STM images (see Fig. 2.3b).
Page 29
2. Methods
17
Figure 2.4 STM image (1700x1700 Å2) of Mo metal deposited on the Au(111) surface at room temperature.
Showing the nucleation of the Mo metal on the elbows of the herringbone reconstruction.
After the argon ion bombardment at room temperature, the STM images reveal a rough pit-and-
mound structure, exhibiting low-coordinated atoms at step-edges and kinks (see Fig. 2.3a).
The clean Au(111) crystal exhibits an atomically flat surface with faint corrugations
showing the unique 23 × √3 unit cell or “herringbone” reconstruction in which the gold atoms
of the topmost layer of the crystal are compressed (4.4%) along the <100> direction. Due to this
compression, 23 surface atoms occupy 22 substrate positions and give rise to a periodic array of
fcc-stacked and hcp-stacked regions separated by couples of ridges (brighter dislocations lines)
which run parallel along the [112]. Long-range elastic interactions introduce domain boundaries
in the surface approximately every 140 Å, where the dislocation lines bend by alternating ±120º
forming a typical zig-zag pattern often referred to as the “herringbone” reconstruction [26]. In
this thesis the herringbone reconstruction is used as a template to disperse the deposited Mo, Co
and MoO3 into nanocluster.
Page 30
2. Methods
18
2.4.2 Synthesis of MoS2 nanoparticles
For the synthesis of MoS2 nanoparticles, molybdenum (GoodFellow, 99.9%) was
deposited from an e-beam evaporator (EGCO4, Oxford Applied Instruments) on Au(111) surface
in a sulfiding H2S atmosphere corresponding to a background pressure of 1.0×10⁻⁶
mbar, while
the sample temperature was 400 K. Molybdenum was evaporated for ~10 minutes to reach the a
coverage of 10% of a monolayer (ML). The H2S (Praxair, 99.8%) gas was admitted from a high
pressure reservoir to the vacuum through a controllable leak consisting of a long hollow (∅ = 75
µm inner diameter, length 2 cm) glass fiber connected to a transferrable stainless steel tube
located inside the UHV chamber. In order to obtain full crystallinity of the MoS2 nanoparticles,
the sample is post-annealed to 673 K for 10 minutes, during which the gas doser is approached
directly onto the sample creating higher pressure surrounding the sample at approximately 10-4
mbar without a large increase in background pressures [27]. The MoS2 nanoparticles obtained
from this method will be called s-MoS2.
2.4.3 Synthesis of CoMoS nanoparticles
The cobalt-promoted MoS2 nanoparticles are formed when Mo was simultaneously
deposited together with Co in the sulfiding atmosphere of 10-6
mbar of H2S described previously.
Initially, molybdenum is evaporated onto the Au(111) surface at 400 K using a deposition rate of
approximately 0.01 ML/min for 8 minutes and at the remaining last 2 minutes Co (GoodFellow,
99.9%) is then co-deposited while maintaining the H2S pressure. This procedure provides an
intermixed capping of the initial sulfided Mo clusters with a Co:Mo ratio of 1:3, similar to
promoted industrial catalysts [28,29]. Finally, the bimetallic sulfide phase is crystallized by post-
annealing at 673 K for 10 minutes. The CoMoS nanoparticles obtained from this co-deposition
method will be called s-CoMoS.
2.4.4 Reduction of s-MoS2 and s-CoMoS nanoparticles
The reduction of s-MoS2 and s-CoMoS nanoparticles is achieved by back-filling the
UHV chamber with H2 to a chamber pressure in excess of 10-4
mbar and then annealing the
sample to 673 K in H2 atmosphere. The ionization gauge for pressure measurement is switched
off during the hydrogen exposure and the pressure measurement is done with a cold cathode
gauge mounted in the main chamber. The H2S pressure from residual gas is estimated to be 10-8
mbar during reducing conditions. The anneal time for the standard experiment is 30 minutes. The
Page 31
2. Methods
19
sample is cooled to 450 K before H2 is pumped away. The nanoparticles which result after the
reduction of the s-MoS2 and s-CoMoS will be called r-MoS2 and r-CoMoS, respectively.
2.4.5 Dosing of molecules
In several experiments in this thesis, the adsorption of heterocyclic aromatic molecules is
investigated. The two molecules thiophene and pyridine are both volatile compounds at room
temperature, thus, these molecules can easily be dosed to the sample in the vacuum chamber
using a standard leak valve connected to a long stainless steel tube. The quinoline molecule is
also a volatile compound but its vapor pressure at the room temperature is very low, for that
reason this molecule was heated up to 40 K to increase the pressure in the gas line. These
compounds were stored in a glass container connected to the leak valve through a gas line which
was pumped by a turbo pump. Prior the molecular exposures, these liquid molecules are purified
by several freeze-pump-thaw cycles using liquid nitrogen to remove impurities such as H2O and
solvents. The DBT and 4, 6-DMDBT are solid compounds with lower vapor pressures at room
temperature, therefore their dosage was done by heating the glass container and leak valve, using
heating tapes, to the melting point of the respective molecule.
Page 33
Chapter 3
3 A hydrotreating model catalyst
In this chapter, the main previous results on non-promoted and Co-promoted MoS2
nanoparticles obtained in the SPM group are briefly summarized, as they form an important
foundation for the work presented in this thesis.
Page 34
3. A hydrotreating model catalyst
22
3.1 Crystal structure of MoS2
The bulk forms of MoS2 (1T, 2H and 3R) consist of covalently bound MoS2 sheets
weakly interacting with each other through van der Waals forces. Each trilayer slab consists of
two hexagonal (0001) planes of S atoms and an intermediate hexagonal layer of Mo atoms [30].
The Mo atoms are six-fold coordinated to S atoms. The most abundant common allotrope of
MoS2 adopts the 2H-stacking i.e. hexagonal closed packing and trigonal prismatic coordination.
In this stacking structure, the S atoms in one layer are positioned over the Mo atoms in the
underlying layer, as shown in Fig. 3.1a. The interatomic distance between the S or Mo atoms in
the MoS2 (0001) plane is 3.15 Å as seen in Fig. 3.1b.
Figure 3.1 (a) Crystal structure of bulk MoS2 showing the 2H-stacking of the S-Mo-S trilayers. The distance
between the Mo layers is 6.15 Å. (b) Top view showing the MoS2 (0001) basal plane. The interatomic distance
between the S atoms is 3.15 Å.
Page 35
3. A hydrotreating model catalyst
23
3.2 Structure of s-MoS2 nanoparticles
The synthesis of s-MoS2 nanoparticles was performed by following the experimental
procedure described in Section 2.4.2 in Chapter 2. As mentioned previously, the gold substrate
was chosen, among other things, because of the high dispersion of the molybdenum sulfide
phase, which nucleates on the elbows of the herringbone reconstruction where the growth takes
place. The dispersion of nanoparticles on the substrate is shown in Fig. 3.2a. The full
crystallinity of the MoS2 nanoparticles is obtained by post-annealing the precursor material
deposited on the gold surface in H2S. This results in the formation of distinct triangular MoS2
nanoparticles lying on the Au(111) surface with the (0001) basal plane parallel to the support
surface. The triangular shape is thermodynamically preferred due to the high H2S partial pressure
in the surroundings of the substrate surface. Different nanoparticle sizes can be obtained through
this procedure and, interestingly, it has been shown that the size variation could be related to the
edge termination of the nanoparticles [31]. For edge lengths longer than ~ 19 Å, the structure of
the nanoparticles is similar to the one shown in Fig. 3.2b, and for smaller lengths nanoparticles
assembly as the one depicted in Fig. 3.2c.
Figure 3.2 (a) Large-scale STM image of s-MoS2 nanoparticles nucleated on Au(111) (386x386Å2). Close-up STM
images of: (b) s-MoS2 nanoparticles with a size >2 nm showing the edge structure and the characteristic brim at the
edge (46x46Å2) and (c) S-terminated s-MoS2 with a size <2 nm (30x30Å
2). Ball model representations of both s-
MoS2 nanoparticles are shown on the right.
Page 36
3. A hydrotreating model catalyst
24
The atom-resolved STM image in Fig. 3.2b illustrates that the nanoparticle contains a
plane of hexagonally-arranged protrusions with an interatomic distance of ~ 3.10 Å, which is the
same lattice distance found for the MoS2(0001) plane shown in Fig. 3.1b. Recently, simulated
STM images based on DFT calculations have shown that the protrusions in low bias STM
images of the MoS2(0001) basal plane can be attributed directly to the topmost layer of S atoms
[32,33]. The average height of the triangular nanoparticles is 1.5 ± 0.5 Å, almost half of the
height of a S-Mo-S layer, which is 3.08 Å. The underestimation of the height imaged by STM is
strongly dependent of the electronic effects resulting from the semiconducting character of the
MoS2 nanoparticles. It has been found that the nanoparticle height exhibits a characteristic
increase in the values as a function of the tunneling voltage approaching asymptotically the
geometrical value of a single MoS2 layer at high bias voltage [34]. It is therefore concluded that
the MoS2 nanoparticles consist of a single S-Mo-S layer, representing only one of the building
blocks in the unit cell of 2H-MoS2.
3.3 Morphology of s-MoS2 nanoparticles
The equilibrium shape that the nanoparticles adopt under the experimental sulfiding
conditions has been shown to be triangular. The equilibrium shape of an MoS2 nanoparticle is
governed by the edge free energies of two different low-index edge terminations of the
MoS2(0001) basal plane, the (1010) Mo-edge and the (1010) S-edge. The shape that minimizes
the crystal’s integrated surface free energy, (∑ 𝛾𝑖.𝑖 𝑙𝑖), can be quantified using the Wulff
construction rule (see Fig. 3.3), which is given by the interior envelope of a surface constructed
by drawing tangent planes to radius vectors extending from the same origin [35]. The plotted
radius vectors, 𝛾𝑀𝑜 and 𝛾𝑆, with the common origin, have a length corresponding to the edge free
energies of the (1010) Mo-edge and the (1010) S-edge, respectively. If the free energy of one
edge exceeds the other one by a factor of two or more (𝛾𝑆 > 2𝛾𝑀𝑜), triangle nanoparticles will
be formed as those observed in the experiments. In the case where the energies are equal
(𝛾𝑆 = 𝛾𝑀𝑜), the vectors will construct a perfect hexagonal nanoparticle.
It should be noted that the Wulff construction is established for the thermodynamic
equilibrium conditions. From our experiments, more than 90% of the nanoparticles have a
triangular morphology; the rest, present in the form of truncated triangular, elongated hexagonal,
etc. represent the kinetic limitations of the procedure, which do not significantly affect the results
described in this thesis.
Page 37
3. A hydrotreating model catalyst
25
Figure 3.3 Wulff construction of a MoS2 nanoparticle showig the exposed (1010) Mo-edge and (1010) S-edge
termination. For γS = γMo the nanoparticle will adopt a perfect hexagonal shape. For γS > 2⋅γMo the nanoparticle will
adopt a triangular shape with Mo-terminated edges. The gray and red rectangles for the (1010) Mo-edge represent
the edge structure for the s-MoS2 and r-MoS2 nanoparticles, respectively. The gray rectangle for the (1010) S-edge
represents the edge structure for both s-MoS2 and r-MoS2 nanoparticles.
3.3.1 Edge structure of s-MoS2 nanoparticles
The edge structure of the triangular nanoparticles is deduced from important comparison
criteria between atomically resolved STM images (see Fig. 3.2b) and STM simulations based on
DFT calculations [28,32]. The following have been concluded from the comparison: (a) the
outermost row of protrusions are observed to be out of registry with the basal plane S atoms, as
indicated by the white circles in Fig. 3.2b, (b) the edges have double periodicity, with an
alternating intensity and (c) there is a pronounced brim located adjacent to the outermost row of
protrusions. These characteristics could not be explained entirely by geometric aspects based on
a simple structural model of the nanoparticle. This reflects the complexity of the interpretation of
STM images, which involves geometric features and electronic effects, more so in this case due
to the particular semiconductivity nature of MoS2 single layer.
The DFT simulations that explain these specific observations made in the STM images
are shown in Fig. 3.4. Both the shift of edge protrusions out of registry and the pronounced
bright brim can only be reproduced in DFT simulated edge termination of the (1010) Mo-edge
fully saturated by sulfur dimers (see Fig. 3.4b) [36,37]. The spatial arrangement of the sulfur
dimers of the (1010) Mo-edge is highlighted by arrows for the 100% S in Fig. 3.3. Furthermore,
DFT calculations show that the (1010) Mo-edge is metallic, as opposed to the interior of the
Page 38
3. A hydrotreating model catalyst
26
MoS2 which is semiconducting. STM imaging of the basal plane of the MoS2 nanoparticle is,
however, possible at all biases due to the effect of the Au(111) substrate that renders the interior
of the MoS2 weakly metallic through charge donation (see Fig. 3.4c). The distinctive bright
features of the (1010) Mo-edge derive from two localized metallic states with bands penetrating
into the band gap region of MoS2 and crossing the Fermi level, as observed in Fig. 3.4d [33,36].
One of the edge states (I) is seen to be almost completely localized at the S dimers. It is a
superposition of 𝑝𝑥 orbitals extending in two parallel chains along the edge, as seen from the plot
of the wave function contours in Fig. 3.4e. The overlapping 𝑝𝑥 orbitals yields a maximum in
local density of states in the interstitial region between the S dimer pairs, which gives the high
intensity between the S atoms in the simulated STM image in Fig. 3.4b-c. The second state (II) is
related to the fully sulfided (1010) Mo-edge and its nature state is somewhat more complicated
than for (I). This state is extending into the first rows of the MoS2 interior and is primarily
responsible for the STM imaging of the bright brim on the nanoparticles. The edge state (III)
localized at the (1010) S-edge will be described in Chapter 4. The smaller MoS2 nanoparticles
observed (see Fig. 3.2c) are imaged by the STM in a quite different way, showing all protrusions
clearly in registry with the basal plane S atoms (indicated by the white circles) as opposed to the
(1010) Mo-edge terminated nanoparticles described above. The triangle shows that protrusions
at the edge are imaged with a lower relative intensity and display a pronounced buckling
structure. It was concluded that the small nanoparticles match with the (1010) S-edge 100% S
termination (see dashed gray rectangle for that edge in Fig. 3.3) [31].
The catalytic properties of the MoS2-based catalysts have been associated to be not only
by under-coordinated sites or S-H groups, but also by the brim structure as shown in many
atomic-scale studies and DFT calculations on the adsorption of sulfur and nitrogen-containing
molecules [38-44], which will be discussed in detail in the next chapters.
3.4 Morphology and edge structure of s-CoMoS nanoparticles
The Co-promoted MoS2 nanoparticles synthesis was performed by following the
experimental procedure described in Section 2.4.3 in Chapter 2. The STM image in Fig. 3.5
shows that the co-deposition of Co towards the end of the synthesis procedure has a pronounced
effect on the nanoparticle shape. The resulting nanoparticles have a hexagonal truncated shape,
as opposed to the s-MoS2 nanoparticles that exhibit a triangular geometry. Two different edge
terminations are observed at the s-CoMoS catalyst, as shown in Fig. 3.5. At one of the edges the
protrusions are out of registry, as observed for the (1010) Mo-edge termination of s-MoS2
nanoparticles. At the other edge, the protrusions are imaged in registry with the protrusion on the
basal plane, showing a bright brim. This may be the (1010) S-edge according to the symmetry
of the MoS2(0001) plane. It has been concluded that the affinity for Co leads to the hexagonally
Page 39
3. A hydrotreating model catalyst
27
truncated shape to be located only at the (1010) S-edge, which is consistent with the DFT
studies that show that Co incorporation stabilizes the S-edge relative to the Mo-edge [45,46].
Figure 3.4 (a) The unit cell used for the DFT calculations of single-layer MoS2. (b) and (c) Simulated STM images
of (1010) Mo-edge with sulfur dimers without and with the underlying Au(111) substrate, respectively. (d)
Calculated band structure for MoS2. The red lines are the band structure for a finite slab exposing both the (1010)
S-edge and the (1010) Mo-edge while the dashed green lines are the band structure for an infinite MoS2 layer. The
infinite layer clearly shows a band gap, whereas the edge terminated system displays three bands crossing the Fermi
level. (e) The contours of the electronic wave functions associated with the edge states localized entirely on the
(1010) Mo-edge (I and II). The edge state (III) (shown in Chapter 4) is associated with the (1010) S-edge (100%
S). The figure is adapted from ref. [33].
Additionally, theoretical work investigated the energetic stability of the (1010) S-edge
for several S coverages [29]. It was concluded that the most stable edge structure is the one
corresponding to the 50% S coverage. However, both STM simulations on Au(111) of the fully
Co-substituted (1010) S-edge with 100% and 50% S reproduce similarly the edges observed in
the experimental STM images of s-CoMoS (see Fig. 3.6a). For both coverages, the protrusions at
the edge reflect the position of the bridging S atoms and the presence of a bright brim adjacent to
the edge atoms towards the basal plane. As we will see in Chapter 4, experimental sulfiding
conditions could be affecting the coverage of the Co-promoted (1010) S-edge with respect to
the edge structure of the nanoparticles present under HDS conditions.
Page 40
3. A hydrotreating model catalyst
28
Figure 3.5 (a) STM image of a s-CoMoS nanoparticle (46x46Å2). The white circles highlight the relative positions
on the edges compared to the S atoms on the basal plane. (b) Ball-model of the CoMoS nanoparticle which exposes
the Mo-edge and S-edge. (c) Edge structure of S-edge for s-CoMoS in (gray rectangle) and r-CoMoS (red rectangle)
nanoparticles. The figure is adapted from ref. [39]
The appearance of the brim regions reflects the electronic structure at the edges of the s-
CoMoS nanoparticle (see Fig. 3.6b). Here, the fully sulfided (1010) Mo-edge shows the same
two localized metallic states (I) and (II) crossing the Fermi level observed in Fig. 3.4d. The edge
state IIICo is, however, located directly at the Co-promoted (1010) S-edge, as seen in the plot of
the wave function contours in Fig. 3.6b. This edge state is localized on the outermost four rows
of atoms counted from the edge and is responsible for the intense bright brim on the (1010) S-
edge. This model does not reproduce the appearance of the S monomers proposed in the STM
images and it was justified in terms of the limitations of the Tersoff-Hamann model used for the
simulation and partly by an effect of the gold substrate [9]. As we will see in the Chapter 4, this
could be related to a misinterpretation of STM images and the influence of the gold substrate on
the S coverage of the Co-promoted (1010) S-edge. In addition, theoretical studies have
concluded that the S coverage for the S-edge is 50% (see red dashed rectangle in Fig. 3.5),
whereas on the Mo-edge the coverage is reduced towards 50% S (see red dashed rectangle in
Fig. 3.3) under HDS conditions [29,36,45,47].
Page 41
3. A hydrotreating model catalyst
29
Figure 3.6 (a) STM simulations of (1010) S-edge edges with 100% and 50% S. (b) The band structure of a MoS2
slab exposing a (1010) Mo-edge (100% S) and a (1010) CoMoS S-edge (50% S). The electronic bands I and II are
associated with metallic edge states on the (1010) Mo-edge, whereas the metallic edge state IIICo is located on the
(1010) S-edge edge. (c) Plot of the wave function contours associated with the three metallic edge states in the s-
CoMoS nanoparticles. The figure is adapted from ref. [29].
Page 43
Chapter 4
4 Shape and edge structure modifications of
s-MoS2 and s-CoMoS nanoparticles
This chapter will present the morphology and edge structure modifications of non-
promoted and Co-promoted MoS2 nanoparticles induced by molecular hydrogen at relative high
pressures and temperatures are investigated. The work presented in this chapter is in preparation
for publication as paper I.
Page 44
4. Shape and edge sites modifications of s-MoS2 and s-CoMoS nanoparticles
32
MoS2-like nanoparticles compose the active phase of several important heterogeneous
catalytic processes, especially those dedicated to the removal of sulfur in HDS process of crude
oil. Due to the inertness of the MoS2 basal plane [5,48,49], it is well-documented that the
catalytic activity of these nanoparticles originates from sites at the edges [50]. Therefore the
optimization of the edge accessibility is crucial in the preparation of the catalyst. These edges
can be also modified by the incorporation of promoters like Co or Ni and their effect on the
catalytic activity has been attributed to the formation of a new type of edge sites at the low
indexed termination of the hexagonally-shaped CoMoS nanoparticles as it was described in
Chapter 3.
Detailed atomistic insights of the morphology and edge structure of s-MoS2 and s-
CoMoS catalysts have been revealed by extensive atom-resolved STM studies [51,52] and, more
recently, by single-atom transmission electron microscopy (TEM) characterization of supported
catalyst particles prepared by industrial procedures [53,54]. These observations have been well
supported by theoretical calculations using DFT, which predicts the shape and edge structure
depending on the preparation conditions for the catalysts [55-61]. It is expected that the
nanoparticle morphology may depend on the H2/H2S gas pressure and composition [62-64].
However, there is still an open question regarding exactly how the active nanoparticles actually
respond to the reactive atmosphere at an elevated hydrogen pressure and temperature. This
information on such processes is remarkably important for the understanding of the pathway
reactions of HDS since the elementary steps of desulfurization are strongly influenced by the
state of the edge and the presence of coordinated unsaturated sites (CUS) [41,56,65].
Studies of these reshaping and edge coverage transitions were not accessible in previous
atom-resolved microscopy investigations. By interplay with DFT modelling, we directly reveal
in this chapter the edge and shape modification of both MoS2 and promoted CoMoS
nanoparticles, which appear to be a correct representation of edges in their active state during
working HDS conditions.
4.1 Experimental details
Gold supported s-MoS2 and s-CoMoS nanoparticles were synthesized by the methods
described in Section 2.4.2 and 2.4.3. This procedure leads to well-defined model system
consisting of fully-sulfided MoS2 or promoted CoMoS-type nanoparticles (described and
illustrated in Chapter 3). Once the samples were transferred to the STM and the nanoparticles
were inspected locally, the samples were subsequently treated in a reducing gas of H2 at a partial
pressure ρ(H2) in the range of 10-4
mbar at 673 K for 30 min, following the procedure described
in Section 2.4.4. The sample was cooled down to room temperature and then transferred to the
STM for the nanoparticles analysis. The nanoparticles resulting from the transition induced by
Page 45
4. Shape and edge sites modifications of s-MoS2 and s-CoMoS nanoparticles
33
post-annealing the s-MoS2 and s-CoMoS nanoparticles in a reducing H2-gas will be termed r-
MoS2 and r-CoMoS nanoparticles.
4.2 MoS2 and CoMoS nanoparticle reshaping
It has been mentioned that the shape of the MoS2 and CoMoS nanoparticles is an
important parameter as it determines the type of edges exposed in the catalyst particles. For a
single-layer MoS2 nanoparticle, the shape is determined by the relative stability of the most
stable low-index edges, which are usually the (1010) Mo-edge and the (1010) S-edge,
respectively. The s-MoS2 nanoparticles larger than 2 nm adopt a perfect triangular shape
terminated by the Mo-edge termination, and for sizes smaller than 2 nm (n < 6, where n denotes
the Mo atom number along the edge of a triangle) the nanoparticles show a S-terminated
structure (see Fig. 3.2). Addition of Co-promoter in MoS2 leads to preferentially hexagonal-
shaped s-CoMoS nanoparticles terminated by both Mo- and S-edges (see Fig. 3.5). The
modification to a hexagonal shape compared to the pure triangular s-MoS2 shape was concluded
to be driven by the preferential substitution of Co atoms at the S-edges, which stabilizes the Co-
substituted S-edge energy relative to the non-promoted case [47,51].
Fig. 4.1a illustrates a pronounced morphological change for non-promoted MoS2 upon
switching from a sulfiding gas to a reducing gas. The transition is induced by post-annealing the
s-MoS2 in a H2-gas atmosphere. The pressure range is at least two orders of magnitude higher
than previous STM studies inspecting the effect of H2 [66]. Remarkably, the exposure at only
10-4
mbar H2 background pressures was enough to induce significant modifications that were not
observed in previous studies. A further increase to 10-2
mbar H2 did not significantly change the
resulting MoS2 morphology, so the systematic experimental series was conducted for the lower
pressure range. From inspection of the large-scale STM images in Fig. 4.1a, we conclude that the
shape of the nanoparticles is significantly affected by the reductive conditions, since the
predominant shape is clearly truncated triangles.
We quantify the observed reshaping in terms of the particle shape factor (s = lS/ltotal),
which in an average value that expresses the length of the S-edges relative to the total particle
perimeter length (sum of Mo- and S-edges) extracted from an extensive dataset consisting of the
particle size and edge lengths measured in atom-resolved STM images of individual
nanoparticles. The graph of the shape factor in Fig. 4.1c shows that for s-MoS2 nanoparticles
with a size larger than 2 nm (n > 6), triangles (s = 0) are predominant for the fully-sulfided
samples (dark green bins), whereas after the reductive treatment the shape factor shifts toward
Page 46
4. Shape and edge sites modifications of s-MoS2 and s-CoMoS nanoparticles
34
Figure 4.1 (a) The morphology of s-MoS2 and r-MoS2 nanoparticles. (b) The morphology of s-CoMoS and r-CoMoS
nanoparticles. (c) Histograms of the shape factor (s = lS/ltotal) for sulfided and reduced MoS2 and CoMoS structures,
respectively. Mo-edge terminated (n > 6) and S-edge terminated (only n < 6) MoS2 nanoparticles are plotted
separately for clarity. The histograms were obtained from analysis of atom-resolved STM images of individual
MoS2 and CoMoS nanoparticles.
Page 47
4. Shape and edge sites modifications of s-MoS2 and s-CoMoS nanoparticles
35
truncated shapes (r-MoS2) with the peak s ≈ 0.3. A detailed comparison shows that the
nanoparticle size distribution is slightly changed towards smaller areas after the exposure (see
appendix A) and the reshaping process can therefore be regarded as an isolated restructuring of
each MoS2 nanoparticle, with negligible exchange of material between particles or ripening.
For the case of Co-promoted MoS2 nanoparticles, the same reductive treatment was
performed and the STM images revealed no effect on the morphology modification (compare
s-CoMoS and r-CoMoS in Fig. 4.1b). The shape factor (s = lS/ltotal) for CoMoS nanoparticles,
derived from an analysis of atom-resolved STM images, is displayed in Fig. 4.1c (lower panel).
Here, the initial distribution (dark red bins) for the s-CoMoS nanoparticles reflects shapes close
to perfect hexagons (s ≈ 0.5). After the exposure to reducing conditions (r-CoMoS), there is no
statistically significant change to this distribution. We therefore conclude that the hexagonal
shape of the CoMoS nanoparticle is the stable equilibrium shape in both cases.
The different sensitivities towards morphology changes exhibited by MoS2 and CoMoS
under the experimental reductive conditions can be explained in terms of the relative ratio of
edge free energies for MoS2 (γS/γMo) (see Fig. 3.3). As mentioned in Chapter 3, for the single-
layer s-MoS2 nanoparticle, the triangular shape results when 𝛾𝑆 > 2𝛾𝑀𝑜. Therefore, the
reshaping after H2 treatment can be induced by stabilization of the S-edge leading to a lower γS
(values between 2⋅γMo and γMo), by destabilization of the Mo-edge (higher γMo), or by a
combination of the two. In fact, the variation of γMo and γS gives rise to a wide range of structural
morphologies, including pentagons, all contained within the symmetry of MoS2 and governed by
the Wulff construction. Such changes in the free energies can occur by allowing reduction of the
terminal S coverage on the edges (S vacancies) or adsorption of H (in the form of S-H), with
theory predicting that both these processes occur under reducing conditions [62,67].
The absence of H2-induced reshaping of s-CoMoS may be explained by the already
favorable energy of the Co-promoted S-edges, which appears not to be affected by further H
adsorption or reduction in the S coverage. This indicates that the relative edge free energies do
not change considerably since the γS/γMo ratio is already close to unity (s ≈ 0.5).
The already triangular s-MoS2 nanoparticles with a size < 2 nm (n ≤ 6) obtained under
sulfiding conditions, are insensitive to the H2 exposure, since the shape factors remain identical
(assuming a shape factor of s ≈ 1), as shown in Fig. 4.1c (middle panel). This observation is in
full accordance with the fact that a further stabilization of the S-edge would not affect the shape
of an already S-edge terminated triangle [52].
Page 48
4. Shape and edge sites modifications of s-MoS2 and s-CoMoS nanoparticles
36
Figure 4.2 (a) Atom-resolved STM image (54 x 54 Å2) of a r-MoS2 nanoparticle (Vt =-0.322 V, It = -0.420 nA). (b)
Line scans along the bright brim and S-edge highlighted by a golden arrow in the STM image. (c) Line scans along
the Mo-edge as indicated with a dashed white line on the r-MoS2 image compared with a line scan on s-MoS2. (d)
Ball-model representation of the r-MoS2 nanoparticle showing the S vacancies along the Mo-edges with red arrows
and possible S-H groups with dashed black circles.
Page 49
4. Shape and edge sites modifications of s-MoS2 and s-CoMoS nanoparticles
37
4.2.1 Edge structure of r-MoS2 nanoparticles
In order to gain access to the S coverage on the edges, we use atom-resolved STM to
resolve the edge structures of the r-MoS2 and r-CoMoS nanoparticles. We compare these
observations with edge structures predicted in the DFT-calculated phase diagrams obtained by ab
initio thermodynamics (AITD) for MoS2 and CoMoS structures supported on Au(111). Fig. 4.2a
illustrates an atom-resolved STM image representative of edges in a truncated r-MoS2
nanoparticle observed after H2 exposure. Here, two distinct edge types can now be identified,
reflecting the fact that both S-edges and Mo-edges are present. None of the edges in the r-MoS2
hexagon expose the STM contrast seen for the fully-sulfided Mo-edge in s-MoS2 in Fig. 3.2b.
The shorter edges exhibit clearly-resolved edge protrusions which are imaged in registry with the
basal plane S atoms together with a strong enhancement of the intensity just behind the edge (see
white balls over the edge). Theoretical calculations developed by Bollinger et al. [32] for the S-
edge on the MoS2 demonstrated that the fully-covered S-edge can break the symmetry of the S
lattice along the edge, i.e. S dimers with a certain zig-zag ordering. However, it was determined
that H forms stable bonds with the fully-covered S-edge, yielding the highest binding energy.
This adsorption of H causes the split of the S dimer, creating one or two S-H groups instead. In
addition, through an analysis of the electronic structure of the fully covered S-edge (100% S)
with and without hydrogen, the presence of two remaining states, III and IIIH, was observed on
the S-edge and is shown in Fig. 4.3a (electronic states I and II corresponding to the Mo-edge
were described in Chapter 3).
Figure 4.3 (a) Calculated band structure for the S-edge of MoS2. The red lines are the comparison of the one-
dimensional energy bands at the Fermi level for a finite MoS2 stripe having a fully covered S-edge, with H adsorbed
in red and without H adsorbed in green (100% S coverage S-edge) showing the edge state IIIH crossing the Fermi
level. At the bottom: The contours of the electronic wave functions associated with the edge states III and IIIH
localized entirely on the S-edge without and with adsorbed hydrogen, respectively. (b) Simulated STM images for finite
MoS2 stripe with a fully covered S-edge with and without hydrogen (III). The figure is adapted from ref. [32].
Page 50
4. Shape and edge sites modifications of s-MoS2 and s-CoMoS nanoparticles
38
Figure 4.4 Left: Length distribution for the Mo and S-edges of r-MoS2 nanoparticles. Right: Average r-MoS2
nanoparticles morphology based on the total area of Mo and S-edges.
Here, the adsorption of H on the S dimers changes the band structure of the S-edge state,
which becomes truly metallic since IIIH crosses the Fermi level. For the clean S-edge, the
electronic state III seems to approach the Fermi level without actually crossing it, forming an
edge superstructure. STM simulations on the S-edge for these two cases are depicted in Fig.
4.3b. It was concluded that the S-H are clearly imaged with the presence of a bright brim that
extends in the row behind the edge. For the case of the S-edge without hydrogen, this shows a
superstructure with periodicity of two S lattice constants for both the brim and the S-edge.
Comparing the experimental STM results with the theoretical aforementioned calculations, I
suggest that the short edges correspond to the S-edge with 100% S coverage. In addition, these
edges seem to form S-H groups since the protrusions observed in the STM images are in registry
with S atoms of the basal plane, very similar to the STM simulations for the S-edge with H. Due
to geometric and electronic effects convoluted in STM technique, it is difficult to point out the
location of the S-H groups. However, by tracing line scans over any of the short edges, it is
possible to detect some specific differences in the corrugation. Fig. 4.2b illustrates one of the
profile lines over the S-edge and the corresponding bright brim that extends in the row behind
the edge. Here, we can observe that on the S-edge there are protrusions at middle positions which
present a slightly greater height than the rest, with a difference of approximately 0.1Å (see
golden arrow in Fig. 4.2b and in the STM image). These protrusions are brighter than the rest of
the protrusions for all the S-edges and one may assume that S-H groups are formed here.
Establishing their location by using probe molecules will be discussed in Chapter 5.
Page 51
4. Shape and edge sites modifications of s-MoS2 and s-CoMoS nanoparticles
39
Given the symmetry of MoS2, the other, longer edges must correspond to the Mo-edges.
The Mo-edges in r-MoS2 exhibit edge positions that are imaged as faint protrusions, in contrast
to the Mo-edge of s-MoS2 in Fig. 3.2b. The line scan in Fig. 4.2a shows that the contrast level
along the edge atoms is reduced from 1 Å for the fully-sulfided edge to ~0.6 Å and the
corrugation along the edge is much weaker (see Fig. 4.2c). This edge appearance indicates
removal of half of the edge S into a 50% S-terminated edge (see Mo-edge in the red rectangle in
Fig. 3.3) , and is fully consistent with previous STM simulation studies assigning them to Mo-
edges with reduced coverage corresponding to a 50% S coverage [61,62,66,68]. Additionally, it
is possible to locate certain atomic positions imaged with even weaker contrast along the Mo-
edge (highlighted by red arrows for the corresponding Mo-edge). Their location is also clearly
visible in the line scan as a further ~0.3 Å reduction in the height profile, pointing to formation
of isolated sulfur vacancies which corresponds to a reduction below the 50% S coverage for
some of the edges.
In order to determine the ratio between the Mo- and S-edges, an analysis of the length
distribution for both edges has been calculated (see Fig. 4.4). Here, we demonstrate that after the
reductive conditions, MoS2 nanoparticles can adopt multiple shape conformations, all governed
by the MoS2 symmetry. As expected, the newly-formed S-edges show shorter atomic lengths
with respect to the Mo-edges, whose lengths can span up to about ten atoms. It is noted that the
S-edges of two atoms are predominant for all the experimental series, while Mo-edges between
four to six atoms are very frequent. By evaluating the total area occupied by the Mo- and S-
edges, we concluded that the ratio is 2.3 i.e. 70% for the Mo-edges and 30% for the S-edges.
These values are very similar to those predicted by DFT calculations under realistic HDS
conditions [36].
4.2.2 Edge structure of r-CoMoS nanoparticles
For the r-CoMoS nanoparticles we also observe significant changes of the edge
structures, indicating S reduction on both edges (see Fig. 4.5a). As in the case of r-MoS2
nanoparticles, the Mo-edges in r-CoMoS are imaged with faint edge protrusions consistent with
reduced edge coverage to 50% S (individual S vacancies are shown with red arrowheads in Fig.
4.5a). Interestingly, the Co-promoted S-edges also seem to be partially reduced compared with
the fully-sulfided case (s-CoMoS), in contrast to the S-edge in the r-MoS2 nanoparticles. The line
scans traced in Fig. 4.5a and illustrated in Fig. 4.5b show the comparison between the S-edges of
the nanoparticle exposed to H2 with respect to the clean S-edges of a fully-covered nanoparticle.
We observe that the reductive conditions generate a decrease in the intensity of the brightest
protrusions on the S-edge of approximately 0.2 Å (S-edge 1) and up to 0.6 Å (S-edge 3). Here,
the protrusions for all the S-edges remain in registry with the basal plane (see white circles in
Page 52
4. Shape and edge sites modifications of s-MoS2 and s-CoMoS nanoparticles
40
Fig. 4.5a) as for the fully sulfided S-edge in Fig. 3.5. The observations are consistent with a
reduction of the S coverage on the Co-promoted S-edge from a full 100% coverage to 50%
(monomers). This is also in agreement with the STM simulations for the 100% and 50% Co-
promoted S-edges (see Fig. 3.6a). However, the simulations shown for this edge in Fig. 3.6a do
not fully reproduce the aspect of the S monomers since they are imaged with a much lower
intensity than in the experimental image (S-edge 1 in Fig. 4.5a). This could indicate that the
composition of the S-edge after the reduction in H2 is slightly different. In the STM simulations
the presence of S-H groups was not considered, but they are expected to be present under HDS
decorating the S-edge with a H coverage ranging from 0 to 50%, depending on the PH2/PH2S ratio
[42,45,47,58]. According to this, we have also observed some slightly higher protrusions at
middle positions of the S-edge (see golden arrows for the S-edge 1 in the STM image and in Fig.
4.5b). The difference in height is of approximately 0.1 Å, the same corrugation as that of the
protrusions in the middle positions on the S-edge of r-MoS2 nanoparticles. When comparing the
S-edge lengths of the s-CoMoS and r-CoMoS nanoparticles, we detect significant differences
between them (see Fig. 4.5b). The maximum length difference corresponds to values of
approximately 2.6 Å, presented when the protrusions on the S-edge are all bright (S-edge 1).
This length difference is gradually reduced as the S-edge protrusions decrease in intensity; this is
the case for the S-edge 3.
The effect of the possible S-H groups on the S-edge can be transferred to the adjacent electronic
states related to the brim sites. As shown in Fig. 4.5c, by tracing line profiles over the bright brim
sites for the S-edges of the s-CoMoS and the r-CoMoS nanoparticle in Fig. 4.5a, we can identify
length differences. Specifically, there is a length difference of 3.1 Å between the brim of the s-
CoMoS with respect to brim 1 for the r-CoMoS nanoparticle. This difference becomes shorter
for the brim 2 and even more diminished for the brim 3. This means that the length of the brim is
related to the presence or absence of the bright brim and protrusions on the S-edge. Based on
these interpretations, we can deduce that the bright intensity of the S-edge is related to the
presence of S-H groups, which modify the one-dimensional electronic states of the S-edges in r-
CoMoS nanoparticles. Thus, the S-edge 2 may correspond to the case when H is adsorbed with a
lower coverage than for the S-edge 1. A ball model representation of the analyzed r-CoMoS
nanoparticle is shown in Fig. 4.5d. Here, the red arrows indicate the sulfur vacancies observed at
the Mo-edges and the black dashed circles show the possible sites for the S-H groups.
In summary, we distinguish in the STM images S-edges reduced to 50% S without the
present of H adsorbed (from now termed as ‘quenched edges’) and S-edges with possible S-H
groups formed. The variety of S-edge types confirms that our system is not in a perfect
thermodynamic equilibrium, as it is expected due to the UHV limitations. However, we can
experimentally observe the presence of possible active sites extensively considered in the
literature of heterogeneous catalysis: S vacancies and S-H groups, believed to be responsible for
the catalytic activity of the MoS2-based catalysts.
Page 53
4. Shape and edge sites modifications of s-MoS2 and s-CoMoS nanoparticles
41
Figure 4.5 (a) Atom-resolved STM image (50 x 50 Å2) of a r-CoMoS nanoparticle (b) Line scans along the Co-
promoted S-edge as indicated on the r-CoMoS compared with a line scan on s-CoMoS. Golden arrows indicate the
positions of possible S-H groups on the S-edge. (c) Line scans along the brim sites of S-edges 1, 2 and 3 as indicated
on the r-CoMoS compared with a line scan on s-CoMoS. (d) Ball-model representation of the r-MoS2 nanoparticle
showing the S vacancies along the Mo-edges with red arrows and possible S-H groups with dashed black circles.
An atom-resolved STM image of another r-CoMoS nanoparticle is shown in Figure 4.6a.
Here, height profiles were plotted from the MoS2 (0001) basal plane to the gold substrate over a
quenched S-edge (frontal edge, in the direction of the green arrow) and a S-edge considered to
contain S-H groups following the direction of the blue arrow. The profiles on these S-edges are
displayed in Fig. 4.6b. For the quenched S-edge, the reduction of the height is gradual and
contained in four different levels until reaching the basal plane (black asterisk). It is known that
Page 54
4. Shape and edge sites modifications of s-MoS2 and s-CoMoS nanoparticles
42
Figure 4.6 (a) STM image (54 x 54 Å2) of a r-CoMoS nanoparticle showing two quenched edges and one S-edge
with H. (b) Line scans from the basal plane to the Au(111) substrate following the direction of the green and blue
arrows in (a). The colored asterisks represent different height levels for the quenched edge (50% S). (c) Corrugation
of the S atoms on the first row at the S-edge.
the edge state responsible for the very intense bright brim is localized on the outermost four rows
of atoms counted inward from the edge [29]. We demonstrate that the first row of S atoms (blue
asterisks in the STM image) are half the height of the basal plane and the distance between the
edge protrusions is 3.0 Å (± 0.1 Å) (see Fig. 4.6c). The separation between the first row of S
atoms and the second one (green asterisk) corresponds to 3.0 Å (± 0.1 Å). This distance is
increased to 3.3 Å (± 0.1 Å) for the next two rows of S atoms (yellow asterisk). The S atoms
Page 55
4. Shape and edge sites modifications of s-MoS2 and s-CoMoS nanoparticles
43
from the second and third row are bonded differently, to Co-Mo atoms and Mo-Mo atoms,
respectively. The bright brim for the Co-promoted S-edge should appear in this area, as it is
shown for line scan over the S-edge with H adsorbed. The absence of the bright brim may be
related to a support effect that will be explained in the next section.
4.3 DFT calculations on r-MoS2 and r-CoMoS nanoparticles supported on Au(111)
Calculated phase diagrams obtained by ab initio thermodynamics analysis were recently
performed by A. Bruix at Aarhus University in Denmark (see Fig. 4.7). There, plots were
constructed by evaluating the Gibbs free energy of formation (∆G) as a function of sulfur’s
chemical potential (μS) for nanoparticle models exposing the three different edge types
considered and varying S coverage (for methods see Appendix B). To facilitate comparison with
the experiment, we also superimpose a stability window representative of the experimental
sulfiding conditions and reducing conditions, noting that the window reflects the uncertainties in
the determination of the chemical potentials from theory and the experimental conditions.
An estimate of sulfur’s chemical potential (𝜇𝑠) achieved under the reducing conditions
(r-MoS2) shows that it is slightly more reducing than that under HDS conditions (using
p(H2S)/p(H2) ≈ 10-4
) [69]. From Fig. 4.7a, we observe that the Mo-edge with the 100% S
coverage is stable within the range of 𝜇𝑠 estimated to correspond to the experimental sulfiding
conditions leading to s-MoS2. In turn, the range of μs defined by reducing conditions leading the
r-MoS2 system coincides with the region of the phase diagram where the 50% S coverage on the
Mo-edge becomes thermodynamically stable. This is in accordance with the STM observations
in the present work and previous DFT-derived phase diagrams for Au-supported stripes of MoS2
[66]. We also note that in some STM images of r-MoS2, S vacancies could be identified on edges
which bear resemblance to defective edges with lower S coverage. For non-promoted S-edges,
the calculated phase diagram (Fig. 4.7b) suggests that the 100% S coverage is stable for s-MoS2
conditions and for a wide range of lower μs values. Under conditions leading to r-MoS2, the
phase diagram indicates that the lower S coverage becomes stable, but we do not observe this
experimentally. This is probably due to the highly favorable adsorption of H atoms on the fully-
sulfided S-edge, which would shift the μs value at which the transition from 100% to 50%
coverage is predicted to happen towards lower energies [32].
The AITD plot for the Co-promoted S-edge for s-CoMoS nanoparticles (see Fig. 4.7c)
indeed shows that a full coverage of 100% S may be stabilized on the S-edge (for the highest
chemical potential in the experiment) and the 50% S coverage becomes most stable for the
conditions that reflect the r-CoMoS experiment. On the other hand, the calculated phase diagram
predicts that the same 50% S coverage on the S-edge is stable for both the Au-supported and free
Page 56
4. Shape and edge sites modifications of s-MoS2 and s-CoMoS nanoparticles
44
Figure 4.7 Ball models (left panels) showing the ideal structure of Mo-edge (a), S-edge (b), and Co-promoted S-
edge (c) terminations of MoS2 and CoMoS nanoparticles with different S coverage. Phase diagrams (right panels)
obtained by means of DFT calculations and ab initio thermodynamics analysis of Au-supported MoS2 and CoMoS
nanoparticle models. The Gibbs free energy of formation (∆G) of the nanoparticles has been evaluated for each edge
type and coverage as a function of sulfur’s chemical potential (𝜇𝑆). Hashed areas indicate regions of 𝜇𝑆 estimated to
be representative of the indicated experimental conditions (i.e. reducing, sulfiding, or HDS).
CoMoS for the chemical potential associated with the formation of r-CoMoS, which is
furthermore also the stable S coverage predicted under HDS conditions [29]. The Mo-edge within
the CoMoS nanoparticles is expected to behave similarly to the Mo-edges in MoS2 particles and
be terminated by the 50% S under HDS conditions [47,59,70]. We note however, that the gold
model substrate used in this experiment may influence the bonding of the remaining terminal
50% S atoms for the S-edge of r-CoMoS nanoparticles, which is calculated to be bonded towards
the substrate (S50H0 in Fig. 4.8b). These results have been extended including the chemical
potential of hydrogen (μH), since the edge structure stability will also depend on the partial
pressure of hydrogen. Fig. 4.8a shows a diagram for the S-edge of r-CoMoS nanoparticles
indicating the stable structures under the experimental conditions. It is observed that under the
HDS conditions at ΔμH = -0.2 eV and ΔμS = -0.95 eV three different structures coexist: S50H0,
S75H50 and S75H100. It should be emphasized, though, that the S-edge coverage will not be
reduced in steps of 25% but rather will decrease continuously from a S coverage of 75% as ΔμS
Page 57
4. Shape and edge sites modifications of s-MoS2 and s-CoMoS nanoparticles
45
is lowered. Considering that the experimental ΔμS value is approximately -1.0 eV, by decreasing
the ΔμH while dosing hydrogen at high temperature it will reach the point termed as ‘red’
(reduction) crossing a window of structures from S75H100 to S50H0. As we do not visualize an
edge structure composed of 75% S for the S-edge compared to the STM simulations [29], this
may indicate that for our system the S-edge will present edge configurations within a range from
S50H100 to S50H0. In Fig. 4.8b these possible edge structures are shown including the
interaction with the gold substrate. The representative models for three atoms-long S-edge
demonstrates how the adsorption of atomic hydrogen can induce some edge relaxations lifting
the S atoms up from the substrate in the S50H50 and S50H100 cases. Based on our experimental
observations, the kinetic limitations during the reduction treatment cause the formation of
different edge structures for the S-edge of r-CoMoS nanoparticles, with S coverage of
approximately 50% and H coverages ranging from 50 to 0%.
Figure 4.8 (a) A phase diagram indicating the stable structures at the Co-promoted S-edge for different values of
(μS, μH). The labels refer to the three experimental situations: sulph for the S-edge of s-CoMoS nanoparticles, HDS
and red for the S-edge of r-CoMoS nanoparticles. (b) Resulting r-CoMoS structures supported on Au(111) based on
the AITD plot in (a) with S-edge coverage of 50% S and H coverages ranging from 0 to 100%.
Page 58
4. Shape and edge sites modifications of s-MoS2 and s-CoMoS nanoparticles
46
4.4 Conclusions
We have shown in this chapter that the morphology and edge structure of non-promoted
MoS2 and Co-promoted CoMoS nanoparticles are significantly affected after being exposed to a
reductive H2 atmosphere at relatively high pressures and high temperatures. The nanoparticle
reshaping has demonstrated that the original triangular s-MoS2 is transformed into truncated
hexagons or pentagons, very similar to the forms found for this catalyst under HDS conditions.
We established that the truncation of the s-MoS2 is due to the formation of new S-edges with
shorter lengths compared the Mo-edges. In this restructuring, the reductive atmosphere of H2
may remove S atoms from the structures, changing the morphology based on the Wulff
construction and MoS2 symmetry of each nanoparticle at high temperature. We suggested that
the S-edges for the r-MoS2 nanoparticles show an edge structure corresponding to 100% S with
the possible locations of S-H groups, visualized by certain geometric or electronic features,
present in middle positions of the S-edge. For the case of the Mo-edge, this has been reduced to
50% S since the presence of dimers is not clearly visible as it is for the case of the s-MoS2
nanoparticles. However, by exposing the r-MoS2 nanoparticles to H2S again, there is a reduction
in the length of the S-edge and a recovery of the 100% S for the Mo-edge. For the case of the
s-CoMoS nanoparticles, we observed that, under reductive conditions, these particles do not
modify their morphology, which remains predominantly hexagonal. However, we detected that
the edge structure changes significantly, showing a variety of compositions at the Co-promoted
S-edge. These S-edges may be reduced to 50% S, but with different H coverages. The absence of
H on some of the S-edges may cause the S monomer to be attracted towards the gold substrate,
while the usual bright brim characteristic for the S and Mo-edges seem to be extinct completely.
These quenched edges present a gradual reduction of the intensity from the basal plane to four
rows of sulfur atoms towards the S-edge. By measuring the distances between the S rows of the
reduced edge, we suggested that the Co atoms are still present in the structures since the
separation of the S rows is different where the Co atom it supposed to be bonded. If H is
adsorbed on some of the reduced S-edges, it contributes to the appearance of the bright brim
characteristic for the metallic edge states, very similar to the one observed for the fully covered
S-edge of r-MoS2 nanoparticles. Using phase diagrams, we also demonstrated that the
complexity of edge structures is due to kinetic limitations of the process which is not in
thermodynamic equilibrium. Finally, for the case of the Mo-edge for r-MoS2 and r-CoMoS
nanoparticles, this has also been reduced to 50% S. Through the interplay of STM studies and
density functional theory modeling, we identify the r-MoS2 and r-CoMoS edge structures and
morphologies in their active state. In order to confirm the presence of the active sites, in the
following chapters will be studied the interaction and adsorption of organic molecules with these
reduced catalysts.
Page 59
Chapter 5
5 Adsorption of nitrogen-containing molecules on
r-MoS2 and r-CoMoS nanoparticles
This chapter will present the results obtained by dosing pyridine and quinoline on r-MoS2
and r-CoMoS nanoparticles. These molecules have been used to identify active sites on the
reduced nanoparticles. The work presented in this chapter is in preparation for publication as
paper II.
Page 60
5. Adsorption of nitrogen-containing molecules on r-MoS2 and r-CoMoS nanoparticles
48
The active sites in HDS reactions are responsible for the direct S extrusion and
hydrogenation of S compound species. These active sites are commonly or selectively subject to
occupancy by some other molecules naturally present in the oil feed and that inhibit the HDS
reaction. Detailed studies showed that the inhibition under catalyst operation is more pronounced
for the HYD pathway and thus the effects are particularly important for the deep HDS
performance of refractory compounds like dibenzothiophenes [71-74]. It is known that the HDS
through the DDS reaction of sterically hindered molecules like 4,6-DMDBT is slow, and if the
HYD is inhibited, the molecules will be left untreated in the final fuel product. More reactive S
species, those where the sulfur atom is not sterically hindered, appear to be less inhibited where
the direct extrusion and C-S bond rupture via the HDS route can easily proceed [5,75].
Heterocyclic basic nitrogen compounds such as pyridine and quinoline have been found
to have a stronger disabling effect on the HDS reactions than inhibitors like benzene and
naphthalene [5]. A ball model and the skeletal representation of pyridine and quinoline are
illustrated in Fig. 5.1. Pyridine (C5H5N) is an aromatic six-membered ring compound that
contains one nitrogen atom with a conjugated system of six π electrons delocalized above and
below the plane of the ring. The N atom is sp2-hybridized whereas the lone electron pair on the
nitrogen is not included in the π system. The electron pair, perpendicular to the π system, can be
protonated without disrupting the aromaticity, yielding a pyridinium cation (PyrH+). The
quinoline molecule (C9H7N) is a fused heterocycle derived by fusion of a pyridine ring with a
benzene ring. All ring atoms are sp2-hybridized. Like pyridine, the lone electron pair on N atom
is not involved in the formation of the delocalized π- molecular orbital. Thus, quinoline is basic,
with a pKa of 4.9, similar to that of pyridine (pKa= 5.2).
It is generally accepted that the nitrogen-containing molecules occupy the
prehydrogenation sites in the HYD route, blocking these sites or decreasing the number of H
atoms available for hydrogenation[5]. The presence of these species even at low concentrations
limits the catalytic activity and it is necessary to use higher temperatures and pressures to obtain
desired conversion values. La Vopa et al. [76] concluded that the adsorption strength of the
inhibitors increases in the order ammonia < aniline < pyridine < piperidine, quinoline. It was
demonstrated that the equilibrium inhibition adsorption constants correlated well with gas-phase
proton affinities of the inhibitor molecules [76,77]. It was proposed that this correlation is due to
the interaction of nitrogenous molecules with Brønsted acid sites (S-H groups) on the catalyst
surface, the sites for the prehydrogenation in the HYD reactions.
Page 61
5. Adsorption of nitrogen-containing molecules on r-MoS2 and r-CoMoS nanoparticles
49
Figure 5.1 (a) Ball model of the pyridine molecule (H: gray, C: brown and N: green) and skeletal representation of
the H, C and S atoms in the structure (M = 79.1 g/mol) and (b) Ball model of the quinoline molecule (H: gray, C:
brown and N: green) and skeletal representation of the H, C and S atoms in the structure (M = 129,16g/mol). At
room temperature, pyridine is a colorless liquid (mp= -41.6 °C) and the vapor pressure is approximately 21.3 mbar.
Quinoline is a colorless liquid (mp= -41.6 °C) and the vapor pressure is approximately 0.08 mbar at 25°C.
Small base molecules like pyridine, NH3, CH3CN, NO or CO have been used as probe
molecules for the quantitative analysis of surface acidity of some solids like SiO2 – Al2O3 [78],
TiO2, ZrO2, and CeO2 [79-81]. In this approach, the nature, strength and concentration of acid
sites are characterized based on clearly distinct adsorption features (frequency and intensity)
using Infrared Spectroscopy (IR) [82]. Topsøe et al. [83] confirmed by IR measurements that the
S-H groups exist on the edges of the MoS2 catalyst and revealed their interaction with pyridine to
form pyridinium ions, giving rise to a characteristic IR band at 1546 cm-1
.
Pyridine and pyridinium ions adsorption on the Mo and S-edges of MoS2 catalyst was
treated in a DFT study by Logadottir et al. [84]. They found that on the Mo-edge pyridine can be
protonated to pyridinium with a very low barrier and binds much stronger than pyridine
(approximately 0.4 eV difference). In contrast, on the S-edge, which has been activated by the
creation of a single vacancy, pyridine binds strongly to the vacancy but the process is less
exothermic than the adsorption of pyridinium ions on the Mo-edge. Differently than in the Mo-
edge, the addition of H atoms on the S-edge makes the adsorption of pyridine endothermic; this
behavior was explained in terms of the proton acidity and deprotonation energy of the S-H
group.
Page 62
5. Adsorption of nitrogen-containing molecules on r-MoS2 and r-CoMoS nanoparticles
50
From an interplay of STM experiments and DFT calculations, atomic-scale insight into
pyridine adsorption on MoS2 has been provided recently by Temel et al [38]. In the experimental
study, pristine MoS2 nanoparticles were exposed to an atomic H flux and sequentially to pyridine
molecules. It was found that pyridine molecules interact with S-H groups forming pyridinium
ions located at the catalytically active brim sites on the Mo-edge. However, it is not clear what
influence low temperatures have on the adsorption configuration of the molecules and the
condensation of H atoms on the S atoms along the Mo-edge.
For the case of the Co-promoted molybdenum sulfide catalyst, Srinivas et al recently
provided the first DFT insight on the adsorption of sulfur and nitrogen-containing molecules
[41]. It was found that the adsorption of pyridine occurs on the brim site in the form of a
pyridinium ion with the N−H bond pointing toward the S atom with an angle of approximately
45° between the plane of the aromatic ring and the catalyst surface. Additionally, pyridinium
ions are also adsorbed strongly on the edge in a perpendicular upright configuration relative to
the S-edge. For the latter case, the binding energy of the ion differs from the calculations
obtained by Logadottir et al. [84] for the pyridinium ion adsorption on the S-edge of non-
promoted catalyst. For a quinoline molecule, similar results were obtained, with the protonated
quinolinium ion on the brim site showing binding energies of −0.86 eV, 0.04 eV less than the
perpendicular adsorption configuration.
5.1 Experimental details
The starting point is the synthesis and characterization of the well-known morphology of
the s-MoS2 and s-CoMoS nanoparticles. In a set of two different experiments, pyridine and
quinoline exposures on s-CoMoS nanoparticles were carried out at room temperature with
molecular dosage background pressures of 1.0×10⁻⁷
mbar for 5 min. The molecules were kept in
glass containers and admitted to the UHV chamber through a leak valve. For the case of
quinoline, the glass container was heated up to 40 °C using heating tapes prior to the dosage to
increase the vapor pressure in the gas line. After the molecular exposure, the s-CoMoS sample
was transferred to the STM stage for a local inspection. Similarly, pyridine and quinoline
exposures at room temperature were performed on r-MoS2 and r-CoMoS nanoparticles
previously treated in H2. Additionally, in situ pyridine exposures on fresh r-CoMoS nanoparticles
were carried by filling the background pressure of the chamber to 1.0 ×10⁻⁶
mbar for 10 min
while the STM tip was scanning over the surface simultaneously.
Page 63
5. Adsorption of nitrogen-containing molecules on r-MoS2 and r-CoMoS nanoparticles
51
5.2 STM results
In catalysis it is fundamental to locate the active sites destined to the prehydrogenation in
the HYD pathway of refractory sulfur-containing compounds. However, the direct detection of
these S-H groups is difficult by STM due to the convolution of geometric characteristics and
LDOS at the edges. The adsorption of probe molecules able to be protonated by such groups is a
way to assess their presence. Thus, through the use of basic heterocyclic nitrogen compounds
such as pyridine and quinolone, in this section we will analyze the detection of these acidic
groups as targets. The adsorption will not only allow us to identify the sites where the catalyst is
poisoned in HDS processes, but also provide more information about the Mo and S-edge
composition of non-promoted and Co-promoted MoS2 nanoparticles before and after the H2
treatment.
5.2.1 Adsorption of pyridine on reduced MoS2 nanoparticle
As mentioned in Chapter 4, reshaping of s-MoS2 nanoparticles has been induced by a
combined process of S-edge stabilization and Mo-edge destabilization, which results in a variety
of nanoparticle shapes with different γS and γMo values. Such changes in free energies are related
to the reduction of terminal S coverage on the edges (S vacancies) and the adsorption of H by the
formation of S-H groups. The S vacancies sites have been assigned to the positions along the
edges imaged as faint protrusions and the possible presence of S-H groups was attributed to the
protrusions on the S-edges with a brighter STM contrast than the rest. Therefore, in order to
confirm the presence of Brønsted acid sites on these r-MoS2 nanoparticles, pyridine has been
used as probe molecule and its preferential adsorption sites have been mapped through STM
images sequentially.
An atom-resolved STM image of a r-MoS2 nanoparticle after exposure to pyridine at
room temperature is shown in Fig. 5.2a. First, we observe that the Mo-edges have not changed
their STM contrast. The low reactivity of these edges may be due to: a) absence of H atoms, b)
presence of weak Lewis acid sites, or c) a thermodynamic barrier at room temperature for the
adsorption or protonation of these molecules. Exposures carried out at higher substrate
temperatures (up to 400K) caused the decomposition of the molecule, making its visualization on
the edges very difficult. However, interestingly, changes on the S-edges are observed at room
temperature. The height changes of the S-edges for this nanoparticle are depicted in Fig. 5.2b.
Here, a very pronounced change in the height on the S-edge 1, of up to 0.6 Å, is clearly observed.
It should be noted that even though S-edge 2 does not present a drastic change in height, its
Page 64
5. Adsorption of nitrogen-containing molecules on r-MoS2 and r-CoMoS nanoparticles
52
corrugation indicates the presence of certain S-H groups, since there are bright protrusions higher
than the average level (this effect will be described below). The intensity increase on S-edge 1 is
represented by two protrusions located exactly in the middle of the edge and shows an apparent
height similar to the brim.
Figure 5.2 Adsorption of pyridine. (a) STM image (52 x 52 Å2) of a r-MoS2 nanocluster after dosing pyridine at
300 K. (b) ball model representation of the r-MoS2 nanoparticle containing a pyridinium ion. (c) Line scans over the
pyridinium ion and the three S-edges of the nanoparticle. (d) Line scans over the brim sites before and after dosing
pyridine molecules.
Page 65
5. Adsorption of nitrogen-containing molecules on r-MoS2 and r-CoMoS nanoparticles
53
Surprisingly, this increase occurs where we located possible S-H groups on the S-edge of
r-MoS2 nanoparticles, as presented in Chapter 4. This modification on the S-edge 1 is
accompanied by the appearance of a small protrusion out of the S-edge, with an apparent height
of 1.0 Å relative to the Au(111) substrate which lies in the middle of the two brightest
protrusions of the edge. If the molecule is protonated on these sites, the formed pyridinium
cation directly affects the electronic edge states since the bright brim is distorted one S row
inwards from the S-edge right in the same direction where protonation can take place (see black
arrow in Fig. 5.2a,c). The brim is vanished 0.24 Å to the same height level of the basal plane of
MoS2 (see Fig. 5.2d). One can suggest that the donation of H atoms from the S-H groups to the
pyridine molecules modifies the chemical environment of the S atoms on the S-edge, as is
reflected in the STM images contrast. However, due to the convolution of the technique, the
contribution of geometrical characteristics cannot be discarded from the interpretation of the
STM images.
We note that the formation of pyridinium ions appears to occur in the middle of the edge
or above two S atoms on the S-edge. Among many scenarios for pyridinium formation on the S-
edge, we tentatively consider here models close to our experimental data as follow: (a) the
formation of pyridinium ions occur through the protonation of the electron pair of the N atom
with a S-H group and the delocalized electrons of the aromatic ring can interact through van der
Waals forces with the S-edge or (b) with a neighbor S-H group, and (c) the assumption that the
electron pair of the N atom is in resonance with two S-H groups at the S-edge, which explains
why the ion is observed in the middle of the edge. These cases are shown in Fig. 5.3. In Fig. 5.3a
the aromatic ring rotates towards the neighbor S atom or S-H group, from where the lone pair of
electrons is being protonated by an S-H group. This corresponds to cases (a) and (b) discussed
above.
In Fig. 5.3b the lone pair electrons of the N atom are in resonance with two S-H groups,
enabling a possible stronger interaction between the ion and the Brønsted acid sites. The line
profile traced over the S-edge 1 (in Fig. 5.2a) from the basal plane to the gold substrate, as shown
in the dashed line in Fig. 5.3b, is depicted in Fig. 5.3c. The distance between the S-edge and the
out-of-the-edge protrusion is approximately 5.1 Å, which correspond to the molecular size of
pyridine. Thus, the protonation configuration between two S-H groups seems to be reasonable
based on the experimental observations, but it could also explain the strong inhibitory character
of the pyridine molecule in HDS, as pyridine may be blocking two active sites dedicated to
prehydrogenation in HYD or for adsorption of sulfur-containing molecules on the S-edge.
Page 66
5. Adsorption of nitrogen-containing molecules on r-MoS2 and r-CoMoS nanoparticles
54
Figure 5.3 Adsorption configuration of pyridinium ion. (a) Double flat adsorption interaction of pyridinium ions. (b)
Resonance interaction between two S-H groups and the lone pair electrons of the N atom. (c) Line scan of the
changes originated from the adsorption of the ion on the S-edge.
The maximum number of pyridinium ions formed on a S-edge seems to be influenced by
the number of available S-H groups and the length of the edge. The interaction of two pyridine
molecules with a S-edge of three atoms of length is shown in Fig. 5.4 (the ball-model
representations of corresponding to STM images are shown below them). On the S-edge marked
with a white arrow, the same features described above and assigned to the formation of a
pyridinium ion are observed. The cation (P1) appears to be located in the middle of two of the
three protrusions of the S-edge, possibly interacting with two S-H groups (see Fig. 5.4a). Next to
it, a molecule (P2) is approaching the same S-edge; this molecule is likely to be protonated on
the third protrusion of the S-edge. However, due to steric effects, protonation cannot take place
until the molecule P2 rotates towards the corner. The protonation of P2 is shown in Fig. 5.4b.
During the protonation of these two molecules, P1 and P2, the brim seems to be recovered and
the cation P1 is displaced from its central axis. Apparently, the interaction of P2 is not strong
enough for the molecule to remain on the S-edge, shared with P1, and therefore P2 is constantly
deprotonated and returned to the gold surface (see Fig. 5.4c). We can conclude that the strength
of the binding energy of the adsorbed pyridinium ion and its stability on the S-edge may depend
Page 67
5. Adsorption of nitrogen-containing molecules on r-MoS2 and r-CoMoS nanoparticles
55
on the amount of available Brønsted acid groups. We have seen that this stability is stronger
when a single pyridinium ion interacts possibly with two S-H groups than when it interacts only
with one. Therefore, for the case described above, the pyridinium ion P1 would have passivated
the S-edge, preventing the stable adsorption of another pyridine molecule. This blocking effect
could be extended to competitive adsorption between nitrogen and sulfur-containing molecules
present in HDS.
Figure 5.4 Pyridinium ion stability on the S-edge. STM images (40 x 40 Å2) of (a) r-MoS2 nanoparticle with P1
adsorbed and P2 approaching to the edge. (b) r-MoS2 nanoparticle with P1 and P2 adsorbed. (c) Deprotonation of
P2 from the S-edge.
It is expected that, by increasing the length of the S-edge, larger amounts of S-H groups
can be found due to the dissociation of the hydrogen molecule at high temperatures in the
reductive treatment. This would imply that greater amount of ions are adsorbed at the S-edges.
However, as shown in Fig. 5.5, the pyridinium ions may be exhibiting another type of adsorption
when more than two S-H groups exist along the edge. Fig. 5.5a-b show two STM images
acquired on the same r-MoS2 nanoparticle over a period of time and after being exposed to
pyridine vapor. At a first inspection, it is not possible to detect notable changes between them.
Page 68
5. Adsorption of nitrogen-containing molecules on r-MoS2 and r-CoMoS nanoparticles
56
Figure 5.5 Diffuse physisorbed mode of pyridine molecules. (a) and (b) STM images (52 x 52 Å2) of a r-MoS2
nanoparticle obtained consecutively showing the diffuse physisorbed movement of the pyridine. (c) Line scans over
the S-edge 1 and 2 for the STM images in (a) and (b).
However, through a detailed analysis we have observed variations in the height of the S-edge 1
and the S-edge 2. These changes are shown in the graph in Fig. 5.5c. The 0.4 Å height increase
on both edges cannot be explained in terms of adsorbed pyridinium ions since we have
demonstrated that the increase related to these cations is of approximately 0.6 Å. In addition to
this, weak evidence of brim reduction due to protonation suggests that these changes have to be
related to a rapid movement of the molecule over the S-edge, since its stabilization on a specific
position was never observed experimentally. We can suggest that this dynamic of the molecule
corresponds to a diffuse physisorbed mode, where the molecule could travel freely along the S-
edge, similarly to 4,6-DMDBT molecules on CoMoS nanoparticles at low temperature [39]. We
could assume that these edges are rich in S-H groups, probably with the presence of three and
four S-H groups for the S-edge 1 and the S-edge 2, respectively. This dynamic effect was also
Page 69
5. Adsorption of nitrogen-containing molecules on r-MoS2 and r-CoMoS nanoparticles
57
observed on the S-edge 2 for the nanoparticle in Fig. 5.2c. For the case of the S-edge 3, this
shows an adsorbed pyridinium ion which remains intact over time. One can suggest that this
edge (which presents a defect marked with a white arrow) has only two S-H groups and therefore
the pyridinium ion does not show the same kinetic effect as on the other two edges for this r-
MoS2 nanoparticle. Thus, pyridinium ions may be strongly or weakly absorbed depending on the
amount of available S-H groups at the S-edges.
5.2.2 Adsorption of quinoline on r-MoS2 nanoparticles
As mentioned above, La Vopa et al. reported that the deactivating effect of nitrogen
compounds on the HDS of thiophene increased in the following order: NH3 < aniline < pyridine
< quinoline [76]. Therefore, the degree of poisoning increases with the increasing basicity of
these compounds, thus quinoline molecules should have a greater affinity to Brønsted acid sites
(see ball model of quinoline in Fig. 5.1b). It is believed that these quinoline molecules occupy
the prehydrogenation sites and therefore inhibit the HYD reactions of refractory sulfur-
containing molecules. In this study the adsorption of quinoline molecules on the r-MoS2
nanoparticles is investigated for the first time.
Direct exposure of quinoline at room temperature onto r-MoS2 reveals significant
changes on the edges of the nanoparticles. The fresh r-MoS2 nanoparticles are able to facilitate
the adsorption of molecules onto sites on the shortest edges, which correspond to the S-edges.
This is displayed in Fig. 5.6. Here, the quinoline ring is imaged as two round-shaped protrusions
with a length of approximately 7 Å (marked with green dashed semicircles in Fig. 5.6a). At this
point, we note that the observation of a strongly bound form of quinoline on the S-edge could be
due to the formation of the quinolinium ion, such as the pyridinium ions, by the interaction of S-
H groups with the lone pair of electrons belonging to the N heteroatom. Similarly to pyridinium
ions, the adsorption of quinolinium ions causes a height increase of some of protrusions on the S-
edge (marked with a dashed-white arrows as protonation sites in Fig. 5.6b) and a distortion of the
bright brim. We have observed that the adsorption configuration of these molecules depends on
the length of the S-edge and possible S-H groups present at the edge. Quinolinium ions Q-1 and
Q-2 are adsorbed on an edge containing two-atoms-long and their adsorption angle with respect
to the S-edge is of approximately 29ᴼ (see Fig. 5.6c). For the case of the cation Q-3, which is
adsorbed on a S-edge of three atoms, the interaction of the quinoline ring with the edge is
stronger and, thus, the adsorption angle between them is smaller. Furthermore, weakly adsorbed
quinoline molecules are also found to decorate the nanoparticle perimeter (shown with dashed
black ovals in Fig. 5.6a)
Page 70
5. Adsorption of nitrogen-containing molecules on r-MoS2 and r-CoMoS nanoparticles
58
Figure 5.6 Adsorption of quinoline. (a) STM image (50 x 50Å2, V=-1030 mV I=-0.270 nA) and (b) STM image
(50x50Å2, V=-487 mV I=-0.290 nA) of a r-MoS2 nanocluster after dosing quinoline at 300 K. (c) Ball model
representation of the r-MoS2 nanoparticle showing the adsorption angle of Q1.
The interaction effect of a quinolinium ion adsorbed on a three-atoms-long S-edge is
shown in Fig. 5.7 (green dashed semicircles indicate the location of the cation in Fig. 5.7a-b).
These two STM images acquired sequentially over the same r-MoS2 nanoparticle demonstrate
the dynamics and strong interaction of the molecule with S-H groups. One can say that there are
no significant differences between these two images (Fig. 5.7a-b). However, by tracing height
profiles over the S-edge on both images (shown in Fig. 5.7c) important electronic and geometric
variations are detected. Here, the bright protrusions on the S-edge show differences in height
from one image to the other (marked with black dashed arrows in Fig. 5.7a-b). Specifically, the
protrusions located at both ends of the edge increase and decrease in intensity while the STM tip
is scanning over the r-MoS2 nanoparticle, thus affecting the bright brim of the edge. We suggest
that this lateral displacement of the molecule is due to van der Waals forces exerted between the
delocalized density of electrons in the aromatic ring (benzene and pyridine-type ring) and the S-
edge, or with S-H groups located at the S-edge. Interestingly, the intensity of the protrusion
located in the middle of the S-edge never changes its intensity even when the molecule moves to
one side or to the other. This indicates the high stability of the quinolinium ion formed at this
position, which could be functioning as the central axis of this translation (see video1in ref.
[85])1.
Therefore, the dynamics of the quinolinium ion cause the simultaneous blockage of three
of the active sites located at the S-edge, sites highly catalytic for the prehydrogenation steps in
HYD reactions. This lateral displacement along the S-edge explains the strong inhibitory
character of this molecule compared to pyridine, which only interacts with two Brønsted acid
sites.
1 The video can be requested via email to: [email protected]
Page 71
5. Adsorption of nitrogen-containing molecules on r-MoS2 and r-CoMoS nanoparticles
59
Figure 5.7 Oscillated adsorption mode of quinoline on r-MoS2 nanoparticle. (a) and (b) Consecutive STM images
(38 x 38 Å2) of a r-MoS2 nanocluster after dosing quinoline at 300 K. (c) Line scans over the S-edge in (a) and (b)
showing the variations in height. (d) Ball model representations of the oscillated adsorption mode on the S-edge.
5.2.3 Adsorption of pyridine on r-CoMoS nanoparticles
It is known that the concentration of Brønsted acid sites in this catalyst depends on the
presence and nature of the promoter. Therefore, it is fundamental to reveal the coverage of these
sites present on the r-CoMoS catalysts and the role they play on the adsorption of N-containing
molecules. However, as we showed in Chapter 4, the S-edges seem to exhibit different
compositions and their direct interpretation from the STM images has not been an easy task. In
this section we use the small molecule of pyridine as a probe, to better clarify and reveal the
composition of the edges and the inhibitory effect of these molecules on the S-edge.
Firstly, s-CoMoS nanoparticles not treated in H2 were exposed to pyridine vapors. The
experiments revealed that the pyridine molecules are not adsorbed or protonated on the S and
Page 72
5. Adsorption of nitrogen-containing molecules on r-MoS2 and r-CoMoS nanoparticles
60
Mo-edges. In order to test if the activation of the catalyst is caused by the reductive conditions of
the H2 treatment, STM experiments were carried out with r-CoMoS nanoparticles.
The atom-resolved STM image in Fig. 5.8a shows a r-CoMoS nanoparticle after exposure
to pyridine vapors. The nanoparticle exhibits edge positions at the S-edge 1 that are imaged as
faint protrusions and the strongly intense brim region adjacent to the S-edge protrusions is now
quenched to lower height values than the basal plane position. In Chapter 4, this type of edge
structure was assigned to the 50% S coverage, where the S monomers are possibly bonded
towards the substrate. The S-edge 2 shows similarities to the behavior observed previously for
the adsorption of pyridine on r-MoS2 nanoparticles: an apparent distortion of the metallic brim,
accompanied by the intensity increase of two protrusions on the S-edge and location of an extra
protrusion outside the S-edge assigned to pyridinium ion. The distortion of the brim is reflected
as a modification of the metallic states near the edge (indicated with a black arrow) probably
related to the adsorption of the cation (PyrH+). S-edge 3 appears to have a similar appearance to
those containing 50% S with H adsorbed as described in Chapter 4 and is therefore suggested to
be pyridine-free despite S-H availability. Fig. 5.8b shows a ball model representation of the r-
CoMoS nanoparticle structure with the presence of a pyridinium ion adsorbed on the S-edge 2.
The black circle indicates the site where the reduction of the brim intensity is observed and the
dashed black line shows the contour of the distorted brim. The location and nature of the H atom
at the S-edge 3 will be discussed later. In order to reveal the structural differences between these
three edges, line profiles have been traced across the edges from the MoS2 basal plane to the gold
substrate (see Fig. 5.8c) and their heights and characteristics are shown in the graph depicted in
Fig 5.8d. As shown in this graph, the profiles differ significantly from one another. The linescan
of S-edge 1 is very characteristic to the one assigned to the S-edge with a 50% S, showing a
gradual decrease from the basal plane to the edge with the absence of the characteristic brim of a
metallic edge. The profile crossing S-edge 2 shows an extension in its length due to a protrusion
with an apparent height of 1.2 Å, located outside the edge. The brighter protrusions on this S-
edge show a height increase of up to 1.8 Å and a decrease of the original brim intensity behind
them. The height difference of 0.6 Å for the two protrusions on the S-edge corresponds to the
one observed for the adsorption of pyridinium ions on the S-edge in the r-MoS2. The distance
between the crest on the S-edge 3 and the edge of the protrusion outside the S-edge is 5.1 Å,
matching the size of the pyridine molecule. This suggests its adsorption in a flat configuration on
the S-edge. For the case of the line crossing the S-edge 3, this shows a brim intensity of 1.8 Å
and the height of the S-edge is approximately 1.2 Å relative to the gold substrate. The brim
intensity of S-edge 3 and the new bright protrusions on the S-edge 2 present the same height
values and their separation is close to 3.2 Å, the interatomic distance between S and Mo atoms in
the crystal structure of MoS2. The image superimposed on the graph shows the adsorption
configuration of the pyridinium ion on the S-edge 2.
Page 73
5. Adsorption of nitrogen-containing molecules on r-MoS2 and r-CoMoS nanoparticles
61
Figure 5.8 Adsorption of pyridinium ions on r-CoMoS nanoparticle. (a) and (c) STM images (42 x 42 Å2) of a r-
CoMoS nanocluster after dosing pyridine at 300 K. (b) Ball model representations of the pyridinium adsorption on
the S-edge showing the distortion contour of the brim. (d) Line scans over the S-edges in (c) to calculate the size of
pyridinium ion and distance between the brim on S-edge 3 and bright protrusions on S-edge 2.
Surprisingly, pyridinium ions present characteristic dynamics in their manner of
adsorbing onto r-CoMoS nanoparticles (as illustrated in Fig. 5.9, the ball model representations
of the images are shown below them), different from the ions adsorbed on the S-edges for the r-
MoS2 nanoparticles. In Fig. 5.9a the nanoparticle described above is shown with the apparent
adsorption of only one pyridinium ion (P1). However, during the repetitive scanning cycles on
the same nanoparticle, the appearance of a second ion (P2) adsorbed on the S-edge 3 is observed
(shown in Fig. 5.9b). In this case the formation of the pyridinium ion seems to occur on a single
S-H group and for this type of adsorption the brim is slightly decreased at two different
positions: one corresponding to the brim of the S-edge and the other to the brim corner shared
with the Mo-edge (marked with white dashed lines and black circles in the ball-model
representation of the STM image). The S-edge 1 remains unreacted over time, reflecting its low
affinity for the adsorption of pyridine molecules and its conjugated protonated ions. In Fig. 5.9c
Page 74
5. Adsorption of nitrogen-containing molecules on r-MoS2 and r-CoMoS nanoparticles
62
the nanoparticle is shown without the apparent adsorbed ions on the S-edges 2 and 3. We suggest
that the adsorbed ions are in a temporary state of a reversible flipping mechanism, which allows
us to visualize the possible location of the sulfohydryl groups on the S-edges (marked with
asterisks in Fig. 5.9c). This reversibility of the cations may consist in a constant rotational
movement on the adsorption sites, but not delocalized along the sulfur edge (see video 2 [85])2.
Different views of the proposed interaction and rotation for the pyridinium ion for the S-edge 2
are illustrated in Fig. 5.10. Fig.5.10a shows the angular configuration of this reversible flipping.
The cation would be in a rotation from 1 to 2: from the supposed flat adsorption on the S-edge to
the adsorbed configuration on the brim sites with the N-H bond pointing towards the S atom,
These two adsorption configurations were proposed by DFT calculations [41] as the most stable
adsorption structures for the pyridinium ion with binding energies (BE) of -0.7 and -0.76 eV, for
positions 1 and 2, respectively. However, we propose for the first time this flipping mechanism
between these adsorption structures for the pyridinium ions on the Co-promoted S-edge with H
adsorbed. The possibility of the cation rotating 180º, from 0 to 2, cannot be ruled out considering
the geometric features related to the pyridine ring observed at the same apparent height of the S-
edge. Fig. 5.10b and c show a side and top view of the proposed rotational movement of the
cation on the S-edge. We have also observed that the flipping rate of the molecules depends on
the length of the non-quenched S-edges and therefore on the number of adsorbed H atoms. Based
on sequential images obtained on r-CoMoS nanoparticles with different S-edge lengths after
exposure to pyridine vapors, we have concluded that the cations have a higher flipping rate when
they are adsorbed on a two-atoms-long S-edge than when they are adsorbed on longer S-edges.
Therefore, for the case shown in Fig. 5.9, we believe that the P2 is interacting with only one S-H
group and P1 with two S-H groups, with the flipping rate possibly reflecting the cations’
adsorption energy. As we will see in the next section, we propose that there is a S-H group
availability trend with the increasing length of the S-edge for the r-CoMoS nanoparticles. It is
also important to note that this proposed reversible flipping mode of the cations was not
observed for the pyridinium ions on r-MoS2 nanoparticles, where the ions were always adsorbed
parallel to the surface on the S-edge or moving freely along the edge. The absence of the
reversible flipping mode for the r-MoS2 nanoparticles may be due to the fact that there is no
rotational angle of 45º between the edge and brim, since the S-edge presents a 100% S coverage
plus adsorbed H atoms. As such, this case is different to the S-edge of r-CoMoS nanoparticles,
where the S-edge coverage is 50% S partially covered by H atoms.
2 The video can be requested via email to: [email protected]
Page 75
5. Adsorption of nitrogen-containing molecules on r-MoS2 and r-CoMoS nanoparticles
63
Figure 5.9 Reversible flipping mode of pyridinium ions. STM images (42 x 42 Å2) of a r-CoMoS nanoparticle
acquired consecutively and their ball model representations showing (a) the appearance of one P1 ion, (b) P1 and P2
ions and (c) the disappearance of P1 and P2 by the reversible flipping mode. The asterisks point to the possible
location of S-H groups on S-edge 2 and S-edge 3.
Figure 5.10 Ball model representation of reversible flipping mode of pyridinium ion. (a) side view in the [2-110]
direction of a r-CoMoS nanoparticle showing the 180º rotational angle of the ion from. (b) side view in the [01-10]
direction showing two S-H groups. (c) top view.
Page 76
5. Adsorption of nitrogen-containing molecules on r-MoS2 and r-CoMoS nanoparticles
64
In-situ experiments were carried out by scanning several nanoparticles before admitting
pyridine in the chamber and sequentially, by keeping the STM tip scanning on a specific area,
and dosing pyridine vapors while the tip continued scanning. These experiments allow for the
real-time detection of the preferential sites for adsorption of the pyridine molecule on the
r-CoMoS nanoparticles. Here we have chosen an area of the sample containing r-CoMoS
nanoparticles with different edge structures, in order to check the reactivity of these edge sites
using the probe molecule. Fig. 5.11a and b show the representative area before and after dosing
pyridine molecules. Three nanoparticles, N1, N2 and N3, exhibiting different S-edge
compositions ranging from 50% S coverage to 50% S with H adsorbed, were analyzed. We
observed that the quenched edges of the nanoparticles, characterized by the absence of a metallic
brim (N1 contains three quenched edges), are unaltered by the pyridine molecules. This confirms
that the interaction of pyridine molecules with S monomers is very weak even when the Co
atoms show CUS sites for adsorption. Furthermore, under the hypothesis that the pyridine reacts
strongly with the S-H groups, this experiment confirms the absence of H bounded to the S atoms
of the quenched S-edges since there is no evidence of any further pyridine protonation on these
sites. However, the N3 nanoparticle, which has only one quenched edge, shows protonation of
the molecules on the other two S-edges; due to the reversible flipping mode of the cations, only
one S-edge is showing a pyridinium ion in Fig. 5.11b. The changes on the S-edge are shown with
green arrows in Fig. 5.11a and b, where there is an increase in the height of two S atoms located
on the edge, as described in the previous sections (see zoom-in of the nanoparticle N3 in Fig.
5.11c and d). This increase is always accompanied by a reduction of the brim site shown with a
black dashed arrow in Fig. 5.11d.
Experimentally, the in situ measurements revealed that the pyridine molecules seem to be
protonated by the sulfohydryl groups formed on some of the S-edges of r-CoMoS nanoparticles.
Also, we observed that the pyridine molecule does not react with the Mo and S-edges that
hypothetically present only a 50% reduction of in the S coverage, without any adsorbed H.
5.2.4 Length-dependent adsorption of pyridinium ions on S-edges
A more detailed STM images and ball-model representations of the adsorption of
pyridinium ions on r-CoMoS nanoparticles with different S-edge lengths are shown in Fig. 5.12.
Here, for nanoparticles with S-edges of two to six sulfur atoms, the adsorbed pyridinium ions
(marked with green dashed semicircles) are shown to occupy certain positions along the edges.
Page 77
5. Adsorption of nitrogen-containing molecules on r-MoS2 and r-CoMoS nanoparticles
65
Figure 5.11 In-situ adsorption of pyridinium ions (a) before and (b) after dosing pyridine molecules while the STM
tip was scanning over three r-CoMoS nanoparticles, N1, N2 and N3. The green and red lines show the changes on
the S-edge and brim, respectively. Zoom in of the nanoparticle N3 (c) before and (d) after dosing pyridine. Black
arrow indicates the extinction of the bright brim site.
Page 78
5. Adsorption of nitrogen-containing molecules on r-MoS2 and r-CoMoS nanoparticles
66
Figure 5.12 STM images of r-CoMoS nanoparticles with different S-edge lengths showing the
adsorption sites of pyridinium ions
These positions may be related to the distribution of S-H groups. For example, for six-atoms-
long S-edges, a maximum amount of two pyridinium ions is found; one of them is flipping. By
shortening the S-edge, the number of cations adsorbed is decreased. The characteristic
occupancy distribution of the cations on the S-edge is presented in Fig. 5.13. This shows the
amount of pyridinium ions and therefore the expected maximum number of S-H group on the S-
edge considering, as our assumption states, that a single pyridinium ion interacts with two S-H
groups. However, as we have observed in the previous sections, for the case of two-atoms-long
S-edges, the cations seem to interact only with one S-H group.
It is surprising that even though there are sites available for the adsorption of more
pyridine molecules, the cations coverage is relatively low especially for the edges longer than
four S atoms. For these S-edges, we observed that the molecule is never adsorbed at the ends of
the edge near the corners. Instead we note that these atoms are imaged with a faint contrast in the
STM images when compared to their neighboring S atoms on the S-edge. This could be related
to a relaxation effect of the S-edge, caused by the gold substrate; this effect distributes the
proposed S-H groups in middle positions where the formation of pyridinium ions occurs. This
rearrangement of the S-edge may be affected by the gold substrate, which may have a different
effect depending on the length of the S-edge: The edges with three or two sulfur atoms have a
different distribution and localization of S-H groups. For these edges the formation of pyridinium
ions occurs on positions near the corner. In addition to this, the steric effects of the molecule
Page 79
5. Adsorption of nitrogen-containing molecules on r-MoS2 and r-CoMoS nanoparticles
67
must be considered, which also prevents the adsorption of other inhibitors in the remaining
available active sites, causing a little poisoning on the S-edge.
Figure 5.13 Pyridinium ions counted as function of the S-edge length showing the possible number of S-H groups
located for the adsorption configuration considered.
The ball-model representations that explains the graph shown in Fig. 5.13 and
summarizes the observations made after the exposures of pyridine onto the r-CoMoS
nanoparticles is depicted in Fig. 5.14. This representation shows, through lateral and top views,
the suggested distribution of the S-H groups and the proposed sites for the adsorption of the
cations along different S-edge lengths. Furthermore, it is worth mentioning that for the 5S-edge
the possible availability of one unbounded S-H group does not represent a favorable site for the
formation of any other pyridinium cation. This may be due to a steric effect of the pyridine
molecules, which in principle must be separated by at least two S atoms. Therefore, it is possible
that the poisoning depends on the length of the S-edge in the Co-promoted MoS2 catalyst,
leaving active sites available for the HDS of other S-containing molecules or simply passivating
the edge. In addition to this, the availability of edges that are completely unaltered by pyridine
molecules, both the S-edges with 50% S without H and the Mo-edges, could explain why
complete poisoning in the HDS reactions of molecules such as thiophene and DBT with pyridine
was not achieved [86-88]. These results indicated that two different sites for HDS are present,
one which is poisoned by pyridine and one which is not [87,89]. The adsorption of these two
sulfur compounds on r-CoMoS nanoparticles will be discussed extensively in Chapter 7.
Page 80
5. Adsorption of nitrogen-containing molecules on r-MoS2 and r-CoMoS nanoparticles
68
Figure 5.14 Ball-model representations showing the location and number of pyridinium ions as function of S-edge
length for edges containing from 6 to 2 atoms S atoms.
Page 81
5. Adsorption of nitrogen-containing molecules on r-MoS2 and r-CoMoS nanoparticles
69
5.2.5 Adsorption of quinoline on r-CoMoS nanoparticles
The use of bigger molecules, such as quinoline, composed of a benzene ring fused with a
five-carbon ring, makes the detection simpler under the STM tip. Experiments performed by
exposing s-CoMoS nanoparticles to even large amounts of quinolone molecules did not show
any adsorption or protonation on the Mo- or the S-edges. This could, in principle, be related to
the edge structure of the s-CoMoS nanoparticles, resulting from the high H2S partial pressures
used during the synthesis. We proposed that the S- and Mo-edges of the s-CoMoS nanoparticles
are fully covered by S atoms without apparent the formation of S-H groups. This scenario of the
edge structure does not allow the adsorption of protonation of the quinoline molecules since the
Co and Mo atoms are already six-fold coordinated to S atoms.
The quinoline molecule was exposed to the r-CoMoS nanoparticles and the results are
similar to those obtained for the r-MoS2. The quenched edges do not show any noticeable
adsorption or protonation of the quinoline molecule, supporting the hypothesis that H atoms are
absent on these edges. However, adsorption on the some of the S-edges is observed. A r-CoMoS
nanoparticle after exposure to quinoline vapors is shown in Fig. 5.15. Here, the S-edge 1 (see
dashed green semicircles in Fig. 5.15a) shows the possible formation of a quinolinium ion.
Similarly to the S-edge on the r-MoS2, two protrusions on the S-edge show an increased
intensity, accompanied by a decrease of the brim located behind them (see circle in Fig. 5.15b).
The distortion of the brim (highlighted by the dashed black lines in Fig. 5.15b) appears to be the
characteristic in the adsorption of these nitrogen-containing molecules, indicating that they can
modify the electronic edge states of the catalyst. Height profiles traced from the basal plane to
the gold substrate, crossing S-edge 1 and 2 (shown in Fig. 5.15c), are depicted in Fig. 5.15d.
Here, there is a 3.2 Å difference between the crests of both profiles, corresponding to the
distance of between two S atoms in the MoS2 unit cell. Additionally, the distance between the
bright protrusions generated at the S-edge and the protrusion related to the adsorbed specie
corresponds to the 5.1 Å distance, similar to the transversal length of a pyridine molecule. This
makes it possible to identify the quinolinium ions near the S-edge, as illustrated by the figure
superimposed in the graph.
A high percentage of the quinolinium ions present a similar dynamic as those previously
studied on r-MoS2 nanoparticles. An example of the quinolinium ions movement is shown in Fig.
5.16a. When plotting a height profile over the quinolinium ion, it can be seen that its length
(quinoline (D) in Fig. 5.16b) is slightly larger than the lateral length of a quinoline molecule
(quinoline (S) in Fig. 5.16b). The difference corresponds to 3.1 Å, the distance between two S
atoms on the edge. This suggests that the quinolinium ion is in constant lateral movement or
pivoting on the central atom of the S-edge 1. This can be understood due to the interaction of not
only the lone electron pair of the N atom, but also the effect of delocalized π electrons of the
aromatic ring. The π cloud of electrons is larger for heavier heterocyclic nitrogen compounds as
Page 82
5. Adsorption of nitrogen-containing molecules on r-MoS2 and r-CoMoS nanoparticles
70
Figure 5.15 Adsorption of quinolinium ions on r-CoMoS nanoparticle. (a) and (c) STM images (40 x 40 Å2) of a r-
CoMoS nanocluster after dosing quinoline at 300 K. (b) Ball model representations of the pyridinium adsorption on
the S-edge showing the distortion contour of the brim. (d) Line scans over the S-edges in (c) to calculate the
transversal length of quinolinium ion and distance between the brim on S-edge 2 and bright protrusions on S-edge 1.
quinoline and the delocalized electrons occupy a space that includes the benzene ring and the
pyridine-type ring in this molecule. The difference between Fig. 5.17 a and b lies in the presence
or absence of brighter protrusions on the S-edge (see white dashed arrows which show the
direction of the movement), which distort the metallic character of the edge in the middle and
behind these two sites, as explained above. Ball-model representations of two static situations of
this movement are illustrated in Fig. 5.17c-d. Here, the quinolinium ion is located in two distinct
positions separated by one S atom distance, which corresponds to the distance between the H
atoms H-7 and H-3 in Fig. 7.18c and Fig. 7.18d, respectively. This interaction near the central S
atom on the edge may be related to the presence of a S-H groups interacting with the lone
electron pair of the N atom and the delocalized electrons on both sites of the heterocyclic
compound. However, it is also possible that the delocalized electrons interact with the S-edge
atoms and the brim by means of van der Waals forces.
Page 83
5. Adsorption of nitrogen-containing molecules on r-MoS2 and r-CoMoS nanoparticles
71
Figure 5.16 Lateral movement of quinolinium ion. (a) STM image (42 x 42 Å2) of a r-CoMoS nanoparticle with a
quinolinium ion adsorbed. (b) Longitudinal distances for a single quinoline molecule (Quinoline (S) and an
oscillated ion (Quinoline (D)).
Furthermore, these quinolinium ions do not show a reversible flipping mode from the S-
edge to the brim sites, which is probably related to a strong interaction with the S-edges in the
flat adsorption configuration.
Figure 5.17 Lateral movement of quinolinium ion. (a) and (b) consecutive STM images (24x14 Å2) of a r-CoMoS
nanoparticle after dosing quinoline at room temperature showing the lateral movement of the quinolinium ion on the
S-edge. (c) and (d) Ball model representations of two static cases of quinolinium kinetics showing two different
positions along the S-edge.
5.3 Conclusions
The main result in this chapter is elucidating the active sites where the pyridine and
quinoline inhibitors are adsorbed on the r-MoS2 and r-CoMoS nanoparticles. From STM images,
we demonstrated that pyridine and quinoline are adsorbed only on the S-edges in the form of
Page 84
5. Adsorption of nitrogen-containing molecules on r-MoS2 and r-CoMoS nanoparticles
72
pyridinium and quinolinium ions. Important differences in the hydrotreating processes were
explored in both catalysts. For the case of pyridine on r-MoS2, static and dynamic adsorption
along the edge was observed, depending on the amount of available H atoms adsorbed on the S-
edge. The absence of a reversible flipping mode for the pyridinium ions on r-MoS2 may be due
to the fact that there is no rotational angle between the edge and the brim, related to a 100% S
coverage for the S-edge. Additionally, the electronic structure near the S-edge, as observed in
STM images, is significantly perturbed after the pyridine exposures. For the case of pyridine on
r-CoMoS, the cations were seen to rotate up to 180º over the N atom between the S-edge and the
brim sites. This proposed reversible flipping mode depends on the length of the S-edge and thus
the amount of S-H groups present. Important aspects regarding the reaction with the probe
molecule were investigated, as well as certain trends related to the distribution of the S-H groups
and the number of pyridinium ions found on different S-edge lengths, which may hold the key to
a better understanding of the inhibitory character of the pyridine molecules on the Co-promoted
S-edge.
The STM provided atomic scale proof that the proposed reduced S-edges, without H and
Mo-edges reduced to the 50% S coverage, do not facilitate the adsorption or protonation of
pyridine molecules. This effect may have different explanations, among which the role that the
Au(111) substrate plays in the bonding of the remaining terminal S atoms on the 50% S covered
edge for r-CoMoS nanoparticles. However, this attraction is not observed on the 50% S Mo-
edge, which has the same low reactivity with the small probe molecule of pyridine as the
quenched S-edge in r-CoMoS nanoparticles. If both Mo and Co atoms on the edges are
uncoordinated, they may be weak Lewis acid sites since pyridine molecules are not adsorbed on
these sites. Therefore, I conclude that pyridine molecules are probing Brønsted acid sites. Those
acid sites were analyzed in Chapter 4 and were suggested to be sulfohydryl groups formed after
the reduction in H2.
For quinoline molecule on r-MoS2 or r-CoMoS nanoparticles, no differences were
observed between the two cases. However, we found that the dynamic of quinolinium ions
causes the blocking of at least three sites on the S-edge. The nature of this lateral movement may
be related to the interaction of the delocalized π electrons of the aromatic ring and the lone pair
electrons of the N atom with the edge, probably polarizing both sides of the heterocyclic
molecule sequentially. The experiments carried out on s-CoMoS nanoparticles demonstrate that
quinoline molecules are not adsorbed or protonated on any of the S or Mo-edges, suggested to
have 100% S coverage.
For further insight, the studies may be extended by e.g. aid of theoretical input, which
could provide conclusive information on a number of issues, such as the adsorption energy of the
pyridine molecules between two S-H groups, exact chemical configuration of adsorbed quinoline
species on three sites on the S-edge, and possible STM simulations of the reduced nanoparticles
supported on gold with the adsorption of pyridine and quinoline on the S-edge.
Page 85
Chapter 6
6 Thiophene adsorption on r-MoS2 nanoparticles
This chapter will present the adsorption of thiophene molecules on individual sulfur
vacancies located on the Mo-edge of r-MoS2 nanoparticles. Modelling has been performed in
close collaboration with Prof. Srinivas Rangarajan and Prof. Manos Mavrikakis from the
University of Wisconsin in United States of America. The work presented in this chapter is in
preparation for publication as paper III.
Page 86
6. Thiophene adsorption on r-MoS2 nanoparticles
74
A better understanding of how r-MoS2 nanoparticles interact with aromatic sulfur compounds is
of vital importance since it can provide fundamental insight into the nature of the active sites in
HDS catalysis. The detailed description of the atomic edge structure and shape modification of
MoS2 nanoparticles after the reductive treatment in molecular hydrogen opens up new
possibilities for experiments in which the STM can be used to pinpoint particularly attractive
sites with an elevated chemical activity for the coordination of adsorbates.
The thiophene molecule (C4H4S) is often used as a probe molecule to test the HDS
activity of catalysts. A ball model and the skeletal representation of thiophene are illustrated in
Fig. 6.1. The molecule has a planar pentagonal structure in which four carbon atoms and sulfur
atom are in sp2-hybridized state. This five-membered aromatic heterocycle is relatively inert,
difficult to reduce and the aromatic ring makes its C-S bonds quite resistant to rupture [5]. The
desulfurization reactions of this molecule are much more difficult than those for other sulfur-
containing molecules such as thiols, sulfides and disulfides that readily undergo
hydrodesulfurization.
Despite the enormous efforts devoted to theoretical and experimental works on HDS of
thiophene [5,48,90], a full explanation of the nature and availability of the active sites still awaits
to be formulated. The reaction mechanism and kinetics are also not completely understood, but it
has been proposed that hydrodesulfurization of thiophene may proceed by two independent
routes: a) the direct desulfurization (DDS) pathway which involves the hydrogenolysis of the C-
S bond [91,92] or b) the hydrogenation pathway (HYD) where thiophene adsorption parallel to
the catalyst surface is followed by hydrogenation and further C-S bond cleavage [5,93].
Recently, DFT calculations on the HYD and DDS pathways of thiophene over the S and
Mo-edges of hexagonal MoS2 nanoparticles have demonstrated that the HYD reaction pathway
could proceed with a mild reaction barrier at the S-edge with the creation of sulfur vacancy. The
DDS pathway with lower reaction barriers was found to be favored at the Mo-edge with sulfur
vacancies [94]. In addition, calculated formation energy of an individual S vacancy or CUS site
on MoS2 was reported in previous studies by Paul et al. [95]. It was demonstrated that the S
vacancy creation on the Mo-edge by H2 to release H2S is very endothermic.
Investigations on the atomic scale for the interaction of thiophene molecules with r-MoS2
nanoparticles revealed, among other, the direct coordination of the S heteroatom of thiophene to
one or more undercoordinated Mo atoms [96]. However, the insufficient quality of the STM
images acquired at low temperature impeded the identification of the adsorbed species on the
triangular s-MoS2 nanoparticles treated in atomic hydrogen.
A more substantiated and direct investigation of the coordination and possible
hydrogenation of thiophene on the sulfur vacancies or S-H groups seems to be a prerequisite for
a detailed elucidation of the active sites of this catalyst. In this chapter, the interaction of the
thiophene molecules with r-MoS2 nanoparticles is investigated directly on the atomic scale.
Page 87
6. Thiophene adsorption on r-MoS2 nanoparticles
75
Figure 6.1: Ball model of the thiophene molecule (H: gray, C: brown and S: yellow) and skeletal representation of
the H, C and S atoms in the structure (M = 84.1 g/mol). At room temperature, thiophene is a colorless liquid
(mp= -38.2 ᴼC) and its vapor pressure is approximately 133.3 mbar.
6.1 Experimental details
The starting point is the synthesis of the well-characterized s-MoS2 nanoparticles grown
on a clean gold substrate by using the standard preparation method (Section 2.4.2). In order to
convert the nanoparticles to their active states, the sample was reduced in a molecular hydrogen
atmosphere as described in Section 2.4.4. The thiophene (99% Aldrich) vapor was then admitted
to the UHV chamber through a leak valve connected to a long stainless steel tube. The sample
was exposed to thiophene at three different substrate temperatures: 300 K, 400 K and 650 K; a
background pressure of 1.0×10⁻⁷
mbar was used for 5 minutes during the molecular dosage. After
each thiophene exposure, the sample was cooled down to room temperature and transferred to
the STM for a local inspection. Finally, the resulting sample was exposed again under a
reductive H2 atmosphere.
6.2 Sulfur vacancy coverage on r-MoS2 nanoparticles
In Chapter 4, we demonstrated that hydrogen induces a crystal reshaping and edge
structure modification of the s-MoS2 nanoparticles. We assigned the location of individual S
vacancies to atomic positions along the Mo-edge imaged with a depleted intensity (see red
arrows in Fig. 6.2a) and the S-H groups to the brightest protrusions on the S-edge. We found that
the r-MoS2 nanoparticles can adopt multiple shape conformations, all governed by the MoS2
symmetry in which the Mo-edge is typically between four to six-atoms-long (see Fig. 6.2b).
Page 88
6. Thiophene adsorption on r-MoS2 nanoparticles
76
Figure 6.2 (a) Atom-resolved STM image (54 x 54 Å2) of a r-MoS2 nanoparticle (Vt =-0.322 V, It = -0.420 nA). (b)
Length distribution for the Mo- and S-edges of r-MoS2 nanoparticles. (c) Ball-model representation of three Mo-
edges (50% S) of different lengths showing the letter assigned to the S atom or vacancy along the edge.
In this section, we will use a statistical study to analyze, based on the data shown in Fig.
6.2b, the coverage of individual S vacancies at the Mo-edge after the reduction in H2. In order to
obtain the lowest possible statistical error, the analysis shown here corresponds to the coverage
of S vacancies only for the four (Mo-4S), five (Mo-5S) and six (Mo-6S) S-atoms-long Mo-edges.
In addition, we have assigned the following letters to the S vacancies located at positions on the
corner (C), adjacent corner (A) and in the middle (M) of the Mo-edge, as shown in Fig. 6.2c. It is
noted in Fig. 6.2c that the number of S vacancies for positions A and M varies depending on the
length of the Mo-edge. Therefore, in the analysis μ corresponds to the number of S atoms
available for the formation of S vacancies per each position (C, A or M) for different edge
lengths (i) as shown in Table 1.
Page 89
6. Thiophene adsorption on r-MoS2 nanoparticles
77
Table 2. Number of S atoms (μ) at each atomic position for different Mo-edge lengths.
Experimentally, the total coverage of vacancies is obtained by dividing the number of S
vacancies counted at positions C, A and M, depending on the length of the edge (i) to the total
amount of S atoms corresponding to those positions C, A and M (μ) per each edge length. The
total S vacancy coverage is depicted in Fig. 6.3. We observe that the coverage of isolated S
vacancies is very low at the Mo-edges. This suggests that, once the edge is reduced to 50%, the
subsequent removal of S atoms from the edge requires a higher energy cost [97]. Here, the most
stable situation for the formation of a S vacancy corresponds to the removal of an S atom for the
adjacent corner position, where the coverage is of approximately 0.25. This is illustrated in the
STM image shown in Fig. 6.2a. Also, we observe that the amount of S vacancies at the corners is
very low, indicating the high stability of the S atom at the crystal corner so this atom is not easily
removed by reduction with hydrogen at high temperatures. However, we note that the amount of
S vacancies is not the same for all the Mo-edges in the same r-MoS2 nanoparticle. This may be
related to the non-thermodynamic equilibrium of our system.
6.3 Thiophene adsorption on the r-MoS2 nanoparticles
To test the affinity of the r-MoS2 towards adsorption of S-containing molecules,
experiments were conducted with thiophene as a probe molecule. Direct exposure at room
temperature on the r-MoS2 nanoparticles reveals significant changes on the edge structure of the
Mo-edges, as shown in Fig. 6.4. Here, the apparent increase of the S coverage for some of the
Mo-edges and the appearance of some specific features (indicated with yellow starts in Fig. 6.4)
suggest that the thiophene molecules are adsorbed on the CUS sites. On the other hand, the S-
edges do not show any evident electronic or topographic change in the adsorption of thiophene
molecules. We have suggested in the previous chapters that the S-edges of the r-MoS2
nanoparticles have 100% S coverage, so the absence of S vacancies seems to impede the
interaction with the probe molecules.
Unfortunately, the clear distinction of individual molecules from the terminal S atoms at
the Mo-edge is challenging, since thiophene has a molecular size of 4 x 5 Å2, and possible
electronic effects that arise during the characterization would impede the intramolecular
visualization of the molecule using the STM technique.
i Mo-4S Mo-5S Mo-6S
S vacancy position M C M A C M A C
μ 2 2 1 2 2 2 2 2
Page 90
6. Thiophene adsorption on r-MoS2 nanoparticles
78
Figure 6.3 Isolated sulfur vacancy coverage of four- to six-S-atoms-long Mo-edges as a function of the S vacancy
position at M, A and C for r-MoS2 nanoparticles exposed to H2 at 673 K.
It is therefore ideal to carry out an analysis of the evolution of the S vacancy coverage
after exposing the thiophene molecules onto the r-MoS2 nanoparticles at different substrate
temperatures. This study is performed considering the same criteria used for the position of the S
vacancies and edge lengths described in the previous section.
Figure 6.4 Atom-resolved STM image (49 x 49 Å2) of a r-MoS2 nanoparticle exposed to thiophene molecules at
room temperature, indicating the position of individual molecules along the Mo-edge.
Page 91
6. Thiophene adsorption on r-MoS2 nanoparticles
79
6.3.1 Sulfur vacancy evolution on the Mo-edges of r-MoS2 nanoparticles
The evolution of the S vacancy coverage after dosing thiophene molecules onto r-MoS2
nanoparticles at 300 K, 400 K and 650 K is depicted in Fig. 6.5. This graph also includes the
results obtained prior to the thiophene exposure (dark blue bins) shown in Fig. 6.3.
By exposing thiophene at room temperature, clear variations in the S vacancy coverage
are observed (light blue bin). Surprisingly, the number of S vacancies at position M does not
change significantly, whereas the coverage at position A decreases from 0.27 to 0.18. In the case
of positions C, the vacancy drops 63% to levels close to zero. These changes demonstrate that
thiophene molecules may be occupying CUS sites at the Mo-edge, which seems to occur without
a substantial activation barrier, especially at position A.
Figure 6.5: Isolated sulfur vacancy coverage of four to six-S-atoms-long Mo-edges as a function of the S vacancy
positions at M, A and C for r-MoS2 nanoparticles exposed to H2 at 673 K, thiophene at 300 K, 400 K and 650 K and
post-annealed in H2 at 673 K.
The interaction of thiophene with the CUS sites at 400 K shows a decrease in the
coverage for all the positions. At this temperature, the corner sites seem to be almost fully
occupied by thiophene molecules. Here, the vacancies at A decrease more rapidly than at
position M. We suggest that this adsorption resistance at position M may be related to steric
Page 92
6. Thiophene adsorption on r-MoS2 nanoparticles
80
effects between the molecules and the terminal S atoms along the Mo-edge or a high energetic
activation barrier.
Experiments carried out at even higher temperatures (650 K, brown bins) show that the S
vacancy coverage decreases to 0.8, 0.7 and 0.02 for positions M, A and C, respectively. Based on
our observations, this reflects the fact that the r-MoS2 nanoparticles have recovered at least the
50% S coverage at the Mo-edge, since individual S vacancies are rarely found.
In order to demonstrate the catalytic cycle of MoS2, the sample exposed to thiophene at
650 K is treated in reductive H2conditions (Section 2.4.4), as shown in Fig. 6.5 (white bins).
Here, we observe an important increase of the S vacancy coverage for all the positons. In fact,
the increase in the coverage by the post-annealing in H2 corresponds to 0.07 and 0.16 for
positions M and A, respectively. The effectiveness of vacancy formation, which results from the
transformation of triangular s-MoS2 to r-MoS2 nanoparticles, cannot be compared with the
results obtained by the post-annealing in H2 of the sample exposed to thiophene since these two
processes are generated from two completely different initial states. This experiment provides
evidence that the molecular hydrogen treatment at relative high pressures and temperature can
create S vacancies directly on hexagonal r-MoS2 nanoparticles.
6.3.2 Length-dependent adsorption of thiophene on Mo-edges
In order to investigate the adsorption behavior as a function of the Mo-edge length, a
more detailed study of the occupancy of vacancies at C, A and M is performed. The S vacancy
fraction per each Mo-edge at different temperatures is depicted in Fig. 6.6. At 300 K, numerous
changes are observed in the evolution of the vacancy fraction, especially the decline of vacancies
at position C for all the edges represented in the graph. In the case of the shortest edges (Mo-4S),
the vacancies at the corner sites disappear completely whereas for the longest edges (Mo-6S) the
decrease is gradual. Surprisingly, for Mo-5S and Mo-6S edges the vacancy at position M does
not decrease and instead it slightly increased. However for position A, the decrease of the
vacancy fraction is significant for all the lengths. This suggests that some atomic rearrangements
along the edge may explain the generation of potentially new vacancies at room temperature. At
400 K, for the most representative edge namely the Mo-5S, a pronounced change occurs at
position A, where the coverage varies from 0.23 to 0.14, showing that these sites are preferable
for the adsorption of the molecule. However, it seems that the occupancy of S vacancies is
occurring at the expense of the formation of others at position M. In the case of position C, the
coverage is kept constant at much lower values. In addition, positions A and M for the Mo-6S
edge change by 0.03 and 0.08, respectively, while coverage reduction for the corners sites is also
noted.
Page 93
6. Thiophene adsorption on r-MoS2 nanoparticles
81
Figure 6.6: Sulfur vacancy fraction for four to six-S-atoms-long Mo-edges as a function of the S vacancy position at
M, A and C for MoS2 nanoparticles exposed to H2 at 673 K, thiophene at 300 K, 400 K and 650 K and post-
annealed in H2 at 673 K.
A temperature increase to 650 K during the exposure of the molecules, again leads to a
tendency towards decreased number of vacancies. As it was mentioned above, vacancies can be
generated again in the reductive H2 treatment as it is clearly shown in the graph plot as PostH2-
673K. In fact, the largest formation of uncoordinated sites occurs at position A for the Mo-5S
and Mo-6S edges where the increase in the S vacancy coverage is of approximately 0.17.
Therefore, we conclude from this study that: (a) at 400 K the occupancy of vacancies at
position A generates new vacancies at M for the Mo-5S edge and (b) the Mo-6S edge presents
the highest adsorption resistance for thiophene molecules at position M even at elevated
substrate temperatures. In order to visualize the possible effects occurring along the Mo-edges
during the thiophene adsorption, STM images will be shown in the next section.
Page 94
6. Thiophene adsorption on r-MoS2 nanoparticles
82
6.3.3 Morphological modifications on the Mo-edge
Apart from analyzing the evolution of the vacancies, it is also interesting to find
morphological changes and similarities in the structures, especially on the Mo-edges after the
thiophene exposure at room temperature. Analyzing the STM images, we find that the height of
the Mo-edges has changed and the appearance of some characteristic protrusions may indicate
the adsorption of individual thiophene molecules. These structural changes observed through the
STM studies are categorized in adsorption modes for a better description and understanding of
the vacancy evolution.
STM images acquired after dosing thiophene molecules at room temperature are shown
in Fig. 6.7. Here, we can identify representative Mo-edges which present the thiophene
adsorption modes. Line scans over those edges are shown in the center of Fig. 6.7. A ball-model
structure of the r-MoS2 nanoparticles exposed to thiophene is superimposed over the STM
images (right side of Fig. 6.7.) We divided the adsorption modes by groups and they correspond
to the Mo-edges I, II, II, IV, V and VI.
In general, the protrusions along the Mo-edges are imaged with a depleted or bright
intensity, differently from the appearance of the Mo-edges before the thiophene exposure (Fig.
6.2a). From the line scan along the Mo-edge I, a common feature with an apparent height of 0.8
Å (indicated with a yellow dot) is always accompanied by a decrease in the intensity for position
A and then an increase in the height for position C. This corrugation pattern will be commonly
observed for all edges. We speculate that it is related to the adsorption of thiophene molecules
along the Mo-edge, which may cause a displacement of S atoms to different positions.
In Fig. 6.7.b, the Mo-edges II and III, corresponding to two different adsorption modes,
are present in the same nanoparticle. Here, the Mo-edges have a different appearance from those
observed on fresh r-MoS2 nanoparticles. Bright protrusions covering most of the Mo-edges may
be related to the adsorption of thiophene molecules. The two line scans over the Mo-edges (II
and III) are traced from the corner atoms near the neighboring common S-edge. Firstly, on the
edge II there is a distinguishable feature with a height of approximately 0.8 Å, located between
two protrusions with an apparent height of 1.0 Å, similar to the height of the fully sulfided Mo-
edges. This feature is located in between two S vacancies, as shown in the ball-model
representation (see Y). At the edge III, a larger protrusion that appears to be positions on the
corner site is present.
Page 95
6. Thiophene adsorption on r-MoS2 nanoparticles
83
Figure 6.7: STM images (49 x 49 Å2) of r-MoS2 nanoparticles after exposure to thiophene at 300 K. The solid lines
mark the Mo-edges with characteristic adsorption modes: a) mode I, b) mode II and III, c) mode IV and V and d)
mode VI. Line scans of the Mo-edges with particular adsorption modes are shown (yellow dot indicates the position
of the thiophene molecule). The STM images with the superimposed nanoparticle lattice show the location of the
thiophene molecules with letters and yellow marks, and the displacement of the S atom out of the corner with blue
dashed curved lines.
Page 96
6. Thiophene adsorption on r-MoS2 nanoparticles
84
Furthermore, the Mo-edges IV, V and VI exhibit a similar corrugations pattern (see Fig.
6.7c-d). Here, the protrusions neighboring the site imaged with a faint intensity, S vacancy (Sv),
have apparent heights of approximately 0.8 Å (marked with a yellow dot) and 1.0 Å. This is
observed for the three Mo-edges. Although the Mo-edges IV and V seem to have certain
similarities, we observe that for the shortest edge (IV) there is a possible atomic displacement out
of the upper corner (indicated with a blue dashed semicircle in the ball-model representation in
Fig. 6.7c) that is not observed at the edge V, which is one S atom longer than IV. If a detailed
inspection is carried out on the Mo-edge VI, the same atomic displacement described for the Mo-
edge IV is observed (indicated with a blue dashed semicircle in the ball-model representation in
Fig. 6.7d); however, these two edges have different lengths.
Figure 6.8 Ball-model representation of a six-atoms-long Mo-edge showing the positions which correspond to the
corrugation pattern observed in the STM images for adsorption modes V and VI. The black arrow indicates the
displacement of the corner S atom.
The comparison between the Mo-edges V and VI is illustrated in Fig. 6.8. In the STM
images, we identified protrusions of 0.8 Å in different positions for these two Mo-edges. For the
Mo-edge V, the aforementioned protrusion is located at position A, while for the Mo-edge VI, the
feature is found at M1. This means that they are located on the adjacent corner positon and in the
middle of the edge, respectively. The 1.0 Å high protrusion on the Mo-edge V is at the position
M2, while for the edge VI, the bright protrusion is found at position A, close to the corner. For
the latter case, the protrusion on C is shifted out of the corner position (see Fig. 6.7d). In the case
that the 0.8 Å protrusion corresponds to a thiophene molecule adsorbed on the Mo-edge, it may
be shifting the neighboring S atoms to a different position, mainly due to steric effects.
In the assumptions described below, the changes observed on the edges will be
considered to be caused by geometric features because it is the most intuitive way to explain the
adsorption modes of thiophene on the Mo-edge. However, as we know, electronic effects may
also arise during the characterization and can affect the interpretation of the STM images.
Page 97
6. Thiophene adsorption on r-MoS2 nanoparticles
85
Representative ball-models for the previously described adsorption of thiophene on the
Mo-edges are illustrated in Fig. 6.9. Here, thiophene molecules are proposed to be adsorbed in
the η5 configuration [48] with the thiophenic ring parallel to the Mo-edge, which represents the
most energetically favorable adsorption geometry [98] and the most effective in activating
thiophene for both C-S bond breaking and hydrogenation [99].
Adsorption mode I shows a thiophene molecule occupying position X (see Fig. 6.7a).
Here, we suggest that the occupancy of a S vacancy by the thiophene molecule displace the
adjacent S atom to positions near or on top of the S atom on the corner site, forming a sulfur
dimer (see green ball on top the S atom) [33,36,41]. In the case of adsorption mode II, the
thiophene molecule seems to be occupying the site in between two S vacancies. The occupancy
of a corner site is illustrated by adsorption mode III. However, it is important to mention that the
probability of finding a S vacancy at the corner site is very low. Therefore, the number of
thiophene molecules found on these sites is lower than for positons A or M, as we observed in
the vacancy evolution after dosing thiophene molecules at room temperature.
Figure 6.9: Ball-model representation of the Mo-edge illustrating the adsorption modes of thiophene molecules at
300 K (red ball correspond to the sulfur atom shifted to position out of the corner and green ball represents the sulfur
atom moved on top of the adjacent atom forming a dimer). The arrows indicate the direction of the atomic
displacement.
Adsorption mode IV is represented by a thiophene molecule occupying a S vacancy at A
position, creating a possible new vacancy in the middle of the edge. This adsorption mode is in
agreement with the observations made on the S vacancy coverage for Mo-5S after dosing
thiophene, where the number of S vacancies at position A decreases. In adsorption modes V and
VI, the possible formation of S dimers occurs at positions A and M2. It was observed that the S
vacancy evolution for the Mo-6S at position A decreases with the interaction of thiophene
molecules; this indicates that the energy cost for displacing a corner S atom from its position is
Page 98
6. Thiophene adsorption on r-MoS2 nanoparticles
86
higher than that for adsorbing a molecule on the adjacent corner position. However, this depends
on the location of the original S vacancy on the Mo-edge.
6.3.4 DFT calculations on the adsorption of thiophene on r-MoS2 nanoparticles
In order to rationalize these hypotheses and further elucidate the adsorption configuration
of the thiophene molecules observed in the STM experiments, DFT calculations were recently
performed by S. Rangarajan at the University of Wisconsin in United States of America. In this
study, hexagonal MoS2 nanoparticles with only five-S-atoms-long Mo-edges were considered.
Although we have seen that the adsorption varies with the Mo-edge length, the adsorption
configurations shown in Fig 6.10 allow a better understanding of the possible mechanisms
involved in the interaction of thiophene with CUS sites located at different positions along the
Mo-edge.
Figure 6.10. DFT calculations on the adsorption of thiophene on S vacancies located along the five-S-atoms-long
Mo-edges. The nanoparticles show different adsorption configurations with their corresponding adsorption energies.
Black arrows indicate the formation of S dimers. Color scheme: violet, cobalt; cyan, molybdenum; yellow, sulfur;
gray, carbon; black, hydrogen.
Page 99
6. Thiophene adsorption on r-MoS2 nanoparticles
87
We conclude that the most stable adsorption structure of thiophene occurs on a S vacancy
located on the corner site (Fig. 6.10a). Experimentally, despite the small number of vacancies on
the corner, after dosing thiophene at room temperature the molecules first occupy those sites.
From the STM images, we assume that the adsorption mode II may correspond to this
configuration. Mode I can be represented by the adsorption of thiophene in the middle position
as shown in Fig. 6.10b; however, in the DFT calculations two vacancies were considered prior to
the adsorption of the molecule in this case. The adsorption of thiophene in the middle of two
vacancies through the direct interaction of the S heteroatom only with one Mo atom is also
calculated (see Fig. 6.10c). The result shows that the binding energy is very exothermic (-1.74
eV) at this position.
Interestingly, the adsorption of thiophene on the Mo-edge with only one CUS site located
at positon A or M, increases the adsorption energy. These adsorption modes are less favorable
because the steric effects that prevent thiophene to be adsorbed in a parallel configuration with
the Mo-edge. Considering the case shown in Fig. 6.10d, the adsorption of the molecule at
position A causes the displacement of the S atom located at M to a positions on top of the
neighboring atom, forming a S dimer (indicated with black arrows in Fig. 6.10) and generating
new S vacancies in the process. This configuration is in agreement with the S vacancy evolution
for Mo-5S, where the number of S vacancies at A is reduced at the expenses of the formation of
new vacancies at M. Also, this can explain the gradual increase of the S vacancies at position M
observed at 400 K.
Fig. 6.10e, f and g show the cases where the thiophene molecule alters the position of the
S atoms located along the Mo-edge, including those at the corners. We would expect that this
displacement of atoms from their original positions entails alterations in the electronic structure
of the edge, since the Mo atoms change their coordination (see Fig. 6.10f and g). The case shown
in Fig. 6.10e can explain the adsorption mode V. However, in the DFT calculations this edge is
only five-atoms-long.
Experimentally, we observe that those effects are probably combined i.e. the
displacement of the S atom to positions out of the corner sites, the creation of new S vacancies
and a possible formation of S dimers. Although the theoretical calculations do not coincide
perfectly with the experimental data, the analysis of the S vacancy coverage for all the edges
confirms that thiophene is adsorbed, affecting the edge structure probably through the relaxation
mechanism calculated by DFT.
Page 100
6. Thiophene adsorption on r-MoS2 nanoparticles
88
6.3.5 Thiophene exposures at high substrate temperatures on r-MoS2 nanoparticles
The STM images for the experiments carried out at high temperatures in thiophene
atmosphere and for the last post-annealing in H2 are illustrated in Fig. 6.11. The r-MoS2
nanoparticles exposed to thiophene at 400 K (see Fig. 6.11a) show S vacancies located at
position M that have not been filled by thiophene molecules. As shown in the line scan over the
Mo-edge (edge marked with a gray line), the protrusions present heights of approximately 0.6 Å
to 1.0 Å, which correspond to an intermediate occupancy of the Mo-edge between 50% and
100% S coverage. Thus, an increase of the reactivity between the thiophene molecule and the
Mo-edge is reached at 400 K. Fig. 6.11b shows the modifications observed in the nanoparticles
by increasing the substrate temperature to 650 K during the thiophene exposure. Surprisingly, the
Mo-edges have a similar appearance to the Mo-edges of the s-MoS2 nanoparticles. The line scan
traced over the Mo-edge shows protrusions with an apparent height of 1.0 Å, resembling the
height of the fully covered (100% S) Mo-edges with the formation of S dimers along the edge.
The decrease in the number of S vacancies at 650K to levels close to zero suggests that
the molecules are adsorbed on a different configuration or have been desulfurized. In the
literature, the desulfurization of the thiophene molecule on MoS2 has been extensively discussed
[5]. The hydrodesulfurization can occur through the direct extrusion of the S heteroatom via C-S
rupture or by hydrogenation. However, considering the absence of tetrahydrothiophene in the gas
phase, Startsev et al. [100,101] proposed a pathway for the desulfurization of thiophene directly
to butene. We demonstrated in Chapter 5 that pyridine and quinoline molecules did not interact
with the Mo-edges, indicating the possible absence of S-H groups. Nevertheless, the S-edges of
the r-MoS2 nanoparticles were found to present sulfohydryl groups. Therefore, in these
experiments, the desulfurization of the thiophene at high temperatures with the r-MoS2 catalyst
may occur on the Mo-edges directly to butene product [5]. However, we cannot discard the
possibility that H atoms are being transferred from the fully covered S-edges to the Mo-edges,
causing the rupture of the C-S bond through the DDS pathway. If the process occurs through this
reaction, the thiophene molecule has to be adsorbed on a CUS site prior to the hydrogenolysis.
The later sample was treated in H2 under the same conditions used for reducing the s-
MoS2 nanoparticles. The results obtained are shown in 6.11.c. In this case, the Mo-edges exhibit
protrusions that are imaged with a faint intensity. The line scan traced over the Mo-edge shows
that the average height corresponds to the 50% S coverage. Additionally, atomic positions
imaged with an even darker contrast indicate again the presence of individual S vacancies. It is
important to mention that the nanoparticles have not changed their shape in any of the processes
carried out here, which points to the high stability of the truncated triangles.
Page 101
6. Thiophene adsorption on r-MoS2 nanoparticles
89
Figure 6.11: STM images of MoS2 nanoparticles (2000 x 2000 Å2) after exposure to: (a) thiophene at 400 K and
(b) 650 K, and (c) H2 at 673 K. In the middle: Representative MoS2 nanoparticles for each experiment (56 x 56 Å2).
Right: line scans over the Mo-edges indicated with solid lines in the nanoparticles. Dashed lines in the graph show
the atomic height for the 100% S and 50% S coverage.
6.4 Summary
In this chapter, through STM experiments and DFT calculations, possible adsorption
configurations for the thiophene molecule on the r-MoS2 nanoparticles have been revealed at
room temperature along the Mo-edges. Studies carried out at high temperature have provided
information about the high reactivity of the Mo-edge with the thiophene molecules, which may
Page 102
6. Thiophene adsorption on r-MoS2 nanoparticles
90
play an important role in the desulfurization of small S-containing compounds. The post-
reduction of the nanoparticles exposed to thiophene at high temperature brought about an
advance in the understanding of the catalytic cycle of the MoS2 catalyst.
A general observation in this study is that the formation of the S vacancy strongly depends
on the length of the Mo-edge. Therefore, the edge length and nanoparticle size are fundamental
for the creation of active sites in the catalysts. A general tendency is that the vacancies on the
corners are the first to be filled, followed by the positions adjacent to the corner and finally the
vacancies in the middle of the edge. However, the adsorption of thiophene molecules entails the
possible formation of new vacancies sites, dimerization of S atoms and atomic displacements out
of the edge considered as part of the side effects generated by the thiophene molecule.
The gradual temperature increase during the exposure of the thiophene molecules recovers
the S coverage to values close to 100% for the Mo-edges, which suggests a possible direct
desulfurization of the molecule at 650 K. The creation of new S vacancies is possible by
reducing the sample again in a H2 atmosphere, showing the effective catalytic cycle of the MoS2
catalyst.
Page 103
Chapter 7
7 Adsorption of sulfur-containing molecules on
r-CoMoS nanoparticles
This chapter will present the affinity of r-CoMoS nanoparticles towards adsorption of
thiophene, DBT and 4,6–DMDBT molecules. The work presented in this chapter is in
preparation for publication as paper IV.
Page 104
7. Adsorption of sulfur-containing molecules on r-CoMoS nanoparticles
92
Hydrodesulfurization studies on both non-promoted and promoted MoS2-based catalysts
have shown that most of the catalytic activity is related to the presence of promoter atoms like
Co or Ni. The cobalt-decorated MoS2 phase was found to have an activity typically more than an
order of magnitude higher compared to non-promoted MoS2. Apart from the broad scientific
consensus that the promotion by Co or Ni increases the activity of the MoS2-based catalysts,
there is still much debate on the effect of promotion in the prehydrogenation steps and S-C
scission activity and resistivity towards inhibitors in HDS. In the literature, the promotional
effect has been proposed to be due to a variation in the binding energy of sulfur to the Co atoms,
weakening of the sulfur bond strength in the CoMoS structure and, hence, a corresponding
increase in the number of sulfur vacancies at the edges [42,102,103].
One of the major challenges for HDS is the removal of sulfur from sterically-hindered
sulfur-containing molecules since the sulfur position is spatially locked up by the functional
groups of the molecule. The desulfurization of these refractory compounds present in the oil feed
has received increased attention since the sulfur atom must be removed to fulfil the recent
environmental legislation for production of ultra-low sulfur transportation fuel. Currently, many
efforts are devoted to identifying the adsorption sites and active sites in the HDS for these
molecules, but it is of great importance to better understand the structure and morphology of the
MoS2 and CoMoS catalysts under HDS conditions in order to enhance the catalyst or find
alternatives to comply with the new requirements [10,104,105].
As mentioned in Chapter 6, the thiophene is a typical molecule used in HDS to test the
ability of a catalyst to remove S. The aromatic ring makes the C-S bonds quite stable and
therefore their desulfurization reaction is more difficult than for other sulfur containing
molecules such as thiols or SO2. Despite numerous efforts, the mechanisms and kinetics involved
in the desulfurization of thiophene are still under great debate in the literature
[5,71,101,106,107]. Most of disagreements are caused by the large amount of uncertainties
related to the nature and location of the active sites and the role that the intermediates play in the
reaction during the desulfurization process. The adsorption and desulfurization reaction
mechanisms have also been studied extensively by DFT calculations [41,42,48,58,94]. It was
found that Co-promotion on the S-edge increases the thiophene binding energy and reduces the
reaction barrier compared to the Mo-edge brim sites. The low barrier was suggested to be
associated to the more loosely bound H atoms on the S-edge on CoMoS nanoparticles, thus
making the S-edge suitable for both hydrogenation and C–S-scission steps [42].
Page 105
7. Adsorption of sulfur-containing molecules on r-CoMoS nanoparticles
93
Figure 7.1 (a) Ball model of the DBT molecule (H: gray, C: brown and S: yellow) and skeletal representation of the
H, C and S atoms in the structure (M = 184.26 g/mol) and (b) ball model of the 4,6-DMDBT molecule (H: gray, C:
brown and S: yellow) and skeletal representation of the H, C and S atoms in the structure (M = 212.31 g/mol). At
room temperature DBT and 4,6-DMDBT are a colorless crystals with a melting point of 100 and 153 °C,
respectively.
Most refractory compounds in the feed belong to the category of molecules called
dibenzothiophenes (DBT), which contain two benzene rings fused to a central thiophene ring.
This category includes the alkyl-substituted derivatives such as 4,6-dimethyldibenzothiophene
(4,6-DMDBT), having the methyl groups placed in the 4th
and 6th
positions of the molecule. A
ball model and the skeletal representation of DBT and 4,6-DMDBT are illustrated in Fig. 7.1.
The low reactivity of DBT is associated with the two benzene rings, which introduce sterical
hindrance around the sulfur atom and prevent adsorption through the S heteroatom of the
thiophene ring on the surface of the catalyst. As it is observed, the sterical hindrance effect can
be even more pronounced by placing alkyl groups in the vicinity of the S atom, as in the 4,6
DMDBT molecule, which makes the sulfur atom spatially inaccessible for adsorption.
There is a general agreement that HDS activity on the CoMoS catalyst proceeds through
DDS and HYD reaction pathways. As mentioned in Chapter I, the reaction mechanism in DDS
involves removal of the sulfur atom from the molecule by the direct C-S hydrogenolysis and
HDS performed through the HYD route occurs by the hydrogenation of the aromatic ring before
C-S rupture. Houella et al. [108] proposed a reaction network for desulfurization of the DBT
molecule on Co/Mo/Al2O3 catalyst based on these two competing pathways. While
dibenzothiophene is desulfurized predominantly by the hydrogenolysis pathway, for the case of
Page 106
7. Adsorption of sulfur-containing molecules on r-CoMoS nanoparticles
94
4,6-DMDBT, the desulfurization preferentially occurs trough the HYD pathway since the DDS
reaction is very slow. It has been suggested that this molecule may adsorb on the catalyst through
the π-electron in its aromatic ring in a flat configuration. This hydrogenation relieves some of the
sterical hindrance introducing certain bonding flexibility in a conformation in which the methyl
groups are directed away from the sulfur atom allowing its subsequent adsorption on the active
site generally believed to be a S vacancy [73].
STM experiments on the atomic scale have been performed for various sulfur-containing
molecules on MoS2 and CoMoS nanoparticles. For the thiophene interaction with CoMoS
nanoparticles, it has been suggested that these molecules could be interacting with S-H groups at
the S-edges allowing the adsorption at the sites immediately behind the edges [34]. For the case
of DBT adsorption, Tuxen et al. [109] have revealed that s-MoS2 nanoparticles pretreated with
atomic H favor the formation of S vacancies. Here, the molecule chemisorbs on the S vacancies
located on the corners of the nanoparticles with (1010) S-edge termination smaller than six
atoms. Similarly, s-CoMoS nanoparticles were treated in atomic hydrogen and exposed to DBT
vapor. It was observed that the molecules are preferentially adsorbed on the corner sites [40]. For
the case of 4,6-DMDBT, exposures at low substrate temperature were carried out on s-MoS2 and
s-CoMoS nanoparticles treated in atomic hydrogen [39,40]. For both of them, the STM images
revealed several 4,6-DMDBT-induced protrusions on the edge sites of the nanoparticles. For the
exposures on s-MoS2 nanoparticles, a flat adsorption configuration on the brim through its
aromatic rings, in the π-adsorption mode was proposed. For the case of CoMoS nanoparticles,
Strange et al. found a flipping mode of the molecule where σ-adsorption can reversibly transform
into a π-like adsorption [39].
Despite the adsorption of sulfur-containing compounds on s-MoS2 and s-CoMoS
nanoparticles has been widely studied through the STM, as mentioned above, the morphology
and edge structure generated after exposing the nanoparticles to H2 at high temperature and
pressures match better with the theoretical models of the catalysts under HDS conditions. It is
therefore essential to test the reactivity of this new catalyst model.
7.1 Experimental details
s-MoS2 and s-CoMoS nanoparticles were synthesized and reduced in H2. The samples
were characterized using the STM before and after exposing the nanoparticles to thiophene and
heavier molecules such as DBT and 4,6-DMDBT in a set of different experiments. The
molecular exposures were carried at partial pressures of 1.0 × 10⁻⁷
mbar for 5 minutes at room
temperature.
Page 107
7. Adsorption of sulfur-containing molecules on r-CoMoS nanoparticles
95
7.1.1 Adsorption of thiophene on r-CoMoS nanoparticles
In the previous chapter we showed the reactivity of the thiophene molecules with the Mo-
edges of the r-MoS2 nanoparticles. We observed that the S-edges remain unaltered after the
exposures of thiophene at different temperatures. This was attributed to the fully covered S-edge
generated after the reduction in H2 of the triangular s-MoS2 nanoparticles. In this section, the
affinity of the promoted r-CoMoS nanoparticles towards adsorption of thiophene at room
temperature is tested. We found that the number of S vacancies at the Mo-edges for r-CoMoS
nanoparticles was lower than for r-MoS2, and therefore the reactivity of the thiophene molecules
with the reduced Co-promoted MoS2 catalyst was predominantly on the S-edge. Thus, here, most
of the results described correspond to the changes observed on the S-edges.
In order to better understand the analysis shown below, it is important to note that
hexagonal r-CoMoS nanoparticles have three S-edges. These S-edges may or may not contain H
adsorbed. We have assigned the absence of H to those S-edges on which the bright brim is
extinct (called as quenched edge). Therefore, when a r-CoMoS nanoparticle has one of its three
S-edges quenched, it means that the other two S-edges may potentially present H adsorbed in the
form of S-H groups. We can determine the amount of r-CoMoS nanoparticles having zero, one,
two or three S-edges without H adsorbed (quenched edges) before and after thiophene exposure
through a detailed statistical analysis extracted from an extensive dataset consisting of atom-
resolved STM images of individual nanoparticles. The results obtained before the thiophene
exposure is shown with blue bins in Fig.7.2. We observe that before dosing the molecules, most
of the analyzed r-CoMoS nanoparticles have at least one quenched S-edge. Considering the
results before the thiophene we conclude that the percentage of the quenched S-edges
corresponds to 32% of the total. Consequently, the other 68% corresponds to the S-edges that
present at least one S-H group formed on the edge.
After exposing the molecules onto the r-CoMoS nanoparticles, we observe that the
amount of quenched S-edges is significantly reduced; most of r-CoMoS nanoparticles have now
zero quenched edges as shown with the yellow bins in Fig.7.2. The final percentage of quenched
S-edges is only 3%. This means that thiophene molecules can occupy most of the reduced S-
edges. Thus, thiophene molecules can interact with the S-edges even without H.
After exposure of thiophene molecules, the distinction of the S-edges with H from those
S-edges that have adsorbed thiophene is not a simple task, since most of the S-edges have now a
similar appearance. However, the molecules leave an adsorption signature on certain edges that
may indicate its presence. If we consider a flat adsorption configuration of thiophene on top of
the S atoms at the S-edge, two molecules of thiophene must be separated at least by two S atoms
due to steric effects, similarly as for the pyridine molecules described in the Chapter 5.
-
Page 108
7. Adsorption of sulfur-containing molecules on r-CoMoS nanoparticles
96
Figure 7.2 Fraction of nanoparticles showing 0, 1, 2 or 3 quenched edges before (blue bins) and after (yellow bins)
dosing thiophene molecules at room temperature on r-CoMoS nanoparticles.
Therefore, two molecules could not be adsorbed in a flat configuration on a quenched two-
atoms-long S-edge (see Fig. 7.3c). This is what the majority of STM images reflects after
exposing the r-CoMoS nanoparticles to thiophene vapor. Two STM images in Fig. 7.3a-b show
this effect. Here, both nanoparticles have a S-edge that is slightly different from the others. These
S-edges present an apparent S vacancy formation next to a bright protrusion (see red dashed lines
in Fig. 7.3a-b). The increase in intensity of two brim sites close to the S-edge where the S
vacancy is found (see green arrows) may be an electronic effect due to adsorption of the
thiophene molecule, which modifies the edge electronic states of the nanoparticle. Considering
the ball-model representation of a r-CoMoS nanoparticle shown in Fig. 7.3c, we can observe that
it is inaccessible for a second thiophene molecule to be adsorbed on the same S-edge where one
molecule is already adsorbed.
Surprisingly the S-edges with adsorbed H appear to be intact. Based on the DFT
calculations discussed in Fig. 4.8b, depending on the H coverage on the S edge, only the S atoms
with S-H group formed are lifted up from the gold substrate, whereas the S atoms on the edge
without H adsorbed seem to be attracted to the substrate. This difference in height of the terminal
S atoms could be creating a steric effect which affects the adsorption of thiophene. However, this
does not explain why the molecules are not adsorbed onto sulfohydryl groups.
Page 109
7. Adsorption of sulfur-containing molecules on r-CoMoS nanoparticles
97
Figure 7.3 Adsorption of thiophene on r-CoMoS. (a-b) STM images (35 x 35 Å2) of a r-CoMoS nanoparticle after
dosing thiophene at 300 K showing the modifications on the sulfur edge and brim. (c) Ball-model representation of a
r-CoMoS nanoparticle with a thiophene molecule adsorbed on a quenched S-edge.
In order to clarify the reactivity of this molecule with the S-edges of r-CoMoS,
consecutive STM images have been acquired for longer times on a r-CoMoS nanoparticle
exposed to thiophene at room (see video 3 [85])3. Three of the STM images of the same r-
CoMoS nanoparticle are shown in Fig. 7.4 (superimposed atomic structure of 1, 2 and 3 are
shown below). In this nanoparticle we observe changes over time, located in the direction of
profiles (i) and (ii) traced from the surface of the catalyst to the gold substrate (see Fig 7.4b).
The detected changes are related to intensity variations from one position to another in
the same line of the profiles. As shown by the gray arrow in (1), there is a bright protrusion on
the brim with a height of 2.0 Å (see blue line in (i) in Fig. 7.4b). However, over time, the
intensity varies slightly between one image and another, with a reduction of approximately 0.3
Å. Curiously, as shown in (i), when the bright protrusion intensity is reduced to 1.7 Å (for
images (2) and (3)), this occurs at the expense of two new protrusions appearing on the right side
over the Co atom position (see black dashed arrow in (i)). This indicates that there is an
alternating movement generating electronic or topographic changes on the structure. In addition,
when the intensity of the brim protrusion is at its maximum at (1), a weak protrusion with a 0.8
Å intensity appears on the S-edge (see red dashed arrow in (i)). Similar, but slightly more diffuse
changes are observed for profile (ii). If two points are fixed near the Co atom position (see
yellow circles), one can see that, over time, these positions appear to be occupied and
unoccupied. If we compare images (1) and (3), we can observe the brightness change from the
brim site to the Co atom position, as it is indicated by the gray and orange arrows.
3 The video can be requested via email to: [email protected]
Page 110
7. Adsorption of sulfur-containing molecules on r-CoMoS nanoparticles
98
Figure 7.4 Dynamic of thiophene molecule on r-CoMoS. (a) Sequential STM images (52x52 Å2) of a r-CoMoS
nanoparticle after dosing thiophene at 300 K showing the rotation of the molecule in image 1, 2 and 3. A
superimposed atomic structure of the nanoparticle is shown below over the STM images. (b) Line scans (i) and (ii)
in the direction from the basal plane to the gold substrate at the same position for 1, 2 and 3.
Page 111
7. Adsorption of sulfur-containing molecules on r-CoMoS nanoparticles
99
Figure 7.5 Ball model representation of the r-CoMoS exposed to thiophene shown in Fig. 1.4. T1 and T2 show two
thiophene molecules in reversible flipping adsorption mode. T3 corresponds to a thiophene molecule adsorbed on
the corner site on the Mo-edge.
We propose a reversible flipping mode on the S-edge 1 generated by at least two different
adsorbed molecules which have an angular rotation from positions on the S-edge to positions on
the metallic brim of the catalyst surface. In this rotation mode, the Co atom seems to be the
central point for the rotation. Rangarajan et al. [41] used DFT to calculate the adsorption energy
of thiophene in a similar scenario to the one proposed here and concluded that the adsorption
energy value of the molecule on the brim is similar to the case when thiophene is adsorbed on a
CUS site at the S-edge. These are the most stable adsorption configurations according to the DFT
calculations. Harris et al [110] through theoretical calculations concluded that both σ- and π-
bondings are important modes of adsorption of thiophene.
In addition, as we discussed in Chapter 6, thiophene molecules are also adsorbed on the
Mo-edges. In Fig. 7.4, a thiophene molecule is probably adsorbed parallel to the Mo-edge on the
corner site (see white semicircle in image 3). A possible representation of what might occur on
this r-CoMoS nanoparticle is shown in Fig. 7.5. Here, T1 and T2 are the molecules that interact
with the metallic brim and S-edge in a reversible flipping mode, and T3 is adsorbed on the corner
site. Interestingly, T1 and T2 are interacting at positions on the S-edge close to the corners,
where the pyridinium ions were not formed for a S-edge with the same length (see Chapter 5).
Desikan et al. proposed two different sites for the adsorption of thiophene, one exclusively for
DDS, and the other a HYD site, which also affect the DDS [111]. Thus, the experimental results
Page 112
7. Adsorption of sulfur-containing molecules on r-CoMoS nanoparticles
100
suggest the possible existence of two different active sites: (i) one for the adsorption of thiophene
molecule and (ii) other for the formation of pyridinium ions. However, we cannot discard the
effect that the gold substrate may be playing in adsorption of the molecules.
7.1.2 Adsorption of DBT on r- CoMoS nanoparticles
In this section we investigate how the adsorption of DBT molecules can be related to
hydrogenation sites or S vacancies distributed on both Mo- and S-edges. It is suggested that HDS
of DBT could happen through a partial hydrogenation of one aromatic ring, followed by C-S
rupture and reformation of the aromatic ring. However, hydrogenation may not be necessary and
the molecule can be desulfurized by direct extrusion of the S atom by hydrogenolysis [5,74,112].
Thus, it is highly interesting to identify the preferential adsorption sites for DBT molecules,
which can suggest tentative reaction pathways in HDS. In order to explore the reactivity of the r-
CoMoS, DBT vapor has been exposed to the nanoparticles, and sequentially transferred to the
STM in order to map its interaction with the molecules.
Fig. 7.6 displays an STM image of a r-CoMoS nanoparticle after exposure to DBT
molecules. Here, the S-edges are occupied by heart-shaped features with a length determined to
be ~ 9.8 Å, in a very good agreement with the expected lateral size of a DBT molecule4. Some
other faint and mobile protrusions are observed decorating the Mo-edges without a clear
interaction with the edge. They seem to be DBT molecules interacting with the Au(111)
substrate probably by van der Waals forces. The line scans over the S-edges (see Fig. 7.6b, the
line scans where traced on a STM image of the same nanoparticle acquired with a bias and
current of V= -146 mV and I= -0.390 nA, respectively) reveal that the S atoms along the edges
present differences in intensity. Even if we cannot directly correlate those changes to geometric
features because of the convolution of this technique, we observe that the bright protrusions on
the edge are in the same axis with the S atom of the DBT molecules (see the direction of the
arrows). This indicates that the molecules are adsorbed on the S-edges. A tentative representation
of the DBT adsorption on S-edges is shown in Fig. 7.6c. Here, three molecules are located on
top of certain S atoms which compose the Co-promoted edges (see red dashed circles). The
interaction of the DBT molecules with or without S-H groups on the S-edge is not easily
distinguished yet. However, we detect significant changes on the brim sites generated after
exposure of DBT molecules. The corrugation modification of the brim sites and S-edge are
displayed in Fig. 6.7d (traced on a STM image of the same nanoparticle acquired with a bias and
current of V= -146 mV and It= -0.390 nA, respectively). Here, the line scans over the S-edge 1
and the corresponding brim show that the adsorption of the DBT molecule (the adsorption site of
the S heteroatom for the DBT molecule is indicated with a red asterisk in the blue profile) causes
4 The distance between the hydrogen atoms protruding on each side of the DBT molecule is 9.6 Å.
Page 113
7. Adsorption of sulfur-containing molecules on r-CoMoS nanoparticles
101
a small decrease of the brim intensity for the two sites in the middle. We have observed that the
adsoption on the S-edge of simpler molecules like pyridine, quinoline and thiophene causes a
pronounced change on the brim site. For the adsorption of a DBT molecule, however, the two H
atoms nearest to the S heteroatom may also differently affect the electronic states of the edge.
Figure 7.6 Adsorption of DBT on r-CoMoS. (a) STM image (48x48 Å2, V=-767.3 mV, I=-0.300 nA) of a r-CoMoS
nanoparticle after dosing DBT at 300 K. (b) Line scans over the three S-edges showing the increase of intensity
where the molecule is adsorbed. (c) Ball model representation of the r-CoMoS nanoparticle containing three DBT
molecules on the sulfur edges. (d) Line scans over the S-edge 1 and Brim 1. The asterisk shows the DBT adsorption
site.
Page 114
7. Adsorption of sulfur-containing molecules on r-CoMoS nanoparticles
102
Figure 7.7 STM image (234 x 234 Å2) of a r-CoMoS nanoparticles after dosing DBT at 300 K showing the DBT
occupancy and unoccupied sites.
We observe, however, that not all the S-edges of the r-CoMoS nanoparticles are fully
occupied by DBT molecules, demonstrating differences in the adsorption energy depending on
the S-edge structure or morphological criteria. An overall image including several r-CoMoS
nanoparticles after exposure to DBT molecules is depicted in Fig. 7.7. Here, some of the
nanoparticles seem to have all the S-edges completely filled by DBT molecules, but there are
nanoparticles with sizes smaller than 25 Å2 and quenched edges where the DBT does not
interact. Instead of being adsorbed on the S-edges, the molecules are imaged as faint protrusions
on the Au(111) substrate decoration the areas near the Mo- and S-edges.
In order to distinguish if the DBT molecule is adsorbed on the S-edge or is decorating the
periphery of the nanoparticle, an analysis of individual nanoparticles is performed. Those
characteristics found are illustrated in Fig. 7.8. In Fig. 7.8a two DBT molecules adsorbed on the
S-edge 1 and S-edge 2 are observed. For the case of S-edge 3, a faint protrusion is imaged near
the edge. Similar weak protrusions were found decorating the short S-edges 2 and 3 (two S
atoms of length) for the nanoparticle shown in Fig. 7.8b. In order to perform this analysis we
present line scans (i) and (ii) taken perpendicular to the S-edges (see the white dashed line as an
example for one of the line scans in Fig. 7.8a) of the r-CoMoS nanoparticles in Fig. 7.8a and Fig.
7.8b, respectively (see Fig. 7.8c).
Page 115
7. Adsorption of sulfur-containing molecules on r-CoMoS nanoparticles
103
Figure 7.8 Adsorption of DBT on r-CoMoS. (a-b) STM images (48x48 Å2) of a r-CoMoS nanoparticles after
dosing DBT at 300 K showing the adsorption of DBT on the sulfur edges and gold substrate. Below the STM
images the graph for the line scans traced from the basal plane to the gold substrate for all the sulfur edges in (a) and
(b) is shown.
The profiles in (i) show that the DBT molecules on the S-edges 1 and 2 present an
apparent height of 1.0 Å relative to the Au(111) substrate, but for the case of the faint protrusion
close the S-edge 3, the height corresponds to 0.6 Å. Interestingly, this reduction in height of the
molecule is accompanied by a clear extinction of the bright brim for the S-edge 3. The profiles in
(ii) show that the DBT molecule adsorbed on the S-edge 1 presents also an apparent height of 1.0
Å and for the short S-edge 2 and 3, the DBT molecules are imaged with heights of 0.6 Å. This
confirms two possible adsorption sites for the DBT molecules: (a) on the Co-promoted S-edge or
(b) on the gold substrate.
Page 116
7. Adsorption of sulfur-containing molecules on r-CoMoS nanoparticles
104
Figure 7.9 Relative frequency percentage for: (a) DBT occupancy per r-CoMoS nanoparticle after the molecular
exposure and (b) different unoccupied site after DBT exposure.
In order to estimate the number of DBT molecules possibly interacting with or without S-
H groups on the S-edge, a thorough statistical analysis was performed based on the DBT
occupancy on the S-edges after the exposure. This is shown in the graph in Fig. 7.9. The graph
illustrates the relative frequency percentage of: (a) number of DBT molecules adsorbed on the S-
edge (in yellow), and (b) number of different sites unoccupied by the molecule after the exposure
(in red). Once we expose DBT molecules onto the r-CoMoS nanoparticles sample, we observe
that their occupancy on the S-edge is relatively high, with more than 50% of the nanoparticles
having the three S-edges occupied by molecules (see Fig. 7.9a). By analyzing the unoccupied S-
edges, we observe that their nature is varied (quenched edges (50% S), S-edges with H (50% S +
H) adsorbed and short edges). We conclude that DBT molecules seem to be more reactive with
the edges considered to have sulfohydryl groups since represents only 10% of the unoccupied
sites. However, as it was mentioned above, the high DBT occupancy indicates adsorption on
both types of S-edges. Finally, the majority of the unoccupied sites correspond to small
nanoparticles composed by short edges, one to two-atoms-long. The inability of the DBT
molecule to be adsorbed on short edges highlights the role that the delocalized electrons in the
aromatic ring may have in the binding strength. These molecules could be interacting with the
edges by direct adsorption of the S heteroatom and through van der Waals forces, as it has been
proposed in the literature for larger heterocyclic molecules. Therefore, we have observed that the
Page 117
7. Adsorption of sulfur-containing molecules on r-CoMoS nanoparticles
105
length of the S-edge and the H coverage may influence the adsorption energy of DBT molecules
on r-CoMoS nanoparticles.
7.1.3 Dynamics of the DBT molecules on the S-edge
Interestingly, some of the DBT molecules adsorbed on the S-edges present a dynamic
interaction between nearby positions (see video 4 [85])5. This effect of the DBT molecule is
shown in Fig. 7.10. Here, Fig. 7.10a shows two images obtained sequentially on a r-CoMoS
nanoparticle after exposure of DBT molecules. In (1) the S-edges are observed to be fully
decorated with DBT molecules. However in (2), the molecule D1 disappears from its “initial”
position and two new protrusions near the corner appear (D1'). To clarify this effect, line scans
are traced over the DBT molecule adsorbed on that S-edge, the brim sites and the two features
which appear on the corner sites (see Fig. 7.10b). Here, the bright brim of (1) shows an apparent
height of 1.3 Å, but for (2) there is a depletion of the height (see black arrow in Fig. 7.10b for the
brim height) of approximately 0.2 Å when the round-shaped protrusions are observed on the
corner. These two protrusions seem to have the same 1.0 Å apparent height of the DBT molecule
(D1). As shown in the representative ball-model of the r-CoMoS nanoparticles in Fig. 7.11, we
suggest that the DBT molecule (D1) is rotating from a position on the S-edge to the corner site
(D1'). The formation of corner vacancies on the Co-promoted MoS2 has been calculated through
DFT calculations [44,58] and the adsorption of DBT and 4,6-DMDBT molecules on this sites
has been demonstrated by STM studies [39,40]. However, this rotational effect of the DBT
molecule between the S-edge and the corner is demonstrated here for the first time. The two
protrusions located on the corner site may be associated to the two benzene rings of the DBT
molecule, which probably moves at a higher rate than the STM tip raster frequency.
The most relevant characteristic of this effect is the adsorption signature left by the DBT
molecule on the S-edge once it occupies the corner site. The bright brim vanishes at the position
marked with a red circle in Fig. 7.11 but is then recovered once the DBT molecule returns to the
initial position on the S-edge. As we have observed, the extinction of the bright brim is
characteristic for the quenched edges (50% S). Therefore, if this effect is characteristic for the
adsorption of DBT on quenched edges, it suggests that the binding energy for the adsorption of
DBT on S-edges with S-H groups is stronger since not all the molecules adsorbed on the Co-
promoted S-edge present the same effect. Furthermore, if the molecule can rotate from the
possibly quenched S-edge to the corner site, it is because the adsorption energy of DBT may be
similar on both sites. We suggest that the appearance of the bright brim when the molecule is on
the S-edge is related to a dimerization between the S heteroatom of the molecule and the terminal
5 The video can be requested via email to: [email protected]
Page 118
7. Adsorption of sulfur-containing molecules on r-CoMoS nanoparticles
106
S atoms on the S-edge, similar to the Co-promoted S-edge of the s-CoMoS nanoparticles or the
fully covered Mo-edge [27,32,33,113].
Figure 7.10 Dynamics of DBT molecule on r-CoMoS. (a) Sequential STM images (40x40 Å2) of a r-CoMoS
nanoparticle after dosing DBT at 300 K showing the rotation of the molecule in image 1 and 2. (b) Line scans over
the brim and DBT molecules for 1 and 2 at the same position.
If the Co atom becomes six fold S coordinated due to the adsorption of the DBT on the
50% S-edge, it can explain why a certain number of S-edges longer than three S atoms partially
recover some of the brim sites after the exposure of DBT. This is shown in Fig. 7.12. Here, all
three S-edges of the r-CoMoS nanoparticle show adsorbed DBT molecules, but there is a
peculiar decrease of the brim intensity on the S-edge 3 for half of the edge (see black arrows
pointing at the brim 3 in Fig. 7.12a). This reduction is evident when line profiles are traced over
Page 119
7. Adsorption of sulfur-containing molecules on r-CoMoS nanoparticles
107
Figure 7.11 Ball model representation of the r-CoMoS exposed to DBT shown in Fig. 1.11. D1 and D1’ show two
thiophene molecules in reversible flipping adsorption mode from the sulfur edge to the corner site.
each brim (see Fig. 7.12b). Brims 1 and 2 have an apparent height of 1.6 Å; for the altered brim
3, however, there is a 0.2 Å decrease for the sites marked with black arrows (the same height
difference to that one observed when the molecule was rotating to the corner in Fig. 7.12b). If
we observe at the axial plane drawn crossing the thiophene ring of the DBT molecule (yellow
dashed line in Fig. 7.12a), the S heteroatom is positioned at half of the length of the recovered
brim. This is an indicator that the molecule is adsorbed on a possibly quenched edge, and
therefore forming a S dimer with one S atom of the edge. We have mentioned that the distinction
of S-edge type (50%S or 50%S+H) where the DBT absorbs is obscured due predominantly to the
convolution of this technique. However, for the adsorption on a quenched edge (50%S) longer
greater than 3 atoms, it is more evident due to the partial recovery of the brim.
Steric effects related to the size of the molecule and the adsorption configuration on the
S-edge may be the reasons why a quenched edge cannot fully recover the bright brim. For the
adsorption of two DBT molecules on a S-edge, considering a flat adsorption on a 50% S edge,
the edge should be at least seven atoms-long and the distance between the two S heteroatoms
would correspond to a separation of 12.6 Å (see Fig. 7.13). Even so, the metallic brim of the
edge would not be complete, since in the middle there would be a gap that probably causes the
brim to vanish (position marked with a red circle), disabling the adsorption of other molecules
with an affinity to the metallic brim, as is the case of thiophene or pyridine.
Page 120
7. Adsorption of sulfur-containing molecules on r-CoMoS nanoparticles
108
Figure 7.12 Adsorption of DBT on r-CoMoS. (a) STM image (48x48 Å2) of a r-CoMoS nanoparticle after dosing
DBT at 300 K showing the adsorption of DBT on a quenched edge. (b) Line scans over the three brim sites showing
the vanished quenched edge in Brim 3.
7.1.4 Adsorption of 4,6-DMDBT on r-CoMoS nanoparticles
The refractory nature of 4,6-DMDBT has been assigned to the strong steric hindrance
the methyl groups have on the adsorption on the active sites. These methyl groups in the 4 and 6
positions, close to the S atoms, lead to an inhibition of the DDS pathway of the molecule in
HDS. In agreement with this, the experimental STM investigations of 4,6-DMDBT on r-CoMoS
nanoparticles showed that the molecule is unable to be adsorbed on any sulfur vacancies at the
Mo-edges. However, apart from the formation of S vacancies, the reduction of the s-CoMoS
nanoparticles is believed to create S-H groups which may interact with the 4,6-DMDBT through
the HYD pathway.
The adsorption of 4,6-DMDBT on a r-CoMoS nanoparticles is shown in Fig. 7.14. Here,
images (1) and (2) in Fig. 7.14a correspond to two sequential STM images obtained under the
same tunneling conditions. We have performed height profiles over the two images, on the same
positions for the S-edge and bright brim, which present important modifications over time (see
Fig. 7.14b). For image 1, it is possible to clearly identify two bright protrusions on the brim sites,
with apparent heights of 1.1 Å (see blue line for brim in image (1)). Surprisingly, one of the
bright protrusions on the brim sites is reduced to 0.9 Å for image 2 (see green line for Brim 2).
Page 121
7. Adsorption of sulfur-containing molecules on r-CoMoS nanoparticles
109
Figure 7.13 Ball model representation of a Co-promoted sulfur edge showing the minimum distance between two
DBT molecules adsorbed in a flat configuration.
This position is marked with a black arrow in both images. This reduction is
accompanied by the increase in the intensity of two protrusions on the S-edge, with heights of
approximately 1.0 Å, as shown in image (2) and in Fig. 7.14b for the S-edges. Also, there is an
increase in intensity for the third sulfur atom on the edge, as shown with a red arrow.
Additionally, two new protrusions which seem to fit with the two benzene rings of the 4,6-
DMDBT molecule also appear out of the S-edge. The molecule seems to be adsorbed directly on
top of the S atom highlighted by the yellow arrow in image (1). As we can observe, this molecule
has a similar reversible flipping mode as thiophene adsorbed on r-CoMoS, but here the
interaction with the S-edge is very strong that vanishes one of the brim sites. One of the possible
adsorption configurations for this molecule is shown in Fig. 7.14c. Here, the molecule is
adsorbed on the S-edge and can flip from position 1 to 2, explaining why the two protrusions out
of the sulfur edge seem to disappear from one image to the other. If the sulfur heteroatom is
interacting with an S-H group, it may explain the modification of the metallic states of the edge.
By terms of DFT calculations [41], it has been shown than the most stable adsorption structure
for the 4,6-DMDBT is that corresponding to position 2 in Fig. 7.14c, but here we have shown
that the molecule presents a reversible flipping mode. Grønborg et al. [39] demonstrated that
after dosing atomic hydrogen at low temperature to CoMoS nanoparticles, the molecule has the
same dynamic as when it is adsorbed on a S vacancy on the corner. The adsorption of 4,6-
DMDBT on the corner was also observed in these experiments as it is shown in Fig. 7.14d
(highlighted by a black arrow). However, for the adsorption of a molecule on a corner, it requires
the removal of S atoms from the S-edge [39], which is rather found in the experiments. In
addition, the 4,6-DMDBT molecule adsorbed on the quenched edges was never observed in the
experiments (see white arrow in Fig. 7.14d). We conclude that the reactivity of 4,6-DMDBT
molecule with the r-CoMoS nanoparticles is very low, since a large number of S-edges remains
Page 122
7. Adsorption of sulfur-containing molecules on r-CoMoS nanoparticles
110
unreacted after dosing the molecules. This is one of the most difficult compounds to remove
from the oil crude, and we confirm that this may be related to the strong steric hindrance that the
methyl groups have on the adsorption on the active sites.
Figure 7.14 Adsorption of 4,6-DMDBT on r-CoMoS. (a) Sequential STM images (52x52 Å2) of a r-CoMoS
nanoparticle after dosing 4,6-DMDBT at 300 K showing the rotation of the molecule from the sulfur edge to the
brim sites in 1 and 2. (b) Line scans over the brim and sulfur edge for 1 and 2 at the same position. (c) Ball model
representation of the reversible flipping adsorption mode (from position 1 to 2) for the r-CoMoS exposed to 4,6-
DMDBT molecules. (d) STM image (52x52 Å2) of a r-CoMoS nanoparticle after dosing 4,6-DMDBT at 300 K
showing the adsorption on corner site.
Additionally, DBT and 4,6-DMDBT molecules were exposed to the r-MoS2 nanoparticles
at room temperature, however, we did not observed any characteristic adsorption mode on this
catalyst. The adsorption may be impeded by the 100%S S-edge of these structures.
Page 123
7. Adsorption of sulfur-containing molecules on r-CoMoS nanoparticles
111
7.2 Conclusions
In this chapter we have revealed through STM experiments the adsorption of thiophene,
DBT and 4,6-DMDBT molecules on r-CoMoS nanoparticles. We demonstrated that the
interaction of the molecules occurs basically with the S-edges. In fact, the thiophene molecules
seem to interact between the metallic brim sites and the S-edge in a reversible flipping mode.
This interaction with the S-edge is observed to occur predominantly on the S atoms without H
adsorbed, contrary to the sites where the formation of pyridinium ion occurs. This suggests two
active sites with different affinity towards adsorption of these nitrogen and sulfur-containing
molecules.
In the case of DBT on r-CoMoS nanoparticles, the high occupancy of the molecules on
the S-edges demonstrated the highly catalytic properties of the Co-promoted S-edges reduced in
H2. We observed adsorption of DBT on both S-edges with and without H adsorbed. Therefore,
hydrogenation of the aromatic ring and direct extrusion of the S heteroatom occurs on this
catalyst. The adsorption of the DBT was observed to partially recover the bright brim of original
quenched edge. This may be related to the formation of S dimers with uncoordinated Co atoms.
The dynamic movement of the molecule suggests that the adsorption on a quenched S-edges and
corners sites may have the similar adsorption energies. Experiments carried out on r-MoS2
nanoparticles exposed to DBT molecules demonstrated a low reactivity of the Mo- and S-edges.
For the case of 4,6-DMDBT, we suggested that the adsorption occur through the
interaction of the molecule with a S-H group on the S-edge which may explain the HYD
pathway reaction followed by the molecule in HDS catalysis. In the reversible flipping
adsorption mode, the molecule can rotate from the S-edge to positions close to the brim pivoting
on a S-H group. Additionally, the refractory molecule was observed adsorbed on corner sites.
However, the low number of molecules adsorbed on those sites confirms the steric hindrance
effect of the methyl groups, which makes the S atom inaccessible to a S vacancy or a S-H group
on the catalyst.
Page 125
Chapter 8
8 Single-layer MoS2 formation from MoOx
precursors
This chapter will present the transformation of MoOx into MoS2 phase through two
significantly different synthesis methods. The thermal decomposition of MoO3-x in UHV by
annealing steps is also studied using XPS and STM techniques. The work presented in this
chapter is already published as paper V.
Page 126
8. Single-layer MoS2 formation from MoOx precursors
114
Transition metal dichalcogenides (TMD) materials have attracted significant attention
due to their distinctive chemical and physical properties [114,115]. As a member of the TMD
family, MoS2 is usually used in the industry as dry lubricant [116] and as an important
hydrodesulphurization (HDS). Whereas bulk MoS2 material is a semiconductor which present an
indirect gap, single-layers of MoS2 exhibit a direct gap of 1.8 eV [117,118] opening up a
profound impact on the next-generation of nanodevices, photonics[119] and optoelectronics
[120,121], and energy technology [122-124].
Several methods have been exploited to synthetize MoS2: single-layer MoS2 can be easily
obtained by physical and chemical methods including scotch tape based micromechanical
exfoliation [125], liquid exfoliation [123,126], physical vapor deposition (PVD) [31,127],
hydrothermal synthesis [128]. Recently, the chemical vapor deposition (CVD) has been adopted
as the synthesis method to precise the number of layers of MoS2 but in most of the cases, high
surface roughness and the control of the crystallographic orientation of MoS2 islands is necessary
to obtain coalescence into a uniform atomic layer [129,130]. This growth method is commonly
used to produce high quality MoS2 films that are suitable for research purposes.
Regardless of the application, the usual precursor applied for chemical production of
MoS2 is molybdenum trioxide (MoO3) [131]. Compared to other growth methods, the sulfidation
of MoO3 precursor into MoS2 is much less understood from the fundamental point of view. It is
for example known from MoS2 catalysts production, that sulfidation of Mo in lower oxidations
states (MoO2) is considerably hindered whereby it becomes a vital parameter to enhance the
MoO3 phase [75,132,133]. It is also highly desirable from the practical point of view to
understand and learn how to control the evolution and spatial distribution of the MoS2
morphology during the sulfidation process, as this can be used to control the shape and size of
MoS2 particles in real catalysts.
In order to better understand how MoO3 phase and its sub-oxide phases are converted into
MoS2, we first investigated the evolution of the morphology, structure, and stoichiometry of
molybdenum oxide thin films grown from an MoO3 powder precursor on Au(111) single
crystalline substrate as a function of the annealing temperature using XPS and STM. Then, we
used the pre-characterized MoO3-x films with several different reduction degrees to investigate
their sulfidation into MoS2 in H2S environment.
8.1 Experimental
A single crystal Au(111) surface is used as a support in these studies. Evaporation of
MoO3 powder (99.98%, Aldrich) on clean Au(111) substrate (see Section 2.4.1) is performed by
using a Mo crucible mounted inside an e-beam evaporator (Oxford Applied Research, EGCO4).
Page 127
8. Single-layer MoS2 formation from MoOx precursors
115
The crucible including the MoO3 was degassed for 30 min until a stable pressure and flux were
obtained. STM images were recorded using a combined Omicron VT-AFM/STM equipped with
a Nanonis SPM controller. X-ray photoelectron spectroscopy measurements were performed to
study the chemical composition of the precursor material and sulfides samples (see details in
Section 2.3). The conversion of precursors into MoS2 was performed using two significantly
different synthesis procedures. This allowed us to investigate the role of presulfidation versus
direct sulfidation on the surface. In the following, we refer to the two methods as direct
sulfidation and reactive physical vapor deposition (reactive PVD) of molybdenum oxide.6
8.1.1 Method I. Direct sulfidation
Molybdenum oxide was deposited by physical vapor deposition of MoO3 powder on
Au(111) at room temperature (RT) with a deposition rate of ~0.01 ML/min until 0.25ML was
reached. Three samples, A, B and C, were annealed for 1 hour at 120, 270 and 420°C in UHV
respectively. The subsequent sulfidation experiment was done by post-annealing in H2S gas
background at 1×10⁻⁶
mbar for 20 min at the same respective annealing temperature for each
sample. A second post-annealing in H2S at 1×10⁻⁶
mbar for 20 min was performed at 270°C for
the sample A.
8.1.2 Method II. Reactive PVD
This second method involves deposition of MoO3 onto a preheated substrate at
temperature T1 directly in a H2S gas atmosphere (1×10⁻⁶
mbar). After characterization at this
step, the samples D, E and F have been post-annealed at a higher temperature T2 in the same gas
atmosphere for 20 min in order to crystallize the sulfide phases (see Table 3).
Table 3. Temperatures used for reactive PVD (method II).
Sample Reactive PVD substrate
temperature T1 [°C]
Annealing
temperature T2 [°C]
D 165 230 E 215 230 F 265 550
6 In this chapter the temperature is given in degrees Celsius according to the published article.
Page 128
8. Single-layer MoS2 formation from MoOx precursors
116
8.2 X-ray photoelectron spectroscopy of Mo oxide precursors
The chemical evolution of the MoOx deposited on Au(111) after successive annealing
cycles from RT to 450°C is monitored with XPS and STM. We observe that the evolution of the
Mo 3d and O 1s core level peaks in three distinct temperature regions (see Table 4) corresponds
to remarkably phase changes of the deposited molybdenum oxide (Fig. 8.1a-b). The gradual shift
of the Mo 3d peak towards lower binding energies (Fig. 8.1a) indicates that the initially
deposited Mo oxide becomes reduced upon UHV annealing (see Appendix C).
Table 4. Three distinct temperature regions for the evolution of MoO3-x after successive annealing cycles in UHV.
In the low temperature range, the Mo3d peaks is fitted with two sets of doublets (see the
example of the fitted spectrum at 90ºC in Fig. 8.1c), consisting of a major component for the
Mo3d5/2 at a binding energy of approximately 232.4 eV and a minor component at 231.2 eV of
each oxidation state. The high binding energy component confirms the presence of Mo
predominantly in the 6+ oxidation state[134], whereas the lower binding energy suggests the
presence of a small fraction of reduced oxide with Mo in 5+ state [135-137]. In the medium
temperature range, two additional shoulders appear at ~229.7 eV and 227.9 eV, which coincide
with the binding energies typically assigned to Mo4+
and Mo0 oxidation states, indicating the
presence of more reduced molybdenum oxide phases like MoO2 and metallic molybdenum,
respectively [134,138]. The spectrum obtained at 270°C shows the coexistence of at least four
oxidation states (see Fig. 8.1c). Surprisingly, in the high temperature range, the Mo3d5/2 peak
corresponding to Mo5+
disappears at the expense of the increase of the lowest energy peak
corresponding to Mo0 as shown in the Mo3d spectrum at 390°C in Fig. 8.1c.
In the case of the O1s peak area (see Fig. 8.1b), a progressive decrease in the oxygen
content is observed. This confirms the reduction of the molybdenum oxide, however, the
presence of oxidized compounds is found on the surface at even high temperatures.
Region Temperature range Low 25 – 150 ºC
Medium 180 – 330 ºC High 360 – 450 ºC
Page 129
8. Single-layer MoS2 formation from MoOx precursors
117
Figure 8.1 Fig 1. XPS spectra of the MoOx/Au(111) system after annealing cycles in increments of 30°C: (a) Mo3d
and (b) O1s regions, and (c) three characteristic peaks fitting at 90, 270 and 390°C. Adapted from ref. [139].
Page 130
8. Single-layer MoS2 formation from MoOx precursors
118
To monitor the changes of the Mo in 6+, 5+, 4+, and 0 states as function of the
temperature, we plot the percentage of each Mo3d5/2 component and normalize the Mo3d5/2 and
O1s relative peak areas with the corresponding sensitive factors and plot the O1s/Mo3d5/2 ratio at
each temperature as shown in Fig. 8.2. In Fig. 8.2a, the stacked column graph clearly indicates
that the integral area of the initial oxide present on the Au(111) surface corresponding to the
Mo6+
, gradually decreases together with the onset formation of the Mo5+
component. The Mo5+
component first increases but it vanishes again around 330°C; it is basically transformed to
reduced species as Mo4+
and Mo0 which are predominant in the medium temperature range. This
reflects the formation of a defective-MoO3 phase. The progressive loss of oxygen atoms during
the annealing steps caused mainly by the rupture of Mo-O bonds explains the continuous
transition from 6+ and 5+ oxidation states to 4+ and 0, which are predominant at high annealing
temperatures. As XPS shows that Mo6+
remains at 450°C, we cannot exclude that some MoO3
survives at high temperature but it is also noted that the background subtraction of the low
intensity peak introduces an uncertainty in the XPS fitting.
Considering the quantitative O1s/Mo3d5/2 ratio shown in Fig. 8.2b, it decreases
approximately from 2.5 after the deposition a room temperature to 1.6 after annealing at 450°C.
This combined with the oxidation states observed suggests that MoO3 is deposited on the
Au(111) surface accompanied by the presence of small amount of Mo2O5 that may exist at the
periphery of the material i.e. reduced edges. The slightly decomposed material is continuously
reduced after each annealing step to lower oxidation states as for example MoO2 and Mo metal.
This is confirmed by the discussed peak position change and the substantial loss of oxygen that
modify notoriously the composition of the oxide compounds on the surface Similar thermal
decomposition of oxides was observed for the case of V2O5 via VO2 to V2O3 and PdO verified
with X-ray photoemission spectra [140,141]. Thus, this procedure provides the opportunity of
tuning the original deposited material to a wide range of molybdenum oxides, each of which
shows different sulfidation behavior.
8.3 Surface structure dependency on the annealing temperature
As discussed above, the initially deposited MoO3 material is gradually reduced after each
annealing step to lower oxidation states. One can expect that such a reduction is accompanied by
structural transformations based on the different crystal structures and Mo coordination in MoO3
(orthorhombic) and MoO2 (monoclinic) [142].
Page 131
8. Single-layer MoS2 formation from MoOx precursors
119
Figure 8.2 Relative percentage of each Mo3d5/2 component calculated from XPS recorded on the MoOx/Au(111)
and (b) O/Mo ratio as a function of annealing temperatures. Adapted from ref. [139].
Page 132
8. Single-layer MoS2 formation from MoOx precursors
120
To investigate the morphological transformation of the Mo oxide precursor, we
performed STM measurements using three samples, denoted A, B and C, which were prepared
by deposition of MoO3 on Au(111) at RT that was followed by an annealing step in UHV for 1
hour at 120, 270 and 420°C respectively. In this way we have characterized samples reflecting
the three predominant oxidation states seen in the XPS sequence in Fig. 8.2a, i.e. MoO3 mostly at
the low temperature range, a mix of Mo in oxidation states +6, +5, +4 and 0 at the medium
temperature range, and finally the mix of Mo6+
, Mo4+
and metallic Mo at the high temperature
range. The STM images of the resulting MoOx island morphology and atomic structure for the
three samples are shown in Fig. 8.3. At 120°C, large scale STM images reveal a high density of
atomically flat islands with an apparent height of ~3.8 ± 0.3 Å (see Fig. 8.3a). The growth takes
place both on the Au(111) terraces and at the step edges sites. The observation of three
dimensional (3D) clusters on top of the islands surfaces that appear as bright protrusions may be
related to second-layer nucleation on the top layers. A high-resolution STM image (see Fig.
8.3b) recorded on the top of one of the islands shown in (see Fig. 8.3a) reveals that their surfaces
are atomically flat and have a 3.6 Å×3.9 Å (±0.1 Å) rectangular unit cell (see Fig. 8.3b), which is
consistent with the growth of (010)-oriented α-MoO3 [142]. We suggest that the islands grown
correspond to the formation of single-layer MoO3 on Au(111). The surface structure of these
islands differ from those obtained by Biener et al. [143,144] on Au(111) via oxidation of Mo
nanoclusters or Mo(CO)6 using NO2 as oxidizing reagent. In this case, a crystalline structure with
a c(4×2) unit cell was observed which may be related to some fraction of the Mo in a reduced
state.
In Fig. 8.3c,e STM measurements for the sample B are shown. Much larger two-
dimensional islands with an apparent height of 4.5Å height are formed. The increase of the
annealing temperature to 270°C of the deposited MoO3 precursor produces larger and more
compact islands with respect to sample A annealed only at 120°C (see Fig. 8.3c). These islands
grow preferentially along the step edges but small islands are also found on the terraces which
nucleate on the elbows of the Au(111) herringbone reconstruction. In this thermal treatment at
270°C the atoms gained sufficient energy to diffuse over the surface and onto each other forming
well-organized structures. Atom-resolved STM images of the molybdenum oxide islands surface
(see Fig. 8.3d) reveal a complex arrangement of atoms in alternating rows. Those rows are most
likely oxygen vacancies probably created during cleavage of the weakest bonds of MoO3 during
the annealing showing a more reduced surface. Bulk substoichiometric oxides as η-Mo4O11(100),
Mo8O23(010) and Mo18O52(100), and other defined molybdate phases, have shown in previously
studies similar characteristics [145-147]. In order to reveal the surface lattice, bias-polarity STM
measurements were done by applying a negative and positive bias (±400mV) to the tip in which
occupied and empty states at the surface are selectively imaged. The surface reveals a 13.1 Å ×
8.4 ± 0.1 Å lattice cell with a β angle of 110.0 ± 2°. In accordance with XPS data, after annealing
the original MoO3 clusters deposited at room temperature up to 270°C, the coordination
Page 133
8. Single-layer MoS2 formation from MoOx precursors
121
environment of the Mo atoms changes accompanied by loss of oxygen. The STM study provides
evidence that the MoOx species in this range are thermally activated and the behavior is
consistent with the free surface diffusion (SD) mechanism [148]. We tentatively associate the
stripes observed in STM to an ordered array of oxygen vacancies due to the formation of Mo4+
and Mo5+
.
Figure 8.3 STM images of the MoOx/Au(111) system after annealing in UHV; (a) sample A at 120°C, (c) sample B
at 270°C and (e) sample C at 420°C, the white dashed arrow shows the Mo-Au alloy on the surface. Atom-resolved
images of the islands surface are shown below; (b) rectangular unit cell for the sample A, (d) bias-polarity switched
STM image (upper/lower part) for sample B showing the rhombic unit cell for sample B (the small dashed-circles
represent the positions of the atoms in both parts of the image) and (f) STM image of the top facet for the cluster
marked in green in Fig. 3e for the sample C. Adapted from ref. [139].
The STM images for sample C are shown in Fig. 8.3e,f. A dramatic decrease in the
number of clusters on the surface is detected at this temperature. This observation confirms that
the annealing causes a thermal decomposition of the initial MoO3 clusters deposited at room
Page 134
8. Single-layer MoS2 formation from MoOx precursors
122
temperature. The elbows of the herringbone reconstruction appear to be fully decorated by small
clusters that probably correspond to Mo metal [149]. Furthermore, irregular and serrated step-
edge morphology and the appearance of “holes” (one of them is marked by a yellow dashed
arrow in Fig. 8.3e) on the surface with a clear different contrast are observed in the STM images.
These observations indicate that Mo is most likely disappearing from the surface due to alloying
with gold. This process can proceed unhindered without the presence of a stabilizing sulfiding or
oxiding atmosphere. Our observations are in agreement with a study of the growth of MoO3 by
direct oxidation of Mo on a Au(111) surface by Biener et al., where the formation of the Mo–Au
surface alloy was observed [149]. However, in our case, the continuously thermal desorption of
oxygen to the chamber decomposes the oxidized Mo species and reduces the cluster size to form
Mo clusters or free Mo atoms that may diffuse on the surface or dissolving along the step edges
of the gold surface. Similar observations were also made for the Cu(100)+Au−c(2×2) system at
room temperature [150]. Additionally, rather well-defined two dimensional islands are found at
the step edges and terraces on the gold surface. An atom-resolved STM image of the island
surface (marked in yellow) in Fig. 3e. is shown in Fig. 3f. The surface structure displays an
almost hexagonal lattice, with lattice units of 5.6 Å × 5.7 Å (± 0.1 Å) distance which corresponds
well to the rhombic unit cell of (010)-oriented MoO2 crystallites[142], consistent with the XPS
results.
8.3.1 Direct sulfidation of molybdenum oxide compounds on Au(111)
To investigate the transformation mechanism of the different molybdenum oxide states
into MoS2, we used the three differently prepared molybdenum oxide samples as described in the
Section 8.1.1 (samples A, B, and C), and treated in a post-annealing step in H2S atmosphere at
the same temperatures as what have been used for UHV annealing (see the description of method
I above).
After the sulfidation for sample A at 120°C, the initial morphology of the clusters has
changed to a slightly rougher island structure with the presence of three dimensional and small
clusters emerging on top of the structures (Fig. 8.4a). At this temperature, the post-annealing in
H2S has not modified significantly the composition of the clusters. After a second post-annealing
in H2S at 270°C more significant changes are observed on the Au(111) substrate. Here, the
majority of the islands show a flat surface with an apparent height of 2.5 ± 0.2 Å. The change in
the morphology of the structures is evident, they present a triangular shape. Also, a larger
hexagonal buckling pattern with a periodicity of 32.5 Å on the basal plane is observed. This
moiré superstructure results from the lattice mismatch between MoS2(0001) and Au(111) and has
been observed previously in studies on the single layer MoS2 on Au(111) synthesized using a
metallic Mo precursor [57,127]. The formation of MoS2 islands is accompanied by the presence
Page 135
8. Single-layer MoS2 formation from MoOx precursors
123
of three-dimensional clusters that might be assigned to molybdenum oxide compounds
originated at the first H2S treatment at 120°C.
Figure 8.4 STM images of the MoOx/Au(111) system after annealing in H2S; (a) sample A at 120°C and (b) sample
A post-annealed at 270°C, (c) direct sulfidation of sample B at 270°C, (d) hexagonal unit cell and moiré pattern of
MoS2 for the surface marked in yellow in Fig. 4c and (e) and (f) sample C at 420°C. Adapted from ref. [139].
After a direct sulfidation of sample B at 270°C, the STM images reveal that almost
complete sulfidation and crystallization into single layer MoS2 slabs has been achieved (Fig.
8.4c). In this sample, triangular-shaped agglomerates lay on the surface with the basal plane
oriented parallel to the gold and with an apparent height of 2.3 ± 0.2 Å. Again, the characteristic
moiré pattern on the basal plane of the MoS2 phase on Au(111) is also clearly resolved (see the
zoom-in in Fig. 8.4d). The atom-resolved STM image of the MoS2 structures show a hexagonal
arrangement of atoms with a periodicity of 3.15Å, fully consistent with interatomic distances, dS-
S or dMo-Mo, of the crystal structure of MoS2 [151]. The observed saw-tooth morphology suggests
Page 136
8. Single-layer MoS2 formation from MoOx precursors
124
that the triangular-shape domains have nucleated independently from molybdenum oxide islands
and subsequently coalesced together with neighboring domains to form larger slabs. The
sulfidation process at 270°C mostly converts the molybdenum oxide into a stable MoS2 phase,
however, the presence of small quantities of oxide remains between the ramified islands (see
inset in Fig. 8.4c) This conversion may occur through an to oxysulfide intermediate phase
formed during the sulfidation as Weber et al. [152] attributed the presence of Mo5+
oxidation
state when crystalline MoO3 was exposed in the forming gas of H2S/H2 in the range between 25-
300°C.
The STM images of sample C sulfidized at 420°C are shown in Fig. 8.4e,f. Larger and
more uniform MoS2 structures are observed on the surface growing predominantly from curved
step edges. A clear decrease in the coverage of the MoS2 as in the previous MoOx sample is
observed. Additionally, in the bottom image, shown by a white arrow, the formation of a
hexagonal-shape MoS2 cluster embedded into the terrace confirms that Mo-Au alloy takes place
along the step edges and on the terraces in form of “holes”. The formation is presumably through
an uniform Mo precursor reservoir by a Mo-Au surface alloy as it was recently proposed by
Song et al. [153]. As consequence of the increase in annealing temperature during the synthesis,
a larger mobility of the sulfide species on the surface leads the formation of a pronounced
agglomeration which synthesize in larger MoS2 single-layers [57]. This is achieved through the
sulfidation of Mo nanoclusters nucleated in the bulged elbows of the herringbone reconstruction
after the thermal decomposition of molybdenum oxide. Furthermore, a small fraction of oxide
clusters remains on the surface probably because of the presence of the more stable reduced
MoO2 phase that is difficult to fully sulfide under the experimental conditions we used. This
effect becomes even more clear in the experiment described below.
8.3.2 Reactive Physical Vapor Deposition of MoO3 in H2S
To investigate whether sulfidation during the MoO3 deposition leads to MoS2 growth, we
performed a series of experiments using reactive PVD growth method described in Section 8.1.2.
The STM images of the surface morphologies and structures of the islands grown by method II
are shown in the panels in Fig. 8.5, which shows the surface appearance after deposition in H2S
on substrates held at three different temperatures (T1D, T1
E, T1
F) (Fig. 8.5a-c) and after further
post-sulfidation at higher temperatures (T2D, T2
E, T2
F) (Fig. 8.5d-f). To follow the degree of
sulfidation we furthermore recorded XPS spectra for the samples D, E and F, and the resulting
O1s/S2p ratios are shown in table 5.
The results are significantly different than for the direct sulfidation. The reactive PVD
deposition at 165°C (method II) results in the morphology illustrated in Fig. 8.5a. Here, the step
edges of the Au(111) surface are now completely decorated with a grainy appearance film which
Page 137
8. Single-layer MoS2 formation from MoOx precursors
125
has an average height of 7.2Å. This non-crystalline layer is extended to the terraces covering
around 60% of the surface. Also, bigger 3D cluster with an apparent height of 25 Å are found to
nucleate on the step edges of Au(111). At this temperature, under the conditions described, we
do not observe the presence of crystalline MoS2 (0001) synthesized after the reactive deposition;
however, it is apparent that sulfur increases the mobility of the Mo-precursor. If we compare the
STM images shown in Fig. 8.3a and 8.5a, we observe that MoOxS species may be formed in the
latter case as can be concluded from the distribution and the morphology of the film. Sulfur
enhanced mobility is a well-known phenomenon on Cu and Co, and is often explained by the
formation of metal-sulfur complexes [154,155].
Figure 8.5 Above, STM images after reactive deposition in H2S at different substrate temperature before annealing
in H2S; (a) 165°C for the sample D, (b) 215°C for the sample E and (c) 265°C for the sample F. Below, STM images
after post-annealing in the H2S atmosphere at: (d) 230°C for the sample D, (e) 230°C for the sample E and (f) 550°C
for the sample F. Adapted from ref. [139].
Page 138
8. Single-layer MoS2 formation from MoOx precursors
126
The increase in the substrate temperature during the reactive deposition at 215°C for the
sample E, causes sintering of the deposited material (see Fig. 8.5b). The STM image reveals a
much flatter and more crystalline film growing on the surface of Au(111) with a height of 5.4 ±
0.2 Å and accompanied by a low concentration of three dimensional clusters emerging on top
(see Fig. 8.5b). A high resolution STM image of the crystalline layer surface is shown inset Fig.
8.5b. The figure shows an arrangement of alternating rows with different contrast related to the
formation of a complex phase on the surface consisting of apparent missing atoms. The
alternating rows have a period of 8.7 Å and the lattice unit of a complete patch is
5.4 × 3.9 ± 0.1Å. This unit cell contains the lattice constant c of the MoO3 crystal structure. This
appearance points to a defective MoO3 surface with incorporated sulfur species. These
observations can be associated with an oxy-sulfide phase as a product of O-S exchange resulting
from a reorganization of the oxide surface structure [156].
After the reactive deposition at 265°C for the sample F, new features appear on the
surface as it is depicted in Fig. 8.5c). The image reveals three dimensional clusters with a height
average of 35 Å and the formation of multilayer islands (marked by a white dashed arrow in Fig.
8.5c) which nucleate favorably at the step edges. A single layer of the slab structure has an
apparent height of 4.8 Å. This may indicate that the reaction at higher substrate temperature
promotes the formation of stable molybdenum oxide phases rather than MoS2 islands. For all
samples, the surface herringbone reconstruction was lifted probably due the high amount of
elemental sulfur adsorbed. In our set-up, H2 gas was not introduced to the chamber in order to
reduce the elemental sulfur that did not react in the experiments.
8.3.3 Post-annealing in H2S
Post-sulfidation experiments were then carried out for samples D, E, and F (prepared by
method II) subjected to a post-annealing step in the H2S atmosphere. Samples D and E have been
annealed at 230 °C, and sample F has been annealed at 550 °C, in all cases the H2S pressure was
1×10⁻⁶
mbar. The STM images of the samples D, E, and F after post-annealing in H2S are shown
in Fig. 8.5d, e, and f, respectively.
After the post-annealing step on the surface of sample D (see Fig. 8.5d), the STM image
reveals the formation of a large amount of triangular-shaped MoS2 features that appear on the
Au(111) substrate nucleating preferentially on the step edges (see white arrows). In the case of
post-annealed sample E, we observe the formation of flat triangular-shaped MoS2 islands on the
surface accompanied with 3D clusters that are attributed to the remnant MoOx or MoOxS which
did not convert into MoS2 phase. This is further confirmed by XPS analysis which shows a
Page 139
8. Single-layer MoS2 formation from MoOx precursors
127
sulfidation process, in which the O1s/S2p ratio after the post-annealing (T2) for sample D and E
decreased, but with a remnant O1s signal in both cases (see Table 5).
Table 5 O/S ratio after annealing (T1) and post-annealing (T2) in H2S for samples D, E and F.
Interestingly, the conversion to MoS2 was even less efficient at elevated temperature. For
sample F, the post-annealing in H2S at 550°C causes the formation of mainly multilayer slabs
with straight edges (see Fig. 8.5e). An atomically-resolved image of the surface of one of the
slabs is shown in Fig. 8.6a. The STM image shows protrusions arranged in a 5.7 Å × 5.7 Å ± 0.1
Å unit cell with an angle of 121 ± 4° between the lattice constants. This surface is consistent with
the (010) surface termination of the bulk monoclinic structure of MoO2 [142,157] and identical to
the one observed after UHV annealing of MoO3 at high temperatures (see Fig. 8.3f). The height
of a single layer of the well-crystalline structures corresponds to 4.8 Å, showing that the
predominant structure that arises is in fact the reduced Mo4+
oxide, and not the sulfide. This also
confirms that the slabs observed in the Fig. 8.5c correspond to MoO2 structures. XPS data
obtained before and after the post-annealing in H2S, support that absence of MoS2, where
contrary to the samples D and E after the post-annealing, the sample F appears much less
sulfided after the post-annealing. The results obtained by using the method II provide chemical
and morphological evidence of the MoO3 reduction via the MoOxS structure to form MoS2 and
MoO2 phases in accordance with Arnoldy et al. observations on the temperature-programmed
sulfidation (TPS) of MoO3 on Al2O3 substrate [156].
8.4 Summary
We found that the progressive UHV annealing steps largely affect the overall
stoichiometry of the initial MoO3 deposited on Au(111) single crystal. The thermal
decomposition generates a series of structural and atomic arrangements due to the loss of oxygen
in the process that results in pronounced changes in the morphology of the molybdenum oxides
studied. The almost complete conversion of the molybdenum oxide into single-layer MoS2 was
Page 140
8. Single-layer MoS2 formation from MoOx precursors
128
achieved from an intermediate oxygen-rich Mo phase, and further at relative high temperature
from metallic molybdenum clusters using the method I. On the other hand, the sulfidation of a
mix of Mo in 4+ and 0 oxidation states results impeded by the prior formation of most stable
oxidized phases.
Figure 8.6 (a) Atomically-resolved STM image of MoO2 surface for the sample F annealed at 550°C and (b) line
scan of the step height corresponding to a single layer of MoO2 (see line scan position in Fig. 8.5f).
The three samples synthesized by method II revealed that sulfur increases the mobility of
the Mo-precursors and the post-annealing in H2S is necessary to convert those pre-reduced
compounds formed to MoS2 single-layer. It was observed that by increasing the substrate
temperature to 265°C during the reactive PVD causes the formation of a very stable
molybdenum oxide phase identified as bulk MoO2, which is not possible to sulfide into the MoS2
phase even at high temperatures or by post-annealing the sample in H2S atmosphere. Thus, the
substrate temperature and the reducing agent of H2S strongly affects the speed of the reaction
and hence the chemical nature of the deposited material after the first treatment using method II.
Page 141
129
9 Summary and outlook
Petroleum is a complex mixture of different aromatic and aliphatic compounds. Sulfur is
found throughout the boiling range of petroleum fractions in the form of many organic sulfur
compounds such as mercaptans, sulfides, disulfides, thiophenes, benzothiophene and DBTs. The
removal of sulfur from these species is one of the biggest challenges and has always been an
integral part of the petroleum processing. The last decades have brought about a strong increased
attention on to the importance of controlling air pollution which has led to significant changes in
the formulation of gasoline and other motor fuels. Current legislation in most industrialized
countries requires ultra-low sulfur levels in diesel fuels, below 10 ppm and 5 ppm for ship fuels
after January 2020, which calls for the development of new and improved catalysts. One of the
difficult aspects of hydrotreating is the complexity of the feed and the lack of detailed knowledge
about the nature of the compounds present. The problem arises since desulfurization depends on
the type of compound, and the aromatic species are actually much less reactive than the
nonaromatic organosulfur compounds because of the steric hindrance and complex reaction
pathways involve in the HDS. Substantial efforts have been devoted to change this situation by
introduction of several new methods which have given improved insight into the molecular
structures, even for compounds with rather high molecular weights. However, hydrotreating
catalysis is often obscured by the lack of fundamental knowledge about the active sites present
on the catalyst surface. The aim of this thesis has been to bring new atomic scale insight into the
active state and catalytic sites on the hydrotreating catalysts through surface science studies of
model catalysts consisting of MoS2 and CoMoS nanoparticles on Au(111).
One of the main topics in this thesis is the influence of hydrogen on the catalytic
properties of the MoS2 and CoMoS nanoparticles. In Chapter 4, it was demonstrated that the
morphology and edge structure of MoS2 and CoMoS nanoparticles is modified by the influence
Chapter 9
Page 142
9. Summary and outlook
130
of reductive conditions of molecular hydrogen at relative high pressures and temperature
for our system. The morphology change of MoS2 nanoparticles from triangles to capped or
corner-truncated triangles, exposing Mo-edges on the long sides and a small area of S-edges at
the corners, where the triangle is capped, appear to be the correct representation of the MoS2
morphology under realistic HDS conditions [36,50,158]. Indeed, the shape of the new catalyst
nanoparticles has a direct influence on the HDS activity, since the type and number of active
sites depend on the length of both Mo and S-edges. Although the CoMoS nanoparticles did not
change their shape, the modification of the edge structure represents the activation of these
catalysts for HDS reactions. The nature of the active sites for these nanoparticles differs from
those found on MoS2, which explains the high reactivity of the Co-promoted MoS2 catalysts.
The use of pyridine as probe molecule when searching for active sites on the catalysts
allowed me to demonstrate in Chapter 5 that the possible location of the S-H groups is
concentrated at S-edges of both catalysts. Apart from identifying these acid sites on reduced
MoS2 and CoMoS nanoparticles, more information was revealed about the inhibitory character
of these molecules. The pyridine molecules seem to be protonated by S-H groups in a reversibly
flipping mode between two adsorption configurations on reduced CoMoS nanoparticles, which
has been recently demonstrated to be the most stable adsorption structure [41]. For the case of
the quinoline molecule, it was shown that the compound has a similar inhibitory effect on both
catalysts, being able to block up to three active sites at the S-edge.
To test the affinity of the r-MoS2 towards adsorption of S-containing molecules, in
Chapter 6 experiments were conducted with thiophene as a probe molecule. Direct exposure at
room temperature on the r-MoS2 nanoparticles reveals significant changes on the edge structure
of the Mo-edges. This molecule was observed to be adsorbed only on the Mo-edge occupying
CUS sites created after the reduction. The number and location of the sulfur vacancies depended
on the length of the Mo-edge, and thus the adsorption behavior of the thiophene molecules was
different for each case. This reflected the fact that the catalytic properties of these catalysts
depend strongly on the morphology of the structures. By increasing the temperature during the
exposure of the molecules, it was observed that these vacancies are increasingly occupied until
they are potentially desulfurized at 650 K. The formation of new sulfur vacancies was confirmed
by reducing the sample again in H2.
In Chapter 7 the adsorption of thiophene and DBT were further investigated on the
reduced CoMoS nanoparticles. On these nanoparticles, both molecules are preferentially
absorbed on the S-edges. Thiophene was observed to have a reversible flipping mode between
two adsorption structures, alternating from the brim sites to the S-edges. For the case of DBT,
the refractory molecules can interact with reduced S-edges with and without S-H groups. The
lateral displacement of the molecule along the S-edge corresponded to the case when the
molecule can be adsorbed on two distinct adjacent sites.
Page 143
9. Summary and outlook
131
In Chapter 8, progressive annealing steps of physical vapor deposited MoO3 powder was
investigated using XPS and STM techniques. The precursors' complete sulfidation in H2S
atmosphere was found to depend on the oxidation state of MoOx. The prerequisite for the
efficient formation of MoS2 is that Mo should stay in the highest Mo6+
state before sulfidation,
whereas the presence of the reduced MoOx phase inhibits MoS2 formation. The reactive
deposition of those precursors in H2S atmosphere led to the formation of rather stable amorphous
oxysulfide phases, including MoO2 phase.
In the future, it would be very interesting to study co-adsorption of sulfur and nitrogen-
containing molecules on both reduced MoS2 and CoMoS. These compounds can compete for the
same CUS-like and brim sites, so it is expected that one of them destabilizes the other depending
on the nature and number of the active sites [41]. In addition, the use of complex molecules
exposing two of the relevant functional groups discussed in this thesis can facilitate studying
preferential intramolecular adsorption. For example, thiochromeno[4,3,2-de]quinoline [159] and
benzothieno[2,3-h]isoquinoline [160] can be used to simultaneously test the affinity of quinoline
or DBT on the catalytic active sites. Some other considerations related to these interactions
should be taken into account, such as the influence of van de Waals forces and delocalized
electrons with the catalyst.
Figure 9.1 Complex organic compounds: (a) thiochromeno[4,3,2-de]quinoline and (b) benzothieno[2,3-
h]isoquinoline
Page 145
133
In the last three years I have had the pleasure of working with very skilled and
professional people who have helped me in many different ways during my PhD studies.
Therefore, I would like to express my deepest appreciation to all of them.
First of all, I would like to thank my excellent supervisor Jeppe Vang Lauritsen for giving
me the opportunity to work in the SPM group, for many fruitful discussions and enthusiastic
scientific guidance, and for supporting me during my entire PhD. I would like to thank Igor
Beinik for his help and guidance in the lab when I started the experimental work in the SPM
group. I am particularly grateful for the technical assistance given by Lutz Lammich with the
STM microscopes in the laboratory. I would especially like to thank Jonathan Rodriguez, Signe
Strange and Søren Birthin for their great collaboration in the lab. The assistance of Moritz Ewert
who participated in the project for a while, is also greatly appreciated as well.
I would like to thank all my group colleagues, Jakob Fester, Yijia Li, Zhaozong Sun,
Kræn Christoffer, Eoghan Rattigan and Ali Sems, for the help and valuable input they constantly
provided constantly. Special thanks to Stig Koust for his help in translating the abstract of this
thesis. I would like to thank Albert Bruix for the productive discussions, collaboration and
feedback. I also acknowledge the theoreticians Srinivas Rangarajan and Manos Mavrikakis, from
the University of Wisconsin-Madison, for their important contributions and fruitful discussions.
It is difficult to overstate my appreciation towards Dr. Teodora Miclaus, who read this thesis
even though this is not her research field. I am so thankful for all the support and feedback
Teodorita.
I would like to thank postdocs Christian Bortolini, Laszlo Kekedy-Nagy, Hongfei Yin,
Lasse Hyldgaard, Siddharth Jethwa and Mehmet Berat for the non-scientific discussions which
have made everyday life an enjoyable experience.
I would like to thank my friends Carolina and Ana for their tireless motivation and for
always being there for me in Costa Rica. I would especially like to thank Chema for his
tremendous support and encouragement every step of the way.
Last but not least, I would like to express my deepest gratitude to my family for their love
and daily support, for always being there for me no matter the distance that separate us.
Norberto José Salazar Moreira
Acknowledgement
10
Page 147
135
A. Particle size distribution
In Chapter 4, the particle size distribution of the MoS2 and CoMoS nanoparticles before and
after the reduction in H2 is shown in Fig. A.1. The graphs also shown the results obtained after
the resulfidation of the r-MoS2 nanoparticles in H2S atmosphere. Those results were not included
in the discussion of this chapter. PhD student Signe Strange has provided this data.
Figure A.1 : (a) Statistical plot for the MoS2 particle size after sulfidation (s-MoS2), reduction (r-MoS2) and
resulfidation in 10-6
mbar of H2S at 673K corresponding to the first sulfidation. (b) CoMoS particle distribution for
sulfidation (s-CoMoS) and reduction (r-CoMoS).
11 Appendices
12
Page 148
Appendices
136
B. DFT calculations
In Chapter 4, the DFT calculations of the Au-supported MoS2 and CoMoS nanoparticle
models were carried out using the PBE exchange-correlation functional [161], the projector-
augmented wave method of Blöchl [162], and a real space grid with spacing for the expansion of
the wave functions as implemented in the GPAW code [163] and supported by the Atomic
Simulation Environment [164]. The geometries for the different models used were optimized
until the forces on each relaxed atom were lower than 0.025 eV/Å and the electronic structure at
each geometry optimization step was self-consistently converged with energy, density, and
eigenvalue thresholds of 5E-4, 1E-4, and 5E-8 eV, respectively. A grid spacing of 0.175 Å was
used and the reciprocal space was sampled using only the gamma-point. All the atoms of the
nanoparticles and the upper layer of the two-layer slab used to represent the Au(111) substrate
were allowed to relax during geometry optimization. The Au slab was constructed using a lattice
parameter 2.1 % smaller than the optimized value in order to reproduce the compression of the
Au atoms in the herringbone-reconstructed Au(111).
Phase diagrams and ab initio thermodynamics: The phase diagrams for the supported
nanoparticles were constructed following previous work [36,47] by calculating the Gibbs free
energy of formation (∆G) as a function of the chemical potential of sulphur. For supported MoS2
nanoparticles:
∆G(∆𝑛, 𝜇𝑆) = 𝐸𝑀𝑜𝑆2
𝐷𝐹𝑇 − 𝑛𝑀𝑜𝐸𝑀𝑜𝑆2
𝑟𝑒𝑓− ∆𝑛∆𝜇𝑆 − 𝐸𝐴𝑢
𝐷𝐹𝑇
where:
∆𝑛 = 2𝑛𝑀𝑜 − 2𝑛𝑆
and :
∆𝜇𝑆 = 𝜇𝑆 − 𝐸𝑆−𝑏𝑢𝑙𝑘𝐷𝐹𝑇
Here, 𝐸𝑀𝑜𝑆2
𝐷𝐹𝑇 is the DFT-calculated energy of the supported MoS2 nanoparticle, 𝐸𝑀𝑜𝑆2
𝑟𝑒𝑓is the
DFT-calculated energy of the reference bulk MoS2, and 𝐸𝐴𝑢𝐷𝐹𝑇 is the DFT-calculated energy of
the bare Au(111) slab. 𝑛𝑀𝑜 and 𝑛𝑆 correspond to the number of Mo and S atoms, respectively,
of the MoS2. ∆𝑛 therefore represents the excess or of the nanoparticles, which will be change for
different edge coverages. For the supported CoMoS nanoparticles:
∆G(∆𝑛, 𝜇𝑆) = 𝐸𝐶𝑜−𝑀𝑜−𝑆𝐷𝐹𝑇 − 𝑛𝑀𝑜𝐸𝑀𝑜𝑆2
𝑟𝑒𝑓−
𝑛𝐶𝑜
9𝐸𝐶𝑜9𝑆8
𝑟𝑒𝑓− ∆𝑛′𝜇𝑆 − 𝐸𝐴𝑢
𝐷𝐹𝑇
Page 149
Appendices
137
Where:
∆𝑛′ = 2𝑛𝑀𝑜 +8
9𝑛𝐶𝑜 − 𝑛𝑆
Here, 𝐸𝐶𝑜−𝑀𝑜−𝑆𝐷𝐹𝑇 is the DFT-calculated energy of the supported CoMoS nanoparticle and
𝐸𝐶𝑜9𝑆8
𝑟𝑒𝑓 is the DFT-calculated energy of bulk Co9S8, which is the stable Co sulphide phase under
the range of chemical potentials considered
The chemical potential (𝜇𝑆) is defined by the conditions of the gas in equilibrium with the
nanoparticles and can be evaluated in terms of the temperature relative pressures between H2 and
H2S according to Arrouvel et al. [165] .The experimental synthesis, reductive, and HDS
conditions thus result in the 𝜇𝑆 values indicated in the table below. Ranges of 𝜇𝑆 are given
instead of discrete values to consider variations due to the uncertainties in relative pressures and
to the approximations used in the calculations. These calculations were provided by Dr. Albert
Bruix.
C. Fitting of XPS data
In chapter 8, the reduction degree of MoO3 precursor was analyzed by fitting all the Mo 3d
peaks with Gaussian-Lorentzian functions after subtracting Shirley background. The spin–orbit
splitting for the doublet peaks Mo 3d5/2 and 3d3/2 was found to be 3.1eV. For each component in
the fit, the spin-orbit splitting was held fixed to have a 3:2 peak area ratio for the quantitative
analysis.
Page 151
139
13 Bibliography
14
[1] Chorkendorff, I.; Niemantsverdriet, J. W. Concepts of Modern Catalysis and Kinetics. Wiley: 2007. [2] Haber, J. Topics in Catalysis 2009, 52 (8), 970-981. [3] Wilkinson, A. M. A. Blackwell Science, Cambridge 1997. [4] Sabatier, P. Berichte der deutschen chemischen Gesellschaft 1911, 44 (3), 1984-2001. [5] Topsøe, H.; Clausen, B. S.; Massoth, F. E. Hydrotreating Catalysis. In Catalysis: Science and Technology, Anderson, J. R.; Boudart, M., Eds. Springer Berlin Heidelberg: Berlin, Heidelberg, 1996; pp 1-269. [6] Okamoto, Y.; Imanaka, T. The Journal of Physical Chemistry 1988, 92 (25), 7102-7112. [7] Parham, T. G.; Merrill, R. P. Journal of Catalysis 1984, 85 (2), 295-310. [8] Clausen, B. S.; Topsoe, H.; Candia, R.; Villadsen, J.; Lengeler, B.; Als-Nielsen, J.; Christensen, F. The Journal of Physical Chemistry 1981, 85 (25), 3868-3872. [9] Kibsgaard, J. 2008, PhD Thesis. University of Aarhus. [10] European Union. Transport & Environment 2012. [11] FuelsEurope. Hart Energy Research and Consulting 2015, June 2015. [12] Mortensen, J. J.; Hansen, L. B.; Hammer, B.; Nørskov, J. K. Journal of Catalysis 1999, 182 (2), 479-488. [13] Freund, H. J.; Kuhlenbeck, H.; Libuda, J.; Rupprechter, G.; Bäumer, M.; Hamann, H. Topics in Catalysis 2001, 15 (2-4), 201-209. [14] Moggridge, G. D.; Rayment, T.; Ormerod, R. M.; Morris, M. A.; Lambert, R. M. Nature 1992, 358 (6388), 658-660. [15] Hansen, T. W.; Wagner, J. B.; Hansen, P. L.; Dahl, S.; Topsøe, H.; Jacobsen, C. J. H. Science 2001, 294 (5546), 1508-1510. [16] Schnadt, J.; Knudsen, J.; Andersen, J. N.; Siegbahn, H.; Pietzsch, A.; Hennies, F.; Johansson, N.; Mårtensson, N.; Öhrwall, G.; Bahr, S.; Mähl, S.; Schaff, O. Journal of Synchrotron Radiation 2012, 19 (Pt 5), 701-704. [17] Song, C. Catal. Today 2003, 86 (1), 211-263. [18] Binnig, G.; Rohrer, H. Reviews of Modern Physics 1987, 59 (3), 615-625. [19] Binnig, G.; Rohrer, H.; Gerber, C.; Weibel, E. Physical Review Letters 1982, 49 (1), 57-61. [20] Teobaldi, G.; Inami, E.; Kanasaki, J.; Tanimura, K.; Shluger, A. L. Physical Review B 2012, 85 (8), 085433. [21] Tersoff, J.; Hamann, D. R. Physical Review Letters 1983, 50 (25), 1998-2001. [22] Bardeen, J. Physical Review Letters 1961, 6 (2), 57-59. [23] Ibach, H.; Lüth, H. Solid-State Physics: An Introduction to Principles of Materials Science ; with 100 Problems. Springer: 2003. [24] Lægsgaard, E.; Besenbacher, F.; Mortensen, K.; Stensgaard, I. Journal of Microscopy 1988, 152 (3), 663-669. [25] Hammer, B.; Norskov, J. K. Nature 1995, 376 (6537), 238-240. [26] Narasimhan, S.; Vanderbilt, D. Physical Review Letters 1992, 69 (10), 1564-1567.
Page 152
Bibliography
140
[27] Helveg, S.; Lauritsen, J. V.; Lægsgaard, E.; Stensgaard, I.; Nørskov, J. K.; Clausen, B. S.; Topsøe, H.; Besenbacher, F. Physical Review Letters 2000, 84 (5), 951-954. [28] Lauritsen, J. V.; Helveg, S.; Lægsgaard, E.; Stensgaard, I.; Clausen, B. S.; Topsøe, H.; Besenbacher, F. Journal of Catalysis 2001, 197 (1), 1-5. [29] Lauritsen, J. V.; Kibsgaard, J.; Olesen, G. H.; Moses, P. G.; Hinnemann, B.; Helveg, S.; Nørskov, J. K.; Clausen, B. S.; Topsøe, H.; Lægsgaard, E.; Besenbacher, F. Journal of Catalysis 2007, 249 (2), 220-233. [30] Critical Reviews in Solid State and Materials Sciences 2014, 39 (5), 319-367. [31] Lauritsen, J. V.; Kibsgaard, J.; Helveg, S.; Topsoe, H.; Clausen, B. S.; Laegsgaard, E.; Besenbacher, F. Nat Nano 2007, 2 (1), 53-58. [32] Bollinger, M. V.; Jacobsen, K. W.; Nørskov, J. K. Physical Review B 2003, 67 (8), 085410. [33] Bollinger, M. V.; Lauritsen, J. V.; Jacobsen, K. W.; Nørskov, J. K.; Helveg, S.; Besenbacher, F. Physical Review Letters 2001, 87 (19), 196803. [34] Lauritsen, J. V. PhD Thesis, Aarhus University 2002. [35] Groß, A. Advanced texts in physics,(Springer, 2003) 2009. [36] Schweiger, H.; Raybaud, P.; Kresse, G.; Toulhoat, H. Journal of Catalysis 2002, 207 (1), 76-87. [37] Byskov, L. S.; Nørskov, J. K.; Clausen, B. S.; Topsøe, H. Catalysis Letters 2000, 64 (2), 95-99. [38] Temel, B.; Tuxen, A. K.; Kibsgaard, J.; Topsøe, N.-Y.; Hinnemann, B.; Knudsen, K. G.; Topsøe, H.; Lauritsen, J. V.; Besenbacher, F. Journal of Catalysis 2010, 271 (2), 280-289. [39] Grønborg, S. S.; Šarić, M.; Moses, P. G.; Rossmeisl, J.; Lauritsen, J. V. Journal of Catalysis 2016, 344, 121-128. [40] Tuxen, A. K.; Füchtbauer, H. G.; Temel, B.; Hinnemann, B.; Topsøe, H.; Knudsen, K. G.; Besenbacher, F.; Lauritsen, J. V. Journal of Catalysis 2012, 295, 146-154. [41] Rangarajan, S.; Mavrikakis, M. ACS Catal. 2016, 6 (5), 2904-2917. [42] Moses, P. G.; Hinnemann, B.; Topsøe, H.; Nørskov, J. K. Journal of Catalysis 2009, 268 (2), 201-208. [43] Rangarajan, S.; Mavrikakis, M. AIChE Journal 2015, 61 (12), 4036-4050. [44] Rangarajan, S.; Mavrikakis, M. ACS Catalysis 2017, 7 (1), 501-509. [45] Byskov, L. S.; Nørskov, J. K.; Clausen, B. S.; Topsøe, H. Journal of Catalysis 1999, 187 (1), 109-122. [46] Raybaud, P.; Hafner, J.; Kresse, G.; Kasztelan, S.; Toulhoat, H. Journal of Catalysis 2000, 190 (1), 128-143. [47] Schweiger, H.; Raybaud, P.; Toulhoat, H. J. Catal. 2002, 212 (1), 33-38. [48] Zonnevylle, M. C.; Hoffmann, R.; Harris, S. Surface Science 1988, 199 (1), 320-360. [49] Salmeron, M.; Somorjai, G. A.; Wold, A.; Chianelli, R.; Liang, K. S. Chemical Physics Letters 1982, 90 (2), 105-107. [50] Kasztelan, S.; Toulhoat, H.; Grimblot, J.; Bonnelle, J. P. Applied Catalysis 1984, 13 (1), 127-159. [51] Lauritsen, J. V.; Kibsgaard, J.; Olesen, G. H.; Moses, P. G.; Hinnemann, B.; Helveg, S.; Nørskov, J. K.; Clausen, B. S.; Topsøe, H.; Lægsgaard, E.; Besenbacher , F. J. Catal 2007, 249, 220-233. [52] Lauritsen, J. V.; Kibsgaard, J.; Helveg, S.; Topsøe, H.; Clausen, B. S.; Besenbacher , F. Nature Nanotechnology 2007, 2, 53-58. [53] Hansen, L. P.; Ramasse, Q. M.; Kisielowski, C.; Brorson, M.; Johnson, E.; Topsøe, H.; Helveg, S. Angewandte Chemie - International Edition 2011, 50 (43), 10153-10156. [54] Zhu, Y.; Ramasse, Q. M.; Brorson, M.; Moses, P. G.; Hansen, L. P.; Kisielowski, C. F.; Helveg, S. Angewandte Chemie International Edition 2014, n/a-n/a. [55] Moses, P. G.; Grabow, L. C.; Fernandez, E. M.; Hinnemann, B.; Topsøe, H.; Knudsen, K. G.; Nørskov, J. K. Catalysis Letters 2014, 144 (8), 1425-1432. [56] Dinter, N.; Rusanen, M.; Raybaud, P.; Kasztelan, S.; da Silva, P.; Toulhoat, H. Journal of Catalysis 2010, 275 (1), 117-128.
Page 153
Bibliography
141
[57] Sørensen, S. G.; Füchtbauer, H. G.; Tuxen, A. K.; Walton, A. S.; Lauritsen, J. V. ACS Nano 2014, 8 (7), 6788-6796. [58] Saric, M.; Rossmeisl, J.; Moses, P. G. Physical Chemistry Chemical Physics 2017, 19 (3), 2017-2024. [59] Moses, P. G.; Hinnemann, B.; Topsøe, H.; Nørskov, J. K. Journal of Catalysis 2009, 268, 201-208. [60] Gandubert, A. D.; Krebs, E.; Legens, C.; Costa, D.; Guillaume, D.; Raybaud, P. Catal. Today 2008, 130 (1), 149-159. [61] Bruix, A.; Füchtbauer, H. G.; Tuxen, A. K.; Walton, A. S.; Andersen, M.; Porsgaard, S.; Besenbacher, F.; Hammer, B.; Lauritsen, J. V. ACS Nano 2015, 9 (9), 9322-9330. [62] Schweiger, H.; Raybaud, P.; Kresse, G.; Toulhoat, H. Journal of Catalysis 2002, 207, 76-87. [63] Chen, J. J.; Labruyere, V.; Mauge, F.; Quoineaud, A. A.; Hugon, A.; Oliviero, L. J. Phys. Chem. C 2014, 118 (51), 30039-30044. [64] Baubet, B.; Girleanu, M.; Gay, A. S.; Taleb, A. L.; Moreaud, M.; Wahl, F.; Delattre, V.; Devers, E.; Hugon, A.; Ersen, O.; Afanasiev, P.; Raybaud, P. Acs Catalysis 2016, 6 (2), 1081-1092. [65] Moses, P. G.; Hinnemann, B.; Topsøe, H.; Nørskov, J. K. Journal of Catalysis 2007, 248 (2), 188-203. [66] Lauritsen, J. V.; Bollinger, M. V.; Lægsgaard, E.; Jacobsen, K. W.; Nørskov, J. K.; Clausen, B. S.; Topsøe, H.; Besenbacher , F. Journal of Catalysis 2004, 221 (2), 510-522. [67] Bruix, A.; Fuchtbauer, H. G.; Tuxen, A. K.; Walton, A. S.; Andersen, M.; Porsgaard, S.; Besenbacher, F.; Hammer, B.; Lauritsen, J. V. ACS nano 2015, 9 (9), 9322-9330. [68] Füchtbauer, H.; Tuxen, A.; Li, Z.; Topsøe, H.; Lauritsen, J.; Besenbacher, F. Topics in Catalysis 2014, 57 (1-2), 207-214. [69] Arrouvel, C.; Breysse, M.; Toulhoat, H.; Raybaud, P. Journal of Catalysis 2005, 232 (1), 161-178. [70] Prodhomme, P. Y.; Raybaud, P.; Toulhoat, H. Journal of Catalysis 2011, 280 (2), 178-195. [71] Girgis, M. J.; Gates, B. C. Industrial & Engineering Chemistry Research 1991, 30 (9), 2021-2058. [72] Gates, B. C.; Topsøe, H. Polyhedron 1997, 16 (18), 3213-3217. [73] Kabe, T.; Ishihara, A.; Zhang, Q. Applied Catalysis A: General 1993, 97 (1), L1-L9. [74] Egorova, M.; Prins, R. Journal of Catalysis 2004, 225 (2), 417-427. [75] Grange, P. Catalysis Reviews 1980, 21 (1), 135-181. [76] La Vopa, V.; Satterfield, C. N. Journal of Catalysis 1988, 110 (2), 375-387. [77] Nagai, M.; Kabe, T. Journal of Catalysis 1983, 81 (2), 440-449. [78] Basila, M. R.; Kantner, T. R.; Rhee, K. H. The Journal of Physical Chemistry 1964, 68 (11), 3197-3207. [79] Cowley, S. W.; Massoth, F. E. Journal of Catalysis 1978, 51 (2), 291-292. [80] Zaki, M. I.; Hasan, M. A.; Al-Sagheer, F. A.; Pasupulety, L. Colloids and Surfaces A: Physicochemical and Engineering Aspects 2001, 190 (3), 261-274. [81] Parry, E. P. Journal of Catalysis 1963, 2 (5), 371-379. [82] Barzetti, T.; Selli, E.; Moscotti, D.; Forni, L. Journal of the Chemical Society, Faraday Transactions 1996, 92 (8), 1401-1407. [83] Topsoe, N. Y.; Topsoe, H. Journal of Catalysis 1993, 139 (2), 631-640. [84] Logadóttir, Á.; Moses, P. G.; Hinnemann, B.; Topsøe, N.-Y.; Knudsen, K. G.; Topsøe, H.; Nørskov, J. K. Catal. Today 2006, 111 (1–2), 44-51. [85] Salazar, N. PhD Thesis, Aarhus University 2017, http://inano.au.dk/about/research-groups/nanocatalysis-lab-lauritsen/stm-movies/norberto-thesis-movies/ [86] Lee, H. C.; Butt, J. B. Journal of Catalysis 1977, 49 (3), 320-331. [87] Satterfield, C. N.; Modell, M.; Mayer, J. F. AIChE Journal 1975, 21 (6), 1100-1107. [88] Ramachandran, R.; Massoth, F. E. Chemical Engineering Communications 1982, 18 (1-4), 239-254. [89] Amberg, C. H. Journal of the Less Common Metals 1974, 36 (1), 339-352. [90] McCarty, K. F.; Schrader, G. L. Journal of Catalysis 1987, 103 (2), 261-269.
Page 154
Bibliography
142
[91] Owens, P. J.; Amberg, C. H. Thiophene Desulfurization by a Microreactor Technique. American Chemical Society: 1961; Vol. 33, pp 182-198. [92] Hargreaves, A. E.; Ross, J. R. H. Journal of Catalysis 1979, 56 (3), 363-376. [93] Sinfelt, J. H. AIChE Journal 1979, 25 (4), 734-734. [94] Zheng, P.; Duan, A.; Chi, K.; Zhao, L.; Zhang, C.; Xu, C.; Zhao, Z.; Song, W.; Wang, X.; Fan, J. Chemical Engineering Science 2017, 164, 292-306. [95] Paul, J.-F.; Payen, E. The Journal of Physical Chemistry B 2003, 107 (17), 4057-4064. [96] Lauritsen, J. V.; Nyberg, M.; Nørskov, J. K.; Clausen, B. S.; Topsøe, H.; Lægsgaard, E.; Besenbacher, F. Journal of Catalysis 2004, 224 (1), 94-106. [97] Bruix, A.; Lauritsen, J. V.; Hammer, B. Faraday Discussions 2016. [98] Raybaud, P.; Hafner, J.; Kresse, G.; Toulhoat, H. Physical Review Letters 1998, 80 (7), 1481-1484. [99] Kumar, N.; Seminario, J. M. The Journal of Physical Chemistry C 2015, 119 (52), 29157-29170. [100] Startsev, A. N.; Burmistrov, V. A.; Yermakov, Y. I. Applied Catalysis 1988, 45 (2), 191-207. [101] Startsev, A. N. Catalysis Reviews 1995, 37 (3), 353-423. [102] Nørskov, J. K.; Clausen, B. S.; Topsøe, H. Catalysis Letters 1992, 13 (1), 1-8. [103] Topsøe, H.; Clausen, B. S.; Topsøe, N. Y.; Nørskov, J. K.; Ovesen, C. V.; Jacobsen, C. J. H. Bulletin des Sociétés Chimiques Belges 1995, 104 (4-5), 283-291. [104] Whitehurst, D. D.; Isoda, T.; Mochida, I. ChemInform 1998, 29 (33), no-no. [105] Gosselink, J. W. Cattech 1998, 4 (127 ). [106] Leliveld, R. G.; van Dillen, A. J.; Geus, J. W.; Koningsberger, D. C. Journal of Catalysis 1998, 175 (1), 108-116. [107] Kishan, G.; Coulier, L.; de Beer, V. H. J.; van Veen, J. A. R.; Niemantsverdriet, J. W. Journal of Catalysis 2000, 196 (1), 180-189. [108] Houalla, M.; Broderick, D. H.; Sapre, A. V.; Nag, N. K.; de Beer, V. H. J.; Gates, B. C.; Kwart, H. Journal of Catalysis 1980, 61 (2), 523-527. [109] Tuxen, A.; Kibsgaard, J.; Gøbel, H.; Lægsgaard, E.; Topsøe, H.; Lauritsen, J. V.; Besenbacher, F. ACS Nano 2010, 4 (8), 4677-4682. [110] Harris, S.; Chianelli, R. R. Journal of Catalysis 1984, 86 (2), 400-412. [111] Desikan, P.; Amberg, C. H. Canadian Journal of Chemistry 1964, 42 (4), 843-850. [112] Vanrysselberghe, V.; Froment, G. F. Industrial & Engineering Chemistry Research 1996, 35 (10), 3311-3318. [113] Ramos, M. A.; Chianelli, R.; Enriquez-Carrejo, J. L.; Gonzalez, G. A.; Berhault, G. Computational Materials Science 2014, 84, 18-22. [114] Chhowalla, M.; Shin, H. S.; Eda, G.; Li, L.-J.; Loh, K. P.; Zhang, H. Nat Chem 2013, 5 (4), 263-275. [115] Sorkin, V.; Pan, H.; Shi, H.; Quek, S. Y.; Zhang, Y. W. Critical Reviews in Solid State and Materials Sciences 2014, 39 (5), 319-367. [116] Tenne, R. Nat Nano 2006, 1 (2), 103-111. [117] Mak, K. F.; Lee, C.; Hone, J.; Shan, J.; Heinz, T. F. Physical Review Letters 2010, 105 (13), 136805. [118] Splendiani, A.; Sun, L.; Zhang, Y.; Li, T.; Kim, J.; Chim, C.-Y.; Galli, G.; Wang, F. Nano Letters 2010, 10 (4), 1271-1275. [119] Mak, K. F.; Shan, J. Nat Photon 2016, 10 (4), 216-226. [120] RadisavljevicB; RadenovicA; BrivioJ; GiacomettiV; KisA. Nat Nano 2011, 6 (3), 147-150. [121] Wang, Q. H.; Kalantar-Zadeh, K.; Kis, A.; Coleman, J. N.; Strano, M. S. Nat Nano 2012, 7 (11), 699-712. [122] Li, H.; Tsai, C.; Koh, A. L.; Cai, L.; Contryman, A. W.; Fragapane, A. H.; Zhao, J.; Han, H. S.; Manoharan, H. C.; Abild-Pedersen, F.; Norskov, J. K.; Zheng, X. Nat Mater 2016, 15 (1), 48-53.
Page 155
Bibliography
143
[123] Jawaid, A.; Nepal, D.; Park, K.; Jespersen, M.; Qualley, A.; Mirau, P.; Drummy, L. F.; Vaia, R. A. Chemistry of Materials 2016, 28 (1), 337-348. [124] Kibsgaard, J.; Chen, Z.; Reinecke, B. N.; Jaramillo, T. F. Nat Mater 2012, 11 (11), 963-969. [125] Tang, D.-M.; Kvashnin, D. G.; Najmaei, S.; Bando, Y.; Kimoto, K.; Koskinen, P.; Ajayan, P. M.; Yakobson, B. I.; Sorokin, P. B.; Lou, J.; Golberg, D. Nature Communications 2014, 5, 3631. [126] Gupta, A.; Arunachalam, V.; Vasudevan, S. The Journal of Physical Chemistry Letters 2016, 7 (23), 4884-4890. [127] Grønborg, S. S.; Ulstrup, S.; Bianchi, M.; Dendzik, M.; Sanders, C. E.; Lauritsen, J. V.; Hofmann, P.; Miwa, J. A. Langmuir 2015, 31 (35), 9700-9706. [128] Peng, Y.; Meng, Z.; Zhong, C.; Lu, J.; Yu, W.; Jia, Y.; Qian, Y. Chemistry Letters 2001, 30 (8), 772-773. [129] Lee, Y.-H.; Zhang, X.-Q.; Zhang, W.; Chang, M.-T.; Lin, C.-T.; Chang, K.-D.; Yu, Y.-C.; Wang, J. T.-W.; Chang, C.-S.; Li, L.-J.; Lin, T.-W. Advanced Materials 2012, 24 (17), 2320-2325. [130] Shi, J.; Ma, D.; Han, G.-F.; Zhang, Y.; Ji, Q.; Gao, T.; Sun, J.; Song, X.; Li, C.; Zhang, Y.; Lang, X.-Y.; Zhang, Y.; Liu, Z. ACS Nano 2014, 8 (10), 10196-10204. [131] Jiang, M.; Wang, B.; Yao, Y.; Wang, H.; Li, Z.; Ma, X.; Qin, S.; Sun, Q. Applied Catalysis A: General 2014, 469, 89-97. [132] Spevack, P. A.; McIntyre, N. S. The Journal of Physical Chemistry 1993, 97 (42), 11031-11036. [133] Farag, H. Energy & Fuels 2002, 16 (4), 944-950. [134] Werfel, F.; Minni, E. Journal of Physics C: Solid State Physics 1983, 16 (31), 6091. [135] Chuang, S.; Battaglia, C.; Azcatl, A.; McDonnell, S.; Kang, J. S.; Yin, X.; Tosun, M.; Kapadia, R.; Fang, H.; Wallace, R. M.; Javey, A. Nano Letters 2014, 14 (3), 1337-1342. [136] Battaglia, C.; Yin, X.; Zheng, M.; Sharp, I. D.; Chen, T.; McDonnell, S.; Azcatl, A.; Carraro, C.; Ma, B.; Maboudian, R.; Wallace, R. M.; Javey, A. Nano Letters 2014, 14 (2), 967-971. [137] McDonnell, S.; Azcatl, A.; Addou, R.; Gong, C.; Battaglia, C.; Chuang, S.; Cho, K.; Javey, A.; Wallace, R. M. ACS Nano 2014, 8 (6), 6265-6272. [138] Schroeder, T.; Zegenhagen, J.; Magg, N.; Immaraporn, B.; Freund, H. J. Surface Science 2004, 552 (1–3), 85-97. [139] Salazar, N.; Beinik, I.; Lauritsen, J. V. Physical Chemistry Chemical Physics 2017, 19 (21), 14020-14029. [140] Su, D. S.; Schlögl, R. Catalysis Letters 2002, 83 (3-4), 115-119. [141] Peuckert, M. The Journal of Physical Chemistry 1985, 89 (12), 2481-2486. [142] Scanlon, D. O.; Watson, G. W.; Payne, D. J.; Atkinson, G. R.; Egdell, R. G.; Law, D. S. L. The Journal of Physical Chemistry C 2010, 114 (10), 4636-4645. [143] Biener, M. M.; Friend, C. M. Surface Science 2004, 559 (2–3), L173-L179. [144] Biener, M. M.; Biener, J.; Schalek, R.; Friend, C. M. The Journal of Chemical Physics 2004, 121 (23), 12010-12016. [145] Wang, D.; Su, D.; Schlögl, R. Crystal Research and Technology 2003, 38 (2), 153-159. [146] Smith, R. L.; Rohrer, G. S. Journal of Solid State Chemistry 1996, 124 (1), 104-115. [147] Kihlborg, L.; Magneli, A. Acta Chemica Scandinavica 1955, 9, 471-474. [148] Song, Z.; Cai, T.; Chang, Z.; Liu, G.; Rodriguez, J. A.; Hrbek, J. Journal of the American Chemical Society 2003, 125 (26), 8059-8066. [149] Biener, M. M.; Biener, J.; Schalek, R.; Friend, C. M. Surface Science 2005, 594 (1–3), 221-230. [150] Chambliss, D. D.; Chiang, S. Surface Science 1992, 264 (1), L187-L192. [151] Dickinson, R. G.; Pauling, L. Journal of the American Chemical Society 1923, 45 (6), 1466-1471. [152] Weber, T.; Muijsers, J. C.; van Wolput, J. H. M. C.; Verhagen, C. P. J.; Niemantsverdriet, J. W. The Journal of Physical Chemistry 1996, 100 (33), 14144-14150.
Page 156
Bibliography
144
[153] Song, I.; Park, C.; Hong, M.; Baik, J.; Shin, H.-J.; Choi, H. C. Angewandte Chemie International Edition 2014, 53 (5), 1266-1269. [154] Kibsgaard, J.; Morgenstern, K.; Lægsgaard, E.; Lauritsen, J. V.; Besenbacher, F. Physical Review Letters 2008, 100 (11), 116104. [155] Kim, D.; Sun, D.; Lu, W.; Cheng, Z.; Zhu, Y.; Le, D.; Rahman, T. S.; Bartels, L. Langmuir 2011, 27 (18), 11650-11653. [156] Arnoldy, P.; van den Heijkant, J. A. M.; de Bok, G. D.; Moulijn, J. A. Journal of Catalysis 1985, 92 (1), 35-55. [157] Magneli, A.; Andersson, G. Acta Chemica Scandinavica 1955, 9, 1378-1381. [158] Kasztelan, S. Langmuir 1990, 6 (3), 590-595. [159] Okabayashi, I.; Fujiwara, H. Journal of Heterocyclic Chemistry 1994, 31 (4), 733-735. [160] Klemm, L. H.; Severns, B.; Wynberg, H. Journal of Heterocyclic Chemistry 1991, 28 (1), 61-64. [161] Perdew, J. P.; Burke, K.; Ernzerhof, M. Physical Review Letters 1996, 77 (18), 3865-3868. [162] Blöchl, P. E. Physical Review B 1994, 50 (24), 17953-17979. [163] Enkovaara, J.; Rostgaard, C.; Mortensen, J. J.; Chen, J.; Dułak, M.; Ferrighi, L.; Gavnholt, J.; Glinsvad, C.; Haikola, V.; Hansen, H. A.; Kristoffersen, H. H.; Kuisma, M.; Larsen, A. H.; Lehtovaara, L.; Ljungberg, M.; Lopez-Acevedo, O.; Moses, P. G.; Ojanen, J.; Olsen, T.; Petzold, V.; Romero, N. A.; Stausholm-Møller, J.; Strange, M.; Tritsaris, G. A.; Vanin, M.; Walter, M.; Hammer, B.; Häkkinen, H.; Madsen, G. K. H.; Nieminen, R. M.; Nørskov, J. K.; Puska, M.; Rantala, T. T.; Schiøtz, J.; Thygesen, K. S.; Jacobsen, K. W. Journal of Physics: Condensed Matter 2010, 22 (25), 253202. [164] Bahn, S. R.; Jacobsen, K. W. Computing in Science & Engineering 2002, 4 (3), 56-66. [165] Arrouvel, C.; Breysse, M.; Toulhoat, H.; Raybaud, P. Journal of Catalysis 2005, 232 (1), 161-178.