1 ATOMIC SCALE OBSERVATIONS OF BAINITE TRANSFORMATION IN A HIGH CARBON HIGH SILICON STEEL F.G. Caballero 1 , M.K. Miller 2 , S.S. Babu 3 , and C. Garcia-Mateo 1 1 Centro Nacional de Investigaciones Metalúrgicas (CENIM-CSIC); Avda Gregorio del Amo, 8; Madrid, E-28040, Spain 2 Oak Ridge National Laboratory (ORNL), Materials Science and Technology Division; P.O. Box 2008, Oak Ridge, TN 37831-6136, USA 3 Edison Welding Institute, Technical Division; 1250 Arthur E Adams Drive, Columbus, Ohio 43221-3585, USA Keywords: Bainite transformation, high silicon steel, atom probe tomography Abstract A fine-scale bainitic microstructure with high strength and high toughness has been achieved by transforming austenite at 200 ºC. X-ray diffraction analysis showed the carbon concentration of these bainitic ferrite plates to be higher than expected from paraequilibrium. Atom probe tomography revealed that a substantial quantity of carbon was trapped at dislocations in the vicinity of the ferrite/austenite interface. These results suggest that the carbon trapping at dislocations prevents the decarburization of supersaturated bainitic ferrite and therefore alters the carbide precipitation sequence during low temperature bainite formation. Keywords: Bainitic steel, phase transformation, atom-probe field-ion microscopy (AP-FIM) Introduction Previous research has shown that a steel with ~2 wt% of silicon can, in appropriate circumstances, lead to a carbide-free bainitic microstructure. In such steels, the bainitic microstructure consists of a mixture of bainitic ferrite and carbon-enriched residual austenite. The presence of silicon retards the precipitation of cementite from austenite because of its low- solid solubility in the cementite crystal structure. Cementite is a cleavage and void-initiating phase and therefore elimination of the same is expected to yield high-strength and high- toughness bainitic microstructure. In agreement with this hypothesis, with careful alloy design and using phase transformation theories, steels with impressive combinations of strength and toughness can be developed [1-11]. In particular, the experimental validations based on this design, lead to a new carbide-free bainitic steel with a very high toughness (30 MPam 1/ 2 ) and strength of 2500 MPa [8-11]. In this steel, the bainitic microstructure was obtained by transforming at temperatures as low as 200 ºC. At this temperature, within the given time- scales, the diffusion of iron or substitutional solutes is very sluggish. The low B S (bainitic start) temperature is a consequence of the high carbon content and, to a lesser extent, the addition of solutes such as manganese and chromium which in the present context increase the stability of austenite relative to ferrite. As a result of the low transformation temperature, the bainite plate widths of 20-40 nm thick were achieved, which in turn leads to high strength. Therefore, this alloy can be considered as a bulk nanocrystalline material that can be obtained by cheap manufacturing route without expensive processing. Extensive transmission electron microscopy (TEM) of this novel microstructure has failed to reveal carbide particles inside the bainitic ferrite. This is indeed an interesting observation, since at these temperatures, the steel with such high carbon levels would transform to a lower- * Text only
Transcript
1
ATOMIC SCALE OBSERVATIONS OF BAINITE TRANSFORMATION
IN A HIGH CARBON HIGH SILICON STEEL
F.G. Caballero1, M.K. Miller2, S.S. Babu3, and C. Garcia-Mateo1
1 Centro Nacional de Investigaciones Metalúrgicas (CENIM-CSIC); Avda Gregorio del Amo, 8; Madrid, E-28040, Spain
2 Oak Ridge National Laboratory (ORNL), Materials Science and Technology Division; P.O. Box 2008, Oak Ridge, TN 37831-6136, USA
3 Edison Welding Institute, Technical Division; 1250 Arthur E Adams Drive, Columbus, Ohio 43221-3585, USA
Keywords: Bainite transformation, high silicon steel, atom probe tomography
Abstract
A fine-scale bainitic microstructure with high strength and high toughness has been achieved by transforming austenite at 200 ºC. X-ray diffraction analysis showed the carbon concentration of these bainitic ferrite plates to be higher than expected from paraequilibrium. Atom probe tomography revealed that a substantial quantity of carbon was trapped at dislocations in the vicinity of the ferrite/austenite interface. These results suggest that the carbon trapping at dislocations prevents the decarburization of supersaturated bainitic ferrite and therefore alters the carbide precipitation sequence during low temperature bainite formation. Keywords: Bainitic steel, phase transformation, atom-probe field-ion microscopy (AP-FIM)
Introduction Previous research has shown that a steel with ~2 wt% of silicon can, in appropriate circumstances, lead to a carbide-free bainitic microstructure. In such steels, the bainitic microstructure consists of a mixture of bainitic ferrite and carbon-enriched residual austenite. The presence of silicon retards the precipitation of cementite from austenite because of its low-solid solubility in the cementite crystal structure. Cementite is a cleavage and void-initiating phase and therefore elimination of the same is expected to yield high-strength and high-toughness bainitic microstructure. In agreement with this hypothesis, with careful alloy design and using phase transformation theories, steels with impressive combinations of strength and toughness can be developed [1-11]. In particular, the experimental validations based on this design, lead to a new carbide-free bainitic steel with a very high toughness (30 MPam1/2) and strength of 2500 MPa [8-11]. In this steel, the bainitic microstructure was obtained by transforming at temperatures as low as 200 ºC. At this temperature, within the given time-scales, the diffusion of iron or substitutional solutes is very sluggish. The low BS (bainitic start) temperature is a consequence of the high carbon content and, to a lesser extent, the addition of solutes such as manganese and chromium which in the present context increase the stability of austenite relative to ferrite. As a result of the low transformation temperature, the bainite plate widths of 20-40 nm thick were achieved, which in turn leads to high strength. Therefore, this alloy can be considered as a bulk nanocrystalline material that can be obtained by cheap manufacturing route without expensive processing. Extensive transmission electron microscopy (TEM) of this novel microstructure has failed to reveal carbide particles inside the bainitic ferrite. This is indeed an interesting observation, since at these temperatures, the steel with such high carbon levels would transform to a lower-
* Text only
2
bainitic microstructure. After extensive aging at 200 ºC for 2 weeks, just a few 20 nm wide and 175 nm long cementite particles have been observed in a thicker bainitic ferrite plate [11]. The difference between upper and lower bainite comes from a competition between the rate at which carbides can precipitate from ferrite and the rate with which carbon is partitioned from supersaturated ferrite into austenite [12]. The precipitation of cementite from lower bainite can occur at temperatures below 125 ºC, in time periods too short to allow any substitutional diffusion of iron atoms. The long-range diffusion of carbon atoms is of course necessary, but because carbon resides in interstitial solution, it can be very mobile at temperatures as low as –60 ºC [13]. The formation of cementite or other transition carbides of iron such as ε-carbide, in these circumstances of incredibly low atomic mobility, must differ from diffusional decomposition reactions. It has been suggested that [14] the cementite lattice is generated by a displacive mechanism with paraequilibrium i.e. an homogeneous deformation of supersaturated ferrite combined with the necessary diffusion of carbon. The X-ray diffraction analysis indicated that the carbon concentration in the bainitic ferrite was much higher than that expected from paraequilibrium thermodynamics between austenite and ferrite [11]. This supersaturation was attributed to the trapping of carbon at the dislocations in the bainitic ferrite. Using transmission electron microscopy, Smith [15] estimated a mean dislocation density of 4x10¹⁴ m-2 in a Fe-0.07C-0.23Ti wt-% alloy when isothermally transformed to bainite at 650 ºC. This relatively high dislocation density is attributed to the fact that shape deformation accompanying displacive transformations is accommodated partially by plastic relaxation [16]. However, no direct observation has been yet reported of the interstitial carbon Cottrell atmosphere in bainitic ferrite. Therefore, the high dislocation density in bainitic microstructures may play an important role on transformation processes such as the decarburization of supersaturated ferrite. The goals of this work are to analyze solute redistribution between ferrite and austenite as well as to evaluate the hypothesis of carbon trapping at dislocations within bainitic ferrite by atom probe tomography.
Experimental Procedure The chemical composition of the steel studied is given in Table I. The alloy was supplied as a cast ingot, samples of which were then homogenized at 1200 oC for 48 h in partially evacuated sealed quartz capsules that were flushed with argon. The sealed samples were cooled in air following the homogenization heat treatment. The martensite-start (Ms) temperature of the steel was measured by dilatometry monitoring the related change in dilatation with temperature. A value of Ms = 120 ºC was recorded on dilatometric curves. Homogenized specimens were austenitized for 15 min. at 1000 ºC, and then isothermally transformed at temperature in the range 200-325 ºC for different times before quenching into water. Quantitative X-ray analysis was used to determine the volume fraction of retained austenite. After grinding and final polishing with a 1 µm diamond paste, the samples were etched to obtain an undeformed surface. Moreover, transmission electron microscopy (TEM) specimens were machined to 3 mm diameter rods and electropolished with a twin-jet electropolisher at room temperature in a mixture of 5 % perchloric acid, 15 % glycerol and 80 % methanol at 40 V until perforation occurred. Atom probe tomography specimens (See Table II for details) were cut from bulk material and electropolished with the standard double layer and micropolishing methods [17]. Atom probe analyses were performed in the ORNL local electrode atom probe. The large field of view and rapid analysis capability of this instrument facilitated the analysis of dislocations in these materials. The local electrode atom probe was operated with a specimen temperature of 60K, a pulse repetition rate of 200 kHz, and a pulse fraction of 20%.
3
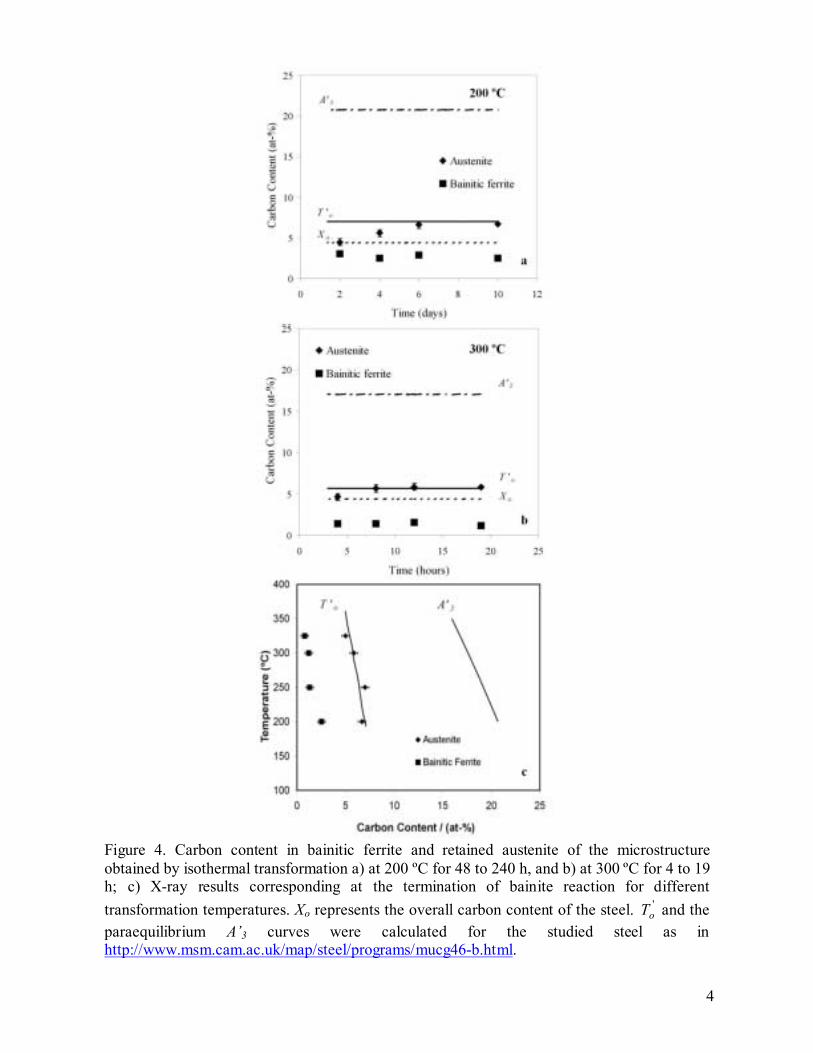
Results and Discussion Kinetics of Bainite Transformation Micrographs after isothermal transformation of austenite to bainitic ferrite at 200 and 300 oC at different time intervals are illustrated in Fig. 1. After 24 h of holding time at 200 ºC, bainite transformation has not started and a mixture of martensite and retained austenite is obtained by quenching (Fig. 1a). A longer annealing time (48 h) at this temperature was required to obtain a significant amount of bainitic transformation, as shown in Fig. 1b. Transformation is completed after 144 h of holding time when a fully bainitic microstructure is obtained (Fig. 1c). The rate of transformation increased at 300 ºC. For example, a visible amount of bainitic microstructure (~10 %) was observed at 300 ºC after 4 h of transformation. A fully bainitic microstructure was achieved at this temperature after 12 h (see Fig. 1d and 1f). An intermediate stage in the transformation a t 300 ºC is shown in Fig. 1e. The evolution of phases present in the microstructure formed at both 200 and 300 ºC as a function of time are shown in Fig. 2. X-ray analysis was used to estimate the quantities of retained austenite present in the microstructure. The retained austenite fraction is expected to increase for the higher transformation temperature. Transmission Electron Microscopy Examination The TEM micrographs in Fig. 3 illustrate that a carbide-free bainitic microstructure is formed at 200 and 300 ºC. Moreover, bainitic plates are long and thin, giving an elegant fine scale mixture of austenite and bainitic ferrite. Dislocation debris is evident in both the bainitic ferrite and the surrounding austenite, as shown in Fig. 3c. Quite remarkably, the plates formed at 200 ºC (Fig. 3a) have a width that is less than 50 nm, with each plate separated by an films of retained austenite. The increased toughness of the steel, with high hardness (600 HV) and high ultimate tensile strength in excess of 2.5 GPa is attributed to the fine scale nature of this microstructure [11]. Analysis indicates that the largest effects on plate thickness are the strength of the austenite, the free energy change accompanying transformation and a small independent effect due to transformation temperature [18]. The observed refinement is a consequence mainly of the high carbon content and the low transformation temperature on enhancing the strength of the austenite. As the yield strength of the austenite decreases with increasing temperatures, it is expected that the plates become thicker, as shown in Fig. 3b. X-Ray Analysis: Carbon Distribution during Transformation One consequence of diffusionless growth in bainitic transformation is that the plates can be supersaturated with carbon, in which case the carbon partitions into the residual austenite soon after the growth event. Diffusionless growth of this kind can only occur if the carbon concentration of the parent austenite is less than that given by the oT ′ curve. The To curve is the locus of all points, on a temperature versus carbon concentration plot, where austenite and ferrite of the same chemical composition have the same free energy. The oT ′ curve is defined similarly but taking into account the stored energy of the ferrite due to the displacive mechanism of transformation (400 J mol-1) [19]. The carbon concentrations of the austenite and bainitic ferrite as determined from X-ray analysis are presented in Fig. 4. The evolution of carbon in austenite and bainitic ferrite during transformation a t 200 and 300 ºC is shown in Figs. 4a and b. Similarly, the carbon content of the austenite and bainitic ferrite at the termination of bainite reaction for different
4
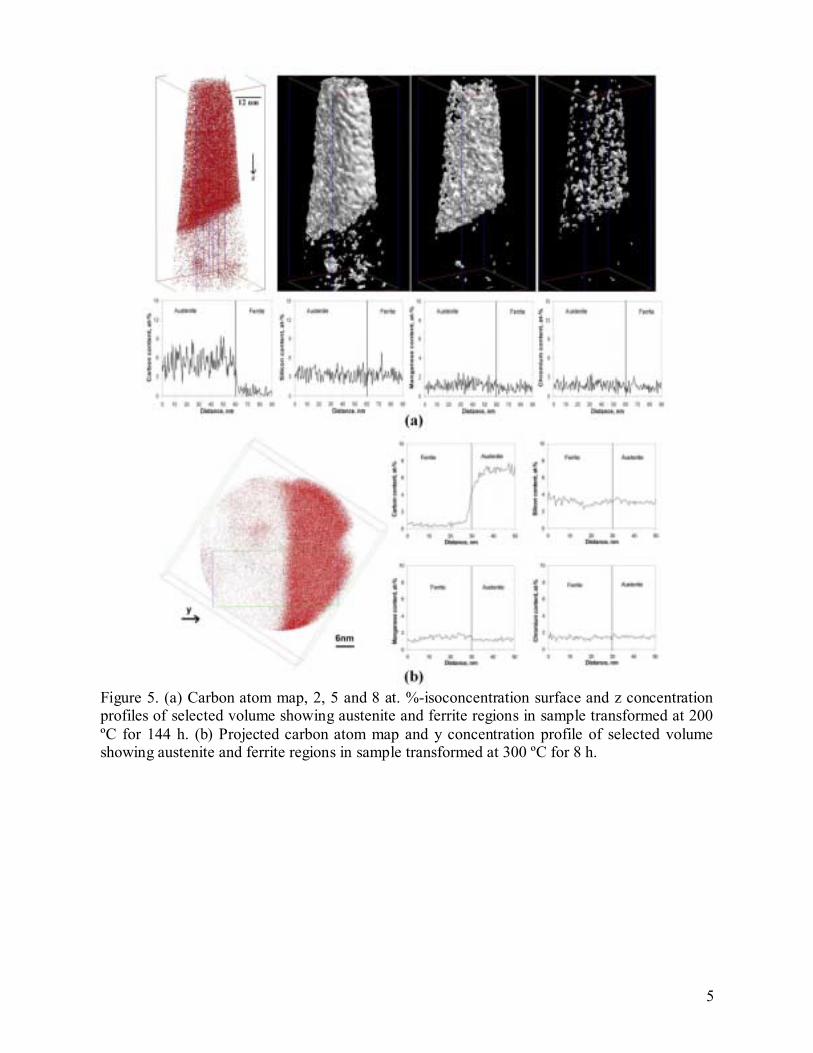
transformation temperatures is shown in Fig. 4c. The measured concentrations in austenite lie closer to the oT ′ value boundary and far from the paraequilibrium phase boundary. This trend is consistent with a mechanism in which the bainite grows without any diffusion, but with excess carbon partitioning into the austenite soon after transformation. The reaction is said to be incomplete since transformation stops before the phases achieve their equilibrium compositions. The X-ray data also indicate that despite the significant fraction of bainite, austenite is not greatly enriched in carbon. This is only possible if a substantial quantity of carbon is trapped in the bainitic ferrite. The experimental results shown in Fig. 4 reveal that there is a significant amount of carbon in solid solution in the ferrite, about ten times higher than that expected from paraequilibrium between austenite and ferrite (~0.12 at. % C). Atom Probe Tomography Carbon Distribution during Transformation.- Two carbon atom maps obtained from the material annealed at 200 ºC for 144 h and at 300 ºC for 8 h are shown in Fig. 5. The distribution of carbon atoms in the analysis volume is not uniform and carbon-rich and carbon-depleted regions are clearly distinguishable. As no crystallographic information was available, the carbon-enriched regions of the atom maps are assumed to represent a region of austenite as its carbon content is higher than the average value of 4.3 at. % and the low carbon (< 1 at. %) regions indicates the ferrite phase. This figure shows two examples of an austenite-ferrite interface for two different transformation temperatures. For instance, comparison of atom probe results shown in Fig. 5 and the corresponding X-ray analysis is presented in Table III. In most cases, the atom probe results on carbon content of both bainitic ferrite and austenite are lower than those measured by X-ray. This is because the atom probe estimate is a simple counting of atoms within the selected volume of matrix of ferrite or austenite that does not contain any carbon enriched regions such as dislocations and boundaries and not an average of a larger volume that may be enriched in carbon as in the x-ray estimate. However, both techniques confirm the small extent of carbon enrichment in the residual austenite compared to nominal carbon concentration of the steel and the high level of carbon in bainitic ferrite, well beyond the expected from paraequilibrium with austenite (~0.12 at. % C). Atom probe results also indicate that the amount of carbon in bainitic ferrite increases as the transformation temperature decreases. It is also clear from the atom probe data in Fig. 5 that there is no significant segregation of either substitutional elements or carbon to the austenite-ferrite interface. Consistently with previous atom probe work [20], quantitative data confirms the absence of any partitioning of the substitutional elements between the phases involved. The results are fully consistent with the diffusionless transformation of austenite to bainite [21]. The absence of any significant carbon build-up at the interface indicates that the interface must be semi-coherent, with a high degree of coherency, consistent with the shape change effect mentioned earlier. Thus, the interface may not provide a very large sink for carbon atoms. Carbon Trapped at Defects.- A carbon atom map obtained from the sample annealed at 200 ºC for 48 h is shown in Fig. 6a. The carbon-enriched region at the top-left of the atom map represents austenite and the low carbon regions indicate the ferrite phase. Finally, the linear features with significant levels of carbon are speculated to be dislocations in the vicinity of a ferrite/austenite interface. The 5 at.% carbon isoconcentration surface outlines the carbon-enriched region around the dislocation. The carbon, manganese, molybdenum and silicon atom maps of a selected volume orientated normal to a linear segment of the dislocation are shown in Fig. 6b. It is evident from these atom maps that dislocations only trap the carbon atoms as
5
originally suggested by Kalish and Cohen [22]. The lateral extent of the Cottrell atmosphere in the vicinity of the dislocation was estimated from the envelope method [17] in terms of a radius of gyration to be lg(x) = 2.1 nm and lg(y)=2.5 nm (i.e., an extent of 5-6 nm). The average carbon level of the Cottrell atmosphere was estimated to be 7.4 ± 0.1 at. % C. This value is in good agreement with the prediction of Cochardt et al. of a saturation carbon concentration of 6-7 at.% in the region one Burgers vector around the core [23]. Wilde et al. also observed a maximum carbon concentration within a dislocation atmosphere of 8 at. % C from an energy-compensated optical position-sensitive atom probe analysis of a quenched and room temperature aged Fe-C alloy [24]. The relatively high dislocation density associated with bainitic ferrite is often attributed to the fact that the shape deformation accompanying the displacive transformation is accommodated at least partially by plastic relaxation. Then the resulting dislocation debris introduced into the austenite can be inherited by any bainite that forms subsequently [16]. Plastic relaxation may also follow in the bainite itself, since the yield stresses of both ferrite and austenite decrease with increasing transformation temperature. Plastic relaxation of the shape change has been observed experimentally, when prepolished samples of austenite are transformed to bainite, the adjacent austenite surface does not remain planar but, instead, exhibits curvature which is characteristic of slip deformation [25]. Observations of the transformation using hot-stage TEM revealed that the growth of bainite is accompanied by the formation of dislocations in and around the bainite [26], and direct observations of the austenite/ferrite interface also provide evidence of plastic accommodation in both phases [27]. Sandvik and Nevalainen [28] demonstrated that the austenite adjacent to the bainitic ferrite undergoes twinning deformation and that the density of twins increases as the transformation temperature decreases. It is known that impurities such as phosphorus, calcium and silicon boundaries can segregate on incoherent twin boundaries with high free volume [29-31]. Concentration profile in Fig. 7 shows a very fine scale modulation normal to the parallel carbon-enriched regions of the carbon atom map for a sample transformed at 300 ºC for 4 h. It is speculated that carbon may be also segregated at microtwins in retained austenite (average carbon content of 5.3 at. %). It is believed that solute segregation on defects associated with plastic relaxation in austenite, as those presented in Figs. 6 and 7, plays an important role on carbon redistribution during bainite transformation. Dislocations in austenite are inherited in the bainite after transformation, and segregation at dislocations is expected to bind and hence prevent or hinder the carbon atoms from diffusing out of the ferrite lattice. This explains the high level of carbon that exists in the bainitic ferrite after transformation and the small extent of carbon enrichment detected in the residual austenite and. Moreover, the increase in the amount of carbon in bainitic ferrite as the transformation temperature decreases is consistent with the fact that the dislocation density of bainitic ferrite is higher the lower the reaction temperature [32]. Cementite Formation in Lower Bainite.- Matas and Hehemann [33] first suggested that the initial carbide in lower bainite is ε-carbide, which is subsequently replaced by cementite. The rate at which the ε-carbide converts to cementite increases with temperature, but also depends on the steel composition. In fact, a high silicon concentration retards the reaction, as is commonly observed in the tempering of martensite [34]. The detection of ε-carbide instead of cementite in lower bainite implies the existence of a carbon supersaturation in bainitic ferrite [35]. However, ε-carbide is not always found as a precursor to the precipitation of cementite in lower bainite. Bhadeshia and Edmonds failed to detect ε-carbide in a high silicon medium carbon steel even during the early stages of the lower bainite transformation [27]. This has been the case in the present investigation. Initially, transmission electron microscopy (TEM) was unable to reveal carbide particles inside bainitic ferrite; however, after a large and equivalent
6
set of accumulated atom probe results, cementite has been identified as the lower bainite carbide despite the high carbon and high silicon content of the steel used. An example of carbide particle precipitated inside bainitic ferrite for a sample transformed at 200 ºC for 240 h is shown in carbon and silicon atoms maps and concentration profiles presented in Fig. 8. The carbon level allows identifying the type of carbide precipitated inside bainitic ferrite (∼ 25 at-% for cementite and ∼ 30 at-% for ε-carbide). Beside the apparent low carbon concentration of cementite, it is clear from these results that para-cementite is observed. In earlier atom probe works on steels, apparent low carbon concentratios of cementite were also reported [36-38].These results are consistent with those reported for cementite precipitation in martensite during the early stages of tempering [36,39]. Although the carbon concentration changes at the cementite-ferrite interface, silicon does not change at all through the interface, indicating that the concentration of silicon is uniform throughout both phases. Since silicon does not partition and is expected to favour the precipitation of ε-carbide, the absence of ε-carbide precipitation in this high carbon bainitic steel can be only rationalized in terms of carbon trapping at dislocations as the theory of tempering due to Kalish and Cohen [22]. Thus, atom probe results in Figs. 6 and 8 confirm that the ε-carbide stage is missed in the precipitation sequence due to the high carbon tied up at the dislocations.
Conclusions A local electrode atom probe has been used to characterize bainitic microstructures formed at 200 and 300 ºC in a high carbon high silicon bainitic steel. Atom probe tomography revealed that a substantial quantity of carbon (7.4 at. % C) was trapped at dislocations in the vicinity of the ferrite/austenite interface. Carbon trapping at dislocations prevents the decarburization of supersaturated ferrite and in some extent alters the carbide precipitation sequence during low temperature bainite formation. Moreover, the distribution of alloying elements across austenite-ferrite interface during transformation was analyzed. Results indicated that no partitioning of substitutional elements occurred during bainite transformation. These results were explained in terms of the diffusionless growth of bainite sub-units. These results provide the first direct observation of carbon Cottrell Atmospheres in bainitic ferrite.
Acknowledgement The authors acknowledge financial support from European Coal and Steel Community (ECSC 7210-PR-345). CGM would like to thank Spanish Ministerio de Ciencia y Tecnología for the financial support in the form of a Ramón y Cajal contract (Programas RyC 2004). Research at the Oak Ridge National Laboratory SHaRE User Facility was sponsored by the Office of Basic Energy Sciences, U.S. Department of Energy, under contract DE-AC05-00OR22725 with UT-Battelle, LLC. Authors also would like to express their special acknowledgement to Prof. H.K.D.H. Bhadeshia for helpful discussions.
References
1. Bhadeshia HKDH, Edmonds DV. Metal Sci 1983; 17: 411 2. Bhadeshia HKDH, Edmonds DV. Metal Sci 1983; 17: 420 3. Miihkinen VTTD, Edmonds DV. Mater Sci Tech 1987; 3: 422 4. Miihkinen VTTD, Edmonds DV. Mater Sci Tech 1987; 3: 432. 5. Miihkinen VTTD, Edmonds DV. Mater Sci Tech 1987; 3: 441 6. Caballero FG, Bhadeshia HKDH, Mawella JA, Jones DG, Brown P. Mater Sci Tech 2001;
17: 512
7
7. Caballero FG, Bhadeshia HKDH, Mawella JA, Jones DG, Brown P. Mater Sci Tech 2001; 17: 517
8. Caballero FG, Bhadeshia HKDH, Mawella JA, Jones DG, Brown P. Mater Sci Tech 2002; 18: 279
9. García-Mateo C, Caballero FG, Bhadeshia HKDH. ISIJ Int 2003; 43: 1238 10. García-Mateo C, Caballero FG, Bhadeshia HKDH. ISIJ Int 2003; 43: 1821 11. Caballero FG, Bhadeshia HKDH. Current Opinion in Solid State and Materials Science
2004; 8, 251. 12. Takahashi M, Bhadeshia HKDH. Mater Sci Tech 1990; 6: 592 13. Winchell PG, Cohen M. Trans. ASM 1962; 55: 347 14. Yakel HC. Int. Met. Rev. 1985; 30: 17 15. Smith GM. PhD Thesis, University of Cambridge, UK, 1984. 16. Bhadeshia HKDH, Christian JW. Metall Trans 1990; 21A: 767 17. Miller MK. Atom Probe Tomography. Kluwer Academic/Plenum Press (NY), 2000. p.28
and p. 158. 18. Singh SB, Bhadeshia HKDH. Mat Sci Eng A 1998; 245: 72 19. Bhadeshia HKDH. Acta Metall 1981; 29: 1117 20. Bhadeshia HKDH, Waugh AR. Acta Metall 1982; 30: 775 21. Bhadeshia HKDH, Edmonds DV. Acta Metall 1980; 28: 1265 22. Kalish D, Cohen M. Mater Sci Eng 1970; 6: 156 23. Cochardt A, Schoeck G, Wiedersich H. Acta Metall 1955; 3: 533 24. Wilde J, Cerezo A, Smith GDW. Scripta Mater 2000; 43: 39 25. Srinivasan GR, Wayman CM. Acta Metall 1968; 16: 621 26. Nemoto M. High voltage electron microscopy. Academic Press (NY), 1974. p. 230 27. Bhadeshia HKDH, Edmonds DV. Metall Trans 1979; 10A: 895 28. Sandvik BPJ, Nevalainen HP. Met Technol 1981; 15: 213. 29. Ogura T, McMahon CJ, Feng HC, Vitek V. Acta Metall 1978; 26: 1317 30. Ogura T, Watanabe T, Karashima S, Masumoto T. Acta Metall 1987; 35: 1807 31. Swiatnicki W, Lartigue-Korinek S, Laval JY. Acta Metall Mater 1995; 43; 795 32. Fondekar MK, Rao AM, Mallik AK. Metall Trans 1970; 1: 885 33. Matas SJ, Hehemann RF. Trans AIME 1968; 221: 179 34. Owen WS. Trans ASM 1954; 46: 812 35. Roberts CS, Averbach BL, Cohen M. Trans ASM 1957; 45: 576 36. Babu SS, Hono K, Sakurai T. Metall Mater Trans 1994; 25A: 499 37. Miller MK, Beaven PA, Brenner SS, Smith GDW. Metall Trans 1983; 14: 1021 38. Sha W, Smith GDW. Surf Sci 1992; 266: 416 39. Thomson RC, Miller MK. Acta Mater 1998; 46: 2203
Figure 1. Microstructure formed by isothermal transformation at (a) 200 ºC for 24 h; (b) 200 ºC for 48 h; (c) 200 ºC for 144 h; (d) 300 ºC for 4 h; (e) 300 ºC for 8 h and (f) 300 ºC for 12 h.
Figure(s)
2
Figure 2. Phase fractions of the microstructure obtained by isothermal transformation at 200 ºC and 300 ºC for several times.
3
Figure 3. Transmission electron micrographs of microstructure obtained at (a) 200 ºC for 240 h, and (b) and (c) 300 ºC for 8 h.
4
Figure 4. Carbon content in bainitic ferrite and retained austenite of the microstructure obtained by isothermal transformation a) at 200 ºC for 48 to 240 h, and b) at 300 ºC for 4 to 19 h; c) X-ray results corresponding at the termination of bainite reaction for different transformation temperatures. Xo represents the overall carbon content of the steel. '
oT and the paraequilibrium A’3 curves were calculated for the studied steel as in http://www.msm.cam.ac.uk/map/steel/programs/mucg46-b.html.
5
Figure 5. (a) Carbon atom map, 2, 5 and 8 at. %-isoconcentration surface and z concentration profiles of selected volume showing austenite and ferrite regions in sample transformed at 200 ºC for 144 h. (b) Projected carbon atom map and y concentration profile of selected volume showing austenite and ferrite regions in sample transformed at 300 ºC for 8 h.
6
Figure 6. (a) Carbon atom map and 5 at. %-isoconcentration surface of dislocations in the vicinity of a ferrite/austenite interface (54 nm x 52 nm x 99 nm), and (b) projected atom maps showing carbon segregation about dislocation in a sample transformed at 200 ºC for 48 h..
7
Figure 7. Carbon atom map and z concentration profile showing carbon segregation about microtwins in retained austenite for a sample transformed at 300 ºC for 4 h.
8
Figure 8. Carbon and silicon atom maps, and z concentration profiles of selected volume showing cementite particle precipitated inside bainitic ferrite in sample transformed at 200 ºC for 240 h.