12
| Date post: | 19-Jul-2015 |
| Category: |
Economy & Finance |
| Upload: | ats-investments |
| View: | 26 times |
| Download: | 0 times |


Company Details
Shilpa Medicare Limited was established in 1987. It is engaged in the manufacture and sale of bulk drugs and
intermediates in India. It offers oncology products, active pharmaceutical ingredients, fine chemicals, herbal
products, and specialty chemical products. The company also exports its products to the United States,
Canada, Australia, and Japan; European countries, such as Germany, Switzerland, the Netherlands, Belgium,
Spain, Greece, Cyprus, Italy, the United Kingdom, etc.; South American countries, including Mexico, Brazil,
Columbia, etc.; African countries comprising Kenya, Nigeria, West Indies, etc.; and Asian countries consisting
of Singapore, Taiwan, China, Malaysia, and Thailand.
Shilpa Medicare has increasingly established itself as one of few companies with integrated development,
manufacturing and commercial expertise in complex sector of generic pharmaceuticals. We have a formidable
track record of development Currently the company is handling about 50 niche products in 8 manufacturing
sites and 2 R&D centers. All the APIs and formulations are manufactured according to established
international norms and rules. Vertical integration with own APIs creates a synergistic effect in the business
dealings and the end products on offer which includes a complete range of products spanning across
injectable, oral drugs as well as new drug delivery solutions.
The company has evolved into a knowledge driven, R&D focused company aspiring to bring advanced,
effective treatments at an affordable cost. With the overarching goal of providing affordable health and quality
of life, the scientists are constantly trying to break new grounds in the development of medicines in cost
effective manner thus passing on the price benefit to the clients and ultimately to patients. T
he current market capitalization stands at Rs 3,599.31 crore. The company has reported a consolidated sales
of Rs 153.66 crore and a Net Profit of Rs 17.16 crore for the quarter ended Sep 2014.
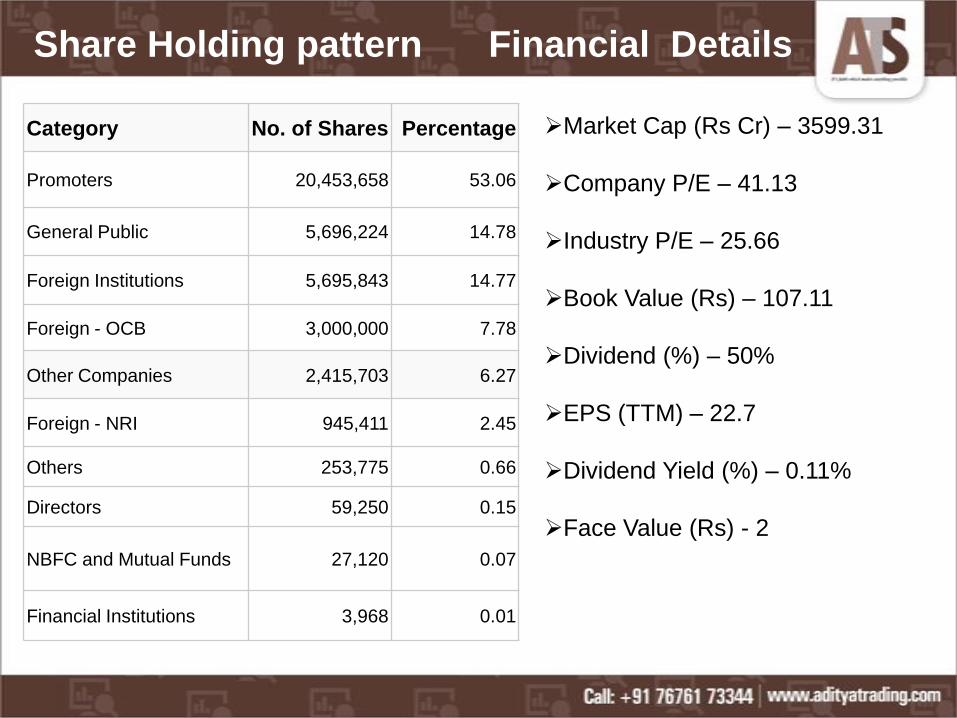
Category No. of Shares Percentage
Promoters 20,453,658 53.06
General Public 5,696,224 14.78
Foreign Institutions 5,695,843 14.77
Foreign - OCB 3,000,000 7.78
Other Companies 2,415,703 6.27
Foreign - NRI 945,411 2.45
Others 253,775 0.66
Directors 59,250 0.15
NBFC and Mutual Funds 27,120 0.07
Financial Institutions 3,968 0.01
Market Cap (Rs Cr) – 3599.31
Company P/E – 41.13
Industry P/E – 25.66
Book Value (Rs) – 107.11
Dividend (%) – 50%
EPS (TTM) – 22.7
Dividend Yield (%) – 0.11%
Face Value (Rs) - 2
Share Holding pattern Financial Details

Industry Details
The global pharmaceutical industry is expected to be worth more than $ 1 trillion in 2014, growing at the
compound annual growth rate of 4-5% over the five year period. The global pharmaceutical industry is a
multinational industry that is a highly regulated, capital intensive, and which is driven by large research and
development expenditures. The industry is primarily privately owned and is technologically sophisticated. The
strong growth in the developed and emerging countries will help to boost sales over the next five years.
Emerging markets such as China, South Korea, Brazil, Russia and Turkey have been experienced double-
digit growth signaling an important shift occurring in the pharmaceutical industry. As growth in the mature
markets is coming to flat, industry attention is shifting to smaller, developing markets that are doing
exceptionally well. Many of these developing nations are experiencing significant gross domestic product
growth which helps finance the healthcare systems, increase patient access and fuels the double digit growth.
Pharmaceutical measures are gearing up to the challenges of meeting the unmet needs of these markets.
India’s pharma industry accounts for about 1.4 per cent of the global pharma industry in value terms and 10
per cent in volume terms. Among the fastest growing pharma industries in the world, India’s pharmaceutical
sector is expected to expand at a compound annual growth rate (CAGR) of 12.1 per cent during 2012–2020
and reach US$ 45 billion. By 2020, the country is expected to be within the top three pharmaceutical markets
by incremental growth and sixth largest market globally in absolute size.
Currently, Indian drugs are exported to more than 200 countries in the world, with the US as the key market. It
is responsible for about 40 per cent of the generic and over-the-counter drugs consumed in the US. During the
year 2013 Foreign Direct Investment (FDI) into the Indian pharmaceutical sector has more than doubled. The
share of generic drugs is expected to continue increasing. Oncology will be a key area of growth in India’s
healthcare sector. With increase in emphasis on health coverage both by central and state governments,
spending on coverage of medicines for oncology will see substantial rise in next 3-5 years

Balance Sheet
Mar '14 Mar '13 Mar '12 Mar '11 Mar '10
Sources Of Funds
Total Share Capital 7.36 4.90 4.90 4.80 4.40
Equity Share Capital 7.36 4.90 4.90 4.80 4.40
Reserves 405.21 325.88 282.39 226.03 107.79
Networth 412.57 330.78 287.29 235.21 112.19
Secured Loans 59.40 82.14 40.81 50.97 67.47
Unsecured Loans 0.00 0.00 0.00 0.00 1.53
Total Debt 59.40 82.14 40.81 50.97 69.00
Total Liabilities 471.97 412.92 328.10 286.18 181.19
Application Of Funds
Gross Block 338.25 212.44 187.96 163.00 155.96
Less: Accum. Depreciation 80.59 59.89 47.12 35.90 28.02
Net Block 257.66 152.55 140.84 127.10 127.94
Capital Work in Progress 49.24 114.27 55.27 3.01 3.06
Investments 75.20 87.29 101.13 28.08 3.69
Inventories 108.95 66.13 59.87 37.44 43.65
Sundry Debtors 60.31 31.88 33.19 33.63 31.49
Cash and Bank Balance 0.81 10.53 1.95 0.89 0.24
Total Current Assets 170.07 108.54 95.01 71.96 75.38
Loans and Advances 74.68 44.26 29.74 32.09 43.23
Fixed Deposits 0.00 0.00 0.00 82.86 1.85
Total CA, Loans & Advances 244.75 152.80 124.75 186.91 120.46
Current Liabilities 149.22 89.88 90.52 41.05 52.02
Provisions 5.66 4.11 3.36 17.87 21.93
Total CL & Provisions 154.88 93.99 93.88 58.92 73.95
Net Current Assets 89.87 58.81 30.87 127.99 46.51
Total Assets 471.97 412.92 328.11 286.18 181.20
Contingent Liabilities 43.00 39.58 39.58 5.04 4.01
Book Value (Rs) 112.15 134.88 117.15 96.08 50.94

Profit and Loss Account
Mar '14 Mar '13 Mar '12 Mar '11 Mar '10
Income
Sales Turnover 527.37 328.20 279.76 263.37 240.67
Excise Duty 0.00 0.00 0.00 5.82 5.43
Net Sales 527.37 328.20 279.76 257.55 235.24
Other Income 8.85 4.91 8.42 8.62 4.16
Stock Adjustments 11.83 -3.71 17.01 -8.84 14.67
Total Income 548.05 329.40 305.19 257.33 254.07
Expenditure
Raw Materials 317.80 201.73 192.02 145.42 143.03
Power & Fuel Cost 15.55 8.83 7.63 5.67 4.52
Employee Cost 42.13 25.60 19.51 17.59 12.12
Other Manufacturing Expenses 0.00 0.00 0.00 2.11 2.15
Selling and Admin Expenses 0.00 0.00 0.00 6.98 8.96
Miscellaneous Expenses 46.00 23.51 21.80 1.14 0.93
Total Expenses 421.48 259.67 240.96 178.91 171.71
Operating Profit 117.72 64.82 55.81 69.80 78.20
PBDIT 126.57 69.73 64.23 78.42 82.36
Interest 3.40 1.36 1.49 2.27 5.49
PBDT 123.17 68.37 62.74 76.15 76.87
Depreciation 21.09 12.75 11.44 10.42 9.76
Profit Before Tax 102.08 55.62 51.30 65.73 67.11
PBT (Post Extra-ord Items) 102.08 55.62 51.30 65.82 67.35
Tax 21.23 9.65 11.54 14.91 21.23
Reported Net Profit 80.86 45.96 39.75 50.93 46.01
Total Value Addition 103.67 57.94 48.94 33.50 28.69
Equity Dividend 3.86 3.19 2.21 1.92 1.54
Corporate Dividend Tax 0.66 0.52 0.36 0.32 0.26
Per share data (annualised)
Shares in issue (lakhs) 367.86 245.24 245.24 240.24 220.24
Earning Per Share (Rs) 21.98 18.74 16.21 21.20 20.89
Equity Dividend (%) 50.00 65.00 45.00 40.00 35.00

Dividend and Bonus History

Index and Price Comparison

Company Forecast

PBIT – 18.01 v/s 15.62
RoCE – 22.34 v/s 13.82
RoE – 21.75 v/s 14.87
Net Profit Margin – 15.07 v/s 13.79
Return on net worth – 19.59 v/s 13.59
D/ E Ratio – 0.14 v/s 0.25
Interest Cover – 31.05 v/s 41.98
Current Ratio – 1.23 v/s 0.89
Reserves – 405.21 cr v/s 325.88 cr
PAT – 80.86 cr v/s 45.96 cr
Total assets – 471.97 cr v/s 412.92 cr
Net sales – 527.37 cr v/s 328.2 cr
Book Value – 112.15 cr v/s 134.88 cr
Days BSE NSE
30 793.98 794.17
50 693.05 693.28
150 574.66 575.20
200 538.79 539.35
Important Ratios Simple Moving Average

Recommendations
Buy Shilpa Medicare Ltd. at current or lower
market levels
Reasons for the recommendations are :
Sound financial statements and healthy return ratios.
Availability of adequate state of art technology and infrastructure.
Huge profit margins and good cash flow.
Approval for applied patents and license will be a huge trigger for growth.
Clients include major national and international players.
Growth forecast in this segment of pharma industry.
Improved QoQ performance of sales.


