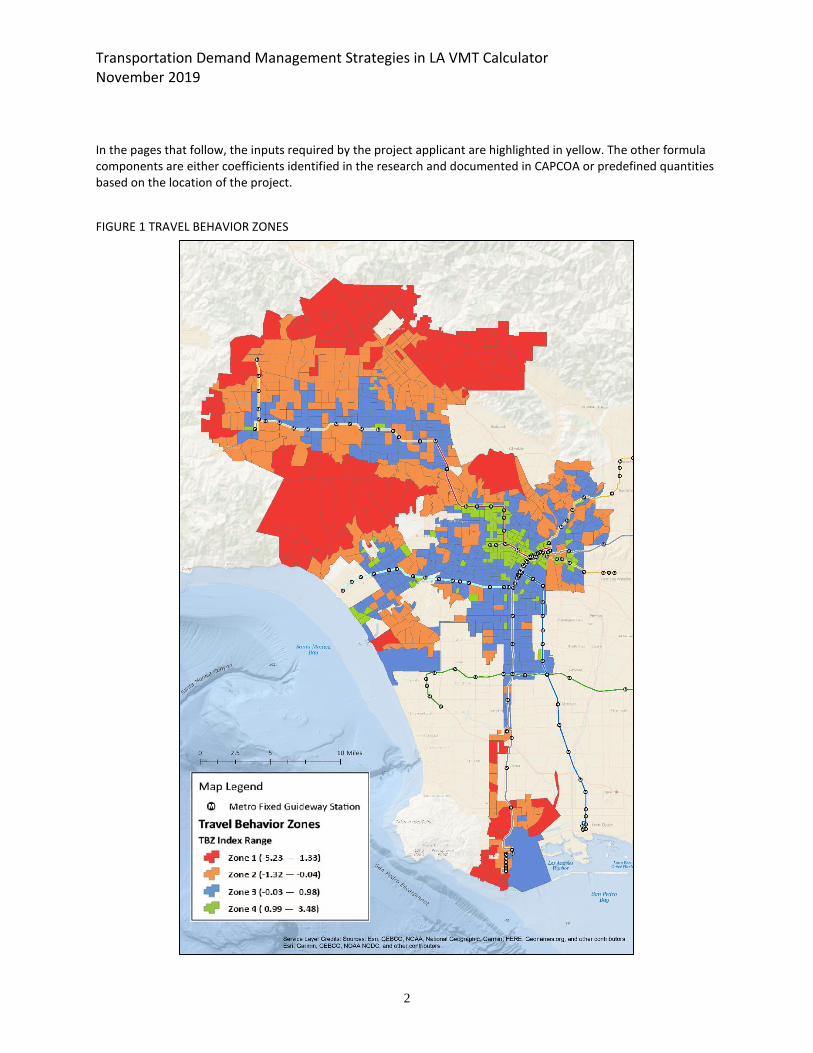
ATTACHMENT G TRANSPORTATION DEMAND MANAGEMENT STRATEGIES IN LA VMT CALCULATOR Introduction This document provides an overview of the Transportation Demand Management (TDM) strategies included in the City of Los Angeles Department of Transportation Vehicle Miles Traveled (VMT) Calculator. The VMT Calculator is a tool designed to measure whether a development project exceeds the VMT thresholds of the City of Los Angeles, based on the MXD methodology 1 validated for City of Los Angeles conditions as documented in the City of Los Angeles VMT Calculator Documentation (Fehr & Peers, October 2017) and the potential VMT reductions available from certain types of project site modifications, programming, and operational changes collectively known as TDM strategies. The effectiveness of each of the 23 TDM strategies included in the VMT Calculator is based primarily on research documented in the 2010 California Air Pollution Control Officers Association (CAPCOA) publication, Quantifying Greenhouse Gas Mitigation Measures (CAPCOA, 2010). CAPCOA offers methodology based on preferred literature, along with methodology based on alternative literature, for each strategy. The strategies used in the VMT Calculator follow CAPCOA guidance by either directly applying the CAPCOA methodology, applying the alternative literature methodology, or adjusting the methodology offered by CAPCOA to account for local needs and departmental goals. Where more recent research (since 2010) or local empirical data are available, those methods have been used in place of the methodology outlined by CAPCOA. The methodology is specified for each strategy in the pages that follow. The TDM strategies are individually described in this document, with individual levels of effectiveness identified. However, to ensure the effectiveness of TDM strategies is not overstated, the VMT reductions in the VMT Calculator are both dampened and capped. Dampening: Within each type of trip (home-based work trip starting at the home end, for example), a multiplicative dampening formula is applied. For example, if both Strategy A and Strategy B are applied, the combined effectiveness is not A+B, but rather 1-(1-A)*(1-B). This captures the reality that many people who would consider using Strategy B overlap with the potential market for Strategy A, and would choose A or B for each trip, but not both A and B. Capping: For the full set of strategies selected across all trip types, a place-type limit, or cap, is applied. The place- type is a pre-defined category based on land use characteristics of the location where the project is sited. Four place-types, or travel behavior zones (TBZs), have been developed by the City: Urban, Compact Infill, Suburban Center, and Suburban. Consistent with CAPCOA, for urban locations, the maximum VMT reduction that can be achieved by combining TDM strategies is 75%. For compact infill locations, the maximum is 40%. For suburban center locations, the maximum is 20%, and for suburban locations the maximum is 15%. These maximums are described and substantiated in CAPCOA. A map of the TBZ system is included in Figure 1. 1 The MXD methodology was originally developed by the U.S. Environmental Protection Agency to better estimate trip generation in urban areas considering a number of factors including the relative numbers of residents and jobs, the density of development, the connectivity for walking or driving among different activities, the availability of transit, the number of convenient trip destinations within the immediate area, vehicle ownership, and household size.
Transcript
ATTACHMENT G
TRANSPORTATION DEMAND MANAGEMENT STRATEGIES IN
LA VMT CALCULATOR
Introduction
This document provides an overview of the Transportation Demand Management (TDM) strategies included in the City of Los Angeles Department of Transportation Vehicle Miles Traveled (VMT) Calculator. The VMT Calculator is a tool designed to measure whether a development project exceeds the VMT thresholds of the City of Los Angeles, based on the MXD methodology1 validated for City of Los Angeles conditions as documented in the City of Los Angeles VMT Calculator Documentation (Fehr & Peers, October 2017) and the potential VMT reductions available from certain types of project site modifications, programming, and operational changes collectively known as TDM strategies. The effectiveness of each of the 23 TDM strategies included in the VMT Calculator is based primarily on research documented in the 2010 California Air Pollution Control Officers Association (CAPCOA) publication, Quantifying Greenhouse Gas Mitigation Measures (CAPCOA, 2010). CAPCOA offers methodology based on preferred literature, along with methodology based on alternative literature, for each strategy. The strategies used in the VMT Calculator follow CAPCOA guidance by either directly applying the CAPCOA methodology, applying the alternative literature methodology, or adjusting the methodology offered by CAPCOA to account for local needs and departmental goals. Where more recent research (since 2010) or local empirical data are available, those methods have been used in place of the methodology outlined by CAPCOA. The methodology is specified for each strategy in the pages that follow. The TDM strategies are individually described in this document, with individual levels of effectiveness identified. However, to ensure the effectiveness of TDM strategies is not overstated, the VMT reductions in the VMT Calculator are both dampened and capped. Dampening: Within each type of trip (home-based work trip starting at the home end, for example), a multiplicative dampening formula is applied. For example, if both Strategy A and Strategy B are applied, the combined effectiveness is not A+B, but rather 1-(1-A)*(1-B). This captures the reality that many people who would consider using Strategy B overlap with the potential market for Strategy A, and would choose A or B for each trip, but not both A and B. Capping: For the full set of strategies selected across all trip types, a place-type limit, or cap, is applied. The place-type is a pre-defined category based on land use characteristics of the location where the project is sited. Four place-types, or travel behavior zones (TBZs), have been developed by the City: Urban, Compact Infill, Suburban Center, and Suburban. Consistent with CAPCOA, for urban locations, the maximum VMT reduction that can be achieved by combining TDM strategies is 75%. For compact infill locations, the maximum is 40%. For suburban center locations, the maximum is 20%, and for suburban locations the maximum is 15%. These maximums are described and substantiated in CAPCOA. A map of the TBZ system is included in Figure 1.
1 The MXD methodology was originally developed by the U.S. Environmental Protection Agency to better estimate trip
generation in urban areas considering a number of factors including the relative numbers of residents and jobs, the density of development, the connectivity for walking or driving among different activities, the availability of transit, the number of convenient trip destinations within the immediate area, vehicle ownership, and household size.
Transportation Demand Management Strategies in LA VMT Calculator November 2019
2
In the pages that follow, the inputs required by the project applicant are highlighted in yellow. The other formula components are either coefficients identified in the research and documented in CAPCOA or predefined quantities based on the location of the project.
FIGURE 1 TRAVEL BEHAVIOR ZONES
Transportation Demand Management Strategies in LA VMT Calculator November 2019
3
Parking
1. Reduce Parking Supply
2. Unbundle Parking
3. Parking Cash-Out
4. Price Workplace Parking
5. Residential Area Parking Permits
Transit
1. Reduce Transit Headways
2. Implement Neighborhood Shuttle
3. Transit Subsidies
Education & Encouragement
1. Voluntary Travel Behavior Change Program
2. Promotions & Marketing
Commute Trip Reductions
1. Required Commute Trip Reduction Program
2. Alternative Work Schedules and Telecommute Program
3. Employer Sponsored Vanpool or Shuttle
4. Ride Share Program
Shared Mobility
1. Car Share
2. Bike Share
3. School Carpool Program
Bicycle Infrastructure
1. Implement/Improve On-Street Bicycle Facility
2. Include Bike Parking per LAMC
3. Include Secure Bike Parking and Showers per LAMC
Neighborhood Infrastructure
1. Traffic Calming Improvements
2. Pedestrian Network Improvements
Transportation Demand Management Strategies in LA VMT Calculator November 2019
4
Parking
1. Reduce Parking Supply
This strategy changes the on-site parking supply to provide less than the amount of vehicle parking required by
direct application of the Los Angeles Municipal Code (LAMC) without consideration of parking reduction
mechanisms permitted in the code. Permitted reductions in parking supply could utilize parking reduction
mechanisms such as TOC, Density Bonus, Bike Parking ordinance, or locating in an Enterprise Zone or Specific Plan
area. Reductions in parking supply could also include reductions in parting requirements due to variances sought
by a project. This strategy is appropriate for use in all land-use contexts and all types of development, and applies
to all trip types.
The maximum available VMT reduction from this strategy is 12.5%.
The formula used to calculate the reduction in VMT as a result of this strategy is as follows:
VMT Reduction = [(Base City Code parking requirement – Actual parking provision)/Base City Code
parking requirement] x 0.5
Inputs:
● Base city code parking requirements – enter the number of spaces required by direct application of the LA
Municipal Code without consideration of parking reduction mechanisms permitted in the code..
● Actual parking provision – enter the number of spaces that the project will be providing.
The application and effectiveness of this strategy is based on research and methodology documented in the 2010
California Air Pollution Control Officers Association publication, Quantifying Greenhouse Gas Mitigation Measures
(CAPCOA), Strategy PDT-1. CAPCOA Strategy PDT-1 has been adjusted to reflect a change in parking provision
compared to the City Code requirements, rather than the ITE Parking requirements as specified in CAPCOA.
Transportation Demand Management Strategies in LA VMT Calculator November 2019
5
Parking
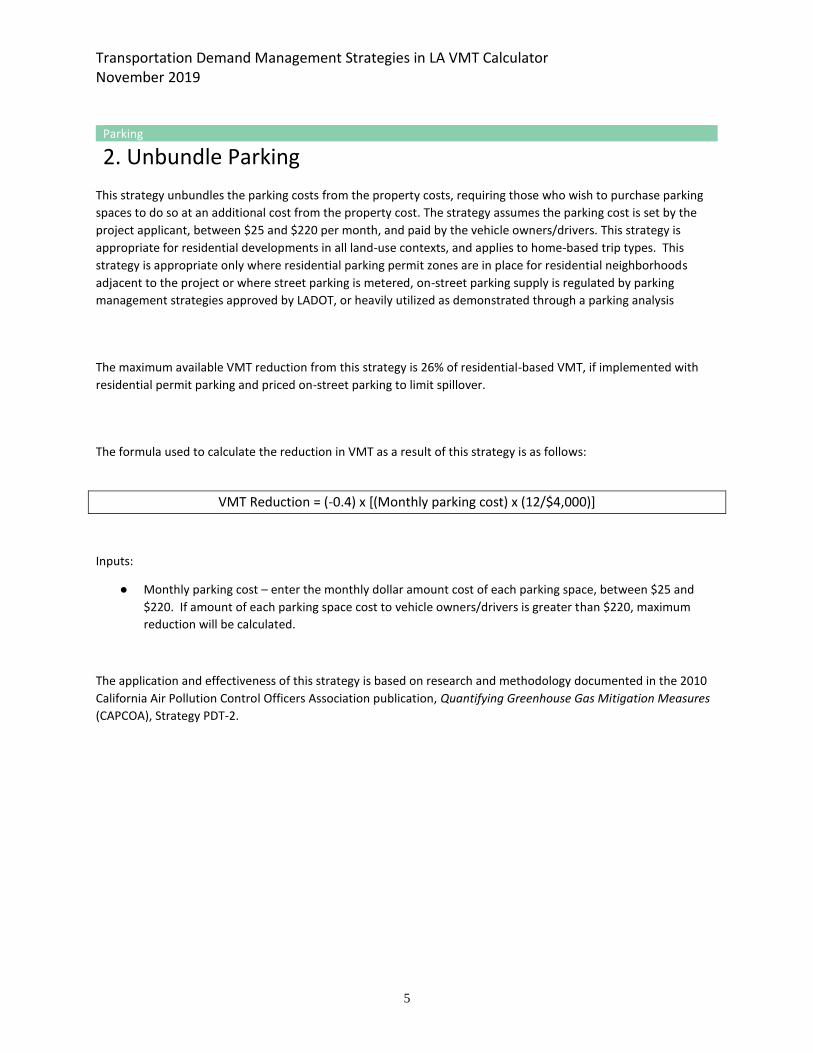
2. Unbundle Parking
This strategy unbundles the parking costs from the property costs, requiring those who wish to purchase parking
spaces to do so at an additional cost from the property cost. The strategy assumes the parking cost is set by the
project applicant, between $25 and $220 per month, and paid by the vehicle owners/drivers. This strategy is
appropriate for residential developments in all land-use contexts, and applies to home-based trip types. This
strategy is appropriate only where residential parking permit zones are in place for residential neighborhoods
adjacent to the project or where street parking is metered, on-street parking supply is regulated by parking
management strategies approved by LADOT, or heavily utilized as demonstrated through a parking analysis
The maximum available VMT reduction from this strategy is 26% of residential-based VMT, if implemented with
residential permit parking and priced on-street parking to limit spillover.
The formula used to calculate the reduction in VMT as a result of this strategy is as follows:
VMT Reduction = (-0.4) x [(Monthly parking cost) x (12/$4,000)]
Inputs:
● Monthly parking cost – enter the monthly dollar amount cost of each parking space, between $25 and
$220. If amount of each parking space cost to vehicle owners/drivers is greater than $220, maximum
reduction will be calculated.
The application and effectiveness of this strategy is based on research and methodology documented in the 2010
California Air Pollution Control Officers Association publication, Quantifying Greenhouse Gas Mitigation Measures
(CAPCOA), Strategy PDT-2.
Transportation Demand Management Strategies in LA VMT Calculator November 2019
6
Parking
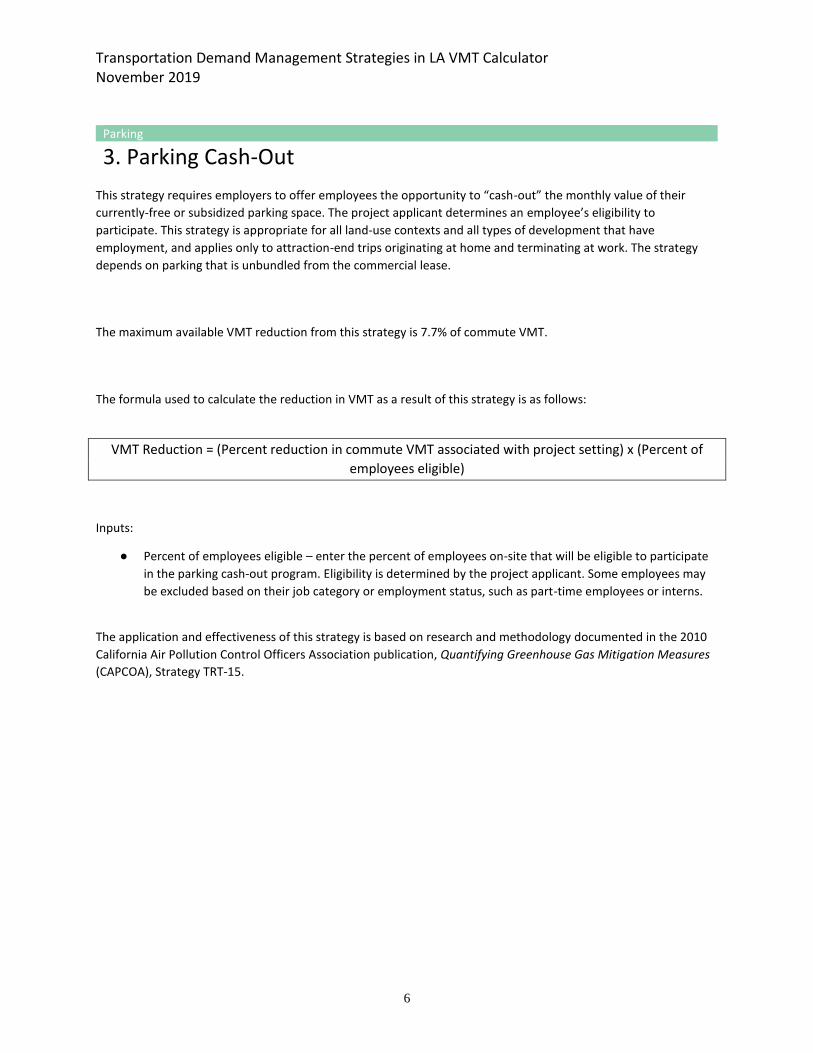
3. Parking Cash-Out
This strategy requires employers to offer employees the opportunity to “cash-out” the monthly value of their
currently-free or subsidized parking space. The project applicant determines an employee’s eligibility to
participate. This strategy is appropriate for all land-use contexts and all types of development that have
employment, and applies only to attraction-end trips originating at home and terminating at work. The strategy
depends on parking that is unbundled from the commercial lease.
The maximum available VMT reduction from this strategy is 7.7% of commute VMT.
The formula used to calculate the reduction in VMT as a result of this strategy is as follows:
VMT Reduction = (Percent reduction in commute VMT associated with project setting) x (Percent of
employees eligible)
Inputs:
● Percent of employees eligible – enter the percent of employees on-site that will be eligible to participate
in the parking cash-out program. Eligibility is determined by the project applicant. Some employees may
be excluded based on their job category or employment status, such as part-time employees or interns.
The application and effectiveness of this strategy is based on research and methodology documented in the 2010
California Air Pollution Control Officers Association publication, Quantifying Greenhouse Gas Mitigation Measures
(CAPCOA), Strategy TRT-15.
Transportation Demand Management Strategies in LA VMT Calculator November 2019
7
Parking
4. Price Workplace Parking
This strategy implements workplace parking pricing for employees at employment locations. This strategy is
appropriate for all land-use contexts and all types of development that include employment, and applies only to
attraction-end trips originating at home and terminating at work. This strategy is appropriate only where
residential parking permit zones are in place for residential neighborhoods adjacent to the project or where street
parking is metered, on-street parking supply is regulated by parking management strategies approved by LADOT,
or heavily utilized as demonstrated through a parking analysis.
The maximum available VMT reduction from this strategy is 19.7% of commute VMT.
The formula used to calculate the reduction in VMT as a result of this strategy is as follows:
VMT Reduction = (Percent reduction in commute VMT associated with daily parking charge) x (Percent
of employees subject to charge)
Inputs:
● Daily parking charge – enter the closest dollar amount of the daily parking cost ($1, $2, $3, or $6). If
necessary, convert monthly costs to daily costs by dividing by 22 work days per month.
● Percent of employees subject to charge – enter the percent of employees on-site that will be subject to
priced parking.
The application and effectiveness of this strategy is based on research and methodology documented in the 2010
California Air Pollution Control Officers Association publication, Quantifying Greenhouse Gas Mitigation Measures
(CAPCOA), Strategy TRT-14.
Transportation Demand Management Strategies in LA VMT Calculator November 2019
8
Parking
5. Residential Area Parking Permits
This strategy involves the implementation of residential permit parking zones for long-term use of on-street
parking in residential areas. This strategy is often implemented to curb “spillover effect” that could be caused by
parking pricing strategies implemented in adjacent commercial or employment locations. This strategy is
appropriate for all land-use contexts and all types of development that have residential units, and applies only to
production-end trips originating at home and terminating at work or other locations. This strategy is appropriate
only for large developments with internal blocks within the project footprint.
The maximum available VMT reduction from this strategy is 0.25%.
The formula used to calculate the reduction in VMT as a result of this strategy is as follows:
VMT Reduction based on a categorical association of annual permit price with percent VMT reduction.
Inputs:
● Annual permit price – enter the closest dollar value of the annual price for the residential permit ($100 or
$200).
The application and effectiveness of this strategy is based on research and methodology documented in the 2010
California Air Pollution Control Officers Association publication, Quantifying Greenhouse Gas Mitigation Measures
(CAPCOA), Strategy PDT-4. In order to disaggregate the effects of this strategy from other parking strategies, the
tool uses the alternative literature available for CAPCOA Strategy PDT-4 rather than the bundled approach
described in the report.
Transportation Demand Management Strategies in LA VMT Calculator November 2019
9
Transit
1. Reduce Transit Headways
This strategy makes transit service more appealing by reducing headways and thereby reducing overall transit trip
time, encouraging riders to switch from auto to transit use. This strategy assumes transit is already present in the
project area, and requires close coordination with the transit service operator in the area to demonstrate the
service improvements are viable. The project applicant would typically be required to financially support the
operation of additional service and demonstrate commitment and partnership with the transit service provider
with formal documentation. This strategy is appropriate for all land-use contexts and all types of development, and
applies to all trip types.
The maximum available VMT reduction from this strategy is 2.5%.
The formula used to calculate the reduction in VMT as a result of this strategy is as follows:
VMT Reduction = (Percent reduction in headway) x (Elasticity of transit ridership based on project
setting) x (Existing transit modeshare) x (Level of implementation) x (0.67 Adjustment factor from transit
ridership increase to VMT)
Inputs:
● Percent reduction in headway – enter the percent reduction in peak-period headways (for example, if the
headways are reduced from 30 minutes to 15 minutes, enter 50%), not to exceed 80%.
● Existing transit mode share – enter the percent mode share for transit in the project area, based on US
Census’ American Communities Survey commute mode share information for the city, or more granular if
possible (e.g., census tract level), not to exceed 17%.
● Level of implementation – enter the percentage of lines within the project area that will be improved (>/=
50% or < 50%).
The application and effectiveness of this strategy is based on research and methodology documented in the 2010
California Air Pollution Control Officers Association publication, Quantifying Greenhouse Gas Mitigation Measures
(CAPCOA), Strategy TST-4.
Transportation Demand Management Strategies in LA VMT Calculator November 2019
10
Transit
2. Implement Neighborhood Shuttle
This strategy involves the implementation of a project-operated or project-sponsored neighborhood shuttle,
serving residents, employees, and visitors of the project site. This strategy is most appropriate for application to
very large project sites, or for smaller projects participating in a neighborhood shuttle in conjunction with other
projects in the vicinity. Shuttle service should not simply mirror existing service, but provide new opportunities for
access, either through differences in route or in cost to the rider. Shuttle service should provide new connections
to job/activity centers and transit. This strategy is appropriate for all land-use contexts and all types of
development, and applies to all trip types.
The maximum available VMT reduction from this strategy is 13.4%.
The formula used to calculate the reduction in VMT as a result of this strategy is as follows:
VMT Reduction = (Percent shift in modeshare of trips based on degree of implementation) x (Percent
employees, residents & visitors eligible) x (0.67 Adjustment factor from shuttle ridership increase to
VMT)
Inputs:
● Degree of implementation – enter high (all day service; headways less than 15 minutes), medium (all day
service; headways 15 minutes or more), or low (peak hours only; headways 15 minutes or more).
● Percent employees, residents, and visitors eligible – enter the percent of all individuals who may access
the project that are eligible to utilize the shuttle (for example, if the shuttle serves only residents on a
mixed-use site with retail employment, divide the anticipated population of residents into the anticipated
population of residents + employees + visitors to determine the percent).
The application and effectiveness of this strategy is based on research and methodology documented in the 2010
California Air Pollution Control Officers Association publication, Quantifying Greenhouse Gas Mitigation Measures
(CAPCOA), Strategy TRT-11. CAPCOA Strategy TRT-11 has been adjusted in the tool to allow for the implementation
of a shuttle in any type of development, open to all residents, employees, and visitors of the site, rather than its
application in CAPCOA as a purely commute-based strategy for work trips only.
Transportation Demand Management Strategies in LA VMT Calculator November 2019
11
Transit
3. Transit Subsidies
This strategy involves the subsidization of transit fare for residents and employees of the project site. The subsidy
must be proactively offered to each dwelling unit and/or employee at least once annually for a minimum of five
years. This strategy assumes transit service is already present in the project area. This strategy is appropriate for all
land-use contexts and all types of development, and applies to all trip types.
In Los Angeles, many transit fare products are available that can pay for individual trips, unlimited trips on a single
transit operator’s system, or unlimited trips on multiple transit operators’ systems. Unlimited passes are available
on a daily, weekly, and monthly basis, and can provide a per-trip discount if the rider exceeds a certain number of
trips within the given time period. In addition, Metro offers several annual pass programs, such as the B-TAP
program for businesses, which offer steep discounts but require a high minimum threshold of participation
amongst all employees. In the future, new pass options may become available and fare structures may change.
Given this level of variation across all transit operators in Los Angeles, subsidy levels are measured in dollars rather
than percent of fares. At the low end, a single trip on LADOT’s DASH system costs $0.35 per ride if the rider pays
with a TAP card. At the high end, some LADOT Commuter Express routes cost $4.25 per ride if the route crosses
several distance-based zones. The base fare on the Metro system is $1.75 for a single trip. Metro’s monthly pass
costs $100/month for unlimited rides.
The maximum available VMT reduction from this strategy is 20%.
The formula used to calculate the reduction in VMT as a result of this strategy is as follows:
VMT Reduction = (Percent employees & residents eligible) x (Percent reduction in trips associated with
daily transit subsidy amount)
Inputs:
● Percent employees & residents eligible – enter the percent of all individuals who may access the project
that are eligible to receive transit subsidies (for example, if the project only offers transit subsidies to
office employees on a mixed-use site with residential units, divide the anticipated population of eligible
office employees into the anticipated population of residents + employees to determine the percent).
● Daily transit subsidy amount – enter the closest dollar amount of daily transit fare subsidy per passenger
($0.75, $1.49, $2.98, or $5.96); select the highest value if unlimited-ride passes are provided.
The application and effectiveness of this strategy is based on research and methodology documented in the 2010
California Air Pollution Control Officers Association publication, Quantifying Greenhouse Gas Mitigation Measures
(CAPCOA), Strategy TRT-4. CAPCOA Strategy TRT-4 has been adjusted in the tool to allow for transit subsidies to be
offered to both employees and residents of a project site, rather than its application in CAPCOA as a purely
commute-based strategy for work trips only.
Transportation Demand Management Strategies in LA VMT Calculator November 2019
12
Education & Encouragement
1. Voluntary Travel Behavior Change Program
This strategy involves the development of a travel behavior change program that targets individual attitudes, goals,
and travel behaviors, educating participants on the impacts of their travel choices and the opportunities to alter
their habits. Unlike the Promotions & Marketing strategy below, which uses only passive educational tools such as
posters, websites, and travel information displays, these programs often include two-way mass communication
campaigns and travel feedback programs that actively engage participants as they make their travel choices in real
time. This program also relies on a coordinator to manage the program and administer the tools, which may be
analog (submit paper forms) or digital (online logging system, push notifications from an app, etc.). This strategy
does not include any monitoring or reporting at the level of the development, but may encourage individual
tracking and reporting of trips for incentives. This strategy is appropriate for all land-use contexts and all types of
development, and applies to all trip types.
The maximum available VMT reduction from this strategy is 8%.
The formula used to calculate the reduction in VMT as a result of this strategy is as follows:
VMT Reduction = (8%) x (Percent employees & residents participating) x (Adjustment factor based on
project setting)
Inputs:
● Percent employees & residents participating – enter the percent of all individuals who will be targeted to
participate in the program (for example, if the program targets only office employees on a mixed-use site
with residential units, divide the anticipated population of eligible office employees into the anticipated
population of residents + employees to determine the percent).
The application and effectiveness of this strategy is based on research and methodology documented in the 2013
policy brief by Steven Spears, Marlon Boarnet, and Susan Handy, Policy Brief on the Impacts of Voluntary Travel
Behavior Change Programs Based on a Review of the Empirical Literature.
Transportation Demand Management Strategies in LA VMT Calculator November 2019
13
Education & Encouragement
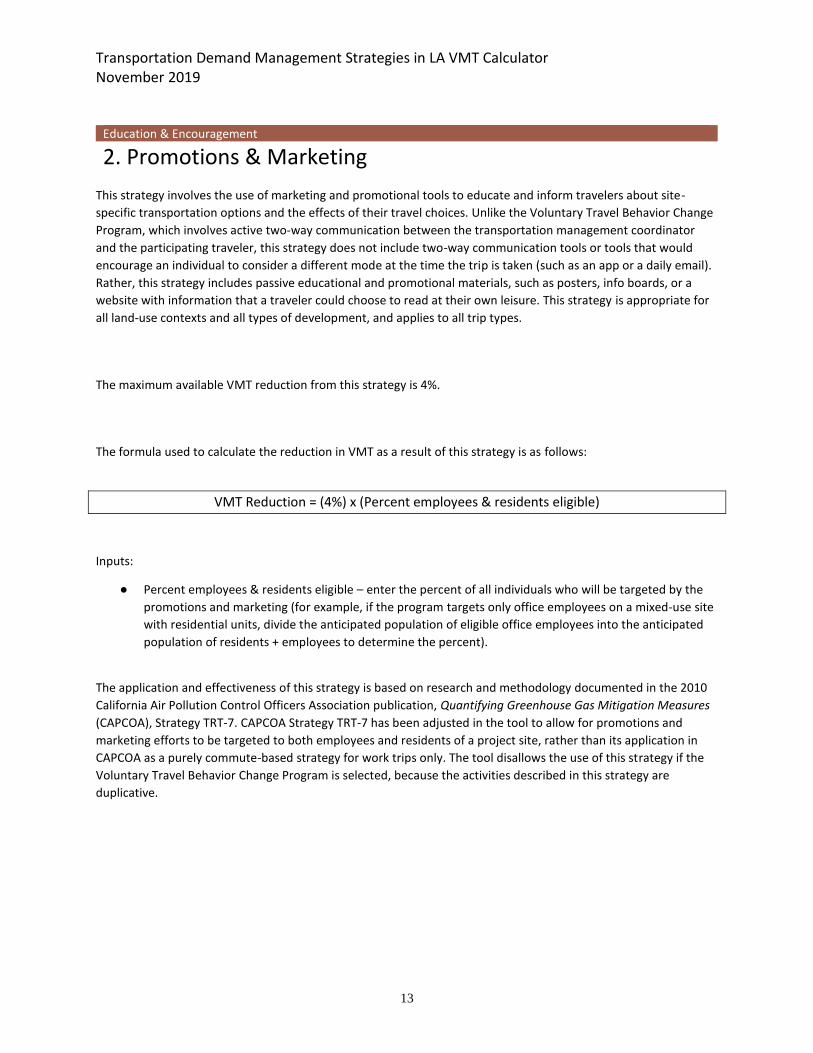
2. Promotions & Marketing
This strategy involves the use of marketing and promotional tools to educate and inform travelers about site-
specific transportation options and the effects of their travel choices. Unlike the Voluntary Travel Behavior Change
Program, which involves active two-way communication between the transportation management coordinator
and the participating traveler, this strategy does not include two-way communication tools or tools that would
encourage an individual to consider a different mode at the time the trip is taken (such as an app or a daily email).
Rather, this strategy includes passive educational and promotional materials, such as posters, info boards, or a
website with information that a traveler could choose to read at their own leisure. This strategy is appropriate for
all land-use contexts and all types of development, and applies to all trip types.
The maximum available VMT reduction from this strategy is 4%.
The formula used to calculate the reduction in VMT as a result of this strategy is as follows:
VMT Reduction = (4%) x (Percent employees & residents eligible)
Inputs:
● Percent employees & residents eligible – enter the percent of all individuals who will be targeted by the
promotions and marketing (for example, if the program targets only office employees on a mixed-use site
with residential units, divide the anticipated population of eligible office employees into the anticipated
population of residents + employees to determine the percent).
The application and effectiveness of this strategy is based on research and methodology documented in the 2010
California Air Pollution Control Officers Association publication, Quantifying Greenhouse Gas Mitigation Measures
(CAPCOA), Strategy TRT-7. CAPCOA Strategy TRT-7 has been adjusted in the tool to allow for promotions and
marketing efforts to be targeted to both employees and residents of a project site, rather than its application in
CAPCOA as a purely commute-based strategy for work trips only. The tool disallows the use of this strategy if the
Voluntary Travel Behavior Change Program is selected, because the activities described in this strategy are
duplicative.
Transportation Demand Management Strategies in LA VMT Calculator November 2019
14
Commute Trip Reductions
1. Required Commute Trip Reduction Program
This strategy involves the development of an employee-focused travel behavior change program that targets
individual attitudes, goals, and travel behaviors, educating participants on the impacts of their travel choices and
the opportunities to alter their habits. The program typically includes elements such as a coordinated ride-sharing
or carpooling program, vanpool program, alternative work schedule program, preferential carpool parking,
guaranteed ride home service, and a program coordinator. The program requires the development of metrics to
evaluate success, program monitoring, and regular reporting. This strategy is appropriate for all land-use contexts
and all types of development that have employment, and applies only to attraction-end trips originating at home
and terminating at work.
The maximum available VMT reduction from this strategy is 21% of commute VMT.
The formula used to calculate the reduction in VMT as a result of this strategy is as follows:
VMT Reduction = (21%) x (Percent of employees eligible)
Inputs:
● Percent employees & residents eligible – enter the percent of all individuals who will be eligible to
participate in the program (for example, if the program targets only office employees on a mixed-use site
with both office and retail employment, divide the anticipated population of eligible office employees into
the anticipated population of office employees + retail employees to determine the percent).
The application and effectiveness of this strategy is based on research and methodology documented in the 2010
California Air Pollution Control Officers Association publication, Quantifying Greenhouse Gas Mitigation Measures
(CAPCOA), Strategy TRT-2. The tool disallows the use of all other Commute Trip Reduction strategies if this
strategy is selected, because the activities described in this strategy are duplicative.
Transportation Demand Management Strategies in LA VMT Calculator November 2019
15
Commute Trip Reductions
2. Alternative Work Schedules and Telecommuting Program
This strategy encourages employees to work alternative schedules or telecommute, including staggered start
times, flexible schedules, or compressed work weeks. This strategy is appropriate for all land-use contexts and all
types of development that have employment, and applies only to attraction-end trips originating at home and
terminating at work.
The maximum available VMT reduction from this strategy is 5.5% of commute VMT.
The formula used to calculate the reduction in VMT as a result of this strategy is as follows:
VMT Reduction based on a categorical association of schedule type and employee participation with
percent VMT reduction.
Inputs:
● Schedule type – enter the type of alternative work schedule program that will be offered (9-day/80-hour
work week, 4-day/40-hour workweek, or 1.5 days per week of telecommuting).
● Percentage of employees participating – enter the closest percentage of employees that are anticipated
to participate in an alternative work schedule (1%, 3%, 5%, 10%, or 25%).
The application and effectiveness of this strategy is based on research and methodology documented in the 2010
California Air Pollution Control Officers Association publication, Quantifying Greenhouse Gas Mitigation Measures
(CAPCOA), Strategy TRT-6. The tool disallows the use of this strategy if either the Voluntary Travel Behavior Change
Program or Required Commute Trip Reduction Program is selected, because the activities described in this strategy
are duplicative.
Transportation Demand Management Strategies in LA VMT Calculator November 2019
16
Commute Trip Reductions
3. Employer-Sponsored Vanpool or Shuttle
This strategy involves the implementation of an employer-sponsored employee vanpool or shuttle connecting
employees to the project site. Vanpool or shuttle service should not simply mirror existing service, but provide new
opportunities for access, through differences in route directness or by providing a lower cost or free option to the
rider. This strategy is appropriate for all land-use contexts and all types of development that have employment,
and applies only to attraction-end trips originating at home and terminating at work.
The maximum available VMT reduction from this strategy is 13.4% of commute VMT.
The formula used to calculate the reduction in VMT as a result of this strategy is as follows:
VMT Reduction = (Percent shift in vanpool/shuttle mode share of commute trips based on degree of
implementation and employer size) x (Percent employees eligible) x (0.67 Adjustment factor from
vanpool/shuttle mode share to VMT)
Inputs:
● Degree of implementation – enter high (>30 vans), medium (10-30 vans), or low (<10 vans).
● Employer size – enter large (>500 employees), medium (100-500 employees), or low (<100 employees).
● Percent employees eligible – enter the percent of all employees that are eligible to utilize the vanpool (for
example, if the vanpools only serve office employees on a mixed-use site with both office and retail
employment, divide the anticipated population of eligible office employees into the anticipated
population of office employees + retail employees to determine the percent).
The application and effectiveness of this strategy is based on research and methodology documented in the 2010
California Air Pollution Control Officers Association publication, Quantifying Greenhouse Gas Mitigation Measures
(CAPCOA), Strategy TRT-11. The tool disallows the use of this strategy if either the Neighborhood Shuttle or
Required Commute Trip Reduction Program is selected, because the activities described in this strategy are
duplicative.
Transportation Demand Management Strategies in LA VMT Calculator November 2019
17
Commute Trip Reductions
4. Ride-Share Program
This strategy increases vehicle occupancy by providing ride-share matching services, designating preferred parking
for ride-share participants, designing adequate passenger loading/unloading and waiting areas for ride-share
vehicles, and providing a website or message board to connect riders and coordinate rides. This strategy is
appropriate for all land-use contexts and all types of development that have employment, and applies only to
attraction-end trips originating at home and terminating at work.
The maximum available VMT reduction from this strategy is 15% of commute VMT.
The formula used to calculate the reduction in VMT as a result of this strategy is as follows:
VMT Reduction = (Percent reduction commute VMT associated with project setting) x (Percent
employees eligible)
Inputs:
● Percent employees eligible – enter the percent of all employees that are eligible to utilize the ride-share
program (for example, if the ride-share program is only offered to office employees on a mixed-use site
with both office and retail employment, divide the anticipated population of eligible office employees into
the anticipated population of office employees + retail employees to determine the percent).
The application and effectiveness of this strategy is based on research and methodology documented in the 2010
California Air Pollution Control Officers Association publication, Quantifying Greenhouse Gas Mitigation Measures
(CAPCOA), Strategy TRT-3. The tool disallows the use of this strategy if either the Voluntary Travel Behavior Change
Program or Required Commute Trip Reduction Program is selected, because the activities described in this strategy
are duplicative. This strategy does not include ride-sharing services such as Lyft, Uber, or other transportation
network companies (TNCs).
Transportation Demand Management Strategies in LA VMT Calculator November 2019
18
Shared Mobility
1. Car-Share
This strategy involves implementation of car-sharing to allow people to have on-demand access to a vehicle, as-
needed. This may include providing membership to an existing program located within ¼ mile, contracting with a
third-party vendor to extend membership-based service to an area, or implementing a project-specific fleet that
supports the residents and employees on-site. Car-share can serve as a supportive strategy that enhances other
TDM strategies including unbundled parking. Car-share implementation should meet the following conditions:
● Memberships are proactively offered to residents/employees annually for the life of the project.
● Car-share vendor provides vehicle insurance and vehicle maintenance.
● Vehicles are located on-site; can be accessed by those on-site and by those off-site.
● Vehicles are unstaffed and self-service; available 24 hours a day.
● Vehicles are available for reservation hourly or in smaller intervals.
This strategy is appropriate for all land-use contexts and all types of development, and applies to all trip types.
The maximum available VMT reduction from this strategy is 0.7%.
The formula used to calculate the reduction in VMT as a result of this strategy is as follows:
VMT Reduction = (% reduction in car-share member annual VMT that corresponds to project setting,
below) x (20 car-share members per shared car) / (Deployment level based on project setting)
Inputs:
● Project setting – enter urban + comprehensive transit, suburban + commuter rail, or all other settings.
o Urban + comprehensive transit corresponds to a 50% reduction in member VMT
o Suburban + commuter rail corresponds to a 75% reduction in member VMT
o All other settings corresponds to a 37% reduction in member VMT
The application and effectiveness of this strategy is based on research and methodology documented in the 2010
California Air Pollution Control Officers Association publication, Quantifying Greenhouse Gas Mitigation Measures
(CAPCOA), Strategy TRT-9, and empirical analysis conducted by Fehr & Peers.
Transportation Demand Management Strategies in LA VMT Calculator November 2019
19
Shared Mobility
2. Bike Share
This strategy involves implementation of bike share to allow people to have on-demand access to a bicycle, as-
needed. In order to apply this strategy, the project must either:
1. be located less than 500 feet away from an existing bike share station;
2. install a publicly-accessible bike share station on-site (for a minimum of 10 bicycles) within 0.25 miles of
an existing or planned bike share station meeting all LADOT Bike Share siting guidelines.
3. offer all building occupants bike share membership passes within a bike share service area (defined as
0.25 miles from an existing or planned bike share station).
This strategy is appropriate for all land-use contexts and all types of development, and applies to all trip types.
The maximum available VMT reduction from this strategy is 0.25%.
The formula used to calculate the reduction in VMT as a result of this strategy is as follows:
VMT Reduction = 0.25% reduction if the project is within 500 feet of an existing bike share station, or if
the project implements a publicly-accessible bike share station for a minimum of 10 bicycles within 0.25
miles of an existing or planned bike share station or offers all building occupants bike share membership
passes within a bike share service area
Inputs:
● Presence of bike share – enter Yes or No.
The application and effectiveness of this strategy is based on empirical data collected from the Downtown Los
Angeles bike share pilot and research documented in the 2010 California Air Pollution Control Officers Association
publication, Quantifying Greenhouse Gas Mitigation Measures (CAPCOA), Strategy TRT-12.
Transportation Demand Management Strategies in LA VMT Calculator November 2019
20
Shared Mobility
3. School Carpool Program
This strategy involves implementation of a school carpool program to encourage ride-sharing for students. This
strategy requires a staff person or volunteers tasked with implementing the program and matching parents to
other families that could pool. This strategy is appropriate for residential land uses in all land-use contexts, and
applies only to school trips.
The maximum available VMT reduction from this strategy is 15.8% of school VMT, or 0.9% of overall VMT, given
the share of overall VMT that is comprised by school VMT.
The formula used to calculate the reduction in VMT as a result of this strategy is as follows:
VMT Reduction = (Percent of families that participate) x (45% Adjustment to convert daily school VMT to
annual school VMT) x (0.059 Adjustment to convert project-level trips to school trips only)
Inputs:
● Percent of families that participate – enter anticipated level of participation: high (75%-100% of all
students + active school pool coordinator), medium (50%-75% of all students), or low (<50% of all
students).
The application and effectiveness of this strategy is based on research and methodology documented in the 2010
California Air Pollution Control Officers Association publication, Quantifying Greenhouse Gas Mitigation Measures
(CAPCOA), Strategy TRT-10, and local adjustment.
Transportation Demand Management Strategies in LA VMT Calculator November 2019
21
Bicycle Infrastructure
1. Implement/Improve On-Street Bicycle Facility
This strategy involves implementing or providing funding for improvements to corridors and crossings for bike
networks identified within the City’s Mobility Plan 2035 within a one-half mile buffer area of the project boundary,
to support safe and comfortable bicycle travel. This strategy is appropriate for all land-use contexts and all types of
development, and applies to all trip types.
The maximum available VMT reduction from this strategy is 0.625%.
The formula used to calculate the reduction in VMT as a result of this strategy is as follows:
VMT Reduction = 0.625% reduction if the project implements or provides funding for improvements to
corridors and crossings for bike networks identified within the City’s Mobility Plan 2035 within a one-
half mile buffer area of the project boundary
Inputs:
● Implements/improves on-street bicycle facility – enter Yes or No.
The application and effectiveness of this strategy is based on research and methodology documented in the 2010
California Air Pollution Control Officers Association publication, Quantifying Greenhouse Gas Mitigation Measures
(CAPCOA), Strategy LUT-8. In order to disaggregate the effects of this strategy from other bicycle-supportive
strategies, the tool uses the alternative literature available for CAPCOA Strategy LUT-8 rather than the bundled
approach described in the report.
Transportation Demand Management Strategies in LA VMT Calculator November 2019
22
Bicycle Infrastructure
2. Include Bike Parking Per LAMC
This strategy involves implementation of short and long-term bicycle parking to support safe and comfortable
bicycle travel by providing parking facilities at destinations. This strategy is appropriate for all land-use contexts
and all types of development, and applies to all trip types.
The maximum available VMT reduction from this strategy is 0.625%.
The formula used to calculate the reduction in VMT as a result of this strategy is as follows:
VMT Reduction = 0.625% reduction if the project provides bike parking at the level specified by City
Code, or more
Inputs:
● Meets or exceeds bike parking requirements as established in the Los Angeles Municipal Code (LAMC) –
enter Yes or No.
Projects providing short-term and long-term bicycle parking spaces in accordance with LAMC Section 12.21A.16
qualify for this measure.
The application and effectiveness of this strategy is based on research and methodology documented in the 2010
California Air Pollution Control Officers Association publication, Quantifying Greenhouse Gas Mitigation Measures
(CAPCOA), Strategy SDT-6. In order to disaggregate the effects of this strategy from other bicycle-supportive
strategies, the tool uses the alternative literature available for CAPCOA Strategy SDT-6 rather than the bundled
approach described in the report.
Transportation Demand Management Strategies in LA VMT Calculator November 2019
23
Bicycle Infrastructure
3. Include Secure Bike Parking and Showers
This strategy involves implementation of additional end-of-trip bicycle facilities to support safe and comfortable
bicycle travel by providing amenities at destinations. This strategy is appropriate for all land-use contexts and all
types of development, and applies to all trip types. This strategy applies to projects that include bicycle parking on-
site per LAMC.
The maximum available VMT reduction from this strategy is 0.625%.
The formula used to calculate the reduction in VMT as a result of this strategy is as follows:
VMT Reduction = 0.625% reduction if the project provides secure bike parking and showers
Inputs:
● Provides secure bike parking (e.g., bicycle lockers, bicycle rooms, bicycle cages, or commercially-operated
attended bicycle facilities) and showers – enter Yes or No.
Projects providing long-term bicycle parking secured from the general public in accordance with LAMC Section
12.21A.16(d)(2) and showers in accordance with LAMC Section 91.6307 qualify for this measure.
The application and effectiveness of this strategy is based on research and methodology documented in the 2010
California Air Pollution Control Officers Association publication, Quantifying Greenhouse Gas Mitigation Measures
(CAPCOA), Strategy TRT-5. In order to disaggregate the effects of this strategy from other bicycle-supportive
strategies, the tool uses the alternative literature available for CAPCOA Strategy TRT-5 rather than the bundled
approach described in the report.
Transportation Demand Management Strategies in LA VMT Calculator November 2019
24
Neighborhood Infrastructure
1. Traffic Calming Improvements
This strategy involves implementation of traffic calming measures throughout and around the perimeter of the
project site that encourage people to walk, bike, or take transit within the development and to the development
from other locations. Traffic calming at an intersection may include elements such as enhanced crossings, curb