This manuscript has been accepted as a contributed paper to be presented at the 2021 32nd IEEE Intelligent Vehicles Symposium (IV) (IV 2021)July 11-15, 2021, in Nagoya University, Nagoya, Japan.
Abstract— Understanding complex scenarios from in-vehiclecameras is essential for safely operating autonomous drivingsystems in densely populated areas. Among these, intersectionareas are one of the most critical as they concentrate a consid-erable number of traffic accidents and fatalities. Detecting andunderstanding the scene configuration of these usually crowdedareas is then of extreme importance for both autonomousvehicles and modern Advanced Driver Assistance Systems(ADAS) aimed at preventing road crashes and increasing thesafety of vulnerable road users. This work investigates inter-section classification from RGB images using well-consolidateneural network approaches along with a method to enhancethe results based on the teacher/student training paradigm.An extensive experimental activity aimed at identifying thebest input configuration and evaluating different networkparameters on both the well-known KITTI dataset and thenew KITTI-360 sequences shows that our method outperformscurrent state-of-the-art approaches on a per-frame basis andprove the effectiveness of the proposed learning scheme.
I. INTRODUCTION
Estimating the scene in front of a vehicle is crucial forsafe autonomous vehicle maneuvers and it is also key to ad-vanced ADAS. Even though over the past years performanceand availability of scene understanding systems increased,nowadays technology seems to be far from the requirementsof SAE full-automation level, in particular regarding urbanareas and contexts without a strict Manhattan-style cityplanning. Among these, intersection areas are one of themost critical, and reports from the United States NationalHighway Traffic Safety Administration (NHTSA) show usthat intersections concentrate more than 40% of motor vehi-cle crashes [1]. Navigation in these areas requires thereforerobust systems able to correctly identify them, enabling safemaneuvers as the vehicle approaches and crosses the upcom-ing intersection. From an opposite viewpoint, it follows thatthe detection and moreover the classification of intersectioncan be used as input to high-level classifiers of drivers ma-neuvers, or to ease the prediction of position and intentionsof vulnerable road users. Toward this goal, some intersectiondetectors are tightly coupled with localization procedures thatin turn rely on external systems such as Global NavigationSatellite System (GNSS) or map providers like Google Maps,HERE or TomTom, which started to provide Light DetectionAnd Ranging (LiDAR) based maps commonly referred to asHigh Definition maps (HD maps). The benefits of having
All authors are from Computer Engineering Department, PolytechnicSchool, Universidad de Alcala, Alcala de Henares, Spain.
1His work has been funded by European Union H2020, under GA MarieSkłodowska-Curie n. 754382 Got Energy. {augusto.ballardini,alvaro.hernandezsaz, miguel.sotelo}@uah.es
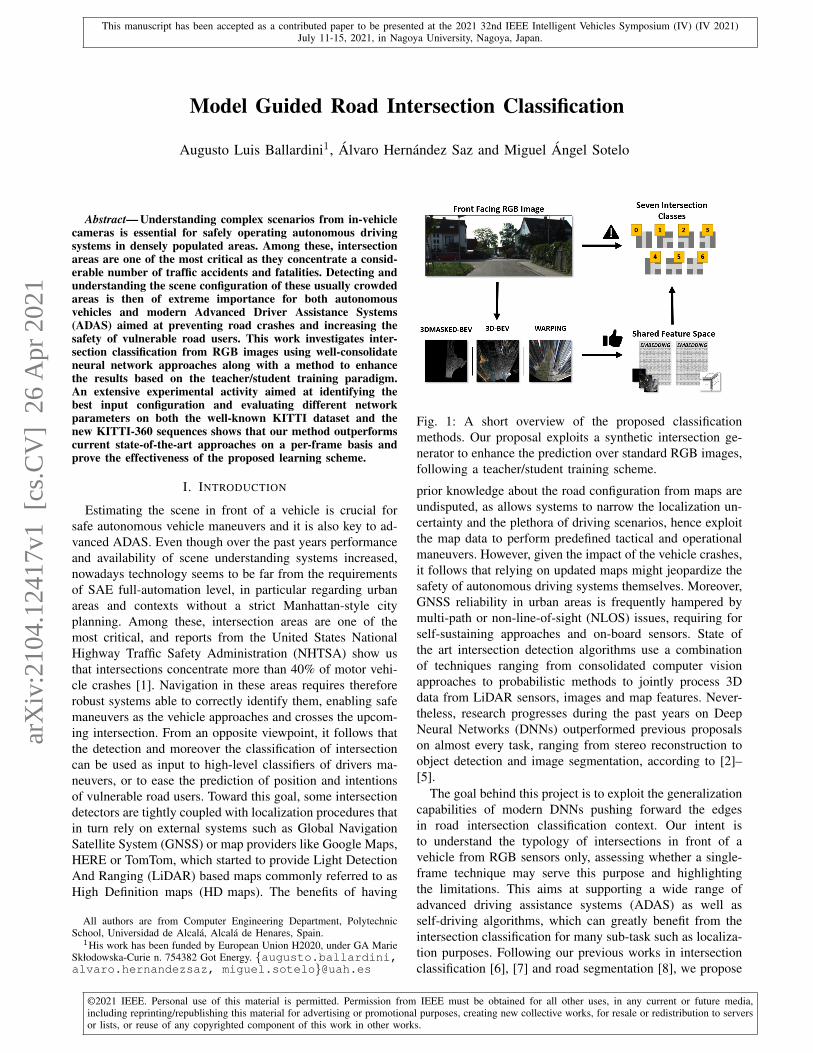
Fig. 1: A short overview of the proposed classificationmethods. Our proposal exploits a synthetic intersection ge-nerator to enhance the prediction over standard RGB images,following a teacher/student training scheme.
prior knowledge about the road configuration from maps areundisputed, as allows systems to narrow the localization un-certainty and the plethora of driving scenarios, hence exploitthe map data to perform predefined tactical and operationalmaneuvers. However, given the impact of the vehicle crashes,it follows that relying on updated maps might jeopardize thesafety of autonomous driving systems themselves. Moreover,GNSS reliability in urban areas is frequently hampered bymulti-path or non-line-of-sight (NLOS) issues, requiring forself-sustaining approaches and on-board sensors. State ofthe art intersection detection algorithms use a combinationof techniques ranging from consolidated computer visionapproaches to probabilistic methods to jointly process 3Ddata from LiDAR sensors, images and map features. Never-theless, research progresses during the past years on DeepNeural Networks (DNNs) outperformed previous proposalson almost every task, ranging from stereo reconstruction toobject detection and image segmentation, according to [2]–[5].
The goal behind this project is to exploit the generalizationcapabilities of modern DNNs pushing forward the edgesin road intersection classification context. Our intent isto understand the typology of intersections in front of avehicle from RGB sensors only, assessing whether a single-frame technique may serve this purpose and highlightingthe limitations. This aims at supporting a wide range ofadvanced driving assistance systems (ADAS) as well asself-driving algorithms, which can greatly benefit from theintersection classification for many sub-task such as localiza-tion purposes. Following our previous works in intersectionclassification [6], [7] and road segmentation [8], we propose
arX
iv:2
104.
1241
7v1
[cs
.CV
] 2
6 A
pr 2
021
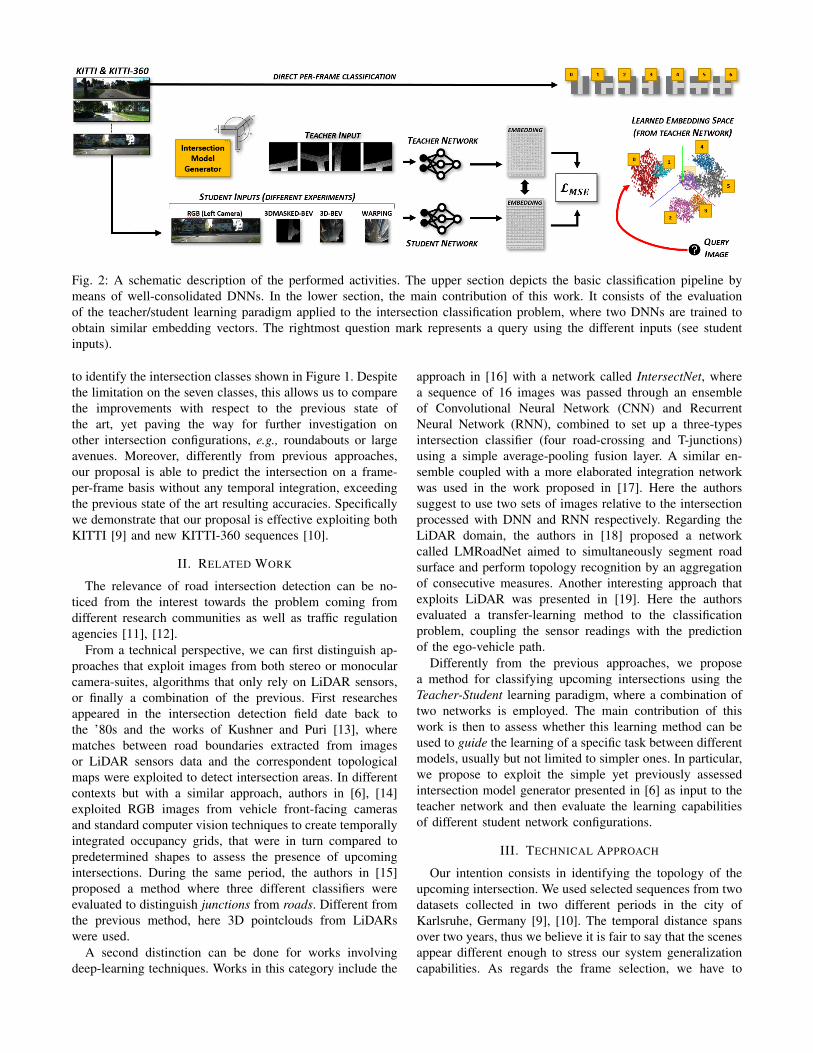
Fig. 2: A schematic description of the performed activities. The upper section depicts the basic classification pipeline bymeans of well-consolidated DNNs. In the lower section, the main contribution of this work. It consists of the evaluationof the teacher/student learning paradigm applied to the intersection classification problem, where two DNNs are trained toobtain similar embedding vectors. The rightmost question mark represents a query using the different inputs (see studentinputs).
to identify the intersection classes shown in Figure 1. Despitethe limitation on the seven classes, this allows us to comparethe improvements with respect to the previous state ofthe art, yet paving the way for further investigation onother intersection configurations, e.g., roundabouts or largeavenues. Moreover, differently from previous approaches,our proposal is able to predict the intersection on a frame-per-frame basis without any temporal integration, exceedingthe previous state of the art resulting accuracies. Specificallywe demonstrate that our proposal is effective exploiting bothKITTI [9] and new KITTI-360 sequences [10].
II. RELATED WORK
The relevance of road intersection detection can be no-ticed from the interest towards the problem coming fromdifferent research communities as well as traffic regulationagencies [11], [12].
From a technical perspective, we can first distinguish ap-proaches that exploit images from both stereo or monocularcamera-suites, algorithms that only rely on LiDAR sensors,or finally a combination of the previous. First researchesappeared in the intersection detection field date back tothe ’80s and the works of Kushner and Puri [13], wherematches between road boundaries extracted from imagesor LiDAR sensors data and the correspondent topologicalmaps were exploited to detect intersection areas. In differentcontexts but with a similar approach, authors in [6], [14]exploited RGB images from vehicle front-facing camerasand standard computer vision techniques to create temporallyintegrated occupancy grids, that were in turn compared topredetermined shapes to assess the presence of upcomingintersections. During the same period, the authors in [15]proposed a method where three different classifiers wereevaluated to distinguish junctions from roads. Different fromthe previous method, here 3D pointclouds from LiDARswere used.
A second distinction can be done for works involvingdeep-learning techniques. Works in this category include the
approach in [16] with a network called IntersectNet, wherea sequence of 16 images was passed through an ensembleof Convolutional Neural Network (CNN) and RecurrentNeural Network (RNN), combined to set up a three-typesintersection classifier (four road-crossing and T-junctions)using a simple average-pooling fusion layer. A similar en-semble coupled with a more elaborated integration networkwas used in the work proposed in [17]. Here the authorssuggest to use two sets of images relative to the intersectionprocessed with DNN and RNN respectively. Regarding theLiDAR domain, the authors in [18] proposed a networkcalled LMRoadNet aimed to simultaneously segment roadsurface and perform topology recognition by an aggregationof consecutive measures. Another interesting approach thatexploits LiDAR was presented in [19]. Here the authorsevaluated a transfer-learning method to the classificationproblem, coupling the sensor readings with the predictionof the ego-vehicle path.
Differently from the previous approaches, we proposea method for classifying upcoming intersections using theTeacher-Student learning paradigm, where a combination oftwo networks is employed. The main contribution of thiswork is then to assess whether this learning method can beused to guide the learning of a specific task between differentmodels, usually but not limited to simpler ones. In particular,we propose to exploit the simple yet previously assessedintersection model generator presented in [6] as input to theteacher network and then evaluate the learning capabilitiesof different student network configurations.
III. TECHNICAL APPROACH
Our intention consists in identifying the topology of theupcoming intersection. We used selected sequences from twodatasets collected in two different periods in the city ofKarlsruhe, Germany [9], [10]. The temporal distance spansover two years, thus we believe it is fair to say that the scenesappear different enough to stress our system generalizationcapabilities. As regards the frame selection, we have to
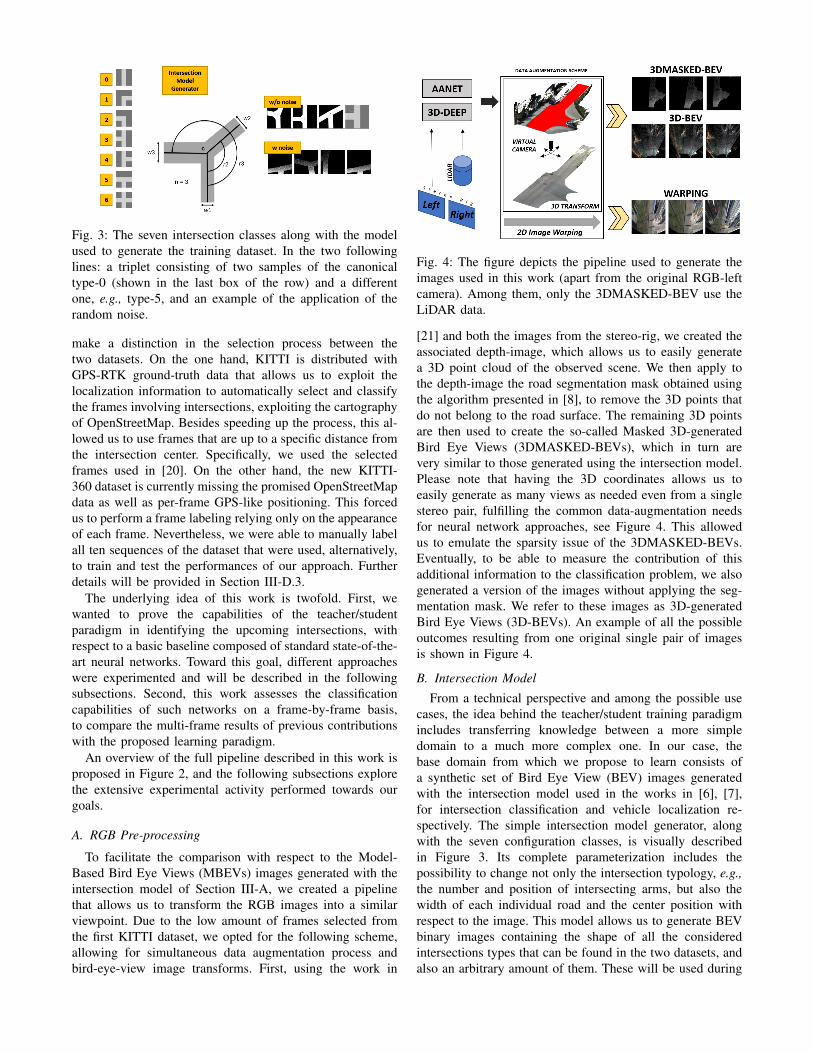
Fig. 3: The seven intersection classes along with the modelused to generate the training dataset. In the two followinglines: a triplet consisting of two samples of the canonicaltype-0 (shown in the last box of the row) and a differentone, e.g., type-5, and an example of the application of therandom noise.
make a distinction in the selection process between thetwo datasets. On the one hand, KITTI is distributed withGPS-RTK ground-truth data that allows us to exploit thelocalization information to automatically select and classifythe frames involving intersections, exploiting the cartographyof OpenStreetMap. Besides speeding up the process, this al-lowed us to use frames that are up to a specific distance fromthe intersection center. Specifically, we used the selectedframes used in [20]. On the other hand, the new KITTI-360 dataset is currently missing the promised OpenStreetMapdata as well as per-frame GPS-like positioning. This forcedus to perform a frame labeling relying only on the appearanceof each frame. Nevertheless, we were able to manually labelall ten sequences of the dataset that were used, alternatively,to train and test the performances of our approach. Furtherdetails will be provided in Section III-D.3.
The underlying idea of this work is twofold. First, wewanted to prove the capabilities of the teacher/studentparadigm in identifying the upcoming intersections, withrespect to a basic baseline composed of standard state-of-the-art neural networks. Toward this goal, different approacheswere experimented and will be described in the followingsubsections. Second, this work assesses the classificationcapabilities of such networks on a frame-by-frame basis,to compare the multi-frame results of previous contributionswith the proposed learning paradigm.
An overview of the full pipeline described in this work isproposed in Figure 2, and the following subsections explorethe extensive experimental activity performed towards ourgoals.
A. RGB Pre-processing
To facilitate the comparison with respect to the Model-Based Bird Eye Views (MBEVs) images generated with theintersection model of Section III-A, we created a pipelinethat allows us to transform the RGB images into a similarviewpoint. Due to the low amount of frames selected fromthe first KITTI dataset, we opted for the following scheme,allowing for simultaneous data augmentation process andbird-eye-view image transforms. First, using the work in
Fig. 4: The figure depicts the pipeline used to generate theimages used in this work (apart from the original RGB-leftcamera). Among them, only the 3DMASKED-BEV use theLiDAR data.
[21] and both the images from the stereo-rig, we created theassociated depth-image, which allows us to easily generatea 3D point cloud of the observed scene. We then apply tothe depth-image the road segmentation mask obtained usingthe algorithm presented in [8], to remove the 3D points thatdo not belong to the road surface. The remaining 3D pointsare then used to create the so-called Masked 3D-generatedBird Eye Views (3DMASKED-BEVs), which in turn arevery similar to those generated using the intersection model.Please note that having the 3D coordinates allows us toeasily generate as many views as needed even from a singlestereo pair, fulfilling the common data-augmentation needsfor neural network approaches, see Figure 4. This allowedus to emulate the sparsity issue of the 3DMASKED-BEVs.Eventually, to be able to measure the contribution of thisadditional information to the classification problem, we alsogenerated a version of the images without applying the seg-mentation mask. We refer to these images as 3D-generatedBird Eye Views (3D-BEVs). An example of all the possibleoutcomes resulting from one original single pair of imagesis shown in Figure 4.
B. Intersection Model
From a technical perspective and among the possible usecases, the idea behind the teacher/student training paradigmincludes transferring knowledge between a more simpledomain to a much more complex one. In our case, thebase domain from which we propose to learn consists ofa synthetic set of Bird Eye View (BEV) images generatedwith the intersection model used in the works in [6], [7],for intersection classification and vehicle localization re-spectively. The simple intersection model generator, alongwith the seven configuration classes, is visually describedin Figure 3. Its complete parameterization includes thepossibility to change not only the intersection typology, e.g.,the number and position of intersecting arms, but also thewidth of each individual road and the center position withrespect to the image. This model allows us to generate BEVbinary images containing the shape of all the consideredintersections types that can be found in the two datasets, andalso an arbitrary amount of them. These will be used during
the training phases of our teacher network, acting itself as adata-augmentation scheme for the DNN. We refer to theseimages as MBEVs. At this time, despite its triviality, itshould be noted that the point-density of 3DMASKED-BEVsis not constant over the distance with respect to the vehicle.Therefore, to simulate comparable MBEVs, we added arandom noise proportional to the distance, see Figure 3.
C. Baseline
We started our experiments by evaluating the classificationcapabilities of two well-known network models, namelyRESNET-18 and VGG-11 networks, to perform classificationin an end-to-end fashion. This allowed us to create a firstneural-baseline to compare with. Please notice that thesenetworks will be then used as backbone for all subsequentactivities. To create this baseline, we first used the RGBimages from the left-camera of the stereo rig. Alongside,we also prepared a second set of images containing a 2Dhomographies of the original images, to obtain a so-calledwarpings with homography (WARPING) images. These twosets of images were used in addition to the previous RGBimages to perform a comparison between the two representa-tions and then assessing the benefits described in Section I. Itis worth mentioning that a fair comparison with most existingapproaches at this stage is not possible, as they used a frame-integration process. Nevertheless, this helped us to set lower-bound thresholds and to evaluate the approaches describedin the following subsections.
D. Teacher/Student Training
In order to compare the images generated from theintersection model and those transformed from the RGBimages, we propose a teacher/student paradigm aimed tolearn a shared-embedding space between the two domains.The approach proposed in this work is inspired by the worksof Cattaneo [22], which performs visual localization using2D and 3D inputs in a bi-directional mode, teaching two net-works to create a shared embedding space. In a similar way,we conceive the classification problem as a metric-learningtask where, given two instances of the same intersectionsclass but in different domains, e.g., Class 0 and DomainsD1 and D2 (D1
C=0 and D2C=0), and two different non-linear
functions f(·) and g(·) represented in form of DNNs, thedistance between the embeddings is lower than any othernegative intersection instance, e.g., D2
c=2. Formally, given theIntersection-Model domain M = {0, 1, ..., 6} and Cameradomain C = {0, 1, ..., 6} each of which contains the sevenintersection typologies considered in Section III-A, given oneelement mi ∈ M , then Equation (1) is satisfied for all theelements in cj ∈ (C \ ci), where d(·) is a distance function.
d(f(mi), g(ci)) < d(f(mi), g(cj)) (1)
With regard to the teacher/student learning scheme, we madethe following considerations.
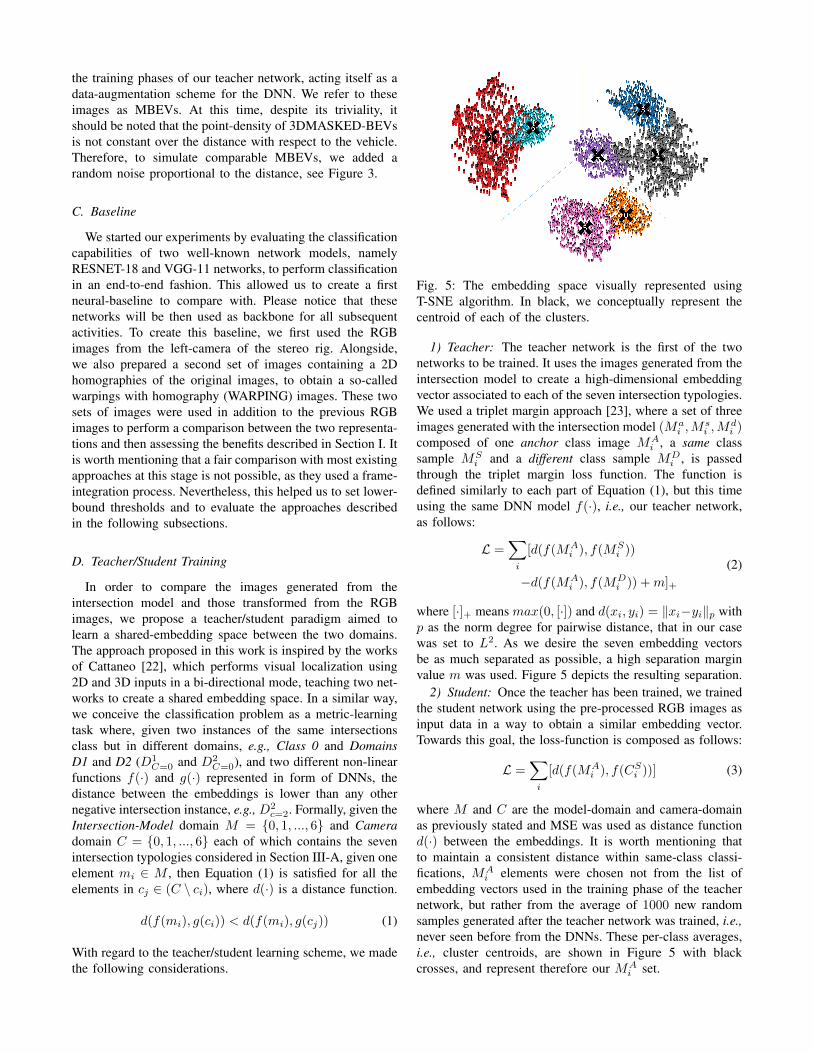
Fig. 5: The embedding space visually represented usingT-SNE algorithm. In black, we conceptually represent thecentroid of each of the clusters.
1) Teacher: The teacher network is the first of the twonetworks to be trained. It uses the images generated from theintersection model to create a high-dimensional embeddingvector associated to each of the seven intersection typologies.We used a triplet margin approach [23], where a set of threeimages generated with the intersection model (Ma
i ,Msi ,M
di )
composed of one anchor class image MAi , a same class
sample MSi and a different class sample MD
i , is passedthrough the triplet margin loss function. The function isdefined similarly to each part of Equation (1), but this timeusing the same DNN model f(·), i.e., our teacher network,as follows:
L =∑i
[d(f(MAi ), f(MS
i ))
−d(f(MAi ), f(MD
i )) +m]+
(2)
where [·]+ means max(0, [·]) and d(xi, yi) = ‖xi−yi‖p withp as the norm degree for pairwise distance, that in our casewas set to L2. As we desire the seven embedding vectorsbe as much separated as possible, a high separation marginvalue m was used. Figure 5 depicts the resulting separation.
2) Student: Once the teacher has been trained, we trainedthe student network using the pre-processed RGB images asinput data in a way to obtain a similar embedding vector.Towards this goal, the loss-function is composed as follows:
L =∑i
[d(f(MAi ), f(CS
i ))] (3)
where M and C are the model-domain and camera-domainas previously stated and MSE was used as distance functiond(·) between the embeddings. It is worth mentioning thatto maintain a consistent distance within same-class classi-fications, MA
i elements were chosen not from the list ofembedding vectors used in the training phase of the teachernetwork, but rather from the average of 1000 new randomsamples generated after the teacher network was trained, i.e.,never seen before from the DNNs. These per-class averages,i.e., cluster centroids, are shown in Figure 5 with blackcrosses, and represent therefore our MA
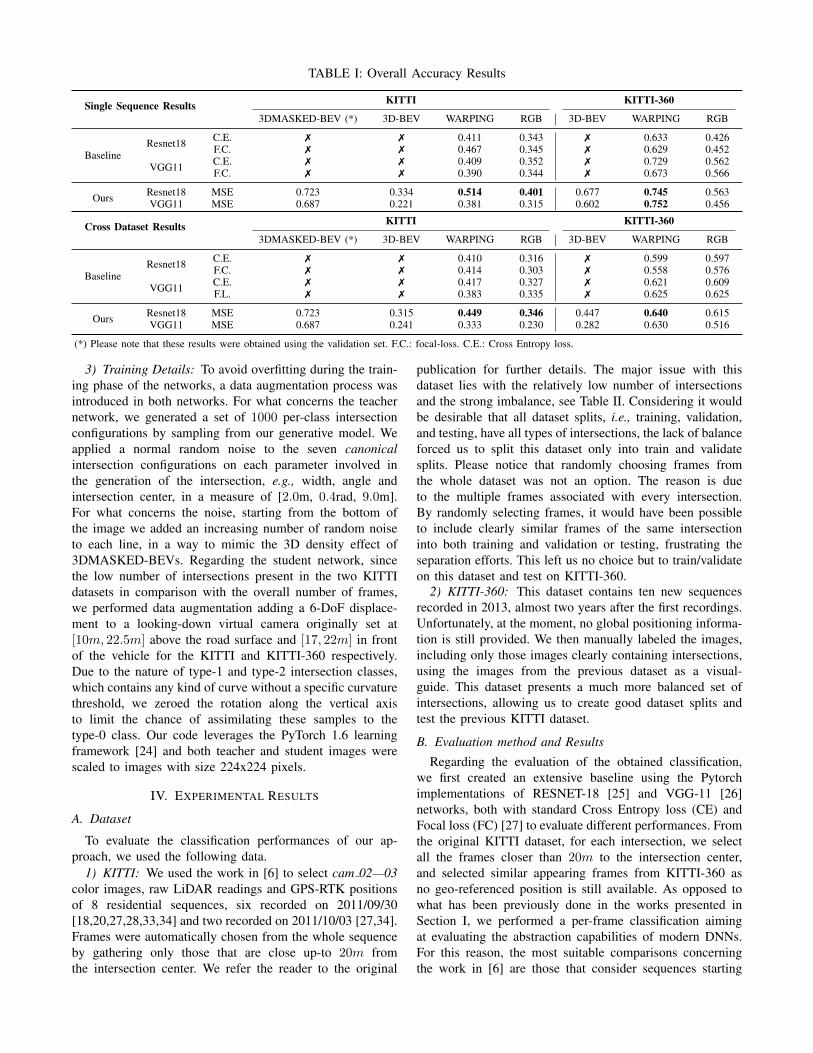
(*) Please note that these results were obtained using the validation set. F.C.: focal-loss. C.E.: Cross Entropy loss.
3) Training Details: To avoid overfitting during the train-ing phase of the networks, a data augmentation process wasintroduced in both networks. For what concerns the teachernetwork, we generated a set of 1000 per-class intersectionconfigurations by sampling from our generative model. Weapplied a normal random noise to the seven canonicalintersection configurations on each parameter involved inthe generation of the intersection, e.g., width, angle andintersection center, in a measure of [2.0m, 0.4rad, 9.0m].For what concerns the noise, starting from the bottom ofthe image we added an increasing number of random noiseto each line, in a way to mimic the 3D density effect of3DMASKED-BEVs. Regarding the student network, sincethe low number of intersections present in the two KITTIdatasets in comparison with the overall number of frames,we performed data augmentation adding a 6-DoF displace-ment to a looking-down virtual camera originally set at[10m, 22.5m] above the road surface and [17, 22m] in frontof the vehicle for the KITTI and KITTI-360 respectively.Due to the nature of type-1 and type-2 intersection classes,which contains any kind of curve without a specific curvaturethreshold, we zeroed the rotation along the vertical axisto limit the chance of assimilating these samples to thetype-0 class. Our code leverages the PyTorch 1.6 learningframework [24] and both teacher and student images werescaled to images with size 224x224 pixels.
IV. EXPERIMENTAL RESULTS
A. Dataset
To evaluate the classification performances of our ap-proach, we used the following data.
1) KITTI: We used the work in [6] to select cam 02—03color images, raw LiDAR readings and GPS-RTK positionsof 8 residential sequences, six recorded on 2011/09/30[18,20,27,28,33,34] and two recorded on 2011/10/03 [27,34].Frames were automatically chosen from the whole sequenceby gathering only those that are close up-to 20m fromthe intersection center. We refer the reader to the original
publication for further details. The major issue with thisdataset lies with the relatively low number of intersectionsand the strong imbalance, see Table II. Considering it wouldbe desirable that all dataset splits, i.e., training, validation,and testing, have all types of intersections, the lack of balanceforced us to split this dataset only into train and validatesplits. Please notice that randomly choosing frames fromthe whole dataset was not an option. The reason is dueto the multiple frames associated with every intersection.By randomly selecting frames, it would have been possibleto include clearly similar frames of the same intersectioninto both training and validation or testing, frustrating theseparation efforts. This left us no choice but to train/validateon this dataset and test on KITTI-360.
2) KITTI-360: This dataset contains ten new sequencesrecorded in 2013, almost two years after the first recordings.Unfortunately, at the moment, no global positioning informa-tion is still provided. We then manually labeled the images,including only those images clearly containing intersections,using the images from the previous dataset as a visual-guide. This dataset presents a much more balanced set ofintersections, allowing us to create good dataset splits andtest the previous KITTI dataset.
B. Evaluation method and Results
Regarding the evaluation of the obtained classification,we first created an extensive baseline using the Pytorchimplementations of RESNET-18 [25] and VGG-11 [26]networks, both with standard Cross Entropy loss (CE) andFocal loss (FC) [27] to evaluate different performances. Fromthe original KITTI dataset, for each intersection, we selectall the frames closer than 20m to the intersection center,and selected similar appearing frames from KITTI-360 asno geo-referenced position is still available. As opposed towhat has been previously done in the works presented inSection I, we performed a per-frame classification aimingat evaluating the abstraction capabilities of modern DNNs.For this reason, the most suitable comparisons concerningthe work in [6] are those that consider sequences starting
(a) Test Seq. - Baseline (b) Test Seq. - Ours (c) Cross Test - Baseline (d) Cross Test - Ours
(e) Test Seq. - Baseline (f) Test Seq. - Ours (g) Cross Test - Baseline (h) Cross Test - Ours
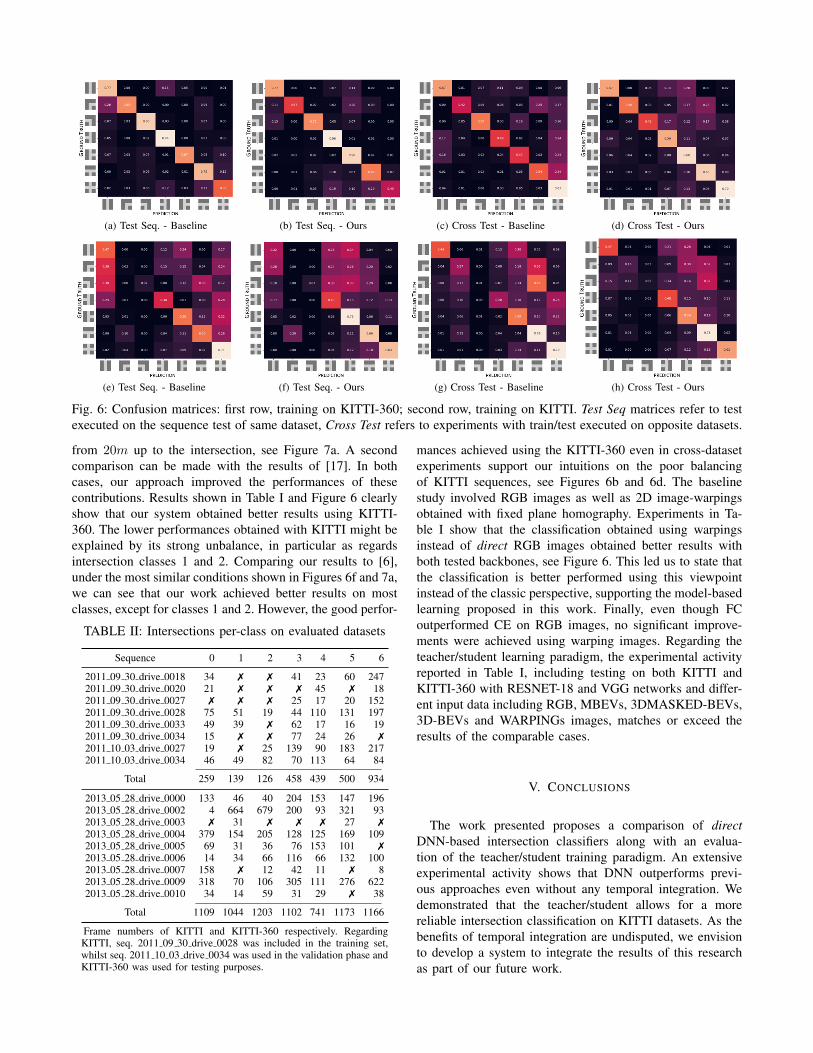
Fig. 6: Confusion matrices: first row, training on KITTI-360; second row, training on KITTI. Test Seq matrices refer to testexecuted on the sequence test of same dataset, Cross Test refers to experiments with train/test executed on opposite datasets.
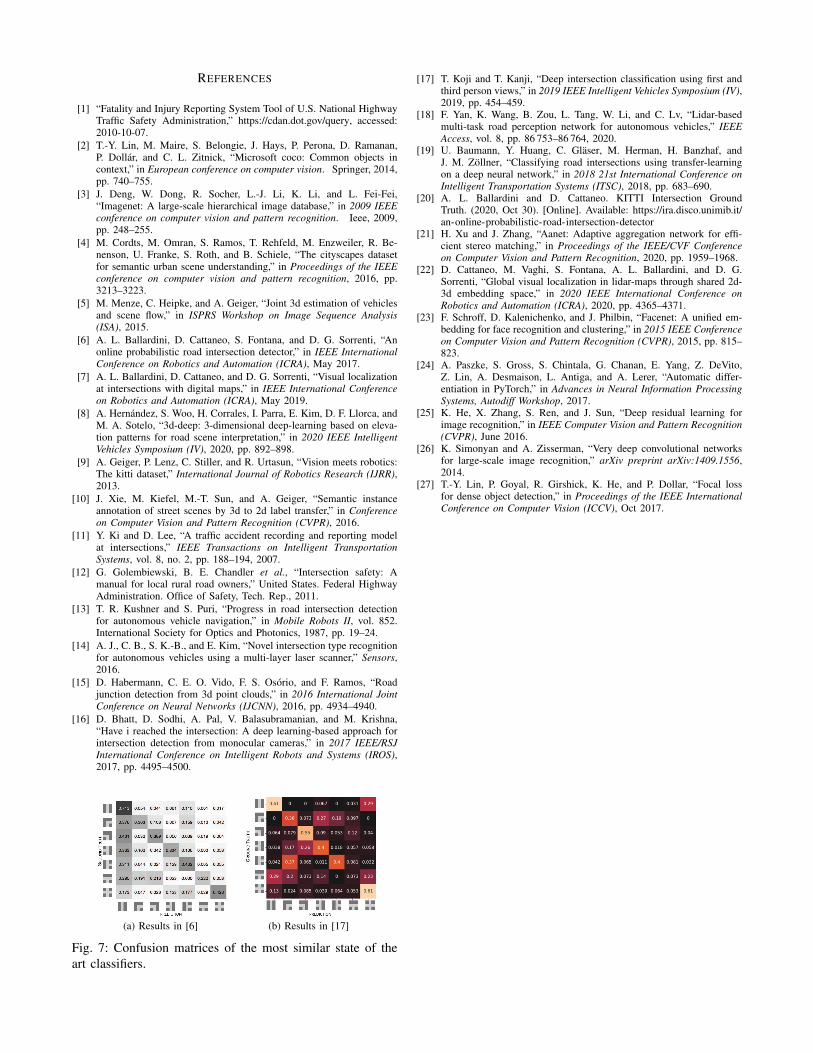
from 20m up to the intersection, see Figure 7a. A secondcomparison can be made with the results of [17]. In bothcases, our approach improved the performances of thesecontributions. Results shown in Table I and Figure 6 clearlyshow that our system obtained better results using KITTI-360. The lower performances obtained with KITTI might beexplained by its strong unbalance, in particular as regardsintersection classes 1 and 2. Comparing our results to [6],under the most similar conditions shown in Figures 6f and 7a,we can see that our work achieved better results on mostclasses, except for classes 1 and 2. However, the good perfor-
TABLE II: Intersections per-class on evaluated datasets
Frame numbers of KITTI and KITTI-360 respectively. RegardingKITTI, seq. 2011 09 30 drive 0028 was included in the training set,whilst seq. 2011 10 03 drive 0034 was used in the validation phase andKITTI-360 was used for testing purposes.
mances achieved using the KITTI-360 even in cross-datasetexperiments support our intuitions on the poor balancingof KITTI sequences, see Figures 6b and 6d. The baselinestudy involved RGB images as well as 2D image-warpingsobtained with fixed plane homography. Experiments in Ta-ble I show that the classification obtained using warpingsinstead of direct RGB images obtained better results withboth tested backbones, see Figure 6. This led us to state thatthe classification is better performed using this viewpointinstead of the classic perspective, supporting the model-basedlearning proposed in this work. Finally, even though FCoutperformed CE on RGB images, no significant improve-ments were achieved using warping images. Regarding theteacher/student learning paradigm, the experimental activityreported in Table I, including testing on both KITTI andKITTI-360 with RESNET-18 and VGG networks and differ-ent input data including RGB, MBEVs, 3DMASKED-BEVs,3D-BEVs and WARPINGs images, matches or exceed theresults of the comparable cases.
V. CONCLUSIONS
The work presented proposes a comparison of directDNN-based intersection classifiers along with an evalua-tion of the teacher/student training paradigm. An extensiveexperimental activity shows that DNN outperforms previ-ous approaches even without any temporal integration. Wedemonstrated that the teacher/student allows for a morereliable intersection classification on KITTI datasets. As thebenefits of temporal integration are undisputed, we envisionto develop a system to integrate the results of this researchas part of our future work.
REFERENCES
[1] “Fatality and Injury Reporting System Tool of U.S. National HighwayTraffic Safety Administration,” https://cdan.dot.gov/query, accessed:2010-10-07.
[2] T.-Y. Lin, M. Maire, S. Belongie, J. Hays, P. Perona, D. Ramanan,P. Dollar, and C. L. Zitnick, “Microsoft coco: Common objects incontext,” in European conference on computer vision. Springer, 2014,pp. 740–755.
[3] J. Deng, W. Dong, R. Socher, L.-J. Li, K. Li, and L. Fei-Fei,“Imagenet: A large-scale hierarchical image database,” in 2009 IEEEconference on computer vision and pattern recognition. Ieee, 2009,pp. 248–255.
[4] M. Cordts, M. Omran, S. Ramos, T. Rehfeld, M. Enzweiler, R. Be-nenson, U. Franke, S. Roth, and B. Schiele, “The cityscapes datasetfor semantic urban scene understanding,” in Proceedings of the IEEEconference on computer vision and pattern recognition, 2016, pp.3213–3223.
[5] M. Menze, C. Heipke, and A. Geiger, “Joint 3d estimation of vehiclesand scene flow,” in ISPRS Workshop on Image Sequence Analysis(ISA), 2015.
[6] A. L. Ballardini, D. Cattaneo, S. Fontana, and D. G. Sorrenti, “Anonline probabilistic road intersection detector,” in IEEE InternationalConference on Robotics and Automation (ICRA), May 2017.
[7] A. L. Ballardini, D. Cattaneo, and D. G. Sorrenti, “Visual localizationat intersections with digital maps,” in IEEE International Conferenceon Robotics and Automation (ICRA), May 2019.
[8] A. Hernandez, S. Woo, H. Corrales, I. Parra, E. Kim, D. F. Llorca, andM. A. Sotelo, “3d-deep: 3-dimensional deep-learning based on eleva-tion patterns for road scene interpretation,” in 2020 IEEE IntelligentVehicles Symposium (IV), 2020, pp. 892–898.
[9] A. Geiger, P. Lenz, C. Stiller, and R. Urtasun, “Vision meets robotics:The kitti dataset,” International Journal of Robotics Research (IJRR),2013.
[10] J. Xie, M. Kiefel, M.-T. Sun, and A. Geiger, “Semantic instanceannotation of street scenes by 3d to 2d label transfer,” in Conferenceon Computer Vision and Pattern Recognition (CVPR), 2016.
[11] Y. Ki and D. Lee, “A traffic accident recording and reporting modelat intersections,” IEEE Transactions on Intelligent TransportationSystems, vol. 8, no. 2, pp. 188–194, 2007.
[12] G. Golembiewski, B. E. Chandler et al., “Intersection safety: Amanual for local rural road owners,” United States. Federal HighwayAdministration. Office of Safety, Tech. Rep., 2011.
[13] T. R. Kushner and S. Puri, “Progress in road intersection detectionfor autonomous vehicle navigation,” in Mobile Robots II, vol. 852.International Society for Optics and Photonics, 1987, pp. 19–24.
[14] A. J., C. B., S. K.-B., and E. Kim, “Novel intersection type recognitionfor autonomous vehicles using a multi-layer laser scanner,” Sensors,2016.
[15] D. Habermann, C. E. O. Vido, F. S. Osorio, and F. Ramos, “Roadjunction detection from 3d point clouds,” in 2016 International JointConference on Neural Networks (IJCNN), 2016, pp. 4934–4940.
[16] D. Bhatt, D. Sodhi, A. Pal, V. Balasubramanian, and M. Krishna,“Have i reached the intersection: A deep learning-based approach forintersection detection from monocular cameras,” in 2017 IEEE/RSJInternational Conference on Intelligent Robots and Systems (IROS),2017, pp. 4495–4500.
(a) Results in [6] (b) Results in [17]
Fig. 7: Confusion matrices of the most similar state of theart classifiers.
[17] T. Koji and T. Kanji, “Deep intersection classification using first andthird person views,” in 2019 IEEE Intelligent Vehicles Symposium (IV),2019, pp. 454–459.
[18] F. Yan, K. Wang, B. Zou, L. Tang, W. Li, and C. Lv, “Lidar-basedmulti-task road perception network for autonomous vehicles,” IEEEAccess, vol. 8, pp. 86 753–86 764, 2020.
[19] U. Baumann, Y. Huang, C. Glaser, M. Herman, H. Banzhaf, andJ. M. Zollner, “Classifying road intersections using transfer-learningon a deep neural network,” in 2018 21st International Conference onIntelligent Transportation Systems (ITSC), 2018, pp. 683–690.
[20] A. L. Ballardini and D. Cattaneo. KITTI Intersection GroundTruth. (2020, Oct 30). [Online]. Available: https://ira.disco.unimib.it/an-online-probabilistic-road-intersection-detector
[21] H. Xu and J. Zhang, “Aanet: Adaptive aggregation network for effi-cient stereo matching,” in Proceedings of the IEEE/CVF Conferenceon Computer Vision and Pattern Recognition, 2020, pp. 1959–1968.
[22] D. Cattaneo, M. Vaghi, S. Fontana, A. L. Ballardini, and D. G.Sorrenti, “Global visual localization in lidar-maps through shared 2d-3d embedding space,” in 2020 IEEE International Conference onRobotics and Automation (ICRA), 2020, pp. 4365–4371.
[23] F. Schroff, D. Kalenichenko, and J. Philbin, “Facenet: A unified em-bedding for face recognition and clustering,” in 2015 IEEE Conferenceon Computer Vision and Pattern Recognition (CVPR), 2015, pp. 815–823.
[24] A. Paszke, S. Gross, S. Chintala, G. Chanan, E. Yang, Z. DeVito,Z. Lin, A. Desmaison, L. Antiga, and A. Lerer, “Automatic differ-entiation in PyTorch,” in Advances in Neural Information ProcessingSystems, Autodiff Workshop, 2017.
[25] K. He, X. Zhang, S. Ren, and J. Sun, “Deep residual learning forimage recognition,” in IEEE Computer Vision and Pattern Recognition(CVPR), June 2016.
[26] K. Simonyan and A. Zisserman, “Very deep convolutional networksfor large-scale image recognition,” arXiv preprint arXiv:1409.1556,2014.
[27] T.-Y. Lin, P. Goyal, R. Girshick, K. He, and P. Dollar, “Focal lossfor dense object detection,” in Proceedings of the IEEE InternationalConference on Computer Vision (ICCV), Oct 2017.