13
www.augustuscapital.es Augustus Capital AM Cervino Global Equities Global Investment in Value and Momentum Septembe r 2021

www.augustuscapital.es
Augustus Capital AM
Cervino Global EquitiesGlobal Investment in Value and MomentumSeptember 2021

Page 2
DISCLAIMER
This document and the information, opinions, estimations and recommendations contained herein have been prepared by Augustus Capital AM in order to provide to its
clients with general information regarding the date of issue of the report. Augustus Capital AM reserves the right to update, modify or remove this information. Neither
this document nor its content constitutes an offer, invitation or purchase request or subscription of securities. Neither constitutes a deal or investment cancellation, and
it can not be used as the basis of any contract, commitment or any kind of decision. The investor who has access to this document should be aware that the securities,
instruments or investments referred could be not be suitable for their specific investments, financial position or risk profile, which have not been taken into consideration
for the preparation of this report. Therefore, investors should make their own investment decisions considering these circumstances and obtaining the necessary
specialized advice. Furthermore, Augustus Capital AM may not be held responsible for the truthfulness, integrity or validity of this information. Investors should note that
past returns do not guarantee future returns. The price of the securities, instruments or the results of the investments could fluctuate against the investors' interests and
even result in a loss of the initial investment. Therefore, before closing any transaction with these kind of instruments, investors should be aware of their operating mode,
the rights, the obligations and the risks involved, as well as be aware of the rights and obligations of the underlying values. It could not exist secondary market for these
instruments. Augustus Capital AM or any other entity of the group, as well as its directors or employees may have a position in any of the securities that this document
refers to, directly or indirectly, or in any other related, previous to the publication or after, to the extent allowed by the applicable Law. Employees of Augustus Capital
AM or other entity of the Group may provide market comments, orally or by writing, or investment strategies to its clients even if those opinions are contrary to the
opinions expressed in this document. Augustus Capital AM or any other entity of the Group also may adopt their own investment decisions even if they are inconsistent
with the recommendations expressed in this document. Any part of this document may be (i) copied, photocopied or duplicated by any other form (ii) redistributed or (iii)
quoted, without the previous written permission of Augustus Capital AM. Any part of this presentation may be reproduced, taken or transmitted to those countries (or
persons or entities) where distribution may be forbidden by law. The failure to comply these restrictions may involve breaking the laws of the relevant jurisdiction.

Page 3
1. Cervino History
2. Cervino vs. MSCI World Net Total Return
3. Return and Risk Data
4. Cervino Method
4.1. Investment Universe
4.2. DCF Valuation
4.3. Portfolio Construction
4.4. Portfolio Example
5. General Information
6. Team
I N D E X

Page 4
1. CERVINO HISTORY
▪ Since 2005, Cervino’s valuation method has been continuously improved.
▪ The basis of Cervino’s portfolio started at Preon Capital (2017): Jari
Ovaskainen’s individual family office, one of the most succesful European
business angel investors.
▪ Since inception, Cervino outperforms the Index MSCI World Net Total Return.

Page 5
2. CERVINO vs. MSCI WORLD NET RETURN
Cervino (virtual trades) **Preon Capital (real trades)*
TORAL RETURN 80%
Cervino
Source: Bloomberg. Data as of 30/09/2021* % Adjusted return by 1.68% annual (management and depository fees)
** % Adjusted return by 3.00% annual (management, depository and brokerage fees)
TOTAL RETURN (base 100) NAV: 10.36 €30/09/2021
90
100
110
120
130
140
150
160
170
180
190
Ma
r-1
7
Ap
r-1
7
Ma
y-1
7
Jun
-17
Jul-
17
Au
g-1
7
Se
p-1
7
Oct
-17
No
v-1
7
De
c-1
7
Jan
-18
Fe
b-1
8
Ma
r-1
8
Ap
r-1
8
Ma
y-1
8
Jun
-18
Jul-
18
Au
g-1
8
Se
p-1
8
Oct
-18
No
v-1
8
De
c-1
8
Jan
-19
Fe
b-1
9
Ma
r-1
9
Ap
r-1
9
Ma
y-1
9
Jun
-19
Jul-
19
Au
g-1
9
Se
p-1
9
Oct
-19
No
v-1
9
De
c-1
9
Jan
-20
Fe
b-2
0
Ma
r-2
0
Ap
r-2
0
Ma
y-2
0
Jun
-20
Jul-
20
Au
g-2
0
Se
p-2
0
Oct
-20
No
v-2
0
De
c-2
0
Jan
-21
Fe
b-2
1
Ma
r-2
1
Ap
r-2
1
Ma
y-2
1
Jun
-21
Jul-
21
Au
g-2
1
Se
p-2
1
Cervino Augustus Back Test Preon MSCI World Net Total Return
+80 %
+62 %

Page 6
3. MONTHLY RETURN
Source: Bloomberg. Data as of 30/09/2021
CERVINO: 13.8% ANNUALIZED
Year January February March April May June July August Sept. October Nov. Dec. Annual
2017 2.1% 3.7% 0.4% -2.6% -1.0% 0.2% 10.9% 5.5% -3.6% 2.8% 19.00%
2018 2.7% 4.6% -2.4% 0.0% 5.6% -4.1% -0.8% 1.0% -1.8% -9.4% 0.3% -7.1% -11.8%
2019 10.7% 3.9% 3.9% 1.6% -5.3% 3.5% 3.1% -2.1% 2.6% 2.7% 3.2% 2.2% 33.6%
2020 2.4% -9.5% -9.2% 9.1% 5.7% 5.1% 2.0% 2.4% 1.4% -1.6% 7.0% 1.5% 15.7%
2021 3.5% 0.3% 4.6% 1.3% -0.6% 2.3% 0.8% 2.3% -3.7% 11.1%
MSCI WORLD NET TOTAL RETURN: 11.1% ANNUALIZED
Year January February March April May June July August Sept. October Nov. Dec. Annual
2017 -0.3% -0.3% -1.1% -1.0% -0.9% -0.7% 2.8% 3.4% -0.2% -7.1% 2.2%
2018 1.5% -2.1% -3.0% 3.0% 4.2% -0.1% 2.9% 1.8% 0.7% -5.0% 1.2% -8.5% -4.1%
2019 7.4% 3.8% 2.7% 3.7% -5.2% 4.3% 2.8% -1.0% 3.2% 0.2% 4.0% 1.2% 30.0%
2020 2.8% -9.5% -13.1% 11.1% 3.2% 1.7% -0.5% 5.5% -1.5% -2.4% 9.8% 1.9% 6.3%
2021 -0.3% 2.7% 6.7% 2.2% -0.1% 4.6% 1.8% 3.0% -2.4% 19.3%
CERVINO vs. MSCI WORLD NET TOTAL RETURN DIFFERENCE: 2.4% ANNUALIZED
Year January February March April May June July August Sept. October Nov. Dec. Annual
2017 2.4% 4.0% 1.5% -1.6% -0.1% 0.9% 8.1% 2.1% -3.4% 9.9% 16.8%
2018 1.2% 6.7% 0.6% -3.0% 1.4% -4.0% -3.7% -0.8% -2.5% -4.4% -0.9% 1.4% -7.7%
2019 3.3% 0.1% 1.2% -2.1% -0.1% -0.8% 0.3% -1.1% -0.6% 2.5% -0.8% 1.0% 3.6%
2020 -0.4% 0.0% 3.9% -2.0% 2.5% 3.4% 2.5% -3.1% 2.9% 0.8% -2.8% -0.4% 9.4%
2021 3.8% -2.4% -2.1% -0.9% -0.5% -2.3% -1.0% -0.7% -1.3% -8.3%

Page 7
3. RETURN AND RISK DATA
SINCE INCEPTION
CERVINOMSCI WORLD NET
TOTAL RETURN
Alpha 5.3% N/A
Sharpe Ratio 0.90 0.66
Beta 0.70 1.00
Volatility 15.4% 16.9%
12 MONTHS CERVINOMSCI WORLD NET
TOTAL RETURN
Alpha -2.5% N/A
Sharpe Ratio 1.59 2.75
Beta 0.80 1.00
Volatility 12.1% 11.3%
Source: Bloomberg. Data as of 30/09/2021
LOWER RISK
vs. Indices
Lower MarketVolatility

Page 8
4.1. CERVINO METHOD: Investment Universe
Cervino Screening Criteria
10 and 5 years Total Shareholder Return > 10% annually
Gross Debt+ Pensions < 2.5 Free Cash Flow
Daily Trading Volume > € 1MM
Holding Companies Excluded
Banks and Natural Resources Excluded
Developed Markets
Bloomberg Trading Companies
At least 3 analysts in Bloomberg consensus
59.181
27.260
24.334
6.111
5.521
2.096
471
240
Source: Bloomberg. Data as of 30/09/2021

Page 9
4.2. CERVINO METHOD: Equity DCF & Adjusted IRR
▪ Equity DCF Method (Discounted Cash Flow)
▪ IRR (Internal Rate of Return) calculated for eachcompany in the last screening criteria
▪ According to CAPM* Model• If IRR >Ke (cost of equity)• Then Value > Price
▪ Ke= Risk free + Beta x Risk Premium where: • Risk free: risk free interest rate• Company’s Beta vs. MSCI World Net Total Return• Risk premium: market risk premium
Equity DCF Method Adjusted IRR
▪ Risk Premium = Constant Market Value
▪ Adjusted IRR for each company:
• Country Risk: risk free of the company’s country• Volatility Risk: company’s index Beta
▪ Adjusted IRR Cervino Model
= (CAPM IRR - Risk free) / Beta
▪ Adjusted IRR > Risk Premium : Value Signal
* Capital Asset Pricing Model
Upside Value Signal: Adjusted IRR/Risk Premium > 1

Page 10
• Value Signal x Momentum Signal > 1.0
• Geographic diversification (USA, Western Europe, Japan,
Australia, Hong Kong)
• Equal weight per company
• The algorithm determines the number of companies in the
portfolio between 50 and 100
• Momentum: 12 months investor return (%) in euros
• Ex.: +30% 12 months momentum
• Upside Momentum Signal = 1.30
• Optimal Range Momentum Signal (historical data base)
• Equity DCF Model per company
• Value Signal: Adjusted IRR/Risk Premium
• Ex.: 7% Adjusted IRR vs. 5% Risk Premium =>
Upside Value Signal = 1.40
• Optimal Range Value Signal (historical data base)
VALUE SIGNAL MOMENTUM SIGNAL
4.3. CERVINO METHOD: Portfolio Construction
CERVINO PORTFOLIO CONSTRUCTIONValue Signal x Momentum Signal
x

Page 11
4.4. CERVINO METHOD: Portfolio Example
Source: Bloomberg. Data as of 30/09/2021
Sector Distribution
4,4%
1,1%
1,3%
1,5%
2,3%
2,8%
2,9%
3,4%
5,0%
5,3%
5,6%
7,8%
8,3%
9,2%
9,6%
12,1%
17,5%
Cash
Food, Beverage & Tobacco
Consumer Services
Commercial & Professional Serv
Materials
Media & Entertainment
Automobiles & Components
Software & Services
Pharmaceuticals, Biotechnology
Health Care Equipment & Servic
Retailing
Transportation
Diversified Financials
Technology Hardware & Equipmen
Consumer Durables & Apparel
Capital Goods
Semiconductors & Semiconductor
UNITED STATES (35)
ACTIVISION BLIZZARD INC
AEROVIRONMENT INC
ALPHABET INC-CL A
AMAZON.COM INC
AMEDISYS INC
APPLIED MATERIALS INC
BLACKROCK INC
BOSTON BEER COMPANY INC-A
CISCO SYSTEMS INC
CUMMINS INC
DECKERS OUTDOOR CORP
EBAY INC
ELECTRONIC ARTS INC
GARMIN LTD
HALOZYME THERAPEUTICS INC
JOHNSON & JOHNSON
KLA CORP
LAM RESEARCH CORP
LINCOLN ELECTRIC HOLDINGS
MICRON TECHNOLOGY INC
MKS INSTRUMENTS INC
NATIONAL BEVERAGE CORP
OSHKOSH CORP
QUALCOMM INC
RAYMOND JAMES FINANCIAL INC
ROBERT HALF INTL INC
SAIA INC
SHARPS COMPLIANCE CORP
TAKE-TWO INTERACTIVE SOFTWRE
TEXAS INSTRUMENTS INC
UNITEDHEALTH GROUP INC
WERNER ENTERPRISES INC
WILLIAMS-SONOMA INC
WW GRAINGER INC
ZEBRA TECHNOLOGIES CORP-CL A
ASIA (16)
ANRITSU CORP
BREVILLE GROUP LTD
CAPCOM CO LTD
CITY CHIC COLLECTIVE LTD
FUJI CORP/AICHI
HONG KONG EXCHANGES & CLEAR
JB HI-FI LTD
MAGELLAN FINANCIAL GROUP LTD
MURATA MANUFACTURING CO LTD
NIHON UNISYS LTD
OTSUKA CORP
POLYNOVO LTD
RIVERSTONE HOLDINGS LTD
TOKYO OHKA KOGYO CO LTD
VENTURE CORP LTD
ZOZO INC
EUROPE (16)
BELLWAY PLC
COMPUTACENTER PLC
DSV PANALPINA A/S
FUTURE PLC
GENMAB A/S
KONE OYJ-B
LOGITECH INTERNATIONAL-REG
MELEXIS NV
METSA BOARD OYJ
NESTE OYJ
PARTNERS GROUP HOLDING AG
PERSIMMON PLC
REDROW PLC
ROCKWOOL INTL A/S-B SHS
TRIGANO SA
VESTAS WIND SYSTEMS A/S
Page 12
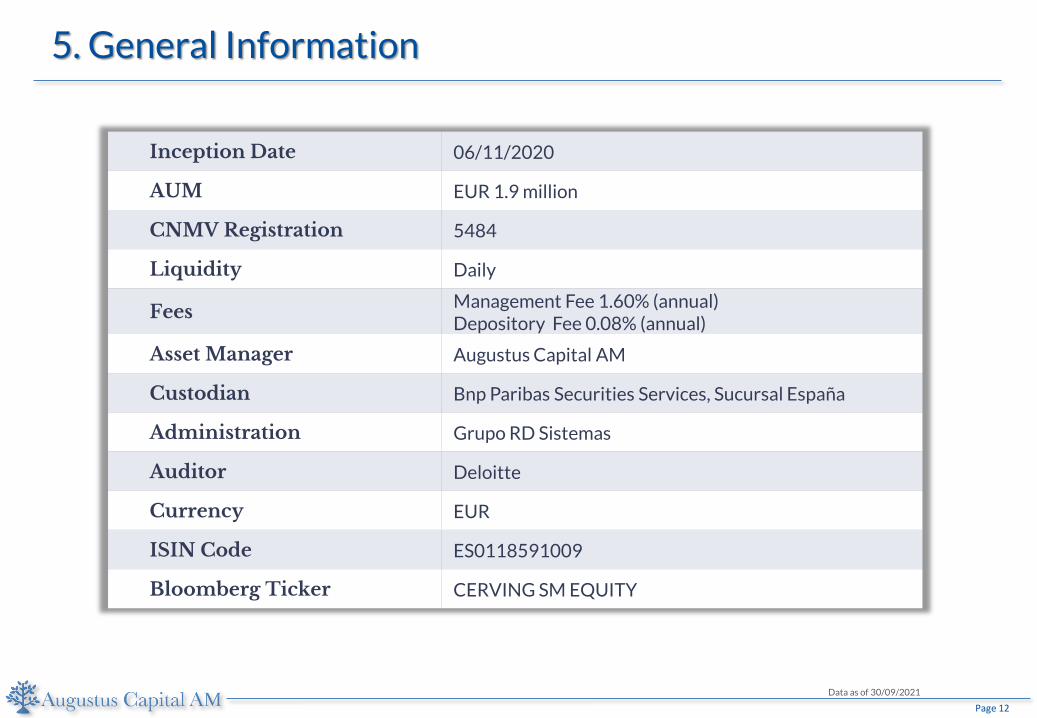
Inception Date 06/11/2020
AUM EUR 1.9 million
CNMV Registration 5484
Liquidity Daily
Fees Management Fee 1.60% (annual)Depository Fee 0.08% (annual)
Asset Manager Augustus Capital AM
Custodian Bnp Paribas Securities Services, Sucursal España
Administration Grupo RD Sistemas
Auditor Deloitte
Currency EUR
ISIN Code ES0118591009
Bloomberg Ticker CERVING SM EQUITY
5. General Information
Data as of 30/09/2021

Page 13
6. TEAM
Juan Uguet de Resayre Francisco Tajada Daniel Porte María Elena Morales Alicia Casasús
FOUNDER & PORTFOLIO MANAGER
FUND MANAGER ANALYST BUSINESS DEVELOPMENT & INVESTOR RELATIONS
FINANCIAL & CONTROL DIRECTOR
Juan began his career at BetaCapital Fortis where heworked for 8 years. He wasHead of the Analysis Teambefore being appointed CIO in1998.From 2000 – 2007, heworked as CIO at IbercajaGestión, managing overEUR9.500MM AUM. Later, hejoined BBVA & Partners,where he became Partner in2007. During this period, Juanmanaged Augustus EquityFund and Augustus NeutralPlus, Total Return.Juan holds a bachelor’sdegree in Economics andBusiness Administration bythe University of Zaragoza(Spain) and was awarded withan MBA Degree by theUniversity of San Francisco(California).
Before joining AugustusCapital AM, Francisco wasPartner at Preon Capital.Francisco is also Chairman ofInvestivity S.A., an innovativeSwiss regulated investmentmanager, specialised inproviding sophisticatedportfolio solutions to protectand increase assets over thelong term, using state-of-the-art technlogy. Francisco wasformerly a partner atONEtoONE CorporateFinancE. From 2008 to 2011,he was a buy-side analyst forStrategic Investment Advisorsin Geneva.Francisco holds an MsCdegree in MechanicalEngineering by the Universityof Zaragoza and an MBA byIESE in Barcelona.
Prior to joining AugustusCapital AM, Daniel began hiscareer as junior analyst atGAR Investment AdvisorsEAFI where he worked for 1year.Daniel holds a bachelor’sdegree in Economics andBusiness Administration fromCEU Abad Oliba University ofBarcelona.
In 2002, Maria Elena beganher career in the auditingindustry working for KPMG(USA) and Deloitte (Mexico).In 2008, she moved to thefinance industry, working asData Analyst for Bloomberg(Mexico) and later in 2010 asRelationship Manager forHSBC Private Banking. Beforejoining Augustus Capital AM,Maria Elena was part of theWells Fargo Advisors’ team(USA).Maria Elena holds a Bachelor’sdegree in Accounting andFinance by ITESM (Mexico)and a Master’s degree inFinance and Banking byUniversidad de Alcala deHenares (Spain).
Before joining AugustusCapital AM, Alicia worked inthe accounting department ofAramon, Montañas de Aragon.
Before that, she was part ofthe finance team at SchindlerSupply Chain Europe AG.
After college, Alicia startedher career in a small companyas head of accounting andfinance.
Alicia holds a Bachelor’sdegree in Economics andMaster’s degree in Accountingand Finance by Universidad deZaragoza.


