Macquarie Group Limited ABN 94 122 169 279 No.50 Martin Place Telephone (61 2) 8232 3333 Sydney NSW 2000 Facsimile (61 2) 8232 7780 GPO Box 4294 Internet http://www.macquarie.com Sydney NSW 1164 AUSTRALIA ASX/Media Release Investor presentation and outlook update SYDNEY, 11 September 2018 – As part of its regular investor communications program, Macquarie Group (Macquarie) (ASX: MQG; ADR: MQBKY) will be presenting at the CLSA Investors’ Forum in Hong Kong on 11 and 12 September 2018. Contained within the presentation (see attached) is an update to the short-term outlook statement that Macquarie provided at the Group’s Annual General Meeting on 26 July 2018. We continue to expect the Group’s result for FY19 to be broadly in line with FY18: - 1H19 result is expected to be broadly in line with the 1H18 result, which included strong performance fees in MAM. The Group’s short-term outlook remains subject to: - The conduct of period end reviews and the completion rate of transactions. We note that the sale of Quadrant Energy has not been included in our current outlook - Market conditions - The impact of foreign exchange - Potential regulatory changes and tax uncertainties; and - Geographic composition of income. Over the medium-term, Macquarie remains well positioned to deliver superior performance. The Group has deep expertise in major markets and we continue to build on our strength in diversity and adapt our portfolio mix to changing market conditions. We are seeing the ongoing benefits of continued cost initiatives, our balance sheet is strong and conservative, and we have a proven risk management framework and culture. Contacts Sam Dobson Investor Relations +61 2 8232 9986 Paul Marriott Corporate Communications +61 2 8232 7381 For personal use only
Transcript
Macquarie Group Limited ABN 94 122 169 279
No.50 Martin Place Telephone (61 2) 8232 3333 Sydney NSW 2000 Facsimile (61 2) 8232 7780 GPO Box 4294 Internet http://www.macquarie.com Sydney NSW 1164 AUSTRALIA
ASX/Media Release
Investor presentation and outlook update SYDNEY, 11 September 2018 – As part of its regular investor communications program, Macquarie Group (Macquarie) (ASX: MQG; ADR: MQBKY) will be presenting at the CLSA Investors’ Forum in Hong Kong on 11 and 12 September 2018. Contained within the presentation (see attached) is an update to the short-term outlook statement that Macquarie provided at the Group’s Annual General Meeting on 26 July 2018. We continue to expect the Group’s result for FY19 to be broadly in line with FY18:
- 1H19 result is expected to be broadly in line with the 1H18 result, which included strong performance fees in MAM.
The Group’s short-term outlook remains subject to:
- The conduct of period end reviews and the completion rate of transactions. We note that the sale of Quadrant Energy has not been included in our current outlook
- Market conditions
- The impact of foreign exchange
- Potential regulatory changes and tax uncertainties; and
- Geographic composition of income.
Over the medium-term, Macquarie remains well positioned to deliver superior performance. The Group has deep expertise in major markets and we continue to build on our strength in diversity and adapt our portfolio mix to changing market conditions. We are seeing the ongoing benefits of continued cost initiatives, our balance sheet is strong and conservative, and we have a proven risk management framework and culture.
Contacts
Sam Dobson Investor Relations +61 2 8232 9986 Paul Marriott Corporate Communications +61 2 8232 7381
For
per
sona
l use
onl
y
25th CLSA Investor’s Forum
Presentation to Investors and Analysts11-12 September 2018
Hong Kong
Alex HarveyChief Financial OfficerSam DobsonHead of Investor Relations
For
per
sona
l use
onl
y
2
DisclaimerThis information has been prepared on a strictly confidential basis by Macquarie Group Limited ABN 94 122 169 279 (“Macquarie”) and may neither be reproduced in whole nor in part, nor may any of its contents be divulged, to any third party without theprior written consent of Macquarie. Information in this presentation, including forecast financial information, should not be considered as legal, financial, accounting, tax or other advice, or a recommendation to investors or potential investors in relation toholding, purchasing or selling securities or other financial products or instruments and does not take into account your particular investment objectives, financial situation or needs. Before acting on any information you should consider the appropriatenessof the information having regard to these matters, any relevant offer document and in particular, you should seek independent financial advice. All securities and financial product or instrument transactions involve risks, which include (among others) therisk of adverse or unanticipated market, financial or political developments and, in international transactions, currency risk.
This information has been prepared in good faith and is not intended to create legal relations and is not binding on Macquarie under any circumstances whatsoever.
To the extent permitted by law, neither Macquarie nor its related bodies corporate (the “Macquarie Group”, ”Group”) nor any of its associates, directors, officers or employees, or any other person (together, “Persons”), makes any promise, guarantee,representation or warranty (express or implied) to any person as to the accuracy or completeness of this information, or of any other information, materials or opinions, whether written or oral, that have been, or may be, prepared or furnished by MacquarieGroup, including, without limitation, economic and financial projections and risk evaluation. No responsibility or liability whatsoever (in negligence or otherwise) is accepted by any person for any errors, mis-statements or omissions in this information orany other information or materials. Without prejudice to the foregoing, neither the Macquarie Group, nor any Person shall be liable for any loss or damage (whether direct, indirect or consequential) suffered by any person as a result of relying on anystatement in or omission from this information. The information may be based on certain assumptions or market conditions, and if those assumptions or market conditions change, the information may change. No independent verification of the informationhas been made. Any quotes given are indicative only.
Other than Macquarie Bank Limited ABN 46 008 583 542 (MBL), any Macquarie group entity noted in this document is not an authorised deposit-taking institution for the purposes of the Banking Act 1959 (Commonwealth of Australia). That entity’sobligations do not represent deposits or other liabilities of Macquarie and Macquarie does not guarantee or otherwise provide assurance in respect of the obligations of that entity, unless noted otherwise. Each of MBL, acting through its London branch,and Macquarie Bank International Limited, is authorised and regulated by the Financial Conduct Authority and the Prudential Regulation Authority to carry on banking business in the United Kingdom. MBL, acting through its Seoul Branch, is authorisedand regulated by the Financial Services Commission in Korea to carry out banking business in Korea. MBL, acting through its Singapore Branch, is authorised and regulated by the Monetary Authority of Singapore to carry out banking business inSingapore. MBL, acting through its Hong Kong branch, is authorised and regulated by the Hong Kong Monetary Authority to carry on banking business in Hong Kong. MBL maintains Representative Offices in Illinois, New York and Texas, but is notauthorised to conduct business in the US. With respect to matters pertaining to US securities laws, and to the extent required by such laws, Macquarie its worldwide subsidiaries consult with, and act through, Macquarie Capital (USA) Inc., a US-registeredbroker-dealer and member of FINRA, or another US broker-dealer. With respect to matters pertaining to US futures laws, and to the extent required by such laws, Macquarie its worldwide subsidiaries consult with, and act through Macquarie Futures USAInc., a US-registered futures commission merchant and member of the National Futures Association, or other futures commission merchants.
The Macquarie Group or its associates, directors, officers or employees may have interests in the financial products referred to in this information by acting in various roles including as provider of corporate finance, underwriter or dealer, holder of principalpositions, broker, lender or adviser and may receive fees, brokerage or commissions for acting in those capacities. In addition, the Macquarie Group and its associates, directors, officers or employees may buy or sell the financial products as principal oragent and as such may effect transactions which are not consistent with any recommendations in this information.
Unless otherwise specified all information is as at 30 June 2018.
This presentation provides further detail in relation to key elements of Macquarie Group Limited’s financial performance and financial position. It also provides an analysis of the funding profile of the Group because maintaining the structural integrity of theGroup's balance sheet requires active management of both asset and liability portfolios. Active management of the funded balance sheet enables the Group to strengthen its liquidity and funding position.
This presentation may contain forward looking statements including statements regarding our intent, belief or current expectations with respect to Macquarie’s businesses and operations, market conditions, results of operation and financial condition,capital adequacy, specific provisions and risk management practices. Readers are cautioned not to place undue reliance on these forward looking statements. Macquarie does not undertake any obligation to publicly release the result of any revisions tothese forward looking statements to reflect events or circumstances after the date hereof to reflect the occurrence of unanticipated events. While due care has been used in the preparation of forecast information, actual results may vary in a materiallypositive or negative manner. Forecasts and hypothetical examples are subject to uncertainty and contingencies outside Macquarie’s control. Past performance is not a reliable indication of future performance.
Any additional financial information in this presentation which is not included in the Macquarie Group Limited Financial Report was not subject to independent audit or review by PricewaterhouseCoopers.
Macquarie | 25th CLSA Investors’ Forum | macquarie.com Overview of Macquarie Macquarie’s Operating Groups 1Q19 Update FY19 Outlook Appendices
Macquarie | 25th CLSA Investors’ Forum | macquarie.com Overview of Macquarie Macquarie’s Operating Groups 1Q19 Update FY19 Outlook Appendices
For
per
sona
l use
onl
y
MACQUARIE 2018
Overview of Macquarie01Macquarie | 25th CLSA Investors’ Forum | macquarie.com Overview of Macquarie Macquarie’s Operating Groups 1Q19 Update FY19 Outlook Appendices
For
per
sona
l use
onl
y
5Macquarie | 25th CLSA Investors’ Forum | macquarie.com Overview of Macquarie Macquarie’s Operating Groups 1Q19 Update FY19 Outlook Appendices
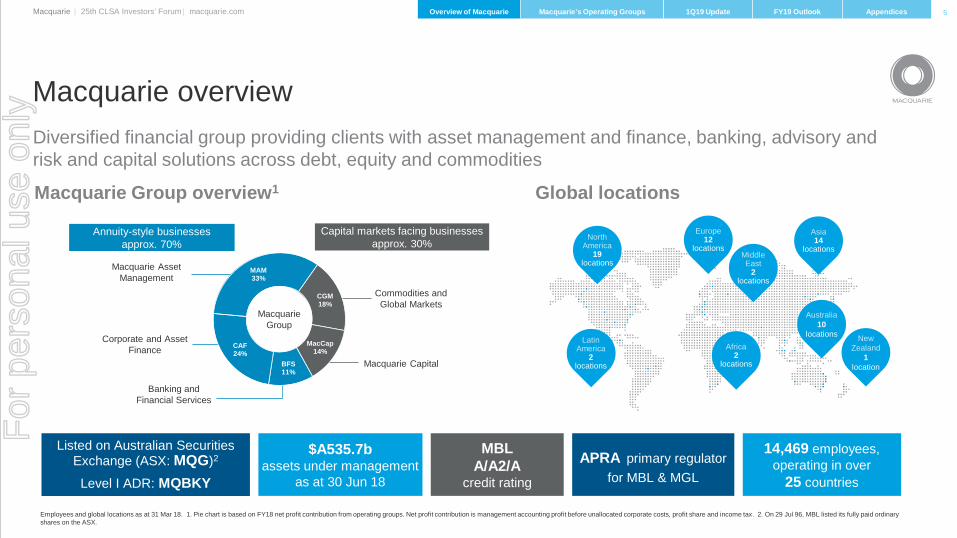
Employees and global locations as at 31 Mar 18. 1. Pie chart is based on FY18 net profit contribution from operating groups. Net profit contribution is management accounting profit before unallocated corporate costs, profit share and income tax. 2. On 29 Jul 96, MBL listed its fully paid ordinary shares on the ASX.
Diversified financial group providing clients with asset management and finance, banking, advisory and risk and capital solutions across debt, equity and commodities
Macquarie overview
Macquarie Group overview1 Global locations
Listed on Australian Securities Exchange (ASX: MQG)2
Level I ADR: MQBKY
MBL A/A2/A
credit rating
APRA primary regulator for MBL & MGL
Latin America
2locations
North America
19 locations
Europe12
locationsMiddle East
2 locations
Asia14
locations
Africa2
locations
Australia10
locations New Zealand
1 location
14,469 employees, operating in over
25 countries
$A535.7bassets under management
as at 30 Jun 18
Macquarie Asset Management
Banking and Financial Services
Corporate and Asset Finance
Macquarie Capital
Commodities and Global Markets
Macquarie Group
Annuity-style businesses approx. 70%
Capital markets facing businesses approx. 30%
CGM18%
MacCap14%
BFS11%
CAF24%
MAM33%
For
per
sona
l use
onl
y
6Macquarie | 25th CLSA Investors’ Forum | macquarie.com Overview of Macquarie Macquarie’s Operating Groups 1Q19 Update FY19 Outlook Appendices
Why Macquarie?
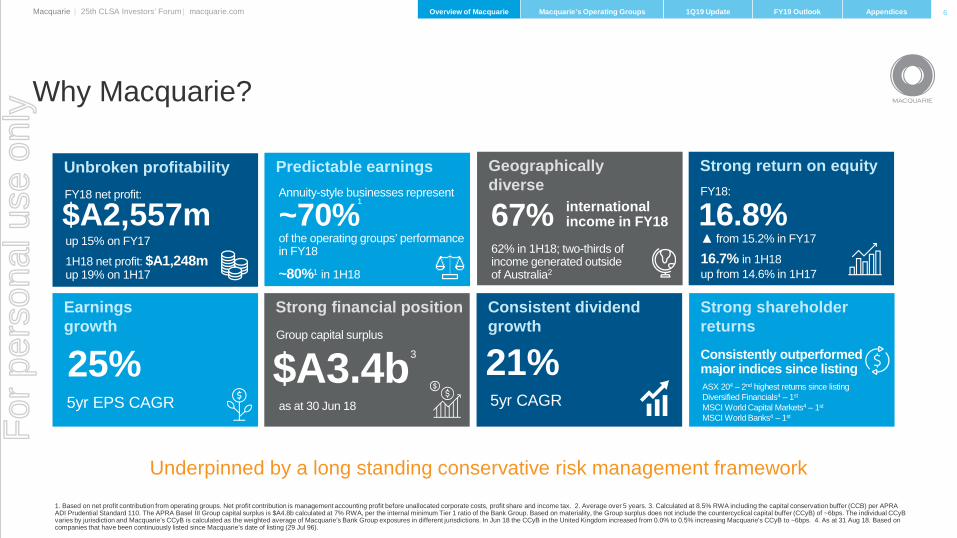
1. Based on net profit contribution from operating groups. Net profit contribution is management accounting profit before unallocated corporate costs, profit share and income tax. 2. Average over 5 years. 3. Calculated at 8.5% RWA including the capital conservation buffer (CCB) per APRA ADI Prudential Standard 110. The APRA Basel III Group capital surplus is $A4.8b calculated at 7% RWA, per the internal minimum Tier 1 ratio of the Bank Group. Based on materiality, the Group surplus does not include the countercyclical capital buffer (CCyB) of ~6bps. The individual CCyB varies by jurisdiction and Macquarie’s CCyB is calculated as the weighted average of Macquarie’s Bank Group exposures in different jurisdictions. In Jun 18 the CCyB in the United Kingdom increased from 0.0% to 0.5% increasing Macquarie's CCyB to ~6bps. 4. As at 31 Aug 18. Based on companies that have been continuously listed since Macquarie’s date of listing (29 Jul 96).
Underpinned by a long standing conservative risk management framework
Strong return on equity
Strong shareholder returnsConsistently outperformed major indices since listing ASX 204 – 2nd highest returns since listingDiversified Financials4 – 1st
MSCI World Capital Markets4 – 1st
MSCI World Banks4 – 1st
Earnings growth
5yr EPS CAGR
25%
Geographically diverse
62% in 1H18; two-thirds of income generated outside of Australia2
7Macquarie | 25th CLSA Investors’ Forum | macquarie.com Overview of Macquarie Macquarie’s Operating Groups 1Q19 Update FY19 Outlook Appendices
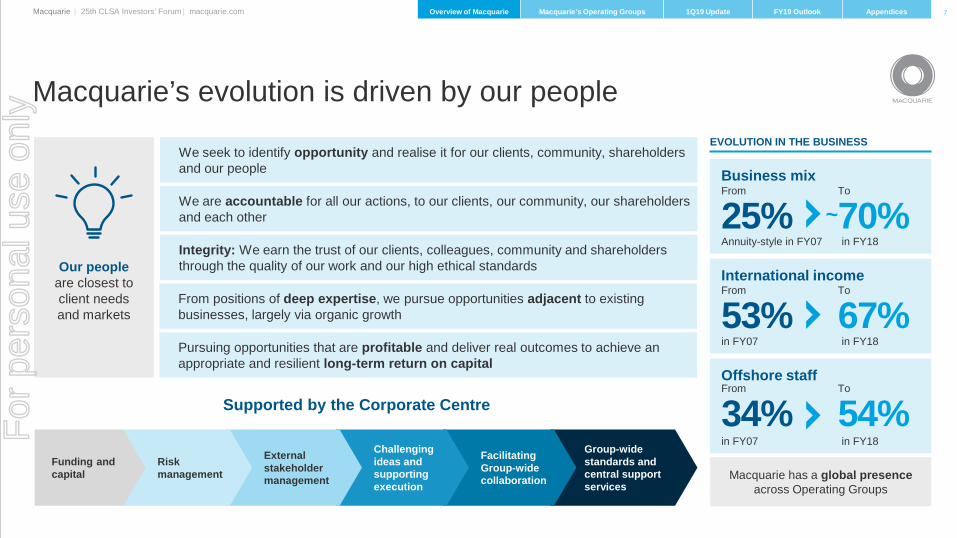
Macquarie’s evolution is driven by our people
Group-wide standards and central support services
Facilitating Group-wide collaboration
Challenging ideas and supporting execution
Macquarie has a global presence across Operating Groups
We are accountable for all our actions, to our clients, our community, our shareholders and each other
We seek to identify opportunity and realise it for our clients, community, shareholders and our people
Integrity: We earn the trust of our clients, colleagues, community and shareholders through the quality of our work and our high ethical standardsOur people
are closest to client needs and markets
Supported by the Corporate Centre
External stakeholder management
EVOLUTION IN THE BUSINESS
Risk management
Funding and capital
Business mix
Annuity-style in FY07
From
25%To
70%~in FY18
International incomeFrom
53%To
67%in FY07 in FY18
Offshore staffFrom
34%To
54%in FY07 in FY18
Pursuing opportunities that are profitable and deliver real outcomes to achieve an appropriate and resilient long-term return on capital
From positions of deep expertise, we pursue opportunities adjacent to existing businesses, largely via organic growth
For
per
sona
l use
onl
y
8
FY17
Unbroken profitability through adjacent growth
Note: the above list is not exhaustive. 1. Acquired on behalf of managed funds and accounts.
2.0
1.8
1.6
1.4
1.2
1.0
0.8
0.6
0.4
0.2
-
$Ab
2.2
FY85 Received an
Australian Banking license as MBLEquitiesBusiness banking
FY86 First listed
property trustEntered stockbroking
FY69 Hill Samuel
UK opens branch office in SydneyStarted corporate finance and advisory; project finance
FY94 Hills Motorway
Mortgage securitisationAsset management Premium fundingNY office opened
FY96 MBL listed
on the ASX
FY95 HK office
openedDEFT
FY99 BT Australia
Wrap
FY07 Thames Water1
Giuliani CapitalCards
FY08 Established
a UK bank, MBIL
FY02 Sydney
Airport1
FY04 ING Asian cash
equitiesGasRailcar financing
FY09 Constellation
CAF Principal FinanceCMA
FY10 Delaware FPK
TristoneMining and medical equipment financing
Staff: 14,657
FY12 Onstream
MIDIS
FY15 AWAS
FY16 Esanda
Advantage Funding
UK GIBCargill
FY03 Meters financing
Oil
1980
’s Started commodities platformRatesFXFuturesWealth management
Underpinned by a strong risk management framework and capital position
2.6
2.4
Macquarie | 25th CLSA Investors’ Forum | macquarie.com Overview of Macquarie Macquarie’s Operating Groups 1Q19 Update FY19 Outlook Appendices
For
per
sona
l use
onl
y
9
-
2,000
4,000
6,000
8,000
10,000
12,000
FY13 FY14 FY15 FY16 FY17 FY18 -
1.00
2.00
3.00
4.00
5.00
6.00
7.00
8.00
FY13 FY14 FY15 FY16 FY17 FY18
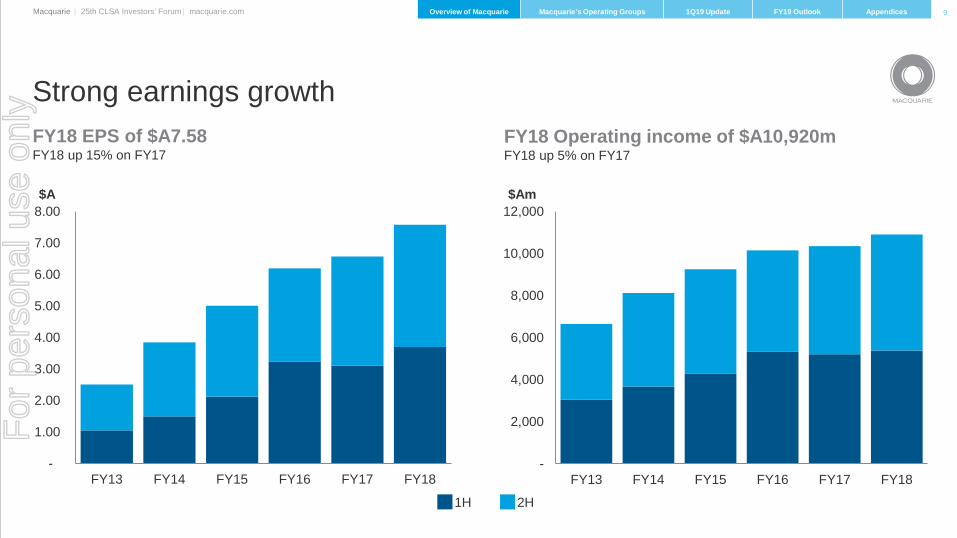
Strong earnings growthFY18 EPS of $A7.58FY18 up 15% on FY17
FY18 Operating income of $A10,920mFY18 up 5% on FY17
1H 2H
$Am$A
Macquarie | 25th CLSA Investors’ Forum | macquarie.com Overview of Macquarie Macquarie’s Operating Groups 1Q19 Update FY19 Outlook Appendices
For
per
sona
l use
onl
y
10Macquarie | 25th CLSA Investors’ Forum | macquarie.com Overview of Macquarie Macquarie’s Operating Groups 1Q19 Update FY19 Outlook Appendices
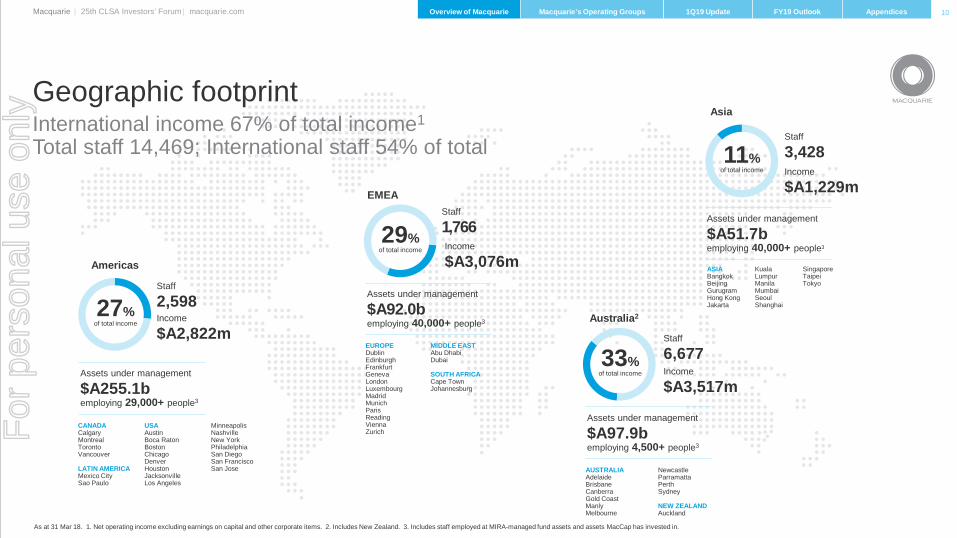
As at 31 Mar 18. 1. Net operating income excluding earnings on capital and other corporate items. 2. Includes New Zealand. 3. Includes staff employed at MIRA-managed fund assets and assets MacCap has invested in.
International income 67% of total income1
Total staff 14,469; International staff 54% of total
Data restated to reflect current business splits. 1. Annuity-style based on net profit contribution (calculated as management accounting profit before unallocated corporate costs, profit share and income tax) for MAM, CAF and BFS. Capital markets facing based on net profit contribution for CGM and MacCap. 2. Based on net operating income excluding earnings on capital and other corporate items. 3. Includes New Zealand.
Predictable earnings and geographically diverseAnnuity-style vs Capital markets facing1 Geographical split of income2
Macquarie | 25th CLSA Investors’ Forum | macquarie.com Overview of Macquarie Macquarie’s Operating Groups 1Q19 Update FY19 Outlook Appendices
FY07 FY18 FY07 FY18
Americas16%
Asia15%
EMEA22%
Australia3
47%
For
per
sona
l use
onl
y
12
Stable earnings
Macquarie | 25th CLSA Investors’ Forum | macquarie.com Overview of Macquarie Macquarie’s Operating Groups 1Q19 Update FY19 Outlook Appendices
4.2x
3.8x
1.5x
1.2x1.0x
0.8x
-
0.5
1.0
1.5
2.0
2.5
3.0
3.5
4.0
4.5
GlobalInvestment
Banks
Global Banks DomesticAsset
Managers
GlobalFund/AssetManagers
Macquarie DomesticMajors
15.7x
4.6x
2.3x1.6x
1.0x 0.6x
-
4.0
8.0
12.0
16.0
20.0
GlobalInvestment
Banks
GlobalFund/AssetManagers
Global Banks DomesticAsset
Managers
Macquarie DomesticMajors
5 year earnings volatility relative to Macquarie (since GFC)
10 year earnings volatility relative to Macquarie (includes GFC)
This page compares the historical earnings volatility among certain firms, and is not intended to represent that Macquarie has a comparable business model, risks or prospects to any other firm mentioned.Volatility of P&L is defined as standard deviation of P&L divided by average P&L (coefficient of variation), based on most recent annual disclosures. Source: Bloomberg as at 2 Aug 18.
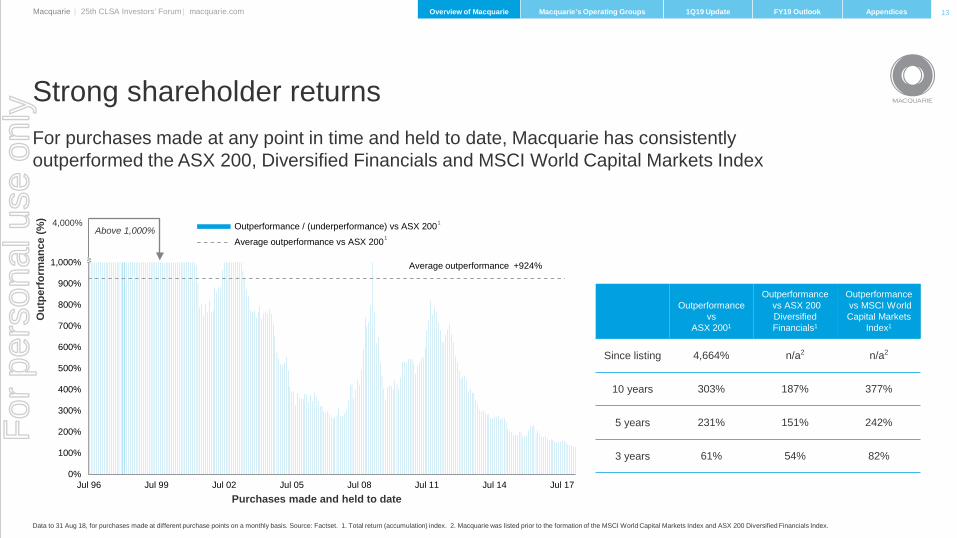
Strong shareholder returnsFor purchases made at any point in time and held to date, Macquarie has consistentlyoutperformed the ASX 200, Diversified Financials and MSCI World Capital Markets Index
Data to 31 Aug 18, for purchases made at different purchase points on a monthly basis. Source: Factset. 1. Total return (accumulation) index. 2. Macquarie was listed prior to the formation of the MSCI World Capital Markets Index and ASX 200 Diversified Financials Index.
Purchases made and held to date
Out
perf
orm
ance
(%)
w
4,000%
Outperformance vs
ASX 2001
Outperformancevs ASX 200 DiversifiedFinancials1
Outperformancevs MSCI World Capital Markets
Index1
Since listing 4,664% n/a2 n/a2
10 years 303% 187% 377%
5 years 231% 151% 242%
3 years 61% 54% 82%
Above 1,000%1
1
Macquarie | 25th CLSA Investors’ Forum | macquarie.com Overview of Macquarie Macquarie’s Operating Groups 1Q19 Update FY19 Outlook Appendices
For
per
sona
l use
onl
y
14
As at 31 Aug 18. 1.Goldman Sachs bank only rated by Standard & Poor’s from 2012. 2. Deutsche Bank legacy senior unsecured.
Long term ratings stabilityMacquarie Bank Limited
JPMorgan Chase Bank
Credit Suisse AG
UBS AG Barclays Bank PLC
DeutscheBank
Goldman Sachs Bank1
Bank of America
Citibank Morgan Stanley Bank
Macquarie BankR
atin
g m
ovem
ent (
notc
hes)
Moody’s Ratings Movements from 2007
Standard & Poor’s Ratings Movements from 2007
MBL has maintained its S&P ‘A’rating for
YEARS27
103
25
56
76
2007
2018
Intra-periodratings
movement
No. ratingsmovements
#
AA-
A+A
AA
AA+
A-
BBB
BBB+
5
Rat
ing
mov
emen
t (no
tche
s)
Aa2Aa3
A1
Aa1AAA
A2
Baa1A3
JPMorgan Chase Bank
Credit Suisse AG
Barclays Bank PLC
Bank of America
Goldman Sachs Bank
Macquarie Bank
UBS AG DeutscheBank2
Morgan Stanley Bank
Citibank
2
13
47
48
73
Baa2
6
Baa3
Macquarie | 25th CLSA Investors’ Forum | macquarie.com Overview of Macquarie Macquarie’s Operating Groups 1Q19 Update FY19 Outlook Appendices
For
per
sona
l use
onl
y
15
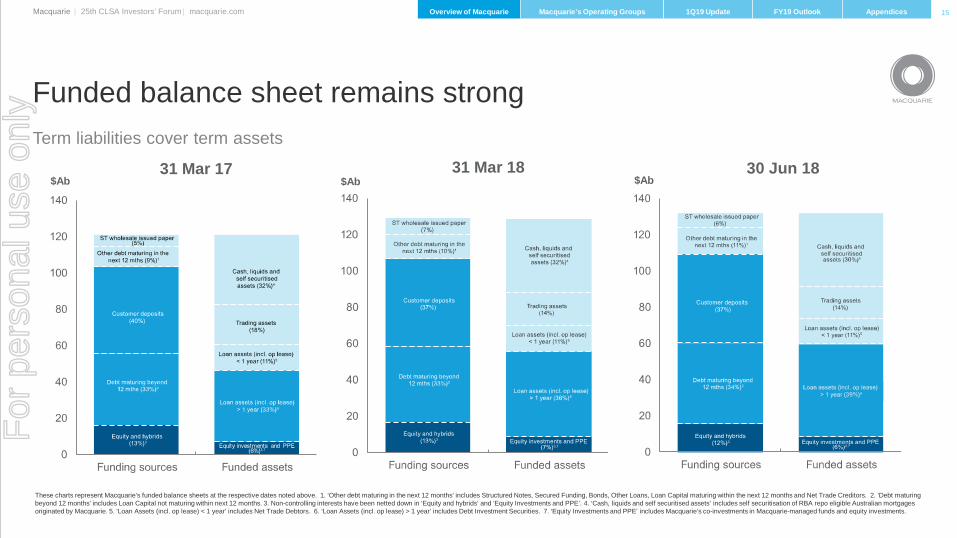
Funded balance sheet remains strong
Macquarie | 25th CLSA Investors’ Forum | macquarie.com Overview of Macquarie Macquarie’s Operating Groups 1Q19 Update FY19 Outlook Appendices
Term liabilities cover term assets
These charts represent Macquarie’s funded balance sheets at the respective dates noted above. 1. ‘Other debt maturing in the next 12 months’ includes Structured Notes, Secured Funding, Bonds, Other Loans, Loan Capital maturing within the next 12 months and Net Trade Creditors. 2. ‘Debt maturing beyond 12 months’ includes Loan Capital not maturing within next 12 months. 3. Non-controlling interests have been netted down in ‘Equity and hybrids’ and ‘Equity Investments and PPE’. 4. ‘Cash, liquids and self securitised assets’ includes self securitisation of RBA repo eligible Australian mortgages originated by Macquarie. 5. ‘Loan Assets (incl. op lease) < 1 year’ includes Net Trade Debtors. 6. ‘Loan Assets (incl. op lease) > 1 year’ includes Debt Investment Securities. 7. ‘Equity Investments and PPE’ includes Macquarie’s co-investments in Macquarie-managed funds and equity investments.
31 Mar 17 31 Mar 18 30 Jun 18$Ab$Ab $Ab
For
per
sona
l use
onl
y
16
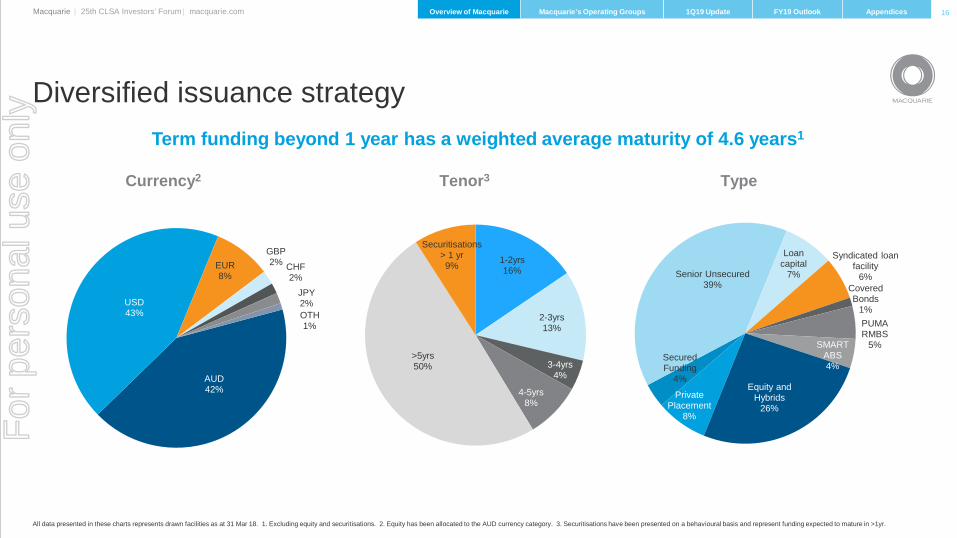
All data presented in these charts represents drawn facilities as at 31 Mar 18. 1. Excluding equity and securitisations. 2. Equity has been allocated to the AUD currency category. 3. Securitisations have been presented on a behavioural basis and represent funding expected to mature in >1yr.
Diversified issuance strategy
Currency2 Tenor3 Type
Term funding beyond 1 year has a weighted average maturity of 4.6 years1
Macquarie | 25th CLSA Investors’ Forum | macquarie.com Overview of Macquarie Macquarie’s Operating Groups 1Q19 Update FY19 Outlook Appendices
AUD42%
USD43%
EUR8%
GBP2% CHF
2%JPY2%OTH1%
1-2yrs16%
2-3yrs13%
3-4yrs4%
4-5yrs8%
>5yrs50%
Securitisations > 1 yr9%
Private Placement
8%
Secured Funding
4%
Senior Unsecured39%
Loan capital
7%
Syndicated loan facility
6%Covered Bonds
1%PUMA RMBS
5%SMART ABS4%
Equity and Hybrids
26%
For
per
sona
l use
onl
y
17
Strong regulatory ratios
Macquarie | 25th CLSA Investors’ Forum | macquarie.com Overview of Macquarie Macquarie’s Operating Groups 1Q19 Update FY19 Outlook Appendices
112%
90.0%
95.0%
100.0%
105.0%
110.0%
115.0%
NSFR
155%
40.0%
70.0%
100.0%
130.0%
160.0%
190.0%
LCR
5.6%
6.4%
-
1.5%
3.0%
4.5%
6.0%
7.5%
Leverage ratio
10.3%
12.8%
-
3.5%
7.0%
10.5%
14.0%
17.5%
CET1 ratio
1. Average LCR for Jun 18 quarter is based on an average of daily observations. 2. ‘Harmonised’ Basel III estimates are calculated in accordance with the BCBS Basel III framework. 3. Includes the capital conservation buffer (CCB) in the minimum CET1 ratio requirement. The countercyclical capital buffer (CCyB) is immaterial at 6bps and has not been included. In Feb 18 APRA proposed a minimum leverage ratio requirement for IRB ADIs of 4% effective from 1 Jul 19.
Bank Group (Jun 18)
Bank Group (APRA) APRA Basel III minimum3Bank Group (Harmonised )2
1
For
per
sona
l use
onl
y
18
Basel III capital position
Macquarie | 25th CLSA Investors’ Forum | macquarie.com Overview of Macquarie Macquarie’s Operating Groups 1Q19 Update FY19 Outlook Appendices
APRA Basel III Group capital at Jun 18 of $A18.8b, Group capital surplus of $A3.4b1,2
1. Calculated at 8.5% RWA including the capital conservation buffer (CCB) per APRA ADI Prudential Standard 110. The APRA Basel III Group capital surplus is $A4.8b calculated at 7% RWA, per the internal minimum Tier 1 ratio of the Bank Group. 2. Based on materiality, the Group surplus does not include the countercyclical capital buffer (CCyB) of ~6bps. The individual CCyB varies by jurisdiction and Macquarie’s CCyB is calculated as the weighted average of Macquarie’s Bank Group exposures in different jurisdictions. In Jun 18 the CCyB in the United Kingdom increased from 0.0% to 0.5% increasing Macquarie's CCyB to ~6bps. 3. Includes current quarter P&L net of business growth, the net impact of hedging employed to reduce the sensitivity of the Group’s capital position to FX translation movements and other movements in capital supply and requirements. 4. APRA Basel III ‘super-equivalence’ includes the impact of changes in capital requirements in areas where APRA differs from the BCBS Basel III framework and includes full CET1 deductions for equity investments ($A0.6b); differences in mortgages treatment ($A0.7b); capitalised expenses ($A0.5b); investment into deconsolidated subsidiaries ($A0.2b); DTAs and other impacts ($A0.2b).
6.35.6
3.4
1.0
0.4(1.5)
(0.6) (2.2)
-
1.0
2.0
3.0
4.0
5.0
6.0
7.0
Harmonised Basel IIIat Mar 18
FY18 Final Dividendand MEREP
MCN redemption MCN3 issuance Other Harmonised Basel IIIat Jun 18
APRA Basel III'super equivalence'
APRA Basel IIIat Jun 18
Group regulatory surplus: Basel III (Jun 18)$Ab
Based on 8.5% (minimum Tier 1 ratio + CCB)
3
4
For
per
sona
l use
onl
y
19
Regulatory and tax update
Macquarie | 25th CLSA Investors’ Forum | macquarie.com Overview of Macquarie Macquarie’s Operating Groups 1Q19 Update FY19 Outlook Appendices
• Regulatory capital1
– In Jul 17 APRA provided guidance on the level of CET1 capital ratios for Australian banks to be considered ‘unquestionably strong’, indicating an average increase of 150bps across the industry would be required2
– In Feb 18, APRA released draft ‘unquestionably strong’ proposals reinforcing their previous guidance. As the final form of the framework remains uncertain there may be a broader range of potential outcomes for individual banks3
– Based on existing guidance, Macquarie’s surplus capital position remains sufficient to accommodate likely additional requirements– In addition, APRA released a discussion paper on their proposed implementation of the leverage ratio with a minimum requirement
of 4% from Jul 19
• Proposed changes to APRA’s related entities framework4
– In Jul 18 APRA released a discussion paper proposing changes to the related entities framework (APS 222), with implementation from 1 Jan 20 plus any transition granted by APRA
– The impact of the final framework remains uncertain. At this stage, Macquarie does not anticipate the proposed changes will have a material impact on results, but may require some restructuring of business activities and legal entities within the Macquarie Group
• US tax reform– In the medium term, the impact to Macquarie will be determined by the proportional contribution of earnings from the US in relation to the
Group’s overall result– Based on past performance, Macquarie estimates a reduction of approximately 3-4% in the Group’s historical effective tax rate
• Macquarie notes recent press articles, in which Macquarie Bank Limited and a number of other financial institutions are mentioned in relation to a large-scale review by German authorities concerning dividend trading between 2006 and 2012. Macquarie has previously provided for these matters, and continues to assist the German authorities with their investigations
1. The Basel Capital Framework applies to the Bank Group only. 2. APRA’s information paper published Jul 17: ‘Strengthening banking system resilience – establishing unquestionably strong capital ratios’. 3. ‘APRA begins consultation with ADIs on revisions to capital framework’; 14 Feb 18. 4. ‘APRA proposes updates to related parties framework for ADIs’; 2 Jul 18.
For
per
sona
l use
onl
y
20
Capital management update
Macquarie | 25th CLSA Investors’ Forum | macquarie.com Overview of Macquarie Macquarie’s Operating Groups 1Q19 Update FY19 Outlook Appendices
• Share buyback
– No buying occurred during 1Q19. Macquarie’s share buyback program remains in place, with any share purchases subject to a number of factors including the Group’s capital surplus position, market conditions and opportunities to deploy capital by the businesses
• Macquarie Group Capital Notes 3 (MCN3)
– On 7 Jun 18, Macquarie announced that it had issued 10,000,000 MCN3 at an issue price of $A100 each, raising $A1b. The MCN3 offer facilitated the redemption of $A600m Macquarie Group Capital Notes (MCN) issued by Macquarie
For
per
sona
l use
onl
y
21
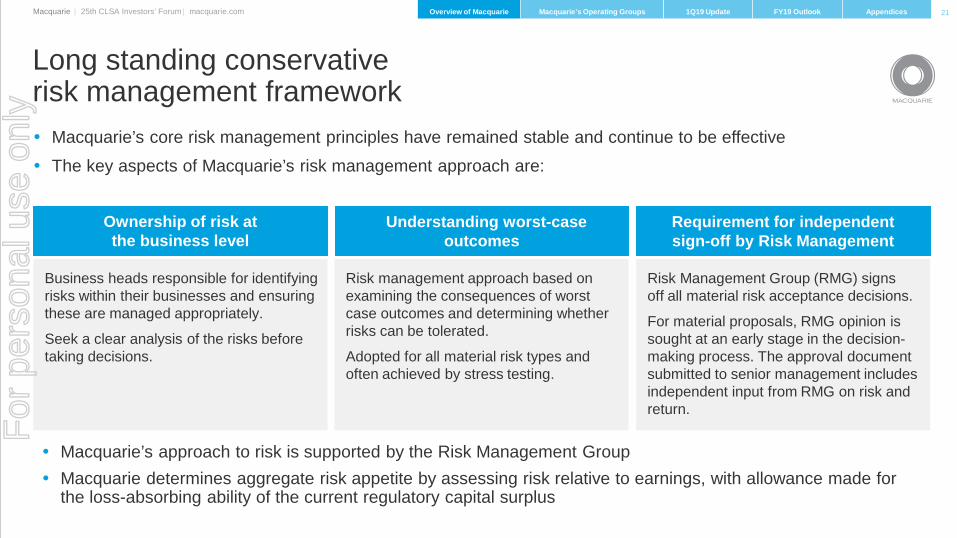
Macquarie’s core risk management principles have remained stable and continue to be effective
The key aspects of Macquarie’s risk management approach are:
Long standing conservative risk management framework
Macquarie’s approach to risk is supported by the Risk Management Group Macquarie determines aggregate risk appetite by assessing risk relative to earnings, with allowance made for
the loss-absorbing ability of the current regulatory capital surplus
Ownership of risk atthe business level
Understanding worst-case outcomes
Requirement for independentsign-off by Risk Management
Business heads responsible for identifying risks within their businesses and ensuring these are managed appropriately.
Seek a clear analysis of the risks before taking decisions.
Risk management approach based on examining the consequences of worst case outcomes and determining whether risks can be tolerated.
Adopted for all material risk types and often achieved by stress testing.
Risk Management Group (RMG) signs off all material risk acceptance decisions.
For material proposals, RMG opinion is sought at an early stage in the decision-making process. The approval document submitted to senior management includes independent input from RMG on risk and return.
Macquarie | 25th CLSA Investors’ Forum | macquarie.com Overview of Macquarie Macquarie’s Operating Groups 1Q19 Update FY19 Outlook Appendices
For
per
sona
l use
onl
y
MACQUARIE 2018
Macquarie’s Operating Groups02Macquarie | 25th CLSA Investors’ Forum | macquarie.com Overview of Macquarie Macquarie’s Operating Groups 1Q19 Update FY19 Outlook Appendices
For
per
sona
l use
onl
y
23
Macquarie overview
Macquarie | 25th CLSA Investors’ Forum | macquarie.com Overview of Macquarie Macquarie’s Operating Groups 1Q19 Update FY19 Outlook Appendices
Net profit contribution is management accounting profit before unallocated corporate costs, profit share and income tax. Pie chart is based on FY18 net profit contribution from operating groups. 1. As at 30 Jun 18. 2. Funds on platform includes Macquarie Wrap and Vision. 3. BFS deposits exclude corporate/wholesale deposits.
CGM18%
MacCap14%
BFS11%
CAF24%
MAM33%
Net profit contribution
Annuity-style businesses (~70%) Capital markets facing businesses (~30%)
Top 50 global asset manager with $A534.1b1
of assets under managementProvides clients with access to a diverse range of capabilities and products, including infrastructure, real assets, equities, fixed income, liquid alternatives and multi-asset investment management solutions
Global provider of specialist finance and asset management solutions, with a $A34.1b1 asset and loan portfolioAsset Finance has global expertise in aircraft, vehicles, technology, healthcare, manufacturing, industrial, energy, rail and mining equipmentPrincipal Finance provides flexible primary financing solutions and engages in secondary market investing, across the capital structure. It operates globally in both corporate and real estate sectors
Integrated, end-to-end offering across global markets including equities, fixed income, foreign exchange and commoditiesProvides clients with risk and capital solutions across physical and financial marketsDiverse platform covering more than 25 market segments, with more than 160 productsGrowing presence in commodities (natural gas, LNG, NGLs, power, oil, coal, base metals, iron ore, sugar and freight)Global institutional securities house with strong Asia-Pacific foundations covering sales, research, ECM, execution and derivatives and trading activities
Global capability across infrastructure, energy, real estate, telecommunications, media, technology, consumer, gaming and leisure, business services, resources, industrials and financial institutions in: M&A advisory; equity and debt capital markets; and balance sheet positionsInvests Macquarie’s balance sheet to develop and create assets, platforms and businesses in the infrastructure, energy and real estate sectors, and partnering primarily with financial sponsor clients to provide capital solutions, particularly in the technology sector
Macquarie Asset Management (MAM)
Corporate and Asset Finance (CAF)
Macquarie’s retail banking and financial services business with a $A42.4b1 Australian loan portfolio, funds on platform2 of $A86.8b1 and total BFS deposits3 of $A46.9b1
Provides a diverse range of personal banking, wealth management and business banking products and services to retail clients, advisers, brokers and business clients
Banking and Financial Services (BFS)
Commodities and Global Markets (CGM)
Macquarie Capital (MacCap)
For
per
sona
l use
onl
y
$A348.7 billionMIM investment funds1
building retirement savings of people all over the world
Top 50 global asset manager
$A534.1 billion
Macquarie Asset Management
1. Pie chart based on FY18 net profit contribution from operating groups.2. As at 30 June 2018.3. Based on AUM. Willis Towers Watson Global Alternatives Survey 2017 (published July 2017). 4. MIRA Credentials, 30 September 2017.5. PDI Annual Awards 2016.
130+ infrastructure and real assets used by ~100 million
No.1infrastructure manager globally3
$A178.5 billion
people every day4
European infrastructure debt manager of the year5
Infrastructure
Energy
Equities
Agriculture
Fixed income Real Estate
Multi-asset Specialist investments
Actively manages money for investors across multiple asset classes
Net profit contribution
$A1,685 million 10%on FY17
assets under management2
Macquarie | 25th CLSA Investors’ Forum | macquarie.com Overview of Macquarie Macquarie’s Operating Groups 1Q19 Update FY19 Outlook Appendices
AUM2
MIRA
$A102.1 billion EUM2
24
33%1
For
per
sona
l use
onl
y
PAGE 25
425
484 477 480 495
534
-
50
100
150
200
250
300
350
400
450
500
550
Mar 14 Mar 15 Mar 16 Mar 17 Mar 18 Jun 18
989
1,2621,372
1,569 1,574 1,608
-
200
400
600
800
1,000
1,200
1,400
1,600
1,800
FY13 FY14 FY15 FY16 FY17 FY18
755
1,051
1,450
1,6441,538
1,685
-
200
400
600
800
1,000
1,200
1,400
1,600
1,800
FY13 FY14 FY15 FY16 FY17 FY18
1. Pie chart is based on FY18 net profit contribution from operating groups. 2. Net profit contribution is management accounting profit before unallocated corporate costs, profit share and income tax.
Net Profit Contribution2 ($Am) Base Fees ($Am) AUM ($Ab)
Macquarie Asset ManagementGrowth in base fees
ANNUITY-STYLE BUSINESS
Macquarie | 25th CLSA Investors’ Forum | macquarie.com Overview of Macquarie Macquarie’s Operating Groups 1Q19 Update FY19 Outlook Appendices
33%
25
1
For
per
sona
l use
onl
y
PAGE 26
MIRA: Income includes more than base feesANNUITY-STYLE BUSINESS
Macquarie | 25th CLSA Investors’ Forum | macquarie.com Overview of Macquarie Macquarie’s Operating Groups 1Q19 Update FY19 Outlook Appendices
1. Pie chart is based on FY18 net profit contribution from operating groups. 2. Average base fees (%) calculated as base fees per financial year / average EUM (Invested). 3. Average performance fees and other income (%) calculated as performance fees and other income per financial year / period end EUM. 4. Other income represents net operating income less base and performance fees for each financial year and includes other income relating to certain MIRA fund assets historically included in the Corporate segment. Base fees and performance fees for real estate funds included from FY05 onwards.
1
30
60
36
52
6667
77
86
26
1
Average base fees (RHS)
MIRA base fees $Am (LHS)MIRA EUM at period end ($Ab)
$AmMIRA performance fees and other income $Am (LHS)
Average other income (RHS)
2
Average performance fees (RHS)3
3, 4
For
per
sona
l use
onl
y
$A34.1 billion
$A37 billioninvested across more than570 Principal Finance deals in 9 years3
Leading Australian vehicle financier600,000+
9 millionsmart meters in the UK by 2020
Leading global aircraft lessor196owned planes
cars
Corporate and Asset Finance
1. Pie chart based on FY18 net profit contribution from operating groups.2. As at 30 June 2018. Vehicles portfolio includes General Plant and Equipment.3. As at 31 March 2018.
Vehicles Aircraft Energy
Healthcare
Technology
Mining equipment
Multi-family Infrastructure
Finances the assets people use every day
asset and loan portfolio2
Net profit contribution
$A1,206 million 1%on FY17
$A16.4 billionVehicles portfolio2
$A8.2 billionAviation portfolio2
27
24%1
For
per
sona
l use
onl
y
PAGE 28
16.517.5
29.7 29.8 29.6
-
5
10
15
20
25
30
35
Mar 14 Mar 15 Mar 16 Mar 17 Mar 18 Jun 18
694
826
1,112 1,1301,198 1,206
-
200
400
600
800
1,000
1,200
1,400
FY13 FY14 FY15 FY16 FY17 FY18
1. Pie chart is based on FY18 net profit contribution from operating groups. 2. Net profit contribution is management accounting profit before unallocated corporate costs, profit share and income tax. 3. Includes Real Estate Structured Finance legacy run-off portfolio and equity portfolio.
Net Profit Contribution2 ($Am)
Corporate and Asset FinanceAsset and loan portfolios
ANNUITY-STYLE BUSINESS
Macquarie | 25th CLSA Investors’ Forum | macquarie.com Overview of Macquarie Macquarie’s Operating Groups 1Q19 Update FY19 Outlook Appendices
AWAS
ESANDA
29.9
Principal Finance Portfolio3 ($Ab)Asset Finance Portfolio ($Ab)
24%
9.0
11.2
9.5
6.8
4.7 4.5
-
2
4
6
8
10
12
Mar 14 Mar 15 Mar 16 Mar 17 Mar 18 Jun 18
28
1
For
per
sona
l use
onl
y
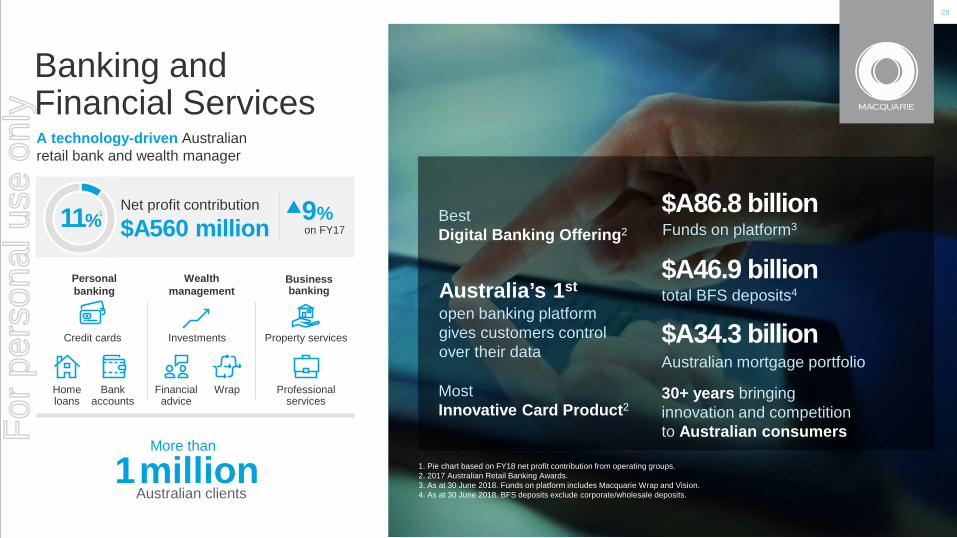
Most Innovative Card Product2
Best Digital Banking Offering2
$A34.3 billionAustralian mortgage portfolio
$A46.9 billiontotal BFS deposits4Australia’s 1st
open banking platform gives customers control over their data
30+ years bringing innovation and competition to Australian consumers
Banking and Financial Services
1. Pie chart based on FY18 net profit contribution from operating groups.2. 2017 Australian Retail Banking Awards.3. As at 30 June 2018. Funds on platform includes Macquarie Wrap and Vision. 4. As at 30 June 2018. BFS deposits exclude corporate/wholesale deposits.
1million Australian clients
More than
Home loans
Bank accounts
Credit cards Investments
Professional services
Property services
A technology-driven Australian retail bank and wealth manager
Financial advice
Wrap
Business banking
Personal banking
Wealth management
Net profit contribution
$A560 million9%on FY17
$A86.8 billionFunds on platform3
29
11%1
For
per
sona
l use
onl
y
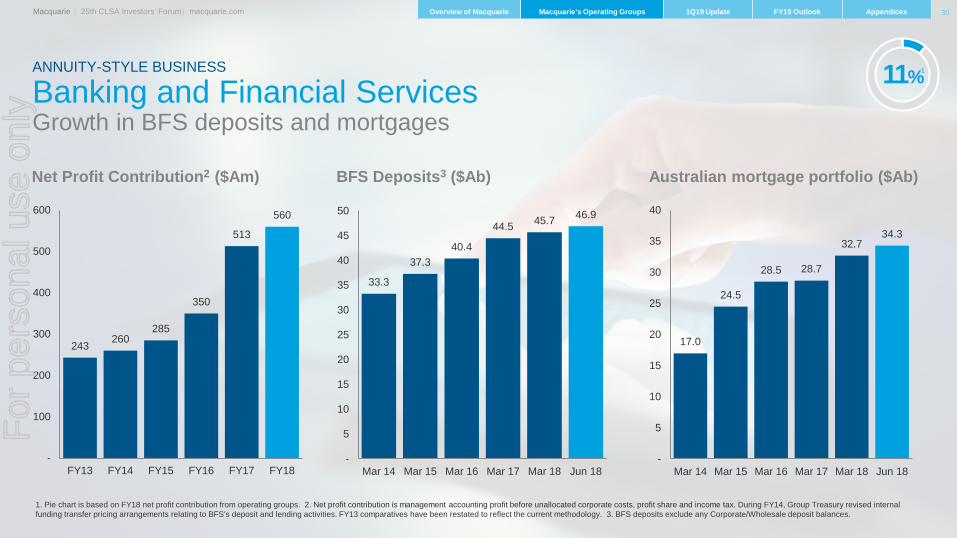
17.0
24.5
28.5 28.7
32.734.3
-
5
10
15
20
25
30
35
40
Mar 14 Mar 15 Mar 16 Mar 17 Mar 18 Jun 18
33.3
37.340.4
44.5 45.7 46.9
-
5
10
15
20
25
30
35
40
45
50
Mar 14 Mar 15 Mar 16 Mar 17 Mar 18 Jun 18
243 260285
350
513
560
-
100
200
300
400
500
600
FY13 FY14 FY15 FY16 FY17 FY18
1. Pie chart is based on FY18 net profit contribution from operating groups. 2. Net profit contribution is management accounting profit before unallocated corporate costs, profit share and income tax. During FY14, Group Treasury revised internal funding transfer pricing arrangements relating to BFS’s deposit and lending activities. FY13 comparatives have been restated to reflect the current methodology. 3. BFS deposits exclude any Corporate/Wholesale deposit balances.
Net Profit Contribution2 ($Am) BFS Deposits3 ($Ab) Australian mortgage portfolio ($Ab)
Banking and Financial Services Growth in BFS deposits and mortgages
ANNUITY-STYLE BUSINESS
Macquarie | 25th CLSA Investors’ Forum | macquarie.com Overview of Macquarie Macquarie’s Operating Groups 1Q19 Update FY19 Outlook Appendices
11%
30
1
For
per
sona
l use
onl
y
US physical gas marketer in North America2
Differentiated insights on
2,000+ stocks globally
DerivativesHouse of the Year3
Energy
Commodities and Global Markets
1. Pie chart based on FY18 net profit contribution from operating groups.2. Platts 1Q CY18.3. 2018 Energy Risk Awards.
No.2
50+50+ equity exchanges and liquidity venues
in metals, equities, futures and FX markets
30+years
in agricultural markets
20+years
in energy markets
15
Provides clients with access to markets, financing, hedging, research and market analysis, and physical execution
160+products in 25+ market segments
Market trading across
years
Net profit contribution
$A910 million 6%on FY17
31
18%1
Direct access
For
per
sona
l use
onl
y
PAGE 32
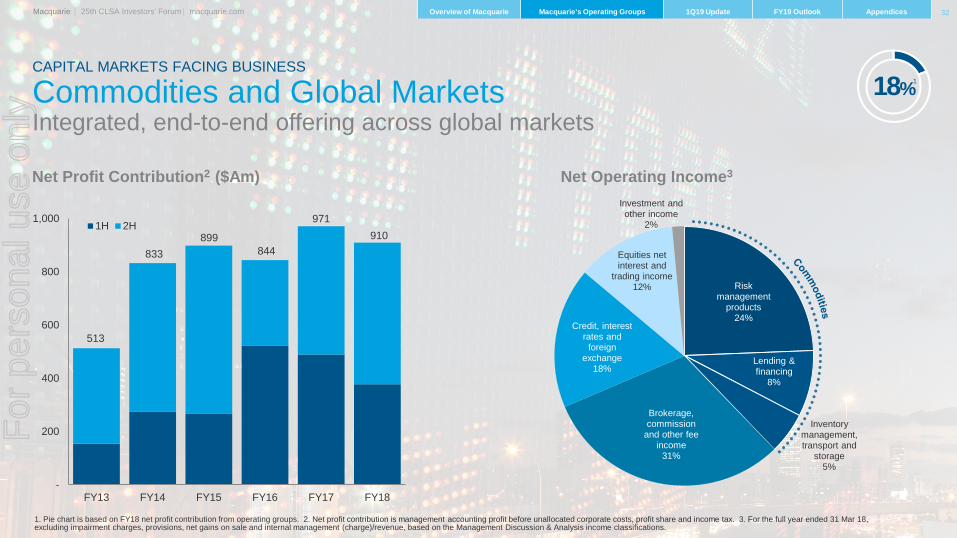
Risk management
products24%
Lending & financing
8%
Inventory management, transport and
storage5%
Brokerage, commission
and other fee income
31%
Credit, interest rates and
foreign exchange
18%
Equities net interest and
trading income12%
Investment and other income
2%
-
200
400
600
800
1,000
FY13 FY14 FY15 FY16 FY17 FY18
1H 2H
1. Pie chart is based on FY18 net profit contribution from operating groups. 2. Net profit contribution is management accounting profit before unallocated corporate costs, profit share and income tax. 3. For the full year ended 31 Mar 18, excluding impairment charges, provisions, net gains on sale and internal management (charge)/revenue, based on the Management Discussion & Analysis income classifications.
513
833899
844
971
Net Profit Contribution2 ($Am) Net Operating Income3
Commodities and Global Markets Integrated, end-to-end offering across global markets
CAPITAL MARKETS FACING BUSINESS
910
Macquarie | 25th CLSA Investors’ Forum | macquarie.com Overview of Macquarie Macquarie’s Operating Groups 1Q19 Update FY19 Outlook Appendices
18%
32
1
For
per
sona
l use
onl
y
No.1 completed M&A deals, IPOs in Australia6
No.1 global infrastructure financial adviser3
No.1 renewablesfinancial adviser4
Global Best Investment Bank in Infrastructure5
1. Pie chart based on FY18 net profit contribution from operating groups.2. Source: Dealogic and IJGlobal for Macquarie Group completed M&A, balance sheet positions, ECM and DCM transactions, converted at 31 Mar FX rate. Deal values reflect the full transaction value and not an attributed value.3. Inframation CY17 (by value). 4. Bloomberg CY17. 5. Global Finance Awards (2018). 6. Dealogic FY18 (by value).7. Inframation CY17 (by value). 8. PPP Awards, Asia Pacific (2017).
in green energy infrastructure
of the year (GOLD)8Financial adviser
Global leader
Macquarie Capital
$A352 billion
Real estateInfrastructureand utilities
Energy
ResourcesTelecommunications, media and entertainment
Financial institutions
Industrials
Technology
Advises and invests alongside clients and partners to realise opportunity
completed deals in FY182
Net profit contribution
$A700 million 45%on FY17
33
No.2 US Tech LBO bookrunner7
14%1
For
per
sona
l use
onl
y
PAGE 34
-
100
200
300
400
500
600
700
800
FY13 FY14 FY15 FY16 FY17 FY18
1H 2H
1. Pie chart is based on FY18 net profit contribution from operating groups. 2. Net profit contribution is management accounting profit before unallocated corporate costs, profit share and income tax. 3. Income by region reflects FY18 net operating income excluding internal management revenue/(charge).
483
150
280
430 451
Net Profit Contribution2 ($Am)
Macquarie CapitalGlobally diversified with a core strength in real assets
CAPITAL MARKETS FACING BUSINESS
700
Macquarie | 25th CLSA Investors’ Forum | macquarie.com Overview of Macquarie Macquarie’s Operating Groups 1Q19 Update FY19 Outlook Appendices
14%
Income by region3
34
1
For
per
sona
l use
onl
y
MACQUARIE 2018
1Q19 Update03Macquarie | 25th CLSA Investors’ Forum | macquarie.com Overview of Macquarie Macquarie’s Operating Groups 1Q19 Update FY19 Outlook Appendices
For
per
sona
l use
onl
y
36Macquarie | 25th CLSA Investors’ Forum | macquarie.com Overview of Macquarie Macquarie’s Operating Groups 1Q19 Update FY19 Outlook Appendices
• Operating groups performing well, in line with expectations
• 1Q19 operating group contribution1 up on pcp and down on a strong prior quarter
• No significant one-off items
1Q19 Macquarie update
1. Represents management accounting profit before unallocated corporate costs, profit share, income tax and period end reviews. 2. Annuity-style businesses consists of Macquarie Asset Management, Corporate and Asset Finance, and Banking and Financial Services. Capital markets facing businesses consists of Commodities and Global Markets and Macquarie Capital.
1Q19 contribution1 vs 1Q18
Annuity-style businesses2
Continued to perform well:• Continued strong base and performance fees in MAM• CAF Principal Finance down on pcp; mainly due to the timing of transactions and a reduction in the size
of the portfolio. CAF Asset Finance broadly in line with pcp• Continued growth in mortgages, business banking and platforms in BFS. Deposits broadly in line with pcp
Capital markets facing businesses2
Experienced strong trading conditions across most markets:• Stronger activity in CGM, particularly in commodity markets and fixed income products• MacCap balance sheet positions performing in line with expectations; solid realisations during the quarter;
fee revenue from DCM down on a strong pcpFor
per
sona
l use
onl
y
37
Annuity-style businesses1Q19 Update
1. Based on FY18 net profit contribution from operating groups. Net profit contribution is management accounting profit before unallocated corporate costs, profit share and income tax. 2. Funds on platform includes Macquarie Wrap and Vision. 3. BFS deposits excludes corporate/wholesale deposits.
FY18 contribution1 Activity during the quarter
MacquarieAsset Management 33%
• AUM of $A534.1b, up 8% on Mar 18, largely due to reaching financial close on previously announced GLL Real Estate Partners and ValueInvest transactions, infrastructure asset acquisitions, and favourable market and FX movements, partially offset by infrastructure asset realisations- MIRA EUM of $A102.1b, up 18% on Mar 18
• Performance fees from several funds including Atlas Arteria (formerly Macquarie Atlas Roads)• MIRA raised equity of $A5.6b primarily from its Macquarie SuperCore Infrastructure Fund and MEIF5 co-investment, and invested
equity of $A4.8b • MIM awarded $A2.9b in new institutional mandates and contributions funded across 36 strategies from clients in 11 countries• MSIS awarded over $A1b of additional infrastructure debt mandates
Corporate and Asset Finance
24%
• Asset and Principal Finance portfolio of $A34.1b, broadly in line with Mar 18• Asset Finance originations in line with expectations• Notable Principal Finance transactions included funding the first installation in the 30MWp onsite PPA solar PV roll out for the UK’s
largest licensed water and sewerage undertaker, and providing financing to the UK’s largest provider of construction waste management services
Banking and Financial Services
11%
• Australian mortgage portfolio of $A34.3b, up 5% on Mar 18• Funds on platform2 of $A86.8b, up 5% on Mar 18• Business banking loan portfolio of $A7.5b, up 3% on Mar 18• Total BFS deposits3 of $A46.9b, up 3% on Mar 18• Awarded Best Cash and Term Deposit Provider at the 2018 SMSF Awards and named as a winner in the 2018 Mozo Experts Choice
Awards in the Travel Money/International Money Transfer category
Macquarie | 25th CLSA Investors’ Forum | macquarie.com Overview of Macquarie Macquarie’s Operating Groups 1Q19 Update FY19 Outlook Appendices
For
per
sona
l use
onl
y
38
Capital markets facing businesses1Q19 Update
1. Based on FY18 net profit contribution from operating groups. Net profit contribution is management accounting profit before unallocated corporate costs, profit share and income tax. 2. Platts 1Q CY18 3. Source: Dealogic and IJ Global for Macquarie Group completed M&A, balance sheet positions, ECM and DCM transactions, converted at 30 Jun FX rate. Deal values reflect the full transaction value and not attributed value. 4. Dealogic, Apr – Jun 18 (by value and volume). 5. Dealogic, Apr – Jun 18 (by value) 6. Inframation, 1H CY18 (by deal count) 7. IJ Global, 1H CY18 (by deal count).
FY18contribution1 Activity during the quarter
Commodities and Global Markets
18%
• Increased client hedging and trading opportunities across the commodities platform, particularly in North American Gas• Continued strong customer activity in foreign exchange and futures • Strong underwriting income from Cash Equities, particularly in Asia• Maintained ranking as No. 2 US physical gas marketer in North America2
Macquarie Capital 14%
• 115 deals completed to the value of $A160b, up on pcp (by value) and up on the prior period (by value and volume)3
• Fee revenue from ECM and M&A broadly in line with pcp. Fee revenue from DCM down on a strong pcp• Balance sheet positions performing in line with expectations with continued realisations during the quarter • Ongoing expansion of Green Investment Group (GIG) – completed official launch of GIG in North America and Asia • No.1 for completed M&A deals4 and ECM deals5 in ANZ• No.1 for global renewables financial advisory6 and global financial advisory in Infrastructure Finance7
Macquarie | 25th CLSA Investors’ Forum | macquarie.com Overview of Macquarie Macquarie’s Operating Groups 1Q19 Update FY19 Outlook Appendices
For
per
sona
l use
onl
y
MACQUARIE 2018
FY19 Outlook04Macquarie | 25th CLSA Investors’ Forum | macquarie.com Overview of Macquarie Macquarie’s Operating Groups 1Q19 Update FY19 Outlook Appendices
For
per
sona
l use
onl
y
40
CGM
MacCap
BFS
CAF
MAM
Net profit contribution
Factors impacting short-term outlookAnnuity-style businesses Capital markets facing businesses
FY18: $A1.7b up 10% on FY17Base fees expected to be up, benefiting from recent acquisitionsPerformance fees and investment-related income (net of impairments) expected to be down
FY18: $A1.2b up 1% on FY17Leasing book broadly in lineReduced loan volumes in Principal FinanceTiming and level of early prepayments and realisations in Principal Finance
FY18: $A0.9b down 6% on FY17Strong customer base expected to drive consistent flow across Commodities, Fixed Income and FuturesImproved result in equitiesReduced impact from timing of revenue recognition driven by accounting volatility
FY18: $A0.7b up 45% on FY17Assume market conditions broadly consistent with 2H18Solid pipeline of realisations expected
Macquarie Asset Management (MAM)
Corporate and Asset Finance (CAF)
FY18: $A0.6b up 9% on FY17Higher loan portfolio, deposit and platform volumesNIM pressure due to higher costs
Banking and Financial Services (BFS)
Commodities and Global Markets (CGM)
Macquarie Capital (MacCap)
Net profit contribution is management accounting profit before unallocated corporate costs, profit share and income tax. Pie chart is based on FY18 net profit contribution from operating groups.
Corporate
Compensation ratio to be consistent with historical levelsBased on present mix of income, along with the favourable impacts of US tax reform, the FY19 effective tax rate is expected to be down on FY18
Macquarie | 25th CLSA Investors’ Forum | macquarie.com Overview of Macquarie Macquarie’s Operating Groups 1Q19 Update FY19 Outlook Appendices
For
per
sona
l use
onl
y
41
Short-term outlook• The Group’s result for FY19 is currently expected to be broadly in line with FY18
– 1H19 result is expected to be broadly in line with the 1H18 result, which included strong performance fees in MAM
• Our short-term outlook remains subject to:
– The conduct of period end reviews and the completion rate of transactions. We note that the sale of Quadrant Energy has not been included in our current outlook
– Market conditions
– The impact of foreign exchange
– Potential regulatory changes and tax uncertainties
– Geographic composition of income
Macquarie | 25th CLSA Investors’ Forum | macquarie.com Overview of Macquarie Macquarie’s Operating Groups 1Q19 Update FY19 Outlook Appendices
For
per
sona
l use
onl
y
42
Medium-term• Macquarie remains well positioned to deliver superior performance in the medium-term
• Deep expertise in major markets
• Build on our strength in diversity and continue to adapt our portfolio mix to changing market conditions
– Annuity-style income is provided by three significant businesses which are delivering superior returns following years of investment and acquisitions
– Macquarie Asset Management, Corporate and Asset Finance and Banking and Financial Services
– Two capital markets facing businesses well positioned to benefit from improvements in market conditions with strong platforms and franchise positions
– Commodities and Global Markets and Macquarie Capital
• Ongoing benefits of continued cost initiatives
• Strong and conservative balance sheet
– Well matched funding profile with minimal reliance on short-term wholesale funding
– Surplus funding and capital available to support growth
• Proven risk management framework and culture
Macquarie | 25th CLSA Investors’ Forum | macquarie.com Overview of Macquarie Macquarie’s Operating Groups 1Q19 Update FY19 Outlook Appendices
For
per
sona
l use
onl
y
43
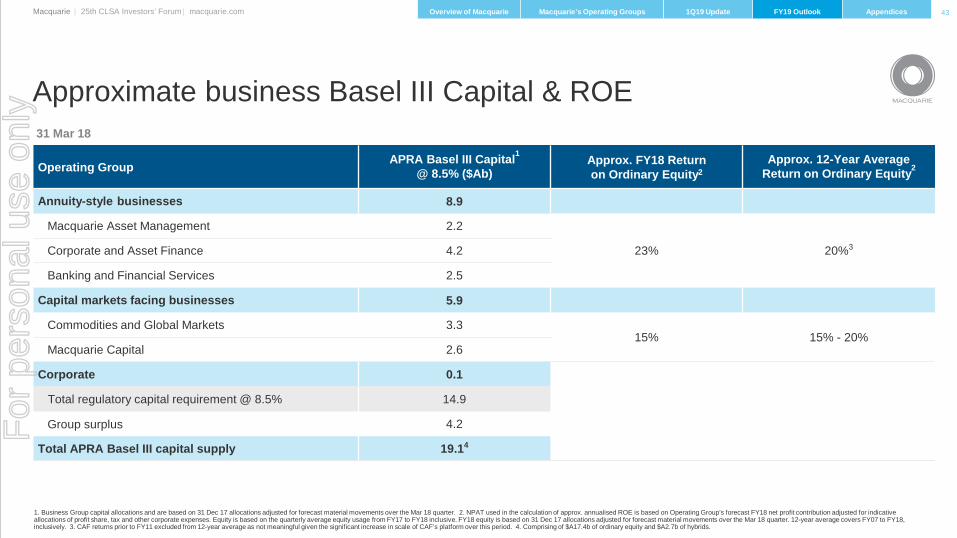
Approximate business Basel III Capital & ROE
1. Business Group capital allocations and are based on 31 Dec 17 allocations adjusted for forecast material movements over the Mar 18 quarter. 2. NPAT used in the calculation of approx. annualised ROE is based on Operating Group’s forecast FY18 net profit contribution adjusted for indicative allocations of profit share, tax and other corporate expenses. Equity is based on the quarterly average equity usage from FY17 to FY18 inclusive. FY18 equity is based on 31 Dec 17 allocations adjusted for forecast material movements over the Mar 18 quarter. 12-year average covers FY07 to FY18, inclusively. 3. CAF returns prior to FY11 excluded from 12-year average as not meaningful given the significant increase in scale of CAF’s platform over this period. 4. Comprising of $A17.4b of ordinary equity and $A2.7b of hybrids.
31 Mar 18
Operating Group APRA Basel III Capital1
@ 8.5% ($Ab)Approx. FY18 Return on Ordinary Equity2
Approx. 12-Year AverageReturn on Ordinary Equity2
Annuity-style businesses 8.9
Macquarie Asset Management 2.2
23% 20%3Corporate and Asset Finance 4.2
Banking and Financial Services 2.5
Capital markets facing businesses 5.9
Commodities and Global Markets 3.315% 15% - 20%
Macquarie Capital 2.6
Corporate 0.1
Total regulatory capital requirement @ 8.5% 14.9
Group surplus 4.2
Total APRA Basel III capital supply 19.14
Macquarie | 25th CLSA Investors’ Forum | macquarie.com Overview of Macquarie Macquarie’s Operating Groups 1Q19 Update FY19 Outlook Appendices
For
per
sona
l use
onl
y
44
CGM
MacCap
BFS
CAF
MAM
Medium-termAnnuity-style businesses Capital markets facing businesses
Annuity-style business that is diversified across regions, products, asset classes and investor typesDiversification of capabilities allows for the business to be well placed to grow assets under management in different market conditionsWell positioned for organic growth with several strongly performing products and an efficient operating platform
Leverage deep industry expertise to maximise growth potential in asset and loan portfolioPositioned for further asset acquisitions and realisations, subject to market conditions Availability of funding from asset securitisation throughout the cycle
Opportunities to grow commodities business, both organically and through acquisition Development of institutional coverage for specialised credit, rates and foreign exchange productsIncrease financing activitiesGrowing the client base across all regionsLeveraging a strong market position in Asia-Pacific through investment in the equities platform and further integration of the business across CGM
Positioned to benefit from any improvement in M&A and capital markets activityContinues to tailor the business offering to current opportunities, market conditions and strengths in each region and sector
Macquarie Asset Management (MAM)
Corporate and Asset Finance (CAF)
Strong growth opportunities through intermediary and direct retail client distribution, white labelling, platformsand client serviceOpportunities to increase financial services engagement with existing business banking clients and extend into adjacent segmentsModernising technology to improve client experience and support growth
Banking and Financial Services (BFS)
Commodities and Global Markets (CGM)
Macquarie Capital (MacCap)
Macquarie | 25th CLSA Investors’ Forum | macquarie.com Overview of Macquarie Macquarie’s Operating Groups 1Q19 Update FY19 Outlook Appendices
For
per
sona
l use
onl
y
MACQUARIE 2018
Select slides from result announcement for the full year ended 31 March 2018
A APPENDIX
Macquarie | 25th CLSA Investors’ Forum | macquarie.com Overview of Macquarie Macquarie’s Operating Groups 1Q19 Update FY19 Outlook Appendices
For
per
sona
l use
onl
y
46
2H18 $Am
1H18 $Am
FY18 $Am
FY17 $Am
Net interest and trading income 2,051 1,892 3,943 3,943
Fee and commission income 2,102 2,568 4,670 4,331
Net operating lease income 466 469 935 921
Share of net profits of associates and joint ventures 138 103 241 51
Brokerage, commission and trading-related expenses (408) (422) (830) (852)
Other operating expenses (1,123) (1,010) (2,133) (2,029)
Total operating expenses (3,763) (3,693) (7,456) (7,260)
Operating profit before tax and non-controlling interests 1,760 1,704 3,464 3,104
Income tax expense (435) (448) (883) (868)
Non-controlling interests (16) (8) (24) (19)
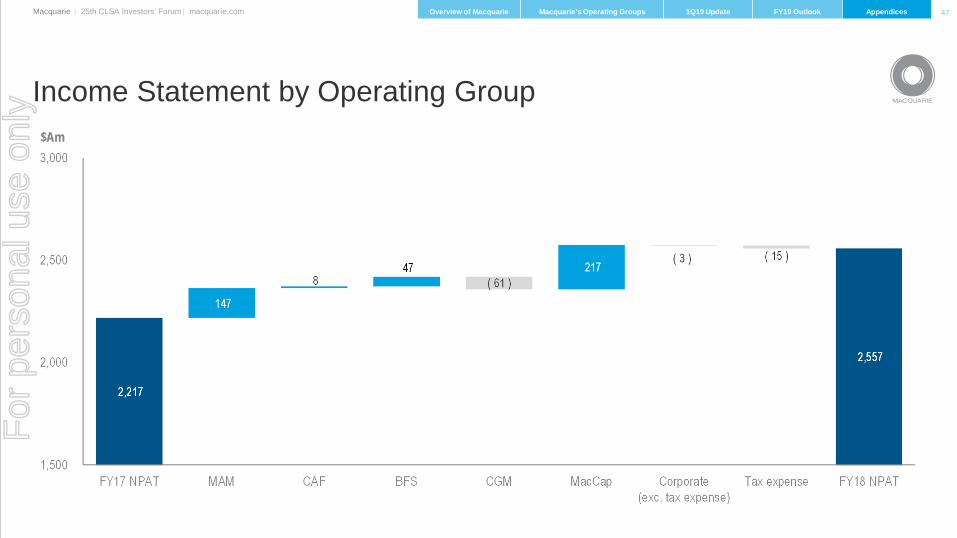
Profit attributable to MGL shareholders 1,309 1,248 2,557 2,217
• Net interest and trading income of $A3,943m was in line with FY17 reflecting: – 6% growth in average Australian loan portfolio volumes and a 7% growth in average BFS deposits– lower costs of holding long-term liquidity in CorporateOffset by:– reduction in the Principal Finance portfolio in CAF – sustained low volatility and tighter credit spreads in interest rate and credit products in CGM – higher funding costs on balance sheet positions in MacCap reflecting increased activity, including the
acquisition of Green Investment Group (GIG)– impact of the Australian Government Major Bank Levy
• Fee and commission income of $A4,670m, up 8% on FY17 largely driven by an increase in performance fee income from MIRA managed funds and assets outperforming their respective benchmarks in MAM
• Net operating lease income of $A935m, up 2% on FY17 benefited from improved underlying income from the Aviation, Energy and Technology portfolios in CAF
• Share of net profits of associates of $A241m increased mainly due to MAM’s share of net profits from the sale of a number of underlying assets within equity accounted investments
• Lower impairments and provisions charge across most Operating Groups due to improved credit conditions, partially offset by the write-down of the investment in MIC
• Other income of $A1,497m reduced 4% on FY17 driven by higher gains on asset realisations particularly in green energy, conventional energy and infrastructure in MacCap and gains from CAF’s Principal Finance investments in the US and Europe, partially offset by the non-recurrence of net gains in FY17 including the sale of Macquarie Life’s risk insurance business and the US mortgages portfolio in BFS
• Employment expenses of $A4,493m, up 3% on FY17 driven by higher performance-related profit share expense, driven by the improved overall performance of the Operating Groups and higher average headcount from acquisitions, partially offset by favourable FX movements
• Other operating expenses of $A2,133m, up 5% on FY17 mainly due to transaction and integration costs from acquisitions and increased business activity
• Income tax expense of $A883m, up 2% on FY17 reflects higher profit before tax, offset in part by increased benefit from permanent tax differences. The reduced effective tax rate of 25.7% reflects the change in geographic composition and nature of earnings
Income Statement key drivers
Macquarie | 25th CLSA Investors’ Forum | macquarie.com Overview of Macquarie Macquarie’s Operating Groups 1Q19 Update FY19 Outlook Appendices
For
per
sona
l use
onl
y
47
Income Statement by Operating Group$Am
Macquarie | 25th CLSA Investors’ Forum | macquarie.com Overview of Macquarie Macquarie’s Operating Groups 1Q19 Update FY19 Outlook Appendices
For
per
sona
l use
onl
y
48
KEY DRIVERS
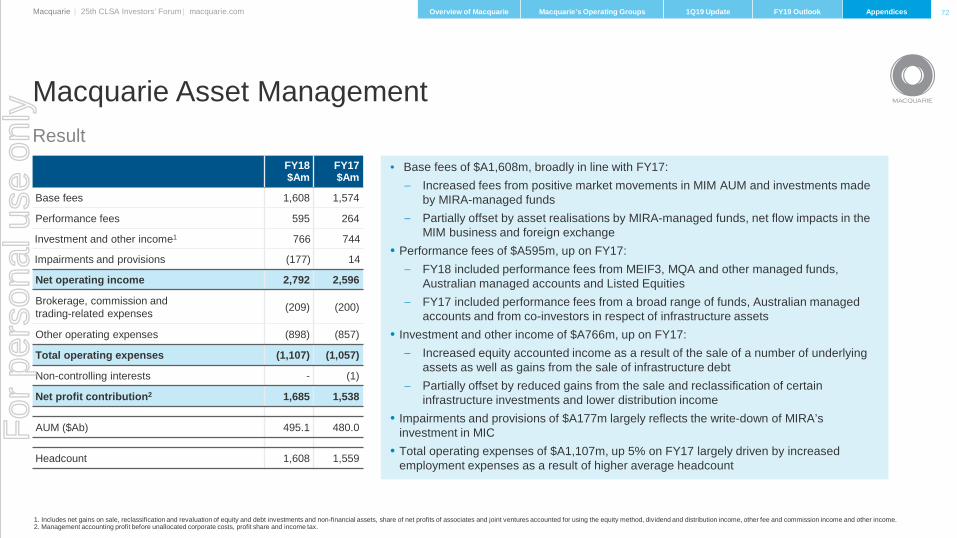
• Higher performance fees with FY18 benefiting from MEIF3, MQA and other managed funds, Australian managed accountsand Listed Equities
• Underlying base fees up:
– Increased fees from positive market movements in MIM AUM and investments made by MIRA-managed funds
– Partially offset by asset realisations by MIRA-managed funds and net flow impacts in the MIM business
• Investment-related income which includes gains from sale and reclassification of certain infrastructure investments and equity accounted income, was broadly in line with a strong FY17
• Increase in impairments largely reflects the write-down of MIRA’s investment in MIC
• Other largely relates to increased employment expenses driven by higher average headcount, increased funding costs and lower other fee income in MSIS closed-end funds
Macquarie Asset ManagementStrong result: FY18 benefiting from strong base and performance fees and investment-related income, partially offset by higher impairments
1. Represents movement in net gains on sale and reclassification of debt and equity investments and non-financial assets, share of net profits of associates and joint ventures accounted for using equity method, and dividend distribution income.
( - ) ( - )( 191 )
( 56 )
1,538
331
34 29 -
1,685
-
500
1,000
1,500
2,000
2,500
FY17 NPC Performancefees
Basefees
Investment-relatedincome
Impairments and provisions
Other FY18 NPC
$Am
1
Underlyingbase fees
FX impact onbase fees
(22)
34
56
Macquarie | 25th CLSA Investors’ Forum | macquarie.com Overview of Macquarie Macquarie’s Operating Groups 1Q19 Update FY19 Outlook Appendices
For
per
sona
l use
onl
y
49
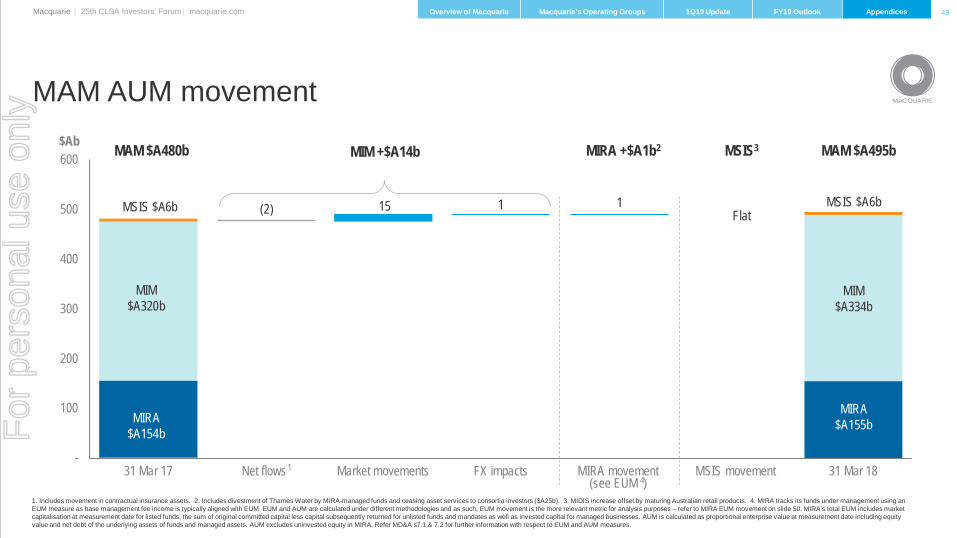
MAM AUM movement
1. Includes movement in contractual insurance assets. 2. Includes divestment of Thames Water by MIRA-managed funds and ceasing asset services to consortia investors ($A25b). 3. MIDIS increase offset by maturing Australian retail products. 4. MIRA tracks its funds under management using an EUM measure as base management fee income is typically aligned with EUM. EUM and AUM are calculated under different methodologies and as such, EUM movement is the more relevant metric for analysis purposes – refer to MIRA EUM movement on slide 50. MIRA’s total EUM includes market capitalisation at measurement date for listed funds, the sum of original committed capital less capital subsequently returned for unlisted funds and mandates as well as invested capital for managed businesses. AUM is calculated as proportional enterprise value at measurement date including equity value and net debt of the underlying assets of funds and managed assets. AUM excludes uninvested equity in MIRA. Refer MD&A s7.1 & 7.2 for further information with respect to EUM and AUM measures.
(2) 15 1 1
-
100
200
300
400
500
600
31 Mar 17 Net flows Market movements FX impacts MIRA movement(see EUM )
MSIS movement 31 Mar 18
MIRA$A154b
MIM$A320b
MSIS $A6b
MIRA$A155b
MIM$A334b
MSIS $A6b
MIRA +$A1b2 MSIS3 MAM $A495bMAM $A480b MIM +$A14b
Flat
$Ab
14
Macquarie | 25th CLSA Investors’ Forum | macquarie.com Overview of Macquarie Macquarie’s Operating Groups 1Q19 Update FY19 Outlook Appendices
For
per
sona
l use
onl
y
50
MIRA EUM movement
1. Committed capital returned by unlisted funds or under mandates due to asset divestments, redemption or other capital distributions as well as capital no longer managed due to sale of management rights or expiry of asset management agreements. 2. FX reflects the movement in EUM driven by changes in FX rates. EUM is calculated using capital commitments translated at period end FX rates. Spot FX rates are used for capital raised and returned and average FX rates are used for security price movements.
77.286.2
(4.2)
(9.3)15.5
2.2
4.8
-
20
40
60
80
100
31 Mar 17 Capital raised Acquisition of GIG Listed security price movements
Committed capital returned or no longer
managed¹
FX² 31 Mar 18
$Ab
Macquarie | 25th CLSA Investors’ Forum | macquarie.com Overview of Macquarie Macquarie’s Operating Groups 1Q19 Update FY19 Outlook Appendices
For
per
sona
l use
onl
y
51
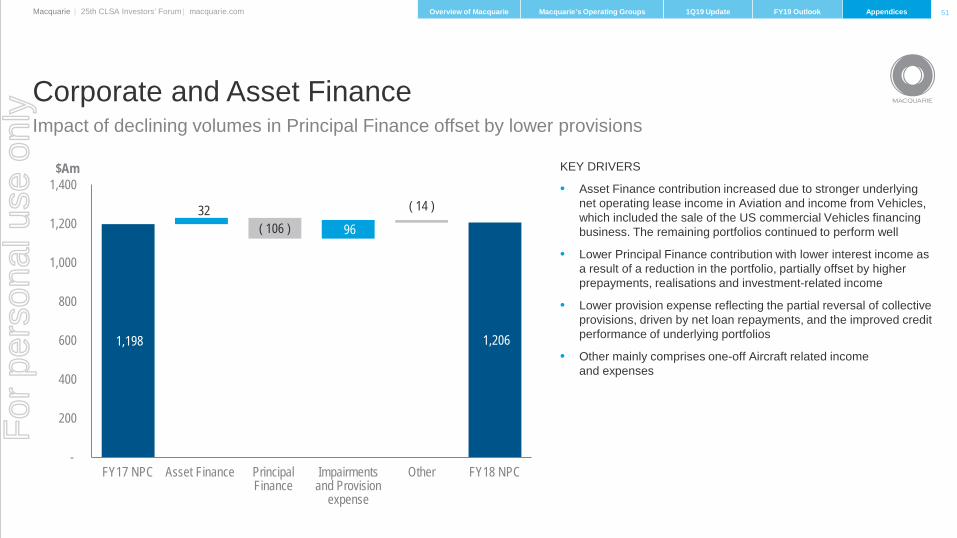
KEY DRIVERS
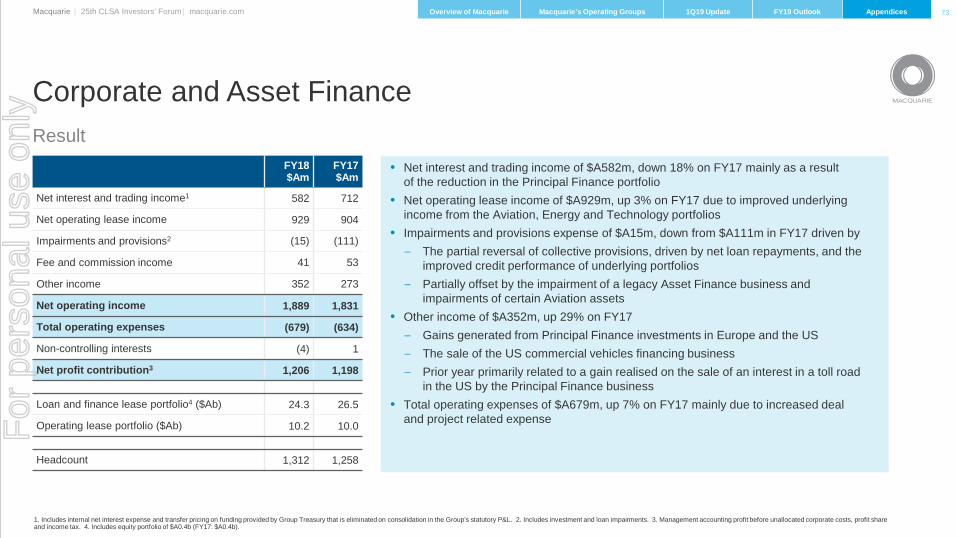
• Asset Finance contribution increased due to stronger underlying net operating lease income in Aviation and income from Vehicles, which included the sale of the US commercial Vehicles financing business. The remaining portfolios continued to perform well
• Lower Principal Finance contribution with lower interest income as a result of a reduction in the portfolio, partially offset by higher prepayments, realisations and investment-related income
• Lower provision expense reflecting the partial reversal of collective provisions, driven by net loan repayments, and the improved credit performance of underlying portfolios
• Other mainly comprises one-off Aircraft related incomeand expenses
Corporate and Asset FinanceImpact of declining volumes in Principal Finance offset by lower provisions
$Am
( 106 )( 14 )
1,198
32 96
1,206
-
200
400
600
800
1,000
1,200
1,400
FY17 NPC Asset Finance Principal Finance
Impairments and Provision
expense
Other FY18 NPC
Macquarie | 25th CLSA Investors’ Forum | macquarie.com Overview of Macquarie Macquarie’s Operating Groups 1Q19 Update FY19 Outlook Appendices
For
per
sona
l use
onl
y
52
Asset Finance movement in the portfolio Corporate and Asset Finance
$Ab
Macquarie | 25th CLSA Investors’ Forum | macquarie.com Overview of Macquarie Macquarie’s Operating Groups 1Q19 Update FY19 Outlook Appendices
For
per
sona
l use
onl
y
53
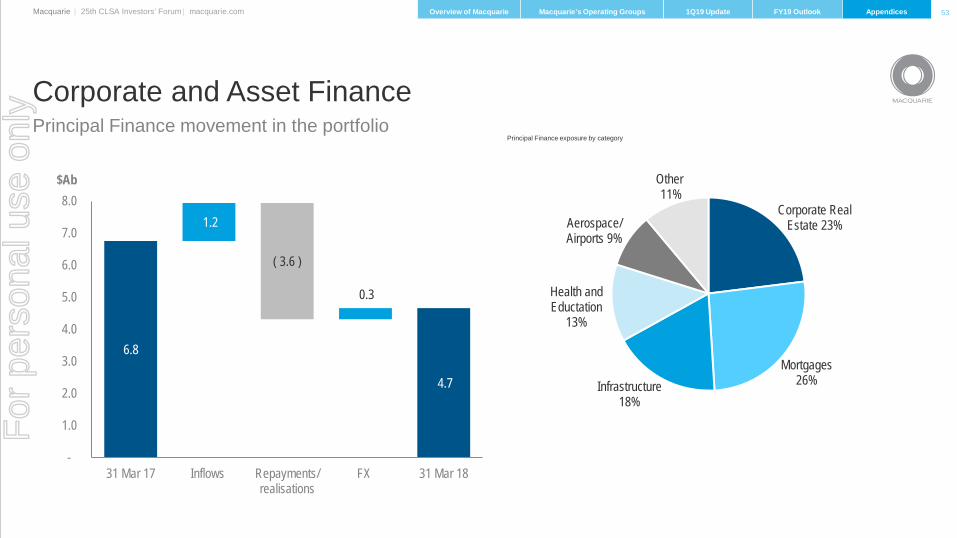
Principal Finance exposure by category
Corporate and Asset FinancePrincipal Finance movement in the portfolio
Corporate Real Estate 23%
Mortgages 26%Infrastructure
18%
Health and Eductation
13%
Aerospace/ Airports 9%
Other 11%
4.7
( 3.6 )
6.8
1.2
0.3
-
1.0
2.0
3.0
4.0
5.0
6.0
7.0
8.0
31 Mar 17 Inflows Repayments/realisations
FX 31 Mar 18
$Ab
Macquarie | 25th CLSA Investors’ Forum | macquarie.com Overview of Macquarie Macquarie’s Operating Groups 1Q19 Update FY19 Outlook Appendices
For
per
sona
l use
onl
y
54
KEY DRIVERS• FY17 sale of businesses and non-recurring items includes net
overall gain on the disposal of Macquarie Life’s risk insurance business to Zurich Australia Limited and the US mortgages portfolio, partially offset by expenses in relation to the Core Banking platform and impairment charges on certain equity positions and intangible assets
• Lower credit provisions with FY17 experiencing higher business lending provisions on a small number of loans
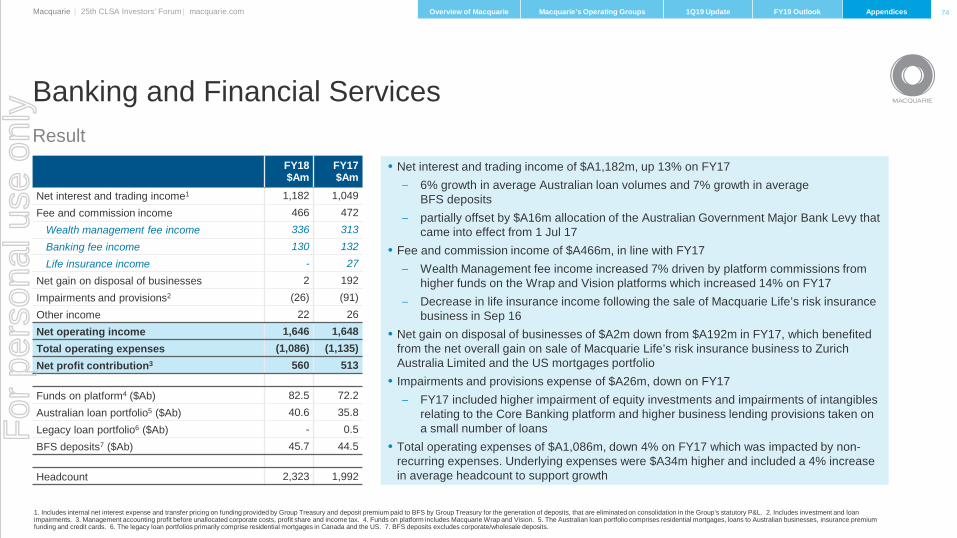
• Higher Personal Banking income driven by a 6% increase in average mortgage volumes
• Higher Business Banking income driven by a 7% increase in average business lending volumes, 12% increase in average business deposit volumes
• Higher Wealth Management income driven by a 19% increase in average Funds on platform reflecting ANZ and Vision migrations, net positive client inflows and market movements
• Higher underlying expenses included a 4% increase in average headcount to support growth
Banking and Financial ServicesStronger volumes offsetting impact of FY17 sale of businesses and non-recurring items
( 51 )
( 16 )
( 34 )
513
-
-20
45
51
32
-
560
-
100
200
300
400
500
600
700
FY17 NPC FY17 sale ofbusinesses
and non-recurringitems
BankLevy
Creditprovision
PersonalBankingincome
BusinessBankingincome
WealthManagement
income
Underlyingexpenses
FY18 NPC
$AmBusiness growth
+25%
Macquarie | 25th CLSA Investors’ Forum | macquarie.com Overview of Macquarie Macquarie’s Operating Groups 1Q19 Update FY19 Outlook Appendices
For
per
sona
l use
onl
y
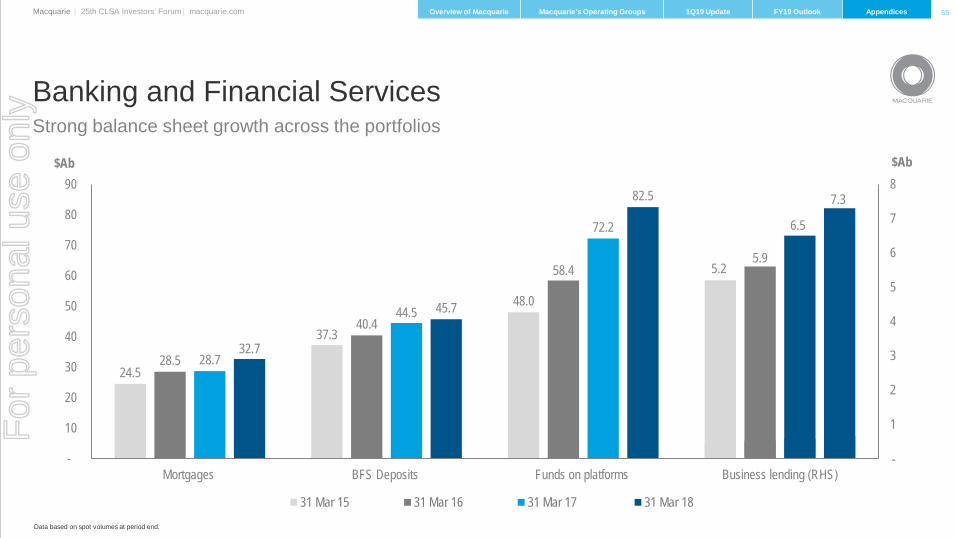
55
Strong balance sheet growth across the portfoliosBanking and Financial Services
Data based on spot volumes at period end.
24.5
37.3
48.0
5.2
28.5
40.4
58.45.9
28.7
44.5
72.2 6.5
32.7
45.7
82.5 7.3
0
1
2
3
4
5
6
7
8
-
10
20
30
40
50
60
70
80
90
Mortgages BFS Deposits Funds on platforms Business lending (RHS)
31 Mar 15 31 Mar 16 31 Mar 17 31 Mar 18
$Ab $Ab
-
Macquarie | 25th CLSA Investors’ Forum | macquarie.com Overview of Macquarie Macquarie’s Operating Groups 1Q19 Update FY19 Outlook Appendices
For
per
sona
l use
onl
y
56
1. Investment-related income includes gain on sale of equity and debt investments and share of net profits of associates and joint ventures using the equity method. 2. In FY17, the timing of income recognition relating to tolling agreements and capacity contracts resulted in a net recognition of $A7m.
KEY DRIVERS• Lower impairments with FY17 impacted by write-downs of certain underperforming
commodity-related loans• Lower investment-related income with FY17 benefiting from gains on sale of a
number of investments, mainly in energy and related sectors• Net interest and trading income (net of associated expenses)
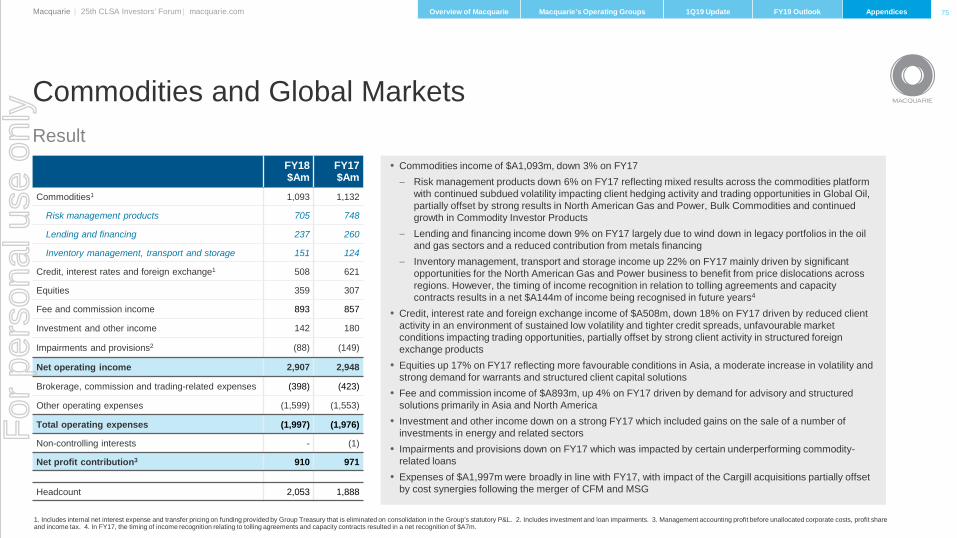
– Commodities – Lower risk management products reflecting mixed results across the
commodities platform with continued subdued volatility impacting client hedging activity and trading opportunities in Global Oil, partially offset by strong activity in North American Gas and Power, Bulk Commodities and continued growth in Commodity Investor Products
– Lower lending and finance income largely due to a reduction in legacy portfolios in the oil and gas sectors and a reduced contribution from metals financing
– Higher inventory management, transport and storage income mainly driven by significant opportunities for the North American Gas and Power business to benefit from price dislocations across regions. However, the timing of income recognition in relation to tolling agreements and capacity contracts results in a net $A144m of income being recognised in future years2
– Lower interest rates and credit income reflecting – reduced client activity in an environment of sustained low volatility and tighter
credit spreads – unfavourable market conditions impacted trading opportunities– partially offset by strong client activity in structured foreign exchange
products– Stronger equity income reflecting more favourable conditions in Asia, a
moderate increase in volatility and strong demand for warrants and structured client capital solutions
– Increased fee and commission income driven by demand for advisory and structured products primarily in Asia and North America
• Other includes higher expenses due to the impact of the Cargill acquisitions, partially offset by cost synergies following the merger of CFM and MSG
Commodities and Global MarketsStrong commodities and FX results in challenging market conditions, equities improving
Commodities ($A39m)
$Am
( 50 )
( 43 )( 23 )
-
( 113 )
-
-( 8 )
971
61-
-
27
-
52
36
-
910
400
500
600
700
800
900
1,000
1,100
FY17 NPC Lowerimpairments
Lowerinvestment
-relatedincome
Riskmanagement
products
Lendingand finance
Inventorymanagement,
transportand storage
Credit,interest rates
and FX
Equitiesnet interestand trading
income
Fee andcommissionincome and
other
Other FY18 NPC
1
Macquarie | 25th CLSA Investors’ Forum | macquarie.com Overview of Macquarie Macquarie’s Operating Groups 1Q19 Update FY19 Outlook Appendices
For
per
sona
l use
onl
y
57
Commodities and Global MarketsStrong client base
959
1,053
1,416
1,010
1,112
1,476
800
900
1,000
1,100
1,200
1,300
1,400
1,500
1,600
Commodities Financial markets and Futures Cash Equities
31 Mar 17 31 Mar 18
Clien
t num
bers
Macquarie | 25th CLSA Investors’ Forum | macquarie.com Overview of Macquarie Macquarie’s Operating Groups 1Q19 Update FY19 Outlook Appendices
For
per
sona
l use
onl
y
58
( 80 )
( 16 )-
-
- ( 51 )
483
-
90
237
37
-
700
-
100
200
300
400
500
600
700
800
FY17 NPC M&A fee income ECM fee income DCM fee income Investment-relatedincome
Lower imparimentsand provisions
Other FY18 NPC
1. Includes movements in share of net profits/(losses) of associates and joint ventures accounted for using the equity method, net gains on sale and reclassification of equity and debt investments, net interest and trading income (which represents the interest earned from debt investments and the funding costs associated with Macquarie Capital’s balance sheet positions), other income and non-controlling interests.
KEY DRIVERS• Fee income broadly in line:
- M&A: lower fee income across most regions except Europe- ECM: reflected a sustained period of lower deal activity in
Australia- DCM: higher fee income reflected increased market share
and client activity in the US• Stronger investment-related income:
- Higher revenue from asset realisations across most regions, primarily in the green energy, conventional energy and infrastructure sectors together with gains in the insurance and technology sectors
- Increase in equity accounted income primarily due to the improved underlying performance of investments
- Partially offset by higher funding costs for balance sheet positions due to increased activity, including the acquisition of GIG
• Lower provisions for impairment• Other primarily reflects transaction, integration and ongoing
costs associated with the acquisition of GIG and higher operating expenses from increased investing activity
Macquarie Capital Result driven by strong investment-related income largely in green energy
1
($A6m)
$Am
Macquarie | 25th CLSA Investors’ Forum | macquarie.com Overview of Macquarie Macquarie’s Operating Groups 1Q19 Update FY19 Outlook Appendices
For
per
sona
l use
onl
y
59
Macquarie Capital Movement in capital
-
0.5
1.0
1.5
2.0
2.5
3.0
3.5
31 Mar 17 Investments Realisations 31 Mar 18
DCM Loan Book Technology Green Energy Conventional Energy Infrastructure Real Estate Other – primarily co-investment alongside sponsor clients
$Ab
$A1.7b
+$A1.4b ($A0.5b)
$A2.6b
Other – primarily co-investment alongside financial sponsor clients
Macquarie | 25th CLSA Investors’ Forum | macquarie.com Overview of Macquarie Macquarie’s Operating Groups 1Q19 Update FY19 Outlook Appendices
For
per
sona
l use
onl
y
60
Impairment and provision expenses
Macquarie | 25th CLSA Investors’ Forum | macquarie.com Overview of Macquarie Macquarie’s Operating Groups 1Q19 Update FY19 Outlook Appendices
Note: Impairment expense includes collective allowance for credit losses, specific provisions and write-offs, impairment charge on non-financial assets, impairment charge on investment securities available for sale, and interest in associates and joint ventures.
KEY DRIVERS
• Increase in MAM largely reflects the write-down of MIRA’s investment in MIC
• Decrease in CAF reflects the partial reversal of collective provisions, driven by net loan repayments, and the improved credit performance of underlying portfolios
• Decrease in BFS as FY17 impacted by the underperformance of certain equity positions, impairments of intangibles relating to the Core Banking platform and higher business lending provisions on a small number of loans
• Decrease in CGM with FY17 impacted by write-downs of certain underperforming commodity related loans
• Decrease in MacCap with FY18 impacted by a small number of underperforming investments
$Am
( 96 )
( 65 )
( 61 )( 37 ) ( 10 )
444
191
366
-
100
200
300
400
500
600
700
FY17 MAM CAF BFS CGM MacCap Corporate FY18
For
per
sona
l use
onl
y
61
Regulatory project spendFY18 $Am
FY17$Am
Basel III and liquidity 7 12
OTC reform 8 22
MiFID II 24 6
IFRS 9 14 4
Other Regulatory Projects (e.g. Privacy, Managed Investment) 57 41
Sub-total 110 85
Business as usual compliance spendFY18 $Am
FY17$Am
Financial, Regulatory & Tax reporting and Compliance 103 115
Compliance policy and oversight 87 79
AML Compliance 29 24
Regulatory Capital Management 18 17
Regulator Levies 10 6
Other Compliance functions (e.g. Privacy, Super, Consumer Protection) 78 78
Sub-total 325 319
Total compliance spend 435 404
• The industry continues to see an increase in regulatory initiatives, resulting in increased compliance requirements across all levels of the organisation
• Direct cost of compliance approx. $A435m in FY18 (excluding indirect costs), up on FY17
• Project spend has increased during FY18,as a result of new projects and additional requirements for specific regulatory and accounting developments (e.g. MiFID II & IFRS 9)
Costs of compliance
Macquarie | 25th CLSA Investors’ Forum | macquarie.com Overview of Macquarie Macquarie’s Operating Groups 1Q19 Update FY19 Outlook Appendices
For
per
sona
l use
onl
y
62
• Balance sheet remains solid and conservative– Term assets covered by term funding, stable deposits and equity– Minimal reliance on short-term wholesale funding markets
• Total customer deposits1, up 1% to $A48.1b as at Mar 18 from $A47.8b as at Mar 17• $A21.8b2 of term funding raised during FY18:
– $A7.3b public unsecured debt issuances– $A5.1b Macquarie Air Finance Term Loan3
– $A3.3b MGL loan facilities4
– $A3.1b private placements and structured note issuance– $A2.2b mortgage and motor vehicle/equipment secured funding– $A0.8b MGL secured trade finance facility
Balance sheet highlights
1. Total customer deposits as per the funded balance sheet ($A48.1b) differs from total deposits as per the statutory balance sheet ($A59.4b). The funded balance sheet excludes any deposits which do not represent a funding source for Macquarie. 2. Issuances are AUD equivalent based on FX rates at the time of issuance and represent full facility size. 3. The Macquarie Air Finance Term Loan is a refinance and upsize of the current outstanding AWAS Term Loan. Commitment letters for the Macquarie Air Finance Term Loan were signed prior to 31 Mar 18. 4. Includes $A3.2b Senior Credit Facility refinance and upsize and $A0.1b addition to the existing MGL Asian Bank Facility refinanced in FY17.
Macquarie | 25th CLSA Investors’ Forum | macquarie.com Overview of Macquarie Macquarie’s Operating Groups 1Q19 Update FY19 Outlook Appendices
For
per
sona
l use
onl
y
63
• Well diversified issuance and funding sources
• Term funding beyond 1 year (excluding equity and securitisations) has a weighted average maturityof 4.6 years
Diversified issuance strategy
Note: All data presented in these charts represents drawn facilities. 1. Equity has been allocated to the AUD currency category. 2. Securitisations have been presented on a behavioural basis and represent funding expected to mature in >1yr. 3. Issuances and Maturities exclude securitisations and other secured finance. Issuances are converted to AUD at the 31 Mar 18 spot rate. Maturities shown are as at 31 Mar 18. 4. The Macquarie Air Finance Term Loan is a refinance and upsize of the current outstanding AWAS Term Loan. Commitment letters for the Macquarie Air Finance Term Loan were signed prior to 31 Mar 18.
-5
101520253035
FY14 FY15 FY16 FY17 FY18 <1 yr 1-2yrs 2-3yrs 3-4yrs 4-5yrs >5yrsDebt Loan Capital Equity and Hybrids AWAS Acquisition Facility Esanda Syndicated Facility
Tenor TypeCurrency
Term funding as at 31 Mar 18 – diversified by currency1, tenor2 and type
Term Issuance and Maturity Profile3$Ab
Issuances
Mar 18: Weighted average maturity 4.6 years
Maturities
AUD42%
USD43%
EUR8%
GBP2% CHF
2%JPY2%OTH1%
1-2yrs16%
2-3yrs13%
3-4yrs 4%
4-5yrs8%
>5yrs50%
Securitisations > 1 yr
9%
Private Placement8%
Secured Funding4%
Senior Unsecured39%
Loan capital7% Syndicated
loan facility6%
Covered Bonds1%
PUMA RMBS 5%
SMART ABS4%
Equity and Hybrids
26%
4
Macquarie | 25th CLSA Investors’ Forum | macquarie.com Overview of Macquarie Macquarie’s Operating Groups 1Q19 Update FY19 Outlook Appendices
For
per
sona
l use
onl
y
64
Macquarie has been successful in pursuing its strategy of diversifying its funding sources by growing itsdeposit base
• In excess of 1 million BFS clients, of which approx. 580,000 are depositors
• Focus on the composition and quality of the deposit base
• Continue to grow deposits, CMA product has an average account balance of approx. $A42,000
Note: Total customer deposits include BFS deposits of $A45.7b and $A2.4b of Corporate/Wholesale deposits.
Continued customer deposit growth
31.6 33.9 36.2 36.9 39.7 43.6 47.8 48.1
-
10.0
20.0
30.0
40.0
50.0
Mar 11 Mar 12 Mar 13 Mar 14 Mar 15 Mar 16 Mar 17 Mar 18
$AbCustomer deposits
Macquarie | 25th CLSA Investors’ Forum | macquarie.com Overview of Macquarie Macquarie’s Operating Groups 1Q19 Update FY19 Outlook Appendices
For
per
sona
l use
onl
y
65
OperatingGroup Category
Mar 18$Ab
Mar 17$Ab Description
CAF
Asset Finance2 25.1 22.2
Secured by underlying financed assetsFinance lease assets 14.9 12.2
Operating lease assets 10.2 10.0
Principal Finance3 4.8 6.6 Diversified corporate and real estate lending portfolio, predominately consisting of loans which are senior, secured, well covenanted and with a hold to maturity horizon
Total CAF 29.9 28.8
BFS
Retail Mortgages2,4 28.7 23.5
Secured by residential propertyAustralia 28.7 23.0
Canada, US and Other - 0.5
Business Banking4 7.9 7.1Secured relationship managed loan portfolio to professional and financial services firms, real estate industry clients, insurance premium funding, mortgages to Business Banking clients and other small business clients. Secured largely by real estate, working capital, business cash flows and credit insurance. The portfolio also includes other retail lending including credit cards
Total BFS 36.6 30.6
CGMResources and commodities 3.1 2.5 Diversified loan portfolio primarily to the resources sector that are secured by the underlying assets
Other 2.4 2.8 Predominately relates to recourse loans to financial institutions, as well as financing for real estate and other sectors
Total CGM 5.5 5.3
MAM Structured investments 2.7 2.0 Loans to retail and wholesale counterparties that are secured against equities, investment funds or cash, or are protected by capital guarantees at maturity
MacCap Corporate and other lending 0.6 0.8 Includes diversified secured corporate lending
Total loan and lease assets per funded balance sheet5 75.3 67.5
Loan and lease portfolios1 – Funded Balance Sheet
1. Loan assets are reported on a funded balance sheet basis and therefore exclude certain items such as assets that are funded by third parties with no recourse to Macquarie. In addition, loan assets at amortised cost per the statutory balance sheet of $A81.2b at 31 Mar 18 ($A76.7b at 31 Mar 17) are adjusted to include fundable assets not classified as loans on a statutory basis (e.g. assets subject to operating leases which are recorded in Property, Plant and Equipment and loans booked in Fair Value through P&L in the statutory balance sheet). 2. Australian Retail Mortgages per the funded balance sheet of $A28.7b differs from the figure disclosed on slide 19 of $A32.7b in the FY18 result announcement presentation and Asset Finance per the funded balance sheet of $A25.1b differs from the figure disclosed on slide 18 of $A29.8b in the FY18 result announcement presentation. The funded balance sheet nets down loans and funding liabilities of non-recourse securitisation and warehouse vehicles to show the net funding requirement. 3. Principal Finance per the funded balance sheet of $A4.8b includes property and related assets, and differs from the figure disclosed on slide 18 of $A4.7b in the FY18 result announcement presentation. 4. Securitised business banking portfolio with underlying residential mortgages was included in Retail Mortgages: Australia and has been reclassed to business banking and restated accordingly in Mar 17. 5. Total loan assets per funded balance sheet includes self-securitised assets.
Macquarie | 25th CLSA Investors’ Forum | macquarie.com Overview of Macquarie Macquarie’s Operating Groups 1Q19 Update FY19 Outlook Appendices
For
per
sona
l use
onl
y
66
Category
Carrying value2
Mar 18 $Ab
Carrying value2
Sep 17 $Ab
Carrying value2
Mar 17 $Ab Description
Macquarie Asset Management (MIRA) managed funds
1.5 1.9 1.6 Includes Macquarie Infrastructure Company, Macquarie SBI Infrastructure Fund, MPF Holdings Limited, Macquarie Korea Infrastructure Fund, Macquarie European Infrastructure Fund 4
Investments acquired to seed new MIRA products and mandates
0.8 1.4 0.6 Includes held for sale investments acquired to seed new MIRA products and mandates. Balance includes a range of investments including Cadent Gas (gas distribution network in the UK) and other various investments
Other Macquarie managed funds 0.4 0.5 0.5 Includes MIM funds as well as investments that hedge directors’ profit share plan liabilities
Transport, industrial and infrastructure 0.6 0.6 0.5 Over 20 separate investments
Telcos, IT, media and entertainment 0.7 0.7 0.6 Over 40 separate investments
Green Energy 1.4 1.0 0.2 Over 30 separate investments. Increase due to a number of additional investments in MacCap
Conventional energy, resources and commodities
0.6 1.0 0.5 Over 50 separate investments
Real estate investment, property and funds management
0.3 0.1 0.1 Over 10 separate investments. Increase includes new real estate investments in MacCap.
Finance, wealth management and exchanges
0.5 0.4 0.4 Includes investments in fund managers, investment companies, securities exchanges and other corporations in the financial services industry
6.8 7.6 5.0
Equity investments of $A6.8b1
1. Equity investments per the statutory balance sheet of $A8.5b (Mar 17: $A7.2b) have been adjusted to reflect the total economic exposure to Macquarie. 2. Total funded equity investments of $A6.8b (Mar 17: $A5.5b), less available for sale and associates’ reserves of nil (Mar 17: $A0.5b).
Macquarie | 25th CLSA Investors’ Forum | macquarie.com Overview of Macquarie Macquarie’s Operating Groups 1Q19 Update FY19 Outlook Appendices
For
per
sona
l use
onl
y
67
AASB.9 Financial Instruments• Full standard adopted from 1 Apr 18
• No material impact to Macquarie on transition
• Key reporting impacts:
– Reduction in shareholders’ equity of approx. $A125m after tax1
– Approx. impact of $A100m on Group capital; Bank CET1 capital ratios not materially impacted
– Increase in credit provisions reflecting the change from incurred loss to expected loss and new forward looking approach, which will introduce some volatility to provisioning levels moving forward
– A number of assets will change to be fair value through profit and loss including equity investments (no change to associates), reverse repurchase arrangements, and some lending assets. No material impact on transition, however will introduce some additional volatility subject to asset mix and market conditions
– Early adoption of hedge accounting requirements with no transition impact
Accounting Standard update
1. This relates primarily to the implementation of the impairment requirements which will result in a reduction in opening retained earnings by approx. $A150m after tax.
Macquarie | 25th CLSA Investors’ Forum | macquarie.com Overview of Macquarie Macquarie’s Operating Groups 1Q19 Update FY19 Outlook Appendices
For
per
sona
l use
onl
y
68
CCB (2.5%)Basel III minimum CET1 (4.5%)
3
4
5
Bank Group Common Equity Tier 1 Ratio: Basel III (Mar 18)
APRA Basel III CET1 ratio: 11.0%1
Harmonised Basel III CET1 ratio: 13.5%2
1. Basel III applies only to the Bank Group and not the Non-Bank Group. APRA Basel III Tier 1 ratio at Mar 18: 12.8%. APRA Basel III CET1 ratio at Sep 17: 11.0%. 2. ‘Harmonised’ Basel III estimates are calculated in accordance with the BCBS Basel III framework. Harmonised Basel III Tier 1 ratio at Mar 18: 15.3%. 3. Excluding foreign currency translation reserve. 4. Includes the net impact of hedging employed to reduce the sensitivity of the Group’s capital position to FX translation movements. 5. APRA Basel III ‘super-equivalence’ includes the impact of changes in capital requirements in areas where APRA differs from the BCBS Basel III framework and includes full CET1 deductions for differences in the treatment of mortgages (1.0%); equity investments (0.5%); capitalised expenses (0.5%); investment into deconsolidated subsidiaries (0.2%); DTAs and other impacts (0.3%).
Bank Group Basel III Common Equity Tier 1 (CET1) Ratio
Macquarie | 25th CLSA Investors’ Forum | macquarie.com Overview of Macquarie Macquarie’s Operating Groups 1Q19 Update FY19 Outlook Appendices
For
per
sona
l use
onl
y
69
Business growth
Macquarie | 25th CLSA Investors’ Forum | macquarie.com Overview of Macquarie Macquarie’s Operating Groups 1Q19 Update FY19 Outlook Appendices
Given significant business growth in FY18, Macquarie did not purchase any shares under the share buyback program announced at the 1H18 result announcement; the program remains in place, with any share purchases subject to a number of factors including the Group’s capital surplus position, market conditions and opportunities to deploy capital by the businesses
1. Regulatory capital requirements are calculated at 8.5% RWA including the capital conservation buffer (CCB), per APRA ADI Prudential Standard 110 as shown in the ‘Approximate business Basel III Capital & ROE’ (slide 43).
KEY DRIVERS• Increase in MAM of $A0.5b mainly due to acquisitions:
– Net increase of $A0.1b due to on-balance sheet investments to seed new MIRA products and mandates
– Net increase of $A0.4b due to off-balance sheet commitments and other requirements, including GLL Real Estate and ValueInvest
• Decrease in CAF of ($A0.2b) due to Principal Finance repayments and a decline in the vehicles portfolio
• Increase in BFS of $A0.3b due to growth in the mortgages and business banking portfolios
• Increase in CGM of $A0.4b due to Cargill acquisitions and increases in commodities and foreign exchange
• Increase in Macquarie Capital of $A0.9b primarily due to the acquisition of the GIG and continued transaction activity, particularly in green energy
– Net increase of $A0.7b due to on-balance sheet investments primarily reflecting the acquisition of GIG and continued transaction activity
– Net increase of $A0.2b due to off-balance sheet commitments and other requirements driven by continued transaction activity, particularly in green energy
Business Capital Requirements1
For
per
sona
l use
onl
y
70
• 162% average LCR for Mar 18 quarter, based on daily observations– Maintained well above regulatory minimums– Includes APRA approved AUD CLF allocation of $A7.7b for 2018 calendar year
• Reflects long standing conservative approach to liquidity management• $A30.4b of unencumbered liquid assets and cash on average over the quarter to Mar 18 (post applicable haircuts)
1. Unencumbered Liquid Asset Portfolio represents the quarterly average of these balances.
Strong liquidity position maintained
Unencumbered Liquid Asset Portfolio1 MBL LCR position
13.5 13.8 11.4
3.9 4.9 5.3
5.0 5.0 7.7
7.7 8.1 6.0
Sep 17 Qtr Dec 17 Qtr Mar 18 QtrHQLA Available Cash CLF Surplus CLF Collateral
$A30.4b$A31.8b$A30.1b
153% 153% 162%
-
50%
100%
150%
200%
Sep 17 Qtr Dec 17 Qtr Mar 18 Qtr
Regulatoryminimum
Macquarie | 25th CLSA Investors’ Forum | macquarie.com Overview of Macquarie Macquarie’s Operating Groups 1Q19 Update FY19 Outlook Appendices
For
per
sona
l use
onl
y
MACQUARIE 2018
Detailed result commentaryB APPENDIX
Macquarie | 25th CLSA Investors’ Forum | macquarie.com Overview of Macquarie Macquarie’s Operating Groups 1Q19 Update FY19 Outlook Appendices
For
per
sona
l use
onl
y
72
1. Includes net gains on sale, reclassification and revaluation of equity and debt investments and non-financial assets, share of net profits of associates and joint ventures accounted for using the equity method, dividend and distribution income, other fee and commission income and other income. 2. Management accounting profit before unallocated corporate costs, profit share and income tax.
• Base fees of $A1,608m, broadly in line with FY17:– Increased fees from positive market movements in MIM AUM and investments made
by MIRA-managed funds – Partially offset by asset realisations by MIRA-managed funds, net flow impacts in the
MIM business and foreign exchange• Performance fees of $A595m, up on FY17:
– FY18 included performance fees from MEIF3, MQA and other managed funds, Australian managed accounts and Listed Equities
– FY17 included performance fees from a broad range of funds, Australian managed accounts and from co-investors in respect of infrastructure assets
• Investment and other income of $A766m, up on FY17:– Increased equity accounted income as a result of the sale of a number of underlying
assets as well as gains from the sale of infrastructure debt– Partially offset by reduced gains from the sale and reclassification of certain
infrastructure investments and lower distribution income• Impairments and provisions of $A177m largely reflects the write-down of MIRA’s
investment in MIC • Total operating expenses of $A1,107m, up 5% on FY17 largely driven by increased
employment expenses as a result of higher average headcount
Macquarie Asset ManagementResult
Macquarie | 25th CLSA Investors’ Forum | macquarie.com Overview of Macquarie Macquarie’s Operating Groups 1Q19 Update FY19 Outlook Appendices
For
per
sona
l use
onl
y
73
1. Includes internal net interest expense and transfer pricing on funding provided by Group Treasury that is eliminated on consolidation in the Group’s statutory P&L. 2. Includes investment and loan impairments. 3. Management accounting profit before unallocated corporate costs, profit share and income tax. 4. Includes equity portfolio of $A0.4b (FY17: $A0.4b).
FY18 $Am
FY17 $Am
Net interest and trading income1 582 712
Net operating lease income 929 904
Impairments and provisions2 (15) (111)
Fee and commission income 41 53
Other income 352 273
Net operating income 1,889 1,831
Total operating expenses (679) (634)
Non-controlling interests (4) 1
Net profit contribution3 1,206 1,198
Loan and finance lease portfolio4 ($Ab) 24.3 26.5
Operating lease portfolio ($Ab) 10.2 10.0
Headcount 1,312 1,258
• Net interest and trading income of $A582m, down 18% on FY17 mainly as a result of the reduction in the Principal Finance portfolio
• Net operating lease income of $A929m, up 3% on FY17 due to improved underlying income from the Aviation, Energy and Technology portfolios
• Impairments and provisions expense of $A15m, down from $A111m in FY17 driven by – The partial reversal of collective provisions, driven by net loan repayments, and the
improved credit performance of underlying portfolios– Partially offset by the impairment of a legacy Asset Finance business and
impairments of certain Aviation assets• Other income of $A352m, up 29% on FY17
– Gains generated from Principal Finance investments in Europe and the US – The sale of the US commercial vehicles financing business– Prior year primarily related to a gain realised on the sale of an interest in a toll road
in the US by the Principal Finance business• Total operating expenses of $A679m, up 7% on FY17 mainly due to increased deal
and project related expense
Corporate and Asset FinanceResult
Macquarie | 25th CLSA Investors’ Forum | macquarie.com Overview of Macquarie Macquarie’s Operating Groups 1Q19 Update FY19 Outlook Appendices
For
per
sona
l use
onl
y
74
1. Includes internal net interest expense and transfer pricing on funding provided by Group Treasury and deposit premium paid to BFS by Group Treasury for the generation of deposits, that are eliminated on consolidation in the Group’s statutory P&L. 2. Includes investment and loan impairments. 3. Management accounting profit before unallocated corporate costs, profit share and income tax. 4. Funds on platform includes Macquarie Wrap and Vision. 5. The Australian loan portfolio comprises residential mortgages, loans to Australian businesses, insurance premium funding and credit cards. 6. The legacy loan portfolios primarily comprise residential mortgages in Canada and the US. 7. BFS deposits excludes corporate/wholesale deposits.
FY18 $Am
FY17 $Am
Net interest and trading income1 1,182 1,049Fee and commission income 466 472
Wealth management fee income 336 313Banking fee income 130 132Life insurance income - 27
Net gain on disposal of businesses 2 192Impairments and provisions2 (26) (91)Other income 22 26Net operating income 1,646 1,648Total operating expenses (1,086) (1,135)Net profit contribution3 560 513
• Net interest and trading income of $A1,182m, up 13% on FY17 – 6% growth in average Australian loan volumes and 7% growth in average
BFS deposits – partially offset by $A16m allocation of the Australian Government Major Bank Levy that
came into effect from 1 Jul 17• Fee and commission income of $A466m, in line with FY17
– Wealth Management fee income increased 7% driven by platform commissions from higher funds on the Wrap and Vision platforms which increased 14% on FY17
– Decrease in life insurance income following the sale of Macquarie Life’s risk insurance business in Sep 16
• Net gain on disposal of businesses of $A2m down from $A192m in FY17, which benefited from the net overall gain on sale of Macquarie Life’s risk insurance business to Zurich Australia Limited and the US mortgages portfolio
• Impairments and provisions expense of $A26m, down on FY17 – FY17 included higher impairment of equity investments and impairments of intangibles
relating to the Core Banking platform and higher business lending provisions taken on a small number of loans
• Total operating expenses of $A1,086m, down 4% on FY17 which was impacted by non-recurring expenses. Underlying expenses were $A34m higher and included a 4% increase in average headcount to support growth
Macquarie | 25th CLSA Investors’ Forum | macquarie.com Overview of Macquarie Macquarie’s Operating Groups 1Q19 Update FY19 Outlook Appendices
For
per
sona
l use
onl
y
75
1. Includes internal net interest expense and transfer pricing on funding provided by Group Treasury that is eliminated on consolidation in the Group’s statutory P&L. 2. Includes investment and loan impairments. 3. Management accounting profit before unallocated corporate costs, profit share and income tax. 4. In FY17, the timing of income recognition relating to tolling agreements and capacity contracts resulted in a net recognition of $A7m.
FY18 $Am
FY17 $Am
Commodities1 1,093 1,132
Risk management products 705 748
Lending and financing 237 260
Inventory management, transport and storage 151 124
Credit, interest rates and foreign exchange1 508 621
Equities 359 307
Fee and commission income 893 857
Investment and other income 142 180
Impairments and provisions2 (88) (149)
Net operating income 2,907 2,948
Brokerage, commission and trading-related expenses (398) (423)
Other operating expenses (1,599) (1,553)
Total operating expenses (1,997) (1,976)
Non-controlling interests - (1)
Net profit contribution3 910 971
Headcount 2,053 1,888
• Commodities income of $A1,093m, down 3% on FY17 – Risk management products down 6% on FY17 reflecting mixed results across the commodities platform
with continued subdued volatility impacting client hedging activity and trading opportunities in Global Oil, partially offset by strong results in North American Gas and Power, Bulk Commodities and continued growth in Commodity Investor Products
– Lending and financing income down 9% on FY17 largely due to wind down in legacy portfolios in the oil and gas sectors and a reduced contribution from metals financing
– Inventory management, transport and storage income up 22% on FY17 mainly driven by significant opportunities for the North American Gas and Power business to benefit from price dislocations across regions. However, the timing of income recognition in relation to tolling agreements and capacity contracts results in a net $A144m of income being recognised in future years4
• Credit, interest rate and foreign exchange income of $A508m, down 18% on FY17 driven by reduced client activity in an environment of sustained low volatility and tighter credit spreads, unfavourable market conditions impacting trading opportunities, partially offset by strong client activity in structured foreign exchange products
• Equities up 17% on FY17 reflecting more favourable conditions in Asia, a moderate increase in volatility and strong demand for warrants and structured client capital solutions
• Fee and commission income of $A893m, up 4% on FY17 driven by demand for advisory and structured solutions primarily in Asia and North America
• Investment and other income down on a strong FY17 which included gains on the sale of a number of investments in energy and related sectors
• Impairments and provisions down on FY17 which was impacted by certain underperforming commodity-related loans
• Expenses of $A1,997m were broadly in line with FY17, with impact of the Cargill acquisitions partially offset by cost synergies following the merger of CFM and MSG
Commodities and Global MarketsResult
Macquarie | 25th CLSA Investors’ Forum | macquarie.com Overview of Macquarie Macquarie’s Operating Groups 1Q19 Update FY19 Outlook Appendices
For
per
sona
l use
onl
y
76
1. Includes internal net interest expense and transfer pricing on funding provided by Group Treasury that is eliminated on consolidation in the Group’s statutory P&L. 2. Includes investment and loan impairments. 3. Internal revenue allocations are eliminated on consolidation in the Group’s statutory P&L. 4. Management accounting profit before unallocated corporate costs, profit share and income tax. 5. Source: Dealogic and IJGlobal for Macquarie Group completed M&A, balance sheet positions, ECM and DCM transactions, converted at 31 Mar FX rate. Deal values reflect the full transaction value and not an attributed value. Prior period deal values and transaction numbers have been restated to align with current year methodology.
FY18 $Am
FY17 $Am
Fee and commission income 878 887Investment-related income (ex non-controlling interests) 652 410
Investment and other income 724 407
Net interest and trading income1 (72) 3
Impairments and provisions2 (60) (97)
Internal management revenue3 21 6
Net operating income 1,491 1,206
Total operating expenses (785) (722)
Non-controlling interests (6) (1)
Net profit contribution4 700 483
Capital markets activity5:
Number of transactions 402 385
Transactions value ($Ab) 352 301
Headcount 1,192 1,136
Macquarie CapitalResult
• Fee income was broadly in line with FY17: - M&A: lower fee income across most regions except Europe- ECM: reflected a sustained period of lower deal activity in Australia- DCM: higher fee income reflected increased market share and client activity in the US
• Stronger investment-related income (ex non-controlling interests):- Higher revenue from asset realisations across most regions, primarily in the green
energy, conventional energy and infrastructure sectors together with gains in the insurance and technology sectors
- Increase in equity accounted income primarily due to the improved underlying performance of investments
- Partially offset by higher funding costs for balance sheet positions due to increased activity, including the acquisition of GIG
• Lower provisions for impairment • Net operating expenses increased 9% on FY17 reflecting transaction, integration and
ongoing costs associated with the acquisition of GIG and higher operating expenses from increased investing activity
Macquarie | 25th CLSA Investors’ Forum | macquarie.com Overview of Macquarie Macquarie’s Operating Groups 1Q19 Update FY19 Outlook Appendices
For
per
sona
l use
onl
y
MACQUARIE 2018
GlossaryB APPENDIX
Macquarie | 25th CLSA Investors’ Forum | macquarie.com Overview of Macquarie Macquarie’s Operating Groups 1Q19 Update FY19 Outlook Appendices
For
per
sona
l use
onl
y
78
Glossary
Macquarie | 25th CLSA Investors’ Forum | macquarie.com Overview of Macquarie Macquarie’s Operating Groups 1Q19 Update FY19 Outlook Appendices
$A / AUD Australian Dollar$C / CAD Canadian Dollar$US / USD United States Dollar£ / GBP Pound Sterling€ Euro1H Half-year ended 30 Sep2H Half-year ended 31 Mar3Q Quarter ended 31 DecABN Australian Business NumberAI Artificial IntelligenceANZ Australia and New ZealandAPI Application Programming InterfaceAPRA Australian Prudential Regulation AuthorityApprox. ApproximatelyASX Australian Securities ExchangeAUM Assets Under Managementb BillionBCBS Basel Committee on Banking Supervisionbcf/d Billion Cubic Feet Per DayBFS Banking and Financial Services
CAF Corporate and Asset FinanceCAGR Compound Annual Growth RateCCB Capital Conversion BufferCEO Chief Executive OfficerCET1 Common Equity Tier 1CFO Chief Financial OfficerCGM Commodities and Global MarketsCMA Cash Management AccountCY Calendar Year ended 31 DecDCM Debt Capital MarketsDMA Direct Market AccessDTA Deferred Tax AssetECA Export Credit AgencyECM Equity Capital MarketsEMEA Europe, Middle East and AfricaEUM Equity Under ManagementFX Foreign ExchangeFY Full year ended 31 MarGIG Green Investment Group (rebranded from Green Investment Bank)GDP Gross Domestic Product
For
per
sona
l use
onl
y
79
Glossary
Macquarie | 25th CLSA Investors’ Forum | macquarie.com Overview of Macquarie Macquarie’s Operating Groups 1Q19 Update FY19 Outlook Appendices
MIRA Macquarie Infrastructure and Real Assetsmmboe Million Barrels of Oil EquivalentMSIS Macquarie Specialised Investment SolutionsMW MegawattMWp Megawatt PeakNGLs Natural gas liquids No. NumberNPAT Net Profit After TaxNSFR Net Stable Funding Ratiop.a. Per annumpcp Prior Corresponding PeriodPPP Public-Private PartnershipPV PhotovoltaicRBA Reserve Bank of AustraliaROE Return on EquityRWA Risk Weighted AssetsSMSF Self Managed Super FundS&P Standard & Poor'st / tr TrillionTMET Telecommunications, Media, Entertainment and TechnologyMIRA Macquarie Infrastructure and Real Assets
For
per
sona
l use
onl
y
80
Glossary
Macquarie | 25th CLSA Investors’ Forum | macquarie.com Overview of Macquarie Macquarie’s Operating Groups 1Q19 Update FY19 Outlook Appendices
UK United KingdomUK GIB United Kingdom Green Investment BankUS / USA United States of Americayr YearYTD Year To Date
For
per
sona
l use
onl
y
25th CLSA Investor’s Forum
Presentation to Investors and Analysts11-12 September 2018
Hong Kong
Alex HarveyChief Financial OfficerSam DobsonHead of Investor Relations