Australian Pharmaceutical Pricing in a Global Context: Trends and Issues Working Paper No. 16 Kim Sweeny Pharmaceutical Industry Project Working Paper Series February 2004 Centre for Strategic Economic Studies Victoria University of Technology PO Box 14428 Melbourne City MC VIC 8001 Australia Telephone +613 9919 1340 Fax +613 9919 1350 Email: [email protected]Website: http://www.cfses.com
Transcript
Australian Pharmaceutical Pricing in a Global Context: Trends and Issues
Working Paper No. 16
Kim Sweeny
Pharmaceutical Industry Project Working Paper Series
February 2004
Centre for Strategic Economic Studies Victoria University of Technology
PO Box 14428 Melbourne City MC VIC 8001 Australia Telephone +613 9919 1340
Australian Pharmaceutical Pricing in a Global Context:
Trends and Issues
Kim Sweeny Summary
The publicly-funded Pharmaceutical Benefits Scheme (PBS) in Australia faces many of the same cost pressures being experienced in other countries, with real growth running at over 8% per annum. Although the Australian market for prescription pharmaceuticals is worth less than A$8 billion (US$6 billion, less than 1% of the global market), understanding the operations of the PBS is useful because the PBS is an important model for a publicly-funded scheme combining universal coverage, a relatively extensive positive list, and the incorporation of pharmacoeconomic analysis within a strict cost-containment regime.
A simplistic analysis suggests that much of the PBS growth is caused by increasing drug prices, particularly for newer drugs. This paper uses standard price and quantity index approaches to show that prices have increased little, if at all, over the past decade and that cost growth is driven by prescription increases.
A major cause for this low price growth is due to the use of economic analysis to determine the list price of new drugs and reference pricing and the availability of generics to lower prices for older drugs. The operation of this pricing system is illustrated for drugs treating hypertension. The ability to add flexibility to the PBS is explored through scenarios for changing the ratio of prices of patent-protected and off-patent drugs. Australian pharmaceutical markets are presented in a global context through the use of standard price index approaches comparing prices in Australia and 13 other markets having a variety of pharmaceutical insurance, cost-containment and regulatory schemes. Australia has low prices for both patent-protected and off-patent drugs, although the PBS price setting mechanism acts to limit the disparity between these two prices so that prices for generic drugs are lower in some other countries. The CSES research program aimed at better understanding the PBS and Australian pharmaceutical markets and their global context will have three major components for the future: (i) extending the index analysis of the PBS using hedonic regression analysis and quantifying the impact of economic evaluation on drug pricing; (ii) understanding longer term outcomes from the use of drugs once they have entered the market, by linking together separate pharmaceutical, medical service and hospital databases, so that patient cohorts can be followed over time; and (iii) expanding the international price comparisons to examine the impact of pharmaceutical system characteristics. 1. Introduction
The rising cost of health services, including pharmaceuticals, continues to be of major concern to countries around the world, and the causes are major sources of controversy. In Australia, cost overruns for blockbuster drugs available under the publicly-funded Pharmaceutical Benefits Scheme (PBS) have drawn attention to the long-run sustainability of the program and the Government has unsuccessfully tried to raise the level of patient co-payments, as well as instituting public advertising campaigns aimed at limiting demand and promoting rational use of medicines.1 In the
1 On sustainability see Treasury (2002).
Centre for Strategic Economic Studies
2
USA, the passage of the new Medicare Drug Benefit has raised issues about the adequacy of the program, its sustainability and the inability to influence prices.2 For both countries these issues have come together in the negotiations around a Free Trade Agreement between the Australia and the USA. Although concentrating mainly on the trade in agricultural commodities, the US negotiating team has been also seeking significant changes to the pricing and listing procedures of the PBS. The inclusion of the PBS within the FTA negotiations indicates that, although the Australian market for prescription pharmaceuticals is worth less than A$8 billion (US$6 billion, less than 1% of the global market), the PBS is an important model for a publicly-funded scheme combining universal coverage, a relatively extensive positive list, and the incorporation of pharmacoeconomic analysis within a strict cost-containment regime. The pharmaceuticals and healthcare research program at the Centre for Strategic Economic Studies has sought to examine the economic, administrative and policy aspects of the PBS with a view to shedding light on how some of the issues around the cost of pharmaceuticals in Australia might be addressed. This necessarily involves understanding the PBS in both a local and a global context. Perhaps surprisingly there has been little research done on the PBS, outside the major contribution Australian economists have made to the application of cost-benefit analysis to health services decision-making. Since 1993, companies seeking to list drugs on the PBS have had to provide an economic analysis to guide decision-making and this aspect of the PBS has been the main focus for economic research.3
Understanding the operations of the PBS also helps address the broader consideration of the various other components of health care in Australia.
This paper reports on some of the findings to date of the Centre’s pharmaceuticals research program. Section 2 describes the important features of the PBS and trends in the price and quantity of drugs available under the scheme using a detailed database covering the period 1991-92 to 2002-03.
The PBS pricing system applies significant downward pressure on prices for both new and old drugs and this price suppression is illustrated for the case of angiotensin II receptor antagonists.
The proportion of the PBS cost accounted for by generic suppliers is increasing but still low in comparison to other countries, such as the USA, Canada and Germany. One of the more promising avenues for meeting the needs of both the government and the manufacturers is through changing the ratio of prices of patent-protected and off-patent drugs. Some results of a recent analysis are presented. Section 3 situates Australian pharmaceutical prices in an international context by comparing price levels with those in 13 other countries having a variety of pharmaceutical insurance, cost-containment and regulatory schemes. Australia has low prices for both patent-protected and off-patent drugs, although the PBS price setting mechanism acts to limit the disparity between these two prices so that prices for generic drugs are lower in some other countries. The analysis of the operations of the PBS and the international comparison of prices has raised a number of issues and suggests future directions for the research 2 These issues have been canvassed by various contributors such as Joseph Newhouse and Ernst Berndt in Health Affairs (January/February 2004). A recent article in Time (Barlett and Steele 2004) captures the flavour of much of the popular commentary. 3 See for instance George et al. (1997, 2001), Henry and Lopert (1999), Hill et al. (1997), and Lopert et al. (2002). Exceptions to this are Johnston and Zeckhauser (1991) and McManus et al. (2001) both of which have looked at the impact of policy changes on PBS expenditure. The Productivity Commission (2001) has compared pharmaceutical prices in Australia with 6 other countries.
Centre for Strategic Economic Studies
3
program. These are discussed in Section 4. It has become increasingly apparent that there is very little information on actual use of pharmaceuticals and their relationship to health outcomes. Understanding this properly will require linking disparate pharmaceutical, medical and hospital records so that cohorts of patients can be tracked over time. Comparing the results of this analysis with similar studies in other countries would add to value to this type of research. 2. The Australian Pharmaceutical Benefits Scheme
Around 75% of prescription drugs consumed in Australia are provided through the Pharmaceutical Benefits Scheme (PBS) (Productivity Commission 2001) which is administered by the Australian government. The PBS acts both as a publicly funded insurance scheme with universal coverage (for Australian residents and eligible overseas visitors), and as a cost-containment program for the Government. State governments are responsible for public hospitals. The PBS is funded from general revenue and has two categories of patients – concessional cardholders who currently contribute a maximum of A$3.70 per prescription filled and general patients with a maximum co-payment of A$23.10.4 A safety net provides a maximum cap on annual expenditure for both categories.5 About three quarters of PBS expenditure is incurred by concessional patients.6 2.1 Listing and Price Determination
As is the case in most comparable countries, the PBS operates a positive list (Jacobzone 2000), requiring manufacturers to apply to have their drug available for subsidy.
The PBS is administered by the Department of Health and Ageing (DHA). The Pharmaceutical Benefits Advisory Committee (PBAC) is the body that recommends whether a drug should be listed on the PBS, while the Pharmaceutical Benefits Pricing Authority (PBPA) recommends to the Department the price at which it should be listed. In response to a range of queries and complaints about the nature and transparency of the procedures for listing and pricing drugs, the PBPA has provided an outline of these processes – its ‘Procedures and Methods’, the latest edition of which is for March 2003 (PBPA 2003).
Suppliers proposing to have a new product listed on the PBS are required to provide a range of information including cost of the new drug and proposed price, as well as an economic evaluation7 (mandatory since 1993) in order for the PBAC to ‘compare the cost arising from the new drug with the benefits gained from its use compared to existing therapy’. ‘New drugs are most commonly recommended by the PBAC on the basis of cost minimisation or acceptable incremental cost effectiveness ratios’. In addition to this, the PBPA uses additional information on overseas prices (UK and NZ), prices of alternatives listed on PBS, and expected expenditure to
4 That is co-payments are a fixed amount not proportional to price. 5 Concessional patients include most people over 65, as well as old age and single parent pensioners and other social security beneficiaries. 6 Further information on the PBS is given in Sweeny (2002). 7 George et al. (2001) reviewed all submissions between 1991 and 1996 and classified them as cost-effectiveness analyses (35%), cost-minimisation analyses (28%), cost-utility studies (3%), and other (or no) analyses (24%).
Centre for Strategic Economic Studies
4
recommend a price for the new drug. The price is then negotiated between the Department and the supplier.
All drugs listed on the PBS are reviewed at least once per year. For this purpose, drugs used to treat the same condition or which have a
similar action are grouped in therapeutic sub groups according to their Anatomical Therapeutic Classification (ATC). All drugs within a sub group are reviewed together.
The principal method used to determine drugs prices is Therapeutic Group Pricing described by PBPA as follows:
Where drugs are considered to be of similar safety and efficacy, the lowest priced brand or drug sets the benchmark price for either the other brands of that drug or the other drugs within the same therapeutic group. Pricing within these therapeutic groups is based on the therapeutic relativities between drugs as noted on the therapeutic relativity sheets... If a sponsor demonstrates to the PBAC a clinical advantage for a particular drug over alternative products then that drug may be granted a higher subsidised price over the alternative.
Reference pricing, of which therapeutic group pricing is a variant, is
increasingly used in many jurisdictions to set the price of drugs. Most commonly however it covers the first instance describe above, namely the comparison of a particular brand to other brands of the same drug. Australia is almost alone among countries in including brands of other drugs in the same therapeutic group in the comparison.
One result of the PBS price setting procedure is that there is very little difference between the price of an originator brand and the brands from generic suppliers.8
The negotiations between suppliers and manufacturers essentially set the price at which the manufacturer provides to the wholesaler. The price paid by the pharmacist is this price plus a 10% margin, while the retail price for most drugs is calculated by adding 10% to the pharmacist price plus a dispensing margin, currently A$4.66.
Aside from these price setting mechanisms, the PBS also contains cost by increasingly restricting the indications and conditions under which doctors can prescribe certain drugs, as well as actively promoting knowledge of pricing to doctors and consumers, promoting the use of generics and discouraging waste. 2.2 Price and Quantity Trends
Although the PBS operates a positive list, the choice available to consumers is quite extensive – with at present about 610 unique molecules (or combinations) in around 2040 variants of form, strength and pack size. About half of the cost of the PBS in 2002-03 was accounted for by drugs listed since 1995.
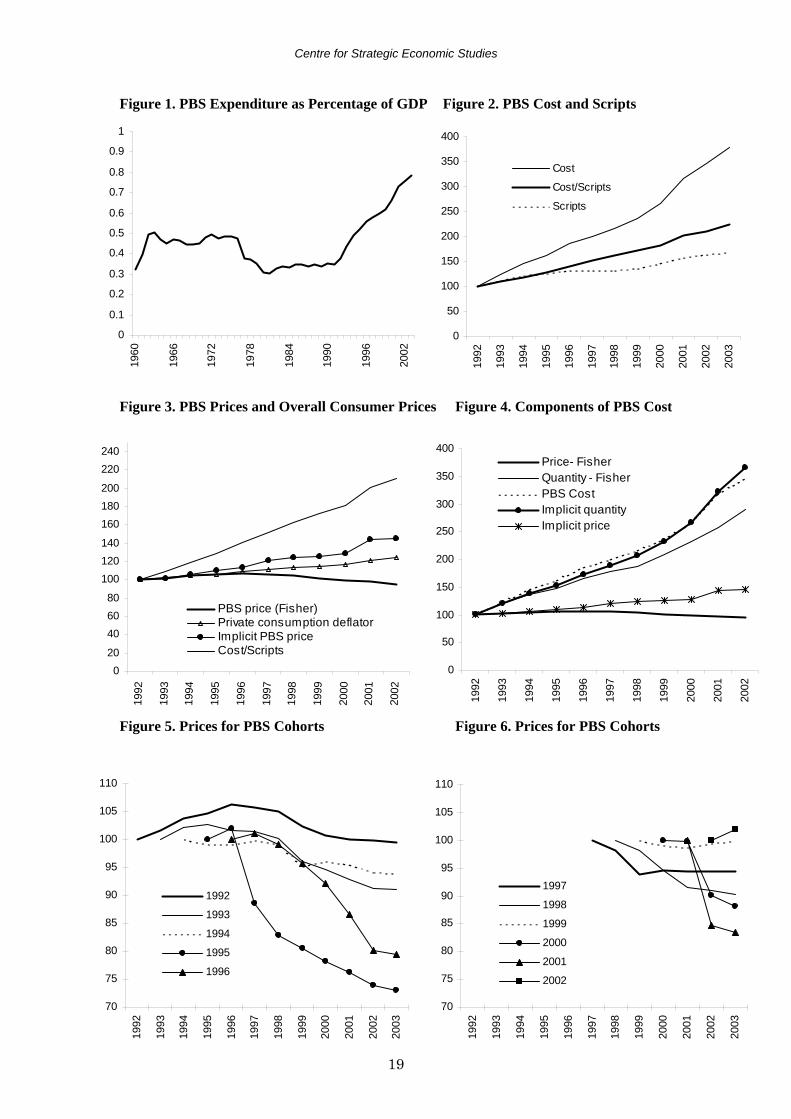
Historically, the cost of PBS drugs has been relatively constant as a proportion of GDP for extended periods of time (Figure 1). Growth rates exceeding 10% per annum have only been experienced since the beginning of the 1990s.
Common explanations for recent cost blow-outs in the PBS have concentrated on doctors prescribing outside indications, the price of drugs (especially new drugs) and increasing demand. Most attention, however, has been on the price of drugs based 8 The base price is set at the lowest price offered by a supplier. Originator brands can add a premium agreed with the PBS, but this is rarely more than 10% of the base price. Patients pay the premium on top of the co-payment.
Centre for Strategic Economic Studies
5
on the kind of analysis illustrated in Figure 2, which shows the total cost of the PBS, the number of scripts written and price calculated as cost divided by scripts (all expressed as indexes based on 1991-92 = 100). This shows prices rising faster than demand.
The conclusions based on Figure 2 are misleading for reasons that have been well canvassed in the literature on pharmaceutical prices for at least 30 years.9 The relative importance of different drugs in the PBS has changed over time, new drugs have entered while old drugs have disappeared, different strengths and forms have been listed, and quality has changed, particularly with the introduction of drugs in new therapeutic categories.
To understand better the dynamics of prices and quantities of drugs under the PBS, indexes were calculated using a dataset of the annual cost and numbers of scripts of all PBS drugs for the period 1991-92 to 2002-03.10 The PBS allocates a four-digit code to each item supplied under the Scheme. Each item is specified in terms of the molecule name of the drug, its form, strength, pack size, indication for which it is listed, and any restriction imposed on its prescription. There may be more than one item number for a particular combination of molecule, form, strength and packsize, if for instance there are different indications.11
Direct price and quantity indexes were calculated for adjacent pairs of years based on the drug items common to both years. These direct indexes were then chained, this procedure minimising the effects of, firstly, omitting new and disappearing drugs and, secondly, quality change.12 Laspeyres, Paasche, Fisher, Walsh, Tornqvist and Vartia price and quantity indexes were calculated. Aside from the Laspeyres and Paasche indexes, there was little difference among these indexes, except for the Tornqvist quantity index, which performed poorly and appears to be sensitive to extreme quantity relatives. Results reported below therefore are for the Fisher index.
Figure 3 compares a number of different measures of PBS prices arising from this approach. The Fisher price index indicates that PBS pharmaceutical prices fell by about 5% over the whole period. Using the Fisher quantity index to deflate PBS expenditure generates an implicit price index, which shows prices increasing by about 45% over the period, somewhat more than the rate of general inflation (24%) as measured by a commonly used index of consumer prices – the deflator for Australian private consumption expenditure. Both price indexes however are well below the index calculated by simply dividing cost by scripts, reproduced from Figure 2.
It is an inherent limitation of the chained direct index approach that the directly calculated price index will not be the same as the price index derived from the quantity index. This is because the PBS expenditure series used in calculating the derived index includes new and disappearing drugs whereas the indexes do not, and
9 In for instance, Berndt et al. (1998), Frank et al. (1999). 10 For a fuller discussion see Sweeny (2003). Data provided by the Department of Health and Ageing. All General, Dental, Emergency Drug and Special Benefit items were included. Excluded are Repatriation (veterans), Highly Specialised Drugs (administered in a hospital) and other special drugs. The total value of these exclusions was about A$750 million in 2001-02. In addition the dataset does not capture sales by pharmacists to general patients of drugs with a price less than the general co-payment level. 11 Although cost and script data was available for each combination of item and manufacturer, the analysis was carried out at the item level. 12 Quality changes occur in the PBS only through the introduction of new drugs which are given a separate item code. In theory the cost-benefit analysis used in determining the initial price of a drug on the PBS means that quality changes should be fully reflected in the price. Accounting for quality changes should be less of a problem than might be first thought.
Centre for Strategic Economic Studies
6
because the basket of goods used in calculating the indexes changes from period to period. Resolving this requires the kind of approach outlined in Section 4 below.
Figure 4 shows the directly calculated and indirectly derived Fisher price and quantity indexes, as well as the index of PBS expenditure.
Whichever way the price and quantity trends are calculated however, it is clear that cost growth in the PBS is being driven by strong increases in demand (as reflected in scripts) rather than by increasing prices. Indeed the downward trend in the directly calculated Fisher price index seems to reflect both the application of economic evaluation in setting the initial price of drugs and the operation of annual therapeutic group pricing reviews, which reduce the price of both patent-protected and originator brands facing competition once generics become available at lower prices.
Anther way of illustrating price trends in the PBS is to look at what happens to cohorts of drugs over time. Figures 5 and 6 chart Fisher price indexes for those drugs introduced to the PBS in each year from 1991-92 to 2001-02 and still listed in 2002-03.13
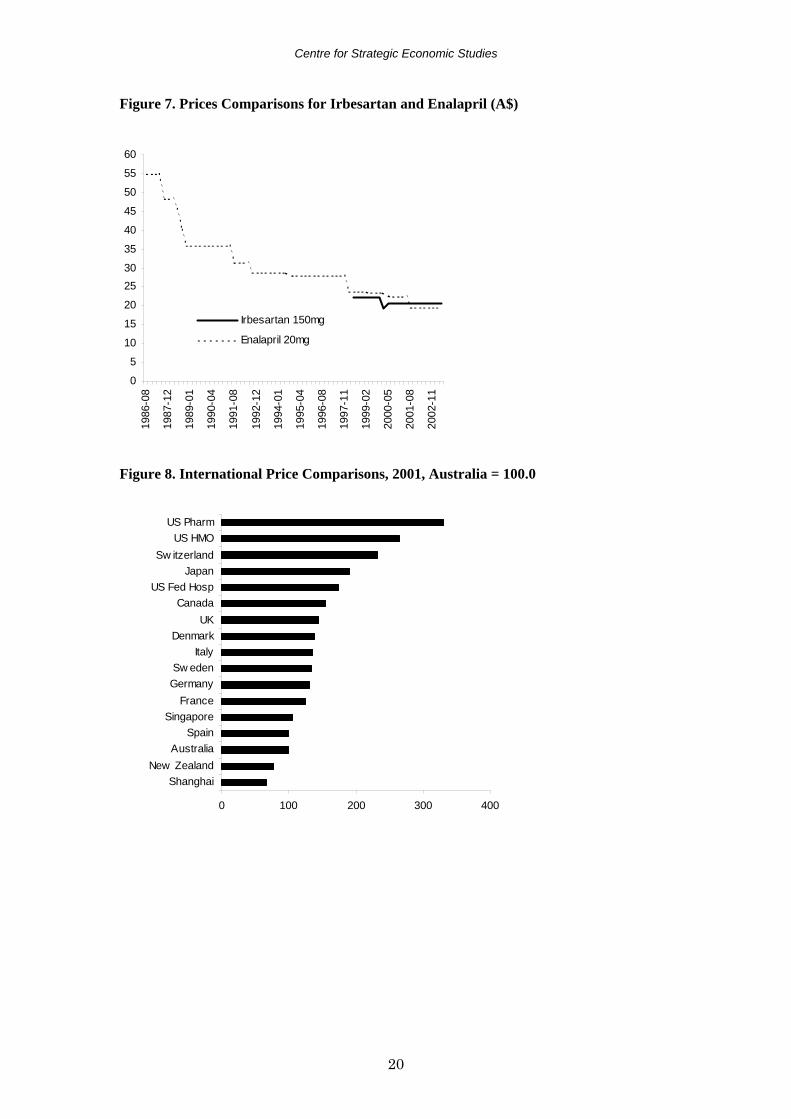
Tracing the subsequent history of a cohort of drugs introduced in a particular year avoids the problem inherent in chaining direct indexes, where the drugs being compared can change from year to year. The cohorts for the years 1991-92 to 1996-97 (Figure 5) show price increases followed by often quite large falls in prices from the mid-1990s onwards. With the exception of the most recent year (2001-02), the other cohorts display falling prices after introduction with some levelling out in later years. In general the movement in prices confirms the earlier impression of consistent downward pressure on prices from the middle of the 1990s to the present. 2.3 Case Study 1: Drugs for Treating Hypertension The price setting operations of the PBS can be illustrated through a case study of drugs for treating hypertension.14 The PBS provides a good selection of hypertension drugs ranging from the earlier diuretics, beta blockers and calcium channel blockers to the newer ACE inhibitors (9 types) and angiotension II receptor antagonists (AIIRA – 5 types). These latter two categories are also available in combination with diuretics. Calcium channel blockers and ACE inhibitors are the most widely prescribed hypertension treatments although AIIRAs have grown strongly since their introduction in 1997, taking market share from the other two.
As noted above, drugs listed under the PBS are classified within therapeutic categories and the drugs in each category are reviewed together each year. ACE inhibitors and AIIRAs are included within the same therapeutic sub group (ATC C09 – Agents Acting on the Renin-Angiotensin System) with the prices of the AIIRAs being linked directly to the price of the ACE inhibitor enalapril.
Enalapril entered the market in August 1986 at a pharmacist price of $55.00 for a packet of 30 tablets. Over time the PBS pricing system had reduced that to $19.69 by May 2003. Unlike other health products, the prices of pharmaceuticals are not adjusted to compensate for inflation. Irbesartan was approved for sale under the PBS in May 1995 in packs of 28 tablets (changed to packs of 30 in February 2000) at a price of $22.22, the same price per tablet as for enalapril 20mg packs. The current price is $20.57.
13 The cohort of drugs for 1991-92 includes those listed in that year and all previous years. 14 CSES (2003).
Centre for Strategic Economic Studies
7
The failure to adjust for inflation against a background of reductions in price arising from the operation of reference pricing and other PBS policy decisions means that it becomes progressively harder for innovative drugs to enter the Australian market at a price sufficient to recoup the cost of R&D and production.
Figure 7 shows how the prices of the two drugs have tracked over time. Irbesartan was initially disadvantaged by a price reduction of enalapril just prior to launch. A further reduction for irbesartan was imposed in February 2000, around the time of the introduction of the other AIIRAs, eprosartan and telmisartan and about a year after candesartan entered the market (and despite an increase from 28 tablets per pack of irbesartan to 30). The next major reduction for enalapril only occurred after the entry of generic suppliers in February 2001 following patent expiry. 2.4 Case Study 2: Reducing the Price of Off-Patent Drugs As noted in the introduction, the effects of the price setting mechanism within the PBS is an important policy issue for the pharmaceutical suppliers in Australia. The previous case study illustrates both the difficulty faced by suppliers of a new drug in obtaining a premium for innovation and the steady erosion in the price after the drug has been listed. The Centre has explored a number of initiatives that might be introduced which could provide some upward flexibility in the price of newer patent-protected drugs. While prices of patent-protected drugs are low in Australia compared to other countries (as demonstrated in Section 3 below), generic prices tend to be relatively high. This is because the PBS sets the price of originator brands close to the price of generic brands, thus discouraging the entry of generic suppliers. This is exacerbated by the high level of oligopoly in the generic drugs supply industry. The corollary is that the price of off-patent drugs facing competition could be reduced and the savings generated used to increase the price of patent-protected drugs (or for other purposes such as listing more new drugs), while maintaining overall cost neutrality for the Scheme. CSES recently undertook a study to explore the scope for this (CSES 2004) using the PBS dataset described in Section 2.1 above. This dataset records, for each item and manufacturer combination, the PBS item number, manufacturer code, the cost to the government, the cost to the patient and script numbers for both. The quarterly PBS Schedule provides, for each item and manufacturer combination, a range of information including molecule name, pack size, description (form and strength), brand name, and ATC code. This was used to match each item and manufacturer combination in the PBS dataset with its molecule name and description. An associated dataset of manufacturer codes and names was used to add the manufacturer name. The manufacturer name and code associated with a drug on the PBS may change over time for a number of reasons. Some companies change name after a merger or acquisition. Because the PBS dataset consists of annual data it can record supply from a company under both the old and new name. To correct this, all manufacturer codes and names were examined to determine the ultimate parent company and codes were recoded to the code of this company.
Having made these allocations, it was then possible to determine for each molecule within the PBS dataset, how many suppliers there were in 2001-02.
In addition, each manufacturer was examined to determine whether it was mainly a research-based company supplying the original version of a drug
Centre for Strategic Economic Studies
8
(‘originator’), or a company supplying generic equivalents of these originator brands (‘generic’).
Using this information, each item/manufacturer combination within a particular molecule was allocated either an ‘Originator’ or ‘Generic’ status.
Information on patent status was obtained from the Patents International database which is part of the IMS Lifecycle suite of products. This database contains details of the patent status and other characteristics of some 1400 drugs up to the beginning of 2002. The patent expiry date for drugs with patent status in Australia was collected from this database and matched to records within the PBS dataset. Mostly this was done at the molecule level unless there was separate patent expiry information within the database for specific forms or conditions.
Using the expiry date it was possible to classify those with an expiry date prior to 1 July 2001 as ‘Off-Patent’, and those with a date from 1 July 2001 as ‘Patent-Protected’. The Patent International database is however not completely comprehensive. It has limited coverage for drugs with a patent expiry date before 1985, and also misses some recently listed drugs. This means that it was not possible to allocate a patent expiry date to many drugs listed on the PBS.
Many of these will be older drugs, so to address this problem, the FDA approval date was used as a proxy for the age of the drug. Unfortunately, the Australian equivalent, the Therapeutic Goods Administration approval date, is not readily available. The IMS Lifecycle product has a database of product launches with dates for Australia but this only covers products launched since 1985. FDA approval dates were obtained from the CD version of the 2003 edition of Mosby’s Drug Consult, a database of drugs available within the USA. This was supplemented by examination of the Drugs@FDA pilot web site and the FDA’s Approved Drug Products with Therapeutic Equivalence Evaluations (Orange Book) database. Although care was taken to ensure that US drug names were used, the coverage was still incomplete, mainly because some drugs listed on the PBS have never been available in the USA. Nonetheless the FDA approval date, combined with a detailed examination of each item/manufacturer combination, enabled the patent status of many of the drugs without a patent date to be determined with some confidence. Most were allocated to the ‘Off-Patent’ category. For the remaining unclassified drugs, the December 1975 edition of the PBS Schedule was consulted. If the drug appeared in this edition it was assumed to be ‘Off-Patent’.
In summary then a variety of sources were used to classify the great majority of the item/manufacturer combinations in the PBS according to their Originator/Generic status and to determine whether they were ‘Off-Patent’ or ‘Patent-Protected’ in 2001-02. In addition the number of suppliers for each molecule in 2001-02 was determined.
Table 1 reports the total cost of the PBS in 2001-02 allocated to these different categories.
Patent protected drugs accounted for $2,912.2 million or 58.2% of the total cost of the PBS in 2001-02. Most patent protected drugs have a single originator supplier, although some have been developed and co-marketed by more than one originator. A small number of patent protected drugs are supplied by generic companies under licence.
Off-Patent drugs are responsible for $1,952.8 million or 39.0% of total cost. Some $210.0 million is supplied by only one company – in some cases the originator has abandoned the market to the generic, conversely the generic supplier has judged the market insufficient to justify the costs of entry.
Centre for Strategic Economic Studies
9
This leaves a contested market for Off-Patent drugs of $1,742.8 million split 66.1% to the originator and 33.9% to the generic supplier. A further $138.4 million of PBS cost (2.8%) was due to drugs for which the patent status is unknown and/or for which originator/generic status could not be determined. Overall, the cost of drugs from generic suppliers was $645.3 million or 12.9% of the total. Table 2 shows the impact of a range of across-the-board reductions in the price of off-patent drugs. Reducing these prices by 20%, for instance, results in savings to the government of $389.8 million. Table 2 also reports by how much the cost of patent-protected drugs could rise if these savings were all dedicated to this end, while keeping the overall PBS cost unchanged. A 20% reduction in the price of off-patent drugs increases the amount available for patent-protected drugs by 13.4%, enabling a price rise of this magnitude if the number of scripts remains the same. Australia, in common with many countries, will experience significant patent expiries for popular drugs over the next 5-10 years. CSES has estimated the impact this will have on the stock of off-patent drugs and the extent of opportunities for further PBS cost savings once this has occurred. Dividing the patent-protected drugs listed in 2001-02 into categories based on their year of patent expiry, and using some simple assumptions about their future demand patterns based on historical PBS growth trends, the total cost of each cohort of drugs was estimated for each of the years from 2001-02 to 2008-09. This enabled an estimate of the stock of off-patent drugs to be calculated for each year (Table 3), as well as an estimate of the value of savings obtained by applying price reductions to these drugs as they come off patent. A 20% reduction in the price of off-patent drugs would generate total savings of $222.5 million over the period to 2008-09, with about $100.9 million of this occurring in 2005-06. 3. The Global Context Understanding the operations of the PBS and its consequences for pharmaceutical markets is important as a prerequisite for informed policy development in Australia. However the PBS has wider significance because various aspects of the Scheme, in particular the use of economic analysis in price setting and listing decisions, have been used as a model for the development of pharmaceutical systems in other countries, such as NICE in the UK and Pharmac in New Zealand. It is important therefore to consider the PBS and Australian pharmaceutical markets in a global context, in order to get some idea of what impact PBS-style features might have if more broadly adopted in other countries. There has developed a significant literature describing pharmaceutical regulation, insurance and cost-containment systems in individual countries and comparing systems within groups of countries (e.g. EC/LSE 2004; Ess et al. 2003; Jacobzone 2000; Kanavos 2001). In addition there is a range of studies linking aspects of these systems to pharmaceutical market outcomes, such as prices, availability of drugs, launch delays, and extent of competition (e.g. Danzon 1997; Danzon and Chao 2000a, 2000b, 2000c; Danzon and Furukawa 2003; Ionnades-Demos et al. 2002; Kyle 2003; Mrazek 2001; Pammolli et al. 2002; Productivity Commission 2001; Rawson 2002; Schmidt et al. 2001). While these studies show broadly that countries with strong cost-containment policies usually have lower prices than those with freer markets, outcomes seem to depend heavily on the particular features of each individual country.
Centre for Strategic Economic Studies
10
Until recently, Australian programs to support the development of the pharmaceutical and biotechnology industries have compensated price suppression under the PBS in return for activities to promote increased exports, local production, and R&D.
In 2002, the Australian Government asked the Productivity Commission (PC) to evaluate these programs (Productivity Commission 2003), and the recommendations arising from this study were instrumental in the design of a new program, the Pharmaceuticals Partnerships Program (P3) which severs the link between industry assistance and participation in the PBS, and concentrates on the commercialisation of pharmaceutical and biotechnology R&D.
Prior to its evaluation, the PC undertook a research study examining the differences between the prices of the 150 top selling pharmaceuticals listed under the PBS and the prices of the same items in comparable overseas countries (Productivity Commission 2001). Their principal findings were that:
• the prices of new innovative drugs in Australia are broadly similar to other countries, except for the USA and to a lesser extent the UK;
• the prices of ‘me-too’ drugs in Australia are the lowest among the comparison countries, except for New Zealand; and
• the prices of generic drugs in Australia are among the lowest of all countries. The PC analysis covered seven countries – Australia, Canada, France, New
Zealand, Spain, Sweden, United Kingdom and the United States of America and used data from IMS Health for a period around June 2000, supplemented by data obtained from national sources.
The approach used by the PC had a number of limitations, in part dictated by the terms of reference for the study as well as practical matters including the cost of acquiring the dataset and the time available to undertake the analysis.
The results obtained by the PC seem to depend crucially on the way in which drugs were allocated to the three categories of ‘innovative’, ‘me-too’, and ‘generic’, and on the decision to use a ‘form-matching’ approach as the basis for its analysis. This meant that only bilateral comparisons were possible between pairs of countries, rather than direct comparisons among all 7 countries.
In comparing prices for generic drugs, the PC did not differentiate between originator brands that were now off patent from the brands of generic competitors that entered the market after the patent had expired. 3.1 Comparisons of International Pharmaceutical Prices and Systems
CSES has initiated its own comparison of international pharmaceutical prices and the differential impacts that pharmaceutical regulation, insurance and cost-containment systems have on price outcomes.
The preliminary results15 reported below use a dataset based on the 174 molecules with highest sales within the PBS (representing about 80% of total cost in 2000-01). Data on annual sales, units, standard units and prices for all combinations of manufacturer, form, strength, and pack size for these molecules was sourced from IMS Health for 2001. Values were converted to Australian dollars using average exchange rates for 2001. Markets in the comparison group were:
Australia Pharmacy
15 Further details are in Sweeny (2003a).
Centre for Strategic Economic Studies
11
Canada Pharmacy Denmark Pharmacy & Hospital France Pharmacy Germany Pharmacy Italy Pharmacy Japan Pharmacy New Zealand Pharmacy Shanghai Hospital Singapore Pharmacy Spain Pharmacy Sweden Pharmacy & Hospital Switzerland Pharmacy U.K. Pharmacy US Federal Hospital US HMO US Pharmacy
In a similar fashion to the PBS price indexes reported in Section 2, a variety of different formula were calculated with very little difference among them. Table 4 shows direct Laspeyres, Paasche, and Fisher price indexes comparing Australia with each of the other markets.
When measured using the Laspeyres index, Australian prices are lower than all other markets except for New Zealand, while prices in Shanghai, Spain and Singapore are broadly comparable. When using the Paasche index, Australian prices are higher than New Zealand, Shanghai, Singapore and Spain, and close to those in France and Germany.
US HMO and pharmacy prices are much higher than Australian prices although US Federal hospitals are not as high. Canada and Japan have higher price differentials with Australia than do the European countries but not as high as the USA. Except for Switzerland and Spain, the European countries are about 25-45% higher than Australia. Switzerland has prices comparable to those in the USA (although significantly lower when measured with the Paasche index).
The disparity between the Paasche and Laspeyres indexes is greatest for Shanghai, Switzerland, Singapore, New Zealand and US HMO suggesting a pattern of pharmaceutical use in these markets significantly different from that in Australia.
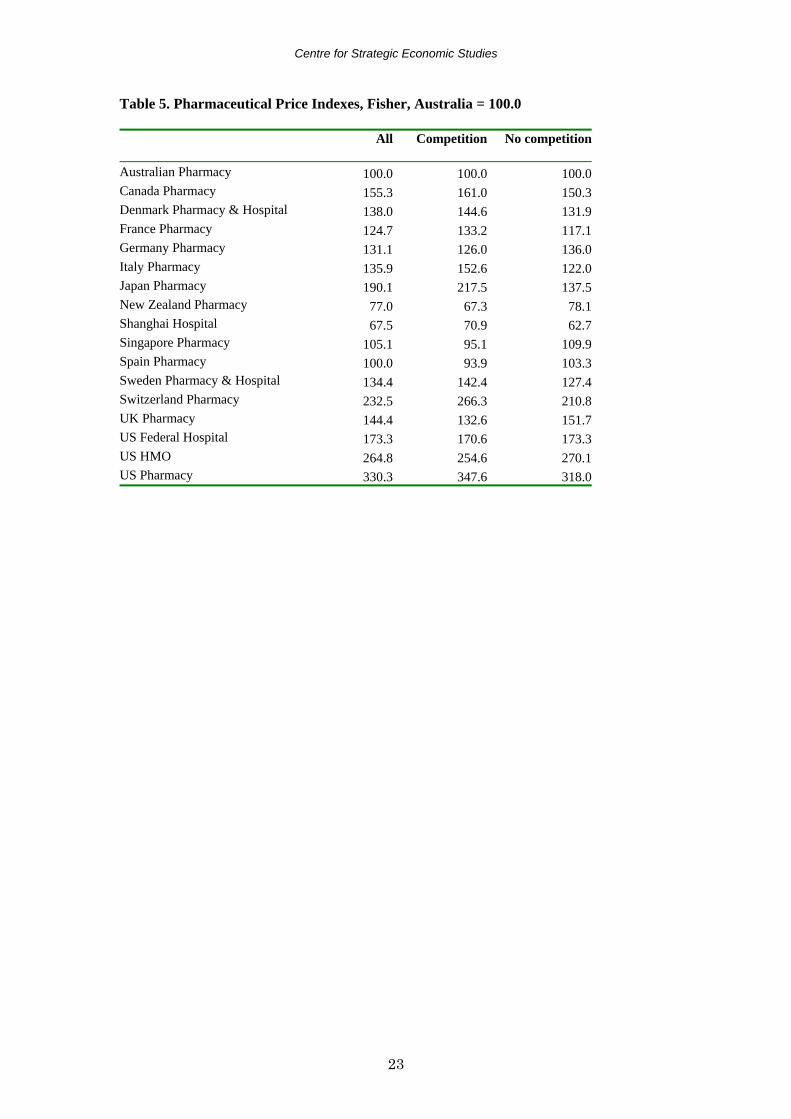
As a summary, Fisher price indexes are shown in Figure 8. Using a number of different sources of information, each molecule was categorised into ‘Molecules with Competition’ or ‘Molecules with No Competition’ based on the presence or absence of non-originator brands of these molecules within the PBS in 2001-02. It should be noted that, at this stage, there is no attempt to separate originator brands from their generic competitors within the category ‘Molecules with Competition’. It should also be recognised that there is no guarantee that the classification given to a molecule in Australia is valid for any other country, ie a molecule may have generic competitors in Australia but not in other countries where it is still protected by patent. In addition comarketing arrangements may vary. Table 5 present Fisher price index comparisons for all molecules, Molecules with Competition and Molecules with No Competition.
Centre for Strategic Economic Studies
12
For Molecules with Competition, Australian prices are lower than all other markets except New Zealand, Shanghai, Singapore, and Spain. This broadly confirms the PC findings for their ‘Generic’ molecules, namely lower prices in New Zealand and Spain. For Molecules with No Competition, Australian prices are the lowest with the exception of New Zealand and Shanghai. Again this is consistent with the PC results for their ‘Me-too’ category of molecules, less so for their ‘Innovative’ category. The price disparity between Australia and other countries is larger for the Molecules with Competition than for the Molecules with No Competition in 9 markets – Canada, Denmark, France, Italy, Japan, Shanghai, Sweden, Switzerland and US Pharmacy, and smaller for 7 markets – Germany, New Zealand, Singapore, Spain, UK, US Federal Hospitals and US HMOs (Table 4). While Australian prices are generally lower than in most other markets, the disparity is not consistently greater or smaller for those molecules facing competition. For the Molecules with Competition, there are wide differences between the Laspeyres and Paasche indexes for Shanghai in particular, but also for Germany, Singapore, Switzerland and US HMOs. For Molecules with No Competition, the difference is less marked. The markets mentioned seem to have quite different patterns of pharmaceutical consumption from Australia and this needs to be borne in mind when making comparisons with these markets. 4. On-going Research Program The research program aimed at better understanding the PBS and Australian pharmaceutical markets and their global context will have three major components for the future. (i) Analysis of PBS Operations The price and quantity index research will be extended by investigating how new approaches in index theory can be applied. As Diewert (2002) has noted, the weighted country product dummy variable approach can be used in the construction of indexes over time and the results of this approach, which uses all the information available (including both new and disappearing drugs), will be compared with that from the chained direct index approach. The impact of various drugs characteristics on price and demand outcomes in the PBS will be investigated. Factors to be considered will include measures of therapeutic worth/innovation, age, and competition from similar drugs and generic equivalents. The effect of the various types of economic evaluation will be traced for individual drugs and in aggregate. Based on the success of drug submissions made between 1991 and 1996, George et al estimate the implied value of a year of life as between A$76,000 and A$42,000. Abelson 2003, however, using other sources of information estimated the value as A$108,000. The effect of using this higher amount in PBS listing decisions will be researched. (ii) Pharmaceuticals and Health Outcomes Studies by Lichtenberg, Cutler and Kadiyala, and others have demonstrated very significant economic benefits from the use of pharmaceuticals. These studies
Centre for Strategic Economic Studies
13
suggest that the economic worth of pharmaceuticals is underestimated in the determinants of price and availability within systems such as the PBS. While there is significant information about health impacts of drugs before they are approved for sale, there is little consistent data about the longer term outcomes from the use of drugs once they have entered the market. Understanding these outcomes requires linking together separate pharmaceutical, medical service and hospital databases, so that patient cohorts can be followed over time. Some progress has been made in this respect in Australia, and the Centre intends further research effort in this area. (iii) The Global Context The comparison of price and quantity indexes will be expanded to a total of about 30 countries and across about 5 years. This should enable a richer picture to be developed of changes in international prices. Aside from the bilateral country comparisons undertaken to date, other techniques such as minimum spanning trees and country product dummy variable approaches will be used. The differentiation among patent-protected, originator and generic brands will be explored as will the effect of different characteristics of drugs (therapeutic worth, age, number of suppliers, extent of market, etc.) and of pharmaceutical systems. Table 6 presents an initial list of these characteristics which will be quantified as far as possible and their effects estimated using regression analysis.
Centre for Strategic Economic Studies
19
Figure 1. PBS Expenditure as Percentage of GDP Figure 2. PBS Cost and Scripts Figure 3. PBS Prices and Overall Consumer Prices Figure 4. Components of PBS Cost Figure 5. Prices for PBS Cohorts Figure 6. Prices for PBS Cohorts
Table 6. Characteristics of Pharmaceutical Systems A. Patent Protection
• Strength • Length of patent protection period • Parallel importation allowed • Compulsory licensing allowed
B. Pharmaceutical Subsidy/Insurance Arrangements
• Extent of coverage – universal/partial • Extent of formulary • Positive or negative list • Presence or absence of industry development objectives • Nature of coverage – public or private schemes • Eligibility for subsidy • Type of co-payment – fixed, proportional • Size of co-payment • Extent of safety net arrangements
C. Cost-containment Policies
(i) Price and Profit Controls Extent of reimbursement pricing Reimbursement pricing methods
• Economic evaluation – cost-minimisation, cost-effectiveness, cost-benefit, cost-utility. Cost of production, prices in comparable countries, price/volume agreements
• Reference pricing – extent of reference group : patented/generic; lowest price or average price: other factors – production costs, degree of innovation, price-volume agreements
• International price benchmarking • Direct price and profit controls – price approval for all drugs (not just subsidised) prior
to marketing; profit controls Price freezes Across-the-board price reductions Fixed budgets for companies Fixed overall budget Volume controls – restricting repeats, indications, authorisation Performance requirements – local employment, production, R&D (ii) Other Cost Containment Measures Altering incentives for
• Pharmaceutical evaluation process – fast/slow; approvals for generics • Marketing costs – advertising DTC • Liability costs • Industry policy
Centre for Strategic Economic Studies
25
References Abelson, Peter 2003, ‘The Value of Life and Health for Public Policy’, Economic Record, vol.
79, special issue, June, S2-S13. Barlett, Donald L and Steele, James B 2004, ‘Why America Pays So Much for Drugs’, Time,
February 2, pp. 41-48. Berndt, Ernst R 2004, ‘Unique Issues Raised By Drug Benefit Design’, Health Affairs, vol. 3,
no. 1, 103-106. Berndt, Ernst R, Cutler, David M, Frank, Richard G, Griliches, Zvi, Newhouse, Joseph P, and
Triplett, Jack E 1998, ‘Price Indexes for Medical Care Goods and Services: An Overview of Measurement Issues’, NBER, Working Paper 6817, November.
Centre for Strategic Economic Studies 2003, ‘The Value of Medicines and Australian Pharmaceutical Pricing Policy: A Case Study of AIIRAs’, CSES, Melbourne, May.
Centre for Strategic Economic Studies 2004, ‘Savings in the Cost of the PBS from Reducing the Price of Off-Patent Drugs’, CSES, Melbourne, January.
Cutler Richard and Kadiyala Srikanth 2001, ‘The Return to Biomedical Research: Treatment and Behavioral Effects’, in Kevin M. Murphy and Robert H. Topel, (eds), Exceptional Returns, University of Chicago Press, Chicago.
Danzon, Patricia M 1997, ‘Pharmaceutical Price Regulation National Policies versus Global Interests’, The AEI Press, Washington.
Danzon, Patricia M and Chao, Li-Wei 2000a, ‘Cross-national price differences for pharmaceuticals: How large, and why?’, Journal of Health Economics, vol. 19, pp159-195.
Danzon, Patricia M and Chao, Li-Wei 2000b, ‘Does Regulation Drive Out Competition in Pharmaceutical Markets?’, Journal of Law and Economics, vol. 43, October, pp. 311-357.
Danzon, Patricia M and Chao, Li-Wei 2000c, ‘Prices, Competition and Regulation in Pharmaceuticals: A Cross-National Comparison’, Office of Health Economics, London, June.
Danzon, Patricia M and Furukawa F 2003, ‘Prices and Availability of Pharmaceuticals: Evidence from Nine Countries’, Health Affairs Web Exclusive, 29 October, W3 pp. 521-536.
Department of the Treasury, ‘Intergenerational Report 2002-03’, Budget Paper No 5, Commonwealth of Australia, Canberra.
Diewert, W Erwin 2002, ‘Weighted Country Product Dummy Variable Regressions and Index Number Formulae’, Discussion Paper No 02-15, Department of Economics, University of British Columbia, September.
Ess, Silvia M, Schneeweiss, Sebastian and Szucs, Thomas D 2003, ‘European Healthcare Policies for Controlling Drug Expenditure’, Pharmacoeconomics vol. 21, no. 2, pp. 89-103.
European Commission/London School of Economics 2004, ‘LSE Study on healthcare in individual countries: Worldwide survey on pharmaceutical pricing and reimbursement structures’, G10 Medicines, European Commission, available at pharmacos.eudra.org/F3/g10/p6.htm (accessed 13.02.04).
Frank, Richard E, Berndt, Ernst R and Busch, Susan H 1999, ‘Price Indexes for the Treatment of Depression’, in Triplett, Jack E (ed.), Measuring the Prices of Medical Treatments, Brookings Institution.
George, Bethan, Harris, Anthony and Mitchell, Andrew 1997, ‘Reimbursement Decisions and the Implied Value of Life: Cost Effectiveness Analysis and Decisions to Reimburse Pharmaceuticals in Australia 1993-1996’, Paper at Nineteenth Australian Conference of Health Economists, Melbourne, July.
George, Bethan, Harris, Anthony and Mitchell, Andrew 2001, ‘Cost-Effectiveness Analysis and the Consistency of Decision Making Evidence from Pharmaceutical Reimbursement in Australia (1991 to 1996)’, Pharmacoeconomics, vol. 19, no. 11, pp. 1103-1109.
Centre for Strategic Economic Studies
26
Henry, David and Lopert, Ruth 1999, ‘Pharmacoeconomics and Policy Decisions : The Australian Health Care System’, Clinical Therapeutics, vol. 21, no. 5, pp. 909-915.
Hill, Suzanne, Henry, David, Pekarsky, Brita and Mitchell, Andrew 1997, ‘Economic evaluation of pharmaceuticals: What are reasonable standards for clinical evidence, the Australian experience’, British Journal of Clinical Pharmacology, vol. 44, pp. 421-425.
Ioannides-Demos, Lisa L, Ibrahim, Joseph E, and McNeil, John J 2002, ‘Reference Based Pricing Systems: Effect on Pharmaceutical Expenditure, Resource Utilisation and Health Outcomes’, Pharmacoeconomics, vol. 20, no. 9, pp. 577-591.
Jacobzone, S 2000, ‘Pharmaceutical Policies in OECD Countries: Reconciling Social and Industrial Goals’, Labour Market and Social Policy Occasional Papers No 40, OECD, Paris.
Johnston, Mark and Zeckhauser, Richard 1991, ‘The Australian Pharmaceutical Subsidy Gambit: Transmuting Deadweight Loss and Oligopoly Rents to Consumer Surplus’, NBER Working Paper No 3783.
Kanavos, Panos 2001, ‘Overview Of Pharmaceutical Pricing And Reimbursement Regulation In Europe’, European Commission, November.
Kyle, Margaret K 2003, ‘Pharmaceutical Price Controls and Entry Strategies’, NBER Summer Institute, July.
Lichtenberg, Frank 2001, ‘Are the Benefits of Newer Drugs Worth Their Cost? Evidence From The 1996 MEPS’, Health Affairs, September/October.
Lopert, Ruth, Lang, Danielle L, Hill, Suzanne R, and Henry, David A 2002, ‘Differential pricing of drugs: a role for cost-effectiveness analysis?’, The Lancet, vol. 359, June15, pp. 2105-2107.
McManus, Peter, Birkett, Donald, Dudley, John and Stevens, Alan 2001, ‘Impact of the Minimum Pricing Policy and introduction of brand (generic) substitution into the Pharmaceutical Benefits Scheme in Australia’, Pharmacoepidemiology and Drug Safety, vol. 10, pp. 295-300.
McManus, Peter, Donnelly, Neil, Henry, David, Hall, Wayne, Primrose, John and Lindner, Julie 1996, ‘Prescription Drug Utilization Following Patient Co-Payment Changes in Australia’, Pharmacoepidemiology and Drug Safety, vol 5, pp. 385-392.
Mrazek, Monique Francine 2001, ‘The Impact of Differing Regulatory Frameworks on Post-Patent Pharmaceutical Markets in the United Kingdom, United States and Germany 1990 to 1997’, unpublished PhD thesis, London School of Economics and Political Science, February.
Newhouse, Joseph P, ‘How Much Should Medicare Pay For Drugs’, Health Affairs, vol. 3, no. 1, pp. 89-102.
Pammolli, Fabio, Magazzini, Laura and Orsenigo, Luigi 2002, ‘The Intensity of Competition after Patent Expiry in Pharmaceuticals. A Cross-Country Analysis’, Revue D’Economie Industrielle, no. 99, 2nd trimester, pp. 107-131.
Pharmaceutical Benefits Pricing Authority 2003, ‘Procedures and Methods’, PBPA, Canberra. Productivity Commission 2001, ‘International Pharmaceutical Price Differences’, Research
Report, Productivity Commission, Canberra. Productivity Commission 2003, ‘Evaluation of the Pharmaceutical Industry Investment
Program’, Research Report, Canberra. Rawson, Nigel S B 2000, ‘Time required for approval of new drugs in Canada, Australia,
Sweden, the United Kingdom and the United States in 1996-1998’, Canadian Medical Association Journal, vol. 162, no. 4, February 22, pp. 501-504.
Schmidt, Franziska, Egler, Martin and Geursen, Robert G 2001, ‘Ramsey Pricing as an Explanation and Justification for Price Differences in the European Pharmaceutical Market’, Drugs Made in Germany, vol. 44, no. 3, pp. 61-66.
Sweeny, K 2002, ‘Trends in the Use and Cost of Pharmaceuticals Under the Pharmaceutical Benefits Scheme’, Pharmaceutical Industry Project Working Paper No. 5, Centre for Strategic Economic Studies, Melbourne.
Sweeny, K 2003a, ‘A Comparison of International Pharmaceutical Prices: Preliminary Results’, Centre for Strategic Economic Studies, Melbourne.
Centre for Strategic Economic Studies
27
Sweeny, K 2003b, ‘Price and Quantity Trends in the Pharmaceutical Benefits Scheme’, Pharmaceutical Industry Project Working Paper No. 14, Centre for Strategic Economic Studies, Melbourne.