36
Australia’s Energy Sector: The State of the Market Steve Edwell, AER Chairman CEDA, 29 August 2007

Australia’s Energy Sector: The State of the Market
Steve Edwell, AER ChairmanCEDA, 29 August 2007

Overview
• New AER functions
• Electricity and gas prices
• Industry consolidation

AER roleNow:
electricity transmissionNational Electricity Market monitoringNational Electricity Law enforcement
Early 2008: addgas transmissionelectricity and gas distribution
Late 2008: add retailconsumer protection, retailer of last resort etcretail price regulation at discretion of each jurisdiction

Regulatory structure post reform
(including NEM and Gas Code regulation)
ERAUCAustralian Energy Regulator (AER)
Australian Competition and Consumer Commission (ACCC)Competition Regulation
WANTTasACTQLDSAVicNSW
ERAUCOTTER/ GPOCICRCOffice of EnergyESCESCIPARTRetail Pricing
Wholesale
Transmission
Distribution
Retail
AEMCAEMCAustralian Energy Market Commission (AEMC)
Rule Changes

Energy prices

Electricity price update
• Price shocks in 2007
• Impacts– Forward market– Retail sector– Investment
• AER monitoring

Weekly electricity prices
NEM prices March 2006 – August 2007 (weekly volume weighted averages)
0
50
100
150
200
250
300
350
400
450
Mar
–06
Apr
–06
May
–06
Jun–
06
Jul–
06
Aug
–06
Sep
–06
Oct
–06
Nov
–06
Dec
–06
Jan–
07
Feb–
07
Mar
–07
Apr
–07
May
–07
Jun–
07
Jul–
07
Aug
–07
$/M
Wh
NSW Qld SA Tas Vic

Drought
Water shortages:• Snowy dams• Tasmanian and Vic hydro• Queensland coal plant
Impact: tighter supply conditions, higher prices

Market under stress in June 2007
• Record prices: 42 price events above $5000 • Retailers under pressure
– High prices squeezing margins– Energy One withdrew from the market– Momentum sold 15,000 customer accounts
• Some major users under pressure

Why the high June prices?
• Continuing drought conditions
• Flood impacts on Hunter Valley coal supplies
• High demand
• Macquarie Generation bidding

Forward prices
0
25
50
75
100
125
150
Q2 07 Q3 07 Q4 07 Q1 08 Q2 08 Q3 08 Q4 08 Q1 09 Q2 09 Q3 09 Q4 09 Q1 10 Q2 10 Q3 10 Q4 10
$/M
Wh
NSW June 07 NSW Feb 07 NSW Aug 07

Higher forward prices — why?
• Uncertainty about future supply– risk of persistent drought?– timing of investment response?– uncertain effects of carbon trading on
investment and prices?

Reliability outlook to 2012
30 000
35 000
40 000
45 000
50 000
55 000
2006–07 2007–08 2008–09 2009–10 2010–11 2011–12
Meg
awat
ts
Proposed scheduled capacity
Non-scheduled generationprojections (summer)
Aggregate scheduled generationcapacity (summer)
Capacity for reliability
Maximun demand

Electricity networks – real investment
0
500
1000
1500
2000
2500
3000
3500
4000
2003-04 2004-05 2005-06 2006-07 2007-08
$m (2
006)
DistributionTransmission

Reliability – distribution
0
50
100
150
200
250
300
350
400
450
1995–96 1997–98 1999–00 2001–02 2003–04 2005–06
Min
utes
Victoria NSW & ACT Queensland South Australia NEM Ave.

Gas prices

Natural gas prices
Historical prices around $2.25–$4.00/Gj
WA prices rising sharply since 2006
Victorian spot prices creeping higher
$0.00
$1.00
$2.00
$3.00
$4.00
$5.00
$6.00
EastQld
Vic NSW EastCoast
Qld-SA
WA NT
2005 2006
$/G
J
2007
2007

Western Australia
• Prices up from $2.50 to $7.50/Gj since 2006
• Tight supply• Competition from LNG exports• High prices attracting new entry, but tight
supply may persist for some time

East Coast gasDownward pressure on prices
– Coal seam methane increases supply
Upward pressure on prices– Increasing demand – electricity generation– Santos LNG proposal for export capability ?
Net impact?– Price rises contained for now – $3.00 to $4.00 range– Victoria prices reached $5 this winter– Longer term risks

Coal seam methane production
0102030405060708090
1996 1998 2000 2002 2004 2006
NSW
Qld
PJ

Ownership consolidation

Energy sector mergers
• Networks
• Retailers
• Vertical integration

Recent merger activity
• AGL and TRUenergy swap generation assets in SA — AGL acquires Torrens Island (1260MW)
• Sale of Origin Energy’s gas assets to APA group
• Sale of Alinta to Babcock & Brown / Singapore Power
• International Power to buy EnergyAustralia–IP retail partnership
• Basslink sale
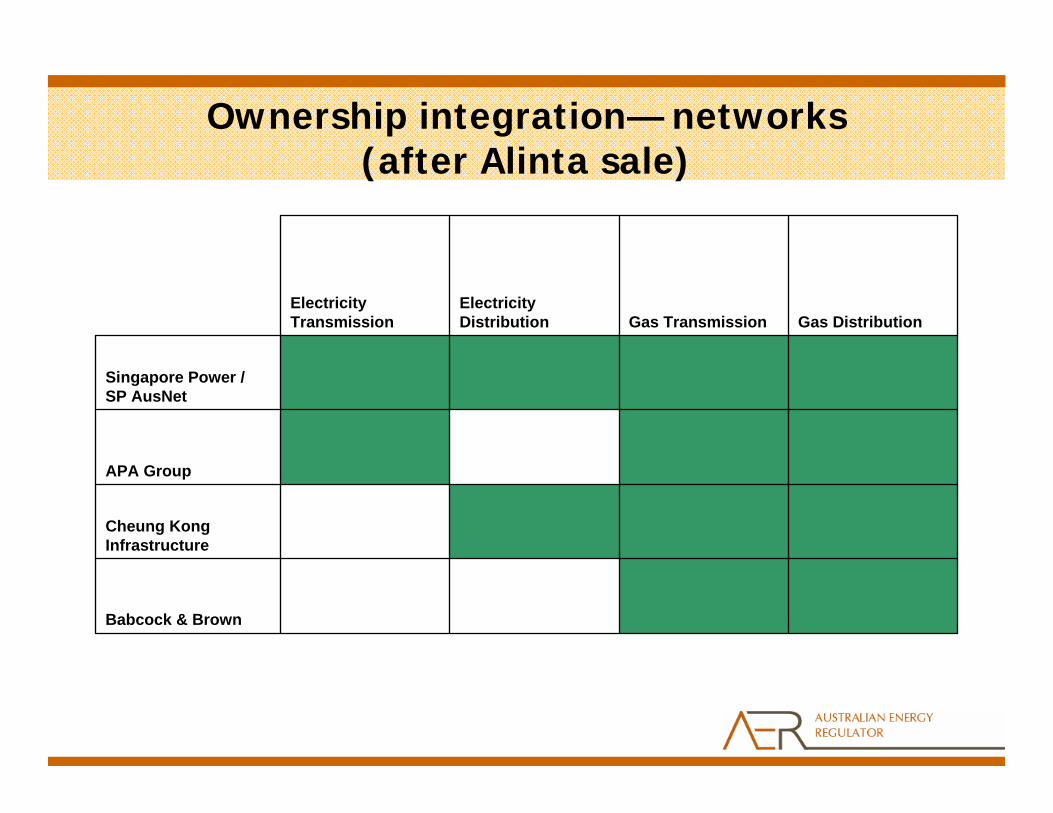
Ownership integration— networks (after Alinta sale)
Cheung Kong Infrastructure
Babcock & Brown
APA Group
Singapore Power / SP AusNet
Gas DistributionGas TransmissionElectricityDistribution
ElectricityTransmission

Retail market share – Vic/SA
AGL AGL
AGL
AGL
Origin Origin
Origin
Origin
TRUenergyTRUenergy
TRUenergy
OtherOther
TRUenergyEnergy Australia Energy Australia
Other
0%
10%
20%
30%
40%
50%
60%
70%
80%
90%
100%
Electricity Gas Electricity Gas
Victoria South Australia
% o
f sm
all b
usin
ess
& d
omes
tic c
usto
mer
s
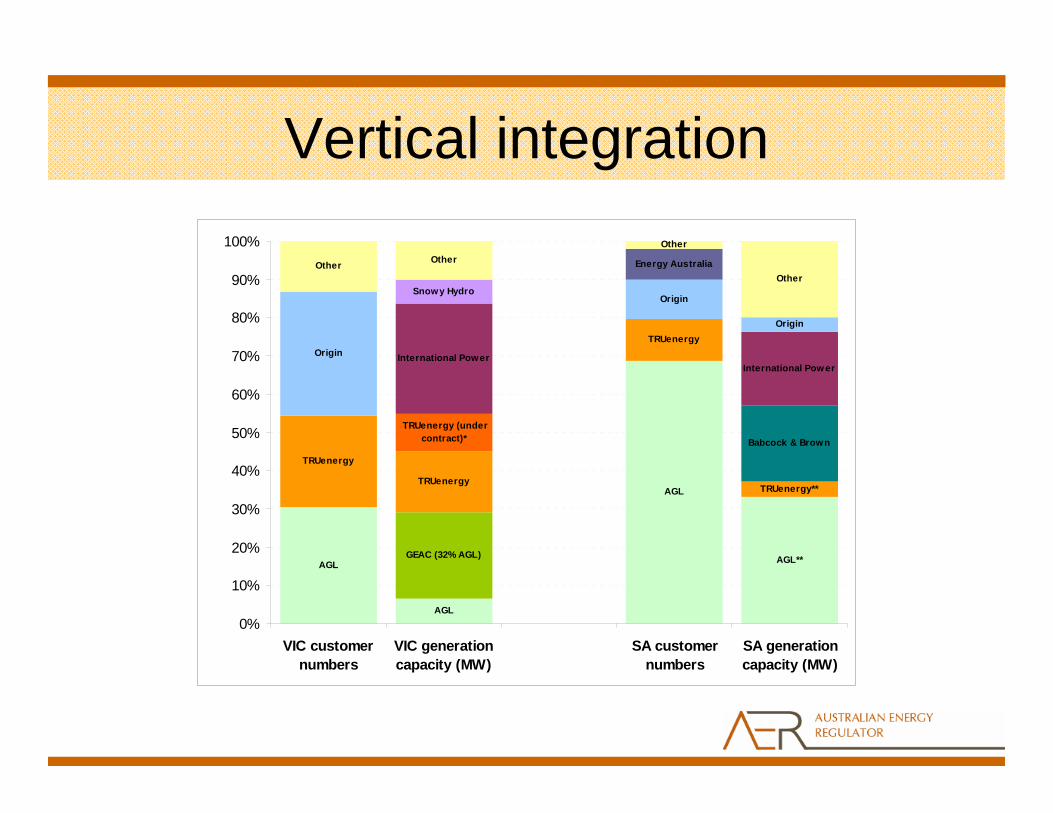
Vertical integration
AGL
AGL
AGL
GEAC (32% AGL)
TRUenergy
TRUenergy
TRUenergy
Babcock & Brown
International PowerInternational Power
Snowy Hydro
Origin
Origin
Origin
Energy AustraliaOther OtherOther
Other
AGL**
TRUenergy**
TRUenergy (under contract)*
0%
10%
20%
30%
40%
50%
60%
70%
80%
90%
100%
VIC customernumbers
VIC generationcapacity (MW)
SA customernumbers
SA generationcapacity (MW)

State of the Energy Market

AER’s new functions
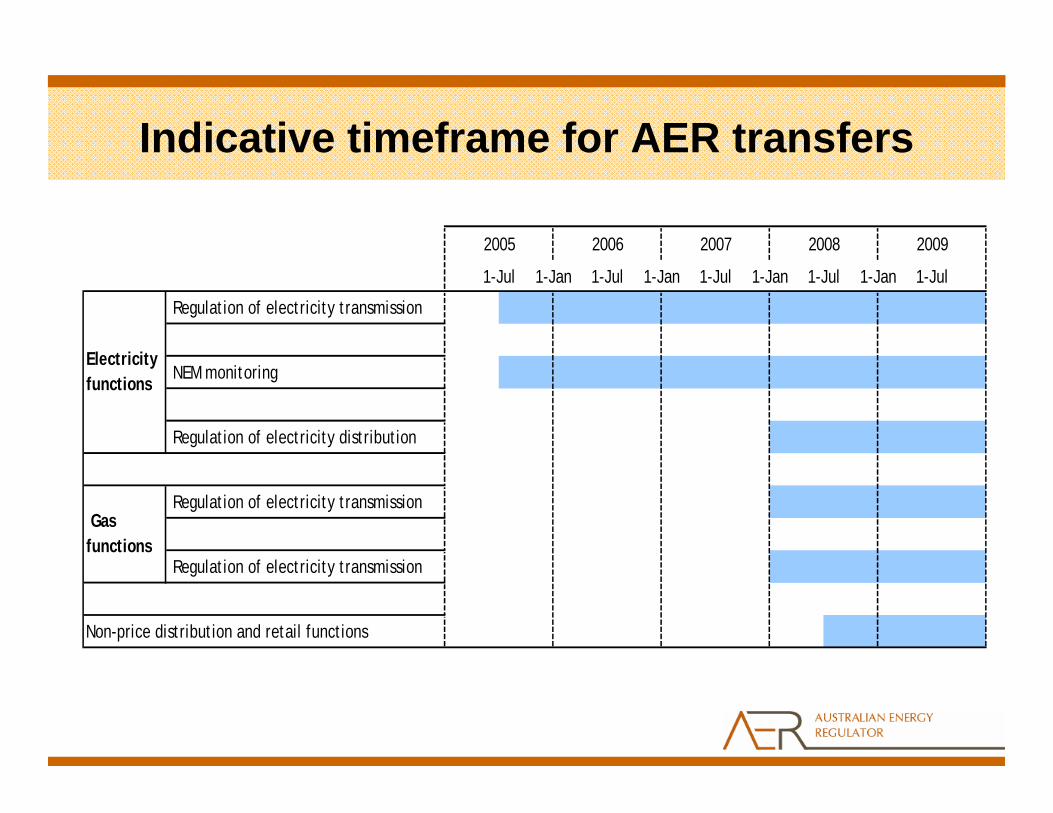
Indicative timeframe for AER transfers
Regulation of electricity transmission
NEM monitoring
Regulation of electricity distribution
Regulation of electricity transmission
Regulation of electricity transmission
Non-price distribution and retail functions
Electricity functions
Gas functions
1-Jan 1-Jul
2007 2008 2009
1-Jan 1-Jul 1-Jan 1-Jul
2005
1-Jul 1-Jan
2006
1-Jul
ElectraNet, SA, ET
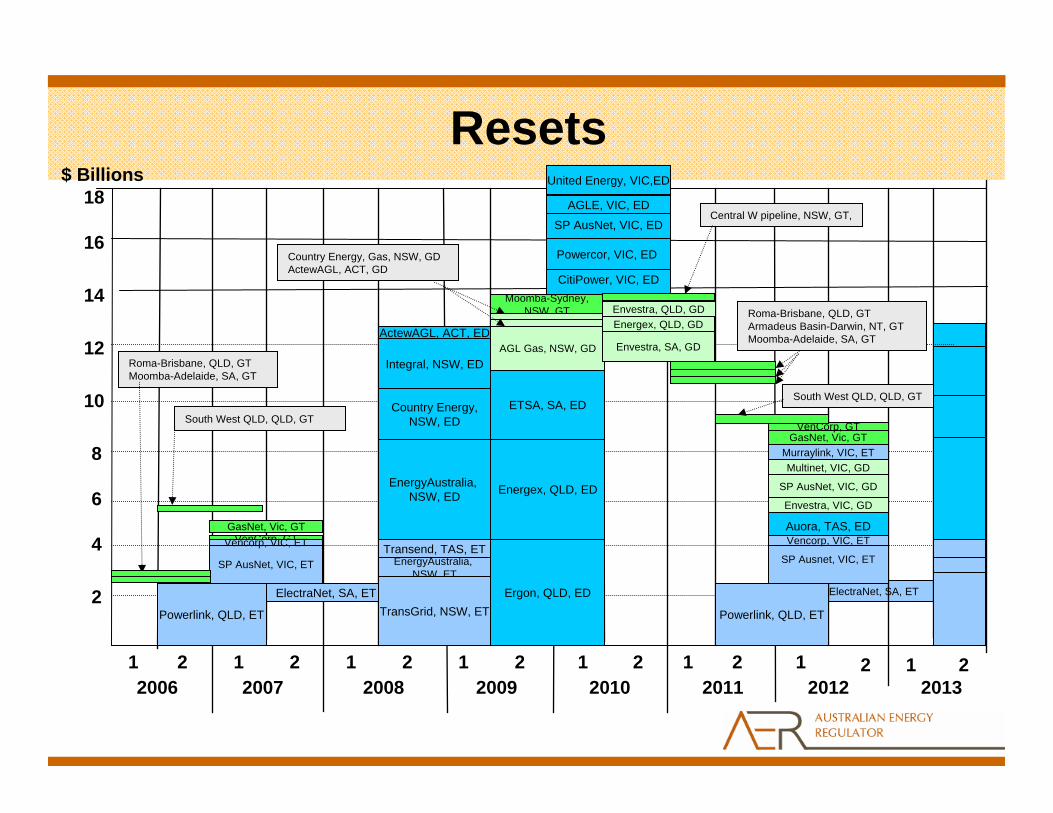
Resets
2010 201120082007 20092006 2012
2
6
4
8
10
12
14
16
18
20131 2 121 2 1 2 1 2 1
SP AusNet, VIC, ET
Powerlink, QLD, ET
Roma-Brisbane, QLD, GTMoomba-Adelaide, SA, GT
GasNet, Vic, GT
ElectraNet, SA, ET
Moomba-Sydney,NSW, GT
ActewAGL, ACT, ED
Country Energy,NSW, ED
Integral, NSW, ED
EnergyAustralia, NSW, ED
EnergyAustralia, NSW, ET
TransGrid, NSW, ET
Transend, TAS, ET
ETSA, SA, ED
Country Energy, Gas, NSW, GDActewAGL, ACT, GD
AGL Gas, NSW, GD
Energex, QLD, ED
SP AusNet, VIC, ED
AGLE, VIC, ED
CitiPower, VIC, ED
Powercor, VIC, ED
Central W pipeline, NSW, GT,
Roma-Brisbane, QLD, GTArmadeus Basin-Darwin, NT, GTMoomba-Adelaide, SA, GT
VenCorp, GT
Ergon, QLD, ED
2 21 1 2
Auora, TAS, ED
Powerlink, QLD, ET
SP Ausnet, VIC, ET
Vencorp, VIC, ET
Envestra, VIC, GD
SP AusNet, VIC, GD
Multinet, VIC, GDMurraylink, VIC, ET
Vencorp, VIC, ET
Envestra, QLD, GD
United Energy, VIC,ED
South West QLD, QLD, GT
GasNet, Vic, GTVenCorp, GT
South West QLD, QLD, GT
Energex, QLD, GD
Envestra, SA, GD
$ Billions

AER regulatory portfolio
Sector Number of regulated businesses / pipleines
Combined regulated asset base
Electricity transmission 9 $11 billion
Electricity distribution 13 $28 billion
Gas transmission 14 $3 billion
Gas distribution 11 $6 billion
47 $48 billion

New regulatory framework
• More prescriptive framework – certainty • Electricity & gas more aligned• Merit review extended to electricity• Light regulation option in gas• Tighter timeframes• Information powers stronger – and more
accountable

Preparation for new functions
• Internal capacity– Budget secured– Increase in staff numbers– Transfer of staff from the state regulators
• Regulatory guidelines – transmission and distribution
• Preparation for NSW resets
• Industry consultation

Objectives
• Committed to smooth transition to national framework
• Keen to pursue ways to improve the quality of regulation. Looking at:– consistent and timely processes established well up
front– streamlining implementation requirements through
standard information templates– ways to make regulation less intrusive but still robust– ways to effectively engage stakeholders

Conclusions
• AER is well prepared for transition to national regulation
• Electricity price shocks in 2007, but market has eased since July
• Gas prices rising in WA; price pressure in the east cushioned by CSM
• Extensive ownership consolidation• Strong investment and steady reliability in
regulated networks

Questions?


