Enclosure performance: Ultrafine particles (UFPs) and volatile organic compounds (VOCs) removal efficiency of desktop 3D printer enclosures
Filament: ABS White
Printer: UP Box +
Authors: Parham Azimi, Ph.D., Brent Stephens, Ph.D., Department of Civil, Architectural, and Environmental Engineering, Built Environment Research Group (http://built-envi.com), Illinois Institute of Technology
Summary:
The goal of this work is to evaluate the effectiveness of a desktop 3D printer enclosure and 100% recirculating HEPA filtration system for reducing emissions of ultrafine particles (UFPs, or particles <100 nm) and speciated volatile organic compounds (VOCs) while printing a standardized test part with a polymer filament (ABS).
Methods:
We conducted controlled environmental chamber testing following methods described in Azimi et al. (2016) Environ Sci Technol 50(3):1260-1268. All measurements were conducted inside a well-mixed 3.6 m3 stainless steel chamber. The 3D printer bed was prepared for printing before sealing the chamber by applying small amounts of adhesive from glue sticks following manufacturer recommendations. We printed a 10×10×1 cm standardized sample from the National Institute of Standards and Technology (NIST), as shown in Figure 1. The UFP and speciated VOC emission rates were measured under various control system scenarios including: (1) open enclosure without the filtration system operating, (2) closed enclosure without the filtration system operating, and (3) closed enclosure with the filtration system operating. The printer is shown in Figure 2 (with and without the enclosure in use) and the HEPA filter cartridge is shown in Figure 3.
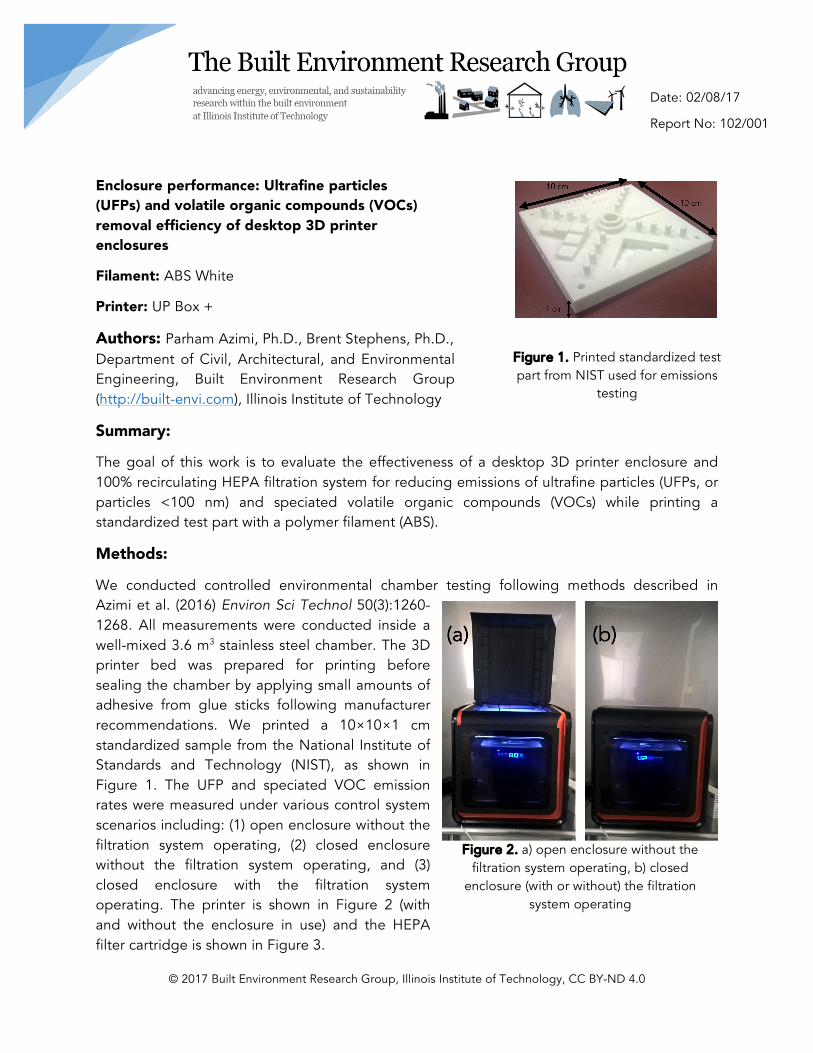
Figure 1. Printed standardized test part from NIST used for emissions
testing
Figure 2. a) open enclosure without the filtration system operating, b) closed
enclosure (with or without) the filtration system operating
Figure 3. 100% recirculating HEPA filtration system inside the tested desktop 3D printer
Results:
UFP emissions
Figure 4a shows time-varying total UFP concentrations resulting from each of the three test conditions and Figure 4b shows estimates of time-varying total UFP emission rates from each condition. The left guideline in Figure 4a shows the moment that the printer began printing and the second guideline shows the moment that the printer stopped printing. The data smoothing method (SM) that was used and the corresponding coefficient of determination (SM-R2) are shown in Figure 4a. The error bars in Figure 4b show an estimated ~45% uncertainty in the UFP emission rate estimates. The number of negative estimated emissions (NNEE) is also provided in Figure 4b.
Figure 4. a) Time-varying UFP concentrations inside the chamber during background, printing, and decay time periods for (i) open enclosure without the filtration system operating (SM-R2: 0.97; total loss
rate: 1.4 1/hr) (ii) closed enclosure without the filtration system operating (SM-R2: 1.00; total loss rate: 1.4 1/hr), , and (iii) closed enclosure with the filtration system operating (SM-R2: 0.99; total loss rate: 1.3 1/hr) and b) estimates of time-varying UFP emission rates during the printing period for the same 3 scenarios
Table 1 summarizes the estimated UFP emission rates from each of the three test scenarios. In all cases, the UFP concentration in the chamber increased rapidly once the printing period began and then decreased during the rest of the printing period, although the peak was lowest during the “closed enclosure with the filtration system operating” scenario. The total number of emitted UFPs during the printing period for the “open enclosure without filtration system”, “closed enclosure without filtration system”, and “closed enclosure with filtration system” scenarios were 2.6×10¹¹, 6.7×10¹⁰, and 2.2 ×10¹⁰, respectively. These results demonstrate that the total number of UFPs emitted was reduced by ~74% with the enclosure alone and by ~91% with the combination of the enclosure and filtration system operating.
Table 1. Summary of total UFP emission rate results
Table 2 summarizes estimates of individual speciated VOC and ΣVOC emission rates (i.e., the sum of the emission rates of the top 5 speciated VOCs with the highest individual emission rates) in the 3 test conditions. Table 2 demonstrates that “Styrene”, “Ethylbenzene” and “Benzene, 1,2,3-trimethyl” have the highest individual VOC emission rates from the tested filament in all case scenarios but that ΣVOC emissions in the three combinations were low relative to an average of ~67 µg/min from 15 printer and filament combinations reported in Azimi et al. (2016). Table 2 also shows the reductions in speciated VOC emission rates that were achieved by using the closed enclosure both with and without the filtration system operating compared to the open enclosure scenario. The VOC reduction results demonstrate that the enclosure alone does not appear to reduce VOC emissions (and actually appears to increase by an average of 50%), while the filtration system appears to reduce VOC emissions by approximately 20%. However, a difference of 20% is within our estimated measurement uncertainty of ~36%, so these results should not be taken as definitive.


![[Nordic Built Challenge 17.12.2013] Trine Pertou Mach, Nordic Built: Nordic Built](https://static.documents.pub/doc/80x56/547174dcb4af9f980a8b4ad9/nordic-built-challenge-17122013-trine-pertou-mach-nordic-built-nordic-built.jpg)


