Automated Classification of Usual Interstitial Pneumonia UsingRegional Volumetric Texture Analysis in High-Resolution
Computed Tomography
Adrien Depeursinge, PhD,*† Anne S. Chin, MD,* Ann N. Leung, MD,* Donato Terrone, MD,*
Michael Bristow, MD,* Glenn Rosen, MD,* and Daniel L. Rubin, MD, MS*‡
1
s-
isofano-o-nisthesg-be
x-eati-i-toeddg
s-gor
,
ed-g
tsl-ici-a-thser-icofisn-al
isr-Tc-r-ici-esp-esalt-d-ct
ine-nlyicnesor
Objectives:We propose a novel computational approach for the automated clasification of classic versus atypical usual interstitial pneumonia (UIP).Materials and Methods: Thirty-three patients with UIP were enrolled in thstudy. They were classified as classic versus atypical UIP by a consensus2 thoracic radiologists with more than 15 years of experience using the AmericThoracic Society evidence–based guidelines for computed tomography diagnsis of UIP. Two cardiothoracic fellows with 1 year of subspecialty training prvided independent readings. The system is based on regional characterizatioof the morphological tissue properties of lung using volumetric texture analysof multiple-detector computed tomography images. A simple digital atlas wi36 lung subregions is used to locate texture properties, from which the responsof multidirectional Riesz wavelets are obtained. Machine learning is used to agregate and to map the regional texture attributes to a simple score that canused to stratify patients with UIP into classic and atypical subtypes.Results: We compared the predictions on the basis of regional volumetric teture analysis with the ground truth established by expert consensus. The arunder the receiver operating characteristic curve of the proposed score was esmated to be 0.81 using a leave-one-patient-out cross-validation, with high specficity for classic UIP. The performance of our automated method was foundbe similar to that of the 2 fellows and to the agreement between experiencchest radiologists reported in the literature. However, the errors of our methoand the fellows occurred on different cases, which suggests that combininhuman and computerized evaluations may be synergistic.Conclusions: Our results are encouraging and suggest that an automated sytem may be useful in routine clinical practice as a diagnostic aid for identifyinpatients with complex lung disease such as classic UIP, obviating the need finvasive surgical lung biopsy and its associated risks.
I diopathic pulmonary fibrosis (IPF) is a specific form of progressivfibrosing parenchymal pneumonia of unknown cause and is the lea
ing cause of end-stage lung disease requiring transplantation accountin
eofl-l-the.ne-hozetoisr-es
Received for publication June 7, 2014; and accepted for publication, after revision,October 8, 2014.
From the *Department of Radiology, School of Medicine, Stanford University,Stanford, CA; †Institute of Information Systems, University of Applied SciencesWestern Switzerland (HES-SO), Sierre, Switzerland; and ‡Section on BiomedicalInformatics Research, Department of Medicine, School of Medicine, StanfordUniversity, Stanford, CA.
Supported by the Swiss National Science Foundation (PBGEP2_142283,PZ00P2_154891, and 205320-141300/1) and the National Cancer Institute,National Institutes of Health (U01-CA-142555).
Conflicts of interest and sources of funding: none declared.Supplemental digital contents are available for this article. Direct URL citations appear
in the printed text and are provided in the HTML and PDF versions of this articleon the journal's Web site (www.investigativeradiology.com)
Reprints: Adrien Depeursinge, PhD, Institute of Information Systems, University ofApplied Sciences Western Switzerland (HES-SO), TechnoArk 3, 3960 Sierre,Switzerland. E-mail: [email protected].
for more than 50% of lung transplants. Median survival for patienwith IPF remains dismal at 3 years after diagnosis.2–4 Idiopathic pumonary fibrosis is associated with the histologic and/or radiologpattern of usual interstitial pneumonia (UIP).5,6 Candidates for surgcal biopsy must be carefully selected because the procedure is invsive as well as costly and carries significant risks in patients wipossible UIP. Specifically, an acute exacerbation of their lung diseais an uncommon but potentially fatal complication after biopsy.2 Sugical lung biopsy can be obviated when the clinical and radiographimpressions are typical of UIP.7–10 However, atypical appearancesUIP are common, accounting for 30% to 50% of patients.2,11 In thcontext, candidate selection for lung biopsy requires a multidiscipliary consensus of clinicians and radiologists experienced in intersitilung diseases, found only in specialized centers of practice.
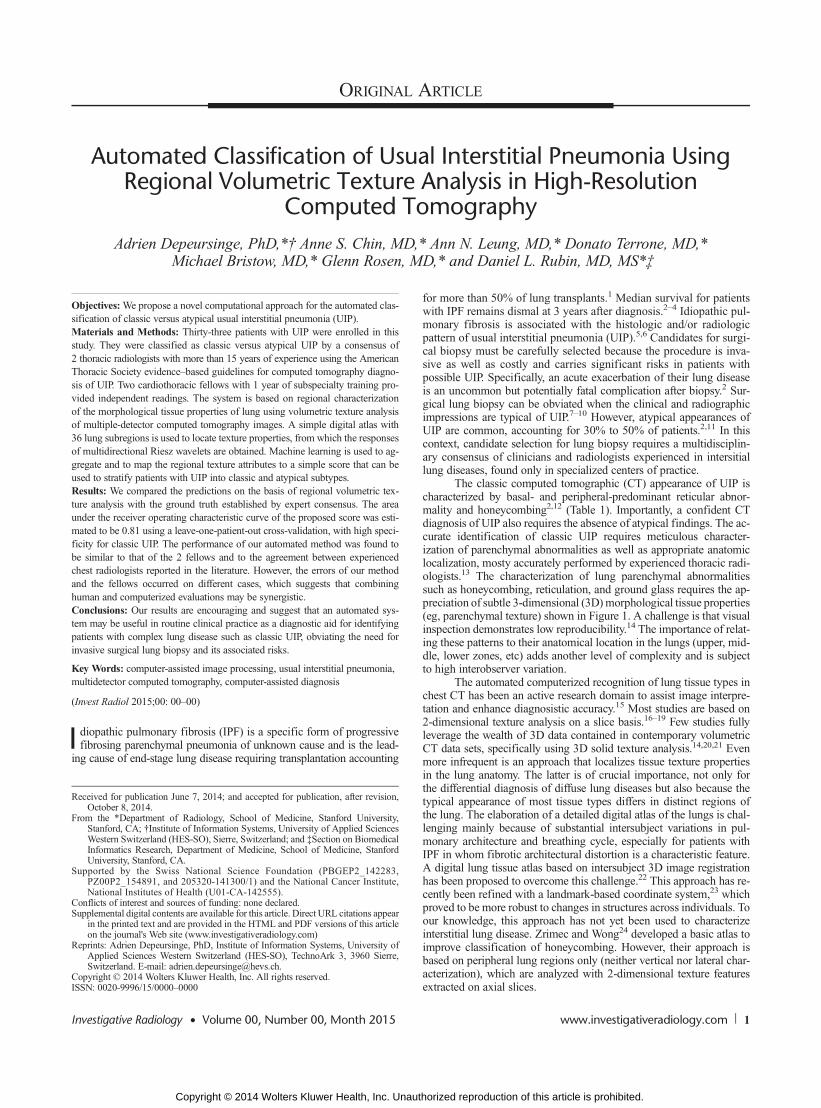
The classic computed tomographic (CT) appearance of UIPcharacterized by basal- and peripheral-predominant reticular abnomality and honeycombing2,12 (Table 1). Importantly, a confident Cdiagnosis of UIP also requires the absence of atypical findings. The acurate identification of classic UIP requires meticulous characteization of parenchymal abnormalities as well as appropriate anatomlocalization, mosty accurately performed by experienced thoracic radologists.13 The characterization of lung parenchymal abnormalitisuch as honeycombing, reticulation, and ground glass requires the apreciation of subtle 3-dimensional (3D)morphological tissue properti(eg, parenchymal texture) shown in Figure 1. A challenge is that visuinspection demonstrates low reproducibility.14 The importance of relaing these patterns to their anatomical location in the lungs (upper, midle, lower zones, etc) adds another level of complexity and is subjeto high interobserver variation.
The automated computerized recognition of lung tissue typeschest CT has been an active research domain to assist image interprtation and enhance diagnosistic accuracy.15 Most studies are based o2-dimensional texture analysis on a slice basis.16–19 Few studies fulleverage the wealth of 3D data contained in contemporary volumetrCT data sets, specifically using 3D solid texture analysis.14,20,21 Evemore infrequent is an approach that localizes tissue texture propertiin the lung anatomy. The latter is of crucial importance, not only fthe differential diagnosis of diffuse lung diseases but also because thtypical appearance of most tissue types differs in distinct regionsthe lung. The elaboration of a detailed digital atlas of the lungs is chalenging mainly because of substantial intersubject variations in pumonary architecture and breathing cycle, especially for patients wiIPF in whom fibrotic architectural distortion is a characteristic featurA digital lung tissue atlas based on intersubject 3D image registratiohas been proposed to overcome this challenge.22 This approach has rcently been refined with a landmark-based coordinate system,23 whicproved to be more robust to changes in structures across individuals. Tour knowledge, this approach has not yet been used to characteriinterstitial lung disease. Zrimec and Wong24 developed a basic atlasimprove classification of honeycombing. However, their approachbased on peripheral lung regions only (neither vertical nor lateral chaacterization), which are analyzed with 2-dimensional texture featurextracted on axial slices.
www.investigativeradiology.com 1
authorized reproduction of this article is prohibited.
Classic UIP (All Required) Inconsistent With UIP (Any)
Peripheral, basal predominance Upper or midlung predominanceReticular abnormality Peribronchovascular predominanceHoneycombing with or without traction bronchiectasis Extensive ground-glass abnormality (extent > reticular abnormality)Absence of features listed as inconsistent with UIP pattern Profuse micronodules (bilateral, predominantly upper lobes)
Discrete cysts (multiple, bilateral, away from areas of honeycombing)Diffuse mosaic attenuation/air trapping (bilateral, in 3 or more lobes)Consolidation in bronchopulmonary segment(s)/lobe(s)
UIP indicates usual interstitial pneumonia.
Depeursinge et al Investigative Radiology • Volume 00, Number 00, Month 2015
In this article, we used a basic anatomic atlas to define and etract morphological tissue properties (ie, 3D texture) from 36 anatomicsubregions of the lung parenchyma. The latter were aggregated to creacomputational models of the radiological phenotypes for classic anatypical UIP. We hypothesized that the characterization of these radilogic phenotypes differentiates the UIP subtypes, specifically classversus atypical UIP. To produce an automated system for this classifiction task, machine learning was used to derive a score from the regiontexture attributes. This score identified patients with typical versus atyical UIP, the latter requiring further evaluation (eg, biopsy) to confirthe diagnosis of IPF. To the best of our knowledge, our work is thfirst attempt to automatically differentiate the UIP subtypes using computational methods.
MATERIALS AND METHODS
Data setComputed tomographic examinations of 33 patients with biops
proven UIP/IPF from Stanford Hospital and Clinics were retrospetively reviewed. The examinations were performed in compliance winational legislation and Declaration of Helsinki guidelines, with instittional review board waiver of informed consent for this retrospectivanalysis. Two thoracic radiologists with more than 15 years of experenceworked in consensus to classify each patient as classic versus atyical UIP on the basis of the American Thoracic Society evidence–baseguidelines for CT diagnosis of IPF/UIP listed in Table 1.1 Therewere 1patients categorized as having a classic UIP and 18 patients with aatypical UIP appearance on CT. Additional readings were performeby 2 cardiothoracic fellows, each having 1-year specialty training to etablish an optimal human performance. A volumetric CT scan wavailable for each patient, which was acquired within the year of thbiopsy-proven diagnosis. The standard routine protocols yielded a computed tomographic dose index of 19.51 ± 8.81 mGy and a dose-lengproduct of 622.11 ± 269.97 mGy·cm. The CT scans were reconstructewith slice thicknesses of 0.625 mm (1), 1 mm (15), 1.25 mm (14), an2 mm (3). The spacings between the slices are 0.6 mm (3), 1 mm (131.25 mm (14), as well as 2 mm (3), and the pixel spacings are in th
FIGURE 1. Common parenchymal appearances of UIP in CT.
range of 0.59 to 0.82 mm. All volumes were resampled to have isotrpic cubic voxels of 0.59 � 0.59 � 0.59 mm3 using cubic spline intepolation. This ensures that the physical dimensions (ie, image scaland directions) are comparable between the patients.
3D Anatomical Atlas of the LungsA simple anatomical atlas of the lung served as a 3D reference
localize the various lung tissue types. The locations were chosen acording to the predominant pattern sites of classic UIP (Table 1). Firsa semiautomated segmentation of the lung volumes was carried owith a graphical user interface.25 The user initiated a region growing agorithm from a seed point placed inside the lungs. The growing 3D rgion mimics the propagation of air in lungs, where each neighborinvoxel is added to the regionMlung if the summed value of its own neigbors differs by less than a threshold value defined by the user. The lunare divided vertically into apical, middle lung, and basal regions on thbasis of the center of mass ofMlung (Table 2). The axial division resulinto central, intermediate, and peripheral lung regions. Left, right, antrior, and posterior regions are defined on the basis of the intersectioof the coronal and sagittal planes. The intersections of all 10 lung divsions results in 36 subregions.
3D Texture Quantification Using Riesz WaveletsThree-dimensional multiscale Riesz filter banks were used
characterize the morphological properties of the lung parenchymavolumetric CT. These filters are advantageous for texture characteriztion because they quantify the local amount of directional image paterns at multiple scales. Second-order Riesz wavelets were used,26,
yielding 6 filters per image scale that are oriented along the main imagdirections X, Y, and Z as well as 3 diagonals XY, XZ and YZ (Fig. 2Likewise, Riesz wavelets allow for a complete coverage of image scaland directions. We hypothesized that the local morpholgical tissuproperties of the normal lung, ground glass, reticulation, and honecombing can be expressed as the combinations of the responses of thoriented filters. The filters were implemented at multiple scales to anlyze both fine morphological structures and coarser reticulations of thlung parenchyma.
Apical, central, basal Peripheral, middle, axial Left, right Anterior, posterior
The lungs are split perpendicularly to 4 axes.25
Images can be viewed online in color at www.investigativeradiology.com.
Investigative Radiology • Volume 00, Number 00, Month 2015 Classification of UIP Using Texture Analysis
Regional Lung Texture AnalysisThe prototype regional distributions of the morphological tissu
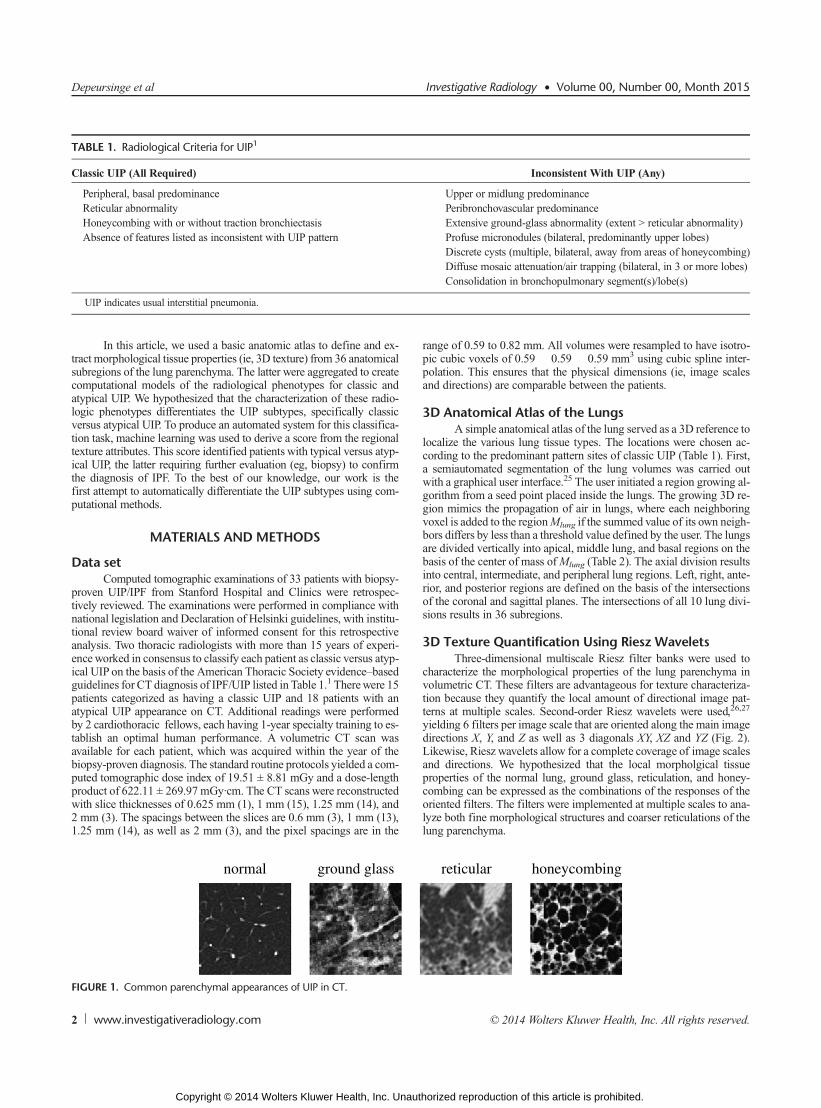
properties of classic versus atypical UIPs were learned using suppovector machines (SVMs). The SVM is a supervised machine learninalgorithm that can learn the complex relationship between a groupvariables (ie, the vector vl) and the presence or absence of a class froan ensemble of examples called the training set.28 Once the SVMmodhas been built from the example cases, it can predict the class of an useen case with a confidence score (called computer score thereinafteThe group of variables feeding SVMs consisted of the responses (ienergies) of the multiscale Riesz filters in each of the 36 anatomical rgions of the lungs (Fig. 3). The size of the vector vl regrouping the rsponses of the 6 Riesz filters at 4 scales from the 36 regions wequal to 864.
To compare Riesz wavelets with other features that could captuthe radiological phenotype of diffuse lung disease, 2 different featugroupswere extracted for each region to provide a baseline performanc15 histogram bins of the gray levels in the extended lung windo[−1000; 600] Hounsfield units (HU) and 3D gray-level co-occurrenmatrices (GLCM).29 Statistical measures from GLCMs are popular teture attributes that were used by several studies in the literature
FIGURE 2. Second-order Riesz filters characterizing edges along the main imonline in color at www.investigativeradiology.com.
characterize the morphological properties of lung tissue associated wiinterstitial lung diseases.16,17,20,21 They consist in counting the coccurrence of voxels with identical gray level values that are separateby a distance d, which results in a co-occurrence matrix. Eleven statistiwere extracted from these matrices29 as texture attributes. The choicofd and the number of gray levels were optimized by considering valuin {−3; 3} and {8, 16, 32}, respectively. The size of the vector of attrbutes vlwas 540 for the gray-level histogram attributes (calledHU therinafter) and 396 for the GLCM attributes.
RESULTSA leave-one-patient-out cross-validation evaluation was used
estimate the performance of the proposed approach. The leave-onpatient-out cross-validation consisted of using all patients but 1 to trathe SVM model and to measure the prediction performance on the rmaining test patient. The prediction performance was then averageover all possible combinations of training and test patients. Receivoperating characteristic (ROC) curves of the system's performanceclassifying between classic and atypical UIP are shown in Figure 4 fdifferent feature groups and their combinations. The ROC curves weobtained by varying the decision threshold between the minimum an
age directions X, Y, Z and 3 diagonals XY, XZ, and YZ. Figure 2 can be viewed
www.investigativeradiology.com 3
authorized reproduction of this article is prohibited.
FIGURE 3. The 36 subregions of the lungs localized the prototype regional distributions of the texture properties. Figure 3 can be viewed online in colorat www.investigativeradiology.com.
Depeursinge et al Investigative Radiology • Volume 00, Number 00, Month 2015
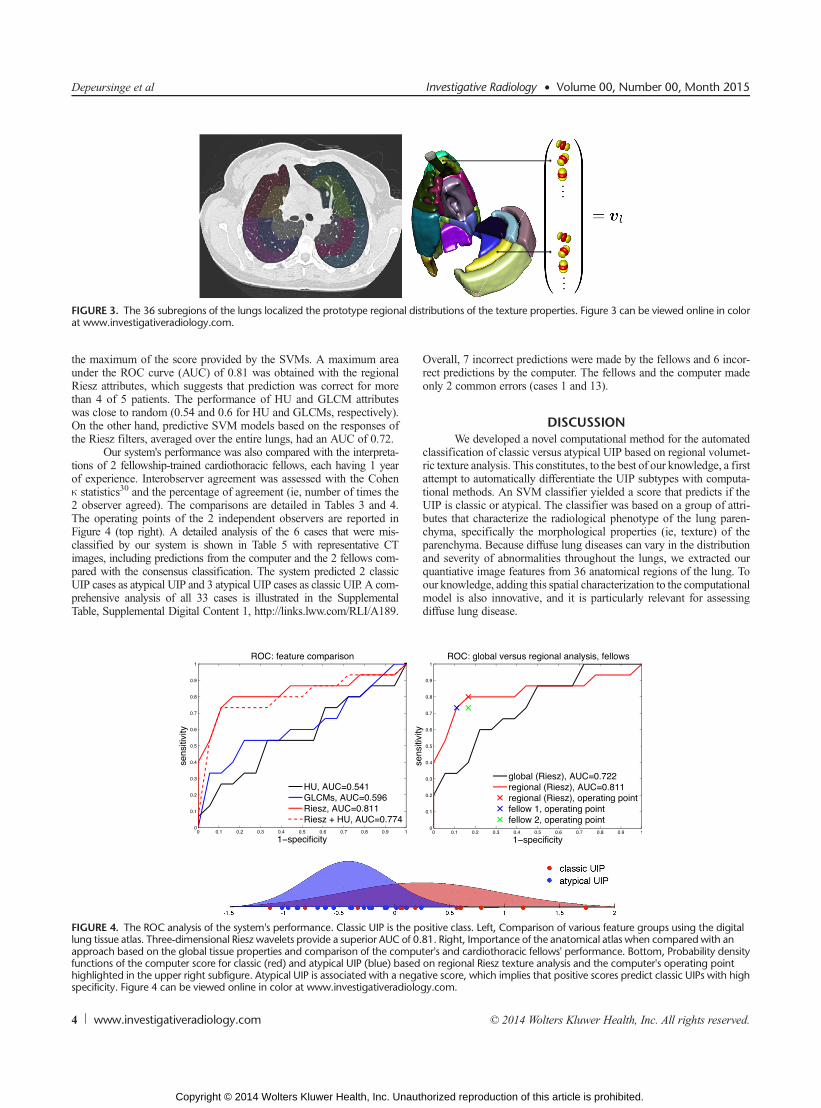
the maximum of the score provided by the SVMs. A maximum arunder the ROC curve (AUC) of 0.81 was obtained with the regionRiesz attributes, which suggests that prediction was correct for mothan 4 of 5 patients. The performance of HU and GLCM attributwas close to random (0.54 and 0.6 for HU and GLCMs, respectivelyOn the other hand, predictive SVM models based on the responsesthe Riesz filters, averaged over the entire lungs, had an AUC of 0.72
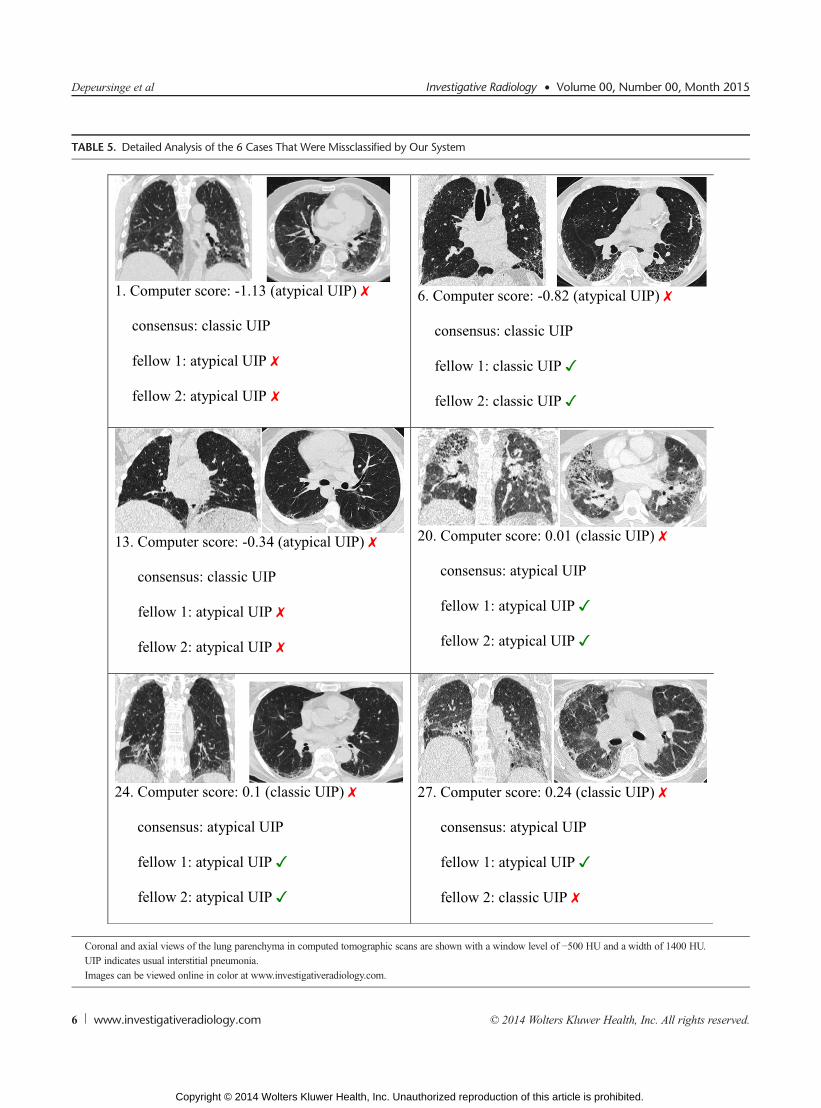
Our system's performance was also compared with the interprettions of 2 fellowship-trained cardiothoracic fellows, each having 1 yeof experience. Interobserver agreement was assessed with the Coheκ statistics30 and the percentage of agreement (ie, number of times th2 observer agreed). The comparisons are detailed in Tables 3 andThe operating points of the 2 independent observers are reportedFigure 4 (top right). A detailed analysis of the 6 cases that were miclassified by our system is shown in Table 5 with representative Cimages, including predictions from the computer and the 2 fellows compared with the consensus classification. The system predicted 2 classUIP cases as atypical UIP and 3 atypical UIP cases as classic UIP. A comprehensive analysis of all 33 cases is illustrated in the SupplementTable, Supplemental Digital Content 1, http://links.lww.com/RLI/A18
FIGURE 4. The ROC analysis of the system's performance. Classic UIP is thlung tissue atlas. Three-dimensional Riesz wavelets provide a superior AUC oapproach based on the global tissue properties and comparison of the comfunctions of the computer score for classic (red) and atypical UIP (blue) bahighlighted in the upper right subfigure. Atypical UIP is associated with a nspecificity. Figure 4 can be viewed online in color at www.investigativeradi
Overall, 7 incorrect predictions were made by the fellows and 6 incorect predictions by the computer. The fellows and the computer madonly 2 common errors (cases 1 and 13).
DISCUSSIONWe developed a novel computational method for the automate
classification of classic versus atypical UIP based on regional volumeric texture analysis. This constitutes, to the best of our knowledge, a firattempt to automatically differentiate the UIP subtypes with computtional methods. An SVM classifier yielded a score that predicts if thUIP is classic or atypical. The classifier was based on a group of attrbutes that characterize the radiological phenotype of the lung parechyma, specifically the morphological properties (ie, texture) of thparenchyma. Because diffuse lung diseases can vary in the distributioand severity of abnormalities throughout the lungs, we extracted oquantiative image features from 36 anatomical regions of the lung. Tour knowledge, adding this spatial characterization to the computationmodel is also innovative, and it is particularly relevant for assessindiffuse lung disease.
e positive class. Left, Comparison of various feature groups using the digitalf 0.81. Right, Importance of the anatomical atlas when comparedwith anputer's and cardiothoracic fellows' performance. Bottom, Probability densitysed on regional Riesz texture analysis and the computer's operating pointegative score, which implies that positive scores predict classic UIPs with highology.com.
Investigative Radiology • Volume 00, Number 00, Month 2015 Classification of UIP Using Texture Analysis
System Performance and Comparison WithChest Specialists
The proposed approach successfully predicted UIP subtypes fmore than 4 of 5 patients (AUC, 0.81), with high specificity for classUIPs. This performance is encouraging and suggests that an automatesystem may be useful in routine clinical practice for radiologists wilimited experience in interpretation of diffuse lung diseases. The dtailed case analyses (see Supplemental Table, Supplemental DigitContent 1, http://links.lww.com/RLI/A189) reveal that, with the excetion of 1 case (case 20), the computer score was able to sort and gradthe patients from highly atypical (eg, patients 2 and 3) to classic (eg, ptient 33). The observer agreement between the computer and the cosensus was associated with a κ value of 0.63 and a percentageagreement of 81.82, which is considered as being substantial in the lerature.31 The performance of the computer was found to be comparble with that of the cardiothoracic fellows with 1 year of specialtraining (Fig. 4, top right). The agreement between each of the 2 fellowand the computer was moderate (ie, 0.51 and 0.57 κ values and 75.8and 78.8% agreement) when compared with their excellent interreadagreement (ie, κ value and percentage of agreeement of 0.94 and 97%respectively). However, the agreement between each of the fellows withe consensus classification (our criterion standard) is considerablower (ie, 0.63 and 0.57 κ values and 81.8% and 78.8% agreement). Iterestingly, the agreement between the computer and the consensus wcomparable with the agreement between the fellows and the consensusuggesting that, although the algorithm can still be improved in termsagreement with the consensus, the current method performs at leastwell as cardiothoracic fellows. The performancewas also consistent withe interreader agreement between the 2 expert radiologists (ie, 4 an8 years of experience, κ value of 0.67) reported by Assayag et al13
their study. Because the target application for this algorithm is for geeral radiologists, the proposed system could considerably improve theperformance, a study which we plan to undertake.
Detailed Case Analysis of the System's PerformanceOur cohort had a much higher proportion of atypical UIPs a
counting for more than half the cases, which likely reflects a selectiobias. In current practice, only cases that are atypical have histologipathologic confirmation, which was required for this cohort analysiMany of the cases had subtle findings that required adhering vestrictly to the guidelines for classification by the consensus, whicmay account for 3 of 6 erroneous predictions of atypical UIP by th
TABLE 4. Interobserver Agreement (Percentage of Times That the Ob
computer (see Table 5 and the Supplemental Table, Supplemental DigitContent 1, http://links.lww.com/RLI/A189). We believe that the algrithm would perform better in a real-world setting, which does not rflect unusual cases referred to a quaternary academic institution.
Erroneous predictions of classic UIP by the computer occurrein 2 patients (patients 24 and 27) where bronchiectasis was mistakefor honeycombing (Table 5). This can be a difficult task even for exprienced chest radiologists, but it will constitute a target for further improvement of the system. One patient with diffuse disease withodefinite basilar predominance was also misclassified as classic Uby the computer.
Overall, 7 incorrect predictions were made by the cardiothoracfellows and 6 incorrect predictions by the computer. Combining thepredictions results in only 2 incorrect predictions of 33 (ie, 94% correpredictions), demonstrating the potential benefit of computer-assistediagnosis in the setting of UIP.
Comparison of the Quantitative Image FeaturesThe gray-level histograms (ie, HU) failed to predict the UIP su
types, and 3D GLCMs provided a slightly better specificity for classicUIPs. The 3D Riesz wavelets provided an AUC of 0.81, which wfound to be higher than that of 3D GLCMs and HU. The combinatioof Riesz and HU did not lead to a performance improvement. Thcan be explained by the fact that the distinction between tissue types asociated with UIP requires a fine characterization of the volumetrmorphological tissue properties (ie, 3D texture) that only 3D Riewavelets were able to extract. The prototype gray-level distributioof ground glass, reticular, and honeycombing may not be sufficientdistinct to accurately discriminate among them, as shown in FigureThe comparison between global and regional texture analysis (Fig.right) highlights the importance of localizing tissue texture propertiewhich is consistent with the medical knowledge.1
Overall, we believe that our automated system may be usefulgeneral radiology practices, accounting for the majority of sites whepatients with IPF are initially examined, to accurately identify patienwith classic UIP for which an unnecessary surgical biopsy can bavoided. The high-resolution imaging of lung disease afforded bmodern-day CT provides accurate 3D anatomic/pathologic fidelitypatients with classic UIP features. A confident CT diagnosis of classUIP can eliminate the need for an invasive surgical biopsy to confirthis diagnosis; this underscores the importance of an accurate and reable interpretation of the CT examination. This task is often challening, particularly in less-specialized practice centers without access
14. Depeursinge A, Foncubierta-Rodríguez A, Van De Ville D, et al. Three-w
g-
-ty-ol.
ia:by4.
Investigative Radiology • Volume 00, Number 00, Month 2015 Classification of UIP Using Texture Analysis
experts experienced in interstitial lung disease. Nevertheless, reductioof needless invasive biopsies is desired when possible to reduce cosand, more importantly, to avoid unnecessary morbidity/mortalty in ptients with UIP.We recognize several limitations of the current work, icluding the small number of cases included in the study and the use ofvery simple digital atlas of the lung anatomy. Future work will includvalidating our results in an independent data set and performing rgional learning of 3D rotation-covariant texture models of normaground glass, reticular, and honeycombing.27,31
nt:n-
i-R.
h-rit
ps5.ir
ic-3:
isre
ir
sy,ol.
edia.
sisofet
lyst.
er-at-
alre-
ntm
onT.
ofg.
hees.
head
l-lth
al-ed
oral
ntu-g:
.ta.ics
ic.
n-ge
REFERENCES
1. Raghu G, Collard HR, Egan JJ, et al. An official ATS/ERS/JRS/ALAT statemeidiopathic pulmonary fibrosis: evidence-based guidelines for diagnosis and maagement. Am J Respir Crit Care Med. 2011;183:788–824.
2. Lynch DA, Huckleberry JM. Usual interstitial pneumonia: typical and atypcal high-resolution computed tomography features. Semin Ultrasound CT M2014;35:12–23.
3. Sumikawa H, Johkoh T, Colby TV, et al. Computed tomography findings in patological usual interstitial pneumonia: relationship to survival. Am J Respir CCare Med. 2008;177:433–439.
4. Alhamad EH, Al-Kassimi FA, AlBoukai AA, et al. Comparison of three grouof patients with usual interstitial pneumonia. Respir Med. 2012;106:1575–158
5. Lynch JP, Saggar R, Weigt SS, et al. Usual interstitial pneumonia. Semin RespCrit Care Med. 2006;27:634–651.
6. Johkoh T, Sumikawa H, Fukuoka J, et al. Do you really know precise radiologpathologic correlation of usual interstitial pneumonia? Eur J Radiol. 2014;820–26.
7. Flaherty KR, King TE, Raghu JG, et al. Idiopathic interstitial pneumonia: whatthe effect of a multidisciplinary approach to diagnosis? Am J Respir Crit CaMed. 2004;170:904–910.
8. Gogali A, Wells AU. Diagnostic approach to interstitial lung disease. Curr RespCare Rep. 2012;1:199–207.
9. Gruden JF, Panse PM, Leslie KO, et al. UIP diagnosed at surgical lung biop2000-2009: HRCT patterns and proposed classification system. Am J Roentgen2013;200:458–467.
10. Aaløkken TM, Naalsund A, Mynarek G, et al. Diagnostic accuracy of computtomography and histopathology in the diagnosis of usual interstitial pneumonActa Radiol. 2012;53:296–302.
11. Raghu G, Lynch D, Godwin D, et al. Diagnosis of idiopathic pulmonary fibrowith high-resolution CT in patients with little or no radiological evidencehoneycombing: secondary analysis of a randomised, controlled trial. LancRespir Med. 2014;2:277–284.
12. Hunninghake GW, Lynch DA, Galvin JR, et al. Radiologic findings are strongassociated with a pathologic diagnosis of usual interstitial pneumonia. Che2003;124:1215–1223.
dimensional solid texture analysis and retrieval in biomedical imaging: revieand opportunities.Med Image Anal. 2014;18:176–196.
15. Sluimer IC, Schilham A, Prokop M, et al. Computer analysis of computed tomoraphy scans of the lung: a survey. IEEE Trans Med Imaging. 2006;25:385–405.
16. Park YS, Seo JB, Kim N, et al. Texture-based quantification of pulmonary emphysema on high-resolution computed tomography: comparison with densibased quantification and correlation with pulmonary function test. Invest Radi2008;43:395–402.
17. Delorme S, Keller-Reichenbecher MA, Zuna I, et al. Usual interstitial pneumonquantitative assessment of high-resolution computed tomography findingscomputer-assisted texture-based image analysis. Invest Radiol. 1997;32:566–57
18. Yoon RG, Seo JB, Kim N, et al. Quantitative assessment of change in regiondisease patterns on serial HRCT of fibrotic interstitial pneumonia with textubased automated quantification system. Eur Radiol. 2013;23:692–701.
19. Guo J, Reinhardt JM, Kitaoka H, et al. Integrated system for CT-based assessmeof parenchymal lung disease. Paper presented at: IEEE International Symposiuon Biomedical Imaging; July 7–10, 2002; Washington, DC.
20. Korfiatis PD, Karahaliou AN, Kazantzi AD, et al. Texture-based identificatiand characterization of interstitial pneumonia patterns in lung multidetector CIEEE Trans Inf Technol Biomed. 2010;14:675–680.
21. Xu Y, Sonka M, McLennan G, et al. MDCT-based 3D texture classificationemphysema and early smoking related lung pathologies. IEEE Trans Med Imagin2006;25:464–475.
22. Li B, Christensen GE, Hoffman EA, et al. Establishing a normative atlas of thuman lung: intersubject warping and registration of volumetric CT imagAcad Radiol. 2003;10:255–265.
23. Li B, Christensen GE, Hoffman EA, et al. Establishing a normative atlas of thuman lung: computing the average transformation and atlas construction. AcRadiol. 2012;19:1368–1381.
24. Zrimec T, Wong JSJ. Improving computer aided disease detection using knowedge of disease appearance. Paper presented at: 12th World Congress on Hea(Medical) Informatics; August 20–24, 2007; Brisbane, Australia.
25. Depeursinge A, Zrimec T, Busayarat S, et al. 3D lung image retrieval using locized features. Paper presented at: SPIE Medical Imaging 2011: Computer-AidDiagnosis; February 12–17, 2011; Orlando, FL.
26. Chenouard N, Unser M. 3D steerable wavelets and monogenic analysis fbioimaging. Paper presented at: IEEE International Symposium on BiomedicImaging: from Nano to Macro; March 30, – April 2, 2011; Chicago, IL.
27. Depeursinge A, Foncubierta-Rodríguez A, Vargas A, et al. Rotation-covariatexture analysis of 4D dual-energy CT as an indicator of local pulmonary perfsion. Paper presented at: IEEE International Symposium on Biomedical ImaginFrom Nano to Macro; April 7–11, 2013; San Francisco, CA.
28. Cortes C, Vapnik V. Support-vector networks. Mach Learn. 1995;20:273–29729. Kurani AS, Xu DH, Furst J, et al. Co-occurrence matrices for volumetric da
Paper presented at: IASTED International Conference on Computer Graphand Imaging; August 17–19, 2004; Kauai, HI.
30. Viera AJ, Garett JM. Understanding interobserver agreement: the kappa statistFam Med. 2005;37:360–363.
31. Depeursinge A, Foncubierta-Rodríguez A, Van De Ville D, et al. Rotatiocovariant texture learning using steerable Riesz wavelets. IEEE Trans ImaProcess. 2014;23:898–908.
www.investigativeradiology.com 7
authorized reproduction of this article is prohibited.