AVIATION RESEARCH LABORATORY INSTITUTE OF AVIATION Ur*NIVERSITY OF ILLINOlI AT URUANA-CHAMPAIWN TECHNICAL REPORT THE ISOLATION Or' MINIMUM SETS OF VISUAL IMAGE CUES. ""WA SUFFICIENT FOR SPATIAL ORIENTATION AUIL DURING AIRCRAFT LANDING APPROACHES .jonice I. Eisle, **ber# C. Williges, Stanley N, R@osce AR 76-16/ONR -76-3 "NOVEMBER 1976 CDC 4n 19? B -7Cntract: N00014-76-C-0081 .•" .l Work Unit Number: NR 196-133 R.eproduction of this doiknoilL in whbole or in part is permitted for any purpone of the U.S. Government. APPROVED FOR P.UBILIC RELEASE: DISTRIBUTIr)N UNLIMITED. propured foe *N@OINIEPIN3 POYCNHOLOUY PCI• lAMIIS ______ OP OP NAVAL VSU•SNACH
Transcript
AVIATION RESEARCHLABORATORYINSTITUTE OF AVIATION
Ur*NIVERSITY OF ILLINOlI AT URUANA-CHAMPAIWN
TECHNICAL REPORT
THE ISOLATION Or'MINIMUM SETS OF VISUAL IMAGE CUES.
""WA SUFFICIENT FOR SPATIAL ORIENTATIONAUIL DURING AIRCRAFT LANDING APPROACHES
.jonice I. Eisle, **ber# C. Williges, Stanley N, R@osce
AR 76-16/ONR -76-3
"NOVEMBER 1976
CDC4n 19?
B-7Cntract: N00014-76-C-0081
.•" .l Work Unit Number: NR 196-133
R.eproduction of this doiknoilL in whbole or in part ispermitted for any purpone of the U.S. Government.
APPROVED FOR P.UBILIC RELEASE: DISTRIBUTIr)N UNLIMITED.
propured foe
*N@OINIEPIN3 POYCNHOLOUY PCI• lAMIIS______ OP OP NAVAL VSU•SNACH
BestAvailable
Copy
UNCLASSIFIEDSECURITY CLASSIFICATION OF THIS PAGE (ft.n Data En,.ted)
REPORT DOCUMENTATION PAGE ' READ INSTRUCTIONSRE BEFORE COMPLETING FORM
J I. REPORT NUMBER 2. GOVT ACCESSION NO. 3. IF.NT'S CATALOG NUMBER
-_,&0-76-16IONR-76-3 ..
_A THEISOLATION OFMINIMUM SETS OF.VISUAL IMAGECUES SUFFICIENT FOR SPATIAL ORIENTATION DURING Technical 1ep;t. 1974-Iff '2AIRCRAFT LANDING APPROACHES * -
7. A5.O~q CONTRACT OR GRANT NUMBER('a)
Janice E./Eisele, Robert C.IWiiiiges an /-Stanley N.IjRosoe
PERFORMING ORGANIZATION NAME AND ADDRESS '.PROGRAM ELEMENT, PROJECT. TASK
AREA 6 WORK UNIT NUMBERSAviation Research Laboratory--
Institute of Aviation NR 196-133University of Illinois, Savoy, IL 61874 -_i: 11,CONTROLLING OFFICE NAME AND ADDRESS 12' . R•EP R
Office of Naval Research (Code 455)7 Novmd•r X76 [• ~~800 North Quincy Street ),WL ATENT"MI•A•E
Arlington, Virginia 22217 3614. MONITORING AGENCY NAME &Ik 9 JDEIR41,_0 t how Contro~llng Olfice) IS SECURITY CLASS. (*I this aopW)
Unclassif ied*T05ECLASSIFICATION/60wlGADINGT
SCHEDULE
IS. thiTRIIUf'?A TEUEN T feD t Rep'e)
Approved for public release; distribution unlimited.
* ~~11, DIT1RIOUTION 0~A?91VI9T (01 t~ot *be~Mc itamloj In *10ek 2, At dtllit.a4 het **Pont)
It. SULEM9JTAAVNONTES-
.K Y WORN fc•.1"o. .. # .w e..*..d.i.. ...e e a, l.tr bp block e.w#-ae
SO. LOSlUACT fCeamel. at, mV4oU* aidg I iftOOm9s ea &W eeaap OWt W~e tueemb"
-.NAn experimontai invescigation of synthetic imaglntg lim.llys- Vws directedtoward the isolation of minimum sets of visual cues s9011 (tient Ifor slpatitalorientation in ground-reforenced aircraft landing approahiets, ThirLy-two
* flight inerructorS viewed static compoter-generated airport mestnen TV-projectetonto A large screen vieved from the cockpit of a twin-engine generaul aviationtrainer. Judgments of lateral and vertical deviations from a foDEr-dogreeapproach to landing aim point in the display vere made to 32 combinations f of
)" 00 , ,, , 14 13 9 0 4- ,o .o r. I 610 v 6 s, o o4 o0 4 .110 17 DI OVIOOEUNCIASSIFIED.
S4S/'j 6/U CL1AUICATtI. oroTHISph,,t. bao..
i l UNCLASSIFIED6SCURITY CLASSIFICATION OF THIS PAO,(WAon 0a, SAWtr..)
20. four contact analog cues: runway outline, runway touchdown zone, runwaycenterline, and ground plane texture; and one guidance cue: glidepath-localizer symbol. Each resulting display was responded to once or morefrom each of 27 different flight position and attitude viewpoints by eachof eight subjects in different serial orders. Dependent measures wereresponse choice and response latency. The most accurate glidepath andcourse deviation judgments were made when the guidance cue glidepath wasin the set. When only contact analog cues were present the best judgmentsof spatial orientation consistently were made when the runway outline waspresent at far and medium ranges from touchdown and when the runway center-line was present at near range. k--
NTNON
UNCLASSIFlsn.CUWIY .AWMATIC M ar Twig VAOEEU be" saw**
AVIATION RESEARCH LABORATORY
University of Illinois at Urbana-ChampaignWillard AirportSavoy, Illinois
61874
Technical Report
ARL-76-16/ONR-76-3
November 1976
THE ISOLATION OF MINIMUM SETS OF VISUAL IMAGE CUESSUFFICIENT FOR SPATIAL ORIENTATION DURING AIRCRAFT LANDING APPRtACIIES
Janice E. Eisele, Robert C. Williges, and Stanley N. Roscoe
Prepared for
ENGINEERING PSYCHOLOGY PROGRAMS
OFFICE OF NAVAL RESEARCH
Contract: N00014-76-C-00811-ork Unit Number: NR 196-133
APPROVED FM PUBLIC RELEASE: DISTRIBUTION uNLNITED
ACKNOWLEDGMENT
This paper describes research performed at the University of Illinois
at Urbana-Champaign under contract with Engineering Psychology Programs,
Office of Naval Research, with Gerald S. Malecki as scientific monitor.
fi
F .
F1
CONTEXT
The Aviation Research Laboratory of the University of Illinois has
investigated integrated synthetic-imaging displays and computer-augmented
flight control for the Office of Naval Research. Mr. Gerald Malecki,
Assistant Director, Engineering Psychology Programs, was the technical
monitor of the research. Professor Stanley N. Roscoe was the principal
investigator during the initial phase of study and experimental apparatus
development; Professor Robert C. Williges served as principal investigator
while Professor Roscoe was on academic leave during 1975-76.
The research was directed toward (1) the isolation of minimum sets
of visual image cues sufficient for spatial and geographic orientation
in the various ground-referenced phases of representative flight missions,
(2) the generation and spatially integrated presentation of computed
guidance commands and fast-time flight path predictors, and (3) the maitch-
ing of the dynamic temporal relationships awon& these display indications
for compatibility with computer-augmented flight performanee control
dynamic#, both vithin each ground-referenced mission phase and during
transitions between phases. The investigative program drev selectively
upon pst work done principally under ONR sponsorship or partial sponsor-
ship, including the ANIP and JAMIR prograuw.
iii
To study experimentally the effectiveness of alternate sets of
visual cues the Aviation Research Laboratory developed a highly versa-
tile computer-generated display system to present dynamic pictorial
images either on a head-down, panel-mounted CRT or on a head-up tele-
vision projection to a large screen mounted in front of the pilot's
windshield on the Link GAT-2 simulator. Due to the great flexibility
of the pictorial display, visual cues and flight status information
could be manipulated experimentally. The experiment reported herein was
conducted to isolate the visual cues sufficient for approach and landing
by measuring subjectst orientation responses to TV-projections of static
computer-generated images containing various combinations of skeletal
symbology from various positions and attitudes on final approaches to
1 Visual Elements Present or Absent in Eachof the Eight Displays in Each of the FourDisplay Groups Presented to IndependentGroups of Eight Flight Instructors Each .. .. .......... 12
2 Coded and Real-World Values of the FlightPosition and Attitude Variables inAccordance with the Central CompositeExperimientallDei sig.... .. .. ... . .. .... 1s
3 Percent Correct Responses and MedlanLatencies of All Responses to Each ofthe 32 Displays at Par, Medium, and NearRanges from the Touchdo'wnZone, . .. . .. . .. . . . . 19
4 Sumary of Analysis of Variance and Resultsfor Percent Correct Responses at Par Range . . . . . . . 20
5 Suvary of Analysis of Variance and Resultsfor Percetut Correct Responses at Medium
6 Sumary of Analysis of Variance and Resultsfor Percent Correct Responses at NearRange .... . . . . . . . . . . . . . . . . .. . . . 22
7 Summary of Anolyisis of Variance and Resultsfor Median Latencies Of All Responses atfar Range . . . . . . . . . .. . . . . . . . . . . . . 23
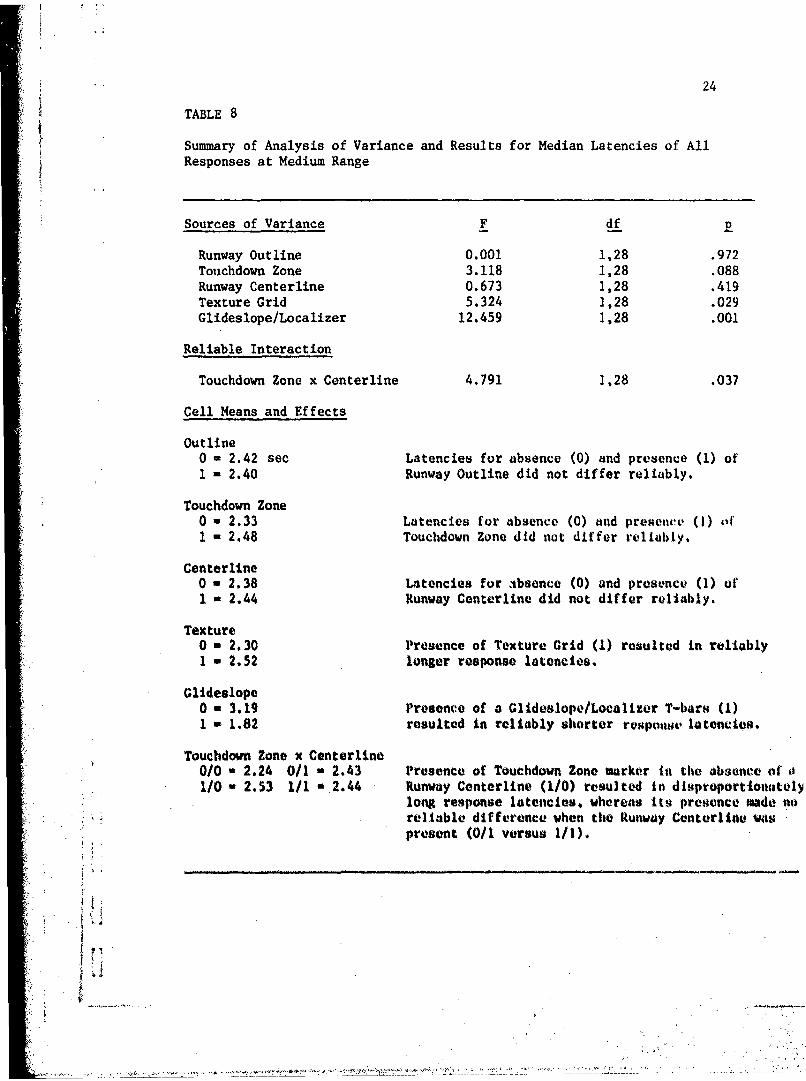
8 Sumary of Analysis of Variance and Resultsfor Median Latencies of All Responses atMedium Range* . . . . . . 24
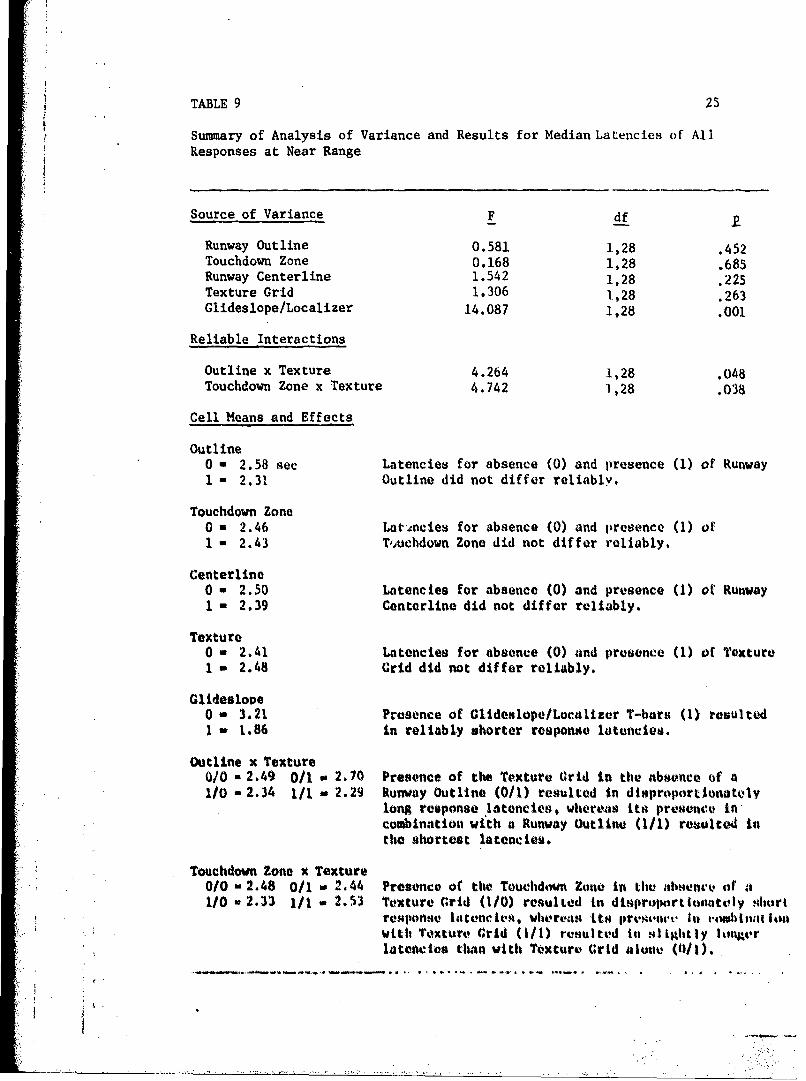
9 Summary of Analysis of Variance and Resultsfor M~edian Latencites of All Responses atRear Range ...... . . . . . . . . . . . . . . . . . 2
10 Regression Equations, vith their AssociatedMultiple Correlation Coefficients* for thePresence (I) or Absence (0) of the VariousDispla- Elements at Near (N). Medium (M). andFar ()Rauges from the Runway Aimpoint (under-livied regression coefficients are statistically
2 Group I display elements: composite ofall Group I elements (left) and compositeof Group I elements with Texture Gridomitted (right).. ... .. ...................... 13
3 Group It display elements: compositeof all Group II elements (left) andcomposiLe of Group II elements with
Texture Grid omitted (right).. .............. 13
4 Group III display elements: compositeof a11 Group III elements (left) andcomposite of Group III elements withTexture Grid omitted (right). . . . . . . . . . . . . 14
5 Group IV display elements: compositeof all Group IV elements (left) andcomposite of Group IV elements withTexture Grid omitted (right) . . . . . . . . . . . . 14
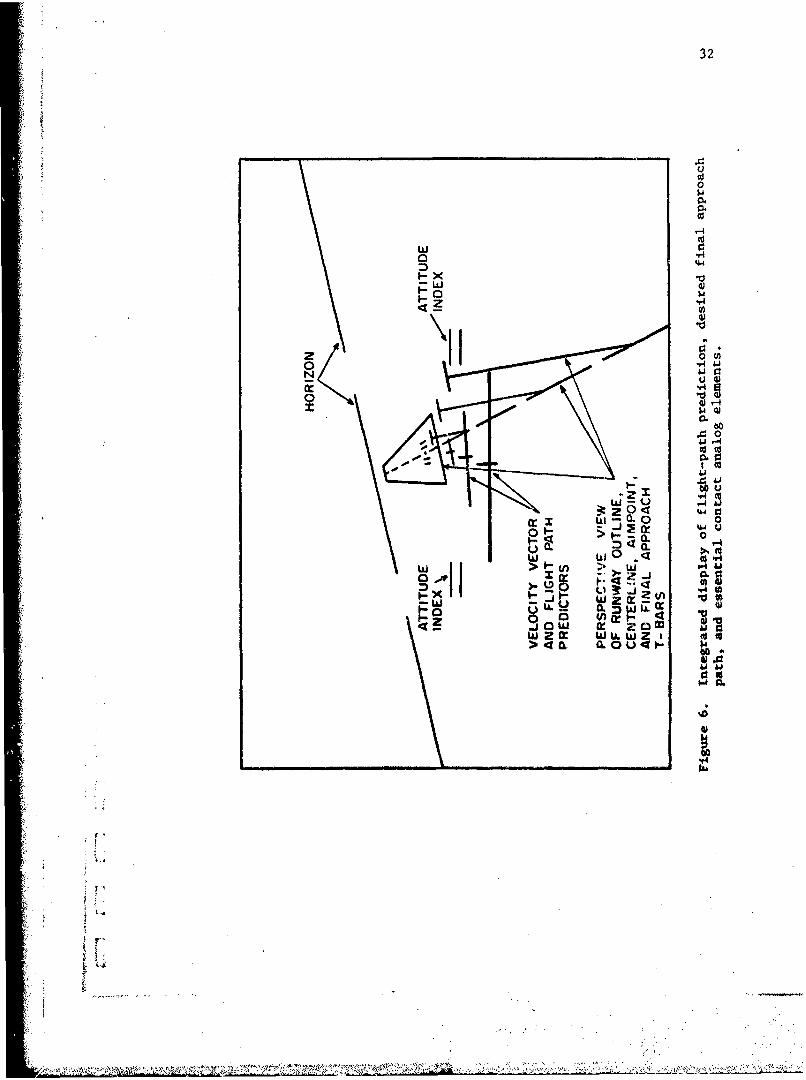
6 totegrated display of flight-pathprediction, desired final approach path,and essential contact analog elments . . . . . . . . 32
BACKGROUND
Aircraft technology has advanced rapidly sinc, its beginning at
the turn of the century, yet only recently has there been widespread
recognition by the aviation community of the constantly changing role
of the pilot in aircraft operations. Innovations in display technology,
made possible by the advent of advanced airborne digital computers, can
improve the pilot's performance by processing imformation to minimize
transformations, including integrations and differentiations us well a1s
simple arithmetic computations, raquired in the decision making ,ind
flight control process. In this way, computers can help pilots perform
their new duties better.
In making and carrying out flight decisions, a pilot must convert
long-teri mission objectives to subgoals for atch fl ight Ltstruient.,
relate instrument subgoals to each other and control iliputs to nireraft
responses and instrument indications. for each of thene functions.,
computers can improve pilot perfortsnce by storing, transforming., ab
integrating sensed Information. Vith the ever increasing air traffir
densities, expand•ln requirewantu for all-weatier, night, and ulp-of-
tht-earth operations, and the hurgeoning eumplexity ow navigation arnd
veapon delivery profiles, the appl It: ion of aIrborne computers to control
auglentation and display Integration to no longer generally discouated
as a radical, Lrresponstble, daagerously unreltable fol ly.
2
Pictorial Vertical Situation Displdys
To apply computers effectively to the transformation of sensed
information and the generation of synthetic displays, information that
is closely related functionally should be presented in a ctmmon frame
of reference. More specifically, information concerniug an airplane's
attitude and flight path relative to surface objects, :,uch as ground
targets, airport runways, or carrier decks, should be p•resented in a
All pictorial displays, by Carol's (1965) definition, lhkvv two c-omo
characteristics. first, the elements in the display are geometrically
similar to tiose in the contact world; and second, the motion of djsplayetd
elements is analagous to that of their real-world correlates.
Literal VSDs. The mst literal VSs for approach attd landing art,
flight periscopvts 4nd forward- looking IR and TV displavs. Rmsvto.
Hler, and Doughtery (1966) conducted iieveral %tudiet usiIt a project ion
periscope wunted in a Coeot" T-50. The pi lot saw thk forward viov on
an 8-inh #creeon mounted above the instrurent panel vith the pertscop#,
projectitn through an alualtnns windshiold. Although safe LAi.keof n•d
landings were made by roefretwe to thia projected forwatd view, the
accuracy of l.ndingt in terms of constant amn variable errors was
reliably Influenced by IagKe a.agnifiactioon the Optimtm v4lu4 beIng
about 125. C~mpbell. iCeachern., atnd Marit (1955) usdl a binwular
periscope to investigate approml. mid landing perforknwea •, 1 r qj•
similar Codustions as to image magnification.
3
"Kibort and Drinkwater (1964) tested the effectiveness of a TV display
in a DC-3 aircraft for the final approach and landing. A steerable
camera was mounted on the nose and a second camera was placed just forward
of the tailwheel. The output of either could be fed to a 14-inch monitor
that subtended 16-17 degrees at the pilot's eye. The task of the pilot
was to fly landing approaches from three miles out through touchdown
and rollout. Kibort and Drinkwater concluded that only quantitative
airspeed, vertical speed, and altitude information was necessary when
flying the TV display.
From the evidence available, an unaided literal TV display appears
inadequate for use as the primary instrument for approach and landing.
The addition of quantitative information on flight and navigation guidance
* parameters would improve the pilot's spatial and geographicaL orientation
cues. Information presented by a literal pictorial display is believable
due to the availability of all the real-world landmarks, and this allows
* -' the pilot to decide among alternative courses of action with high confidence.
S * In this wily, literal displays take advantage of the overlearned perceptual
* habits that pilots acquire from VFR flight.
AnalogjV . In the late 1950s through early 1960s, the ANIP program
(Army-Navy Instrumentation Program) followed by the JANAIR (Joint Army
Navy Aircraft Instrumentation Research) program were conducted. These
programs included investigations and development of advanced instrument
systems for aircraft and standards for electronic and optically-Itenerated
*; aircraft displays.
j,
4
Carel (1965), in his frequently cited JAkiAIR report, defined a
contact analog display as "the point perspective projection of a three-
dimensional model to a picture plane." Typical computer-generated models
contain reference objects significant for flight performance, such as a
surface representing the horizon and ground plane, a surface representing
the command path for the pilot to follow, and other surfaces or objects
useful during various phases of a mission. Most importantly, the dis-
played surface dynamics are similar to those of their ;nalog surfaces
in the natural visual environment. The displayed surfaces still follow
the laws of motion perspective, thus providing information coded in a
fashion analogous to the coding provided in visual contact flight.
Investigators at Bell Helicopter Company carried out simulator and
flight tests using a contact analog display developed by Norden. Abbott
and Dougherty (1964) studied the accuracy with which altitude and ground-
speed could be interpreted using the Norden display. No control was
required of the subject pilots in the open-loop task. It was concluded
that the display offered the same problem areas as dots VFR flight in
the presentation of altitude and groundspeed information. The higher
the altitude or speed, tile poorer was the judgment. and an interaction
existed between speed and altitude judgments, with increasing difficulty
in interpreting either as tile other increased.
Emery and Dougherty (1964) studied low-altitude, ground-referenced
maneuvers in the Bell moving-base helicopter simulator. Tile content of
"the displays was varied in four test conditions: ground planeo only,
ground plane and landing pad; ground pltinu with 1I Ight path bo.rdter; and
5
ground plane, flight path border, and "tarstrips" perpendicular to the
border edges. Pilot performance improved as command guidance informa-
tion was added in the form of a desired flight path.
In a third investigation, Dougherty, Emery, and Curtin (1964) com-
pared pilot performances when flying with standard instruments and with
the contact analog display. Two groups were trained to a criterion ot
"performance equivalence" with the two types of display in the moving-
base helicopter simulator. Subjects were required to control altitude,
heading, course, and airspeed while concurrently performing a digit-
reading side task at variable rates. Pilot performances with the two
types of display did not differ reliably under the control condition
(no digit-reading task) or under the slowest rate condiLi•,n; however,
as the side-task rate was increased progressively, performance on the
contact analog display remained relatively stable, while performance
on the standard instruments deteriorated.
The authors concluded that "the pictorial JANAIR display was by far
the superior display as the visual workload increased," and attributed
this to three factors:
I. The pilot may more quickly assimilate qualitative
information from the pictorial display.
2. Using conventional information, tile pilot samples
one parameter of information per glance. Withi the
pictorial display, he accumulates informatfion oi
More thati ont. parameter per glati'e.
. 3. wernuse of its rclatively large tangular field of view,
the pictorial display poa'mttg use of perillheral elsiei.
6
Williams and Kronholm (1965) reported the results from simulation
studies of an integrated electronic vertical situation display developed
by Norden under JANAIR support. The object of the Universal Contact
Analog Display (UCAD) research program was to formulate a methodology
for determining VSD requirements and to generate design criteria for an
integrated cockpit display applicable to both fixed-wing and rotary-
wiug aircraft. Significant among the conclusions and recommendations
were: 1) the desirability of quantitative indications of altitude, air-
speed, vertical velocity, turn rate; and 2) the desirability of incorporating
,,ompute.1 control information into the display fo, critical tasks.
Ketchel and Jenny (1968) surveyed the literature, presented display
design considerations, and delineated areas in which further research was
needed. Their eport included consideration of informittion requirements,
symbolngy and format, and quantitative display characteristics, with the
primary emp'..asis on CRT display, tor fixed-wing aircraft. Following
publication. of thk Ketchel and Jenny report, a new prod.ram of expertmentatk.n
on contact aulg)& displays was indertaken at the Naval Hissile Center, Pt.
Mugu.
Cross and Cavellero (1971) investigated pilot performance during
esmulated lanaing approaches to an aircraft c.arrier. Performances in the
simulator were found to bo ",.omparahle" to ?orform sncee; on aoproaches to
iA CVA tarr"er in an actual F-4 aircraft. Io addition, p ants oXproosed
the opinion Ouat tho nature and love) of task di'fIfcui&y experi)tccd
in the aslmlator were similar to thuse encountered in the *alrcrrt in the
.lvdtt Ia h p1tke. Prowu thle evitdknce syntli'( l.:g lly g, ierateI aialog' sitR
ii
4, 7
displays appeared to facilitate spatial orientation and allow manual control
not greatly different from literal imaging displays of comparable dimensions.
A projected flight path indication was added to the display used by
Cross and Cavallero to allow investigation of a possible means of further
improving performance during approach and landing. Wulfeck, Prosin, and
Burger (1973) had pilots fly approaches in a fixed-base F-4 simulator
with the baseline contact analog display, the predictor display, and a
glideslope reference element of the predictor display. The predictor display
proved reliably superior to the baseline display in all comparisons,
including altitude and lateral error variability, oscillatory control
patterns, landings within error criteria, and "acceptable" approiches at
the ramp.
Unanswered Questions
Although much has been learned from the experiments Just revLewed,
the overriding conclusion is that pilots cau land airplanes by rererence
to an infinite number of sets of visual cues, each of which may be
sufficient to support performance at a particular level, no one of which
is uniquely necessary. Thus, when one speaks of the "t'sewntlal" visual
cues for landing, he is implicitly addressing the unanswered questions
concerning the relative effectiveness of the various sets of cues that
might be presented by a visual display within our present sensing, com-
puting, and display technology.
The approach taken in the present expertmental" investigatiio wua
to select a clearly sufficient sat of visual indcatlotis symWolic
IIi..... .. ... ....
8
of geometric aspects of the contact visual scene and to conduct a
parametric comparison of their various combinations in terms of the
performances of qualified pilots in judging their flight positions and
attitudes relative to the nominally correct landing approach path.
Open-loop responses were made to successive static presentations of
flight situations represented by computer-generated images of the
various display configurations projected onto a large screen viewed
from the cockpit of a flight simulator.
I~IP
I f m | m
*1 9
METHOD
Apparatus
A Raytheon 704 digital computer was used to generate the displays,
control the experimental display presentations, collect the dependent
measures, and record the data. The computer-generated displays were
imaged on a CRT from which a TV camera relayed them to an Advent Video-
beam projector. The Advent projector, mounted above the simulator cah,
projected the TV image onto a 68.5 x 51.5-in spherical-section screen
mounted in front of the simulator, a modified Singer-Link General Aviation
Trainer (GAT-2). The left half of the windscreen was removed so that the
subject, sitting in the pilot's seat, had an unobstructed view, straight
ahead, of the Advent screen. The simulatorts cab and Advent system as
shown In Figure 1 were entirely enclosed in a black plastic curtain that
shielded the projection screen from ambient light. The response device
was a nioe-button keyboard, Installed on the end of the subject's right
armrest and adjustable for various 4rm and finger lengths.
"_p~rimental Dosn
The displays were developed by the full factorial combination of
five symbolic elements, four representative of visible aspects of an
airport scene and one synthetic element nout present in the real world.
The real-world or "contact analog" display elements included:
(1) runway outline. (2) touchdown tone, (3) runway centerline, and
(4) a grid of "section linesv" that served to define a textured ourface.A'
' "
S[
rRAYTHEON 704
L -- COMPUTER
SYMBOLGEN ERATOR
,TV
.r!
Fi r .Pcoillnigdslysmlto qitet
The synthetic element was a row of four "T-bars" of increasing height
positioned along the approach centerline at 1/4, 1/2, 1, and 2 miles
from the touchdown aimpoint to provide a visual representation of an
imaginary glideslope and localizer path (analogous to a "highway in the
sky").
Two additional elements from the contact scene, present in all 32
displays, were touchdown aimpoint and horizon. To approximate the
viewing condition that would result in subjective equality of distance
judgments relative to those obtained with a direct, contact view of a
real airport, the computer-generated scenes were projected with a
magnification factor of 1.2 as measured at the pilot's eye position
(Roscze, Hasler, and Dougherty, 1966). The 32 displays were divided
into fwr groups of eight displays each by selecting two elements, run-
way outline and glidoslope-localizer path, as between-subjects factors.
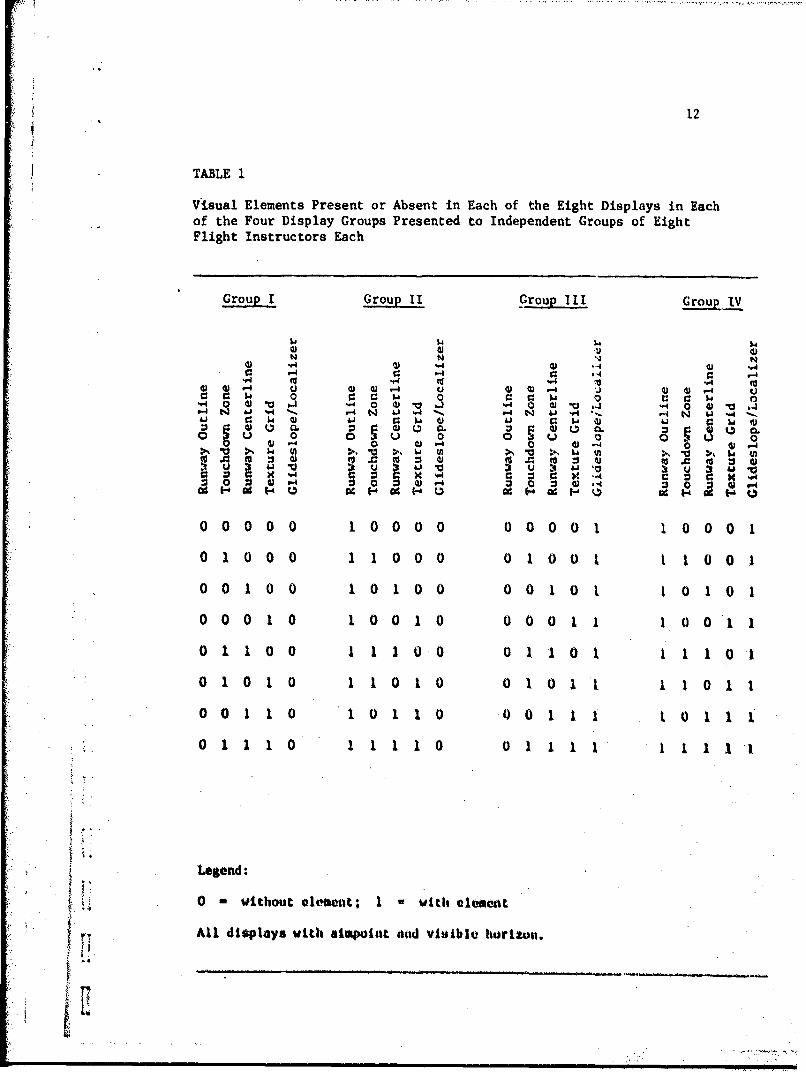
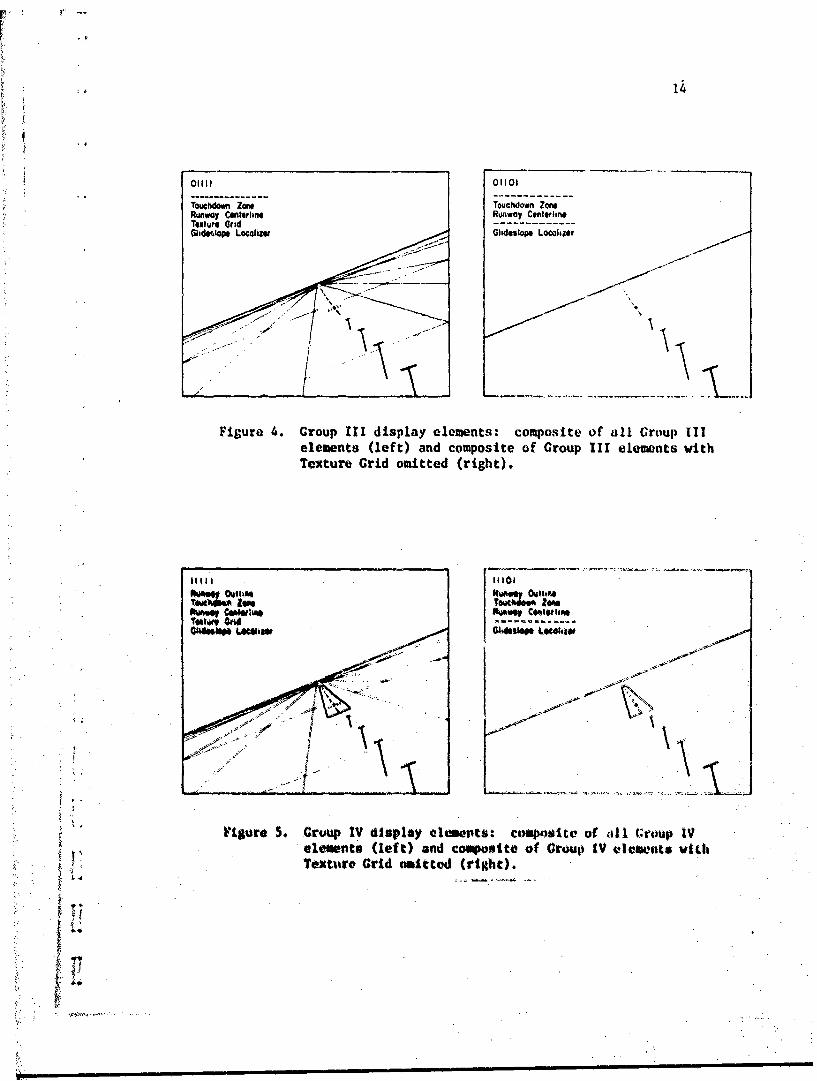
The four groups of displays are given in Table 1 and in Figure. 2-5.
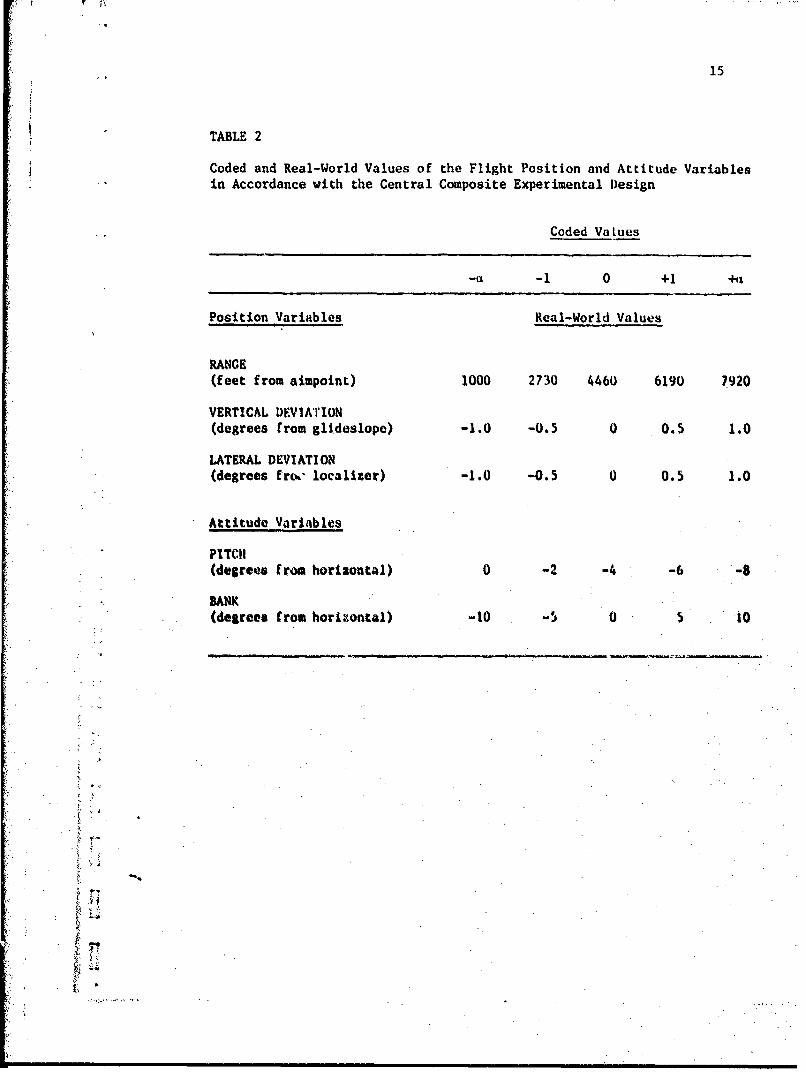
A central-composite design (CMD) was used to derive 27 different
viewpoints from which subjects would respond to the airport scenes pro-
jected onto the screen mounted ia front et the simulator. This systematic
strategy provided an acon•omical sampling of ranges frm touchdowt aimpoint.
vertical and lateral deviation from the glideslope/localixer T-bars, and
aircraft pitch and bank attitudes. The coded factor levels and correspond-
ing real-uiorld values used to generate the 27 different perspective views
of the landing approach scene (for each of the 32 display.) are • hown its
Table 2. A one-half replicate of a 2 factorial combination ti varialvhs
(±i values), plus 2 x 5 extended axial "otar" points (4 vwalues). pIlus
10 replications of the centerpoint (0 values) yielded 36 pregimitllomo
T',
"12
TABLE 1
Visual Elements Present or Absent in Each of the Eight Displays in Eachof the Four Display Groups Presented to Independent Groups of EightFlight Instructors Each
Group I Group II Group II Group ,IV
0 1 0 0 .I 0 0 I 0 S..! 0
0 0 I 0 0
N N "0 0 0 1 0 0 00 0 "-4 0 w" 1a -4 ~ -4 9: r~ -4
(U -. 4 41 44 -.4
•..0 1 1 00 411 1 1 0-0 0-1 00-. 00l 1 - U
SS. 0 w~ 0 a? C a w a? a? w40 1 0 0 w V 1 0 4 0 0 1 0 10 " 40 0U 1 1.-4 N 6J .4 ' -.4 N 4J w4 P-. .4 N 414 "''.'4 N
0 C0 '- 0 14 Z § W(UC U 0 0Un ( ~4)( 0 UUC ( U Co.
Figure 2. Group I display elements: composite of all Group I elements(left) and composite of Group I elements with Texture Gridomitted (right).
I1110 . 1I00
..... c...... ----------~ne
.... 1...Figure 3. Group 11 display elements: composite of all Group i1 eletents
(left) and composite of Croup It elementsv vith Texture Gridomitted (right)..
01111 01101
Touchdown Zone Touchdown ZoneR Unway Cm1•rttne Runway Cenewtlan4Text Grad -------------Glide~lop Lowh~an Giadeslope Locolizet
Figure 4. Group III display elements: composite of all Group Illelements (left) and composite of Group III elements withTexture Grid omitted (right).
11111 I1101
• 1,
@I4"W" t~wlim Le"41s 4MI~
P1igure S. Cruup IV display olelnets: cooslpitc of ;tll (Croup IVelements (left) and colqosite of Croupi IV evloents vitIhTextitre Grid nmitted (right).
A-U.TTL;
15
TABLE 2
Coded and Real-World Values of the Flight Position and Attitude Variablesin Accordance with the Central Composite Experimental Design
Coded VaLues
-a -1 0 +1 +1
Position Variables Real-World Values
RANGE(feet from aimpoint) 1000 2730 4460 6190 7920
VERTICAL DEVIATION(degrees from glideslope) -1.0 -0.5 0 0.5 1.0
Outline x Glideslope 6.876 1,28 .014Centerline x Glideslope 7.466 1,28 .01]
Cell Means and Effects
Outline0 - 72.1 Presence of Runway Outline (1) resulted in a reliably1 a 82.8 higher percentage of correct responses.
Touchdown ZoneO * 78.1 Percentages for absence (0) anl presence (1) ofI a 76.7 Touchdowt, Zone did not differ reliably.
Centerline0 a 75.1 Presence of Runway Centerline (1) resulted in aI - 79.8 r-ltably higher percentage of ,oorrecL responses.
Texture0 a 75.4 Percentages for absence (0) anl presence (1) of1 - 79.5 Texture Grid did not differ reliably.
Glideslope0 a 56.8 Presence of Glideslope/Localizer T-baru (1) resulted1 - 98.1 in a reliably higher percentage of correct responses.
Outline x Glideslope0/0 - 46.4 0/1 - 97.7 Presence of the Runway Outline had no evident effect1/0 - 68A0 1/1 - 98.4 when the Glideslope/I.oca lizer was present (0/i and 1/1),
but its presence yielded a higher percentage of correctresponses when the 61 ideslape/Locial 1yer was ahe4ent( I/I wrsus 0/0).
Centerline x Glideslope0/0 - 51.6 0/1 a 98.6 Presence of the Runway Centerline interacted with the1/0 w 62.0 1/1 a 97.6 absence of the Clideslope/Localixer in the sase way
that the Runway Outline did.
................................
.(: *:. - . ... . . .
21
TABLE 5
Summary of Analysis of Variance and Results for Percent Correct Responses atMedium Range
(No first-order interaction was statistically reliable.)
Cell Means and Effects
Outline0 - 76.0 Percentages for absence (0) and presence (1) of1 a 81.4 Runway Outline did not differ reliably. *
Touchdown Zone0 * 78.5 Percentages for absence (0) and presence (1) of1 i 78.9 Touchdown Zone did not differ reliably.
Centerline0 - 78.8 Percentages for absence (0) and presence (1) of
1 a 78.6 Runway Centerline did not differ reliably.
Texture0 - 80.0 Percentages for absence (0) and presencu (1) of1 - 77.3 Texture Grid did not differ reliably.
Glideslope0 - 62.6 Presence of Glideslope/Localizer T-bars (1) resulted1 94.8 in a reliably higher percentage of correct responses.
The corresponding regression analysis (see Table 10), which took intoaccount all of the individual response data for the ten reuplivationu ofthe centerpolnt of the central compislte expertmental design, :dmwed th•presence of the Runway Outline to contribute reliably to correet responsesat Medium Range (p < .05). The analysis of variance included only the firstof the ten centerpoint responses by each subjent.
TABLE 6 22
Summary of Analysis of Variance and Results for Percent Correct Responses atNear Range
Outline x Centerline 23.910 L,28 .000Centerline x Glideslope 12.712 1,28 .001
Cell Means and Effects
Outline0 - 80.4 Percentages for absence (0) and presence (1) ofI - 80.6 Runway Outline did not differ reliably.
Touchdown Zone0 - 79.5 Percentages for absence (0) and presence (1) of1 - 81.4 Touchdown Zone did not differ reliably.
Centerline0 a 76.5 Presence of Runway Centerline (1) resulted in a1 - 84.5 reliably higher percentage of .vorrect responses.
Texture0 - 80.8 Percentages for absence (0) and presence (1) of1 - 80.1 Texture arid did not differ reliably.
Glideslope0 - 66.4 Presence of Glideslope/Localizer T-bars (1) resulted1 a 94.5 in a reliably higher percentage of correct responses.
Outline x Centerline0/0 a 72.2 0/1 -88.5 Presence of Runway Centerline in the absence of a1/0 a 80.7 1/1 s 80.4 Runway Outline (0/1) resulted in a disproportion-
ately high percentage of correct responses.
Centerline x Glideslope0/0 59.4 0/1 - 93.6 Although the highest percentage of correct responses1/O - 73.4 1/1 - 95.5 occurred when both Glideslope/Localtzer and Runway
, iCenterline were pre.gent (1/1), the perccntnge wasdisproportionately high when either was present Inthe absence of the other (1/0 or 0/1), and thepercentage with Clideslope/Localizer present it theabsenc;i of Runway Centerltne (0/t) was nearly equalto that with both present.
- -,-- - - - . .. . .. ,-.. . .. . .
23
TABLE 7
Summary of Analysis of Variance and Results for Median Latencies of AllResponses at Far Range
Outline0 - 2.42 sec Latencies for absence (0) and presence (1) of1 - 2.40 Runway Outline did not differ reliably.
Touchdown Zone0 w 2.33 Latencies for absence (0) and presenec (1) Of
1 - 2.48 Touchdown Zone did not differ reliably.
Centerlineo0 2.38 Latencies for 3bsence (0) and presence (1) of1 = 2.44 Runway Centerline did not differ reliably.
Textureo0 2.30 Presence of Texture Grid (1) resulted in reliably1 - 2.52 longer response latencies.
Glideslope0 - 3.19 Presence of a Glideslope/Locallzer T-bars (1)1 - 1.82 resulted in reliably shorter r spotset latencies.
Touchdown Zone x Centerline0/0 a 2.24 0/1 - 2.43 Presence of Touchdown Zone marker In the absence of i1/0 - 2.53 1/1 a 2.44 Runway Centerline (1/0) resulted it disproportionately
long response latencies, whereas its presence made noreliable difference when the Runway Centerline waspresent (0/1 versus 1/1).
TABLE 9 25
Summary of Analysis of Variance and Results for Median Latencies of AllResponses at Near Range
Outline x Texture 4.264 1,28 .048Touchdown Zone x Texture 4.742 1,28 .038
Cell Means and Effects
Outline0 - 2.58 sec Latencies for absence (0) and presence (1) of Runway1 - 2.31 Outline did not differ reliably.
Touchdown Zone0 - 2.46 Latr.,ncies for absence (0) and presence (1) of1 - 2.43 Touchdown Zone did not differ reliably.
Centerline0 a 2.50 Latencies for absence (0) and presence (1) of Runway1 - 2.39 Centerline did not differ reliably.
Texture0 - 2.41 Latencies for absence (0) and presence (1) of Texture1 a 2.48 Grid did not differ reliably.
Glideslove0 3.21 Presence of Glideslope/Locnlizer T-bars (1) resulted1 , 1.86 in reliably shorter response latencies.
Outline x Texture0/0 - 2.49 0/1 m 2.70 Presence of the Texture Grid in the absence of a1/0 -2.34 1/1 - 2.29 Runway Outline (0/i) resulted in disproportiunately
long response latencies, whereas its presacut incombination with a Runway Outline (1/1) resulted inthe shortest latencies.
Touchdown Zone x Texture010 2.48 0/1 w 2.44 Presence of tie Touchdown Zone in the albsue"e of at1/0 2.33 1/1 a 2.53 Texture Grid (1/0) resulted in disprolortionately shoort
response latenctieA, whereas its protm4t.ntt In cNUhl1tt o111with Texture Grid (1l/) resulted ltt sightly liongerlateacies than with Texture Grid alone (0l1).
3
26
TABLE 10
Regression Equations, with their Associated Multiple Correlation Coefficients,for the Presence (1) or Absence (0) of the Various Display Elements at Near (N),Medium (M), and Far (F) Ranges from the Runway Aimpoint (underlined regression
* coefficients are statistically reliable; p < .05).
Kibort, B. R. and Drinkwater, F. J. A flight study of manual blind land-
ing performance using closed circuit television displays. Moffett
Field, Calif.: Ames Research Center, Technical Note NASA TN D-2252,
1964.
Muller, C. G. Numerical transformations in the analysis of experimental
data. Psychological Bulletin, 1949, 46, 198-223.
Myers, R. H. Response surface methodology. Boston: Allyn and Bacon.
1971.
Roscoe. S. N., Hasler, S. G., and Dougherty, D. J. Flight by periscope:
Making takeoffs and landings; The influence of imige nmagnification,
practice, and various conditions of flight. Human Factors, 1966,
8, 13-40 (Originally issued it 1952 as ONK Human EngineerLng Report
SDC-71-16-9J.
Williams, P. R. and Kronholm, N. Technical report on Almulation tairdtes
of an integrated electronic vertical display. Norwalk, Conn.:
Norden Division of United Aircraft Corporation, JANAIR Report
1161-R-0021, 1965. [AD629-1571
†t* f~'
36
Williges, R. C. Research note: Modified orthogonal central-composite
designs. Human Factors, 1976, 18, 95-98.
Wulfeck, J. W. and Prosin, D. J., and Burger, W. J. Effect of a
predictor display on carrier landing performance - Part I -
Experimental evaluation (Part II - Laboratory mechanization, by
L. E. Erhardt, F. R. Cavallero, and R. S. Kennedy). Inglewood,
Calif.: Dunlap and Associates, Report NR 196-106, 1973.
†††††††††i~ #~,-4-
OFFICE OF NAVAL RESEARCH, CODE 455TECHNICAL REPORTS DISTRIBUTION LIST
Director, Engineering Psychology Commanding OfficerPrograms, Code 455 ONR Branch OfficeOffice of Naval Research ATTN: Mr. R. Lawson800 North Quincy Street 1030 East Creen StreetArlington, VA 22217 (5 cys) Pasadena, CA 91106
Defense Documentation Center Dr. M. Bert inCameron Station Office of Naval ResearchAlexandria, VA 22314 (12 cys) Scientific Liaison Group
American Embao.oy, Room A-407Dr. Robert Young APO San Francisco 96503Director, Cybernetics Technology OfficeAdvanced Research Projects Agency Director, Naval Research Laboratory1400 Wilson Blvd Technical Ir.Zormation DivisionArlington, VA 22209 Code 2627
Washington, D. C. 20375 (6 cys)Lt. Col. Henry L. Taylor, USAFOAD(E&LS) ODDR&E Mr. John :;illPentagon, Room 3D129 Naval Research LaboratoryWashington, D.C. 20301 Code 5767.40
"Washington, D. C. 20375Office of Naval ResearchInternational Programs Offilc. of the Chief of NavalCode 1021P Uperatiori, OP987PIO800 North Quincy Street Personnel Logistics PlaisArlington, VA 22217 (6 cys) De,-,irtment of the Navy
Washington, D. C. 20350Director of TechnologyCode 200 Hr. Arnold RubinsteinOffice of Naval Research Naval Haterial Command800 North Quincy Street NAVHAT 0344Arlington, VA 22217 Department of the Navy
Washington, D. C. 20360Director, 1le.ctromagneotics
Program, Code 221 CotanderOffice of Naval Research Naval Air Systesns Command800 North Quincy Street Iluatan Factors Programs, AIR 340FArlington, VA 22217 Washington, D. C. 20361
Commanding Officer CommanderONK Branch Office Naval Air Systems CoumandATTN: Dr. J. Lester Crew Station. Oosigu, AIR 5313495 Sumer Street Washington, 0. C. 20361Boston, HA 02210
Hr. T. NomlyamaCommanding Officer Naval Air Systems CommandONR Branch Office Advance Concepts; Division, AIR 03PAATTN: Dr. Charles Davis Washington, D. C. 20b1536 South Clark ,Vtreet
Mr. George Tsaparas Mr. Ronald A. EricksonNaval Air Systems Command, AIR 340 Human Factors BranchWashington, D.C. 20360 Code 3175
Naval Weapons Center
LCDR R. Gibson China Lake, CA 93555Bureau of Medicine & SurgeryAerospace Psychology Branch Human Factors SectionCode 513 Systems Engineering Test DirectorateWashington, D.C. 20372 U. S. Naval Air Test Center
Patuxent River, MD 20670Dr. George MoellerHuman Factors Engineering Branch Naval Training Equipment CenterSubmarine Medical Research Laboratory ATTN: Technical LibraryNaval Submarine Base Orlando, FL. 32813Groton, CT 06340
Human Factors DepartmentChief, Aerospace Psychology Division Code N215Naval Aerospace Medical Institute Naval Training EqutpInent CenterPensacola, FL 32512 Orlando, FV. 32813
Dr. Lloyd Hitchcock Dr. Cary PoockHuman Factors Engineering Department Operations Research DepartmentCrew Systems Division Naval Postgraduate SchoolNaval Air Development Center Monterey. CA 93940
Warminster, PA 18974Dr. A. L. Slafkosky
Bureau of Naval Personnel Scientific AdvisorSpecial Assistant for Research Cornandant of the Marine Corps
Dr. Fred Muckler Headqtunrters, t)epar ent' of theNavy Personnel Research and Army, t)API-P11R
Development Center Washlngton, D.C. ?'0)'46
Manned Systems Design, Code 311San Diego, CA 92152 Technicitl Director
U.S. Army Human Engineering LabsCDR Charles Theisen Aberdeen Proving GroundHuman Factors Engineering Branch Aberdven, MD 210U)Crew Systems t)epartmentNaval Air Development Center U.S. Air Forco Office of Scie, triftJohnsvil le ResearchWarminster, PA 18974 Life Scienceg Directorate, NL
BollInn Air Force RaseLCDR William Moronev Waghinton, D.C. 20312IHtman Factors Engineeriop BranchCode 1226 ta. Col. Joseph A. HirtPacific Missile Teat Ctnter IImall tn rrnl $) vislehiPoint Mugu, CA 93042 Aero.•pare Medical Rrsvt'reh 1.ahijratorý
Wright Patterson AFI0, (ON 45433
ii
Dr. W. S. Vaughan I)r. Robert FoxOceanautics, Inc. Vanderbilt University
422 6th St. Department of PsychologyAnnapolis, MD 21403 Nashville, TN 37240
Dr. Alphonse Chapanis Dr. Jesse OrlanskyThe Johns Hopkins University Institute for Defenso AnalysisDepartment of Psychology 400 Army-Navw DriveCharles & 34th Streets Arlington, VA 22202Baltimore, MD 21218
Dr. Stanley DeutschDr. Robert R. Mackie Office of Life Scienceshuman Factors Research, Inc. HOS, NASASanta Barbara Research Park 600 Independence Avenue6780 Cortona Drivw Washington, D.C. 20546,oleta, CA 93017
Director, Human Factors Wing
I)r. Gershon Wei.tman Defense & Civil Institute ofPerceptronics, Inc. Environmental Medicine6271 Variel Avenue Post Office Box 2000':oodland Hills, CA 91.364 Downsville, Toronto, Ontario
CANADADr. Edward JonesMcDonnell-Douglas Astronautics Dr. A. 1). Baddeley
Company-EAST Director, Applied Psychology Unit
St. Louis, MO 63166 Medical Research Council15 Chaucer Road
Dr. J. W. Wulfeck Cambridge, CB2 2EF
New Mexico State University ENCLAND
Department of PsychologyBox 5095 Dr. David Zaldel
Las Cruces, NM 88003 Road Safety Centre T'echnion CityHlaifa
Dr. II. Rudy Ramsey IS RAELScience Applications, Inc.40 Denver Technological Center West7935 East Prentice AvenueEnglewood, Colorado 80110
Dr. Ross L. PepperNaval Undersea CenterHawaii LaboratoryP.O. Box 997Kailua, Hawaii 96734
Dr. Robert r. PachellaUniversity of MichiganDepartment of PsychologyHuman Performance Center330 Packard RoadAnn Arbor, MI 48104