Climatology Situated in the tropics south of the equator, the Cocos Islands broadly experience two seasons: the wet (doldrums) season from November to April, and the trade wind season from May to October. The wet season is characterised by higher rainfall and greater variability in the winds. The trade wind season is characterised by reduced rainfall and almost constant east to southeast trade wind flow. There is often some overlap between the seasons, particularly in regard to rainfall, with the changing of the seasons heavily influenced by the movement of the monsoon trough. The monsoon trough migrates to its southernmost point around February, with tropical cyclones and monsoon lows most likely to affect the Islands between the months of November and April. AVIATION WEATHER HAZARDS Cocos (Keeling) Islands Airport (YPCC) Bureau of Meteorology › Aviation Weather Services Latitude: S12 11 19 Longitude: E96 49 50 Height above mean sea level: 10 ft (3 m) This pamphlet describes hazardous weather conditions for Cocos (Keeling) Islands airport. It is one of a series of pamphlets focussing on hazardous weather conditions at a number of the busier general aviation aerodromes. Pilots should regard this publication as information provided in support of official forecasts. West Island, Cocos Islands Cocos (Keeling) Islands (YPCC) Introduction Cocos (Keeling) Islands Airport is situated on West Island, one of the Keeling Islands and the largest island in the Cocos Islands group. It is located in the Indian Ocean approximately 2770 km northwest of Perth and 980 km west-southwest of Christmas Island. The islands are made up of low-lying coral atolls with a maximum elevation of 12 m (40 ft). The aerodrome itself has an elevation of 3 m (10 ft) above mean sea level. Cocos (Keeling) Islands. Image courtesy Department of the Environment
Transcript
ClimatologySituated in the tropics south of the equator, the Cocos Islands broadly experience two seasons: the wet (doldrums) season from November to April, and the trade wind season from May to October. The wet season is characterised by higher rainfall and greater variability in the winds. The trade wind season is characterised by reduced rainfall and almost constant east to southeast trade wind fl ow. There is often some overlap between the seasons, particularly in regard to rainfall, with the changing of the seasons heavily infl uenced by the movement of the monsoon trough. The monsoon trough migrates to its southernmost point around February, with tropical cyclones and monsoon lows most likely to affect the Islands between the months of November and April.
AVIATION WEATHER HAZARDS
Cocos (Keeling) Islands Airport (YPCC) Bureau of Meteorology › Aviation Weather Services
Latitude: S12 11 19
Longitude: E96 49 50
Height above mean sea level: 10 ft (3 m)
This pamphlet describes hazardous weather conditions for Cocos (Keeling) Islands airport. It is one of a series of pamphlets focussing on hazardous weather conditions at a number of the busier general aviation aerodromes. Pilots should regard this publication as information provided in support of offi cial forecasts.
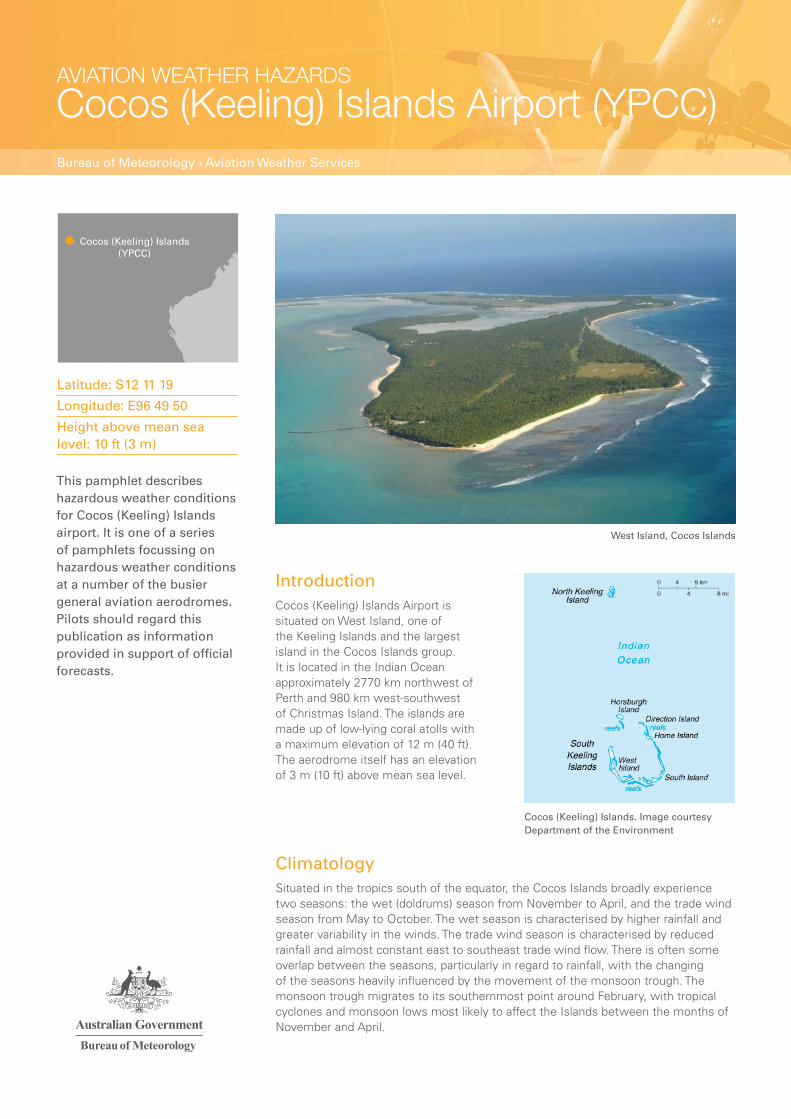
West Island, Cocos Islands
Cocos (Keeling) Islands (YPCC)
IntroductionCocos (Keeling) Islands Airport is situated on West Island, one of the Keeling Islands and the largest island in the Cocos Islands group. It is located in the Indian Ocean approximately 2770 km northwest of Perth and 980 km west-southwest of Christmas Island. The islands are made up of low-lying coral atolls with a maximum elevation of 12 m (40 ft). The aerodrome itself has an elevation of 3 m (10 ft) above mean sea level.
Cocos (Keeling) Islands. Image courtesy Department of the Environment
Rain is frequent at the Cocos Islands, with an average of 180 rain days a year or between 10 and 20 a month. The most rain tends to fall in the months between January and July. Historically, October is the driest month (averaging around 84 mm) and April is the wettest (averaging around 254 mm).
Due to the small size and minimal topography of the islands, they are virtually unaffected by any local small-scale processes. Instead, the weather generally reflects the broad-scale conditions of the surrounding ocean.
The Bureau of Meteorology office and automatic weather station (AWS) with ceilometer and visibility meter are located at the airport. The office is normally staffed during daylight hours, seven days a week, and provides manual observations.
WindThe wind around the islands is dominated by the east to southeast trade flow for much of the year, with some increased variability seen between the months of November and April. On average, the strongest winds generally occur between the months of June and October, peaking in August and September, when the trade flow is strongest. During these months the islands will often see east to southeasterly winds sustained between 15 to 20 knots, with average winds often exceeding 20 knots during August and September. Gusts up to 40 knots are possible, although these tend to be associated with showers or thunderstorms.
In the wet season, when the monsoon trough moves closer to the Islands, the wind is generally lighter and more variable in direction. Winds in these months can be from any direction, but are still predominantly southeasterly, and are generally lighter than 15 knots. The lightest average winds are observed in February, where the average recorded wind speed is below 10 knots. The exception to this is when the islands are affected by a tropical cyclone or monsoon low, when the speed and direction of the winds will depend on the proximity and position of the system relative to the islands.
Tropical cyclones and the monsoon troughTropical cyclones are a potential hazard for the region between the months of November and April. Since 1952, two such systems have been observed during the month of May; however, the risk of tropical cyclones is greatly reduced outside of the November to April period. During this time of year, the monsoon trough generally lies just to the north of the Islands, often bringing adverse weather conditions to the region. Tropical cyclones and monsoon lows often form in the monsoon trough and when these systems occur, conditions at the Islands are at their worst. The effect a tropical cyclone may have on the islands depends on its size, severity and position relative to the islands.
From 1952 to 2005, 27 tropical cyclones caused severe wind gusts of at least 48 knots in the Cocos Islands, and four have caused destructive wind gusts to 65 knots. On average, this equates to about one cyclone affecting the islands every two years.
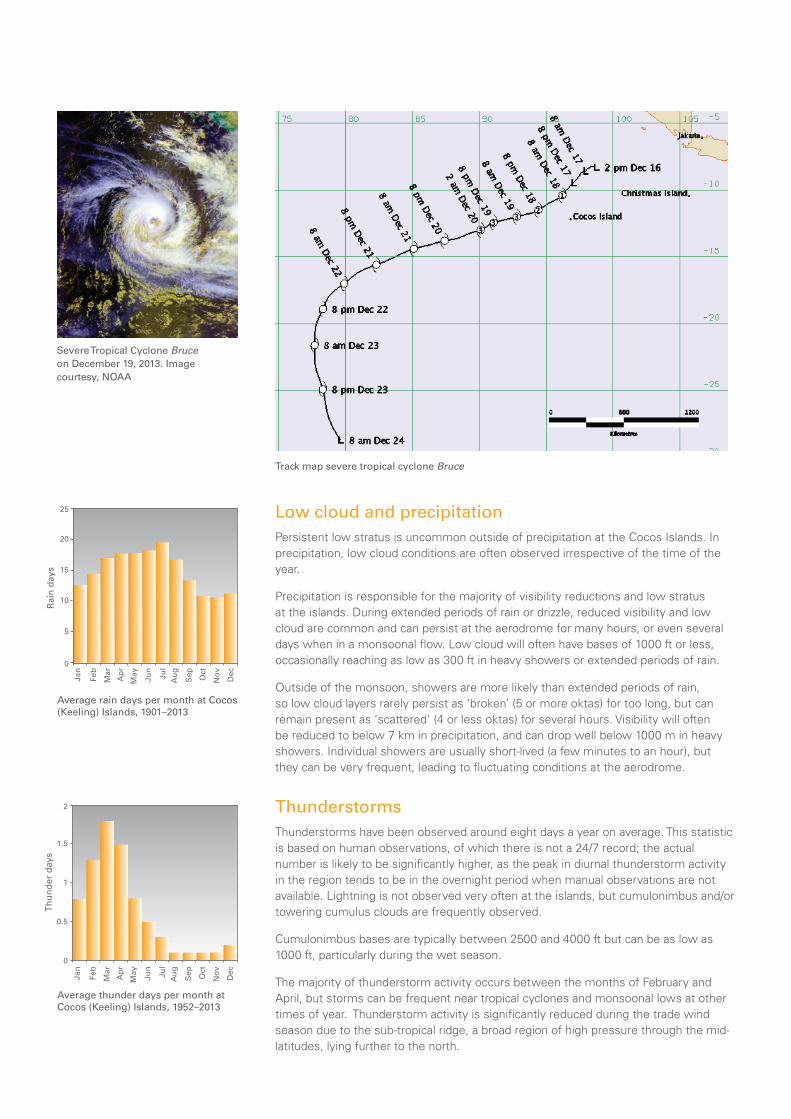
On 18 December 2013, the Cocos Islands experienced gale force winds for several hours as severe tropical cyclone Bruce passed approximately 200 km to the northwest.
When a tropical cyclone is in the vicinity of the islands, strong winds, thunderstorms, low cloud and reduced visibility and heavy rainfall can be expected. In addition, severe turbulence and icing are likely hazards to aviation during these events. These conditions can persist for several days as a tropical cyclone or monsoon low moves through the area.
With the monsoon trough in close proximity to the islands at this time of year, on occasion it can move to the south of the islands, bringing a moist north-westerly monsoonal wind regime to the area. This can lead to sustained periods of heavy rainfall that may last several days, resulting in persistent low cloud and visibility reductions at the aerodrome.
Cocos Island Automatic Weather Station
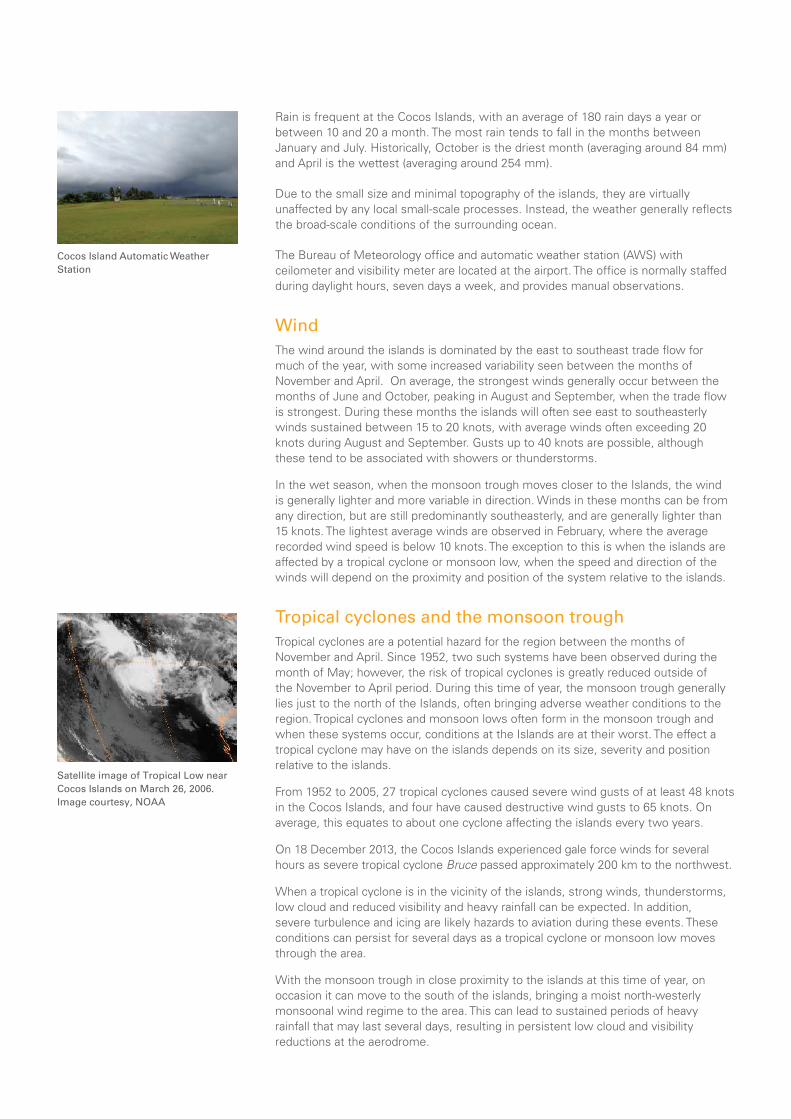
Satellite image of Tropical Low near Cocos Islands on March 26, 2006. Image courtesy, NOAA
Low cloud and precipitationPersistent low stratus is uncommon outside of precipitation at the Cocos Islands. In precipitation, low cloud conditions are often observed irrespective of the time of the year.
Precipitation is responsible for the majority of visibility reductions and low stratus at the islands. During extended periods of rain or drizzle, reduced visibility and low cloud are common and can persist at the aerodrome for many hours, or even several days when in a monsoonal fl ow. Low cloud will often have bases of 1000 ft or less, occasionally reaching as low as 300 ft in heavy showers or extended periods of rain.
Outside of the monsoon, showers are more likely than extended periods of rain, so low cloud layers rarely persist as ‘broken’ (5 or more oktas) for too long, but can remain present as ‘scattered’ (4 or less oktas) for several hours. Visibility will often be reduced to below 7 km in precipitation, and can drop well below 1000 m in heavy showers. Individual showers are usually short-lived (a few minutes to an hour), but they can be very frequent, leading to fl uctuating conditions at the aerodrome.
ThunderstormsThunderstorms have been observed around eight days a year on average. This statistic is based on human observations, of which there is not a 24/7 record; the actual number is likely to be signifi cantly higher, as the peak in diurnal thunderstorm activity in the region tends to be in the overnight period when manual observations are not available. Lightning is not observed very often at the islands, but cumulonimbus and/or towering cumulus clouds are frequently observed.
Cumulonimbus bases are typically between 2500 and 4000 ft but can be as low as 1000 ft, particularly during the wet season.
The majority of thunderstorm activity occurs between the months of February and April, but storms can be frequent near tropical cyclones and monsoonal lows at other times of year. Thunderstorm activity is signifi cantly reduced during the trade wind season due to the sub-tropical ridge, a broad region of high pressure through the mid-latitudes, lying further to the north.
Severe Tropical Cyclone Bruce on December 19, 2013. Image courtesy, NOAA
Track map severe tropical cyclone Bruce
Average rain days per month at Cocos (Keeling) Islands, 1901–2013
Average thunder days per month at Cocos (Keeling) Islands, 1952–2013
Rai
n d
ays
0
15
10
5
20
25
Jan
Feb
Mar
Ap
r
May
Jun
Jul
Au
g
Sep Oct
No
v
Dec
Th
un
der
day
s
0
0.5
1.5
1
2
Jan
Feb
Mar
Ap
r
May
Jun
Jul
Au
g
Sep Oct
No
v
Dec
Airservices Australia is the official distributor of aviation forecasts, warnings and observations issued by the Bureau of Meteorology. Airservices’ flight briefing services are available at www.airservicesaustralia.com. Telephone contact details for elaborative briefings are contained in Airservices’ Aeronautical Information Publication Australia (AIP), which is available online through their website.
Other brochures produced by the Bureau of Meteorology’s aviation weather services program can be found at www.bom.gov.au/aviation/knowledge-centre.
Other elements affecting visibilityHaze occasionally occurs at the islands, but it generally does not result in significant reductions in visibility. In strong winds, sea spray can cause reductions in visibility to below 15 km. Reduced visibility to 5000 m due to haze has been reported just twice since 1995.
Mist and fog have not been observed at the Cocos Islands. The very small land mass relative to the surrounding ocean does not allow the near-surface air to cool sufficiently overnight to form a stable layer required for fog formation.
Dust and smoke have never been reported, due to the remote maritime location of the islands.
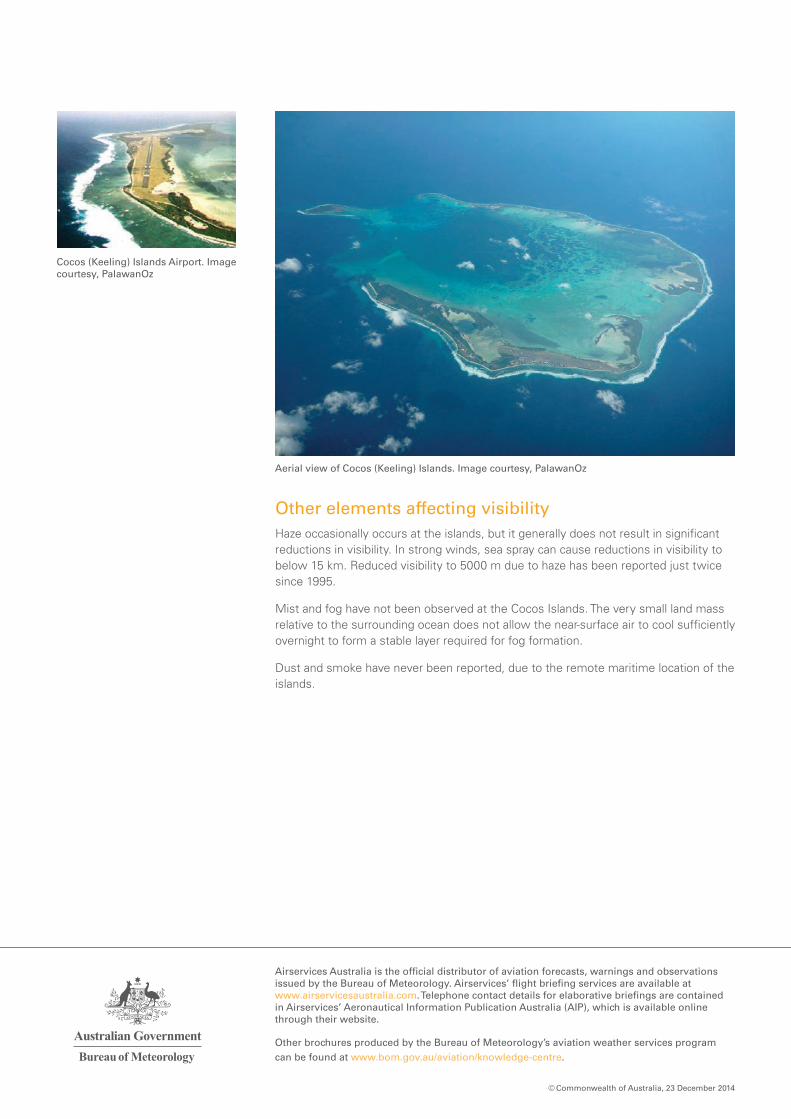
Aerial view of Cocos (Keeling) Islands. Image courtesy, PalawanOz