Page 1
© 2016, Amazon Web Services, Inc. or its Affiliates. All rights reserved.
Bob Griffiths, Solutions Architect, AWS
Brett Shriver, Senior Director, FINRA
Ricardo Portilla, Lead Architect, FINRA
December 2016
CMP316
Learn How FINRA Aligns
Billions of Time-Ordered Events
with Apache Spark on Amazon EC2
Page 2
What to Expect from the Session
• Overview of Apache Spark on
AWS
• FINRA will describe their use
of Spark for aligning time
ordered events (business
problem, solution, benefits,
lessons learned)
Page 3
AWS – Spark Overview
3
Page 4
What is Spark?
• A fast and general
engine for large-scale
data processing
• Write applications quickly
in Java, Scala, Python, R
• Run programs up to
100x faster than Hadoop
MapReduce in memory,
or 10x faster on disk To learn more, check out http://spark.apache.org
4
Page 5
Spark on AWS Compute
• Amazon EC2
• Standalone cluster mode
• Apache Mesos
• Amazon EMR
• YARN
5
Page 6
AWS Storage options
Amazon EC2 ephemeral storage (HDFS)
Amazon EBS
Amazon S3
Amazon DynamoDB
6
Page 7
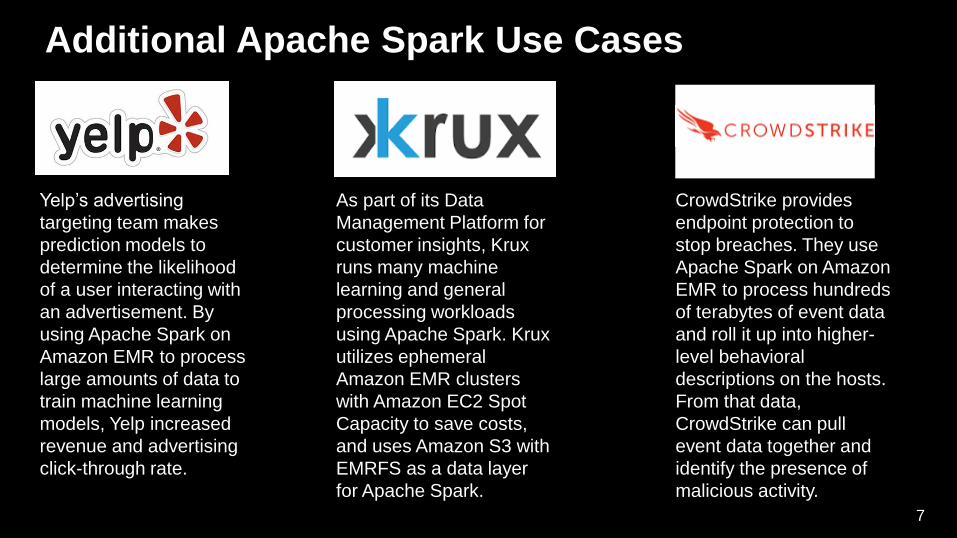
Additional Apache Spark Use Cases
Yelp’s advertising
targeting team makes
prediction models to
determine the likelihood
of a user interacting with
an advertisement. By
using Apache Spark on
Amazon EMR to process
large amounts of data to
train machine learning
models, Yelp increased
revenue and advertising
click-through rate.
As part of its Data
Management Platform for
customer insights, Krux
runs many machine
learning and general
processing workloads
using Apache Spark. Krux
utilizes ephemeral
Amazon EMR clusters
with Amazon EC2 Spot
Capacity to save costs,
and uses Amazon S3 with
EMRFS as a data layer
for Apache Spark.
CrowdStrike provides
endpoint protection to
stop breaches. They use
Apache Spark on Amazon
EMR to process hundreds
of terabytes of event data
and roll it up into higher-
level behavioral
descriptions on the hosts.
From that data,
CrowdStrike can pull
event data together and
identify the presence of
malicious activity.
7
Page 8
Spark on AWS Best Practices
8
Page 9
Separate Storage & Compute
• Optimize cluster size based on
compute requirements
• Allows selection of optimal EC2
instance types
• Shut down your cluster when not in
use
• Share data among multiple clusters
• Fault tolerance and disaster recovery
9
Page 10
Spot instances
• Bid on spare Amazon EC2 computing capacity
• Reduce operating costs by up to 50-90%
• Ideal for ephemeral compute clusters
10
Page 11
FINRA: Spark Case Study
11
Page 13
What Do We Do?
By the Numbers• We oversee more than 3,900 securities firms with approximately
640,795 brokers.
• Every day, we watch over nearly 6 billion shares traded in U.S. listed equities markets—using technology powerful enough to detect potential abuses.
• In fact, FINRA processes approximately 6 terabytes of data and up to 75 billion events every day to build a complete, holistic picture of market trading in the U.S.
• In 2015, FINRA:
• Referred over 800 fraud cases for prosecution
• Levied more than $191 million in fines & restitution
13
Page 14
Problem Statement
What data is FINRA tracking, and what do we do with it?
- Up to 75 billion events/day
- 12 markets/exchanges
- Surveillance – Compare the state of activity across different
'venues', such as quotation systems, exchanges, firms, or
trade reporting facilities
• Involves grouping events by stock symbol and venue then
ordering by event time
- Alerts for ‘venues of interest’ where suspicious activity occurs
14
Page 15
Problem Statement (cont’d)
What qualifies as suspicious activity? Actions taken by traders/brokers which disadvantage
customer orders or undermine fairness/efficiency of markets.
Individual investors Broker/Firm
Buy customer order placed – 100,000 shares
Broker buys (100 shares)
Buy customer order executes, share price increases
Broker sells high
Time
Front-running
Layering
Broker places multiple sell orders, slowing incrementing price
Customer drives price lower
Broker buys at lower price 15
Page 16
Example 1 – Intermarket Price Protection
Intermarket Price
Protection - Restrict broker
trading outside the best
publicly available bid/offer
to encourage best
execution of customer
orders
Best price = highest bid/lowest ask, broker is trading outside this band!
85K quotes/sec
< 1K trades/sec
16
Page 17
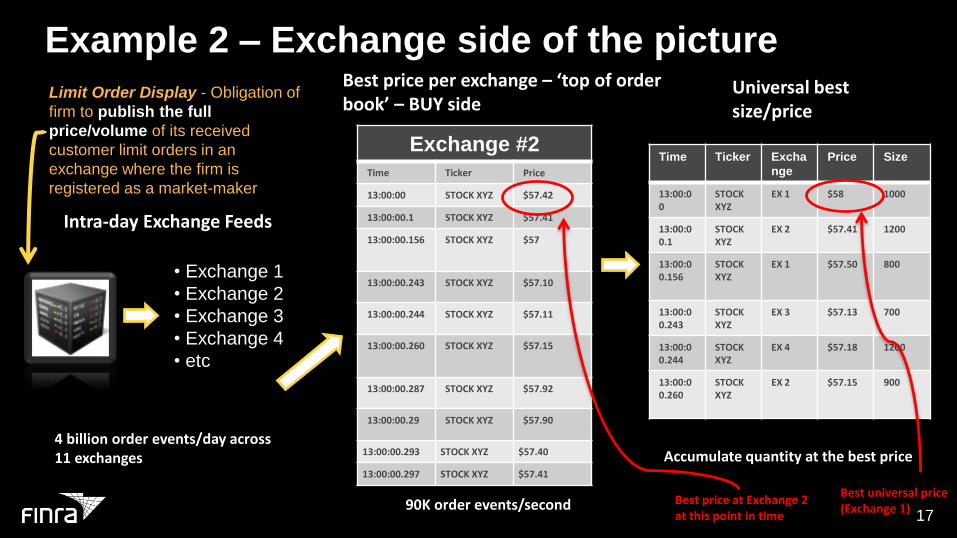
Example 2 – Exchange side of the picture
Exchange #2
Time Ticker Price
13:00:00 STOCK XYZ $57.42
13:00:00.1 STOCK XYZ $57.41
13:00:00.156 STOCK XYZ $57
13:00:00.243 STOCK XYZ $57.10
13:00:00.244 STOCK XYZ $57.11
13:00:00.260 STOCK XYZ $57.15
13:00:00.287 STOCK XYZ $57.92
13:00:00.29 STOCK XYZ $57.90
13:00:00.293 STOCK XYZ $57.40
13:00:00.297 STOCK XYZ $57.41
Intra-day Exchange Feeds
Best price per exchange – ‘top of order book’ – BUY side
90K order events/second
4 billion order events/day across 11 exchanges
Time Ticker Excha
nge
Price Size
13:00:00
STOCK XYZ
EX 1 $58 1000
13:00:00.1
STOCK XYZ
EX 2 $57.41 1200
13:00:00.156
STOCK XYZ
EX 1 $57.50 800
13:00:00.243
STOCK XYZ
EX 3 $57.13 700
13:00:00.244
STOCK XYZ
EX 4 $57.18 1200
13:00:00.260
STOCK XYZ
EX 2 $57.15 900
Universal best size/price
Limit Order Display - Obligation of
firm to publish the full
price/volume of its received
customer limit orders in an
exchange where the firm is
registered as a market-maker
Accumulate quantity at the best price
Best price at Exchange 2 at this point in time
Best universal price (Exchange 1)
17
• Exchange 1
• Exchange 2
• Exchange 3
• Exchange 4
• etc
Page 18
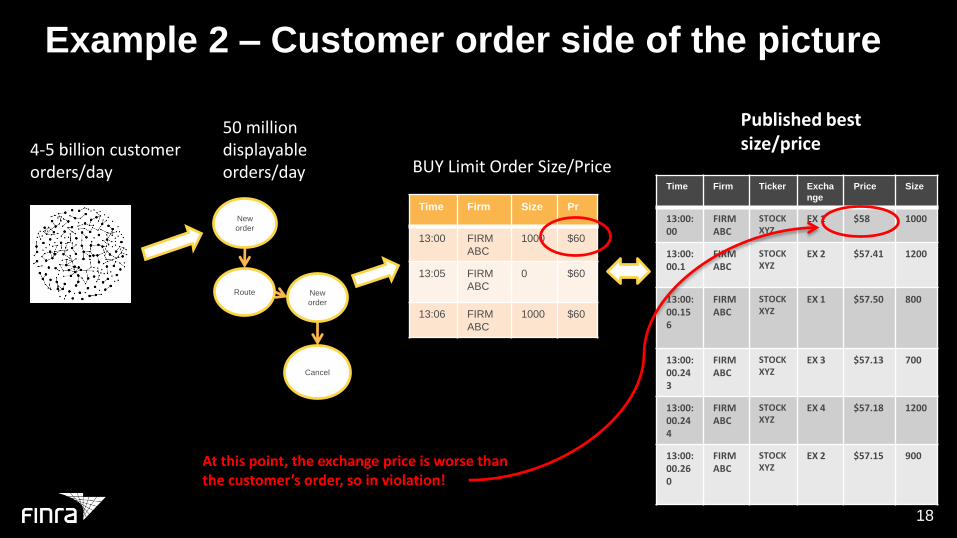
Example 2 – Customer order side of the picture
Time Firm Ticker Excha
nge
Price Size
13:00:00
FIRM ABC
STOCK XYZ
EX 1 $58 1000
13:00:00.1
FIRM ABC
STOCK XYZ
EX 2 $57.41 1200
13:00:00.156
FIRM ABC
STOCK XYZ
EX 1 $57.50 800
13:00:00.243
FIRM ABC
STOCK XYZ
EX 3 $57.13 700
13:00:00.244
FIRM ABC
STOCK XYZ
EX 4 $57.18 1200
13:00:00.260
FIRM ABC
STOCK XYZ
EX 2 $57.15 900
Published best size/price
New
order
4-5 billion customer orders/day
50 million displayable orders/day
Time Firm Size Pr
13:00 FIRM
ABC
1000 $60
13:05 FIRM
ABC
0 $60
13:06 FIRM
ABC
1000 $60
BUY Limit Order Size/Price
At this point, the exchange price is worse than the customer’s order, so in violation!
Route New
order
Cancel
18
Page 19
Legacy Solution
Storage
Compute
Proprietary processors380 cores, 380 TB disk
> 300 SQL-based
surveillances
Data off-loading
to make way for
current
data/processingData loads run
day/night
Production DB Architecture
Storage
Compute
DR – Disaster Recovery
19
Page 20
Pain Points
Pain points with the legacy solution – no longer present in
AWS/Spark architecture
- 7 figures yearly to maintain and operate
- Difficult to scale during periods of market volatility
- Storage and compute tightly coupled
- Won’t support industry movement toward real time
- Reprocessing is difficult (takes months)
- Unavailable during maintenance windows
- No control of managing internal compute model
21
Page 21
Alternatives
Key requirements of new solution:
- Scalability / elasticity
- Cost effectiveness
- Ease of coding and testing
- Platform for future real-time processing
- Support for time-based iteration
What options were considered?
- Apache Spark on Amazon EMR
- Java MapReduce
- Apache Giraph
- Apache Crunch
Page 22
Spark Processing ApproachTime
T
T
T
T
Venue = Quoting Facility Q = Externally quoted/displayed data
Q
Q
Q
Q
Q
Q
Q
Q
• What makes this comparison difficult? • Have to join on ticker and firm -> large partitions• Instead of joining -> union, sort, and iterate
Turns an M x N problem into an M + N problem.
Venue = Trade Reporting FacilityT = Surveillance events (e.g. trades)
Q
20
Page 23
AWS ArchitectureAmazon S3 Storage
Input Bucket
Output Bucket
Spark on EMR ComputeSpot m1.xlarge (I/O intensive)
Spot m2.4xlarge (shuffle intensive)
Spot m3.2xlarge (compute intensive)
23
Page 24
Choosing Spot InstancesThis architecture gets us:
Flexibility / Elasticity
I/O intensive instances for portions of code (m1.xlarge)
Shuffle-heavy (m2.4x)
Time-based computations (compute optimized -> m3.2x)
Cost Savings
Targeting AWS Spot Instance types to match these profiles saved us 3X the cost. We also pinpointed instances which were not too volatile.
24
Page 25
Benefits
Realized Benefits
• Order of magnitude cost savings vs. on-premises database
architecture
• Increased speed on reprocessing requests
• Scalability, etc.
Expected Future Benefits
• Supports real-time processing (as data providers migrate to real time)
• Easier experimentation with new instance types
• Convert more surveillance to this model
25
Page 26
FINRA’s Future Plans
• Capture additional benefits of Spark, such as use of data
frames API for easier manipulations and optimization
• Migrate additional workloads onto Spark – currently 240
surveillance applications are implemented in Hive but would
benefit from Spark
• Some experiments at FINRA show 2X speed with Spark vs Hive
for same design
• Use new AWS APIs
• Move toward real time (coordinating with data providers)
26
Page 28
Remember to complete
your evaluations!
28
Page 29
Related Sessions
FINRA Sessions:
- BDM203 – Building a Secure Data Science Platform
- DAT302 – Best Practices for Migrating to RDS / Aurora
- ENT313 – FINRA in the Cloud, Big Data Enterprise
- STG308 – Data Lake for Big Data on Amazon S3
- SVR202 – What’s new with Lambda
29