Page 1
University of Southern Queensland
Faculty of Health, Engineering & Sciences
Study of effects of coarse grain contents on Atterberg limits
and expansiveness of the clay
A dissertation Submitted by
Suman Shrestha
In fulfillment of the requirement of
Courses ENG4111 & 4112 Research Project
towards the degree of
Bachelor of Engineering (Civil)
Submitted: October 2016
Page 2
i
Abstract
Expansive soil, which experiences significant volume change associated with change in water
content, can cause severe distress to the structure build on them. It may be noted that repair
of damaged infrastructures built on expansive soil costs billions of dollars annually.
Especially roadways and small building are subjected to severe cracking and distress due to
surface movements resulting from wetting and drying of expansive soil. Therefore
geotechnical researchers have developed several measures to stabilise the soil by improving
its expansive characteristics of soil. Soil stabilisation techniques aim at improving soil
strength and increasing resistance to softening by water through bonding the soil particles
together, water proofing the particles or combination of the two (Sherwood, 1993).
The research aims to study the effect of sand content on a selected, expansive clay type,
namely kaolinite clay. In this study, kaolinite is mixed with a coarse grain material (fine sand)
at various percentages by weight as a measure to stabilise/treat the expansive soil. Atterberg
limits tests (liquid limit and plastic limit) and expansive properties (swelling potential and
swelling pressure) tests are performed in the lab. The experiment results indicate that liquid
limit, plastic limit, swelling potential and swelling pressure are reduced with increased fine
sand content. The reduction of Atterberg limits is almost linear to the increment of sand
content. However, change in swelling potential and swelling pressure is very significant when
the sand content is increased from 25% to 50%. Further increase in sand content above 50%
does not indicate significant changes in either swell pressure or potential. Therefore, further
investigations need to be performed with more variation in percentage of sand content
between 25 to 50%.
In addition to above Atterberg limits and expansive characteristics, this study aims to measure
natural rebound or swell caused by unloading process and total swelling. Loading and
unloading cycles were introduced to measure the swelling amount as well swell pressure. The
literature does not provide adequate information on attempts to measure above two
components on individual basis. However, the tests were carried out under ambient conditions
or uncontrolled humidity, due to limited laboratory facilities. Nevertheless, this new
contribution to knowledge can encourage future research in this direction to provide much
useful information to geotechnical engineers.
Page 3
ii
University of Southern Queensland
Faculty of Health, Engineering and Sciences
ENG4111 and 4112 Research Project
Limitations of Use
The Council of the University of Southern Queensland, its Faculty of Health, Engineering
and Sciences, and the staff of the University of Southern Queensland, do not accept any
responsibility for the truth, accuracy or completeness of material contained within or
associated with this dissertation.
Persons using all or any part of this material do so at their own risk, and not at the risk of the
Council of the University of Southern Queensland, its Faculty of Health, Engineering and
Sciences or the staff of the University of Southern Queensland.
This dissertation reports an educational exercise and has no purpose or validity beyond this
exercise. The sole purpose of the course pair entitles “Research Project” is to contribute to
the overall education within the student’s chosen degree program. This document, the
associated hardware, software, drawings, and any other material set out in the associated
appendices should not be used for any other purpose: if they are so used, it is entirely at the
risk of the user.
Page 4
iii
Certification of Dissertation
I certify that the ideas, designs and experimental work, results, analyses and conclusions set
out in this dissertation are entirely my own effort, except where otherwise indicated and
acknowledged.
I further certify that the work is original and has not been previously submitted for assessment
in any other course or institution, except where specifically stated.
Suman Shrestha
Student Number: u1025914
Page 5
iv
Acknowledgments
The author would like to thank the following people for their assistance in completing this
dissertation:
Dr Buddhi Wahalathantri (Project Supervisor) for his constant technical guidance, feedback
and support during this project.
Dr Kazem Ghabraie for his suggestion in the selection of this topic and his guidance during
the initial phase of the research.
My family for their continued encouragement, support and patience throughout the course of
the degree.
Suman Shrestha
University of Southern Queensland
October 2016
Page 6
v
Table of Contents
Abstract ......................................................................................................................i
Limitations of Use .................................................................................................... ii
Certification of Dissertation .................................................................................... iii
Acknowledgements ..................................................................................................iv
List of Figures ........................................................................................................ vii
List of Tables ........................................................................................................ viii
1 Introduction .................................................................................................. 1
1.1 Project aims & objectives ............................................................................ 2
2 Literature Review ......................................................................................... 3
2.1 Basic Soil Properties .................................................................................... 3
2.1.1 Particle Size Distribution ................................................................. 4
2.1.2 Atterberg Limits .............................................................................. 4
2.2 Expansive Soils ............................................................................................ 5
2.2.1 Background ..................................................................................... 5
2.2.2 Mechanism of Swelling ................................................................... 8
2.2.3 Swell-Shrink Behaviour .................................................................. 9
2.3 Identification of Expansive Soils ................................................................ 10
2.3.1 Engineering Classification Test ..................................................... 11
2.3.2 Mineralogical Methods .................................................................. 13
2.3.3 Cation Exchange Capacity (CEC) ................................................ 14
2.3.4 Free Swell ...................................................................................... 16
2.3.5 Potential Volume Change .............................................................. 16
2.3.6 Expansive Index Test (EI) ............................................................ 17
2.3.7 California Bearing Ratio (CBR) Test ............................................ 17
2.3.8 Coefficient of Linear Extensibility ................................................ 18
2 Material and Methodology ......................................................................... 20
3.1 Material Description ................................................................................... 20
Page 7
vi
3.1.1 Kaolinite ........................................................................................ 20
3.1.2 Fine Sand ....................................................................................... 21
3.2 Testing Program ......................................................................................... 22
3.2.1 Liquid Limit .................................................................................. 22
3.2.2 Plastic Limit .................................................................................. 23
3.2.3 Plasticity Index .............................................................................. 24
3.2.4 Swelling Potential & Swelling Pressure ........................................ 25
4. Results & Discussion.................................................................................. 28
4.1 Liquid Limit, Plastic Limit & Plasticity Index Tests ................................. 28
4.2 Swelling Potential Tests ............................................................................ 30
4.3 Swelling Pressure Tests .............................................................................. 33
4.4 Correlation between Atterberg limits and expansiveness of soil ................ 35
5. Conclusion ................................................................................................. 39
6. Recommendations for further work ............................................................ 40
7. References .................................................................................................. 41
Appendix A Project Specification ...................................................................... 45
Appendix B Tabulated Results of Liquid limit & Plastic limit tests .................. 47
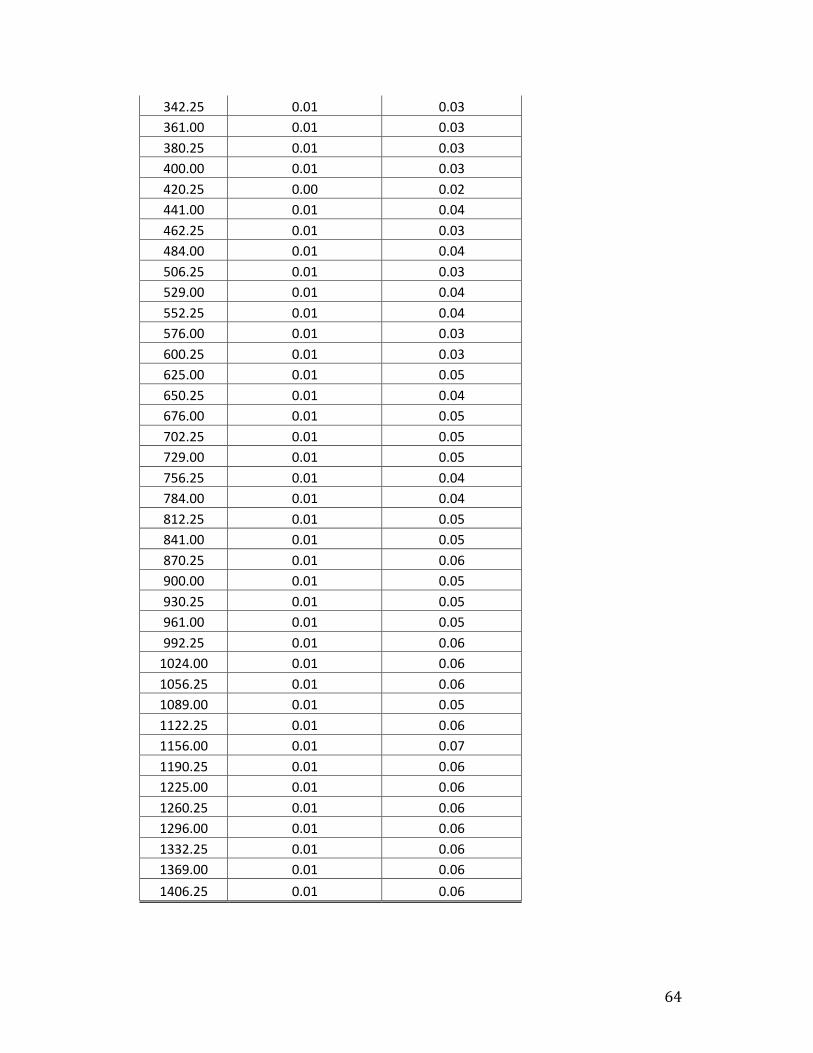
Appendix C Test data for Oedometer test .......................................................... 51
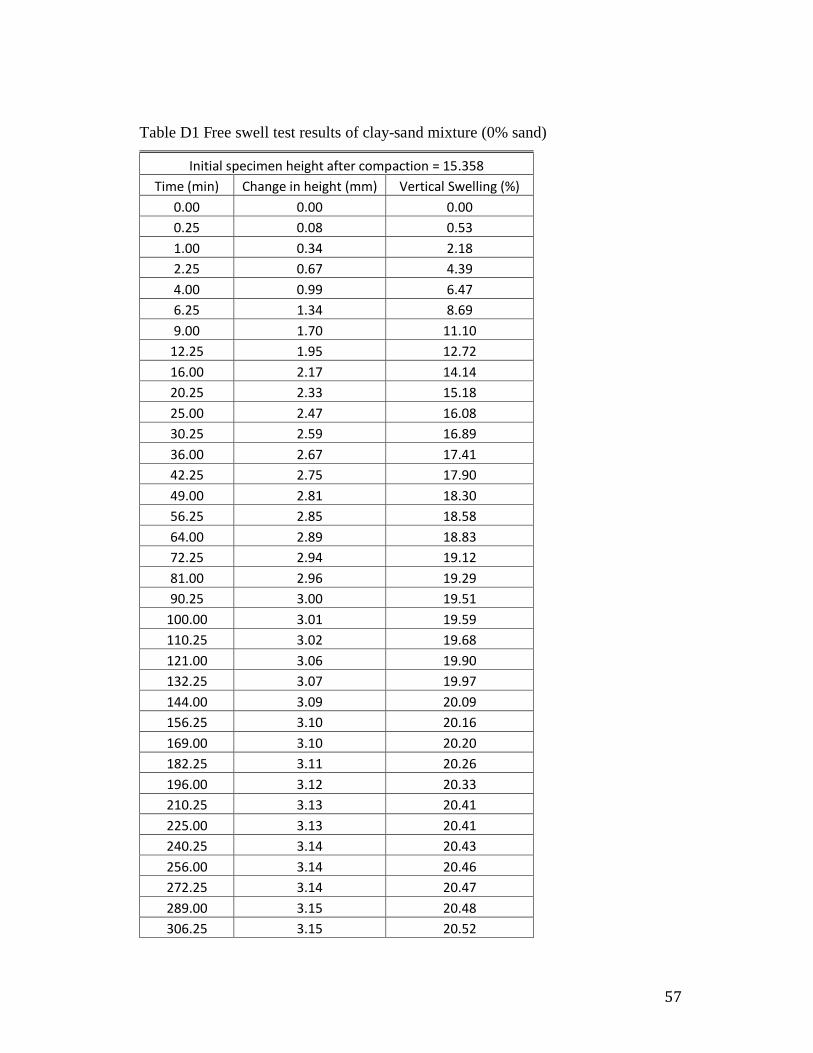
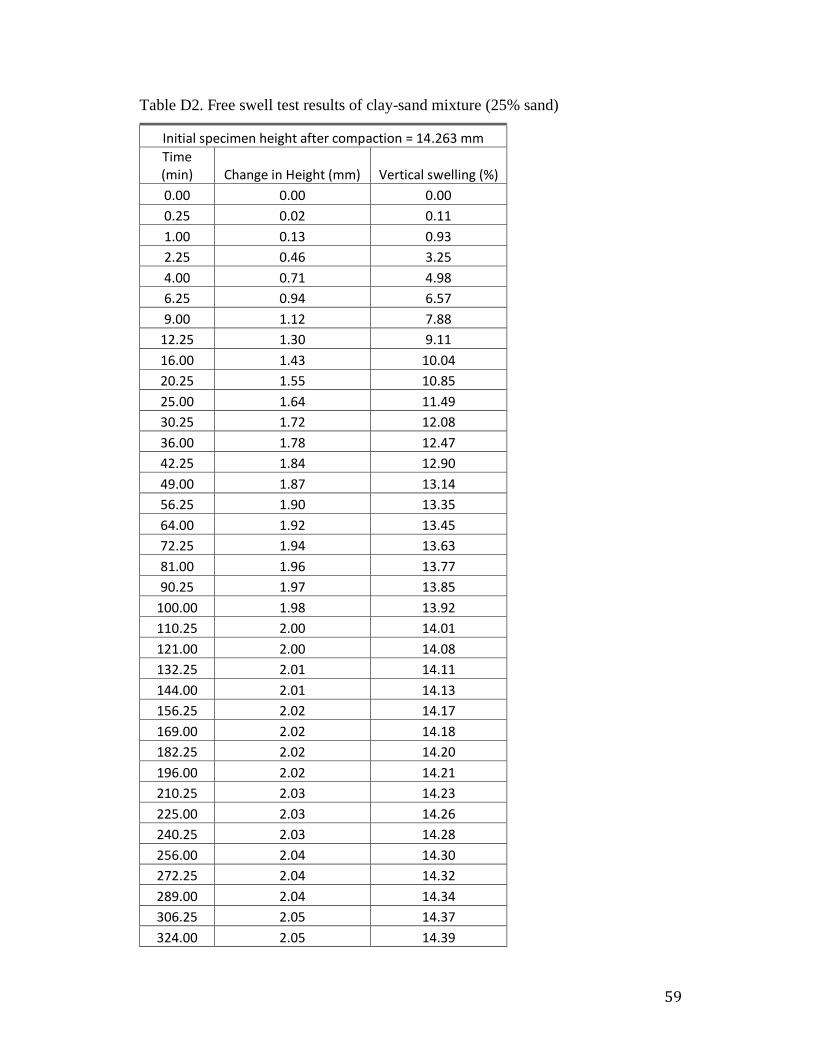
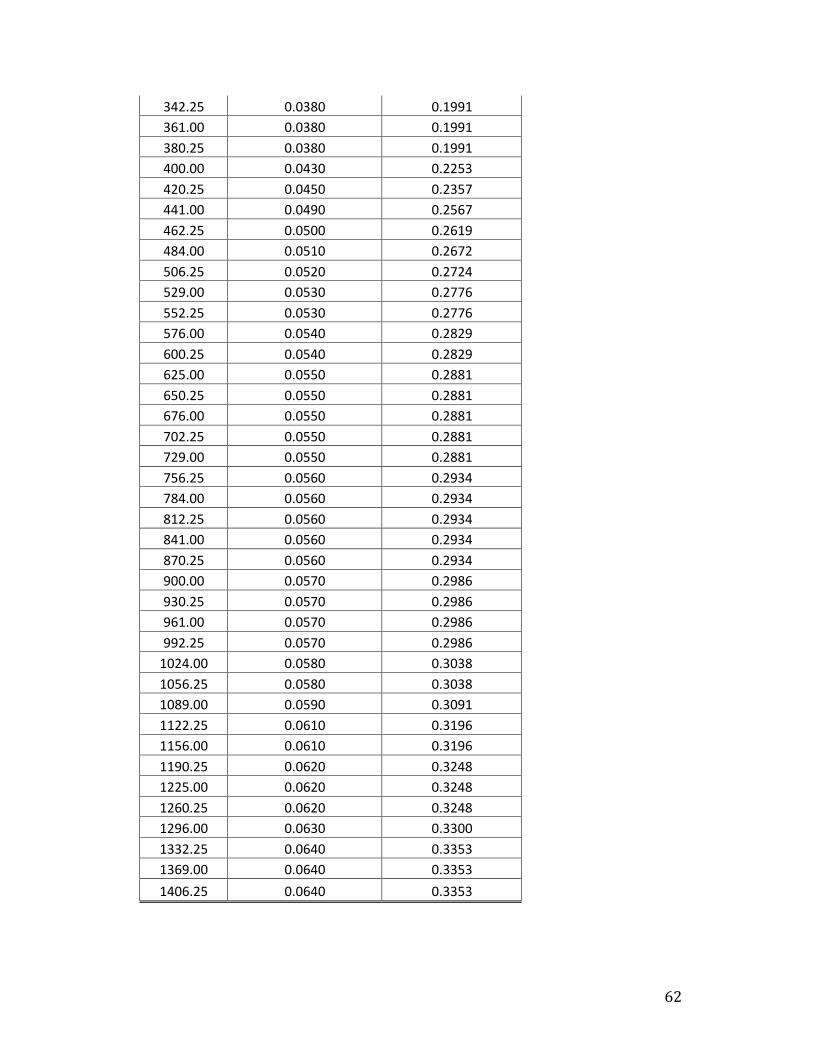
Appendix D Tabulated Results of Oedometer free swell tests ........................... 56
Appendix E Risk Assessment ............................................................................ 65
Page 8
vii
List of Figures
Figure 1. Different States and Limits (Das, 2006) ................................................................................... 5
Figure 2 Distribution of Cracking Clays within Queensland (Queensland Department of
Main Roads, 2000) ............................................................................................................................................... 7
Figure 3. Distribution of Vertisols in Australia (Harms, n.d.) ............................................................. 8
Figure 4. Clay Minerals: a) Kaolinite, b) Illite, c) Montmorillonite (Craig, 2004)...................... 9
Figure 5. Swelling potential based on activity and clay (Seed et al, 1962) ................................. 13
Figure 6. Mineralogical classification (Pearing, 1963; Hold, 1969) .............................................. 15
Figure 7. Expansive potential indication from CEAc and activity (Nelson & Miller, 1992) 16
Figure 8. Kaolin (Eckalite 1) clay ................................................................................................................ 21
Figure 9. Fine uniform sand ........................................................................................................................... 22
Figure 10. Cone penetrometer for determining liquid limit ............................................................... 23
Figure 11. Rolling of soil mass on ground glass to determine plastic limit (Das, 2008) ........ 24
Figure 12. One dimensional oedoemeter for determining swell potential and swelling
pressure .................................................................................................................................................................. 26
Figure 13. Variation of Liquid limit, plastic limit and plasticity index with % of sand ......... 29
Figure 14. Time-swell curve .......................................................................................................................... 32
Figure 15. Variation of swelling pressure with % of sand ........................................................... 33
Figure 16. Variation in swelling potential and swelling pressure with respect to
plasticity index .................................................................................................................................................. 35
Figure 17. Modified Plasticity Chart (Cimen et al., 2012) ................................................................. 37
Page 9
viii
List of Tables
Table 1. Plasticity in terms of liquid limits (Australian Standards, 1993) ...................................... 5
Table 2. Expansive soil classification based on plasticity index (Chen, 1988) .......................... 11
Table 3. Expansive soil classification based on Atterberg limits and in situ suction (Snethen
et al., 1977) ........................................................................................................................................................... 11
Table 4. Classes of Clay in terms of Activity (Skempton, 1953) .................................................... 12
Table 5. Cation exchange capacities of various minerals (Mitchell, 1976) ................................. 14
Table 6. Classification of Potential Expansion of soils using EI (ASTM D4829) .................... 17
Table 7. Expansive soil classification with Atterberg limits and potential swell (Austroads,
2004) ....................................................................................................................................................................... 18
Table 8. Soil Mixture (proportions) used in the current testing program ..................................... 20
Table 9. Particle size distribution of fine sand ........................................................................................ 21
Table 10. Liquid Limit, Plastic Limit & Plasticity index of Kaolinite clay mixed with fine
sand .......................................................................................................................................................................... 28
Table 11. Expansive Index and swelling potential classification of clay-sand mixtures ........ 30
Table 12. Swelling of clay-sand mixture before and after addition of water .............................. 32
Table 13. Swelling pressure and total pressure of clay-sand mixtures..................................34
Page 10
1
1 Introduction
Soil is a complex material with different engineering properties that may vary due to many
factors such as soil mineralogy, environment and stress. Expansive soils are the ones that
undergo large amounts of heaving and shrinking due to seasonal moisture changes. Like any
other soil deposits, expansive soils are usually heterogeneous in composition and each deposit
is different from every other deposit.
Expansive soils are found in many parts of the world particularly in semi-arid regions where
the evapotranspiration exceeds the precipitation. They are generally unsaturated and contain
clay minerals that exhibit high volume upon wetting and drying. Expansive soil when wetted
will apply a considerable pressure against the structure built on it. Structures such as roadways
and small buildings built on expansive soil are often subjected to serious cracking and distress.
The solution to the problem of foundations on expansive soils cannot be achieved without an
understanding of the fundamental characteristics of expansive soils and the variables involved
that affect the swelling phenomena. Safe and economic designs of founds on expansive soils
require determining the swelling indices such as swelling, pressure, swelling potential and
swelling index (ElKholy, 2008).
The major problem in expansive soil is excessive volume change. Change of volume in
foundation soil is usually accompanied by change in shear strength. Shear strength and
volume change are important variables usually considered in the design and construction of
building foundations, pavement (roads), embankments and retaining structures.
Due to expansive soil, the distressed infrastructure problems have resulted in billions of
dollars of repair costs annually (Nelson and Miller, 1992). Therefore geotechnical researchers
have developed many measures to reduce the expansiveness of soils. One of the techniques
of treatment of expansive soil is with a wide range of additives. The current study seeks to
improve expansive properties of soil by addition of non-expansive soil which is coarser than
0.425mm.
Page 11
2
1.1 Project Aims and Objectives
Expansive soil is the one that experiences significant volume change associated with changes
in waters contents. Extensive studies have been conducted regarding the properties of
expansive soil. Due to the global distribution of expansive soils many different ways to tackle
the problems have been developed and these can vary considerably. Full replacement of
expansive soil layers and treatment of expansive soil with a wide of range of additives are of
the two main techniques used in order to improve the properties of expansive soil.
The main aim of the research is to study the characteristics of commercially available
expansive soil (i.e., kaolinite) and find the improvement in their engineering properties with
the addition of non-expansive soil (i.e., fine uniform sand). The present study mainly focuses
on Atterberg limits (liquid limit, plastic limit and plasticity index) and swelling indices such
as swelling potential and swelling pressure of expansive soil.
An experiment based study is carried out to investigate and analyse the relationships of
characteristics of expansive soil with and without coarse grain non-expansive soil.
The objectives of this project can be summarised as follows:
To study plasticity properties (Atterberg limits) of soil
To understand the nature of expansive soils and their properties
To perform laboratory tests to study the characteristics of expansive soils when mixed
with coarse-grained (non-expansive soil)
To seek a correlation between Atterberg limits and swelling characteristics of
expansive soils
Page 12
3
2 Literature Review
Expansive soils, which undergo large volume changes when subject to the actions of wetting
and dying, present significant geotechnical and structural engineering challenges all around
the world costing several billions annually. The importance and necessity of knowledge of
expansive soil properties and physical behaviours is reviewed in this literature review. A
particular emphasis has been given to the following topics to gain a thorough understanding
of the essential engineering properties of expansive soil.
• Basic soil properties
• Expansive soil background
• Swell-shrink properties
• Identification and classification of expansive soils
2.1 Basic Soil Properties
Soil is comprised of minerals, solid organic matter, water and air. The compositions of these
components greatly influence soil physical properties, including texture, structure and
porosity, the fracture fraction of pore space in a soil. These properties in turn affect air and
water movement in the soil and thus the soil’s ability to function. The understanding and
knowledge of soil materials found in the construction site is the first step to be developed
before the design stage. It is essential to know its basic characteristics as thoroughly as
possible because soil behaves in a complex manner in different conditions. Only after the
basic characteristics of soil are known, its engineering properties can be defined. In this
section, brief description of soil and different soil classification systems that are used
worldwide are presented.
Soil is a natural aggregate of mineral grains such as rocks, which can be separated by means
of agitation in water (Murthy, 2003). It is a complex engineering material, which can be
simply described as cohesionless or cohesive. Coarse grained are cohesionless soils in which
the majority of the soil particles are greater than 75μm in size such as gravel, sand and
boulders. These soils are also called granular soils, which are influenced by the comparative
proportions of the different shape, size of particles and the density where gravitational forces
determined their engineering characteristics. Fine-grained soils are cohesive soils in which
the most of the soil particles are less than 75μm in size such as clay and silt.
Page 13
4
Generally the smallest particle size that can be differentiated with the naked eye is one of
about 75μm. The engineering behaviour of this soil type is dependent on the mineralogy of
the fine soil particles and water content where interparticle forces are predominant (Murthy,
2003). Soil is formed due to the weathering of the parent rock, which takes place in arid
climates (Murthy, 2003). The structure behaviour depends on the geotechnical properties of
soil materials in which the structure builds on. Australian Standards (1993) use the index
properties such as particle distribution and Atterberg Limits (plasticity) to classify coarse
grained and fine-grained soils respectively.
2.1.1 Particle Size Distribution
Sieve Analysis is used to determine the particle size distribution of a coarse grained soil. A
prepared dry soil sample is shaken thoroughly and passed through a stack of sieves that consist
of different apertures. The percentage of soil particles passed through different sizes of sieves
is calculated as a percentage of the total dry sample mass. In case of fine-grained soils,
Hydrometer Analysis is used to determine the particle size distribution where soils are
combined with distilled water to make 1000 ml of suspension. Then the hydrometer is used
to measure the density of the solution for specific times. The time-density data is used to
calculate the percentage of particle sizes for the required 48 hours period where observations
are required to be made.
Both coarse and fine grains are quite commonly found in the soil, which makes it necessary
to perform sieve and hydrometer analysis to determine the complete particle size distribution.
The preferred way to carry out these tests is to perform sieve analysis first and then
hydrometer test to the particles that passed the 75μm sieve. Then the particle size distribution
is calculated cumulatively according to the percentage passing each sieve.
2.1.2 Atterberg Limits
The engineering properties of fine-grained soils vary significantly depending on the amount
of moisture available within soils. A. Atterberg in early 1900 developed the limiting moisture
contents for key physical states, which are known as Atterberg Limits, and this consists of
liquid limit, plastic limit, and shrinkage limit (Das, 2006) as shown in figure 2. K. Terzaghi
in the late 1920’s and A. Casagrande in early 1930’s refined these limits in order to make it
suitable for geotechnical works. (Sivakugan, 2000).
Page 14
5
The Atterberg limits are the behaviour of soil in a solid, plastic and liquid due to the variation
in the range of the moisture content. The liquid limit (LL) of a soil is the percentage of water
content above, which the soil behaves as a liquid. The plastic limit (PL) is defined as the
percentage of moisture content above which the soil behaves as plastic. Plasticity Index (PI)
is the difference between the liquid limit and plastic limits. The shrinkage limit is defined as
the percentage of moisture content below which the soil will not shrink when dried. Figure 1
below summarizes the description of these states, limits and indices.
Figure 1. Different States and Limits (Das, 2006)
AS 1726 – 1993 stated that the fine-grained soils (clay and silt) can be described according to
their plasticity, which is shown in below table 1.
Table 1. Plasticity in terms of liquid limits (Australian Standards, 1993)
Descriptive Term Range of Liquid limit (%)
Of low plasticity ≤ 35
of medium plasticity > 35 ≤ 50
of high plasticity > 50
Page 15
6
2.2 Expansive Soil
2.2.1 Background
Expansive soil is the one that changes in volume in relation to changes in water content. The
volume changes can either be in the form of swell upon absorption of water or in the form of
shrinkage upon evaporation, and therefore they are sometimes known as swell/shrink soils or
swelling soils or reactive soils.
All the infrastructures are built on foundations, which largely influence infrastructure
structural performance. If the foundation soil tends to expand or contracts, it can cause failure
in the structures. With naturally available soils, clays with high plasticity are classified as
expansive soils as clays possess change in volume when subjected to moisture variations
(Yang, H et al., 2007). Chen (1988) defined that Montmorillonite clay has the high swell
shrink potential. Soil with swell potential can be often referred as vertisols, which contain
clay minerals those possess a net negative electrical charge imbalance attracting the positive
pole of dipolar water molecules and cations due to their natural physiochemical properties
(Snethen, 1980). A huge numbers of infrastructure, particularly those with low self-weight,
experience the problems created by reactive soils associated with serviceability performance
mostly in the form of cracks and permanent deformation.
The expansive soils are found in humid environment, air or semi-arid regions of the tropical
and temperate climate zones and are widely distributed over almost all geographical locations
worldwide, Australia, Ethiopia, India and USA to name a few countries (Chen, 1988; Jones
and Jefferson, 2015). In the United States, it was estimated that expansive soils affected
structures worth billions of dollars, particularly to light building and pavements, more than
any other natural hazard, including earthquakes and floods (Nelson and Miller, 1992). In
Australia, expansive soils are widely distributed. It was estimated that 20% of the surface
soils of Australia could be classified as expansive (Richards et al., 1983).
In Queensland, expansive or reactive soils are referred to by soil scientists as “Cracking
Clays” or, more commonly, as “Black Soils” (Dept. of Main Roads QLD, 2000). The
distribution of these Cracking Clays by land area covers approximately one third of the state.
Figure 2 illustrates the extent of these types of soils within Queensland, based on geological
soil mapping.
Page 16
7
Figure 2 Distribution of Cracking Clays within Queensland (Queensland Department of
Main Roads, 2000)
Six out of eight of Australia’s largest cities have clay foundation soils that consist of a higher
proportion of expansive potential (Fityus et al., 2004). O’Malley and Cameron (n.d.) stressed
that the western suburbs of Sydney and Brisbane, the western and northern suburbs of
Melbourne, the foothills of Perth, almost the whole of suburban Adelaide and many regional
centres of Australia are underlain by expansive soils in Australia.
Page 17
8
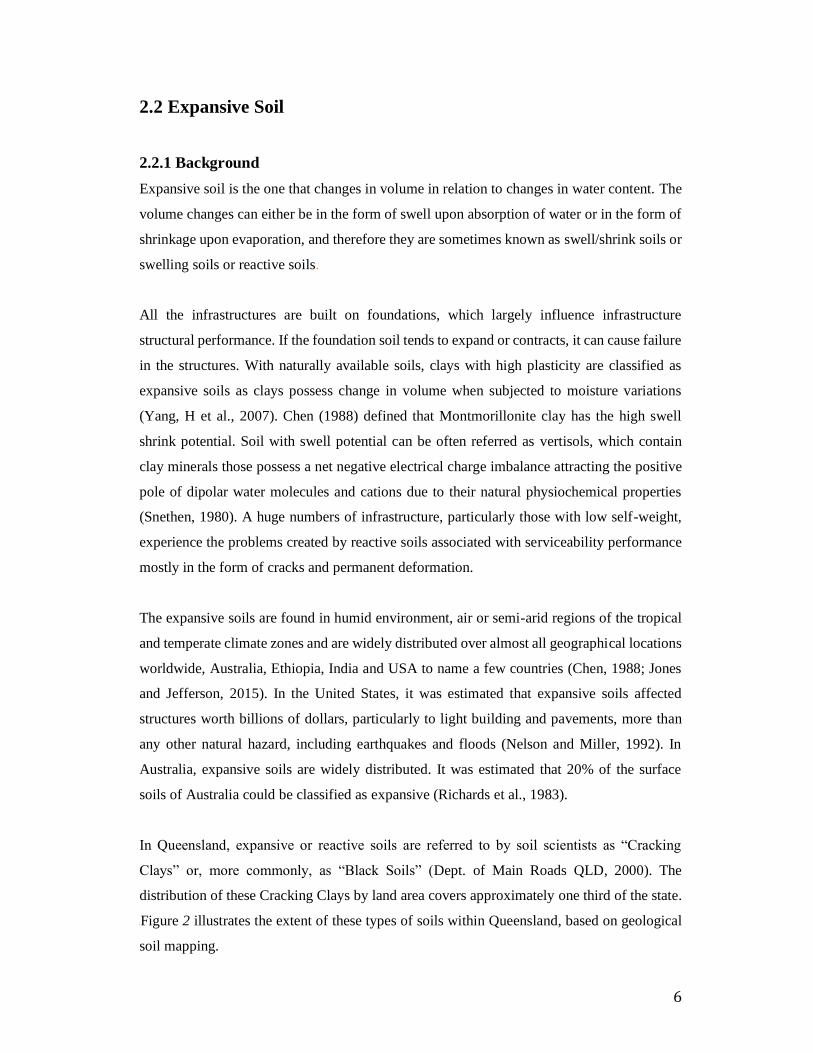
Most of the light structures in Adelaide have cracks due to excessive foundation distortion
created by expansive clays (Morgan and Kagawa, 1994). According to Harms (n.d.), 12% of
the country is covered by Vertisols in Australia as shown in Figure 3.
Figure 3. Distribution of Vertisols in Australia (Harms, n.d.)
2.2.2 Mechanism of Swelling
The extent of change in volume in expansive soils highly depends on its clay minerals. As the
particle size distribution influence the engineering behaviour of coarse-grained soils, clay
doesn’t get influence by this distribution. However colloidal properties such as absorption of
water due to large specific surface area of the soil particles influence the physical behaviour
of the clay soils (Grim 1953). There are three important types of clay minerals, namely,
Kaolinite, Illite and Montmorillonite as shown in figure 4 (Das, 2006).
As these clays are of plate like appearance, they have a high specific surface resulting in major
impact on their properties (Craig, 2004). Most of the clay minerals consist of silicon-oxygen
tetrahedron and aluminium-hydroxyl octahedral as their structural units from which, different
types of clays are formed in different stacking sheets with various types of bond between
these sheets (Craig, 2004).
Page 18
9
Figure 4. Clay Minerals: a) Kaolinite, b) Illite, c) Montmorillonite (Craig, 2004)
Kaolinite consists of the combination of a layer of a single sheet of silica tetrahedron with
layer of a single sheet of alumina octahedron by hydrogen bonding. This strong hydrogen
bonding minimizes the interlayer space between the sheets, which helps to reduce in
expansion of clay mineral.
The Illite consists of an alumina octahedron sheet that is sandwiched between two silica sheets
by potassium ions bonding. Das (2006) described that these potassium ions provide relatively
weak bonding as it allows the higher amount of water cations to be absorbed. This causes
increasing in expansion rate than that of Kaolinite but less than Montmorillonite.
Montmorillonite clay has a structure similar to that of Illite except the presence of potassium
ion bonding between the combined sheets (Das, 2006). Therefore, the large space between
the combined layers attracts a large amount of water molecules and exchangeable cations.
This resulting in weak bonding between the combined sheets which provides clay the freedom
to swell in considerable amount due to the additional water being absorbed (Craig, 2004).
Alternatively, the loss of moisture content during dry season causes substantial volumetric
change.
2.2.3 Swell-Shrink Behaviour
The variation in moisture content causes the change in volume within soil, which is generally
termed as swell-shrink potential. The volume of soil decreases or shrinks as it dries out and
this causes desiccation cracks to appear due to internal stresses in the shrunken and dried soils
mass. The soil increases its volume when it gets wet by swelling and this closed the open
cracks resulting rises in the soil level.
Page 19
10
The shrink-swell potential of expansive soils is assessed by water content, void ratio, internal
structure, vertical stresses and the type and amount of clay minerals in the soil. The clay
minerals that are present in the soils largely influenced the natural expansiveness of the soil,
which includes smectite, montmorillonite and illite. Fine grained soils with higher amount of
clay are prone to swelling as they can absorb large quantities of water during rainy season
whereas these soils become very hard and dry during hot summer, resulting in shrinking and
cracking the ground. This activity of hardening and softening of soil is referred as ‘shrink-
swell behaviour’.
2.3 Identification of Expansive Soils
The identification of expansive soils is essential before any design stages of infrastructures.
According to Hamilton (1977) it is very important to identify the potential swelling or
shrinking of subsoil problems for the selection of adequate foundation. It helps to determine
the feasibility and selection of the construction site as well as subsequent performance of the
structure.
Expansive soils are different from other soils and they can be distinguishable by their ability
to swell from the imbibition of water with resulting volume change (Snethen et al., 1975).
The knowledge of expansive soils will provide the indication of soil strata that possess the
swell–shrink activity. Failure to identify these soils will result in extensive damage to
structures.
According to Nelson and Miller (1992), there are various existing methods to identify the
swelling potential of soils, which are listed as:
• Engineering Classification Test
• Mineralogical Methods
• Cation Exchange Method
• Free Swell
• Potential Volume Change (PVC)
• Expansion Index Test
• California Bearing Ratio (CBR)
• Coefficient of Linear Extensibility (COLE)
Page 20
11
Engineering classification test, mineralogical methods and cation exchange methods are
indirect methods, which involve the use of soil properties and classification schemes to
estimate swell shrink properties whereas other remaining tests are direct methods to determine
the actual swelling potential in the soil. These are briefly described in this section.
2.3.1 Engineering Classification Test
Index properties such as particle size distribution, clay content and plasticity are the most
widely used for identifying and classifying expansive soils (Nelson and Miller, 1992). As the
Atterberg limits define the consistency of fine-grained soils (clay) in four states depending on
the water content, Plasticity Index is extensively used for classifying swelling potential which
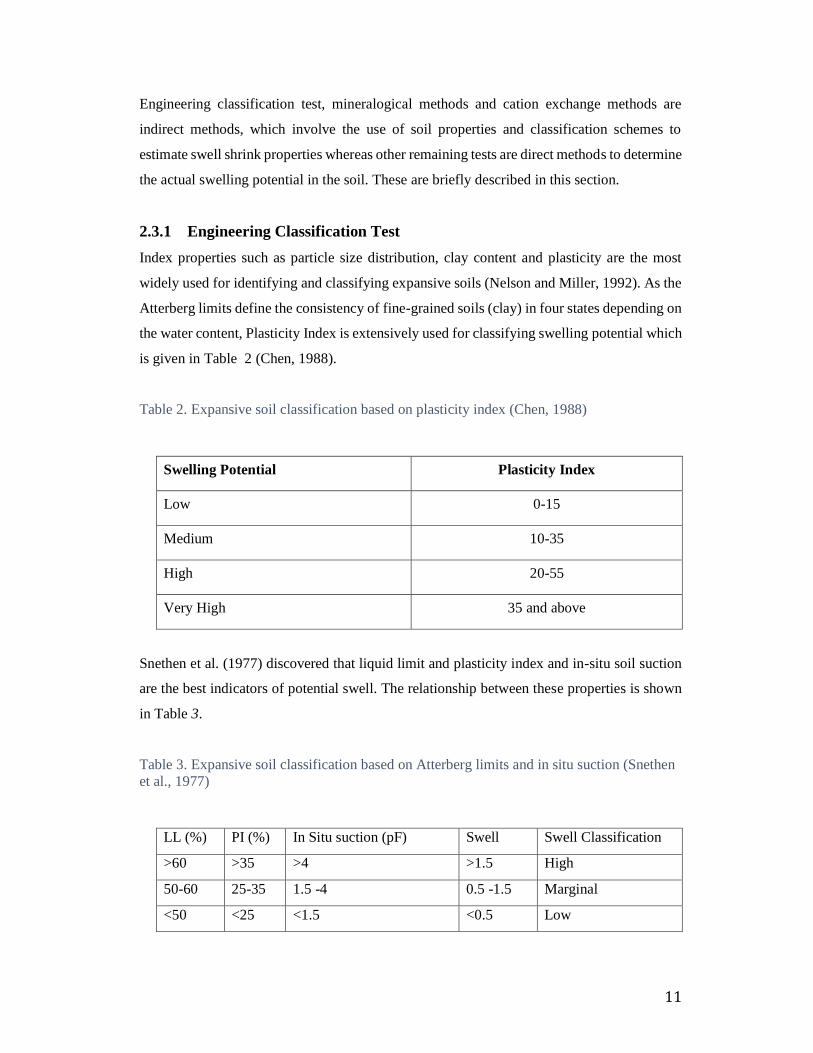
is given in Table 2 (Chen, 1988).
Table 2. Expansive soil classification based on plasticity index (Chen, 1988)
Swelling Potential Plasticity Index
Low 0-15
Medium 10-35
High 20-55
Very High 35 and above
Snethen et al. (1977) discovered that liquid limit and plasticity index and in-situ soil suction
are the best indicators of potential swell. The relationship between these properties is shown
in Table 3.
Table 3. Expansive soil classification based on Atterberg limits and in situ suction (Snethen
et al., 1977)
LL (%) PI (%) In Situ suction (pF) Swell Swell Classification
>60 >35 >4 >1.5 High
50-60 25-35 1.5 -4 0.5 -1.5 Marginal
<50 <25 <1.5 <0.5 Low
Page 21
12
New Zealand Standards ‘NZS 3604:1999 – Timber Framed Buildings’ also described
expansive soils as those soils that have a liquid limit of more than 50 % and linear shrinkage
of more than 15 %. The linear shrinkage is defined as the percent decrease in the length of a
bar of soil dried in an oven from the liquid limit. If the linear shrinkage is high, it indicates a
large potential shrinkage of the soil on drying which could pose the serious damage to the
foundation.
The expansive soil characteristics are dependent on the amount of clay present in the soil.
Nelson and Miller support this information saying the amount of colloidal particles (less than
0.001mm) directly influences the plasticity characteristics and volume change behaviour of
soils. Skempton (1953) developed the relationship by combining Atterberg limits and clay
content into a single parameter called the Activity. The activity is defined as follows:
Ac = Plasticity Index
Clay content in percentage
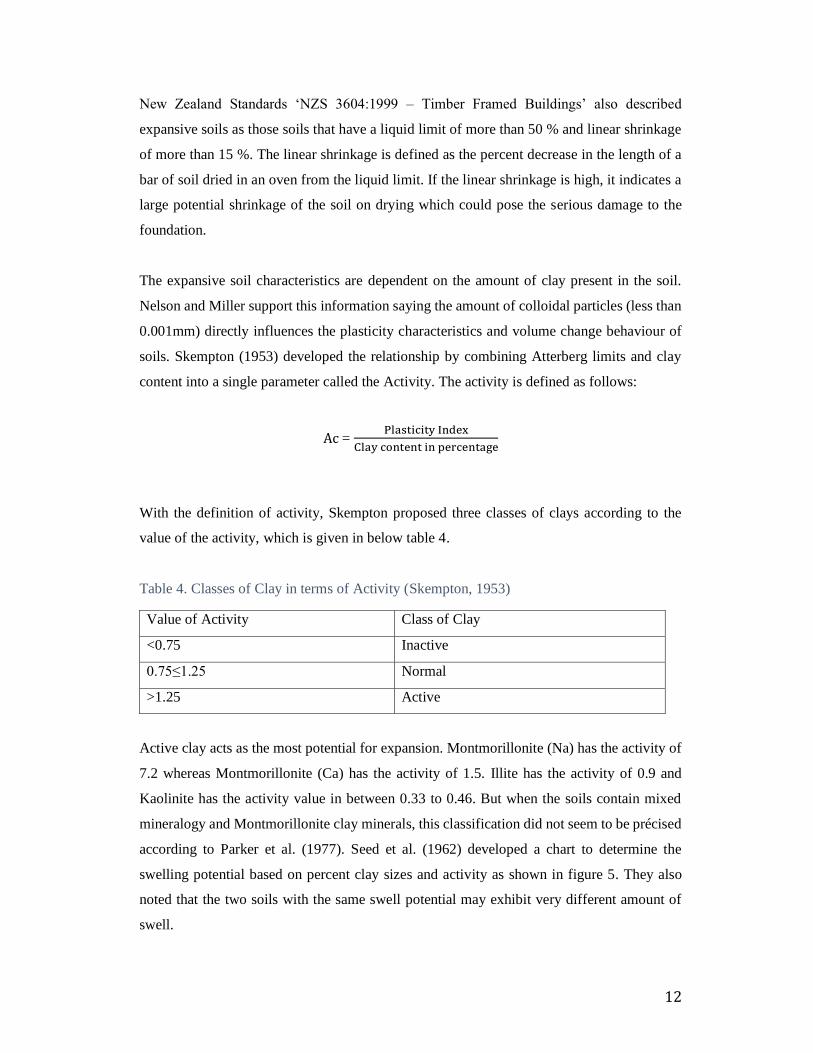
With the definition of activity, Skempton proposed three classes of clays according to the
value of the activity, which is given in below table 4.
Table 4. Classes of Clay in terms of Activity (Skempton, 1953)
Value of Activity Class of Clay
<0.75 Inactive
0.75≤1.25 Normal
>1.25 Active
Active clay acts as the most potential for expansion. Montmorillonite (Na) has the activity of
7.2 whereas Montmorillonite (Ca) has the activity of 1.5. Illite has the activity of 0.9 and
Kaolinite has the activity value in between 0.33 to 0.46. But when the soils contain mixed
mineralogy and Montmorillonite clay minerals, this classification did not seem to be précised
according to Parker et al. (1977). Seed et al. (1962) developed a chart to determine the
swelling potential based on percent clay sizes and activity as shown in figure 5. They also
noted that the two soils with the same swell potential may exhibit very different amount of
swell.
Page 22
13
Figure 5. Swelling potential based on activity and clay (Seed et al, 1962)
2. 3.2 Mineralogical Methods
The expansive soil’s swelling and shrinking behaviour greatly depends on the type and
amount of clay minerals present in the soil (Ranjan and Rao, 2012). With variety of techniques
available, X-ray diffraction methods are one of the most popular methods, which provides
detailed information about the atomic structure of crystalline substances. As the different
minerals with the various patterns of crystalline structures will diffract X-rays to yield
different X-ray diffraction patterns, the types of minerals and proportion present in the soils
can be known (Ranjan and Rao, 2012). Other methods to determine mineralogy in soils
include differential thermal analysis (DTA) and electron microscopy (Nelson and Miller,
1992).
Page 23
14
2.3.3 Cation Exchange Capacity (CEC)
Chen (1988) describes the CEC as the charge or electrical attraction for cation per unit mass
measured in milliequivalents per 100 grams of soil. Excess salts present in the soil are
removed first and adsorbed cations are replaced by saturating the soil exchange sites with a
known species in this test procedure. Then the original cation complex composition is
determined by the chemical analysis of the original extract (Nelson and Miller, 1992). CEC
is related to the amount and type of clay present in a soil. As CEC increases, the swell potential
increases because high CEC values are the indicator of a high surface activity. Specific ranges
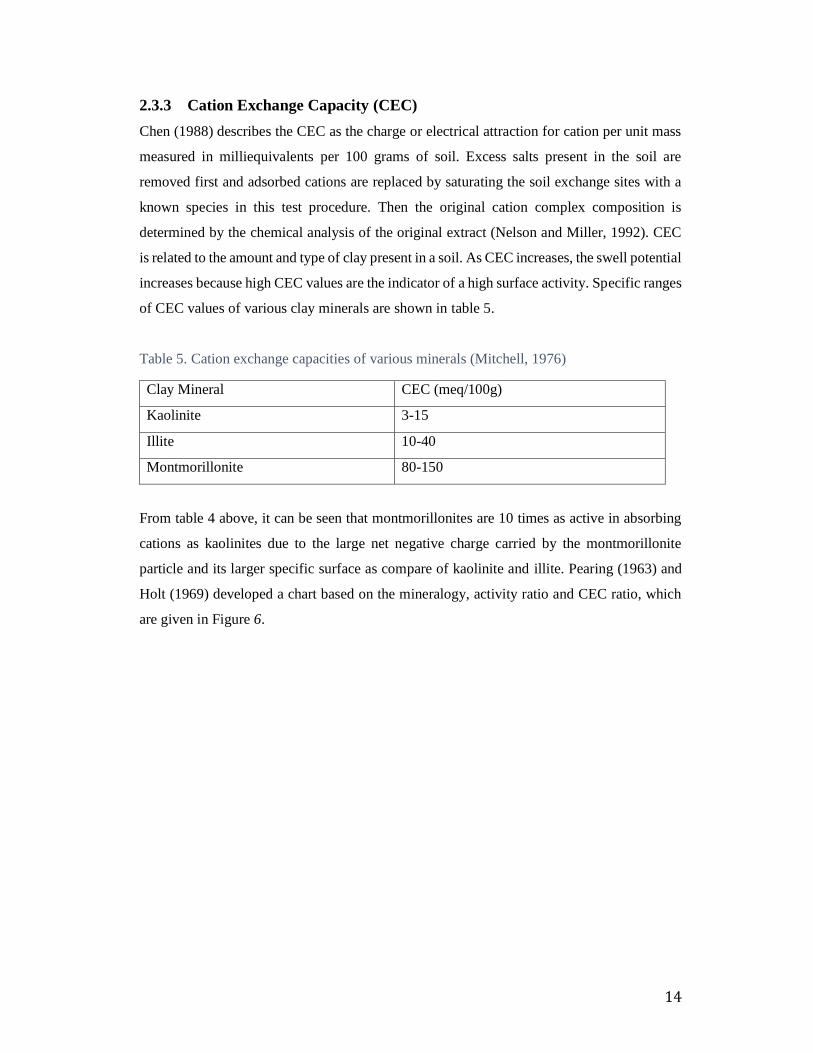
of CEC values of various clay minerals are shown in table 5.
Table 5. Cation exchange capacities of various minerals (Mitchell, 1976)
Clay Mineral CEC (meq/100g)
Kaolinite 3-15
Illite 10-40
Montmorillonite 80-150
From table 4 above, it can be seen that montmorillonites are 10 times as active in absorbing
cations as kaolinites due to the large net negative charge carried by the montmorillonite
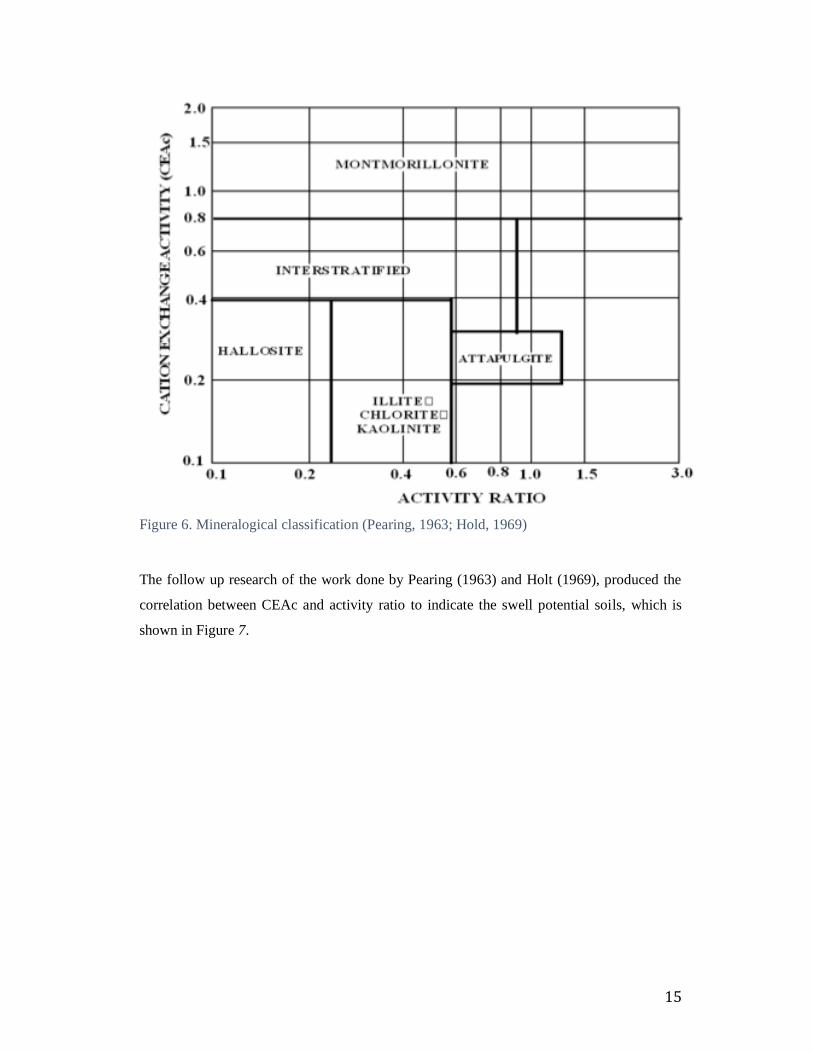
particle and its larger specific surface as compare of kaolinite and illite. Pearing (1963) and
Holt (1969) developed a chart based on the mineralogy, activity ratio and CEC ratio, which
are given in Figure 6.
Page 24
15
Figure 6. Mineralogical classification (Pearing, 1963; Hold, 1969)
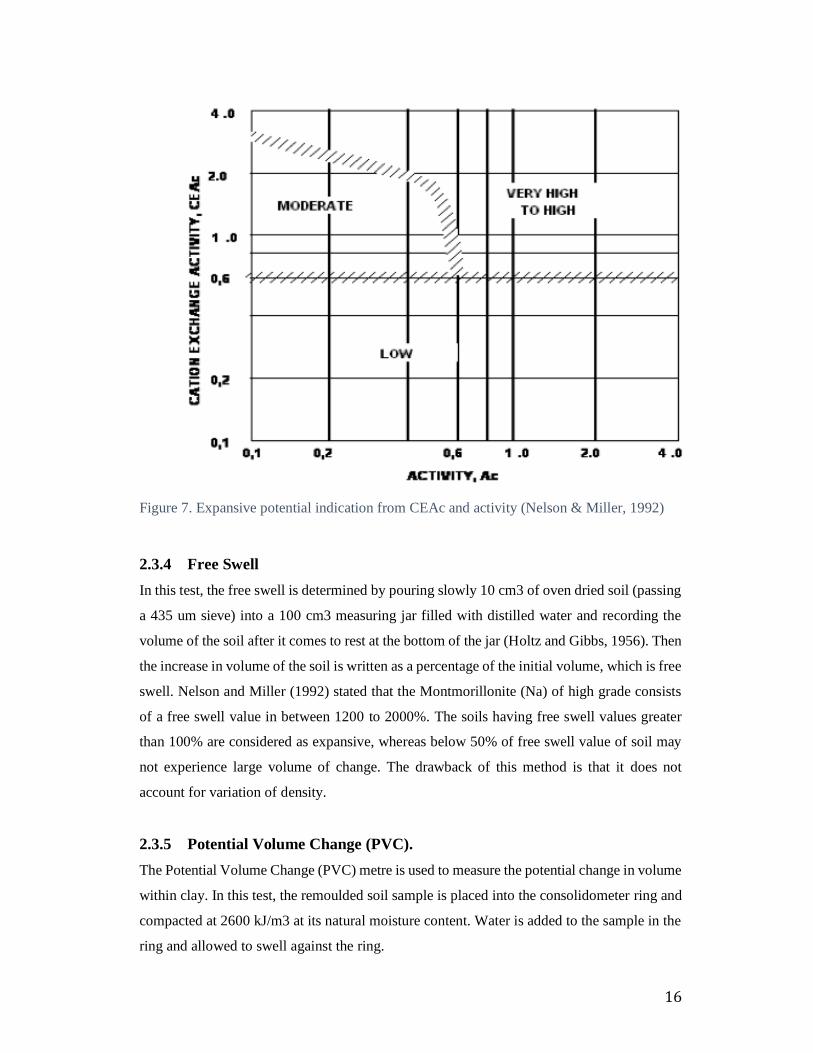
The follow up research of the work done by Pearing (1963) and Holt (1969), produced the
correlation between CEAc and activity ratio to indicate the swell potential soils, which is
shown in Figure 7.
Page 25
16
Figure 7. Expansive potential indication from CEAc and activity (Nelson & Miller, 1992)
2.3.4 Free Swell
In this test, the free swell is determined by pouring slowly 10 cm3 of oven dried soil (passing
a 435 um sieve) into a 100 cm3 measuring jar filled with distilled water and recording the
volume of the soil after it comes to rest at the bottom of the jar (Holtz and Gibbs, 1956). Then
the increase in volume of the soil is written as a percentage of the initial volume, which is free
swell. Nelson and Miller (1992) stated that the Montmorillonite (Na) of high grade consists
of a free swell value in between 1200 to 2000%. The soils having free swell values greater
than 100% are considered as expansive, whereas below 50% of free swell value of soil may
not experience large volume of change. The drawback of this method is that it does not
account for variation of density.
2.3.5 Potential Volume Change (PVC).
The Potential Volume Change (PVC) metre is used to measure the potential change in volume
within clay. In this test, the remoulded soil sample is placed into the consolidometer ring and
compacted at 2600 kJ/m3 at its natural moisture content. Water is added to the sample in the
ring and allowed to swell against the ring.
Page 26
17
Then the swell index is measured as the pressure on the ring, which is correlated to qualitative
ranges of PVC. As the remoulded samples are used in this test, the results of PVC meter tests
is only advantageous to estimate shrink-swell behaviour but cannot be used as design
parameters for in place soils.
2.3.6 Expansion Index Test (EI)
The expansion index (EI) was developed in California and used to evaluate building sites
(Nelson and Miller, 1992). According to American Society for Testing and Materials (ASTM)
in accordance to the ASTM D4829 testing method, this method is used to determine the
expansion potential of soils for practical engineering applications. In this test, the soil is
passed through a No. 4 sieve (4.75mm) and bringing to achieve approximately optimum
moisture content. Then the soil is compacted into a 10.2 cm diameter standard meld and a 6.9
kappa pressure is applied. Volume change is recorded for up to 24 hours.
The expansion index is calculated as follows:
Expansive Index = ∆H
H x 1000
Where ∆H = percent swell
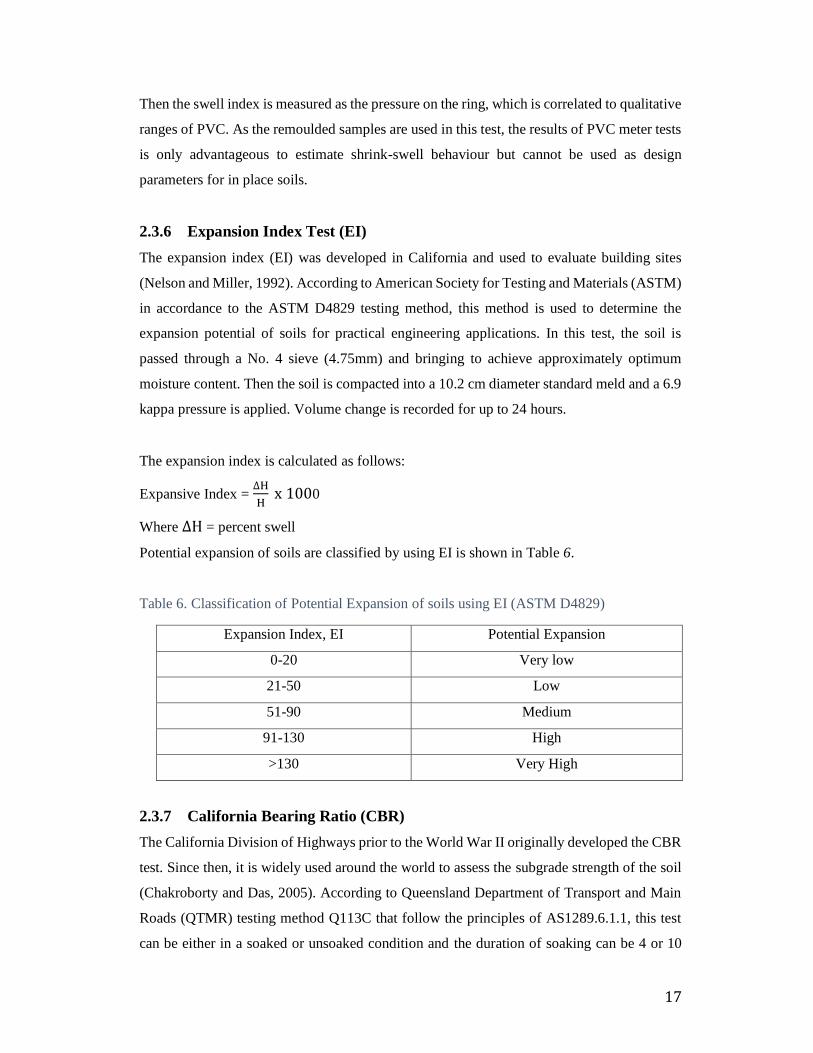
Potential expansion of soils are classified by using EI is shown in Table 6.
Table 6. Classification of Potential Expansion of soils using EI (ASTM D4829)
Expansion Index, EI Potential Expansion
0-20 Very low
21-50 Low
51-90 Medium
91-130 High
>130 Very High
2.3.7 California Bearing Ratio (CBR)
The California Division of Highways prior to the World War II originally developed the CBR
test. Since then, it is widely used around the world to assess the subgrade strength of the soil
(Chakroborty and Das, 2005). According to Queensland Department of Transport and Main
Roads (QTMR) testing method Q113C that follow the principles of AS1289.6.1.1, this test
can be either in a soaked or unsoaked condition and the duration of soaking can be 4 or 10
Page 27
18
days. This test is performed to determine vertical swell of fine-grained soils before measuring
the penetration resistance (Nelson and Miller, 1992). In this test, Soils are compacted into 152
mm internal diameter CBR test cylinders at different moistures and densities that soaked in
water under a surcharge load for 4 days for 4 days soaked CBR test. Then swell percentage is
measured with the help of dial gage during and after the 4 days soaked period. Then the
sample is drained for 15 minutes prior to the penetration test.
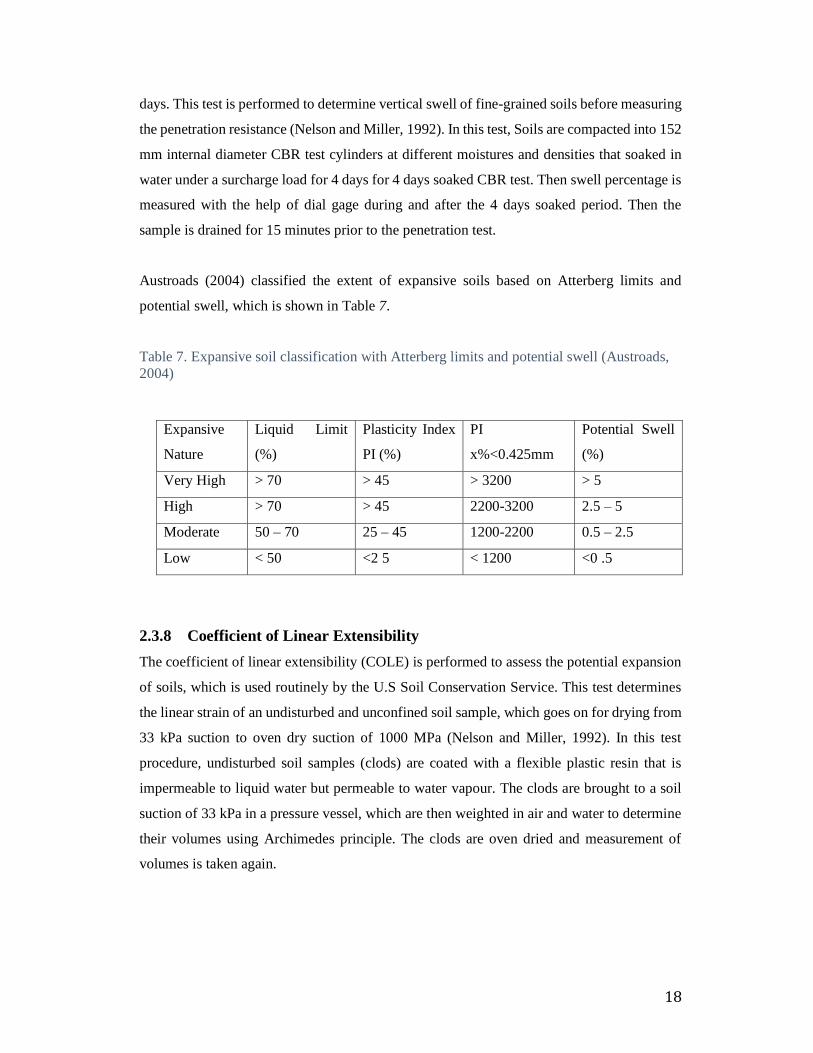
Austroads (2004) classified the extent of expansive soils based on Atterberg limits and
potential swell, which is shown in Table 7.
Table 7. Expansive soil classification with Atterberg limits and potential swell (Austroads,
2004)
Expansive
Nature
Liquid Limit
(%)
Plasticity Index
PI (%)
PI
x%<0.425mm
Potential Swell
(%)
Very High > 70 > 45 > 3200 > 5
High > 70 > 45 2200-3200 2.5 – 5
Moderate 50 – 70 25 – 45 1200-2200 0.5 – 2.5
Low < 50 <2 5 < 1200 <0 .5
2.3.8 Coefficient of Linear Extensibility
The coefficient of linear extensibility (COLE) is performed to assess the potential expansion
of soils, which is used routinely by the U.S Soil Conservation Service. This test determines
the linear strain of an undisturbed and unconfined soil sample, which goes on for drying from
33 kPa suction to oven dry suction of 1000 MPa (Nelson and Miller, 1992). In this test
procedure, undisturbed soil samples (clods) are coated with a flexible plastic resin that is
impermeable to liquid water but permeable to water vapour. The clods are brought to a soil
suction of 33 kPa in a pressure vessel, which are then weighted in air and water to determine
their volumes using Archimedes principle. The clods are oven dried and measurement of
volumes is taken again.
Page 28
19
The change in volume of sample from the moist to oven dry state is COLE and is given by,
COLE =∆L
∆LD= [ (
γdD
γdM)
0.33
− 1]
Where
∆L
∆LD= Linear strain relative to dry dimensions
γdD = dry density of oven dry sample
γdM = dry density of sample at 33kPa suction
Page 29
20
3 Materials and Methodology
3.1 Material Description
This chapter describes the materials and methodology selected for laboratory tests. Soils used
are commercially available Kaolinite and uniform fine sand. As mentioned, the purpose of
the study is to study of effect of addition of non-expansive soil (fine sand) to expansive soil,
i.e. kaolinite. The tests conducted are liquid limit, plastic limit, plasticity index and expansive
characteristics, swelling potential (vertical swell) and swelling pressure.
The above tests are performed on original clay sample and after mixing the sample with fine
sand at various percentage by weight, namely 25%, 50% and 75%. The soil tests are
performed following the Australian Standards 1289 for general soil properties and free swell
technique for swelling indices. Table 8 shows a total of 4 samples with various proportions
of sand.
Table 8. Soil Mixture (proportions) used in the current testing program
Sample S1 S2 S3 S4
Clay (soil) 100% 75% 50% 25%
Sand 0% 25% 50% 75%
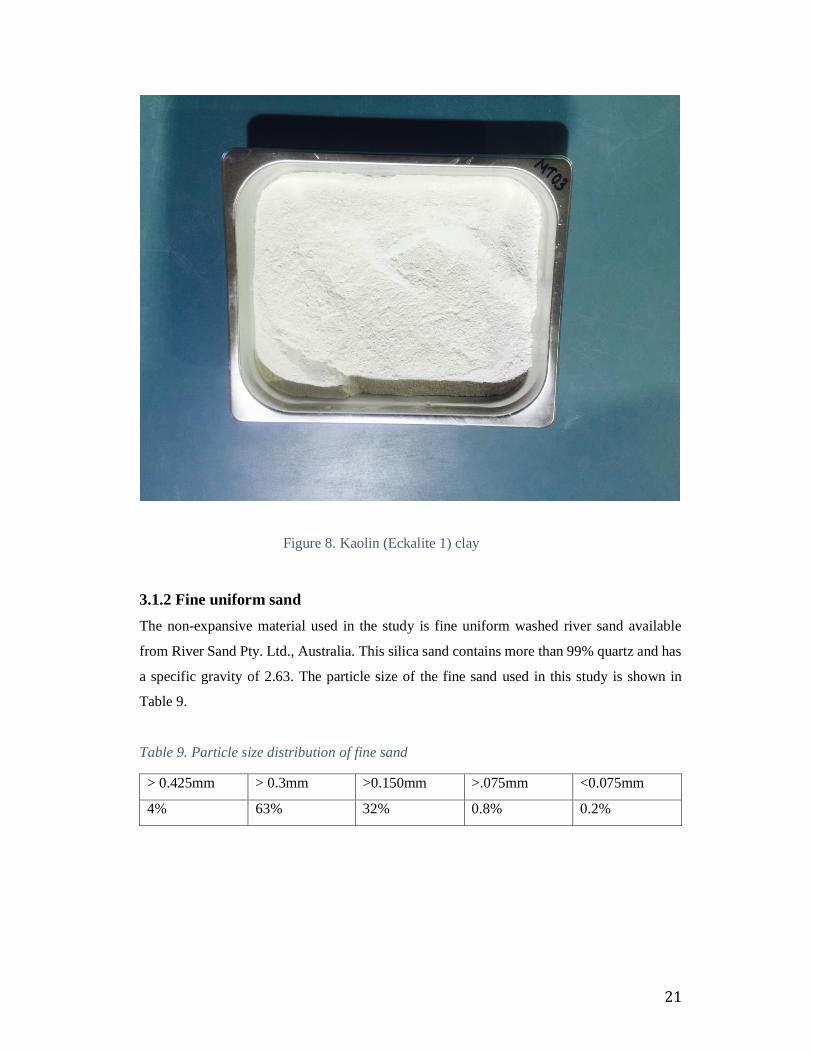
3.1.1 Kaolinite
Kaolinite, also known as China clay, is a common phyllosilicate mineral. Kaolinite is the most
common clay mineral and entire clay deposits can be composed of this mineral. It has a soft
consistency and earthy texture. It is easily broken and can be molded or shaped, especially
when wet. The clay used in present study is commercial Kaolin (Eckalite 1) available from
Pottery Works Queensland. It is off white in colour.
Page 30
21
Figure 8. Kaolin (Eckalite 1) clay
3.1.2 Fine uniform sand
The non-expansive material used in the study is fine uniform washed river sand available
from River Sand Pty. Ltd., Australia. This silica sand contains more than 99% quartz and has
a specific gravity of 2.63. The particle size of the fine sand used in this study is shown in
Table 9.
Table 9. Particle size distribution of fine sand
> 0.425mm > 0.3mm >0.150mm >.075mm <0.075mm
4% 63% 32% 0.8% 0.2%
Page 31
22
Figure 9. Fine uniform sand
3.2 Testing Program
Laboratory tests were designed to investigate the basic properties (liquid limit and plastic
limit) and swelling characteristics (swelling potential and swelling pressure) of the soil sample
that is in dry powder form. The sample was then mixed with fine sand material at different
percentage by weight.
3.2.1 Liquid limit
The liquid limit is percentage moisture content that defines where the soil changes from the
plastic to a fluid state. Liquid limit test was conducted using a cone penetrometer following
Austrian Standard 1289.3.9.1. Liquid limit is the water content in percentage when
penetration of the cone is 20mm. Dry powder clay and tap water was used. The dimension of
the specimen cup used is 55mm in diameter and 45mm in height. A homogeneous paste is
prepared of the sample by adding water and cone penetrometer test is performed with the
range of penetration depth taken from 15 to 25 mm.
Page 32
23
A minimum of 5 tests was performed with different water contents with at least two values
below and two values above 20mm penetration. Moisture content of the soil is determined
following AS 1289.2.1.1. Water content versus penetration depth graph is plotted and water
content corresponding to 20mm penetration is noted, which is the liquid limit of the soil
sample.
Figure 10. Cone penetrometer for determining liquid limit
3.2.2 Plastic limit
Plastic limit is the percentage moisture content that defines where the soil changes from semi-
solid to a plastic (flexible) stage. Plastic limit test was conducted following AS 1289.3.3.1.
As plasticity index is also to be calculated from this test result, the soil sample (paste) used
for determination of liquid limit was used for the plastic limit test.
Page 33
24
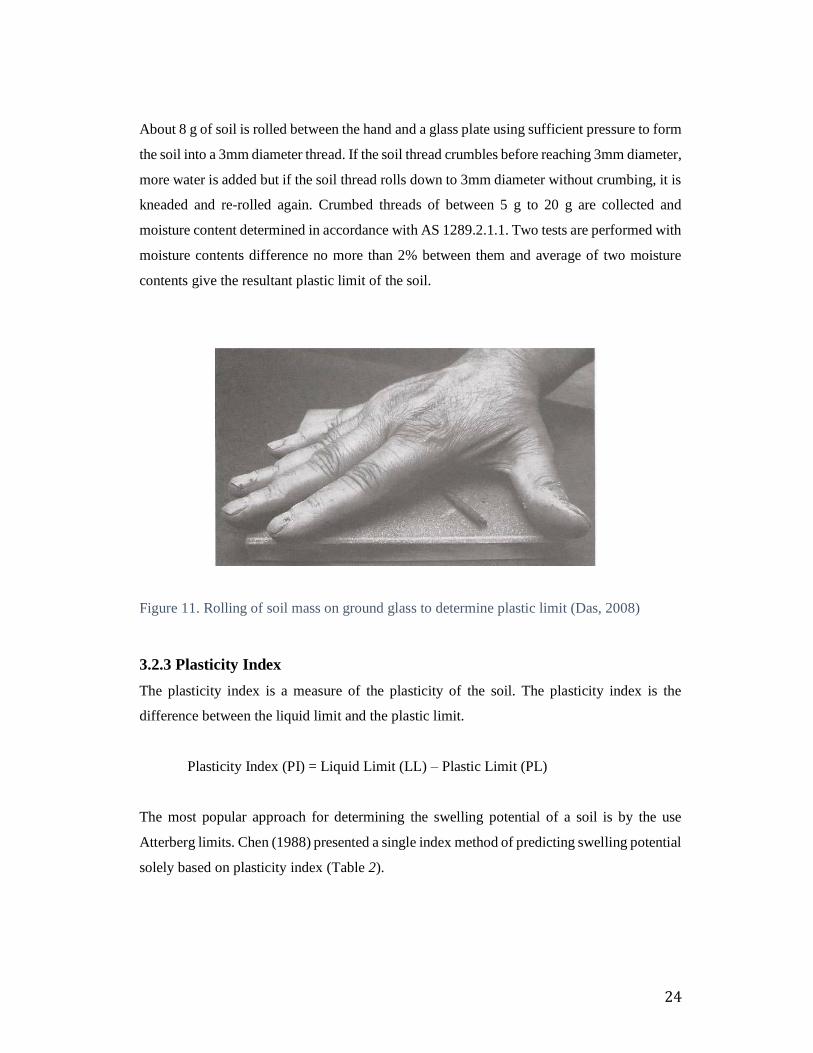
About 8 g of soil is rolled between the hand and a glass plate using sufficient pressure to form
the soil into a 3mm diameter thread. If the soil thread crumbles before reaching 3mm diameter,
more water is added but if the soil thread rolls down to 3mm diameter without crumbing, it is
kneaded and re-rolled again. Crumbed threads of between 5 g to 20 g are collected and
moisture content determined in accordance with AS 1289.2.1.1. Two tests are performed with
moisture contents difference no more than 2% between them and average of two moisture
contents give the resultant plastic limit of the soil.
Figure 11. Rolling of soil mass on ground glass to determine plastic limit (Das, 2008)
3.2.3 Plasticity Index
The plasticity index is a measure of the plasticity of the soil. The plasticity index is the
difference between the liquid limit and the plastic limit.
Plasticity Index (PI) = Liquid Limit (LL) – Plastic Limit (PL)
The most popular approach for determining the swelling potential of a soil is by the use
Atterberg limits. Chen (1988) presented a single index method of predicting swelling potential
solely based on plasticity index (Table 2).
Page 34
25
3.2.4 Swelling potential and swelling pressure
Swelling potential and swelling pressure are two important characteristics in determining the
behaviour of expansive soils. The lack of a standard definition of swelling potential is the
most confusing aspect of expansive soil classification (Nelson & Miller, 1992). In general,
swelling potential of a soil is a measure of its ability to swell. Hold and Gibbs (1956) defined
the swelling potential of a soil as the total volume change of when saturated under 6.9 kPa
load.
The swelling pressure is the pressure required to hold the soil or restore the soil to its initial
void ratio when given access to water. Cimen et al. (2012) defined swelling pressure as the
pressure required to compress the fully swollen soil sample back to its initial volume in free
swell test.
A number of factors influence the swelling characteristics of expansive soils. Some of these
are gradation of the soil particles, texture, structure, density, applied loadings, load history,
mineralogical composition, temperature, etc.
In this study swelling potential and swelling pressure of expansive soil as well as the soil
mixtures were determined using one dimensional consolidation apparatus (oedometer)
following free swelling odometer test method. At least two replicated lab tests were
performed for each sand-clay mixture and average value from the experiments were taken.
The classification of swelling potential for various sand-clay mixtures was made following
expansive index method according to ASTM D4829 (Table 6).
Page 35
26
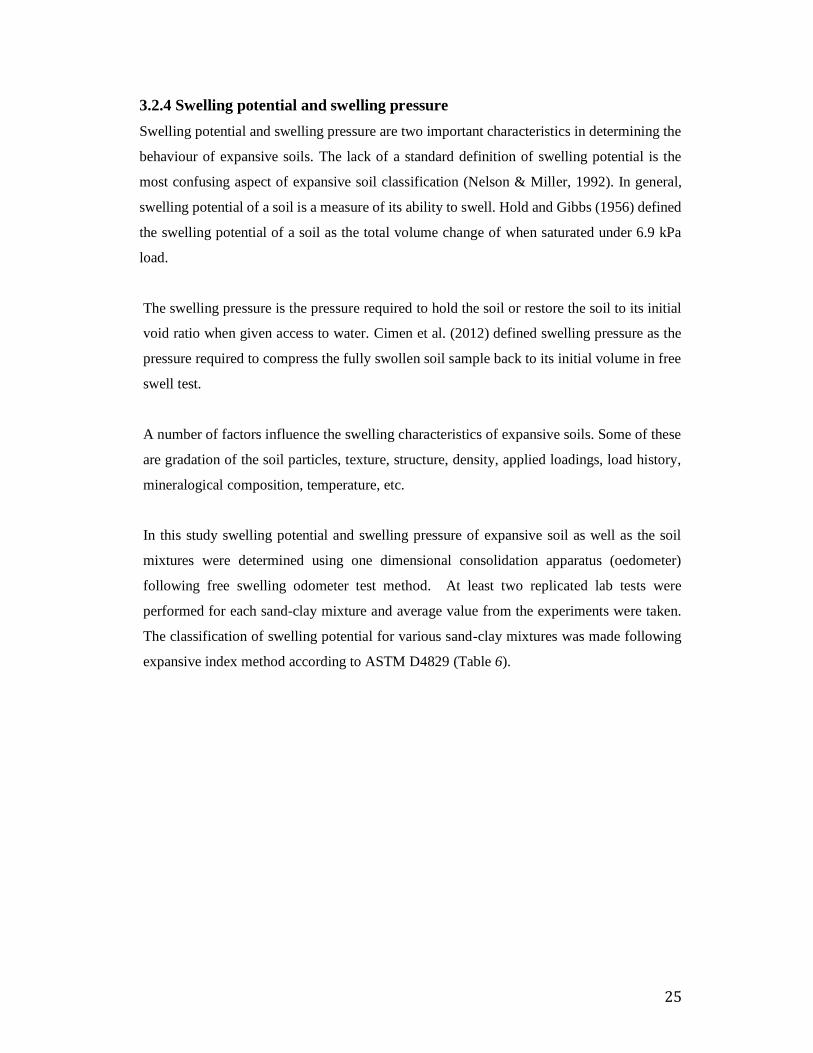
Figure 12. One dimensional oedoemeter for determining swell potential and swelling
pressure
In an oedometer test method, the swelling/consolidation of soil is investigated by restricting
lateral and axial deformations under oedometric conditions.
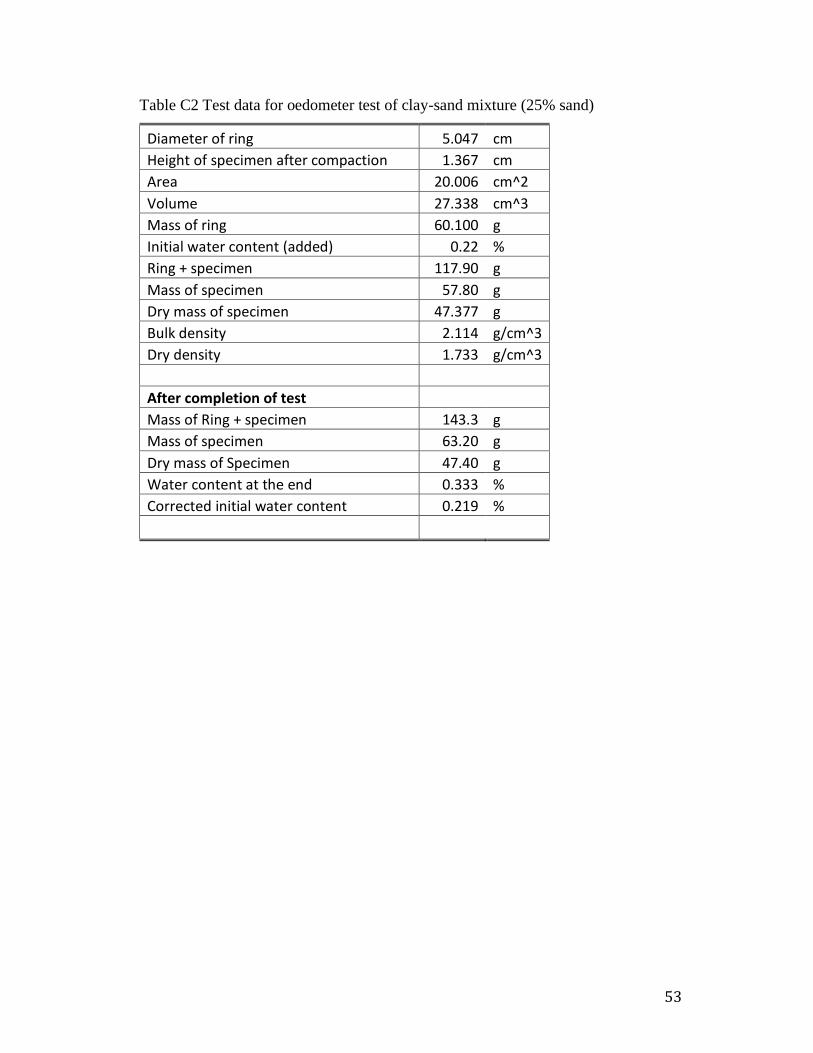
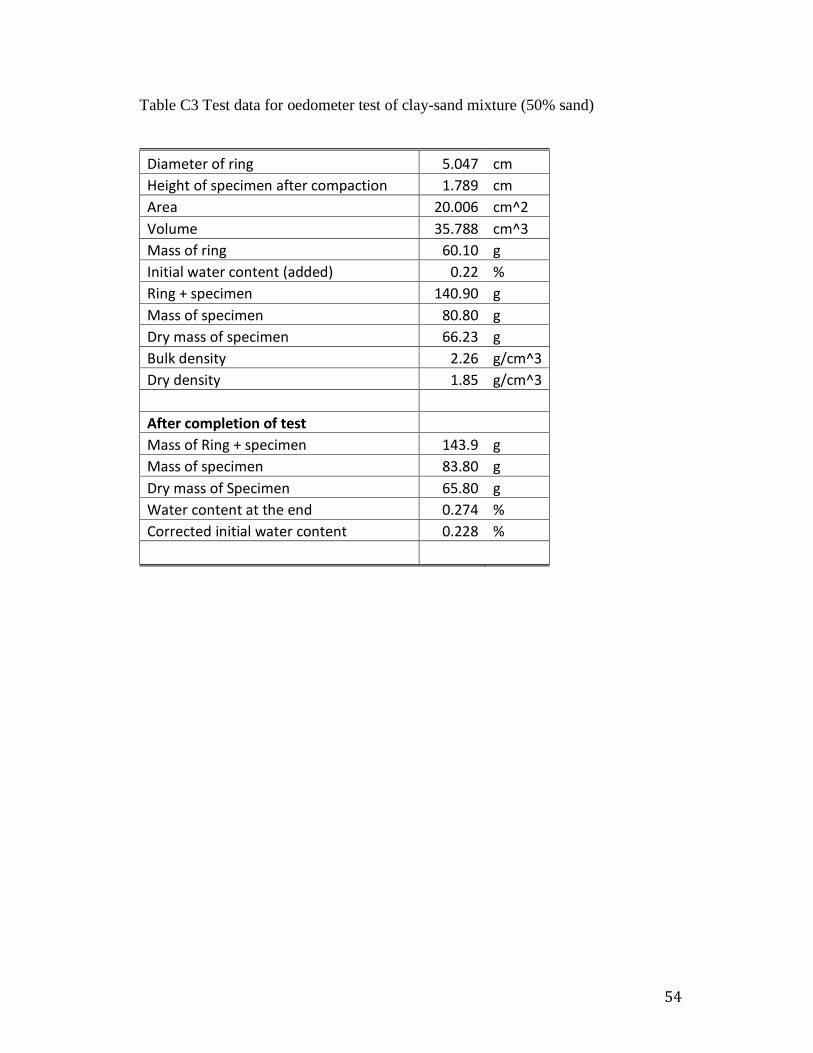
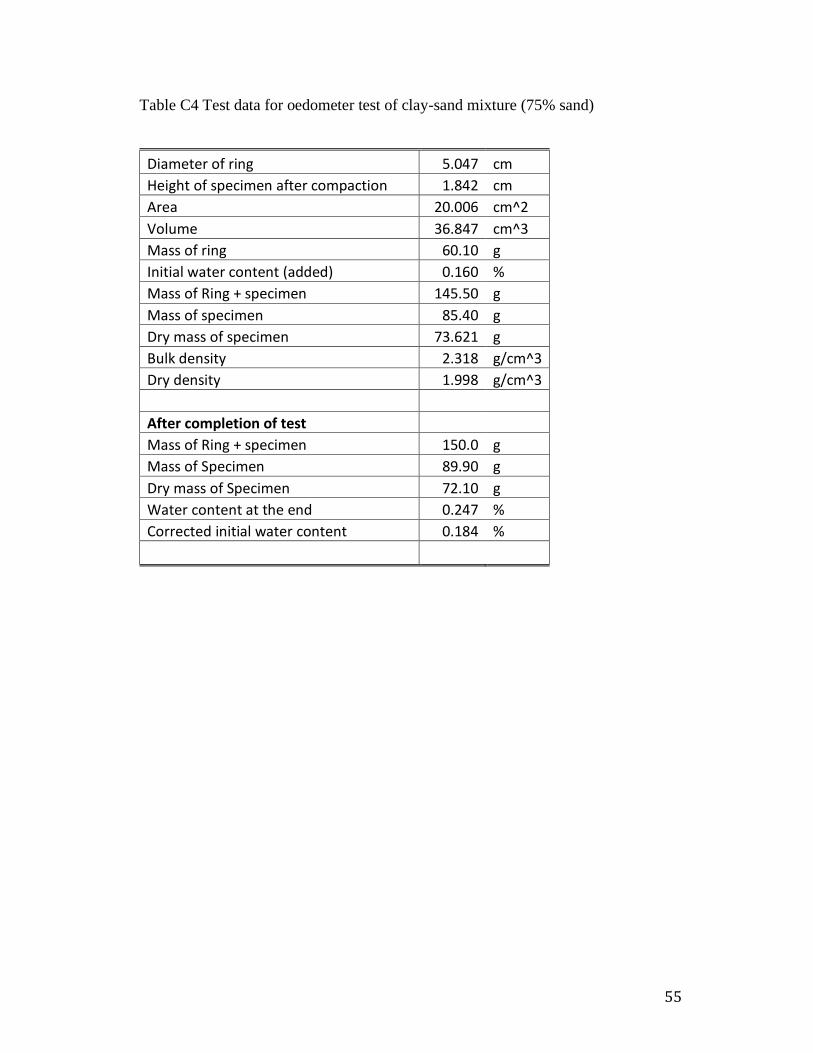
The soil was oven dried for more than 24 hours. The dry soil was thoroughly mixed with a
calculated amount of water necessary to reach 22% initial moisture content. It was then further
kneaded to form a homogeneous mixture. The soils were tested in fixed ring oedometer using
stainless steel ring which had an inside diameter of 50.47 and a height of 20mm.
Page 36
27
The specimen was moderately compacted in the oedometer ring in 3 layers using a small
hammer weighing 344.3 gm. The excess soil was trimmed using a palette knife. Filter papers
were placed on top and bottom of the soil specimen to prevent the tiny particles entering into
the pores of the porous stones placed on both sides of the specimen. As the room was not
temperature controlled, the space around the specimen ring was enclosed with a loose-fitting
plastic wrap to minimise change in specimen water content. After positioning the specimen
in the oedometer, the sample in the oedometer was compacted applying static force of 1000
kPa for 24 hours. Then compaction force was gradually reduced and the soil sample was
subjected to a seating pressure of 7 kPa for 24 hours and natural rebound is measured as the
height difference of the specimen under 1000 kPa and 7 kPa pressure. Thereafter the soil
specimen was inundated with water and allowed to swell freely under a nominal pressure of
7 kPa for further 24 hours. The percent change in height of the specimen before and after
adding water under 7 kPa is the free swelling potential value. In the study, as the water is
added only after the soil sample has been kept under a seating load of 7 kPa for 24 hours after
the removal of compaction force, natural rebound (swell) as a result of unloading cycle is also
measured. This rebound swelling would be helpful in determining the required preload and
the natural swell after the removal of preload which is used to reduce or eliminate the
secondary settlement that occurs when actual construction takes place.
After the soil sample has reached a maximum swelling with addition of water under 7 kPa, it
is loaded applying incremental loads starting at 25 kPa until specimen reaches its initial
height. The swelling pressure can be taken as the pressure that brings the specimen back to
its original height before adding the water under 7kPa. The total pressure required to bring
back the specimen to the height after consolidation under 1000 kPa load was also determined.
Page 37
28
4 Results and discussion
The results obtained from the laboratory experiments performed are presented and discussed
in this section. Firstly the results of index properties are discussed followed by expansive
properties and thereafter relationship between Atterberg limits and swelling characteristics.
4.1 Liquid limit, Plasticity Limit and Plasticity Index Tests
This section examines the variation of Atterberg limits with different percentage of sand.
Liquid limit, plastic limit and plasticity index, which are very important elements in
determining the expansive properties of a soil, are determined. These tests were performed to
analyse how the plasticity characteristics of clay behaves with the addition of coarse
material and to try and relate these plasticity characteristics with expansive properties of the
soil specimen. In this study, liquid limit was determined using a cone penetrometer test. The
test results for kaolinite clay mixed with various percentages of fine sand is presented in
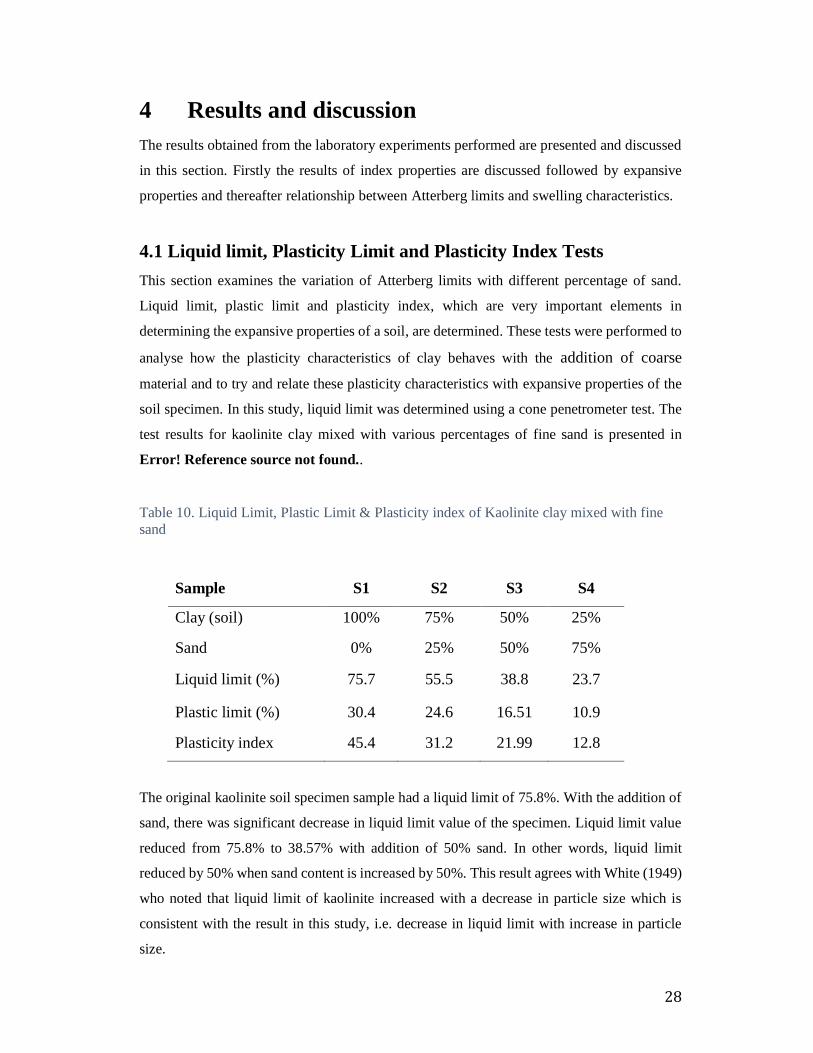
Error! Reference source not found..
Table 10. Liquid Limit, Plastic Limit & Plasticity index of Kaolinite clay mixed with fine
sand
Sample S1 S2 S3 S4
Clay (soil) 100% 75% 50% 25%
Sand 0% 25% 50% 75%
Liquid limit (%) 75.7 55.5 38.8 23.7
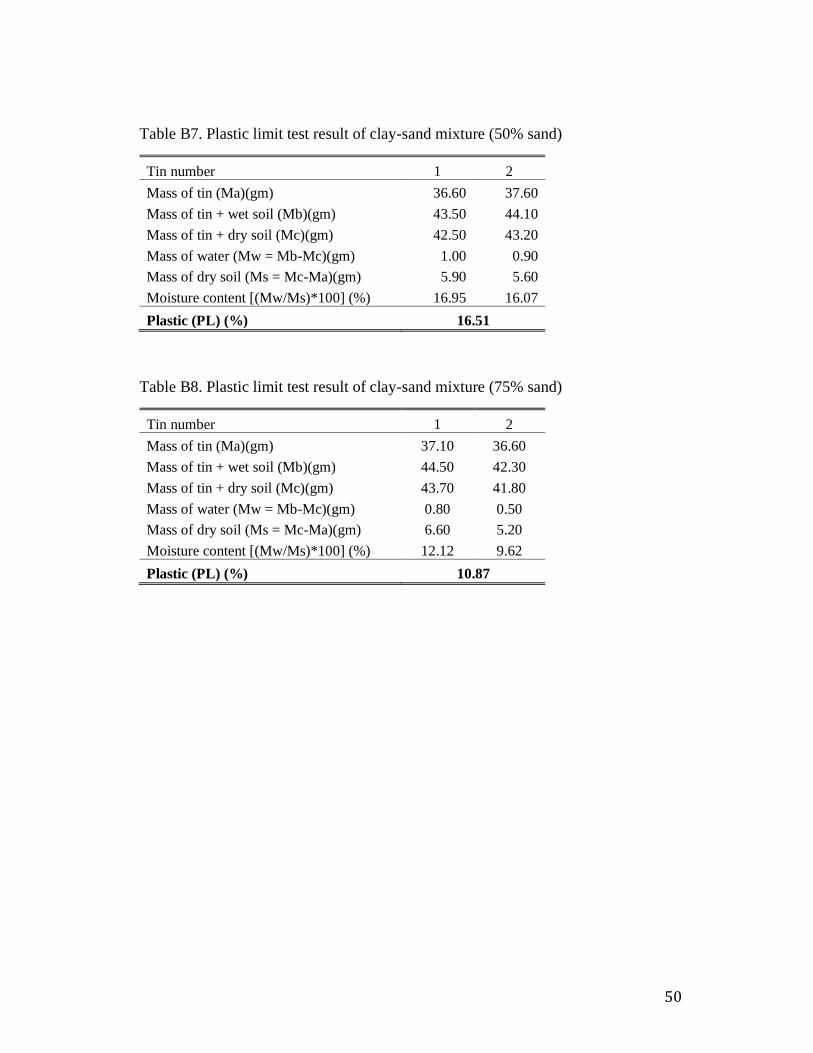
Plastic limit (%) 30.4 24.6 16.51 10.9
Plasticity index 45.4 31.2 21.99 12.8
The original kaolinite soil specimen sample had a liquid limit of 75.8%. With the addition of
sand, there was significant decrease in liquid limit value of the specimen. Liquid limit value
reduced from 75.8% to 38.57% with addition of 50% sand. In other words, liquid limit
reduced by 50% when sand content is increased by 50%. This result agrees with White (1949)
who noted that liquid limit of kaolinite increased with a decrease in particle size which is
consistent with the result in this study, i.e. decrease in liquid limit with increase in particle
size.
Page 38
29
Figure 13. Variation of Liquid limit, plastic limit and plasticity index with % of sand
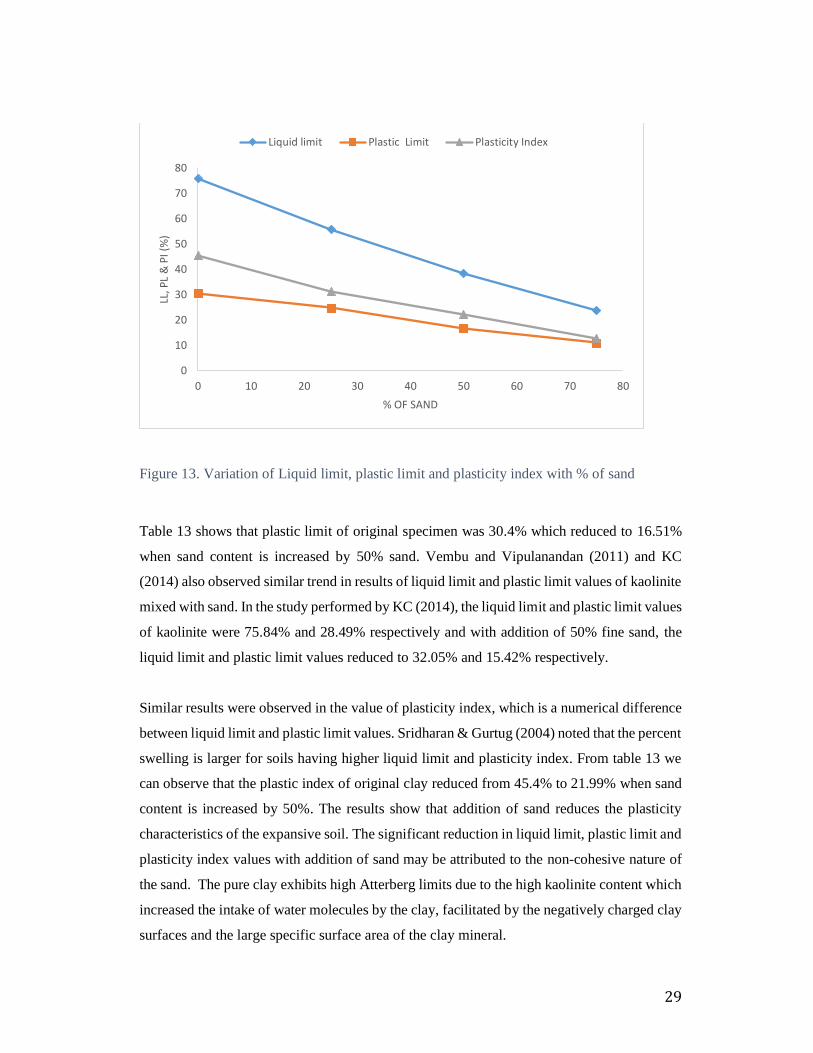
Table 13 shows that plastic limit of original specimen was 30.4% which reduced to 16.51%
when sand content is increased by 50% sand. Vembu and Vipulanandan (2011) and KC
(2014) also observed similar trend in results of liquid limit and plastic limit values of kaolinite
mixed with sand. In the study performed by KC (2014), the liquid limit and plastic limit values
of kaolinite were 75.84% and 28.49% respectively and with addition of 50% fine sand, the
liquid limit and plastic limit values reduced to 32.05% and 15.42% respectively.
Similar results were observed in the value of plasticity index, which is a numerical difference
between liquid limit and plastic limit values. Sridharan & Gurtug (2004) noted that the percent
swelling is larger for soils having higher liquid limit and plasticity index. From table 13 we
can observe that the plastic index of original clay reduced from 45.4% to 21.99% when sand
content is increased by 50%. The results show that addition of sand reduces the plasticity
characteristics of the expansive soil. The significant reduction in liquid limit, plastic limit and
plasticity index values with addition of sand may be attributed to the non-cohesive nature of
the sand. The pure clay exhibits high Atterberg limits due to the high kaolinite content which
increased the intake of water molecules by the clay, facilitated by the negatively charged clay
surfaces and the large specific surface area of the clay mineral.
0
10
20
30
40
50
60
70
80
0 10 20 30 40 50 60 70 80
LL, P
L &
PI (
%)
% OF SAND
Liquid limit Plastic Limit Plasticity Index
Page 39
30
Al-Shayea (2001) stated that addition of sand to clay reduces liquid limit and plastic limit
because the sand particles act as an inert filler and do not interact electrochemically with
water.
Figure 13 shows that as the amount of sand is increased in the mixture, PL, LL and PI decrease
almost linearly with respect to the sand content. These results are similar to those obtained by
Skempton (1953) for four clayey soils, Seed et al. (1964) for kaolinite and bentonite mixtures,
by Nagaraj et al. (1991) and Han (1998) for bentonite-sand mixtures.
4.2 Swelling potential tests
Swelling potential is an indicator of magnitude of the swelling. It is defined as the equilibrium
vertical volume change obtained from oedometer test, expressed as a percent of the original
height. In this study, the vertical swelling percentage was calculated in accordance with the
above definition by inundating the consolidated soil specimen under a seating pressure of 7
kPa. Many researchers have used the vertical swelling value to identify expansive soils and
accordingly they have classified the soils as having low, medium, high and very high degrees
of swelling potential. In this study, expansive index method according to ASTM4829 was
followed to classify the swelling potential of the soil specimen (Table 6). Expansive index is
the ratio of 1000 times the difference between final height and initial height divided by initial
height and can be calculated as follows:
Expansive Index = ∆H
H x 1000
Where, ∆H = change in height and H = original height of specimen
It may be noted that expansive index is 10 times the vertical swell percent of the soil specimen.
Table 11. Expansive Index and swelling potential classification of clay-sand mixtures
% of Sand 0% 25% 50% 75%
Expansive Index 213 149 33.5 6.3
Swelling
potential
Very High Very high Low Very Low
Page 40
31
Table 11 indicates that the original soil sample has an expansive index of 213 which is
classified as very high swelling potential. As expected, the addition of coarse material to the
original clay reduces the expansive capacity of the soil sample. With the addition of 25%
sand, the expansive index reduces to 149 which is a reduction of 30%. However the clay-sand
mixture still classified into very high swelling potential category. The addition of 50% sand
reduces the expansive index to 33.5 and hence classifies into the low swelling potential
category.
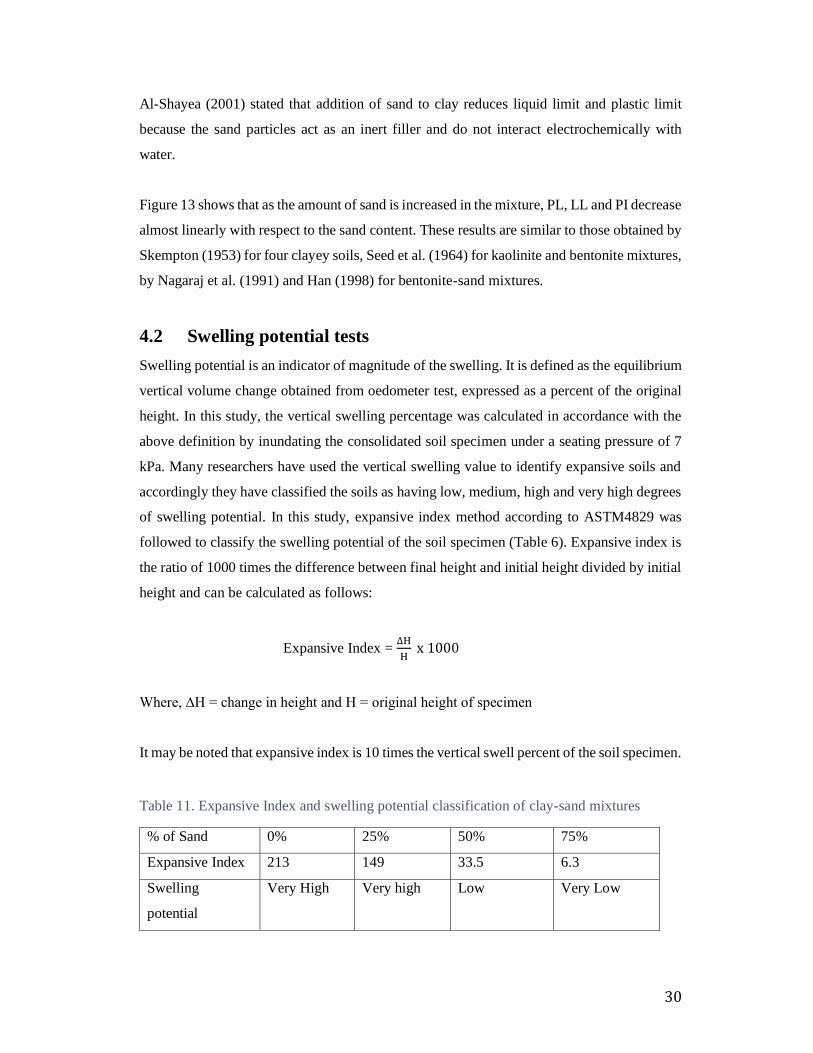
Figure 15 shows the results of swelling tests in the form of vertical swell percent as a function
of elapsed time (minutes). The curve for soil with sand content of 0% and 25% sand can be
divided into three stages, initial, primary and secondary swelling whereas curve for soil with
sand content of 50% and 75% is almost linear. The swelling rate is low in the initial stage due
to the low permeability of the soil sample which reduces the rate of flow of water. The rate
of swelling is very high in primary stage followed by a low rate in the secondary stage. This
can be attributed to high water adsorptive forces during the primary stage (Adbduljauwad,
1993). Primary swelling occurs between 1 to 100 minutes where the time for secondary
swelling varies between 100 to 1440 minutes.
The swelling percent for soil with sand content of 50% and 75% is very small compared to
the soil containing lower percentage of sand. This is due to the fact that the swollen clay
particles just occupy the voids between the sand grains causing a relatively non-significant
amount of swelling.
Page 41
32
Figure 144. Time-swell curve
In addition to the vertical swell after addition of water, natural rebound swell 24 hours after
unloading of compaction force of 1000 kPa to 7 kPa was also measured. Table 12 shows the
vertical swell (displacement) before and after adding water in various clay-sand mixtures.
Table 12. Swelling of clay-sand mixture before and after addition of water
% of Sand
0% 25% 50% 75%
Natural Rebound
(mm)
Before adding
water 0.403 0.57 1.2 0.436
Swelling (mm)
After adding
water 3.279 2.127 0.073 0.012
Total swell (mm) 3.682 2.697 1.273 0.448
In a real life practical setting, this rebound swelling would be helpful in determining the
natural swell after removal of preload which is used to reduce or eliminate the secondary
settlement that occurs when actual construction takes place.
0
2
4
6
8
10
12
14
16
18
20
22
0.1 1 10 100 1000 10000
Ver
tica
l Sw
ell (
%)
time (min)
75% sand
25% sand
50% sand
75% Sand
Page 42
33
Table 12 indicates that total change in height of specimen after addition of water decreased
significantly with the addition of fine sand. However, the natural rebound after consolidation
increased with the increment of sand percentage till 50% sand and then decreased slightly
with addition of 75% sand. This could be attributed to the variation in compacted density of
the soil specimens. The original kaolinite clay after consolidation had a natural expansion of
0.403mm in 24 hours and a further swelling of 3.279mm after addition of water giving a total
swelling of 3.682mm in 48 hours. With the addition of 50% sand, the natural rebound
increased to 1.2mm but with the addition of water further expansion was only 0.073mm which
gives a total swelling of 1.273. It is noted that the original clay has significantly less rebound
compared to expansiveness after adding water whereas with the addition of higher percentage
of sand, the vertical swell is relatively nonsignificant.
4.3 Swelling Pressure tests
As defined earlier, swelling pressure is the pressure required to compress the fully swollen
sample back to its initial volume in a free swell test. Figure 15 shows that increase in the
percentage of fine sand mixed from 0% to 75% reduced the swelling pressure of the soil
specimen 366 kPa to 9 kPa.
Figure 15. Variation of swelling pressure with % of sand
0
50
100
150
200
250
300
350
400
0 10 20 30 40 50 60 70 80
Swel
ling
Pre
ssu
re (
kPa)
% of Sand
Page 43
34
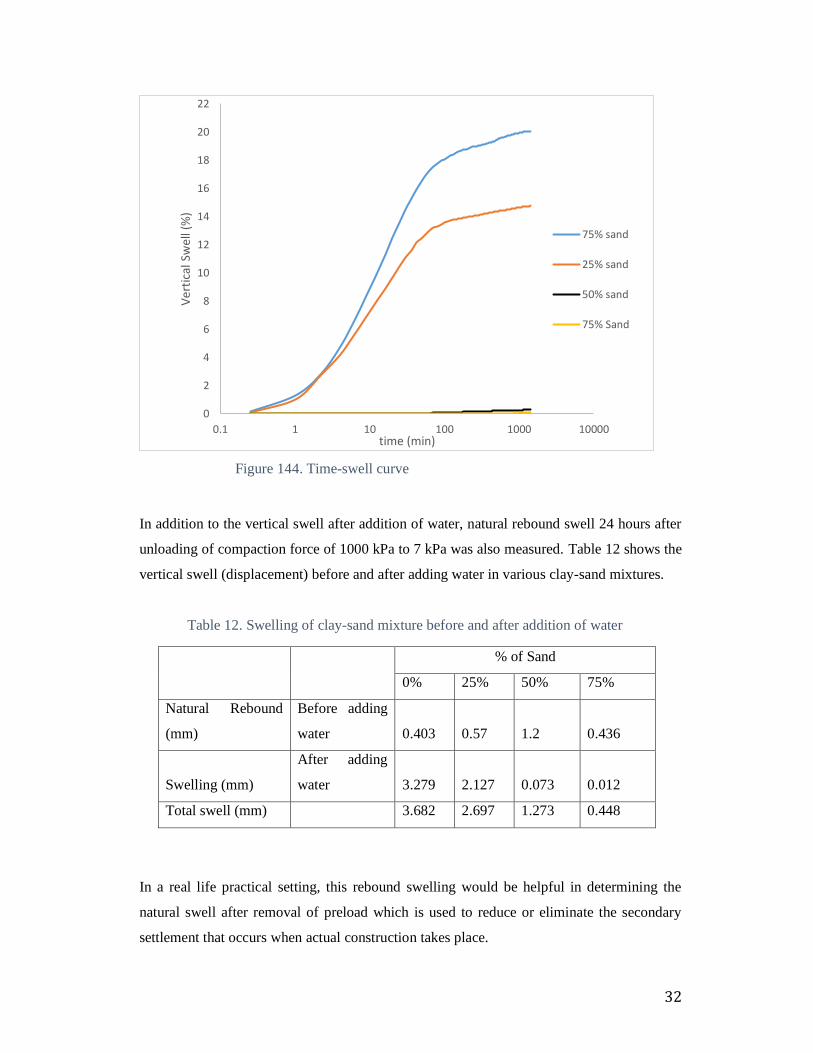
It may be noted that the rate of reduction of swelling pressure is very high between sand
percentage of 25% and 50%. This rate of reduction is insignificant with more than 50% sand
content. The swelling pressure reduces at a similar ratio of between 4 to 6% between 0 and
25% and 50% to 75% of sand whereas the rate of reduction between 25 to 50% is more than
90%. Therefore, further laboratory investigations need to be carried out with more variations
in sand content between 25 and 50%. This result agrees with ElKholy (2008) and
Abdelrahman, et al. (2004) who noted that an increase in the percentage of coarse fraction of
sand mixed with clay reduced with swelling pressure.
In this study, as the soil specimen was unloaded from 1000 kPa to a seating load of 7 kPa and
left for 24 hours before adding the water. Also the total pressure required to bring the
specimen height back to the initial height after full static compaction under 1000 kPa was
determined, which of course would be higher than the swelling pressure. It may be noted that
while the swelling pressure reduced with addition of fine sand, the total pressure increased
with the addition of the same. While it took 563 kPa pressure to bring the original kaolinite
clay to the initial height under 1000 kPa load, the required pressure increased to 704 kPa for
the soil specimen with 50% sand content. The rate of increment in the total pressure decreases
with increase in the sand content.
Table 13. Swelling pressure and total pressure of clay-sand mixtures
% of Sand Swelling Pressure (kPa) Total Pressure (kPa)
0.00 366.51 563.38
25.00 349.11 649.47
50.00 19.44 703.98
75.00 9.29 732.68
No previous literature could be found to compare these studies regarding total swelling
pressure. It may be noted that swelling characteristics of soil is more dependent on dry unit
weight than initial water content but in this study the compacted dry density of tested soil
specimens was not constant but varied between 1.4 to 1.9 g/cm3. Therefore, the result of total
pressure is inconclusive and further lab investigations need to be carried out and correlated
with the current test results.
Page 44
35
4.4 Correlation between Atterberg limits and expansiveness of soil
From the results discussed above, we know that both Atterberg limits and expansiveness of
clay reduce with increase in sand content. Figure 16 shows the variation in swelling potential
and swelling pressure with respect to plasticity index of clay-sand mixtures. All the three
parameters, plasticity index, swelling potential and swelling pressure values are highest for
original kaolin clay with 0% sand, which gradually reduces with increment in sand content.
The pure clay sample had a plasticity index of around 45%, swelling potential of 21% and
swelling pressure of around 360 kPa. With the addition of 50% sand, the plasticity index,
swelling potential and swelling pressure reduced to 31%, 0.3% and 19 kPa respectively. It
may be noted that the swelling potential and pressure are higher for soils having higher
plasticity index. As there is an almost linear relationship between plasticity index, liquid limit
and plastic limit, the above expansive characteristics will vary similarly with respect to liquid
limit ad plastic limit. This result agrees with Cimen et al. (2012) who stated that plasticity
characteristics and volume change behavior of soils are related to the amount of clay particles
in the soil and that swelling properties of clay minerals are directly proportional to their
plasticity properties.
Figure 16. Variation in swelling potential and swelling pressure with respect to plasticity index
0% sand
25% sand
50% sand75% sand
0
50
100
150
200
250
300
350
400
0
5
10
15
20
25
0 10 20 30 40 50
Swel
ling
Pre
ssu
re (
kPa)
Swel
ling
po
ten
tial
(%
)
Plasticity Index (%)
Swelling Potential (%) Swelling Pressure (kPa)
Page 45
36
As stated earlier, Atterberg limit is the most common method for determining the swelling
capacity of a soil. Chen (1988) derived a criteria for identifying swelling potential solely
based on plasticity index of a soil, which is presented in Table 2. From the table, it can be
noted that soil having a plasticity index of greater than 35 is considered to have very high
swelling potential. Therefore, the original clay used in this study which has a plasticity index
of 45.4 is categorised as having a very high swelling potential. With the addition of sand, the
plasticity index value decreases and so does the ability of the soil to expand. The mixture of
clay and fine sand (50% of each) has a plasticity index of 21.99 which is categorised on Table
2 as having a medium swelling potential. It may be noted that swelling potential reduces from
very high to high with addition of 25% sand, to medium with 50% sand and to low with 75%
sand.
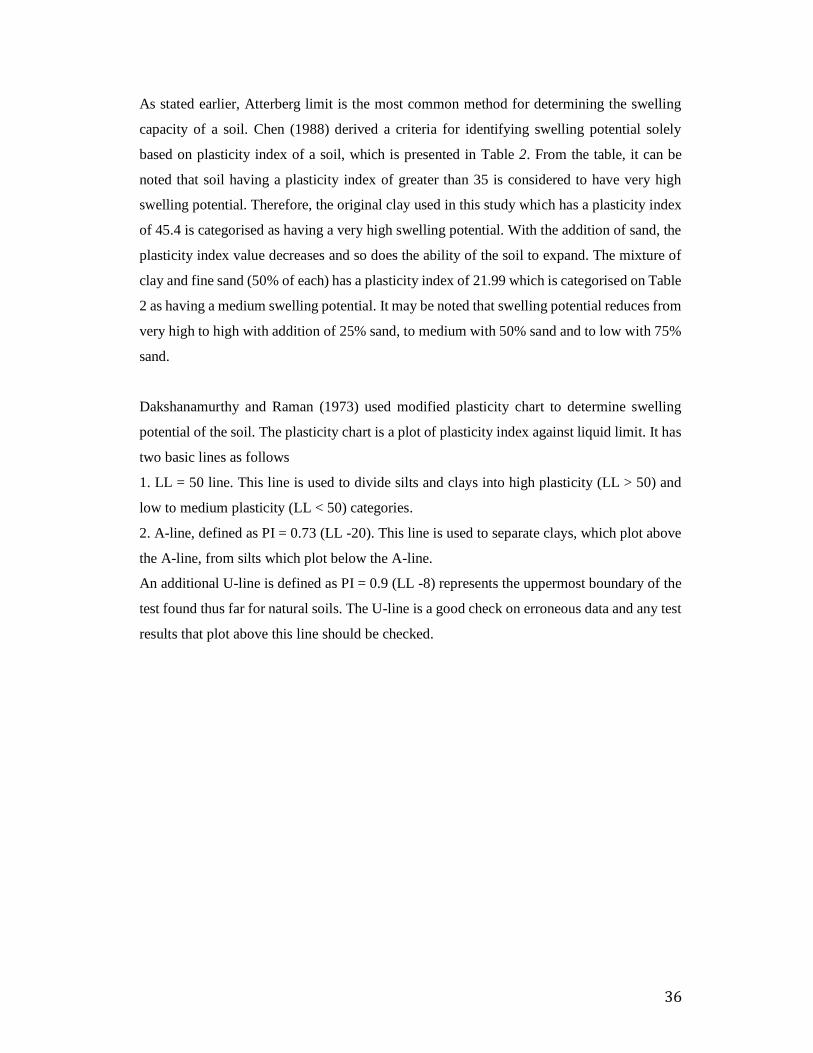
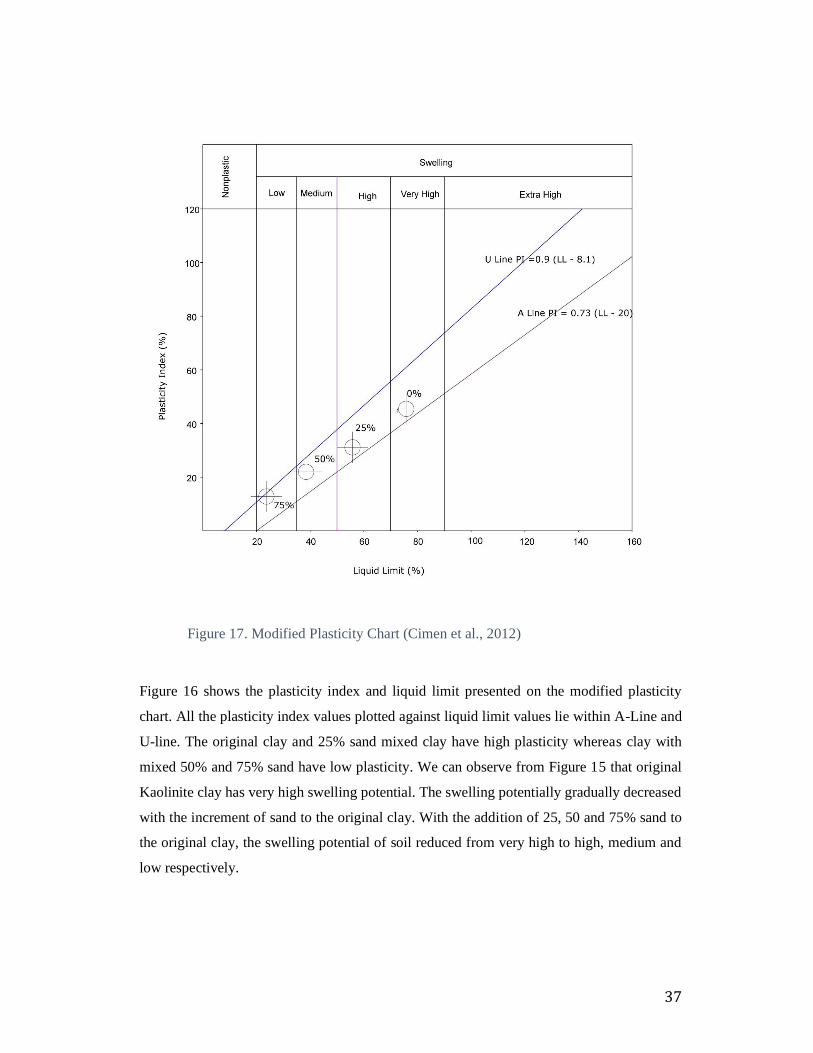
Dakshanamurthy and Raman (1973) used modified plasticity chart to determine swelling
potential of the soil. The plasticity chart is a plot of plasticity index against liquid limit. It has
two basic lines as follows
1. LL = 50 line. This line is used to divide silts and clays into high plasticity (LL > 50) and
low to medium plasticity (LL < 50) categories.
2. A-line, defined as PI = 0.73 (LL -20). This line is used to separate clays, which plot above
the A-line, from silts which plot below the A-line.
An additional U-line is defined as PI = 0.9 (LL -8) represents the uppermost boundary of the
test found thus far for natural soils. The U-line is a good check on erroneous data and any test
results that plot above this line should be checked.
Page 46
37
Figure 17. Modified Plasticity Chart (Cimen et al., 2012)
Figure 16 shows the plasticity index and liquid limit presented on the modified plasticity
chart. All the plasticity index values plotted against liquid limit values lie within A-Line and
U-line. The original clay and 25% sand mixed clay have high plasticity whereas clay with
mixed 50% and 75% sand have low plasticity. We can observe from Figure 15 that original
Kaolinite clay has very high swelling potential. The swelling potentially gradually decreased
with the increment of sand to the original clay. With the addition of 25, 50 and 75% sand to
the original clay, the swelling potential of soil reduced from very high to high, medium and
low respectively.
Page 47
38
The results for swelling potential based on Atterberg Limits using modified plasticity chart
(Cimen, et al., 2012) and Chen’s (1988) method is very similar with both methods identifying
the original clay used in the study as having very high swelling potential and with increment
of sand to 50%, the clay-sand mixture had a medium swelling potential.
It may be noted that as the plasticity of the soil increases from non-plastic to very high plastic
the swelling of soil also increase in the same range of plasticity. This verifies that swelling
properties of clay minerals follow the same trend as their plasticity properties.
Page 48
39
5. Conclusion
The engineering properties of clay-sand mixtures are highly influenced by the sand content.
The Atterberg limits (liquid limit, plastic limit and plasticity index) are found to reduce with
increase in sand content. This variation is found to be almost linear with respect to the sand
content which could be attributed to non-cohesive nature of the sand.
The free swell percentage and swelling pressure clay-sand mixtures also reduce with the
increase in sand content. However, results indicate a significant change in both swell pressure
and swell percentage when the sand content is increased from 25% to 50%. Further increase
in sand content above 50% does not indicate significant changes in expansive properties. In
other terms, addition of 50% of coarse content should have treated the expansive nature of
the kaolinite clay.
This rate of reduction of the swelling and swelling pressure is very high between 25% and
50% sand content but with further addition after 50%, the rate of change of the above swelling
characteristics is nonsignificant.
It may be noted that as the plasticity of the soil increases from non-plastic to very high plastic
the swelling of soil also increase in the same range of plasticity. This verifies that swelling
properties of clay minerals follow the same trend as their plasticity properties.
While the free swell after addition of water decreased with increase in sand content, the
rebound swelling before adding water increased with increase in sand content up to 50% but
then slightly reduced at 75% sand. Also the total pressure required to bring back the soil
specimen to its original height after being statically compacted under 1000 kPa is greater for
clay-sand mixture containing higher percentage of sand.
Therefore it can be concluded that addition of sand improves the overall characteristics of soil
by reducing its plasticity, swelling potential and swelling pressure but the results obtained for
natural rebound and total pressure is inconclusive due to the unavailability of previous work
for comparison. Therefore, further lab testing are needed to refine and improvement the
findings.
Page 49
40
6. Recommendations for further work
The main problem faced in this study was related to the method of compaction to reach the
desired dry density of the soil specimen. Due to the unavailability of suitable equipment and
apparatus for standard compaction method, the soil specimen was statically compacted in the
oedometer itself which made it impossible to get constant dry density for all soil specimens
after compaction. Also each test took at least a week to complete and there were many failed
tests, therefore the lab investigations could be done with only 3 variation in sand contents. A
large number of data points is required to obtain more accurate and generalised relationships
to predict the swelling behaviour of soil. Therefore further lab investigations could be
performed:
Using different method of compaction
Using different static load for compaction to see how the swelling properties change
with the change in degree of consolidation.
With more variation in sand content especially between 25% and 50%.
Page 50
41
7. References
Abdelrahman, GE & Shahien MM, 2004, ‘Swelling Treatment By Using Sand for Tamia
Swelling Soil’, Proceedings of International Engineering Conference, Mansoura University,
Sharm El-Sheikh, Egypt.
Al-Mhaidib, AI, Prediction of swelling potential of an expansive shale’, Proceedings of the
second international conference on Unsaturated Soils, vol. 1.
Al-Shayea, NA 2001, ‘The combined effect of clay and moisture content on the behavior of
remolded unsaturated soils’, Engineering Geology, vol. 62, pp. 319-342.
ASTM International 2011, Standard Test Method for Expansive Index of Soils, D4829 –11,
100 Barr Harbor Drive, PO Box C700, West Conshohocken, PA 19428-2959, United States.
ASTM International 2014, Standard Test Method for One Dimensional Swell or Collapse of
Soils, D4546 – 14, 100 Barr Harbor Drive, PO Box C700, West Conshohocken, PA 19428-
2959, United States.
Austroads 2004, A Guide to the Structural Design of Road Pavement, Austroads Incorporated,
Sydney.
Basma AA, Al-Homoud AS, Husein A 1995, ‘Laboratory assessment of swelling pressure of
expansive soils’, Applied Science 9.
Chakroborty, P, & Das, A 2004, Principles of Transportation Engineering, Prentice Hall of
India Pvt. Ltd., New Delhi.
Chen, FH 1988, Foundation on Expansive Soils, Elsevier Science Pub. Co., New York, NY
Cimen, O, Keskin SN, Yildirim H 2012, ‘Prediction of Swelling Potential and Pressure in
Compacted Clay’, Arabian Journal of Science and Engineering, vol. 37, no. 6, pp. 1535-1546.
Page 51
42
Craig, RF 2004, Craig's Soil Mechanics, Spon Press, London.
Dakshanamurthy, V & Raman, V 1973, ‘A simple method of identifying an expansive soil’,
Soils and Foundations, Japanese Society of Soil Mechanics and Foundation Engineering, vol.
13, no 1.
Das, BM 2006, Principles of Geotechnical Engineering, Nelson, Toronto, Canada
ElKholy, SM 2008, ‘Improving Characteristics of Expansive Soil Using Coarse-grained soil’,
Journal of Engineering and Computer Sciences, vol. 1, no. 2, pp. 71-81.
Fityus, SG, Smith, DW & Allman, MA 2004, ‘Expansive Soil Test Site Near Newcastle’
Journal of Geotechnical and Geoenvironmental Engineering, vol. 130, no. 7.
Grim , RE, ‘Clay Mineralogy’, McGraw-Hill Book Company, New York.
Jones, LD & Jefferson, I 2015, Chapter 33 Expansive Soils, ICE manual of geotechnical
engineering.
Hamilton, JJ 1977, Foundations on Swelling or Shrinking Subsoils, viewed 20 January 2016
<http://web.mit.edu/parmstr/Public/NRCan/CanBldgDigests/cbd184_e.html>
Holt, JH 1969, ‘A Study of Physio-Chemical, Mineralogical, and Engineering Index
Properties of Fine Grained Soils In Relation to their Expansive Characteristics.
Mitchell, JK 1976, Fundamentals of Soil Behavior, John Wiley and Sons, New York.
Murthy, VN 2003, Geotechnical Engineering: Principles and Practices of Soil Mechanics
and Foundation Engineering, Marcel Dekker, Inc., New York.
Nalbantoglu, Z 2004, ‘Effectiveness of class C fly ash as an expansive soil stabilizer’,
Construction and Building Materials, vol. 18, pp. 377-381.
Page 52
43
Nelson, JD & Miller, DJ 1992, Expansive Soils: Problems and Practice in Foundation and
Pavement Engineering, John Wiley & Sons, Inc., New York.
Malley, AP, & Cameron, DA, ‘The Influence of Trees on Soil Moisture, Dwellings and
Pavement in an Urban Environment’, University of South Australia, Salisbury SA.
Pearing , JR 1963, A Study of Basic Mineralogical, Physical-Chemical, and Engineering
Index Properties of Laterite Soils.
Ranjan, G & Rao, AS 2000, Basic and Applied Soil Mechanics, New Age International
Publishers, New Delhi.
Richards, BG, Peter, P & Emerson, WW 1983, ‘The effects of vegetation on the swelling and
shrinking of soils in Australia’, Geotechnique, vol. 33, no. 2, pp. 127-139.
Sherwood, P 1993, Soil Stabilization with cement and lime, Her Majesty Stationary Office,
London, England
Sivakugan, N 2000, Soil Classification. Viewed 5 April, 2016
<http://eng1.jcu.edu.au/research/compgeo/classify.pdf>
Skempton, AW 1953, ‘The Colloidal Activity of Clays’, International Conference on Soil
Mechanics, vol. 1.
Snethen, DR 1980, ‘Expansive Soils in Highway Subgrades’, United States of America: U.S
Department of Transportation.
Sridharan A, Gurtug Y 2004, ‘Swelling behaviour of compacted fine-grained soils’,
Engineering Geology, vol. 72, pp. 9-18.
Standards Australia 1993, AS 1726-1993 Geotechnical site investigations, Standards
Australia, Homebush, NSW
Page 53
44
Standards Australia 1995, AS 1289.3.3.1-1995 Methods of testing soils for engineering
purposes Method 3.3.1: Soil classification tests- Calculation of the plasticity index of a soil,
Standards Australia, Homebush, NSW.
Standards Australia 2005, AS 1289.2.2.1-2005 Methods of testing soils for engineering
purposes Method 1.2.1: Soil moisture content tests - Determination of the moisture content
of a soil – Oven drying method (standard method), Standards Australia, Homebush, NSW.
Standards Australia 1995, AS 1289.3.2.1-1995 Methods of testing soils for engineering
purposes Method 3.2.1: Soil classification tests- Determination of the plastic limit of a soil –
Standard method, Standards Australia, Homebush, NSW.
White, WA 1949, ‘Atterberg limits of clay minerals’, American Mineral, vol, 34, pp. 508-
512.
Yang, H, Zheng, J, Zhang, R., & Liao, W 2007, ‘New Flexible Treatment Technology for the
Landslide of Expansive Soil Cut Slope’, Tenth Academic Conference of Soil Mechanics and
Geotechnical Engineering of China Civil Engineering Society.
Page 54
45
Appendix A – Project Specification
Page 55
46
ENG4111/4112 Research Project
Project Specification
For: Suman Shrestha
Title: Study of effects of coarse grain contents on Atterberg limits and
expansiveness of the clay
Major: Civil Engineering
Supervisor: Dr Buddhi Wahalathantri
Enrolment: ENG4111 – EXT S1, 2016
ENG4112 – EXT S2, 2016
Project Aim: To see how the expansive properties to soil change when coarse grain
contents (various percentages by weight) are added to it.
Programme: Issue A, 24th March 2016
1. Write an initial literature review on expansive soils.
2. Perform Atterberg’s limits (Liquid limit, Plastic limit & plasticity index) of the soil
sample and then perform oedometer test to find its expansive characteristics (swell
potential, swell pressure & swelling index).
3. Add coarse content (probably fine sand because of the size of the equipment) by 20, 50
& 80 percentages by weight and repeat the above step 3 for the each of the mixtures.
4. Compare the obtained results with the available literature. Seek a correlation between
Atterberg limits and expansive characteristics of samples.
5. Conclude whether the added contents have a positive or negative affect on the
expansive properties of soil and the ratios of each mixture.
Page 56
47
Appendix B – Tabulated test results for Liquid limit & Plastic limit
Page 57
48
Table B1. Liquid limit test result of clay-sand mixture (0% sand)
Tin number 1 2 3 4 5
Mass of tin (Ma)(gm) 36.60 37.00 37.30 37.00 36.70
Mass of tin + wet soil (Mb)(gm) 51.60 64.90 61.20 58.70 62.90
Mass of tin + dry soil (Mc)(gm) 45.60 53.20 50.90 49.20 51.10
Mass of water (Mw = Mb-Mc)(gm) 6.00 11.70 10.30 9.50 11.80
Mass of dry soil (Ms = Mc-Ma)(gm) 9.00 16.20 13.60 12.20 14.40
Moisture content [(Mw/Ms)*100] (%) 66.67 72.22 75.74 77.87 81.94
Penetration(mm) 14.98 18.52 20.22 21.23 23.01
Liquid Limit (LL) (%) 75.7
Table B2. Liquid limit test result of clay-sand mixture (25% sand)
Tin number 1 2 3 4 5
Mass of tin (Ma)(gm) 37.00 37.40 36.80 37.00 37.00
Mass of tin + wet soil (Mb)(gm) 61.00 60.20 59.50 58.10 59.40
Mass of tin + dry soil (Mc)(gm) 53.00 52.30 51.40 50.40 51.00
Mass of water (Mw = Mb-Mc)(gm) 8.00 7.90 8.10 7.70 8.40
Mass of dry soil (Ms = Mc-Ma)(gm) 16.00 14.90 14.60 13.40 14.00
Moisture content [(Mw/Ms)*100] (%) 50.00 53.02 55.48 57.46 60.00
Penetration(mm) 15.77 17.93 20.01 21.30 22.90
Liquid Limit (LL) (%) 55.48
Table B3. Liquid limit test result of clay-sand mixture (50% sand)
Tin number 1 2 3 4 5
Mass of tin (Ma)(gm) 36.60 36.90 37.10 36.90 37.00
Mass of tin + wet soil (Mb)(gm) 54.90 51.60 53.80 55.30 55.30
Mass of tin + dry soil (Mc)(gm) 50.00 47.60 49.20 50.00 49.90
Mass of water (Mw = Mb-Mc)(gm) 4.90 4.00 4.60 5.30 5.40
Mass of dry soil (Ms = Mc-Ma)(gm) 13.40 10.70 12.10 13.10 12.90
Moisture content [(Mw/Ms)*100] (%) 36.57 37.38 38.02 40.46 41.86
Penetration(mm) 17.16 18.29 18.34 23.17 23.99
Liquid Limit (LL) (%) 38.9
Page 58
49
Table B4. Liquid limit test result of clay-sand mixture (75% sand)
Tin number 1 2 3 4 5
Mass of tin (Ma)(gm) 36.70 37.00 37.00 37.40 37.00
Mass of tin + wet soil (Mb)(gm) 58.90 56.50 64.80 73.70 59.40
Mass of tin + dry soil (Mc)(gm) 54.80 52.85 59.55 66.40 54.80
Mass of water (Mw = Mb-Mc)(gm) 4.10 3.65 5.25 7.30 4.60
Mass of dry soil (Ms = Mc-Ma)(gm) 18.10 15.85 22.55 29.00 17.80
Moisture content [(Mw/Ms)*100] (%) 22.65 23.03 23.28 25.17 25.84
Penetration(mm) 17.70 18.65 19.08 22.96 24.29
Liquid Limit (LL) (%) 23.7
Table B5. Plastic limit test result of clay-sand mixture (0% sand)
Tin number 1 2
Mass of tin (Ma)(gm) 37.20 37.10
Mass of tin + wet soil (Mb)(gm) 42.70 43.20
Mass of tin + dry soil (Mc)(gm) 41.40 41.80
Mass of water (Mw = Mb-Mc)(gm) 1.30 1.40
Mass of dry soil (Ms = Mc-Ma)(gm) 4.20 4.70
Moisture content [(Mw/Ms)*100] (%) 30.95 29.79
Plastic (PL) (%) 30.37
Table B6. Plastic limit test result of clay-sand mixture (25% sand)
Tin number 1.00 2.00
Mass of tin (Ma)(gm) 37.00 37.20
Mass of tin + wet soil (Mb)(gm) 43.60 43.20
Mass of tin + dry soil (Mc)(gm) 42.20 42.10
Mass of water (Mw = Mb-Mc)(gm) 1.40 1.10
Mass of dry soil (Ms = Mc-Ma)(gm) 5.20 4.90
Moisture content [(Mw/Ms)*100] (%) 26.92 22.45
Plastic (PL) (%) 24.69
Page 59
50
Table B7. Plastic limit test result of clay-sand mixture (50% sand)
Tin number 1 2
Mass of tin (Ma)(gm) 36.60 37.60
Mass of tin + wet soil (Mb)(gm) 43.50 44.10
Mass of tin + dry soil (Mc)(gm) 42.50 43.20
Mass of water (Mw = Mb-Mc)(gm) 1.00 0.90
Mass of dry soil (Ms = Mc-Ma)(gm) 5.90 5.60
Moisture content [(Mw/Ms)*100] (%) 16.95 16.07
Plastic (PL) (%) 16.51
Table B8. Plastic limit test result of clay-sand mixture (75% sand)
Tin number 1 2
Mass of tin (Ma)(gm) 37.10 36.60
Mass of tin + wet soil (Mb)(gm) 44.50 42.30
Mass of tin + dry soil (Mc)(gm) 43.70 41.80
Mass of water (Mw = Mb-Mc)(gm) 0.80 0.50
Mass of dry soil (Ms = Mc-Ma)(gm) 6.60 5.20
Moisture content [(Mw/Ms)*100] (%) 12.12 9.62
Plastic (PL) (%) 10.87
Page 60
51
Appendix C – Test Data Oedometer Test
Page 61
52
Table C1 Test data for oedometer test of clay-sand mixture (0% sand)
Diameter of ring 5.047 cm
Height of specimen after compaction 1.495 cm
Area 20.006 cm^2
Volume 29.909 cm^3
Mass of ring 60.10 g
Initial water content (added) 0.22 %
Ring + specimen 114.50 g
Mass of specimen 54.40 g
Dry mass of specimen 44.590 g
Bulk density 1.819 g/cm^3
Dry density 1.491 g/cm^3
After completion of test
Mass of Ring + specimen 123.1 g
Mass of specimen 63.00 g
Dry mass of Specimen 44.30 g
Water content at the end 0.422 %
Corrected initial water content 0.228 %
Page 62
53
Table C2 Test data for oedometer test of clay-sand mixture (25% sand)
Diameter of ring 5.047 cm
Height of specimen after compaction 1.367 cm
Area 20.006 cm^2
Volume 27.338 cm^3
Mass of ring 60.100 g
Initial water content (added) 0.22 %
Ring + specimen 117.90 g
Mass of specimen 57.80 g
Dry mass of specimen 47.377 g
Bulk density 2.114 g/cm^3
Dry density 1.733 g/cm^3
After completion of test
Mass of Ring + specimen 143.3 g
Mass of specimen 63.20 g
Dry mass of Specimen 47.40 g
Water content at the end 0.333 %
Corrected initial water content 0.219 %
Page 63
54
Table C3 Test data for oedometer test of clay-sand mixture (50% sand)
Diameter of ring 5.047 cm
Height of specimen after compaction 1.789 cm
Area 20.006 cm^2
Volume 35.788 cm^3
Mass of ring 60.10 g
Initial water content (added) 0.22 %
Ring + specimen 140.90 g
Mass of specimen 80.80 g
Dry mass of specimen 66.23 g
Bulk density 2.26 g/cm^3
Dry density 1.85 g/cm^3
After completion of test
Mass of Ring + specimen 143.9 g
Mass of specimen 83.80 g
Dry mass of Specimen 65.80 g
Water content at the end 0.274 %
Corrected initial water content 0.228 %
Page 64
55
Table C4 Test data for oedometer test of clay-sand mixture (75% sand)
Diameter of ring 5.047 cm
Height of specimen after compaction 1.842 cm
Area 20.006 cm^2
Volume 36.847 cm^3
Mass of ring 60.10 g
Initial water content (added) 0.160 %
Mass of Ring + specimen 145.50 g
Mass of specimen 85.40 g
Dry mass of specimen 73.621 g
Bulk density 2.318 g/cm^3
Dry density 1.998 g/cm^3
After completion of test
Mass of Ring + specimen 150.0 g
Mass of Specimen 89.90 g
Dry mass of Specimen 72.10 g
Water content at the end 0.247 %
Corrected initial water content 0.184 %
Page 65
56
Appendix D – Tabulated Results of Free swell tests
Page 66
57
Table D1 Free swell test results of clay-sand mixture (0% sand)
Initial specimen height after compaction = 15.358
Time (min) Change in height (mm) Vertical Swelling (%)
0.00 0.00 0.00
0.25 0.08 0.53
1.00 0.34 2.18
2.25 0.67 4.39
4.00 0.99 6.47
6.25 1.34 8.69
9.00 1.70 11.10
12.25 1.95 12.72
16.00 2.17 14.14
20.25 2.33 15.18
25.00 2.47 16.08
30.25 2.59 16.89
36.00 2.67 17.41
42.25 2.75 17.90
49.00 2.81 18.30
56.25 2.85 18.58
64.00 2.89 18.83
72.25 2.94 19.12
81.00 2.96 19.29
90.25 3.00 19.51
100.00 3.01 19.59
110.25 3.02 19.68
121.00 3.06 19.90
132.25 3.07 19.97
144.00 3.09 20.09
156.25 3.10 20.16
169.00 3.10 20.20
182.25 3.11 20.26
196.00 3.12 20.33
210.25 3.13 20.41
225.00 3.13 20.41
240.25 3.14 20.43
256.00 3.14 20.46
272.25 3.14 20.47
289.00 3.15 20.48
306.25 3.15 20.52
Page 67
58
324.00 3.17 20.62
342.25 3.17 20.63
361.00 3.17 20.66
380.25 3.18 20.69
400.00 3.18 20.73
420.25 3.19 20.75
441.00 3.20 20.82
462.25 3.20 20.82
484.00 3.20 20.86
506.25 3.21 20.89
529.00 3.21 20.93
552.25 3.22 20.96
576.00 3.22 20.99
600.25 3.22 20.99
625.00 3.23 21.03
650.25 3.24 21.08
676.00 3.24 21.08
702.25 3.25 21.14
729.00 3.25 21.17
756.25 3.25 21.19
784.00 3.26 21.20
812.25 3.26 21.21
841.00 3.26 21.23
870.25 3.26 21.25
900.00 3.26 21.25
930.25 3.27 21.26
961.00 3.27 21.27
992.25 3.27 21.27
1024.00 3.27 21.27
1056.25 3.27 21.28
1089.00 3.27 21.28
1122.25 3.27 21.28
1156.00 3.27 21.30
1190.25 3.27 21.30
1225.00 3.27 21.30
1260.25 3.27 21.31
1296.00 3.27 21.31
1332.25 3.27 21.32
1369.00 3.27 21.32
1406.25 3.27 21.32
Page 68
59
Table D2. Free swell test results of clay-sand mixture (25% sand)
Initial specimen height after compaction = 14.263 mm
Time (min) Change in Height (mm) Vertical swelling (%)
0.00 0.00 0.00
0.25 0.02 0.11
1.00 0.13 0.93
2.25 0.46 3.25
4.00 0.71 4.98
6.25 0.94 6.57
9.00 1.12 7.88
12.25 1.30 9.11
16.00 1.43 10.04
20.25 1.55 10.85
25.00 1.64 11.49
30.25 1.72 12.08
36.00 1.78 12.47
42.25 1.84 12.90
49.00 1.87 13.14
56.25 1.90 13.35
64.00 1.92 13.45
72.25 1.94 13.63
81.00 1.96 13.77
90.25 1.97 13.85
100.00 1.98 13.92
110.25 2.00 14.01
121.00 2.00 14.08
132.25 2.01 14.11
144.00 2.01 14.13
156.25 2.02 14.17
169.00 2.02 14.18
182.25 2.02 14.20
196.00 2.02 14.21
210.25 2.03 14.23
225.00 2.03 14.26
240.25 2.03 14.28
256.00 2.04 14.30
272.25 2.04 14.32
289.00 2.04 14.34
306.25 2.05 14.37
324.00 2.05 14.39
Page 69
60
342.25 2.05 14.39
361.00 2.05 14.41
380.25 2.06 14.44
400.00 2.06 14.45
420.25 2.06 14.46
441.00 2.06 14.49
462.25 2.07 14.53
484.00 2.07 14.57
506.25 2.08 14.62
529.00 2.08 14.64
552.25 2.09 14.70
576.00 2.09 14.71
600.25 2.10 14.72
625.00 2.10 14.73
650.25 2.10 14.73
676.00 2.10 14.74
702.25 2.11 14.79
729.00 2.11 14.79
756.25 2.11 14.82
784.00 2.11 14.82
812.25 2.11 14.83
841.00 2.11 14.84
870.25 2.11 14.85
900.00 2.11 14.85
930.25 2.12 14.88
961.00 2.12 14.88
992.25 2.12 14.88
1024.00 2.12 14.90
1056.25 2.12 14.91
1089.00 2.12 14.91
1122.25 2.12 14.91
1156.00 2.12 14.92
1190.25 2.12 14.92
1225.00 2.12 14.92
1260.25 2.12 14.92
1296.00 2.13 14.93
1332.25 2.13 14.93
1369.00 2.13 14.93
1406.25 2.13 14.93
Page 70
61
Table D3. Free swell test results of clay-sand mixture (50% sand)
Initial Specimen height after compaction = 19.089mm
Time (mm) Change in height (mm) Vertical Swelling (%)
0.00 0.0000 0.0000
0.25 0.0002 0.0010
1.00 0.0007 0.0037
2.25 0.0009 0.0047
4.00 0.0010 0.0052
6.25 0.0020 0.0105
9.00 0.0030 0.0157
12.25 0.0050 0.0262
16.00 0.0050 0.0262
20.25 0.0050 0.0262
25.00 0.0070 0.0367
30.25 0.0070 0.0367
36.00 0.0080 0.0419
42.25 0.0100 0.0524
49.00 0.0110 0.0576
56.25 0.0110 0.0576
64.00 0.0120 0.0629
72.25 0.0140 0.0733
81.00 0.0140 0.0733
90.25 0.0140 0.0733
100.00 0.0190 0.0995
110.25 0.0200 0.1048
121.00 0.0210 0.1100
132.25 0.0220 0.1152
144.00 0.0220 0.1152
156.25 0.0240 0.1257
169.00 0.0280 0.1467
182.25 0.0310 0.1624
196.00 0.0330 0.1729
210.25 0.0340 0.1781
225.00 0.0340 0.1781
240.25 0.0350 0.1834
256.00 0.0360 0.1886
272.25 0.0360 0.1886
289.00 0.0360 0.1886
306.25 0.0370 0.1938
324.00 0.0370 0.1938
Page 71
62
342.25 0.0380 0.1991
361.00 0.0380 0.1991
380.25 0.0380 0.1991
400.00 0.0430 0.2253
420.25 0.0450 0.2357
441.00 0.0490 0.2567
462.25 0.0500 0.2619
484.00 0.0510 0.2672
506.25 0.0520 0.2724
529.00 0.0530 0.2776
552.25 0.0530 0.2776
576.00 0.0540 0.2829
600.25 0.0540 0.2829
625.00 0.0550 0.2881
650.25 0.0550 0.2881
676.00 0.0550 0.2881
702.25 0.0550 0.2881
729.00 0.0550 0.2881
756.25 0.0560 0.2934
784.00 0.0560 0.2934
812.25 0.0560 0.2934
841.00 0.0560 0.2934
870.25 0.0560 0.2934
900.00 0.0570 0.2986
930.25 0.0570 0.2986
961.00 0.0570 0.2986
992.25 0.0570 0.2986
1024.00 0.0580 0.3038
1056.25 0.0580 0.3038
1089.00 0.0590 0.3091
1122.25 0.0610 0.3196
1156.00 0.0610 0.3196
1190.25 0.0620 0.3248
1225.00 0.0620 0.3248
1260.25 0.0620 0.3248
1296.00 0.0630 0.3300
1332.25 0.0640 0.3353
1369.00 0.0640 0.3353
1406.25 0.0640 0.3353
Page 72
63
Table D4. Free swell test results of clay-sand mixture (75% sand)
Initial Specimen height after compaction = 18.908mm
Time (mm) Change in height (mm) Vertical Swelling (%)
0.00 0.00 0.00
0.25 0.00 0.01
1.00 0.00 0.01
2.25 0.00 0.01
4.00 0.00 0.01
6.25 0.00 0.01
9.00 0.00 0.01
12.25 0.00 0.01
16.00 0.00 0.01
20.25 0.00 0.01
25.00 0.00 0.01
30.25 0.00 0.01
36.00 0.00 0.01
42.25 0.00 0.02
49.00 0.00 0.02
56.25 0.00 0.02
64.00 0.00 0.02
72.25 0.00 0.02
81.00 0.00 0.02
90.25 0.00 0.02
100.00 0.00 0.01
110.25 0.00 0.02
121.00 0.00 0.01
132.25 0.00 0.02
144.00 0.00 0.02
156.25 0.00 0.02
169.00 0.00 0.02
182.25 0.00 0.02
196.00 0.00 0.02
210.25 0.00 0.02
225.00 0.00 0.02
240.25 0.00 0.02
256.00 0.01 0.03
272.25 0.00 0.02
289.00 0.00 0.02
306.25 0.00 0.02
324.00 0.01 0.03
Page 73
64
342.25 0.01 0.03
361.00 0.01 0.03
380.25 0.01 0.03
400.00 0.01 0.03
420.25 0.00 0.02
441.00 0.01 0.04
462.25 0.01 0.03
484.00 0.01 0.04
506.25 0.01 0.03
529.00 0.01 0.04
552.25 0.01 0.04
576.00 0.01 0.03
600.25 0.01 0.03
625.00 0.01 0.05
650.25 0.01 0.04
676.00 0.01 0.05
702.25 0.01 0.05
729.00 0.01 0.05
756.25 0.01 0.04
784.00 0.01 0.04
812.25 0.01 0.05
841.00 0.01 0.05
870.25 0.01 0.06
900.00 0.01 0.05
930.25 0.01 0.05
961.00 0.01 0.05
992.25 0.01 0.06
1024.00 0.01 0.06
1056.25 0.01 0.06
1089.00 0.01 0.05
1122.25 0.01 0.06
1156.00 0.01 0.07
1190.25 0.01 0.06
1225.00 0.01 0.06
1260.25 0.01 0.06
1296.00 0.01 0.06
1332.25 0.01 0.06
1369.00 0.01 0.06
1406.25 0.01 0.06
Page 74
65
Appendix E – Risk Assessment
Page 75
66
Risk Assessment
For all the projects, it is very essential that the associated risks be identified, assessed and
controlled. This is only possible in a controlled work environment and by following safe
workplace procedures.
Risks are associated with hazards and while hazards are cannot be avoided, risks associated
can certainly be reduced and controlled by proper management.
A risk management chart summarizing hazard identification, potential risks, and control
methods is presented in the table below.
Activity Hazard Risks Risk Level Control measures
Lab experiments Falling over of
objects/parts of
equipment
(oedometer, etc)
Potential injury
to the
user/damage to
the equipment
Moderate Avoid placing
objects at the
edge of the table.
Place them
properly so they
don’t roll over
and fall
Lab experiments Fine sand
particles flying
in air
Potential
irritation of
eyes, nose and
throat and/or
serious
problems
Moderate Wear facemask
and goggles
Do not turn on
fan in high speed
near the sand
Lab Experiment Tables with
wheels
Injury to people
and/or damage
of equipment
Low Make sure the
wheels are locked
Research and
reporting
Sitting at a desk
for prolonged
periods
Potential neck
and back
injuries
Moderate Follow the
ergonomics
(correct siting
posture)
Take regular
breaks and do
some stretches
Research and
reporting
Viewing
computer screen
for prolonged
periods
Potential eye
problems and
headaches
Low Take a few
minutes breaks
every hour.
Regularly look
away from
computer,
possibly out of
the window
during