Back-arc extension in the Andaman Sea: Tectonic and magmaticprocesses imaged by high-precision teleseismic double-differenceearthquake relocation
T. Diehl,1,2 F. Waldhauser,1 J. R. Cochran,1 K. A. Kamesh Raju,3 L. Seeber,1
D. Schaff,1 and E. R. Engdahl4
Received 10 August 2012; revised 29 March 2013; accepted 16 April 2013.
[1] The geometry, kinematics, and mode of back-arc extension along the Andaman Seaplate boundary are re!ned using a new set of signi!cantly improved hypocenters, globalcentroid moment tensor (CMT) solutions, and high-resolution bathymetry. By applyingcross-correlation and double-difference (DD) algorithms to regional and teleseismicwaveforms and arrival times from International Seismological Centre and NationalEarthquake Information Center bulletins (1964–2009), we resolve the !ne-scale structureand spatiotemporal behavior of active faults in the Andaman Sea. The new data reveal thatback-arc extension is primarily accommodated at the Andaman Back-Arc SpreadingCenter (ABSC) at ~10!, which hosted three major earthquake swarms in 1984, 2006, and2009. Short-term spreading rates estimated from extensional moment tensors account forless than 10% of the long-term 3.0–3.8 cm/yr spreading rate, indicating that spreading byintrusion and the formation of new crust make up for the difference. A spatiotemporalanalysis of the swarms and Coulomb-stress modeling show that dike intrusions are theprimary driver for brittle failure in the ABSC. While spreading direction is close toridge normal, it is oblique to the adjacent transforms. The resulting component of E-Wextension across the transforms is expressed by deep basins on either side of the rift and achange to extensional faulting along the West Andaman fault system after the Mw = 9.2Sumatra-Andaman earthquake of 2004. A possible skew in slip vectors of earthquakes inthe eastern part of the ABSC indicates an en-echelon arrangement of extensional structures,suggesting that the present segment geometry is not in equilibrium with current plate-motion demands, and thus the ridge experiences ongoing re-adjustment.
Citation: Diehl, T., F. Waldhauser, J. R. Cochran, K. A. Kamesh Raju, L. Seeber, D. Schaff, and E. R. Engdahl(2013), Back-arc extension in the Andaman Sea: Tectonic and magmatic processes imaged by high-precision teleseismicdouble-difference earthquake relocation, J. Geophys. Res. Solid Earth, 118, doi:10.1002/jgrb.50192.
1. Introduction
[2] The Andaman Sea in the northeast Indian Ocean is anactively opening marginal basin inboard of theWestern SundaArc (Figure 1). Extension in the Andaman Sea is primarilydriven by oblique subduction of the Indian-Australian platebeneath the western Sunda arc, in contrast to back-arc basinsin the southwestern Paci!c, where extension is mainly
associated with trench rollback [e.g., Uyeda and Kanamori,1979]. Oblique plate convergence is accommodated in partby strain partitioning along this subduction zone resultingin arc-parallel strike-slip faulting and the formation of anorthward moving sliver plate [e.g., Fitch, 1972;McCaffrey, 1992; McCaffrey, 2009]. The boundarybetween the sliver, Burma Plate, and the Sunda Plate isa system of arc-parallel transforms and arc-normal ridgesin the back-arc of the Andaman Sea, which connects tothe right-lateral Sumatra fault along the volcanic arc inthe southwest (Figure 1). The connection with theSagaing Fault to the northeast is less distinct, and differ-ent geometries have been proposed [e.g., Rangin et al.,1999; Curray, 2005] (see Figure 1). As the Burma Plateis dragged northward (with respect to the Sunda Plate) bythe underthrusting Indian-Australian plate, “pull-apart” basinsdevelop along the plate boundary, resulting in NE-SWextension of the Andaman Sea [e.g., Curray, 2005;McCaffrey, 2009]. While the term “pull-apart” usually refersto intracrustal extension along a strike-slip system, extensionin the Andaman Sea involves the formation of new crust
Additional supporting information may be found in the online version ofthis article.
1Lamont-Doherty Earth Observatory, Columbia University, Palisades,New York, USA.
2Now at Swiss Seismological Service, ETH Zurich, Zurich,Switzerland.
3National Institute of Oceanography, Dona Paula, Goa, India.4Department of Physics, University of Colorado, Boulder, Colorado, USA.
Corresponding author: T. Diehl, Swiss Seismological Service, ETH Zurich,Sonneggstrasse 5, CH-8092, Zurich, Switzerland. ([email protected])
[Kamesh Raju et al., 2004] and justi!es identifying the sliveras a distinct plate. This transtensional mode of back-arcopening is also referred to as “rhombochasm” [e.g., Rodolfo,1969; Curray, 2005] or “leaky-transform” [e.g., Thompsonand Melson, 1972; Uyeda and Kanamori, 1979; Tayloret al., 1994].
[3] The !rst geophysical evidence for active opening ofthe Andaman Sea was derived from bathymetric, magnetic,gravimetric, heat "ow, and seismic surveys [e.g., Rodolfo,1969; Curray et al., 1979; for a summary, see Curray,2005]. Kamesh Raju et al. [2004] mapped the structure ofthe Andaman Back-Arc Spreading Center (ABSC, Figure 1)in detail, using high-resolution multibeam swath bathymetryin combination with magnetic and single-channel seismicsurveys. They identify three SW-NE trending spreadingsegments, separated by left-stepping offsets of several kilo-meters. Interpretation of magnetic anomalies suggests thattrue sea"oor spreading started at about 4Ma and is thusmuch younger than the Sunda arc. It may still be developing,according to the kinematic model of Kamesh Raju et al.[2004] that implies a westward propagation of the spreadingcenter. Magnetic anomalies suggest an initial spreading rateof 1.6 cm/yr and an increase in rate up to 3.8 cm/yr fromabout 2–2.5Ma to present [Kamesh Raju et al., 2004]. Theestimated 118 km opening of the ABSC over 4Myrresults in an average rate of 3.0 cm/yr [Curray, 2005].Chamot-Rooke et al. [2001] proposed a similar range ofspreading rate of 2.8–3.6 cm/yr. With a present full ratein the range of 3.0–3.8 cm/yr, the Andaman SpreadingCenter is in the class of slow-spreading ridges [e.g., Dicket al., 2003].[4] Early evidence for neotectonic extension was based on
focal mechanisms determined from teleseismic records ofearthquakes in the Andaman Sea. Fitch [1972] found threenormal-faulting events in the northern part of the AndamanSea, indicating a WNW-NW extension. In addition, he asso-ciated four right-lateral strike-slip events located north andnorthwest of Sumatra with a submarine continuation of theSumatra fault system. The existence of two spreading centerslocated at 10!N and at 14!N separated by a N-S transformfault was inferred from the recovery of additional right-lateral strike-slip and normal-faulting mechanisms in theAndaman Sea by Eguchi et al. [1979]. Guzmán-Speziale andNi [1993] obtained the strikingly low short-term spreadingvelocity of 0.05 cm/yr in the Andaman Sea from summingseismic moment tensors of normal-faulting events between1964 and 1986, much smaller than the calculated displace-ment velocity along the right-lateral Sagaing Fault. Theirspreading velocity was based on the assumption of full cou-pling in a deeply rooted extension regime with no contributionfrom magmatic injection and is likely an underestimate.[5] Earthquakes in the Andaman Sea often occur clustered
in space and time as noted, e.g., in Mukhopadhyay andDasgupta [2008] and shown in Figure S1 in the supportinginformation. In the course of this study, we use the term“cluster” to indicate spatial clustering and “sequence” forspatial as well as temporal clustering of earthquakes. Specialtypes of sequences are “swarms,” which typically lack adistinct main shock, show an unusually large spatial extentcompared to the moment release of the largest individualevent, and have magnitudes that fail to decay with time [e.g.,Roland and McGuire, 2009]. The characteristics of severalearthquake sequences in the Andaman Sea are described indetail in section S.1 of the supporting information. Earthquakeswarms were observed in 1973, 1983–1984, and 1993, particu-larly in the south Andaman Sea (Figures 2, S1, and S2). InMarch 2006, more than 1year after the Mw=9.2 December2004 Sumatra-Andaman earthquake, an earthquake swarm
Figure 1. Simpli!ed tectonic map of the Sumatra-Andaman region with active faults indicated by solid linesand inactive faults marked as dashed black lines [afterCurray, 2005]. Thin lines indicate the extensional horsetailsystem forming the southern termination of the SagaingFault as proposed by Rangin et al. [1999]. Dashed box indi-cates study area. Convergence rate is from Sieh andNatawidjaja [2000], spreading rate in the Andaman Sea isfrom Kamesh Raju et al. [2004]. Stars correspond to NEICepicenters of the December 2004 Sumatra-Andaman andMarch 2005 Nias events. Corresponding global CMT solu-tions are plotted at their centroid locations. Triangles corre-spond to volcanic arc [Siebert and Simkin, 2002]. Boldlabels indicate plates. AB: Aceh Basin, ABSC: AndamanBack-Arc Spreading Center, AR: Alcock Rise, I-A: Indian-Australian, SEU: Seulimeum strand of the Sumatra fault sys-tem, SFS: Sumatra fault system, SR: Sewell Rise, WAF:West Andaman fault.
DIEHL ET AL.: BACK-ARC EXTENSION IN THE ANDAMAN SEA
2
occurred in the ABSC, followed by another swarm in July 2009(Figures 2, S1, and S2). The swarm-like occurrence ofearthquakes is indicative of episodic rifting events. Major earth-quake swarms in the ABSC appear to occur roughlyevery 10years, with the exception of the 2009 swarm, whichoccurred after a quiescence of only 3 years (Figure S1).[6] Existing models of plate-boundary structure and tec-
tonic processes in the Andaman Sea are based in large parton global bulletin earthquake locations and associated focalmechanisms. Bulletin locations such as provided by the ISC(International Seismological Centre) or EDR (EarthquakeData Report of the National Earthquake Information Center,NEIC) typically have spatial resolution (depth in particular)below the scale length of tectonic structures in this region andhamper seismotectonic interpretations. To better understandthe underlying mechanisms of the earthquake swarms in theAndaman Sea, we use cross-correlation and double-differencemethods to signi!cantly improve the hypocenter locations instandard global earthquake catalogs. The high-resolution time-space seismicity patterns together with global centroid momenttensor (CMT) solutions starting in 1976 (http://www.globalcmt.org) and detailed sea"oor bathymetry are combined to constructand discuss an improved seismotectonic framework for theAndaman Back-Arc region.
2. Data and Double-Difference Relocation
[7] We use phase arrival time data observed at regionaland global seismic networks and published in the ISC bulle-tin for the years 1964–2006 and in the EDR bulletin for theyears 2007–2009, as well as digital waveform data obtainedfrom the Incorporated Research Institutions for Seismology(IRIS). The combined ISC/EDR catalog includes a total of19,000 earthquakes in the Sumatra-Andaman region, 1266of which occurred in the Andaman Sea (area outlined bydashed line in Figure 2) and are discussed in this paper.The hypocenters in these catalogs are estimated usingsingle-event location methods that invert arrival times forthe absolute location of the hypocenter and its origin time.Due to limited station coverage, inconsistencies in phaseassociation, uncertainties in arrival time readings, and errorsin the model used to predict the data, the spatial resolution ofthese locations is often low. Because of the trade-offbetween origin time and depth for events recorded atteleseismic distances, focal depths are often unconstrainedand set to a default value.[8] Previous relocation studies include Engdahl et al.
[2007], who relocated a subset of the global bulletin data forthe Sumatra-Andaman region following the Engdahl-van der
Figure 2. Seismicity in the Sumatra-Andaman region as reported in the ISC and EDR bulletins for focaldepths !40 km. (a) Time period: 1 January 1964 to 25 December 2004. Blue dots correspond to eventsbetween 1983 and 1984; green dots indicate events between 1993 and 1994. Stars indicate epicenters ofthe 2004 Sumatra-Andaman earthquake and 2005 Nias earthquake. Dashed line indicates outline ofback-arc region studied. (b) Time period: 26 December 2004 (Mw= 9.2 Sumatra-Andaman earthquake)to 28 March 2005. Yellow line indicates rupture area of the 2004 Sumatra-Andaman earthquake basedon the slip model of Chlieh et al. [2007]. (c) Time period: 28 March 2005 (Mw= 8.7 Nias earthquake)to end of 2009. Yellow dots correspond to events in 2006; red dots indicate events in 2009. Brown lineindicates rupture area of the 2005 Nias earthquake based on the slip model of Briggs et al. [2006].
DIEHL ET AL.: BACK-ARC EXTENSION IN THE ANDAMAN SEA
Hilst-Buland (EHB) procedure, which computes a groomedcatalog of the highest-quality events with improved depthsby using depth phases obtained by probabilistic phase associ-ation [Engdahl et al., 1998]. Pesicek et al. [2010] relocated theEHB catalog by applying a double-difference algorithm to !rstarriving P waves and depth phases extracted from the EHBbulletin and measured via waveform cross-correlationtogether with a regional 3-D velocity model.[9] In this study, we aim to resolve and study in a
comprehensive way the !ne details of active faulting in
the Andaman Sea by applying the teleseismic double-difference (hypoDD) algorithm of Waldhauser and Schaff[2007] to all !rst and later arriving P and S phase datareported in the ISC and EDR bulletins. The double-difference method removes unmodeled velocity structureby directly inverting travel-time differences between eventsfor their hypocenter separation [Waldhauser and Ellsworth,2000]. This approach permits the combined use of phasedelay times measured from bulletin picks and fromcross-correlation of similar seismograms. Cross-correlation(CC) methods can measure differential phase arrival timeswith subsample precision for events that are nearby and havesimilar focal mechanisms, typically resulting in more than anorder of magnitude improvement over delay times formedfrom phase onset picks reported in earthquake bulletins[Poupinet et al., 1984; Waldhauser and Schaff et al., 2007].
2.1. Waveform Cross-Correlation[10] While the following cross-correlation results pertain
to the entire Sumatra-Andaman region, their subsequentanalysis and interpretation focuses on the Andaman Sea.We extracted 7 million waveforms of more than 19,000events from the IRIS and GEOFON data centers, selectingthe best ~1000 regional and global stations from theGlobal Seismic Network, the GEOFON network (http://geofon.gfz-potsdam.de), and the GEOSCOPE network(http://geoscope.ipgp.fr). All available stations within a ra-dius of 30! from the Sumatra-Andaman region and all avail-able stations in the Southern Hemisphere were used.Typically less than 10 records are available for events thatoccurred prior to 1990 and none for events before 1984.We perform time-domain cross-correlation [Schaff et al.,2004; Waldhauser and Schaff, 2007] on 9 s long windowsaround the predicted !rst arriving P and S phases. Wave-forms of all pairs of events separated by less than 300 kmare cross-correlated. A band-pass !lter of 0.5 to 2.0Hz is ap-plied to seismograms prior to cross-correlation in order to in-crease the signal-to-noise ratio of the body waves.[11] The distribution of the CC measurements across the
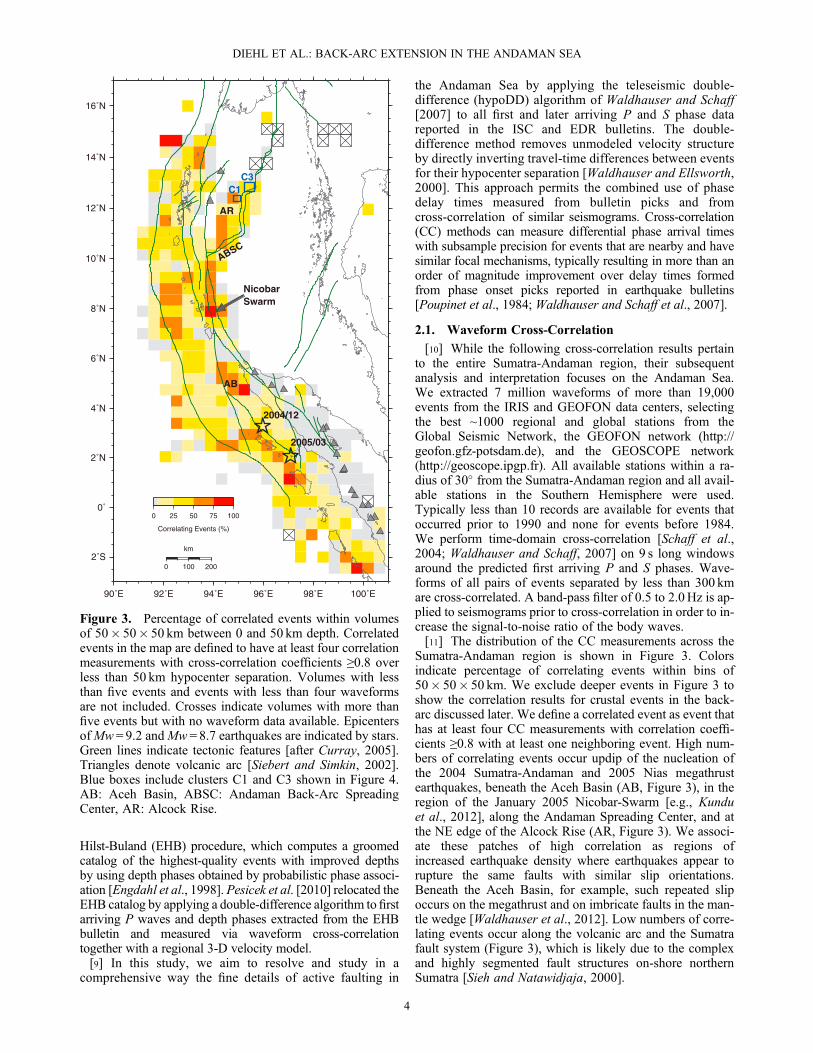
Sumatra-Andaman region is shown in Figure 3. Colorsindicate percentage of correlating events within bins of50" 50" 50 km. We exclude deeper events in Figure 3 toshow the correlation results for crustal events in the back-arc discussed later. We de!ne a correlated event as event thathas at least four CC measurements with correlation coef!-cients "0.8 with at least one neighboring event. High num-bers of correlating events occur updip of the nucleation ofthe 2004 Sumatra-Andaman and 2005 Nias megathrustearthquakes, beneath the Aceh Basin (AB, Figure 3), in theregion of the January 2005 Nicobar-Swarm [e.g., Kunduet al., 2012], along the Andaman Spreading Center, and atthe NE edge of the Alcock Rise (AR, Figure 3). We associ-ate these patches of high correlation as regions ofincreased earthquake density where earthquakes appear torupture the same faults with similar slip orientations.Beneath the Aceh Basin, for example, such repeated slipoccurs on the megathrust and on imbricate faults in the man-tle wedge [Waldhauser et al., 2012]. Low numbers of corre-lating events occur along the volcanic arc and the Sumatrafault system (Figure 3), which is likely due to the complexand highly segmented fault structures on-shore northernSumatra [Sieh and Natawidjaja, 2000].
90˚E 92˚E 94˚E 96˚E 98˚E 100˚E
2˚S
0˚
2˚N
4˚N
6˚N
8˚N
10˚N
12˚N
14˚N
16˚N
0 100 200
km
C1C3
AB
AR
ABSC
NicobarSwarm
2004/12
2005/03
0 25 50 75 100
Correlating Events (%)
Figure 3. Percentage of correlated events within volumesof 50" 50" 50 km between 0 and 50 km depth. Correlatedevents in the map are de!ned to have at least four correlationmeasurements with cross-correlation coef!cients "0.8 overless than 50 km hypocenter separation. Volumes with lessthan !ve events and events with less than four waveformsare not included. Crosses indicate volumes with more than!ve events but with no waveform data available. EpicentersofMw = 9.2 andMw = 8.7 earthquakes are indicated by stars.Green lines indicate tectonic features [after Curray, 2005].Triangles denote volcanic arc [Siebert and Simkin, 2002].Blue boxes include clusters C1 and C3 shown in Figure 4.AB: Aceh Basin, ABSC: Andaman Back-Arc SpreadingCenter, AR: Alcock Rise.
DIEHL ET AL.: BACK-ARC EXTENSION IN THE ANDAMAN SEA
4
2.2. Teleseismic Multiphase Double-Difference Relocation[12] We combine 40,000 high-precision correlation
delay-time measurements for events within the back-arcregion with 1.3 million delay times formed from bulletinpicks and invert the data for relative hypocenter locationsusing the teleseismic hypoDD algorithm of Waldhauserand Schaff [2007]. In order to reduce the number of out-liers caused by cycle skipping in the correlation data,only CC measurements with CC coef!cient "0.8 areused. We compute pick delay times from all !rst andlater arriving P and S phase data listed in the ISC/EDRbulletins. The use of core phases with their steep takeoffangles, in addition to depth phases, is especially impor-tant to constrain relative depths. The global travel-timemodel ak135 is used to predict the observed data. Toreduce the impact of the inhomogeneous station distribu-tion, we selected for each event pair independently the
best station within bins of 3! across the globe beforerelocation (see Waldhauser and Schaff [2007] for details).[13] To reduce the often signi!cant errors in the ISC and
EDR bulletin locations, which can lead to an incomplete net-work of delay time links, we relocate each event listed inthese catalogs individually relative to events in an updated(1918–2009) and DD relocated version of the EHB catalogfor the Sumatra-Andaman region [Engdahl et al., 2007]using a single-event DD algorithm [Waldhauser, 2009;Waldhauser et al., 2012]. The improved single-event DDlocations are subsequently used to generate a new networkof phase delay times from the combined ISC and EDR bulle-tins and are taken as starting locations for a !nal simultaneousinversion of both correlation and phase pick delay time data.The !nal DD relocations have an RMS of 0.72 s for bulletinpick data. The RMS value for correlation data is on the orderof 60ms for earthquakes with well-correlated seismograms,such as observed in cluster C1 (Figures 3 and 4b).
12.7˚N
12.8˚N
12.9˚N
13˚N
10 km
(c) C3: ISC/EDR
95.3˚E 95.4˚E 95.5˚E 95.6˚E
12.7˚N
12.8˚N
12.9˚N
13˚N
!2700
!2700
!2600
(d) C3: DD
12.3˚N
12.4˚N
12.5˚N
10 km
(a) C1: ISC/EDR
94.8˚E 94.9˚E 95˚E 95.1˚E
12.3˚N
12.4˚N
12.5˚N(b) C1: DD
05/06
04/07
04/07
04/08
04/07
03/07
03/07
04/07
04/07
04/07
O3
O2
O1S1
N2
N1
S2
N3
N4N5
N6
N7
N8
83/12
03/01
03/01
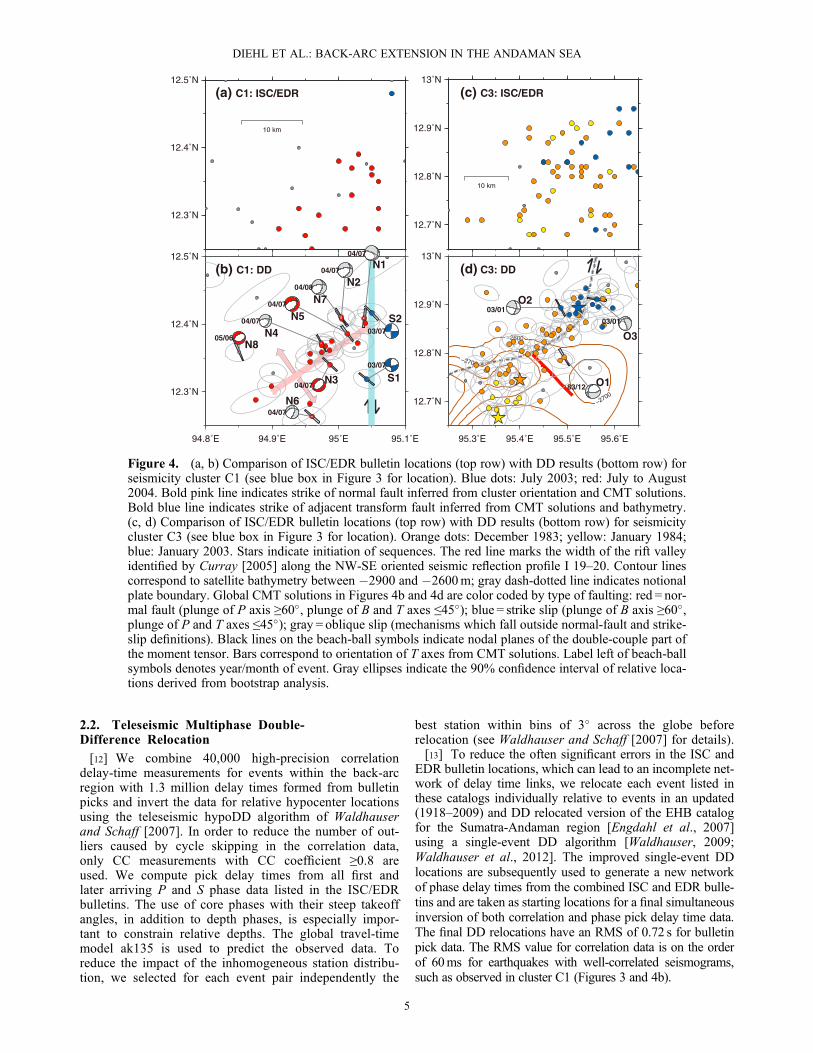
Figure 4. (a, b) Comparison of ISC/EDR bulletin locations (top row) with DD results (bottom row) forseismicity cluster C1 (see blue box in Figure 3 for location). Blue dots: July 2003; red: July to August2004. Bold pink line indicates strike of normal fault inferred from cluster orientation and CMT solutions.Bold blue line indicates strike of adjacent transform fault inferred from CMT solutions and bathymetry.(c, d) Comparison of ISC/EDR bulletin locations (top row) with DD results (bottom row) for seismicitycluster C3 (see blue box in Figure 3 for location). Orange dots: December 1983; yellow: January 1984;blue: January 2003. Stars indicate initiation of sequences. The red line marks the width of the rift valleyidenti!ed by Curray [2005] along the NW-SE oriented seismic re"ection pro!le I 19–20. Contour linescorrespond to satellite bathymetry between #2900 and #2600m; gray dash-dotted line indicates notionalplate boundary. Global CMT solutions in Figures 4b and 4d are color coded by type of faulting: red = nor-mal fault (plunge of P axis "60!, plunge of B and T axes !45!); blue = strike slip (plunge of B axis "60!,plunge of P and T axes !45!); gray = oblique slip (mechanisms which fall outside normal-fault and strike-slip de!nitions). Black lines on the beach-ball symbols indicate nodal planes of the double-couple part ofthe moment tensor. Bars correspond to orientation of T axes from CMT solutions. Label left of beach-ballsymbols denotes year/month of event. Gray ellipses indicate the 90% con!dence interval of relative loca-tions derived from bootstrap analysis.
DIEHL ET AL.: BACK-ARC EXTENSION IN THE ANDAMAN SEA
5
[14] Figure 4 demonstrates the improvement of the DDlocations compared to the ISC/EDR bulletin locations fortwo clusters of earthquakes near 12.4!N/95!E (C1 inFigure 3) and 12.8!N/95.5!E (C3 in Figure 3). While theISC/EDR epicenters widely scatter (Figure 4a), the DDlocations resolve a NE-SW striking structure (Figure 4b),consistent with the fault strike of the CMT solutions andthe NE-SW oriented structures present in the bathymetrydata near the Alcock Rise (Figure 1). DD locations of clusterC3 (Figure 4d) show that the three sequences occupy distinct
areas of the basin suggesting differences in their underlyingtectonic mechanisms. Relative location errors, computedfrom 200 bootstrap samples drawn from the !nal residualvector for each event (see Waldhauser and Ellsworth[2000] for details), are on the order of few kilometers or less.They are shown in Figure 4 as horizontal projections of the90% con!dence ellipsoids. Relocations of events prior tothe 1990s and back to 1964 are mainly or entirely basedon bulletin pick data, and therefore the quality of the DDlocations may also vary with time.
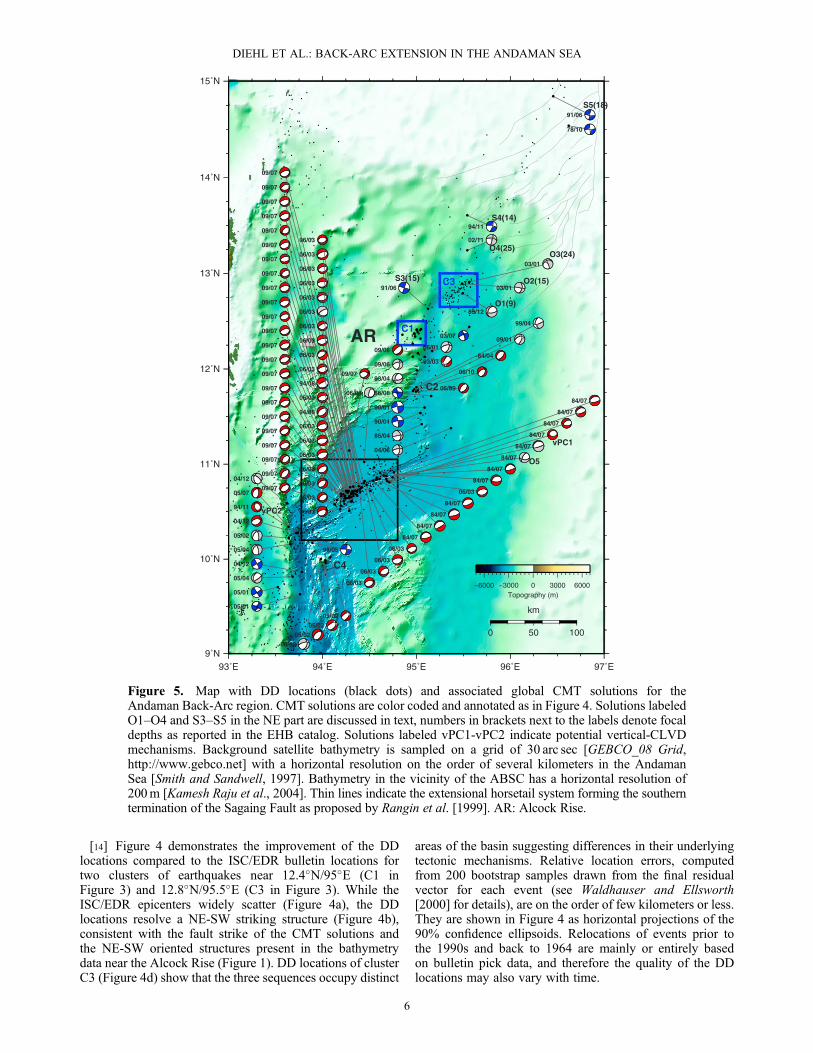
Figure 5. Map with DD locations (black dots) and associated global CMT solutions for theAndaman Back-Arc region. CMT solutions are color coded and annotated as in Figure 4. Solutions labeledO1–O4 and S3–S5 in the NE part are discussed in text, numbers in brackets next to the labels denote focaldepths as reported in the EHB catalog. Solutions labeled vPC1-vPC2 indicate potential vertical-CLVDmechanisms. Background satellite bathymetry is sampled on a grid of 30 arc sec [GEBCO_08 Grid,http://www.gebco.net] with a horizontal resolution on the order of several kilometers in the AndamanSea [Smith and Sandwell, 1997]. Bathymetry in the vicinity of the ABSC has a horizontal resolution of200m [Kamesh Raju et al., 2004]. Thin lines indicate the extensional horsetail system forming the southerntermination of the Sagaing Fault as proposed by Rangin et al. [1999]. AR: Alcock Rise.
DIEHL ET AL.: BACK-ARC EXTENSION IN THE ANDAMAN SEA
2.3. Assessment of Absolute Location Robustness[15] Because the EHB locations are the reference base
for the overall absolute location of the DD solutions,possible bias in the EHB locations would also affectthe absolute position of the DD solutions. Such biasmay result from deviations of the true structure fromthe 1-D velocity model ak135 used to locate the events(presence of slab, etc.) and bias in station geometry. Grid
search results using the 3-D regional velocity model ofWidiyantoro and van der Hilst [1997] indicate that ourabsolute locations are robust within 5 km. While relativedepths are typically well constrained by differential depthand core phases, the absolute depths in our DD catalogare mostly constrained by depth phases from the EHBbulletin. More details on absolute location robustnessare provided in section S.2 of the supporting information.
93˚E 94˚E 95˚E 96˚E 97˚E9˚N
10˚N
11˚N
12˚N
13˚N
14˚N
15˚N
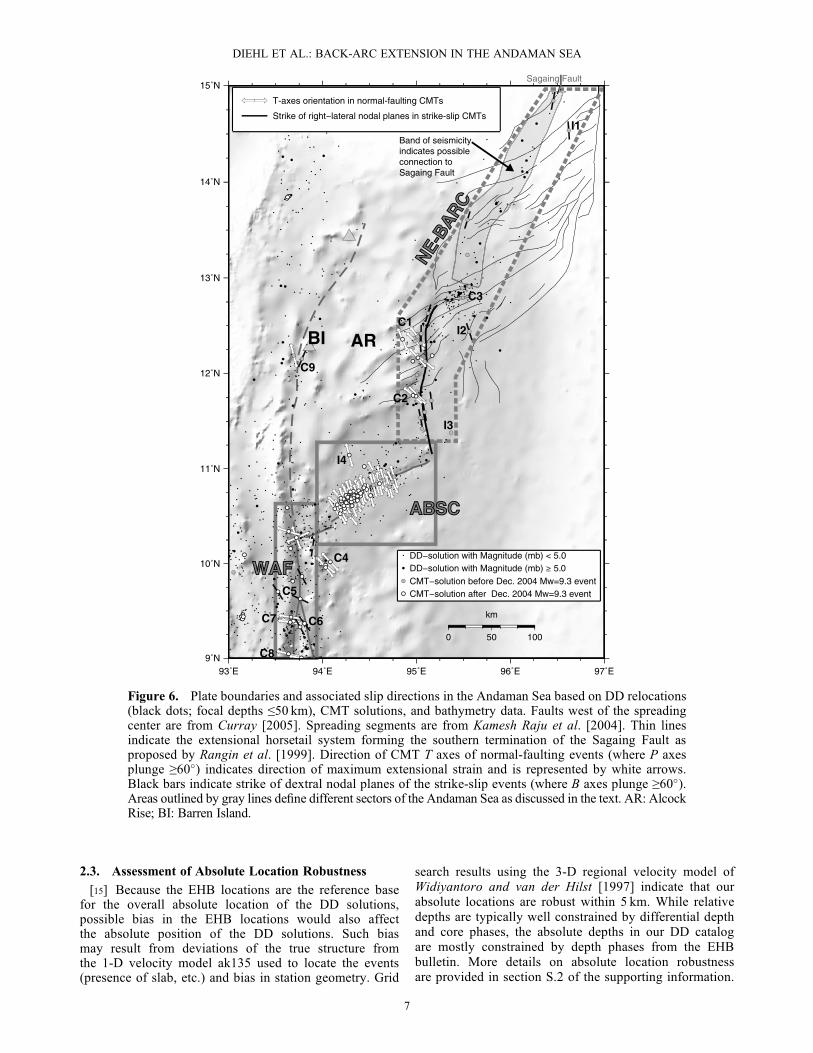
Figure 6. Plate boundaries and associated slip directions in the Andaman Sea based on DD relocations(black dots; focal depths !50 km), CMT solutions, and bathymetry data. Faults west of the spreadingcenter are from Curray [2005]. Spreading segments are from Kamesh Raju et al. [2004]. Thin linesindicate the extensional horsetail system forming the southern termination of the Sagaing Fault asproposed by Rangin et al. [1999]. Direction of CMT T axes of normal-faulting events (where P axesplunge "60!) indicates direction of maximum extensional strain and is represented by white arrows.Black bars indicate strike of dextral nodal planes of the strike-slip events (where B axes plunge "60!).Areas outlined by gray lines de!ne different sectors of the Andaman Sea as discussed in the text. AR: AlcockRise; BI: Barren Island.
DIEHL ET AL.: BACK-ARC EXTENSION IN THE ANDAMAN SEA
7
3. Seismic Structure and Kinematics of theAndaman Sea Plate Boundary
[16] The relocated seismicity and CMT solutions (Figures 5and 6) image a system of active normal and strike-slip faultsthat connect the right-lateral Sumatra, Seulimeum, and WestAndaman transform faults in the southwest with the SagaingFault in the northeast, forming the present eastern edge ofthe Burma Plate [Curray, 2005; Cochran, 2010] (Figure 1).The majority of earthquakes occur along the extensional plateboundary in the ABSC (Table 1), with intraplate earthquakes(such as I1–I4 in Figure 6) accounting for less than 2% ofthe total seismic moment in the back-arc region. CMT solu-tions along the fault system connecting the ABSC with theSagaing Fault in the northeastern back-arc (NE-BARC regionin Figure 6) are sparser but bigger (i.e., lower b-value) relativeto the ABSC (Figures S6 and S7, see section S.3 of thesupporting information for more details on the b-valueanalysis), and earthquakes cluster in both space and time asdemonstrated by clusters C1 and C2 (Figure 6 and Table 1).Earthquakes in clusters C1 and C2 locate east of the NStrending transform faults and sea"oor depression and showprimarily extensional failure along ~20 km long NE-SWstriking faults. These faults abut the NS striking transformfault and presumed plate boundary (Figures 4b and 6).
[17] Cluster C1 is formed by a sequence of extensionalevents (Mw= 4.8–5.8) (N1–N8, Figure 4b) that started inJuly 2007 and lasted for less than a year. The distribution ofmagnitudes with time in Figure S3 suggests a foreshock-mainshock-aftershock pattern, and the b-value of cluster C1 is closeto 1 (Figure S7). The sequence was preceded, by 1 year, by tworight-lateral, strike-slip earthquakes (Mw=5.1 and 5.3) thatruptured the adjacent transform fault within 1 h of each other(S1–S2, Figure 4b). The structure and kinematics of the seis-micity that forms cluster C2 are comparable to those of C1,suggesting a similar process ~60 km south of C1.[18] Another distinct earthquake cluster is revealed in the
northeastern part of the basin (C3, Figures 4d and 6). Theposition and orientation of this 35 km long cluster correlate witha NE-SW striking sea"oor depression, which is interpreted as ashort spreading axis by Curray [2005]. The majority of earth-quakes associated with C3 occurred within three sequences(December 1983, orange; January 1984, yellow; January2003, blue; Figure 4d) that occupy distinct areas. The 1983sequence initiated in the center of the bathymetric depressionand activated faults along the northern rim of the basin andbeyond to the northeast. The 1984 and 2003 sequences "ankedthe 1984 sequence at its SW and NE terminations. Thesequences in 1983 and 1984 have the character of earthquakeswarms, whereas the !rst sequence in January 2003 indicatesa main shock-aftershock pattern (Figure S4).
3.1. Spatiotemporal Characteristics ofABSC Seismicity[19] Three major swarms that occurred in 1984, 2006, and
2009, and two smaller ones in 1973 and 1993 dominate theseismicity along the ABSC (Figures 2, S1, and S2 andTable 2). CMT solutions are almost exclusively purenormal-faulting mechanisms with some variation in strikeand dip (Figures 5 and 6). The analysis of non-double-couple components of global CMT solutions, described indetail in section S.4 of the supporting information, identi!eda possible vertical compensated-linear-vector-dipole (CLVD)mechanism within the 1984 swarm (vPC1 in Figure 5).Figure 7a shows the high-resolution bathymetry data for theseismically active central part of the spreading ridge with DDlocations superimposed (dots color coded according to swarmoccurrence). Based on the bathymetry data and magneticanomalies, the ABSC is divided into three segments: A, B,and C (brown lines in Figure 7a) [Kamesh Raju et al., 2004].
Table 1. Distribution of Seismic Moment Release M0 FromGlobal CMT Solutions in the Andaman Sea (Figure 4–6)a
Sector Focal Mechanism # CMTs % of Total M0
WAF All 18 23SS 6 4NF 8 16OS 4 3
ABSC All 62 34NF 58 31OS 4 3
NE-BARC All 34 37SS 10 15NF 8 4OS 16 18
aThe total seismic momentM0 of all CMT solutions in the Andaman back-arcregion (Figure 5) is 1.269 $ 1026 dyne cm. Groups of focal mechanisms arede!ned in the caption of Figure 4 (SS: strike slip, NF: normal fault, OS: obliqueslip). Gray boxes in Figure 6 de!ne sectors of seismicity (NE-BARC sector isoutlined by dashed line). Clusters C4 and C9 outside of the three sectors(Figure 6) accommodate the remaining 6% of the total M0.
Table 2. Statistics of Major Earthquake Swarms in the Andaman Back-Arc Spreading Centera
StartOn Spreading
SegmentDuration of TotalActivity (Days)
Duration of MainActivity (Days)b
# Events in ISC/EDR+DD Location
# Events WithCMT+DD Location
Sum of CMT Moments(1026 dyne cm)
1973/07/26c
04:23A 1 1 6 0 -
1984/07/0520:46
C 40 7 80 12 0.117
1993/08/2318:53
A+B 10 2 21 0 -
2006/03/0914:45
B+C 23 3 137 24 0.168
2009/07/2606:45
B+C 3 3 52 24 0.104
Sum: 0.424
aSpreading segments are de!ned in Figure 7.bDuration of main activity is de!ned by consecutive days of "3 events per day.cDates are formatted as year/month/day.
DIEHL ET AL.: BACK-ARC EXTENSION IN THE ANDAMAN SEA
8
[20] The smallest swarm occurred in July 1973 (magenta dotsin Figure 7a) at the western end of segment A. It contains sixevents, and its duration was less than a day.[21] The swarm of July 1984 includes ~80 events (blue dots
in Figure 7a) and occupied approximately 40 km of the centralpart of the eastern spreading segment C. This segment ischaracterized by a deep and narrow rift valley. Althoughthick sediment makes it dif!cult to recognize magnetic
anomalies in the eastern part of ABSC, this segment isconsidered the oldest part of the ABSC [Kamesh Rajuet al., 2004]. The !rst recorded event (mb = 5.0) of theswarm occurred about 15 km north of the ridge axis and wasimmediately followed by two bigger events (mb=5.4 and5.3) located in the rift valley. About 48 h later, the mainactivity started in the rift valley and propagated from the centerof segment C southwestward along the ridge (Figure 8). The
94˚E 94.25˚E 94.5˚E 94.75˚E
10.25˚N
10.5˚N
10.75˚N
11˚N
(b)
(a)
Figure 7. (a) Map with DD locations (dots) in the Andaman Back-Arc Spreading Center (see black box inFigure 5). Gray: background seismicity; magenta: seismicity in 1973; blue: seismicity in 1984; green: 1993;yellow: 2006; red: 2009. Gray ellipses indicate 90% con!dence interval for relative locations derived frombootstrap analysis. Bars correspond to surface projections of B axes of global CMT solutions of normal-faulting events; gray arrows correspond to surface projections of the CMT slip vector (preferred fault plane);Beach-ball symbols indicate composite moment tensors of individual swarms and all CMT solutions. High-resolution bathymetry (grid of 100m) is from Kamesh Raju et al. [2004]. Ridge segments A–C [Kamesh Rajuet al., 2004] are indicated by brown lines. D–D0 shows location of depth pro!le in Figure 7b for events includedin box. (b) Depth cross-section along pro!le D–D0. Circles and dots are hypocenters using the same colorscheme as in Figure 7a. Error bars indicate the 90% con!dence interval of relative depth derived from bootstrapanalysis. Global CMT solutions are shown as projections to the depth pro!le. Note vertical exaggeration ofbathymetry cross-section. FS: Fault Scarp; NVZ: Neovolcanic Zone.
DIEHL ET AL.: BACK-ARC EXTENSION IN THE ANDAMAN SEA
9
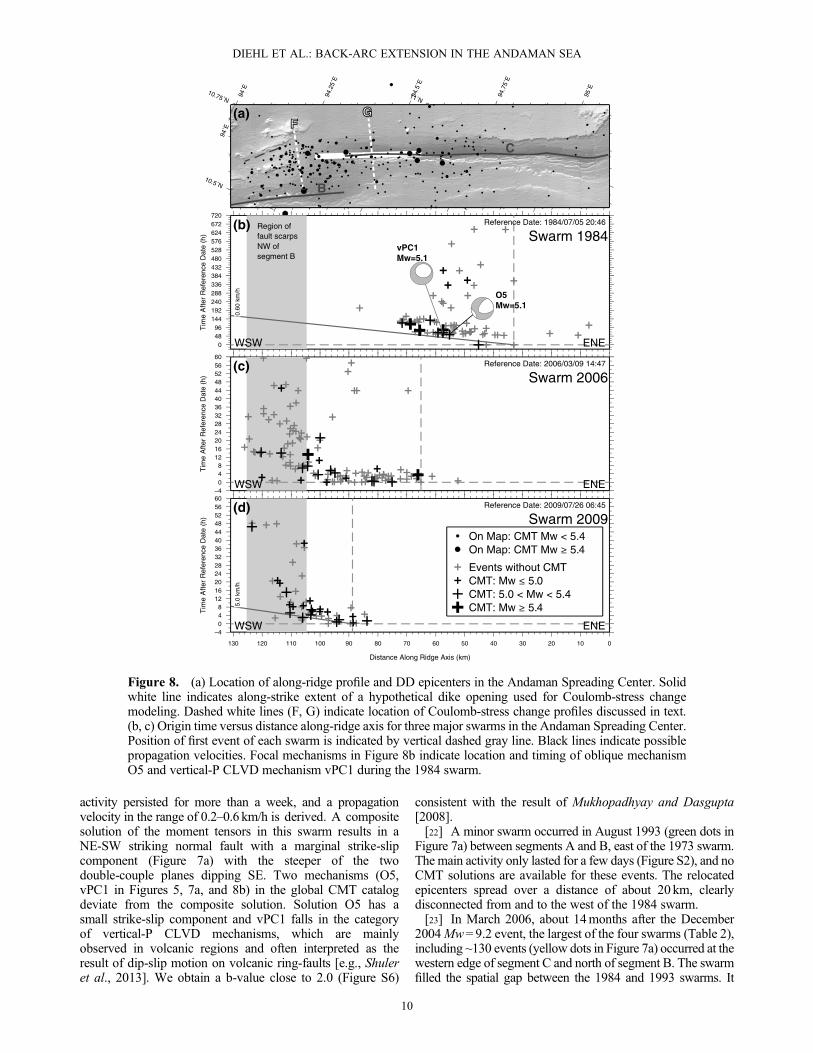
activity persisted for more than a week, and a propagationvelocity in the range of 0.2–0.6 km/h is derived. A compositesolution of the moment tensors in this swarm results in aNE-SW striking normal fault with a marginal strike-slipcomponent (Figure 7a) with the steeper of the twodouble-couple planes dipping SE. Two mechanisms (O5,vPC1 in Figures 5, 7a, and 8b) in the global CMT catalogdeviate from the composite solution. Solution O5 has asmall strike-slip component and vPC1 falls in the categoryof vertical-P CLVD mechanisms, which are mainlyobserved in volcanic regions and often interpreted as theresult of dip-slip motion on volcanic ring-faults [e.g., Shuleret al., 2013]. We obtain a b-value close to 2.0 (Figure S6)
consistent with the result of Mukhopadhyay and Dasgupta[2008].[22] A minor swarm occurred in August 1993 (green dots in
Figure 7a) between segments A and B, east of the 1973 swarm.The main activity only lasted for a few days (Figure S2), and noCMT solutions are available for these events. The relocatedepicenters spread over a distance of about 20 km, clearlydisconnected from and to the west of the 1984 swarm.[23] In March 2006, about 14months after the December
2004Mw=9.2 event, the largest of the four swarms (Table 2),including ~130 events (yellow dots in Figure 7a) occurred at thewestern edge of segment C and north of segment B. The swarm!lled the spatial gap between the 1984 and 1993 swarms. It
(a)
(b)
(c)
(d)
Figure 8. (a) Location of along-ridge pro!le and DD epicenters in the Andaman Spreading Center. Solidwhite line indicates along-strike extent of a hypothetical dike opening used for Coulomb-stress changemodeling. Dashed white lines (F, G) indicate location of Coulomb-stress change pro!les discussed in text.(b, c) Origin time versus distance along-ridge axis for three major swarms in the Andaman Spreading Center.Position of !rst event of each swarm is indicated by vertical dashed gray line. Black lines indicate possiblepropagation velocities. Focal mechanisms in Figure 8b indicate location and timing of oblique mechanismO5 and vertical-P CLVD mechanism vPC1 during the 1984 swarm.
DIEHL ET AL.: BACK-ARC EXTENSION IN THE ANDAMAN SEA
10
initiated approximately at the WSW end of the 1984 swarm onridge segment C and propagated southwestward along theridge, similar to the 1984 swarm but at much higher speed.Within 2 h, the swarm events covered a distance of about50 km along the ridge (Figure 8). After about 8 h, seismicactivity ceased in the rift valley of segment C. At the same time,intense activity started off-axis north of segment B and lastedfor about 2 days before gradually decaying over the following20 days. The sea"oor morphology in that area shows SW-NEoriented lineaments and suggests fault scarps related toSE-dipping planes (Figure 7b). The composite momenttensor of this swarm corresponds to a NE-SW striking, purenormal fault with the shallower of the two double-coupleplanes dipping SE. The b-value of the 2006 swarm derivedfrommb reported in the ISC catalog is close to 2.0 (Figure S6).[24] The 2009 swarm, while smaller (~50 events, Figure 7a),
is similar to the 2006 swarm in many aspects. The affected areaand spatiotemporal evolution of the activity is similar to the2006 swarm, and the composite moment tensor is almostidentical with the solution derived from the 2006 earthquakes.The strike of CMT B axes (indicated by thick lines inFigure 7a) for several events in the 2006 and 2009 swarm alignremarkably well with the strike of the fault scarps seen in thebathymetry data north of segment B. Hypocenters plotted in avertical cross-section normal to the strike of these fault scarpsreveal at least two active faults that dip ~30! to the SE, consis-tent with the SE-dipping double-couple planes (Figure 7b). Theintersection of the projection of the shallower of the two faultswith the sea"oor coincides with fault scarps seen in thebathymetry data. The b-value of the 2009 swarm derived frommb reported in the ISC catalog is close to 2.0 (Figure S6).
4. Discussion
4.1. Mode of Extension in the Andaman Sea[25] While formation of trench-parallel back-arc basins
is commonly associated with trench rollback, the obliqueopening of the Andaman Sea (Figure 1) results from thecombination of two extensional components. Curray [2005]decomposed the average spreading rates in the ABSC into anorthward component (2.7 cm/yr) and a westward component(1.2 cm/yr). The dominant northward component compareswell with slip rates observed along the Sumatra fault [Curray,2005], and its driving force seems to be the northwarddragging of the Burma sliver plate by the trench-parallelcomponent of convergence. Slip rates along the northern portionof the Sumatra fault are on the order of 2.7–2.5 cm/yr [Siehand Natawidjaja, 2000; Genrich et al., 2000]. Present-daygeodetic slip rates along the Sagaing Fault in Myanmar areon the order of 1.8 cm/yr [Vigny et al., 2003; Maurin et al.,2010] and therefore smaller than the average long-termnorthward component of the spreading rate. This differencein slip rate can be explained by the partitioning of motionbetween the India-Burma and Burma-Sunda plates, and theslip rates predicted by such a model agree to a !rst order withthe observed rates [Gahalaut andGahalaut, 2007]. Northwardmotion might also be partially absorbed by diffuse faultsystems such as the extensional horsetail structure proposed byRangin et al. [1999] (Figures 1, 5, and 6). The smaller westwardcomponent of the spreading rate (1.2 cm/yr) likely results fromrollback, modulated by recurrent stresses due to coseismicslip and afterslip on the plate interface.
[26] The West Andaman fault (WAF) system southeast ofthe ABSC seems to accommodate both dextral and westwardextensional motion (Figure 6), and the partitioning appears tobe correlated in time with coseismic slip and afterslip of theMw=9.2 Sumatra-Andaman earthquake of December 2004.Extensional mechanisms along the WAF system between9.0!N and 10.5!N occur almost exclusively in the months afterthe 2004 earthquake (Figure 6) and correlate in space with apeak in coseismic and postseismic deformation and momentrelease [Chlieh et al., 2007]. This change from dextral towardextensional regime of theWAF systemwas already noticed byothers [e.g., Engdahl et al., 2007; Cattin et al., 2009];however, whether or not extensional and strike-slip motionis partitioned on the same fault (e.g., the WAF) cannot beanswered conclusively. Based on bathymetry and re"ectionseismic pro!les [Curray, 2005; Kamesh Raju et al., 2007;Cochran, 2010], the WAF is expected to dip steeply towardthe east. In fact, fault planes associated with dextral slip (suchas C5 and C6 in Figure 6) show dip angles of 80! to 90!. Faultplanes associated with eastward dipping normal faults (such asC7 and C8 in Figure 6), however, have shallower dip angles of50! to 60!. The difference in fault dip suggests that theextensional strain might be accommodated on splay structuresof the master strike-slip fault.[27] The inferred plate boundary connecting the ABSC
with the Sagaing Fault consists of a right-lateral transformwith prominent extensional bends (solid black line withindashed region in Figure 6). The contribution to overallback-arc extension, as indicated by the distribution ofextensional CMT solutions and seismic moment (Table 1and Figure 6), seems minor. A large fraction of the seismicmoment release in this region is accommodated byoblique-slip mechanisms (Table 1) suggesting the presenceof young structures, where strain partitioning is not yetdeveloped. Normal-fault earthquakes, as observed in clustersC1 and C2 (Figures 4b and 6), accommodate additional ex-tension at the eastern edge of the Alcock Rise on NE-SWstriking faults [see also Rangin et al., 1999; Curray, 2005].These faults consistently locate west of the inferred plateboundary that hosts the strike-slip events (Figures 4b and6). The spatiotemporal evolution of these earthquakes andthe fact that the normal-faulting events closest to thetransform fault have a signi!cant strike-slip component(Figure 4b) suggest that the extensional events accommodateadditional bending-related residual stresses from slip on theeast veering transform plate boundary in that region. TheNW-SE orientation of T axes of the extensional earthquakesN2–N8 in Figure 4b agrees with the T axes orientationobserved for the two nearby strike-slip events S1–S2 andis similar to the general trend of the ABSC (Figure 6).[28] Sea"oor morphology and the orientation of relocated
seismicity in combination with the strike of right-lateral faultplanes such as S1–S3 suggest that the inferred transform fault(solid black line within dashed region in Figure 6) links theABSC with the short spreading segment of cluster C3(Figures 4b, 5, and 6). Earthquake swarms in 1983 and 1984in cluster C3 are indicative of active spreading processesinvolved in the formation of this basin. Three available momenttensor solutions (O1–O3, Figure 4d), however, indicate obliqueslip. Oblique slip likely contributes to the basin developmentsimilar to transtensional mechanisms proposed for basinformation in the Marmara Sea [Seeber et al., 2006].
DIEHL ET AL.: BACK-ARC EXTENSION IN THE ANDAMAN SEA
11
[29] Seismicity is more diffuse between the short spreadingsegment of cluster C3 and the Sagaing Fault (Figures 5 and 6),and no clear connection between both structures is resolved.Chamot-Rooke et al. [2001] proposed an eastward connectionof the short spreading segment of cluster C3 to a series ofgrabens, forming the horsetail termination of the Sagaing Faultsystem (Figures 5 and 6). The strike of right-lateral fault planessuch as of O2–O4 and S4 (Figure 5), however, deviates signif-icantly from the general WSW-ENE strike of the proposedhorsetail system. Well-constrained hypocenters in the EHBcatalog report focal depths in the range of 14–25 km for theseevents (Figure 5), which places them in the lower part of thecrust. Relocated seismicity is concentrated along a band inthe western end of the horsetail system (Figure 6). Therefore,we cannot rule out a possible connection to the Sagaing Faultby a system of faults in the underlying basement (outlined bygray shaded area in Figure 6).[30] The distribution of extensional CMT solutions
and seismic moment in the Andaman Sea suggests thatback-arc extension occurs primarily in the ABSC (Table 1and Figure 6). To quantify the direction and the amount ofextension accommodated by seismic slip on normal faultsin the ABSC, we calculated the short-term spreading rateby following the calculations of Guzmán-Speziale and Ni[1993] with modi!ed model assumptions and updated globalCMT solutions. The direction of maximum extensive strainis de!ned by the eigenvector e1 associated with the largesteigenvalue l1 of the summed moment tensor Ms of allnormal-faulting events at the ridge. The spreading rate vcan be derived from the following:
v % 12mtLh
l1; (1)
with t being the time interval, m the shear modulus(3 $ 1010N/m2), L the length of the ridge, h the maximumdepth of the seismogenic layer, and l1 the largest eigenvalueof Ms. We assume that recent and current extension corre-lates with normal-fault earthquakes along segments C andB of the ABSC, and L is about 84 km (Figure 7a). Thecross-section in Figure 7b suggests a seismogenic layer ofabout 18 km; however, these events are off-axis and repre-sent reactivation of existing faults. Instead, we use aseismogenic layer h of 10 km, a value commonly assumedto be the maximum focal depth at mid-ocean rifts [Huangand Solomon, 1988]. Because the actual depth of theseismogenic layer lies somewhere between 10 and 18 km,the spreading rate derived from equation (1) with h = 10 kmshould only be considered as an upper bound rather than abest estimate. We sum up all CMT solutions with P axesplunging "60! (normal-faulting type). We !nd 57 of theseevents between 1984 and 2009 (t = 26 years). The largesteigenvalue l1 of Ms is 3.301 $ 1018Nm. The direction ofmaximum extensive strain de!ned by eigenvector e1 isN22!W, which is close to the value of N19!W found byGuzmán-Speziale and Ni [1993]. It also compares well tothe long-term spreading direction of N25!W derived byCurray [2005] from reconstruction of the ABSC over thepast 4Myr. Using equation (1), the maximum bound onthe tectonic contribution to the spreading rate v of our modelis about 0.25 cm/yr, which is about 5 times higher than whatGuzmán-Speziale and Ni [1993] obtained (0.05 cm/yr), but
more than one order of magnitude smaller than the long-term opening rate of 3.0–3.8 cm/yr [Kamesh Raju et al.,2004; Curray 2005]. Since the 1984 and 2009 swarms bracketthe observation period, t might also be underestimated. Thus,seismic slip on normal faults accounts at most for 7–8% of thelong-term opening rate. Similar to Guzmán-Speziale and Ni[1993] and Solomon et al. [1988], we interpret the de!cit inseismically accommodated extension as indication foraseismic processes. The de!cit in seismic moment and themorphology of the ABSC supports an active spreadingsystem, where extension (driven by far !eld forces) is largelyaccommodated by intrusion of new crust along the centralneovolcanic zone. The proposed formation of new crust is fur-ther supported by magnetic anomalies from shipboard surveys[Kamesh Raju et al., 2004] and satellite data (Figure S9).Recent industry seismic re"ection data image many sillsbelow the basement, also indicative for ongoing diking andintrusion processes [Singh et al., 2010]. The thick sedimentarycover of the northeastern ridge segment likely acts as a blanketfor volcanic eruptions and hydrothermal circulation,suggesting an accretionary process different from typicaloceanic spreading [Singh et al., 2010].
4.2. Structure and Fault Geometry of the ABSC[31] Similar to slow-spreading ridges in the Mid-Atlantic,
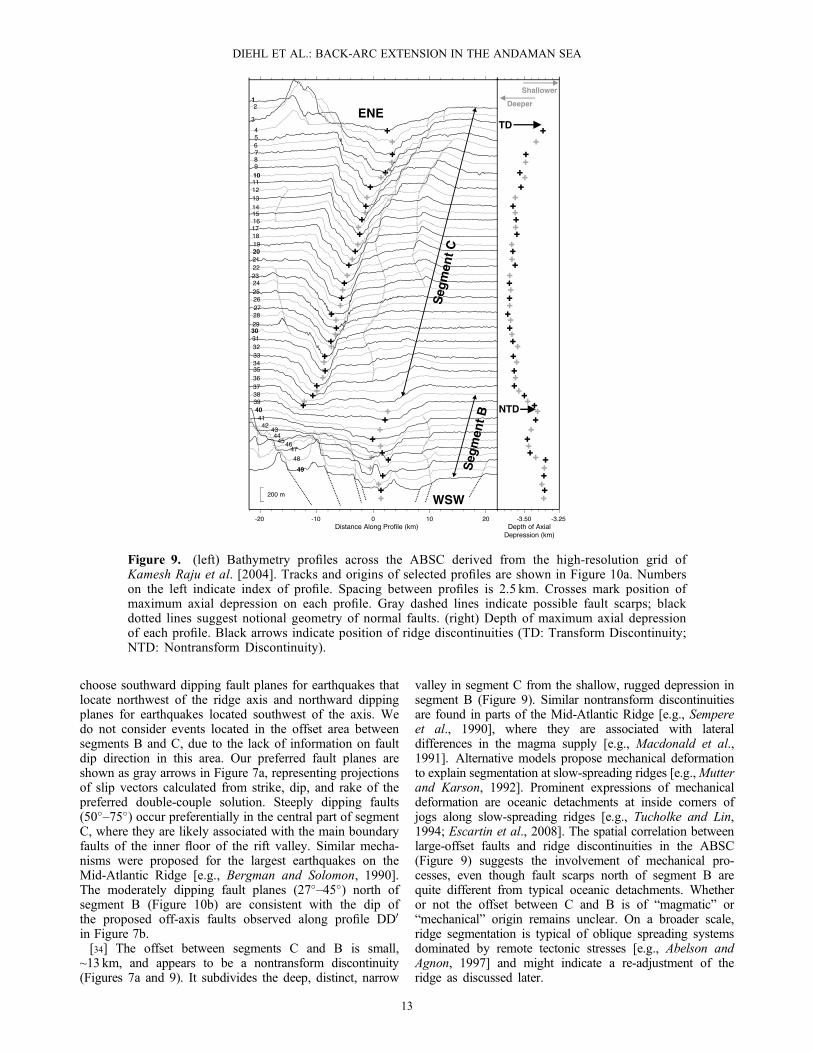
the morphology of the ABSC is characterized by a distinctrift valley bounded by a series of scarps and stepliketerraces, which are apparent in the high-resolution bathyme-try maps on either side of the rift (Figures 7a and 8) and incross-axis bathymetry pro!les (Figure 9). We interpret thesefault scarps as expressions of inward facing normal faults.These faults are indicative of tectonic extension processes(including faulting, uplifting, and tilting of blocks) andmay contribute signi!cantly to the formation of theaxial depression of slow-spreading ridges [e.g., Mutter andKarson, 1992]. Fault scarps in the inside corners ofsegments B and C appear to have larger throws than else-where along the ABSC (Figure 9).[32] The role of inward facing normal faults in the archi-
tecture of the rift valley is con!rmed by two single-channelseismic re"ection pro!les, penetrating the !rst few kilome-ters of the crust [Kamesh Raju et al., 2004, Figure 10]. Apro!le across segment C (close to pro!le 20 of Figures 9and 10a), suggests a full graben structure. It images inwardfacing normal faults with corresponding fault scarps in thebathymetric cross-section of pro!les 20 and 21 (Figure 9).A second seismic pro!le close to DD0 of Figure 7b acrosssegment B indicates inward facing normal faults southeastof the rift valley. To the northwest, Kamesh Raju et al.[2004] interpret near sea"oor re"ections as shallow base-ment; however, faults are not resolved in this part of theseismic image.[33] Seismicity along pro!le DD0 suggests moderately
dipping faults north of segment B (Figure 7b). In contrast,seismicity pro!les across segment C provide no constrainton fault dip. Insuf!cient depth resolution of hypocentersdue to fewer and lower quality data in 1984 may be a factor,in addition to possible along-strike discontinuities betweenfaults. Information on fault dips across segment C is derivedfrom CMT double-couple solutions. The preferred faultplanes are inward facing, following observations from thetwo seismic pro!les and the seismicity pro!le DD0. We
DIEHL ET AL.: BACK-ARC EXTENSION IN THE ANDAMAN SEA
12
choose southward dipping fault planes for earthquakes thatlocate northwest of the ridge axis and northward dippingplanes for earthquakes located southwest of the axis. Wedo not consider events located in the offset area betweensegments B and C, due to the lack of information on faultdip direction in this area. Our preferred fault planes areshown as gray arrows in Figure 7a, representing projectionsof slip vectors calculated from strike, dip, and rake of thepreferred double-couple solution. Steeply dipping faults(50!–75!) occur preferentially in the central part of segmentC, where they are likely associated with the main boundaryfaults of the inner "oor of the rift valley. Similar mecha-nisms were proposed for the largest earthquakes on theMid-Atlantic Ridge [e.g., Bergman and Solomon, 1990].The moderately dipping fault planes (27!–45!) north ofsegment B (Figure 10b) are consistent with the dip ofthe proposed off-axis faults observed along pro!le DD0
in Figure 7b.[34] The offset between segments C and B is small,
~13 km, and appears to be a nontransform discontinuity(Figures 7a and 9). It subdivides the deep, distinct, narrow
valley in segment C from the shallow, rugged depression insegment B (Figure 9). Similar nontransform discontinuitiesare found in parts of the Mid-Atlantic Ridge [e.g., Sempereet al., 1990], where they are associated with lateraldifferences in the magma supply [e.g., Macdonald et al.,1991]. Alternative models propose mechanical deformationto explain segmentation at slow-spreading ridges [e.g.,Mutterand Karson, 1992]. Prominent expressions of mechanicaldeformation are oceanic detachments at inside corners ofjogs along slow-spreading ridges [e.g., Tucholke and Lin,1994; Escartin et al., 2008]. The spatial correlation betweenlarge-offset faults and ridge discontinuities in the ABSC(Figure 9) suggests the involvement of mechanical pro-cesses, even though fault scarps north of segment B arequite different from typical oceanic detachments. Whetheror not the offset between C and B is of “magmatic” or“mechanical” origin remains unclear. On a broader scale,ridge segmentation is typical of oblique spreading systemsdominated by remote tectonic stresses [e.g., Abelson andAgnon, 1997] and might indicate a re-adjustment of theridge as discussed later.
Figure 9. (left) Bathymetry pro!les across the ABSC derived from the high-resolution grid ofKamesh Raju et al. [2004]. Tracks and origins of selected pro!les are shown in Figure 10a. Numberson the left indicate index of pro!le. Spacing between pro!les is 2.5 km. Crosses mark position ofmaximum axial depression on each pro!le. Gray dashed lines indicate possible fault scarps; blackdotted lines suggest notional geometry of normal faults. (right) Depth of maximum axial depressionof each pro!le. Black arrows indicate position of ridge discontinuities (TD: Transform Discontinuity;NTD: Nontransform Discontinuity).
DIEHL ET AL.: BACK-ARC EXTENSION IN THE ANDAMAN SEA
13
[35] The ABSC displays many of the key features of mid-ocean ridges, yet some differences are noteworthy. In con-trast to mid-ocean ridges, the transform and nontransformdiscontinuities at the ends of segment C coincide with min-imum axial depths. Also, segment C does not exhibit thetypical axial high (Figure 9), but thick sediment masks base-ment morphology along this segment. The ABSC is unusualamong spreading ridges in being surrounded by sedimentsources and thus receiving not only high but also spatiallyvariable sedimentation. Changes in sediment cover accountsfor some of the differences in sea "oor morphology alongthe ABSC [Kamesh Raju et al., 2004; Curray, 2005; Singhet al., 2010] but may also account for structural differences.In models proposed for rifting in the Gulf of California,
deposition of sediments promotes narrow rifting [Lizarraldeet al., 2007; Bialas and Buck, 2009]. Accordingly, the thicksediment cover deposited by turbidity currents that arereaching segment C, but not B, may have led to the observedalong-axis difference in the extensional styles betweenthese segments.
4.3. Kinematics of the ABSC[36] Although some earthquakes in the 1984 sequence are
off-axis, the main activity within this swarm concentrates be-neath the rift valley on steeply dipping faults (Figures 7a and10b). The seismic activity propagates over 40 km along therift from ENE to WSW (Figure 8b) with a velocity of about0.6 km/h, comparable to propagation velocities observed in
(b)
(c)
(d)
(a)
Figure 10. (a) Location of along-ridge pro!le, DD epicenters, preferred fault planes, and tracks ofbathymetry pro!les shown in Figure 9. (b–d) Dip, strike, and rake of preferred fault planes along the ridgeaxis. CMT solutions for which a preferred fault plane has been determined are indicated by black bold dotsand squares (dots: preferred fault plane dipping to SE; squares: preferred fault plane dipping to NW).White square indicates vertical-P CLVD mechanisms vPC1. For CMT solutions without preferred plane(gray dots), azimuths of B axes are shown in Figure 10c. Dash-dotted line in Figure 10c indicates directionof maximum extensional strain plus 90! as derived from composite CMT solutions along segment C. Rosediagram in Figure 10c shows orientation of fault strike or B axis of CMT solutions along segment C.
DIEHL ET AL.: BACK-ARC EXTENSION IN THE ANDAMAN SEA
14
other rift systems (Iceland: 1.8 km/h [e.g., Einarsson andBrandsdottir, 1980]; Afar: 1.1 km/h [e.g., Ayele et al.,2009]). Swarms associated with sea"oor spreading eventsalong the Juan de Fuca and Gorda ridge in the Eastern Paci!cshow very similar migration rates of 0.2 to 2.0 km/h [Dziaket al., 2007]. Magmatic processes are predicted by the de!citin seismic moment, high b-values, the presence of sea"oorspreading magnetic anomalies [Kamesh Raju et al., 2004],and seismic re"ection data of Singh et al. [2010]. Therefore,we interpret the 1984 swarm as expression of a dike intrusionpropagating laterally toward WSW. The occurrence of exclu-sively normal-faulting events on the main boundary faults ofthe inner rift "oor is consistent with volcanic-spreading eventson mid-ocean ridges [e.g., Tolstoy et al., 2001] and can beaccounted for by the tensile stress !eld that forms above thepropagating dike [Rubin, 1992]. The location of the vertical-P CLVDmechanisms vPC1 in the 1984 swarm coincides withthe oblique mechanism O5 (Figure 7a). Event O5 occurred on8 July (05:26) followed by event vPC1 about 11 h later(Figure 8b). As proposed by Ekström [1994], such vertical-CLVD mechanism can be explained by dip-slip motion onvolcanic ring-faults. Shuler et al. [2013] found a strong corre-lation between the occurrence of vertical-CLVD mechanismsand volcanic unrest, where vertical-P mechanisms generallyoccur after eruptions. The location and timing of event O5and vPC1 might therefore be indicative for volcanic processessuch as de"ating or collapse of a magma chamber in the centerof segment C during the swarm.[37] In contrast to the 1984 sequence, earthquakes within
the 2006 swarm occurred nearly concurrently (within 2 h) overmore than 50 km across the western part of segment C beneaththe rift valley, followed by an increased seismic activity in thefault scarp region north of segment B (Figure 8). If there werea propagation, it would have velocities >20 km/h, muchhigher than known lateral dike propagation velocities. Theinstantaneous occurrence of earthquakes is better explainedas the consequence of near-simultaneous injections verticallyfrom an axial magma lens, as proposed by Dziak et al.[2009]. Studies by Cattin et al. [2009] and Sevilgen et al.[2012] suggest that a critical stress regime may have built upin the back-arc due to the December 2004 Mw=9.2 earth-quake. Stress calculations show that the megathrust ruptureincreased the Coulomb stress on normal faults within theABSC region. The Coulomb-stress increase in the ABSCderived by Cattin et al. [2009] and Sevilgen et al. [2012],however, is very small (about 0.2–0.3 bar) and does notexplain the lag of 14months between the 2004 rupture andthe 2006 swarm.[38] In order to compare the amplitudes of the post-2004
regional stress change to local stresses resulting from a dikeintrusion, we modeled the Coulomb-stress change due to ahypothetical tensile dike opening at the location of the2006 earthquake swarm using the COULOMB softwarepackage [Stein, 1999]. The modeled dike assumes a typicalopening of 1m and a height of 1.5 km [e.g., Buck et al.,2006; Dziak et al., 2009]. The along-strike extent of themodeled dike beneath segment C is derived from the distri-bution of hypocenters within the !rst 4 h of the 2006 swarm,and it is shown as a solid white line in Figure 8a. Its verticalposition is based on seismic re"ection pro!les [Singh et al.,2010] and ranges from 4.0 km to 5.5 km depth (fromseabed). The average positive Coulomb-stress change on
axial normal faults (receiver fault: strike = 73!, dip = 58!,rake =#92!) above (and below) the opening dike at pro!leG in Figure 8a (depth range 0–20 km) is 3.6 bar. This valuesigni!cantly exceeds possible coseismic stress perturbationsthat may have originated from the December 2004 rupture inthe ABSC. Dike opening also leads to positive Coulomb-stress changes on the proposed moderately dipping normalfaults (receiver fault: strike = 63!, dip = 36!, rake =#96!) inthe off-axis region. The average positive Coulomb-stresschange at the location of pro!le F in Figure 8a (depth range0–20 km) is 0.4 bar, comparable to coseismic stress perturba-tions predicted by Cattin et al. [2009] and Sevilgen et al.[2012] for the December 2004 Mw= 9.2 earthquake.As shown in section S.6 of the supporting information, theoverall results are rather independent of the details of thechosen dike geometry.[39] Based on the above, we argue that the primary driver
for the 2006 swarm was a magmatic intrusion, probably ver-tically injected from an axial magma lens beneath the WSWpart of segment C. Earthquakes on moderately dipping off-axis faults may have been triggered by stress changes fromthe magmatic intrusion as well as from the primarysequences of earthquakes on axial faults in the rift valleyalong segment C. Similarities in location, b-values and thespatiotemporal behavior of seismicity suggest a similarmechanism for the 2009 swarm, although the propagationvelocity in the 2009 swarm (on the order of a few kilometersper hour) appears lower than in the 2006 sequence andsomewhat closer to values typically associated with lateraldike intrusion. Aseismic opening of the Andaman Sea at arate of 3.8 cm/yr would require dike injections about every25 years (assuming a typical dike thickness of ~1m), whichis roughly consistent with the period between the 1984 andthe 2006/2009 swarms. No additional swarm was identi!edin the ISC catalog between 1964 and 1984 along segmentC. Differences in the apparent migration rates of the threeswarms, however, seem to hint that properties of injectionssuch as dike width might not be uniform and that there isnot a simple horizontal propagation but a combination ofhorizontal propagation and vertical injections. The westwardpropagation of dike intrusions and the potentially vertical in-jection during the 2006 event also implies the existence ofseveral magma lenses beneath segment C, rather than onemagma supply in the center of the segment. The WSW prop-agation of the swarms as well as the seismic activity withineach swarm, on the other hand, suggest an “unzipping” ofsegment C from ENE to WSW, consistent with the proposedlong-term westward propagation of the spreading center[Kamesh Raju et al., 2004]. Whether or not the 2006/2009intrusion events have been triggered by the 2004 Mw= 9.2Sumatra-Andaman earthquake remains unclear. Volumetricexpansion in the back-arc region due to the megathrustearthquake as proposed by Walter and Amelung [2007] incombination with "uid-diffusion processes might be mecha-nisms to explain the delay of 14months.
4.4. Strain Partitioning in a Non-orthogonalRidge-Transform System[40] The net long-term spreading direction in the ABSC is
about N25!W [Curray, 2005] and therefore nearly normal tothe general trend of the ridge but oblique to the adjacent
DIEHL ET AL.: BACK-ARC EXTENSION IN THE ANDAMAN SEA
15
transforms, as illustrated by the conceptual end-membermodel displayed in Figure 11a. To study how and to whichdegree strain is partitioned within such a non-orthogonalsystem, we begin with a detailed analysis of nodal planesand slip vectors from global CMT solutions in the ABSC.In Figures 10c and 10d, we plot strike and rake of the pre-ferred (inward dipping) double-couple nodal planes withrespect to their position along the ridge. For solutions with-out preferred planes (events in the overlapping zone betweensegments C and B), we plot the directions of B axes insteadof fault strike (gray dots in Figure 10c).[41] Nodal planes along segment C suggest clockwise
misalignment with respect to the ridge axis (shown as solidline in Figure 10c), with deviations up to 25!. The medianstrike of preferred planes and directions of B axes along seg-ment C is 73!, which corresponds to a deviation of 8! fromridge parallel as shown by the rose diagram in Figure 10c.The direction of the principal tensile strain derived from thecomposite moment tensor of CMT solutions along segmentC (shown as dash-dotted line in Figure 10c) indicates a similarclockwise deviation of about 6! from ridge normal.[42] To the WSW, fault strike of earthquakes in the fault
scarp region and along segment B appear to align with thestrike of segment B (median strike of preferred planesbetween 106 and 130 km in Figure 10c is 60!), and theinferred tension direction is close to normal to the ridge axis(Figures 6, 7a, and 10c). Two solutions, however, are anti-clockwise misaligned. No CMT solutions are available forearthquakes located at spreading segment A.[43] The rakes of preferred nodal planes distribute around
#90! (Figure 10d) indicating pure dip-slip normal faulting.A systematic shift toward minor dextral components of slipvectors is apparent in the fault scarp region (rake about#105!). Few individual solutions along the ridge indicatelarger deviation from pure dip-slip mechanisms (rake ofabout #120! and #60!, respectively).[44] The conceptual model of Figure 11a agrees well with
the general characteristics of the ABSC. However, while the
spreading direction (SD in Figure 11) is perfectly normal tothe strike of segment C, it is slightly oblique to segments A, B,and the general trend of the ridge axis (Figure 11b). The anglebetween the spreading direction and the normal to the generaltrend of the ridge axis is only about 6!, much smaller thanvalues typically considered as oblique spreading [e.g.,Abelsonand Agnon, 1997]. Thus, we conclude that dip-slip normalfaulting and the N22!W direction of maximum extensivestrain of the cumulative CMT solution along the ridge areconsistent with ridge-normal spreading. The N-S orientedtroughs on either end of the ABSC (Figures 5 and 6) mightbe expressions of the “leaky” character of the adjacent trans-forms, due to westward extension across the strike-slip faults[e.g., Menard and Atwater, 1968; Thompson and Melson,1972; Taylor et al., 1994].[45] As illustrated in Figure 11b, the ridge is fragmented
into three discordant segments obliquely oriented to its gen-eral trend. Such (second order) ridge segmentation is pre-dicted by the crack model of Abelson and Agnon [1997]for oblique spreading systems dominated by remote tectonicstresses. The possible clockwise deviation of fault strike(SC) from the maximum extensive strain (TC) and thespreading direction (SD) along segment C (Figures 10cand 11b) suggest that the horizontal principal compressivestress axes (SH> Sh) are oblique to both the spreading direc-tion and the trend of the ridge, consistent with the“transtensional” model of Tuckwell et al. [1996]. In theirmodel, extensional fractures and normal faults form normalto the minimum principal compressive stress Sh but obliqueto ridge and plate vector. The extensional faults and dikesmay form en-echelon arrays along the ridge axis. Thus, theobserved misalignment of our nodal planes might indicatea similar en-echelon arrangement of dikes along segmentC. But the observed 8! deviation of the median fault strikefrom ridge parallel along segment C might not beresolvable. Differences of 5–7! between moment tensorscan be introduced by approximations in the modeling[e.g., Hjörleifsdóttir and Ekström, 2010], and studiescomparing source parameters of different catalogs reportuncertainties of 5–7! in moment tensors for the bestCMT solutions [Kagan, 2003]. Based on a similar study,Helffrich [1997] concluded that the slip-vector uncer-tainty of a typical shallow earthquake is 14!. It isunlikely, however, that uncertainties in the moment ten-sor or slip vector are solely assigned to the fault strikecomponent. The rather good agreement between faultstrike and ridge orientation along segment B suggests thatthe observed misalignment along C is consistent with theoverall discordant orientation of ridge segments B and C.[46] Whether or not such non-orthogonal ridge-transform
systems represent stable con!gurations over time oradjust toward orthogonal geometries remains controversial[e.g., Lachenbruch and Thompson, 1972; Lachenbruch,1976; Atwater and Macdonald, 1977; Tanaka and Fujii,1991]. In the Andaman Sea, structures are in place to lockgeometry and direction of spreading. For instance, the positionand geometry of transforms in the ABSC-system seem to becontrolled by plateaus like the Alcock Rise, where the plateboundary follows the shape of its eastern edge (Figure 6).The initial NE-SW orientation of the spreading ridge is prob-ably re"ecting preexisting structures within these plateaus,similar to normal faults imaged by clusters C1 and C2. The
(a) Conceptual Model:Spreading normal toridge & transformsoblique to ridge:
Figure 11. (a) Conceptual end-member model of non-orthogonal ridge-transform geometry. SD: long-term spread-ing direction [Curray, 2005]. Trend of ridge and transformfaults are based on the ABSC geometry. (b) Summary of theridge geometry of the ABSC. TC: direction of compositetension axis of CMT solutions at segment C; SC: medianstrike of nodal planes at segment C (inset Figure 10c).
DIEHL ET AL.: BACK-ARC EXTENSION IN THE ANDAMAN SEA
16
clockwise deviation of ridge segments A and C from the gen-eral trend of the ridge as well as possible clockwise deviationof fault strike and maximum extensive strain along segment Csuggest that the segment geometry is not in equilibrium withcurrent plate-motion demands and thus indicate ongoing re-adjustment of the ridge. Reorientation might occur by riftpropagation [e.g., Hey et al., 1988], for instance, along seg-ment C, which seems to be the most appropriately orientedridge segment for the current spreading demands. Such a riftpropagation concept would be consistent with the concentra-tion of earthquakes beyond the SW end of segment C andthe WSW migration of swarms.
5. Conclusions
[47] Teleseismic cross-correlation based double-differencerelocation of seismicity in the Andaman Sea reveals insightinto the spatial and temporal structure and dynamics of thisextensional plate-boundary system. The new data imageNE-SW trending active normal faults at the eastern edge ofthe Alcock Rise, which accommodate the NW-SE directedextension in the Andaman Sea. These normal faults are lo-cated west of the master plate boundary, which is inferredfrom N-S trending transform faults connecting the AndamanBack-Arc Spreading Center (ABSC) with the Sagaing Fault.Seismicity and seismic moment release suggest that back-arcextension is primarily accommodated within the ABSC.However, the short-term spreading rate derived from exten-sional moment tensors account for less than 10% of thelong-term 3.0–3.8 cm/yr spreading rate. The de!cit in seis-mic strain supports the concept of a spreading system, whereextension is largely accommodated by formation ofnew crust.[48] Episodes of dike intrusions are proposed as the pri-
mary driver for three major earthquake swarms in theABSC. Directivity and migration velocities of seismicity inthe 1984 swarm are interpreted as expression of a tensilestress !eld that forms above a lateral dike intrusion initiatedin the central part of segment C, propagating toward WSW.High b-values of about 2 and the occurrence of a potentialvertical-CLVD mechanism in the center of segment C areadditional hints for a magmatic origin of the 1984 swarm.Swarms in 2006 and 2009 initiated at the WSW end of seg-ment C and show similar propagation toward WSW.Coulomb-stress modeling suggests that dike opening andaxial earthquakes triggered seismic activity on moderatelyinward dipping off-axis faults north of segment B. Theperiod of about 25 years between the 1984 and 2006/2009swarms is consistent with the long-term spreading rate of3.8 cm/yr (assuming a dike thickness of 1m and purelyaseismic opening).[49] The spreading direction in the ABSC over the past
4Myr appears to be close to ridge normal but oblique tothe adjacent transforms. The non-orthogonal ridge-transform geometry results in the formation of “leaky trans-forms,” consistent with NS oriented deep troughs evident inthe bathymetry on either side of the ABSC. In particular, theWest Andaman fault system accommodates westward exten-sion in the month after the Mw = 9.2 Sumatra-Andamanearthquake of December 2004. A possible systematic skewin slip vectors suggests an en-echelon arrangement ofextensional structures in the eastern part of the ABSC, which
indicates that segment geometry is not in equilibrium withcurrent plate-motion demands and thus ongoing re-adjustment of the ridge.
[50] Acknowledgments. We thank Roger Buck, Göran Ekström, andJochen Wössner for helpful discussions. Comments by the associate editor,Frederik Tilmann, and two anonymous reviewers helped to improve themanuscript. This work was supported in part by the National ScienceFoundation under grants EAR-06-08739 (T.D., F.W., E.R.E.) and OCE-0927024 (T.D., J.C., F.W., K.K.-R.). The LDEO contribution number is 7689.Seismic waveform data were obtained from the Incorporated Research Institu-tions for Seismology (IRIS) and the GEOFON data center. The bulletin datawere provided by the ISC and USGS/NEIC, and moment tensor solutions wereobtained from the Global CMT Project. Figures were prepared using the GMTsoftware package [Wessel and Smith, 1998].
ReferencesAbelson, M., and A. Agnon (1997), Mechanics of oblique spreading andridge segmentation, Earth Planet Sci. Lett., 148(3–4), 405–421,doi:10.1016/S0012-821X(97)00054-X.
Atwater, T., and K. C. Macdonald (1977), Are spreading centers per-pendicular to their transform faults?, Nature, 270(5639), 715–717,doi:10.1038/270715a0.
Ayele, A., D. Keir, C. Ebinger, T. J. Wright, G. W. Stuart, W. R. Buck,E. Jacques, G. Ogubazghi, and J. Sholan (2009), September 2005 mega-dike emplacement in the Manda-Harraro nascent oceanic rift (Afardepression), Geophys. Res. Lett., 36, L20306, doi:10.1029/2009GL039605.
Bergman, E. A., and S. C. Solomon (1990), Earthquake swarms on theMid-Atlantic Ridge—Products of magmatism or extensional tectonics?,J. Geophys. Res., 95(B4), 4943–4965, doi:10.1029/JB095iB04p04943.
Bialas, R. W., and W. R. Buck (2009), How sediment promotes narrowrifting: Application to the Gulf of California, Tectonics, 28, TC4014,doi:10.1029/2008TC002394.
Briggs, R. W., et al. (2006), Deformation and slip along the SundaMegathrust in the great 2005 Nias-Simeulue earthquake, Science,311(5769), 1897–1901, doi:10.1126/science.1122602.
Buck, W. R., P. Einarsson, and B. Brandsdottir (2006), Tectonic stress andmagma chamber size as controls on dike propagation: Constraints fromthe 1975–1984 Kra"a rifting episode, J. Geophys. Res., 111, B12404,doi:10.1029/2005JB003879.
Cattin, R., N. Chamot-Rooke, M. Pubellier, A. Rabaute, M. Delescluse,C. Vigny, L. Fleitout, and P. Dubernet (2009), Stress change andeffective friction coef!cient along the Sumatra-Andaman-Sagaing faultsystem after the 26 December 2004 (Mw= 9.2) and the 28 March2005 (Mw= 8.7) earthquakes, Geochem. Geophy. Geosy., 10, Q03011,doi:10.1029/2008GC002167.
Chamot-Rooke, N., C. Rangin, and C. Nielsen (2001), Timing and kinemat-ics of Andaman basin opening, paper presented at AGU Spring Meeting,Abstract T42B-08.
Chlieh, M., et al. (2007), Coseismic slip and afterslip of the great Mw 9.15Sumatra-Andaman earthquake of 2004, Bull. Seismol. Soc. Am., 97(1),S152–S173, doi:10.1785/0120050631.
Cochran, J. R. (2010), Morphology and tectonics of the Andaman Forearc,northeastern Indian Ocean, Geophys. J. Int., 182(2), 631–651,doi:10.1111/j.1365-246X.2010.04663.X.
Curray, J. R. (2005), Tectonics and history of the Andaman Sea region,J. Asian Earth Sci., 25(1), 187–228, doi:10.1016/j.jseaes.2004.09.001.
Curray, J. R., D. G.Moore, L. A. Lawver, F. J. Emmel, R.W. Raitt, M. Henry,and R. Kieckhefer (1979), Tectonics of the Andaman Sea and Burma, inGeo-logical and Geophysical Investigations of Continental Margins, edited byJ. Watkins, L. Montadert and P. W. Dickerson, pp. 189–198, Am. Assoc. Pet.Geol. Mem. 29, American Association of Petroleum Geologists, Tulsa, Okla.
Dick, H. J. B., J. Lin, and H. Schouten (2003), An ultraslow-spreading classof ocean ridge, Nature, 426(6965), 405–412, doi:10.1038/nature02128.
Dziak, R. P., D. R. Bohnenstiehl, J. P. Cowen, E. T. Baker, K. H. Rubin,J. H. Haxel, and M. J. Fowler (2007), Rapid dike emplacement leads toeruptions and hydrothermal plume release during sea"oor spreadingevents, Geology, 35(7), 579–582, doi:10.1130/G23476A.1.
Dziak, R. P., D. R. Bohnenstiehl, H. Matsumoto, M. J. Fowler, J. H. Haxel,M. Tolstoy, and F. Waldhauser (2009), January 2006 sea"oor-spreadingevent at 9 degrees 500N, East Paci!c Rise: Ridge dike intrusion and trans-form fault interactions from regional hydroacoustic data, Geochem.Geophys. Geosyst., 10, Q06T06, doi:10.1029/2009GC002388.
Eguchi, T., S. Uyeda, and T. Maki (1979), Seismotectonics and tectonic his-tory of the Andaman Sea, Tectonophysics, 57(1), 35–51, doi:10.1016/0040-1951(79)90100-8.
DIEHL ET AL.: BACK-ARC EXTENSION IN THE ANDAMAN SEA
17
Einarsson, P., and B. Brandsdottir (1980), Seismological evidence forlateral magma intrusion during the July 1978 de"ation of the Kra"avolcano in Ne Iceland, J. Geophys., 47(1–3), 160–165.
Ekström, G. (1994), Anomalous earthquakes on volcano ring-fault struc-tures, Earth Planet. Sci. Lett., 128, 707–712.
Engdahl, E. R., R. van der Hilst, and R. Buland (1998), Global teleseismicearthquake relocation with improved travel times and procedures fordepth determination, Bull. Seismol. Soc. Am., 88(3), 722–743.
Engdahl, E. R., A. Villasenor, H. R. DeShon, and C. H. Thurber (2007),Teleseismic relocation and assessment of seismicity (1918–2005) in theregion of the 2004 Mw 9.0 Sumatra-Andaman and 2005 Mw 8.6 NiasIsland great earthquakes, Bull. Seismol. Soc. Am., 97(1), S43–S61,doi:10.1785/0120050614.
Escartin, J., D. K. Smith, J. Cann, H. Schouten, C. H. Langmuir, andS. Escrig (2008), Central role of detachment faults in accretion ofslow-spreading oceanic lithosphere, Nature, 455(7214), 790–795,doi:10.1038/nature07333.
Fitch, T. J. (1972), Plate convergence, transcurrent faults, and internaldeformation adjacent to southeast Asia and western Paci!c, J. Geophys.Res., 77(23), 4432–4460, doi:10.1029/JB077i023p04432.
Gahalaut, V. K., and K. Gahalaut (2007), Burma plate motion, J. Geophys.Res., 112(B10), B10402, doi:10.1029/2007JB004928.
Genrich, J. F., Y. Bock, R. McCaffrey, L. Prawirodirdjo, C. W. Stevens,S. S. O. Puntodewo, C. Subarya, and S. Wdowinski (2000), Distributionof slip at the northern Sumatran fault system, J. Geophys. Res., 105(B12),28327–28341, doi:10.1029/2000JB900158.
Guzmán-Speziale, M., and J. F. Ni (1993), The opening of the AndamanSea—Where is the short-term displacement being taken up?, Geophys.Res. Lett., 20(24), 2949–2952, doi:10.1029/93GL03053.
Helffrich, G. R. (1997), How good are routinely determined focal mecha-nisms? Empirical statistics based on a comparison of Harvard, USGSand ERI moment tensors, Geophys. J. Int., 131(3), 741–750,doi:10.1111/j.1365-246X.1997.tb06609.X.
Hey, R. N., H. W. Menard, T. M. Atwater, and D. W. Caress (1988),Changes in direction of sea"oor spreading revisited, J. Geophys. Res.,93(B4), 2803–2811, doi:10.1029/JB093iB04p02803.
Hjörleifsdóttir, V., and G. Ekström (2010), Effects of three-dimensionalEarth structure on CMT earthquake parameters, Phys. Earth Planet. In.,179(3–4), 178–190, doi:10.1016/j.pepi.2009.11.003.
Huang, P. Y., and S. C. Solomon (1988), Centroid depths of mid-oceanridge earthquakes—Dependence on spreading rate, J. Geophys. Res.,93(B11), 13445–13477, doi:10.1029/JB093iB11p13445.
Kagan, Y. Y. (2003), Accuracy of modern global earthquake catalogs, Phys.Earth Planet. In., 135(2–3), 173–209, doi:10.1016/S0031-9201(02)00214-5.
Kamesh Raju, K. A., T. Ramprasad, P. S. Rao, B. R. Rao, and J. Varghese(2004), New insights into the tectonic evolution of the Andaman basin,northeast Indian Ocean, Earth Planet Sci. Lett., 221(1–4), 145–162,doi:10.1016/S0012-821X(04)00075-5.
Kamesh Raju, K. A., G. P. S. Murty, D. Amarnath, and M. L. M. Kumar(2007), The west Andaman fault and its in"uence on the aftershock pat-tern of the recent megathrust earthquakes in the Andaman-Sumatraregion, Geophys. Res. Lett., 34(3), L03305, doi:10.1029/2006GL028730.
Kundu, B., D. Legrand, K. Gahalaut, V. K. Gahalaut, P. Mahesh,K. A. Kamesh Raju, J. K. Catherine, A. Ambikapthy, and R. K. Chadha(2012), The 2005 volcano-tectonic earthquake swarm in the AndamanSea: Triggered by the 2004 great Sumatra-Andaman earthquake,Tectonics, 31, TC5009, doi:10.1029/2012TC003138.
Lachenbruch, A. H. (1976), Dynamics of a passive spreading center, J.Geophys. Res., 81(11), 1883–1902, doi:10.1029/JB081i011p01883.
Lachenbruch, A. H., and G. A. Thompson (1972), Oceanic ridges andtransform faults—Their intersection angles and resistance to plate mo-tion, Earth Planet Sci. Lett., 15(2), 116–122, doi:10.1016/0012-821X(72)90051-9.
Lizarralde, D., et al. (2007), Variation in styles of rifting in the Gulf ofCalifornia, Nature, 448(7152), 466–469, doi:10.1038/nature06035.
Macdonald, K. C., D. S. Scheirer, and S. M. Carbotte (1991), Midoceanridges—Discontinuities, segments and giant cracks, Science, 253(5023),986–994, doi:10.1126/science.253.5023.986.
Maurin, T., F. Masson, C. Rangin, U. T. Min, and P. Collard (2010), Firstglobal positioning system results in northern Myanmar: Constant andlocalized slip rate along the Sagaing fault, Geology, 38(7), 591–594,doi:10.1130/G30872.1.
McCaffrey, R. (1992), Oblique plate convergence, slip vectors, and fore-arc deformation, J. Geophys. Res., 97(B6), 8905–8915, doi:10.1029/92JB00483.
McCaffrey, R. (2009), The tectonic framework of the Sumatran subductionzone, Annu. Rev. Earth Planet. Sci., 37, 345–366, doi:10.1146/annurev.earth.031208.100212.
Menard, H. W., and T. Atwater (1968), Changes in direction of sea "oorspreading, Nature, 219(5153), 463–467, doi:10.1038/219463a0.
Mukhopadhyay, B., and S. Dasgupta (2008), Swarms in Andaman Sea,India—A seismotectonic analysis, Acta Geophys., 56(4), 1000–1014,doi:10.2478/s11600-008-0039-5.
Mutter, J. C., and J. A. Karson (1992), Structural processes atslow-spreading ridges, Science, 257(5070), 627–634, doi:10.1126/science.257.5070.627.
Pesicek, J. D., C. H. Thurber, H. Zhang, H. R. DeShon, E. R. Engdahl,and S. Widiyantoro (2010), Teleseimic double-difference relocation ofearthquakes along the Sumatra-Andaman subduction zone using a 3-Dmodel, J. Geophys. Res., 115, B10303, doi:10.1029/2010JB007443.
Poupinet, G., W. L. Ellsworth, and J. Frechet (1984), Monitoring velocityvariations in the crust using earthquake doublets—An application to theCalaveras Fault, California, J. Geophys. Res., 89(Nb7), 5719–5731,doi:10.1029/JB089iB07p05719.
Rangin, C., W. Maw, S. Lwin, W. Naing, C. Mouret, G. Bertrand, andGIAC scienti!c party (1999), Cenozoic pull apart basins in centralBurma; the trace of the path of India along the western margin ofSundaland, paper presented at European Union of Geosciences confer-ences, Strasbourg, France.
Rodolfo, K. S. (1969), Bathymetry and marine geology of AndamanBasin, and tectonic implications for southeast Asia, Geol. Soc.Amer. Bull., 80(7), 1203–1230, doi:10.1130/0016-7606(1969)80[1203:BAMGOT]2.0.CO;2.
Roland, E., and J. J. McGuire (2009), Earthquake swarms on transformfaults, Geophys. J. Int., 178, 1677–1690, doi:10.1111/j.1365-246X.2009.04214.X.
Rubin, A. M. (1992), Dike-induced faulting and graben subsidence involcanic rift zones, J. Geophys. Res., 97(B2), 1839–1858, doi:10.1029/91JB02170.
Schaff, D. P., G. H. R. Bokelmann, W. L. Ellsworth, E. Zanzerkia,F. Waldhauser, and G. C. Beroza (2004), Optimizing correlationtechniques for improved earthquake location, Bull. Seismol. Soc. Am.,94(2), 705–721, doi:10.1785/0120020238.
Seeber, L., M. H. Cormier, C. McHugh, O. Emre, A. Polonia, and C. Sorlien(2006), Rapid subsidence and sedimentation from oblique slip near abend on the North Anatolian transform fault in the Marmara Sea, Turkey,Geology, 34(11), 933–936, doi:10.1130/G22520A.1.
Sempere, J. C., G. M. Purdy, and H. Schouten (1990), Segmentation of theMid-Atlantic Ridge between 24! N and 30! 400N, Nature, 344(6265),427–431, doi:10.1038/344427a0.
Sevilgen, V., R. S. Stein, and F. F. Pollitz (2012), Stress imparted by thegreat 2004 Sumatra earthquake shut down transforms and activated riftsup to 400 km away in the Andaman Sea, P. Natl. Acad. Sci. USA,109(38), 15152–15156, doi:10.1073/pnas.1208799109.
Shuler, A., M. Nettles, and G. Ekström (2013), Global observation ofvertical-CLVD earthquakes at active volcanoes, J. Geophys. Res., 118,doi:10.1029/2012JB009721.
Siebert, L., and T. Simkin (2002-). Volcanoes of the world: An illustratedcatalog of Holocene volcanoes and their eruptions. Smithsonian Institu-tion, Global Volcanism Program Digital Information Series, GVP-3,(http://www.volcano.si.edu/world/).
Sieh, K., and D. Natawidjaja (2000), Neotectonics of the Sumatran fault,Indonesia, J. Geophys. Res., 105, 28,295–228,326, doi:10.1029/2000JB900120.
Singh, S. C., J. McArdle, K. Johansen, and K. A. K. Raju (2010), Seismicimages of the axial melt lens, Moho and deep penetrating faults at thesedimented Andaman Sea Spreading Center, paper presented at FallMeeting, AGU, San Francisco, Calif., 13–17 Dec.
Smith, W. H. F., and D. T. Sandwell (1997), Global sea "oor topographyfrom satellite altimetry and ship depth soundings, Science, 277(5334),1956–1962, doi:10.1126/science.277.5334.1956.
Solomon, S. C., P. Y. Huang, and L. Meinke (1988), The seismic momentbudget of slowly spreading ridges, Nature, 334(6177), 58–60,doi:10.1038/334058a0.
Stein, R. S. (1999), The role of stress transfer in earthquake occurrence,Nature, 402(6762), 605–609, doi:10.1038/45144.
Tanaka, A., and N. Fujii (1991), Energy-dissipation rates at ridge andtransform-fault segments—A model of oblique spreading, Geophys.Res. Lett., 18(5), 857–860, doi:10.1029/91GL00996.
Taylor, B., K. Crook, and J. Sinton (1994), Extensional transform zones andoblique spreading centers, J. Geophys. Res., 99(B10), 19707–19718,doi:10.1029/94JB01662.
Thompson, G., and W. G. Melson (1972), Petrology of oceanic crust acrossfracture zones in Atlantic Ocean—Evidence of a new kind of sea-"oorspreading, J. Geol., 80(5), 526–538, doi:10.1086/627779.
Tolstoy, M., D. R. Bohnenstiehl, M. H. Edwards, and G. J. Kurras (2001),Seismic character of volcanic activity at the ultraslow-spreading GakkelRidge, Geology, 29(12), 1139–1142, doi:10.1130/0091-7613(2001)029<1139:SCOVAA>2.0.CO;2.
DIEHL ET AL.: BACK-ARC EXTENSION IN THE ANDAMAN SEA
Tucholke, B. E., and J. Lin (1994), A geological model for the structure ofridge segments in slow-spreading ocean crust, J. Geophys. Res., 99(B6),11937–11958, doi:10.1029/94JB00338.
Tuckwell, G. W., J. M. Bull, and D. J. Sanderson (1996), Models of fractureorientation at oblique spreading centres, J. Geol. Soc. London, 153,185–189, doi:10.1144/gsjgs.153.2.0185.
Uyeda, S., and H. Kanamori (1979), Back-arc opening and the mode of subduc-tion, J. Geophys. Res., 84(Nb3), 1049–1061, doi:10.1029/JB084iB03p01049.
Vigny, C., A. Socquet, C. Rangin, N. Chamotrooke, M. Pubellier,M. N. Bouin, G. Bertrand, and M. Becker (2003), Present-day crustal de-formation around Sagaing fault, Myanmar, J. Geophys. Res., 108(B11),2533, doi:10.1029/2002JB001999.
Waldhauser, F. (2009), Near-real-time double-difference event locationusing long-term seismic archives, with application to Northern California,Bull. Seismol. Soc. Am., 99(5), 2736–2748, doi:10.1785/0120080294.
Waldhauser, F., and W. L. Ellsworth (2000), A double-differenceearthquake location algorithm: Method and application to the northern
Waldhauser, F., and D. Schaff (2007), Regional and teleseismic double-difference earthquake relocation using waveform cross-correlation and globalbulletin data, J. Geophys. Res., 112, B12301, doi:10.1029/2007JB004938.
Waldhauser, F., D. P. Schaff, T. Diehl, and E. R. Engdahl (2012), Splayfaults imaged by "uid-driven aftershocks of the 2004 Mw 9.2 Sumatra-Andaman earthquake, Geology, 40(3), 243–246, doi:10.1130/G32420.1.
Walter, T. R., and F. Amelung (2007), Volcanic eruptions following M " 9megathrust earthquakes: Implications for the Sumatra-Andamanvolcanoes, Geology, 35, 539–542, doi:10.1130/G23429A.1.
Wessel, P., and W. H. F. Smith (1998), New, improved version of theGeneric Mapping Tools released, EOS, Trans. Am. Geophys. Un.,79, 579, doi:10.1029/98EO00426.
Widiyantoro, S., and R. van der Hilst (1997), Mantle structure beneathIndonesia inferred from high-resolution tomographic imaging, Geophys.J. Int., 130(1), 167–182, doi:10.1111/j.1365-246X.1997.tb00996.X.
DIEHL ET AL.: BACK-ARC EXTENSION IN THE ANDAMAN SEA