Page 1
Baird Family Wealth Group
Presents:
Brian Beaulieu
September 30, 2015
Dallas 5950 Berkshire Lane Dallas, TX 75225 214-373-2974
Milwaukee 777 East Wisconsin Avenue Milwaukee, WI 53202 414-765-7092
Robert W. Baird & Co.
www.BairdFamilyWealthGroup.com
Page 2
Brian Beaulieu CEO
Prosperity in the Age of Decline
Baird Family Wealth Group
2
Page 3
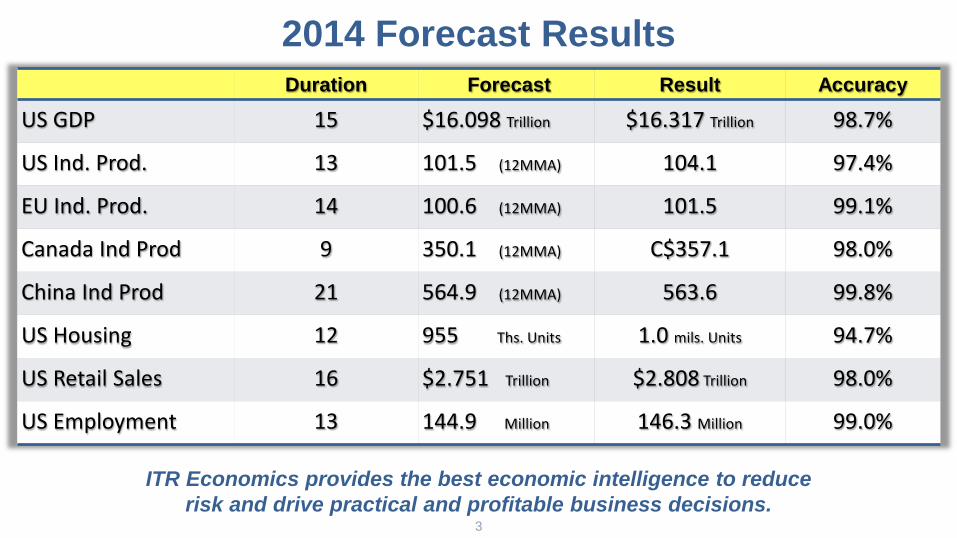
ITR Economics provides the best economic intelligence to reduce risk and drive practical and profitable business decisions.
Duration Forecast Result Accuracy
US GDP 15 $16.098 Trillion $16.317 Trillion 98.7%
US Ind. Prod. 13 101.5 (12MMA) 104.1 97.4%
EU Ind. Prod. 14 100.6 (12MMA) 101.5 99.1%
Canada Ind Prod 9 350.1 (12MMA) C$357.1 98.0%
China Ind Prod 21 564.9 (12MMA) 563.6 99.8%
US Housing 12 955 Ths. Units 1.0 mils. Units 94.7%
US Retail Sales 16 $2.751 Trillion $2.808 Trillion 98.0%
US Employment 13 144.9 Million 146.3 Million 99.0%
2014 Forecast Results 3
3
Page 4
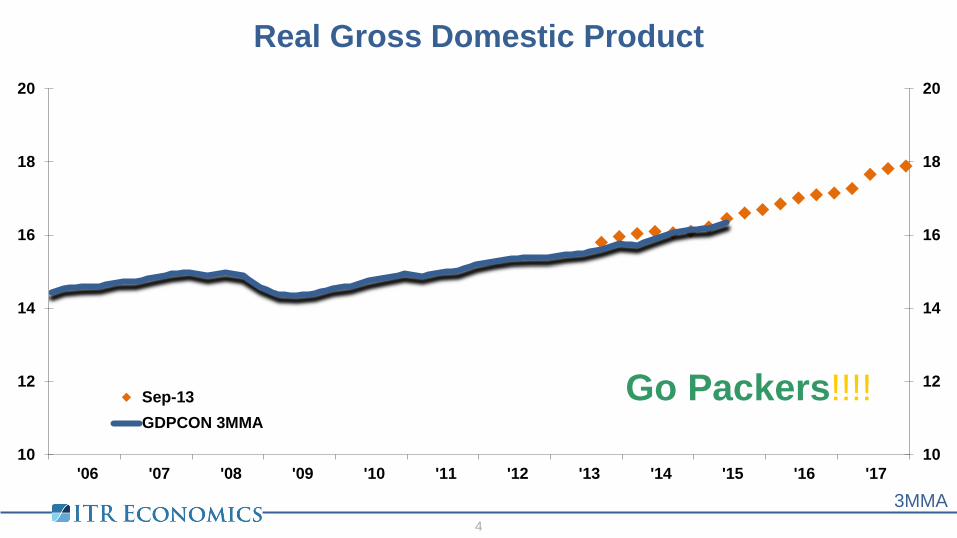
Real Gross Domestic Product
3MMA 4
10
12
14
16
18
20
10
12
14
16
18
20
'06 '07 '08 '09 '10 '11 '12 '13 '14 '15 '16 '17
Sep-13GDPCON 3MMA
Go Packers!!!!
Page 5
Crude Oil Futures Prices to Natural Gas Future Prices
5
0
3
6
9
12
15
-5
25
55
85
115
145
'86 '88 '90 '92 '94 '96 '98 '00 '02 '04 '06 '08 '10 '12 '14 '16 '18 '20
Gas Oil
OilNatural Gas
Raw Data
Page 6
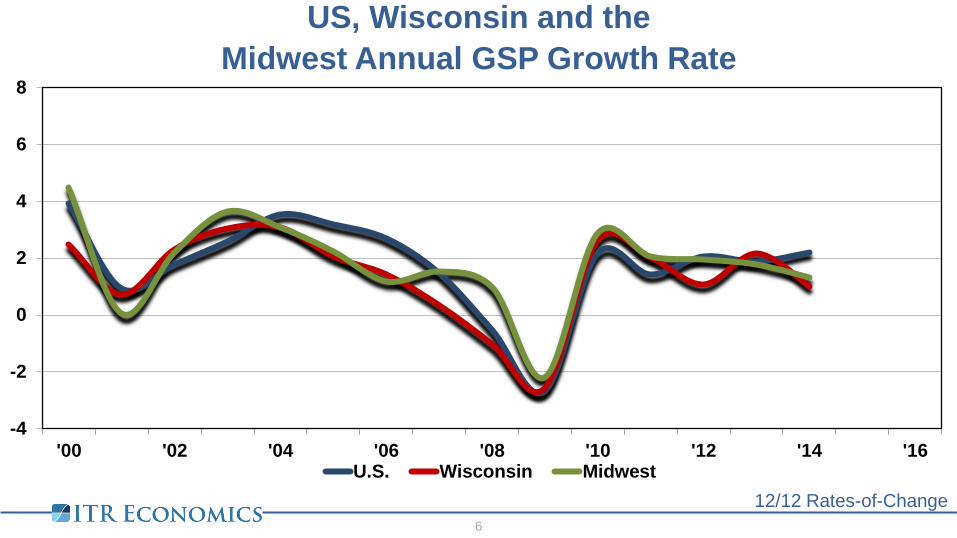
US, Wisconsin and the Midwest Annual GSP Growth Rate
6
12/12 Rates-of-Change
-4
-2
0
2
4
6
8
'00 '02 '04 '06 '08 '10 '12 '14 '16U.S. Wisconsin Midwest
Page 7
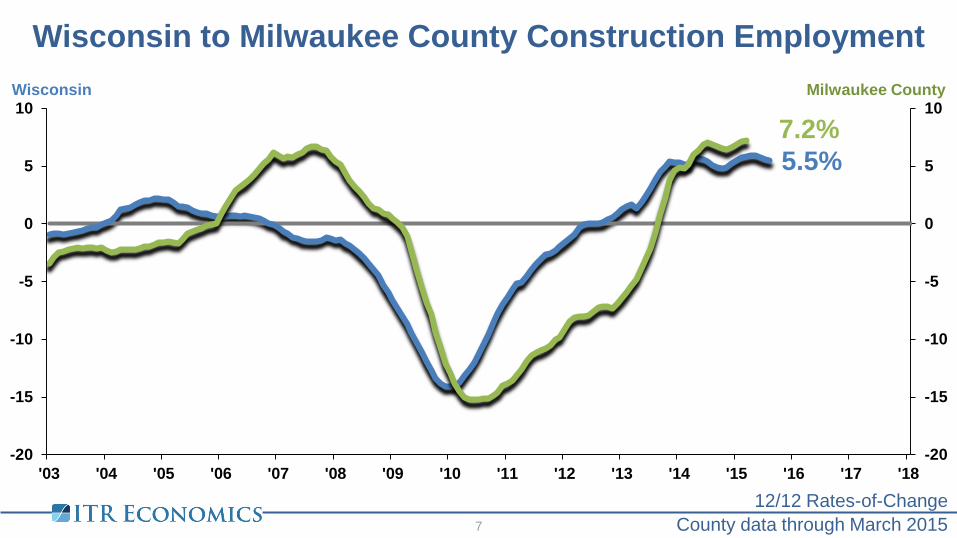
Wisconsin to Milwaukee County Construction Employment
County data through March 2015 12/12 Rates-of-Change
7
5.5% 7.2%
-20
-15
-10
-5
0
5
10
-20
-15
-10
-5
0
5
10
'03 '04 '05 '06 '07 '08 '09 '10 '11 '12 '13 '14 '15 '16 '17 '18
Milwaukee County Wisconsin
Page 8
Wisconsin to Milwaukee County Population
Annual data through 2013 Millions of Persons
8
0.0
0.5
1.0
1.5
2.0
2.5
3.0
0.0
1.0
2.0
3.0
4.0
5.0
6.0
1969 1973 1977 1981 1985 1989 1993 1997 2001 2005 2009 2013
Wisconsin
Population, Wisconsin
Population, Milwaukee County
Milwaukee County
Page 9
World GDP, Trillions of US $, Current Prices
9
Percent of 2014 World GDP
Data Source: IMF, *IMF Estimated Figures
*77.302 Trillion US$
Page 10
Interest Rates for Long-Term Government Bonds
10
2.72%
0.94% 0.96%
1.52%
0.91% 0.92% 0.97%
0.65%
8.58%
1.26% 1.81%
0.33% 0.83%
3.35% 2.57%
2.04%
0.73%
-0.09%
1.84% 2.17%
-2%
0%
2%
4%
6%
8%
10%
12%
Latest yield
Page 11
Exports to China in 2014
11
0%
2%
4%
6%
8%
10%
12%
14%% of GDP
Source: IMF and ITR Economics. Japan estimate on 2013 GDP.
Page 12
US to Europe Industrial Production
12
12
Annual Average Data Trends
60
80
100
120
140
40
60
80
100
120
1975 1980 1985 1990 1995 2000 2005 2010 2015 2020
Europe US
USEurope
Page 13
Raw Oct-13 1.4 Nov-13 1.5 Dec-13 1.5 Jan-14 1.4 Feb-14 1.5 Mar-14 1.3 Apr-14 1.3
May-14 1.6 Jun-14 1.6 Jul-14 1.5
Aug-14 1.7 Sep-14 1.6 Oct-14 1.7 Nov-14 1.7 Dec-14 1.7 Jan-15 1.6 Feb-15 1.7 Mar-15 1.5 Apr-15 1.5
May-15 1.9 Jun-15 1.7 Jul-15 1.7
Aug-15 1.9 Sep-15 1.7
3/12 Rate-of-Change = 𝑆𝑆𝑆𝑆𝑆𝑆𝑆𝑆𝑆 2015 3𝑀𝑀𝑀𝑆𝑆𝑆𝑆𝑆𝑆𝑆𝑆𝑆 2014 3𝑀𝑀𝑀
× 100 − 100 =5.34.8
× 100 − 100 = 10.4%
3MMT
4.4 4.4 4.4 4.2 4.1 4.2 4.5 4.7 4.8 4.8 5.0 5.0 5.1 5.0 5.0 4.8 4.7 4.9 5.1 5.3 5.3 5.3
12MMT
18.0 18.2 18.4 18.6 18.8 19.0 19.2 19.4 19.7 19.8 20.0 20.2 20.3
12/12
26.7% 25.5% 25.2% 22.4% 20.0% 18.3% 15.4% 12.7%
12/12 Rate-of-Change = 𝑆𝑆𝑆𝑆𝑆𝑆𝑆𝑆𝑆 2015 12𝑀𝑀𝑀𝑆𝑆𝑆𝑆𝑆𝑆𝑆𝑆𝑆 2014 12𝑀𝑀𝑀
× 100 − 100 =20.318.0
× 100 − 100 = 12.7%
3/12
15.9% 13.6% 13.6% 14.3% 14.6% 16.7% 13.3% 12.8% 10.4% 10.4%
Data Preparation
13
Page 14
Global Leading Indicators
Data Source: Markit Economics 1/12 Rates-of-Change
14
-3.6% 3.2% 3.4%
-60
-40
-20
0
20
40
60
80
-60
-40
-20
0
20
40
60
80
'07 '08 '09 '10 '11 '12 '13 '14 '15 '16 '17 '18
EZ Comp PMIEU Manufacturing PMIJP Morgan Global MFG PMI
Page 15
US Industrial Production to ITR Leading Indicator™
USIP – 12/12 Indicator - Monthly 15
Reported in ITR Trends Report – ITR Advisor
-15
-10
-5
0
5
10
15
-15
-10
-5
0
5
10
15
'80 '82 '84 '86 '88 '90 '92 '94 '96 '98 '00 '02 '04 '06 '08 '10 '12 '14 '16 '18 '20
Indicator US IP
Indicator - Monthly
US IP - 12/12
Page 16
Non-Manufacturing Purchasing Managers Index
16
Above 50 Indicates expansion Data Source: Institute for Supply Management
57.5
45
50
55
60
45
50
55
60
'10 '11 '12 '13 '14 '15 '16
MMA R-O-C
3MMA 12MMA
Page 17
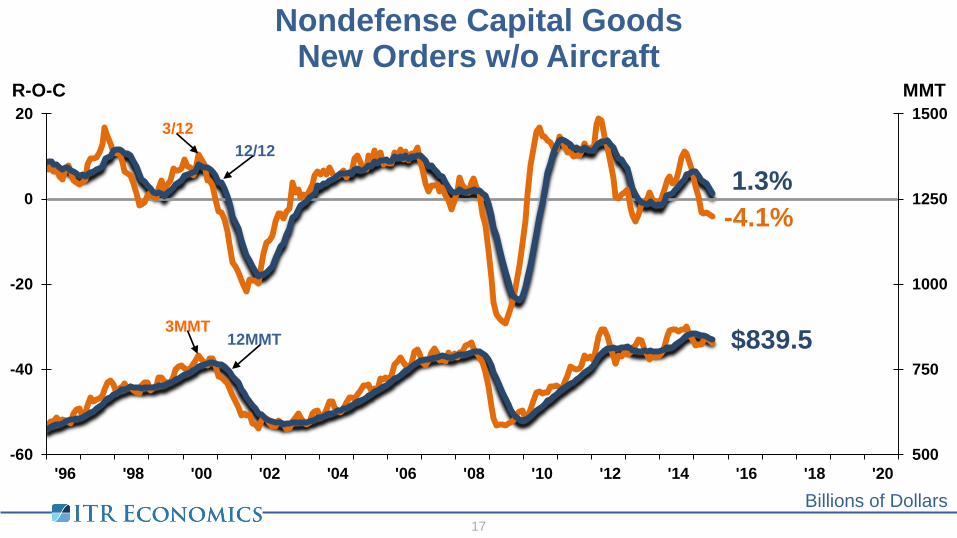
Nondefense Capital Goods New Orders w/o Aircraft
Billions of Dollars 17
-4.1% 1.3%
$839.5
500
750
1000
1250
1500
-60
-40
-20
0
20
'96 '98 '00 '02 '04 '06 '08 '10 '12 '14 '16 '18 '20
MMT R-O-C
3/12 12/12
3MMT 12MMT
Page 18
S&P500 Stock Prices Index
18
Data Trends Data Source: Wall Street Journal
0
400
800
1200
1600
2000
2400
0
400
800
1200
1600
2000
2400
1965 1970 1975 1980 1985 1990 1995 2000 2005 2010 2015 2020
Raw12MMA
Page 19
Existing Home Sales
Millions of Units 19
8.6% 5.4%
5.2
4
5
7
8
10
11
13
-48
-36
-24
-12
0
12
24
'96 '98 '00 '02 '04 '06 '08 '10 '12 '14 '16 '18 '20
MMA R-O-C 3/12 12/12
3MMA 12MMA
Page 20
Housing Starts
16.8% 10.5%
1.079
0.2
1.0
1.9
2.7
3.5
4.4
5.2
-80
-60
-40
-20
0
20
40
'96 '98 '00 '02 '04 '06 '08 '10 '12 '14 '16 '18 '20
MMT R-O-C
3/12
12/12
3MMT 12MMT
Millions of Units 20
Mar ‘13
May ‘11
Dec ‘09
Page 21
Generating the Quantitative Forecast
21
ITR Long Term Business Cycle Theory News and Market Observations
Leading Economic Indicators Internal Trends
Page 22
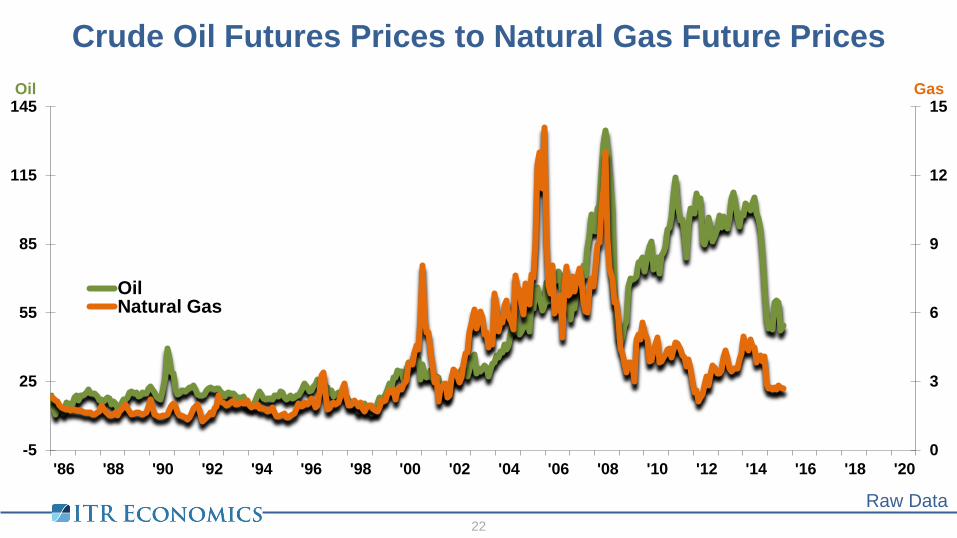
Crude Oil Futures Prices to Natural Gas Future Prices
22
0
3
6
9
12
15
-5
25
55
85
115
145
'86 '88 '90 '92 '94 '96 '98 '00 '02 '04 '06 '08 '10 '12 '14 '16 '18 '20
Gas Oil
OilNatural Gas
Raw Data
Page 23
Crude Oil Futures Prices to Cushing Hub Inventories
12/12 Rates-of-Change 23
-60
-30
0
30
60
90
-60
-30
0
30
60
90
'99 '00 '01 '02 '03 '04 '05 '06 '07 '08 '09 '10 '11 '12 '13 '14 '15 '16 '17 '18 '19 '20
Inventories Oil Prices
Oil Prices
Inventories
The Cushing Hub Inventories 12/12 has a 15 month lead time to the Crude Oil Futures Prices 12/12 through business cycle highs and lows.
Correlation: 0.60
Page 24
US Consumption of Crude Oil & Petroleum Products to Real Gross Domestic Product
24
Data Trends Data Sources: EIA, BEA
6
10
14
18
0.4
0.5
0.6
0.7
1985 1990 1995 2000 2005 2010 2015 2020
GDP Trils C2009$
Oil Bils Barrels
Oil Consumption - Raw DataGDP - 3MMA
Page 25
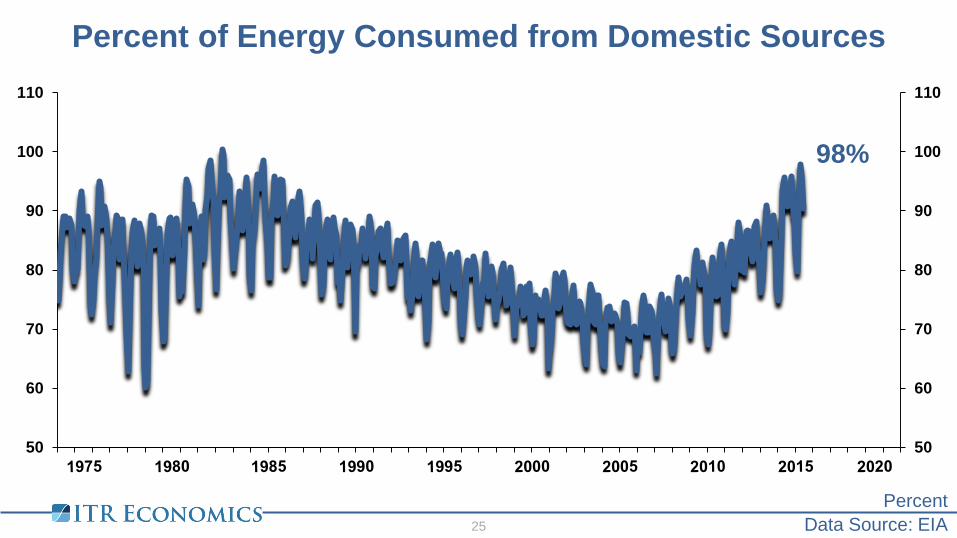
Percent of Energy Consumed from Domestic Sources
25 Data Source: EIA Percent
98%
50
60
70
80
90
100
110
50
60
70
80
90
100
110
Page 26
Euros per US Dollars
26 Data Source: Wall Street Journal
17.1% 18.2%
0.869
0.6
0.7
0.8
0.9
1.0
1.1
1.2
-60
-45
-30
-15
0
15
30
'05 '06 '07 '08 '09 '10 '11 '12 '13 '14 '15 '16 '17 '18 '19
MMA R-O-C
1/12
12/12
Actual
12MMA
Page 27
Business Cycle Drivers
27
Inflation Interest Rates Employment Consumer
Construction
Page 28
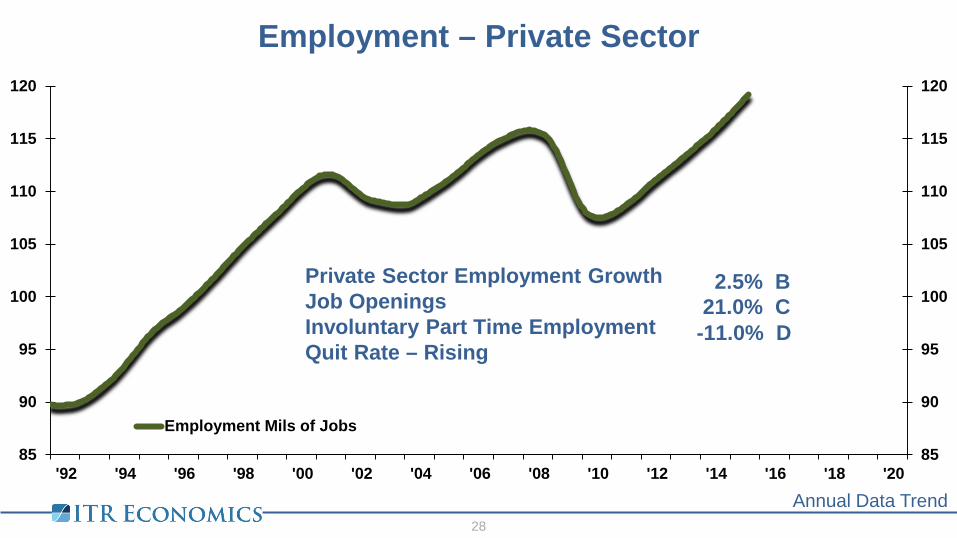
Employment – Private Sector
Annual Data Trend 28
85
90
95
100
105
110
115
120
85
90
95
100
105
110
115
120
'92 '94 '96 '98 '00 '02 '04 '06 '08 '10 '12 '14 '16 '18 '20
Employment Mils of Jobs
Private Sector Employment Growth Job Openings Involuntary Part Time Employment Quit Rate – Rising
21.0% C 2.5% B
-11.0% D
Page 29
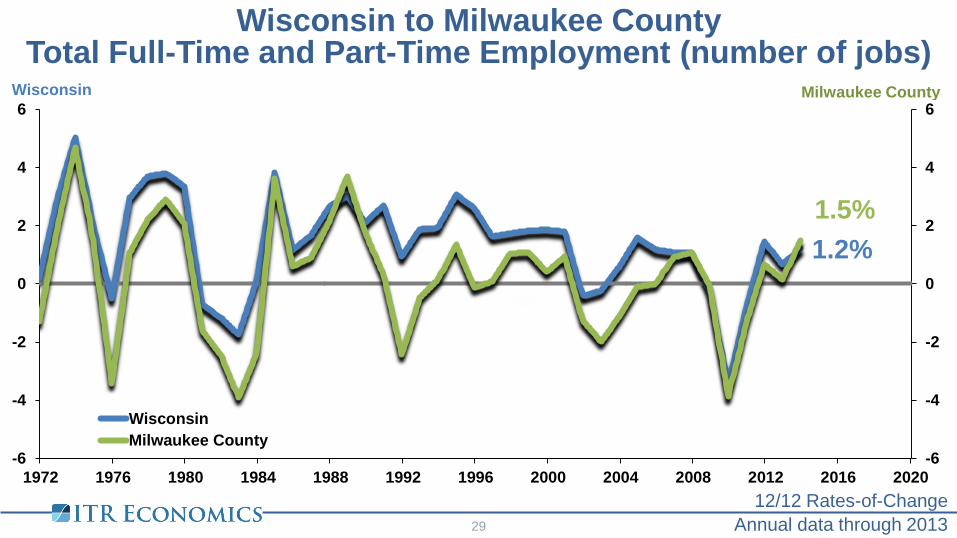
Wisconsin to Milwaukee County Total Full-Time and Part-Time Employment (number of jobs)
Annual data through 2013 12/12 Rates-of-Change
29
1.2% 1.5%
-6
-4
-2
0
2
4
6
-6
-4
-2
0
2
4
6
1972 1976 1980 1984 1988 1992 1996 2000 2004 2008 2012 2016 2020
Wisconsin
WisconsinMilwaukee County
Milwaukee County
Page 30
2
3
4
5
6
7
8
9
10
11
'00 '01 '02 '03 '04 '05 '06 '07 '08 '09 '10 '11 '12 '13 '14U.S. Wisconsin
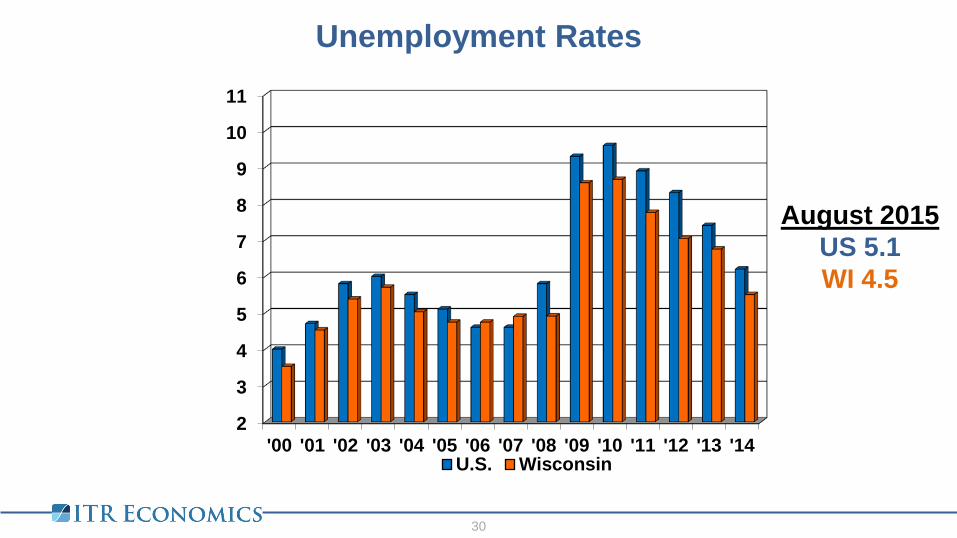
Unemployment Rates
30
August 2015 US 5.1 WI 4.5
Page 31
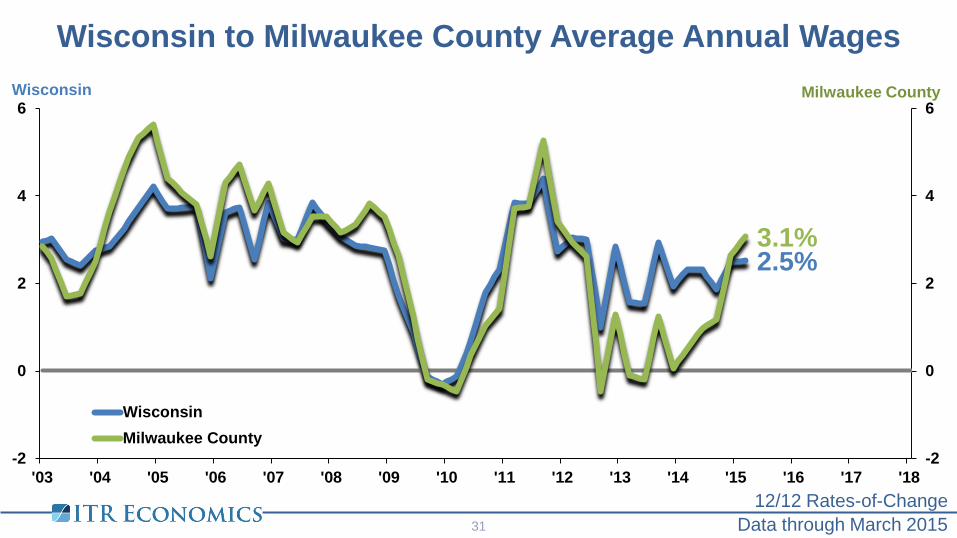
Wisconsin to Milwaukee County Average Annual Wages
Data through March 2015 12/12 Rates-of-Change
31
2.5% 3.1%
-2
0
2
4
6
-2
0
2
4
6
'03 '04 '05 '06 '07 '08 '09 '10 '11 '12 '13 '14 '15 '16 '17 '18
Wisconsin
WisconsinMilwaukee County
Milwaukee County
Page 32
Minimum Wage and Supply & Demand
Source: Principles of Macroeconomics by Dr. N. Gregory Mankiw
32
Page 33
Consumer Price Index
33
Rates-of-Change
0.2% 0.5%
-3
0
3
5
8
10
-3
0
3
5
8
10
'82 '84 '86 '88 '90 '92 '94 '96 '98 '00 '02 '04 '06 '08 '10 '12 '14 '16 '18 '20
1/12
12/12
Page 34
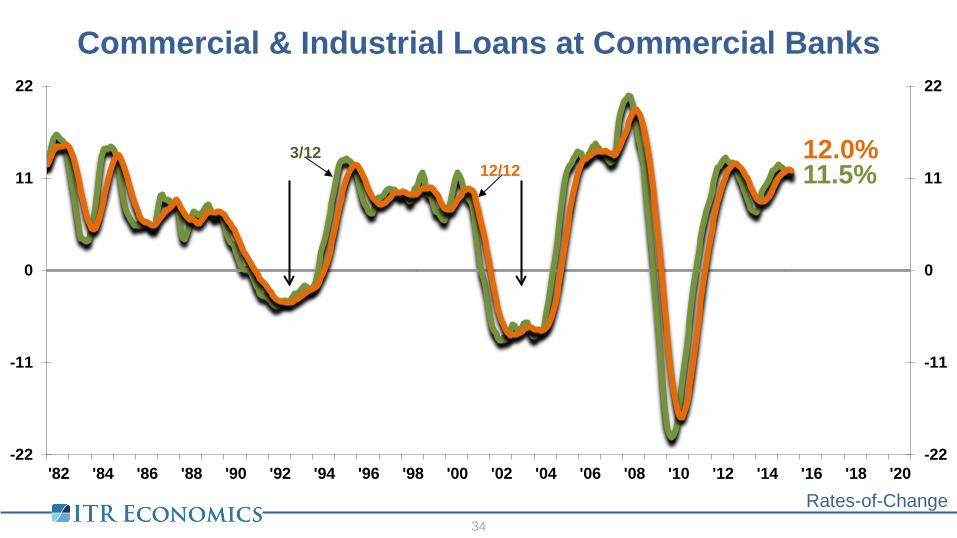
Commercial & Industrial Loans at Commercial Banks
Rates-of-Change 34
11.5% 12.0%
-22
-11
0
11
22
-22
-11
0
11
22
'82 '84 '86 '88 '90 '92 '94 '96 '98 '00 '02 '04 '06 '08 '10 '12 '14 '16 '18 '20
12/12 3/12
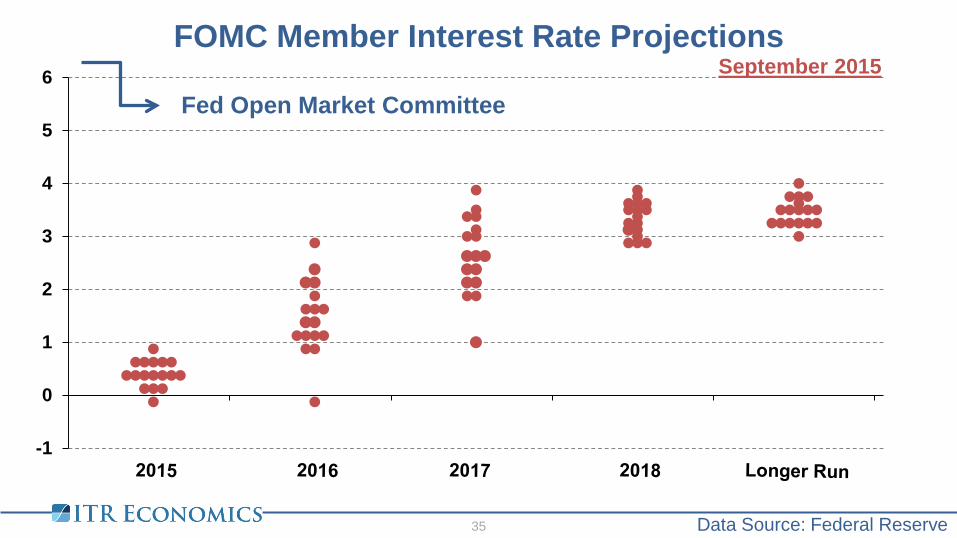
Page 35
-1
0
1
2
3
4
5
6
FOMC Member Interest Rate Projections
Data Source: Federal Reserve
35
Fed Open Market Committee September 2015
Page 36
36
0
2
4
6
8
10
12
14
16
'82 '84 '86 '88 '90 '92 '94 '96 '98 '00 '02 '04 '06 '08 '10 '12 '14 '16
Yield on 10 Year Treasury Note 36
%
Page 37
Total Retail Sales (deflated)
37
Trillions of Dollars
2.4% 2.5%
$2.23
1.50
2.00
2.50
3.00
3.50
4.00
4.50
-18
-14
-9
-5
0
5
9
'96 '98 '00 '02 '04 '06 '08 '10 '12 '14 '16 '18 '20
MMT R-O-C
3/12 12/12
3MMT 12MMT
Page 38
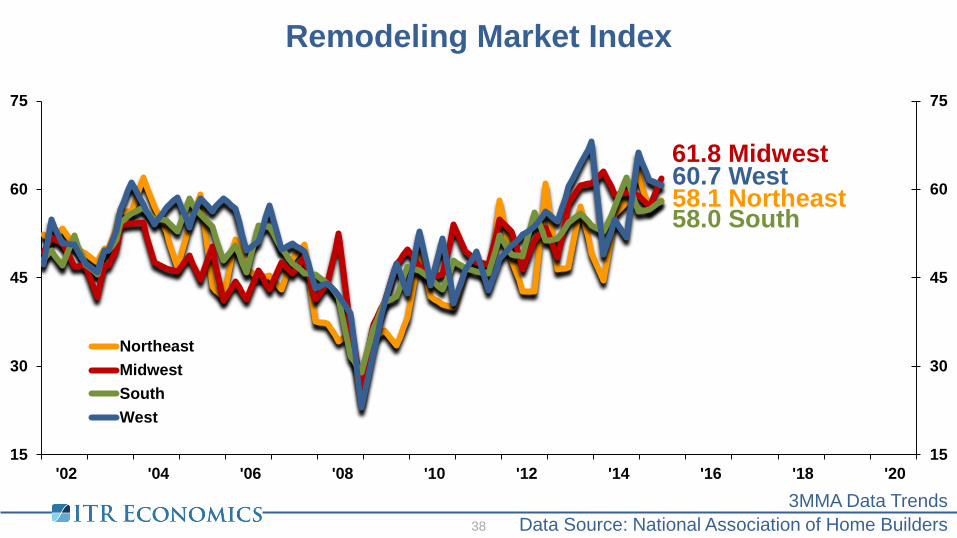
Remodeling Market Index
Data Source: National Association of Home Builders
3MMA Data Trends 38
58.1 Northeast 60.7 West 58.0 South
61.8 Midwest
15
30
45
60
75
15
30
45
60
75
'02 '04 '06 '08 '10 '12 '14 '16 '18 '20
NortheastMidwestSouthWest
Page 39
Wisconsin Housing Unit Building Permits
39
Thousands of Units
7.9% 0.1%
15.1
-2
10
22
34
46
58
70
82
94
-150
-125
-100
-75
-50
-25
0
25
50
'98 '00 '02 '04 '06 '08 '10 '12 '14 '16 '18 '20
MMT R-O-C 3/12
12/12
3MMT 12MMT
Page 40
Wisconsin Housing Price Index
40
Year over Year % Change
100
150
200
250
100
150
200
250
'94 '96 '98 '00 '02 '04 '06 '08 '10 '12 '14 '16
Raw
Page 41
US to Milwaukee MSA Median Home Sale Prices
41
150
165
180
195
210
225
240
150
165
180
195
210
225
240
'03 '04 '05 '06 '07 '08 '09 '10 '11 '12 '13 '14 '15 '16 '17 '18 '19 '20
USMilwaukee
$214.9 $216.9
Annual Data Trends
Page 42
50
150
250
350
450
35
65
95
125
155
1975 1980 1985 1990 1995 2000 2005 2010 2015 2020
Construction Index
Index
Construction
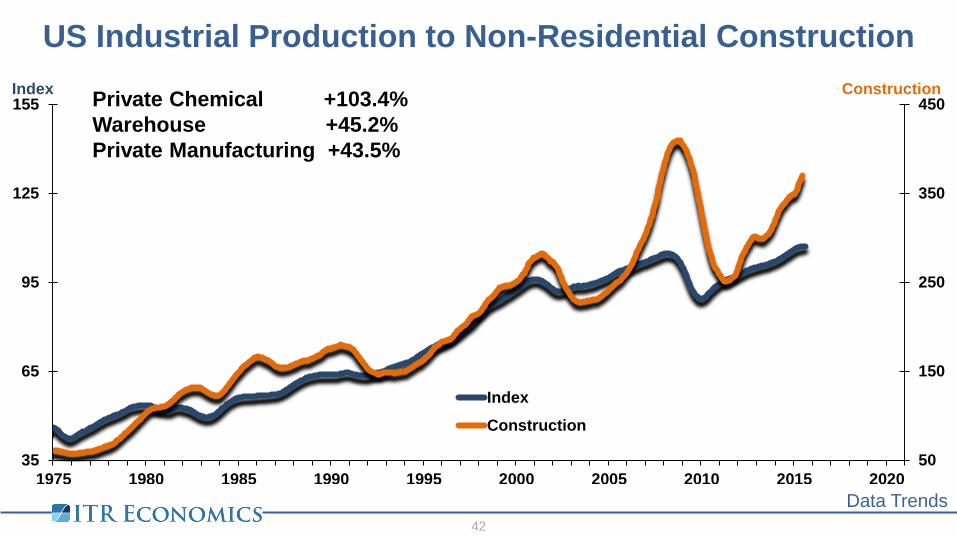
US Industrial Production to Non-Residential Construction
42
Private Chemical +103.4% Warehouse +45.2% Private Manufacturing +43.5%
Data Trends
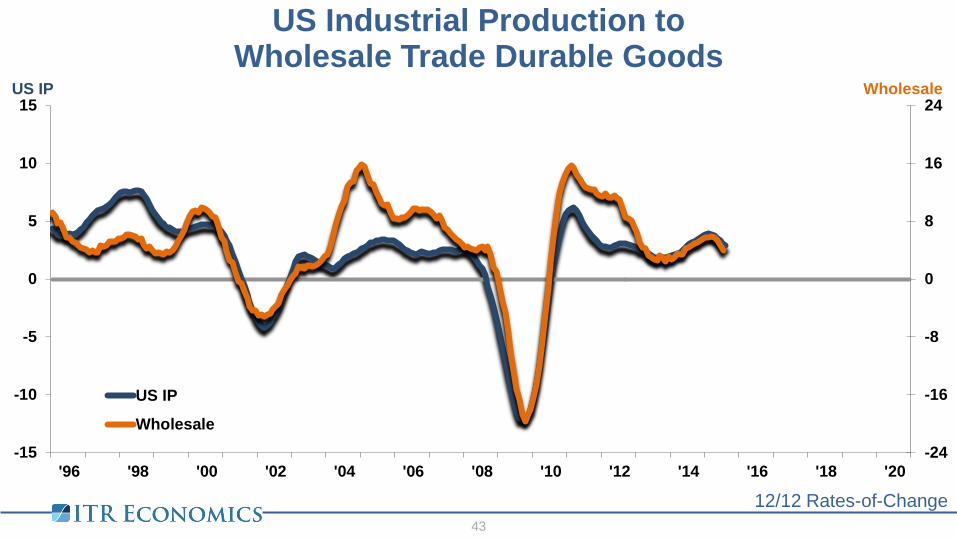
Page 43
US Industrial Production to Wholesale Trade Durable Goods
12/12 Rates-of-Change 43
-24
-16
-8
0
8
16
24
-15
-10
-5
0
5
10
15
'96 '98 '00 '02 '04 '06 '08 '10 '12 '14 '16 '18 '20
Wholesale US IP
US IP
Wholesale
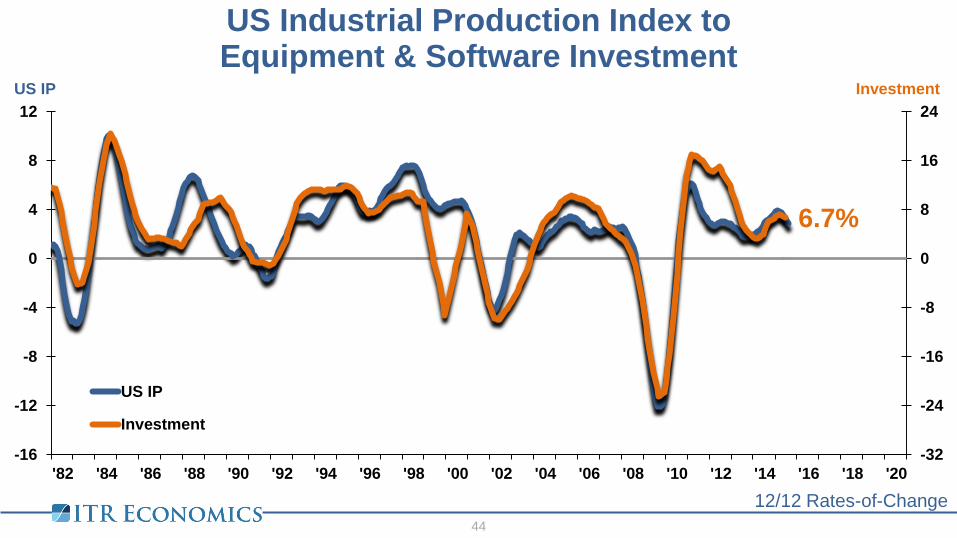
Page 44
US Industrial Production Index to Equipment & Software Investment
12/12 Rates-of-Change 44
6.7%
-32
-24
-16
-8
0
8
16
24
-16
-12
-8
-4
0
4
8
12
'82 '84 '86 '88 '90 '92 '94 '96 '98 '00 '02 '04 '06 '08 '10 '12 '14 '16 '18 '20
Investment US IP
US IP
Investment
Page 45
60.4% 59.9% 58.2% 57.0% 51.5% 49.2% 44.7% 40.0% 32.9% 26.9%
0%
10%
20%
30%
40%
50%
60%
70%
2005 2006 2007 2008 2009 2010 2011 2012 2013 2014
U.S. Dependence on Foreign Oil Declining Net imports as a share of domestic consumption
45
Data Source: Energy Information Administration
Page 46
FRED IP Manufacturing
46
1. Near –Sourcing 2. Technology 3. Capital vs. Labor 4. Energy 5. Consumer base
Page 47
Apple Rolls Royce AT&T Yamaha Honda Ford Michelin Lenovo K’Nex Wham-O Airbus MERCK
Bayer Chemical Toshiba Braun Caterpillar Toyota NCR
GE Flextronics OTIS NCR Siemens SKF
CHOBANI Boeing FAGE
USA Manufacturing Wall of Fame
47
Page 48
Wall of Fame – page 2
48
Coleman GM Mercedes-Benz Yokohama LuckyBrand Ashley Furniture SentrySafe MARS Navistar
Heinz little tikes Otter Box Whirlpool KitchenAid’ Samsung
Brooks Brothers DeWalt Master Lock
Armstrong Dow Intel Nissan
USA Manufacturing Wall of Fame
Page 49
US Industrial Production to Gross Domestic Product
-6.8%
-2.9% -5.7%
-15.3%
1.3%
-16
-12
-8
-4
0
4
8
12
-16
-12
-8
-4
0
4
8
12
'82 '84 '86 '88 '90 '92 '94 '96 '98 '00 '02 '04 '06 '08 '10 '12 '14 '16 '18 '20
GDP US IP
GDPUS IP
Year-over-Year, Quarter-to-Quarter (3/12) 49
Page 50
The next Great Depression is coming.
Are you ready?
Order your copy today from Barnes & Noble.
Available in e-book and print format.
50
Page 51
ITR Management Objectives™ Preparing for the Rise Ahead
51
1. Budget for the rise…do you have enough….
2. Invest in customer market research to reduce price sensitivity
3. Make sure your training and retention programs are top notch
4. Marketing and advertising spending increasingly effective
5. Drive efficiencies with technology
6. Hire sales people and leaders
7. Lock in costs toward the end of 2015
8. Expand credit offerings to garner market share
9. What are you going to do to avoid 2019?
Page 52
It’s About YOU! YOUR RISK,
YOUR PROFITABILITY
[email protected] 603.796.2500
FREE Consultation Contact us Today!
52