32
BAJAJ FINANCE LIMITED Q1 FY18 Presentation 19 July 2017

BAJAJ FINANCE LIMITED Q1 FY18 Presentation
19 July 2017
PRESENTATION PATH• Bajaj group structure 3
• Bajaj Finserv group - Executive summary 4
• What do we stand for 5
• Key strategic differentiators 6
• Bajaj Finance Shareholder profile 7
• Financial snapshot 8
• Bajaj Finance Limited product suite 9
• Executive summary 10
• Customer franchise 12
• Key portfolio metrics 13
• Strong distribution reach 14
• Key performance highlights for Q1 FY18 15
• Other updates for Q1 FY18 16
• Financial statement summary 17
• Financial performance trends Q1 FY18 18
• Credit quality Portfolio composition 21
• Credit quality Provisioning coverage 24
• Disclaimer 25
• Annexures 27

BAJAJ GROUP STRUCTURE
3
Above shareholding is as of 30 June 2017*W.e.f Nov 2014 . Bajaj Housing Finance Limited has a 100% subsidiary named Bajaj Financial Securities Limited which does not have any operations
Bajaj Holdings and Investment Limited
(Listed)
Bajaj Auto Limited
(Listed)
Bajaj Finserv Limited
(Listed)
Bajaj Finance Limited
(Listed)
*Bajaj Housing FinanceLimited
Bajaj Allianz life Insurance Company Limited
Bajaj Allianz General Insurance Company Limited
1. 49.30% holding through promoter holding company and promoter group
2. 58.35% holding through promoter holding company and promoter group
3. 57.94% holding through promoter holding company and promoter group
Auto Business Arm Financial Services Arm
31.54% 39.16%
57.80% 74%
100%
Lending Protection and Retiral
1 2
3 74%

BAJAJ FINSERV GROUP - EXECUTIVE SUMMARY
4
2nd largest private General insurer in India as of FY17
Offers a wide range of General insurance products across retail and corporate segments
Highest profit after tax among private players in FY17. ROE of 23% in FY17
Combined ratio of 96.8% in FY17
Recognized in the market for claims servicing
FY17 PAT of ₹ 728 crores
Amongst top 5 private players as of FY17 on new business
Deep pan India distribution reach
Diversified distribution mix consisting of agency, bancassurance, other partners, direct etc.
AUM of over 49K crores as of FY 17
Net worth of ₹ 8,476 cr as of 31st March 2017
One of the most profitable private life insurers in India.
FY17 PAT of ₹ 836 Crs
A 30 year old non bank finance company
Diversified Consumer, SME, Rural & Commercial lender in India
Credit rating is AAA/Stable by CRISIL, India Ratings, CARE Ratings and ICRA
Credit rating for Short Term Debt Program is A1+ by CRISIL, ICRA & India Ratings
339 consumer branches and 560 rural locations with over 41,000+ distribution points
Large customer franchise of 21.69 MM
10.03 MM new loans acquired in FY17
Bajaj Finserv is the financial services arm of the Bajaj group with business interest in
Bajaj Allianz General Insurance Company
Bajaj Allianz Life Insurance Company
Bajaj Finance Limited
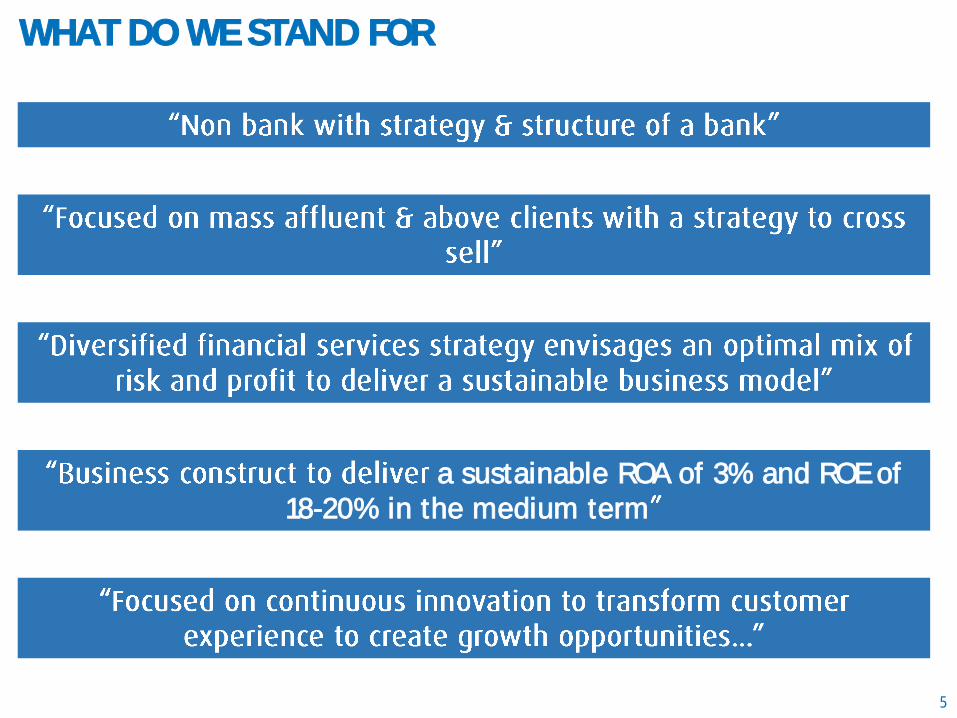
WHAT DO WE STAND FOR
5
a sustainable ROA of 3% and ROE of 18-20% in the medium term

KEY STRATEGIC DIFFERENTIATORS
6
Part of the Bajaj Group one of the oldest & most respected business houses
A trusted brand with strong brand equity
Focus on mass affluent and above clients Overall franchise of 21.69 MM and Cross sell client base of 12.19 MM
Strong focus on cross selling assets, insurance and wealth products to existing customer
Consumer PPC of 3.01 and SME PPC of 4.93 vs corresponding Consumer PPC of 2.88 and SME PPC of 3.76 last year
Diversified lending strategy AUM mix for Consumer : SME : Commercial : Rural stood at 46% : 34% : 14% : 6%
Highly agile & highly innovative Continuous improvements in product features and digital technologies to maintain competitive edge
Deep investment in technology and analytics Has helped establish a highly metricised company and manage risk & controllership effectively
7
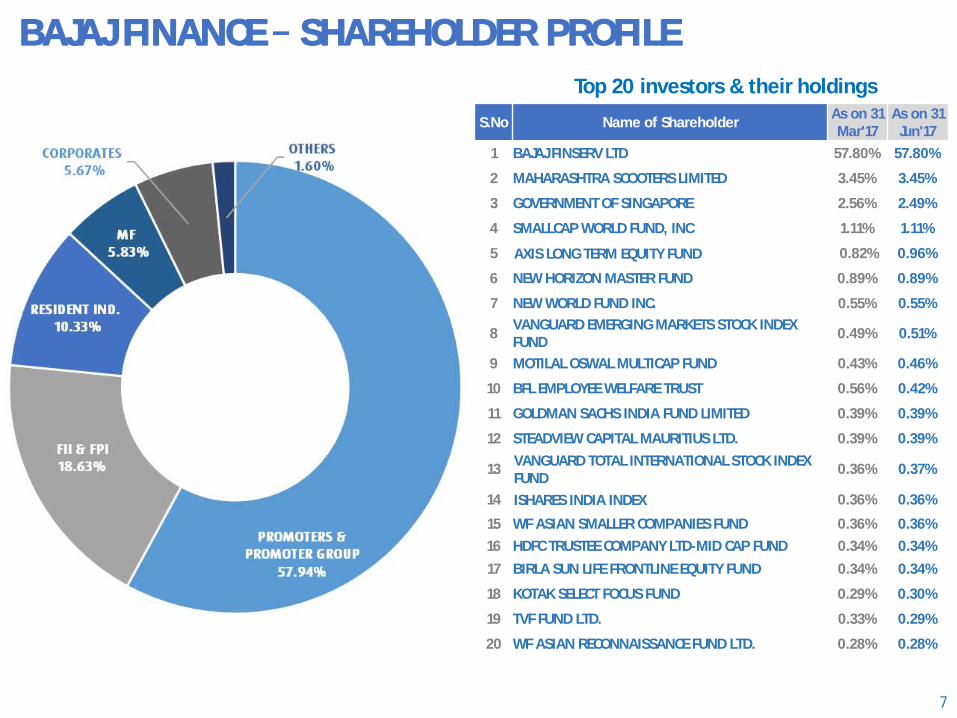
BAJAJ FINANCE SHAREHOLDER PROFILE
Top 20 investors & their holdings
S.No Name of ShareholderAs on 31 Mar'17
As on 31 Jun'17
1 BAJAJ FINSERV LTD 57.80% 57.80%
2 MAHARASHTRA SCOOTERS LIMITED 3.45% 3.45%
3 GOVERNMENT OF SINGAPORE 2.56% 2.49%
4 SMALLCAP WORLD FUND, INC 1.11% 1.11%
5 AXIS LONG TERM EQUITY FUND 0.82% 0.96%
6 NEW HORIZON MASTER FUND 0.89% 0.89%
7 NEW WORLD FUND INC. 0.55% 0.55%
8VANGUARD EMERGING MARKETS STOCK INDEX FUND
0.49% 0.51%
9 MOTILAL OSWAL MULTICAP FUND 0.43% 0.46%
10 BFL EMPLOYEE WELFARE TRUST 0.56% 0.42%
11 GOLDMAN SACHS INDIA FUND LIMITED 0.39% 0.39%
12 STEADVIEW CAPITAL MAURITIUS LTD. 0.39% 0.39%
13VANGUARD TOTAL INTERNATIONAL STOCK INDEX FUND
0.36% 0.37%
14 ISHARES INDIA INDEX 0.36% 0.36%
15 WF ASIAN SMALLER COMPANIES FUND 0.36% 0.36%
16 HDFC TRUSTEE COMPANY LTD-MID CAP FUND 0.34% 0.34%
17 BIRLA SUN LIFE FRONTLINE EQUITY FUND 0.34% 0.34%
18 KOTAK SELECT FOCUS FUND 0.29% 0.30%
19 TVF FUND LTD. 0.33% 0.29%
20 WF ASIAN RECONNAISSANCE FUND LTD. 0.28% 0.28%

FINANCIAL SNAPSHOT
8
As per the RBI regulations, NBFCs were required to transition to 150 dpd by March 2016 and 120 dpd by March 2017. Hence NPA numbers are not comparable*The net NPA & provisioning coverage numbers for FY16 are at 150 days over-due while the same for previous years are at 180 days over-due**The net NPA & provisioning coverage numbers for FY17 are at 120 days over-due^ EPS numbers adjusted for bonus and split
*^
YoY
Assets under management 2,478 2,539 4,032 7,573 13,107 17,517 24,061 32,410 44,229 60,194 36% 43%
Income from operations 503 599 916 1,406 2,172 3,110 4,073 5,418 7,333 10,003 36% 39%
Interest expenses 170 164 201 371 746 1,206 1,573 2,248 2,927 3,803 30% 41%
Net Interest Income (NII) 332 435 715 1,035 1,426 1,904 2,500 3,170 4,406 6,200 41% 38%
Operating Expenses 193 220 320 460 670 850 1,151 1,428 1,898 2,564 35% 33%
Loan Losses & Provision 109 164 261 205 154 182 258 385 543 818 51% 25%
Profit before tax 30 51 134 370 602 872 1,091 1,357 1,965 2,818 43% 66%
Profit after tax 21 34 89 247 406 591 719 898 1,279 1,837 44% 65%
Ratios FY08 FY09 FY10 FY11 FY12 FY13 FY14 FY15 FY16 FY17
Opex to NII 58.1% 50.6% 44.8% 44.4% 47.0% 44.6% 46.0% 45.0% 43.1% 41.4%
Return on assets 0.9% 1.4% 2.8% 4.4% 4.2% 4.1% 3.6% 3.3% 3.5% 3.7%
Return on equity 2.0% 3.2% 8.0% 19.7% 24.0% 21.9% 19.5% 20.4% 20.9% 21.6%
Earning per share (Basic) - ` 0.56 0.93 2.42 6.75 11.08 13.57 14.48 17.99 24.23 34.01
Net NPA 7.05% 5.50% 2.20% 0.80% 0.12% 0.19% 0.28% 0.45% *0.28% **0.44%
NPA provisioning coverage 29% 32% 55% 79% 89% 83% 76% 71% 77% 74%
FY17CAGR
(10 years)
` in Crs
Financials snapshot FY09 FY10 FY11 FY12 FY13 FY14 FY15 FY16FY08

BAJAJ FINANCE LIMITED PRODUCT SUITE
9Available through Digital channels as well
Bajaj Finance Limited
Consumer Lending
Small Business Lending
Commercial Lending
Rural Lending
DepositsPartnerships & Services
Co-Branded Credit Cards
Property SearchServices
Consumer Financial FitnessReport
SME Financial Fitness
Report
Auto Component Vendor Financing
Large Value Lease Rental Discounting
Securities Lending
Developer Finance
Retail term deposits
Life Insurance Distribution
Corporate term deposits
Loans Against Property
Lease Rental Discounting
Business Loans
Home Loans for Self Employed
Professional Loans
Consumer Durable Financing
2W & 3W vehicle Financing
EMI Card
Home Loans for Salaried
Personal Loans to Salaried
Digital Product Financing
Lifestyle Product Financing
Gold Loans
Personal Loans cross sell
Business Loans
Consumer Durable Financing
Property FitnessReport
Mutual Fund Distribution
Financial Institutions Lending Business
Professional Loans
Loans Against Property
Light Engineering Business
Corporate Finance Business
Personal Loans Cross Sell
E-commerce Consumer Finance
EMI card Retail finance
Urban gold loans
Digital Product Financing
Salaried Personal Loans
Warehouse Receipt Financing
General Insurance Distribution

EXECUTIVE SUMMARY
10
Bajaj Finance
• 30 year old non bank with a demonstrated track record of profitability
• Focused on Consumer, Rural, SME & Commercial lines of businesses
• Portfolio mix for Consumer : SME : Commercial : Rural stands at 46% : 34% : 14% : 6%
• Strategic business unit organization design supported by horizontal common utility support functions to drive domain expertise, scalability and operating leverage
• Strategy is to focus on cross sell, customer experience and product & process innovations to create a differentiated & profitable business model
• The company has ₹ 68,883 Crs of Assets under Management with a net NPA of 0.53% at 90 daysoverdue and a capital adequacy of 20.15% as of 30 Jun 2017. The company in Q1 FY18 has delivered a post tax profit of ₹ 602 Crs which is a 42% growth at an ROA1 of 1.0% and ROE1 of 6.1%
Consumerbusiness
• Two wheeler financing business cwheeler sales and disbursed 159K accounts in Q1FY18. Three wheeler financing business currently contributes to 28%of three wheeler sales and disbursed 14K account in Q1FY18
• Present in 339 locations with 33,000+ active distribution point of sale
• Largest consumer electronics, digital products & furniture lender in India, focused on affluent consumers
• Amongst the largest personal loan lenders in India
• EMI (Existing Membership Identification) Card franchise crossed 9.8* MM cards (CIF)
• Amongst the largest new loans acquirers in India (3.77 MM in Q1 FY18)
Ruralbusiness
• Highly diversified lender in the rural eco system offering 8 products in consumer and MSME business categories with a unique hub and spoke business model
• Geographic presence across 560 towns and villages and retail presence across 5,900+ stores1 Not Annualised * Includes EMI Card, and Virtual EMI cards

SME Business
• Focused on high net worth SMEs with an average annual sales of ₹ 15 Crores with established financials & demonstrated borrowing track records
• Offer a range of working capital & growth capital products and mortgage (Loan against property, Lease Rental Discounting & Home Loans) products to SME & self employed professionals
•
• Built a dedicated SME Relationship Management channel to provide wide range of cross sell products to our SME franchise
• Retail mortgage product strategy is to sell to existing customers only
Commercialbusiness
• Offer wholesale lending products covering short, medium and long term needs of Auto component & light engineering vendors and financial institutions in India
• Offer a range of structured products collateralized by marketable securities or mortgage
Treasury • Strategy is to create a balanced mix of wholesale and retail borrowings
• stood at ₹ 53,569 Crs with a mix of 32 : 58 : 10 between banks, money markets and deposits
Credit Quality
• Gross NPA of 1.70% & Net NPA of 0.53% as of 30 Jun 2017 at 90 DPD. The company has moved its NPA recognition policy from 120 days overdue to 90 days overdue. The comparable GNPA andNNPA stood at 1.44% and NNPA of 0.42% as of 30 Jun 2017 vs GNPA 1.47% & NNPA of 0.41% as of 30th June 2016
• Provisioning coverage ratio stands at 69% as of 30 Jun 2017
CreditRating
• Credit rating for Long Term Debt Program is AAA/Stable by CRISIL, ICRA, CARE & India Ratings
• Credit rating for Short Term Debt Program is A1+ by CRISIL, ICRA & India Ratings
• Credit rating for FD program is FAAA/Stable by CRISIL & MAAA (Stable) by ICRA
EXECUTIVE SUMMARY (CONTD.)
11

CUSTOMER FRANCHISE
12Growing customer cross sell franchise by 25-
Q1 FY1711,10,102
Q2 FY17
8,27,413
Q3 FY17
11,74,444
Q4 FY17
9,56,224
Jun 2017
Total Franchise
Credit segment filter
Overall Cross sell franchise
Non delinquent customers
Cross sell franchise
15.79 million
21.69 million
15.04 million
Jun 2016
17.18 million
11.88 million
11.24 million
13.91 million
12.19 million
10.15 million
9.24 million
Q1 FY18
15,58,612

13
KEY PORTFOLIO METRICS
*Includes 2,021 Crs of IPO Financing
Business Segment AUM (₹ Crore) Disb. No. of
AccountsIRR (%) Ticket
(Lacs)Q1 FY17 Q1 FY18 YoY Q1 FY17 Q1 FY18 YoY Range
Consumer Businesses
1. 2W & 3W finance 4,080 5,215 28% 1,059 1,078 2% 173,605 22.0-26.0 0.58
2. Consumer durable finance 6,783 7,974 18% 5,020 6,039 20% 22,61,873 23.0-25.0 0.27
3. Digital product finance 816 1,217 49% 646 1,081 67% 527,390 23.0-25.0 0.20
4. Lifestyle product finance 386 513 33% 235 319 36% 65,565 23.0-25.0 0.46
5. Retail EMI & Ecommerce - 604 - - 579 - 2,04,537 23.0-25.0 0.10-0.27
6. Personal loans cross sell 4,392 6,962 59% 997 1,537 54% 97,397 16.0-26.0 1.49
7. Salaried personal loans 2,764 3,877 40% 656 1,063 62% 15,678 14.0-16.0 5.5-6.0
8. Salaried Home Loans 1,786 3,268 83% 386 673 74% - 8.5-9.5 37
9. BFS Direct (HL, PL) 721 1,604 122% 244 445 82% - - -
SME Businesses
10. Business loans (BL) 4,866 5,990 23% 1,344 1,299 (3%) 10,293 17.0-20.0 11-14
11. Professional loans 1,265 2,057 63% 371 661 78% 4,974 14.0-17.0 11-14
12. Loan against property (LAP) 8,661 8,582 (1%) 1,132 1,561 38% - 10.50 90-110
13. Self employed Home Loans 3,286 3,970 21% 557 964 73% - 8.8-10.5 55-65
14. RM Business 2,136 2,349 10% 504 280 (44%) - - -
Commercial Businesses
15. Securities lending 2,975 6,127* 106% - - - - 10.0-11.5 -
16. Vendor financing 1,545 2,014 30% - - - - 10.0-12.5 -
17. Financial institutions group 433 707 63% 20 105 425% - 9.5-12.0 -
18. Corporate finance 459 647 41% 120 190 58% - 10.0-12.0 -
19. Infrastructure lending Exited Infra portfolio by selling down its largest exposure and paydown by one of the largest accounts
Rural Business
20. Rural lending 1,688 3,916 132% 795 1,627 105% 3,70,985 14.0-26.0 -

STRONG DISTRIBUTION REACH
14
91 57 91114 80 70184161 119
232
393
193262
397
590
318 296
538
856
339 366
560
926
Consumer SME Rural Total
Geographic presence
FY13 FY14 FY15 FY16 FY17 FY18*
3,500+ 4,900 + 7,000+ 9,400 +14,000 + 14,000+
850 +1,600 +
2,650 +
5,200 +
5,900 + 7,500+
1,150+
3,200+
3,900+4,000+
5,600+8,000+
2,600+2,600+
3,000+
3,000+
3,200+
3,000+
1,500+
3,200+
5,500+
5,900+191
256
FY13 FY14 FY15 FY16 FY17 FY 18*
Active distribution Points of sale
Gold Loan Rural 2W -Dealer/ASCs REMI Lifestyle Digital CD
7,000+9,000+
16,000+
24,000+
38,000+
41,000+

KEY PERFORMANCE HIGHLIGHTS FOR Q1 FY18
15
• Customer franchise as of 30 Jun 2017 26% to 21.69 million from 17.18 million as of 30 Jun 2016. During thequarter, the company acquired 1.56 MM new customers
• New loans booked during Q1 FY18 48% to 37,71,392 from 25,40,540 in Q1 FY17
• AUM as of 30 Jun 2017 was 39% to ₹ 68,883 Crs from ₹ 49,608 Crs as of 30 Jun 2016. AUM as of 30 Jun 2017Includes 2,021 Crore of IPO financing. Adjusted for this AUM would have grown by 35%
• Total income for Q1 FY18 39% to ₹ 3,165 Crs from ₹ 2,282 Crs in Q1 FY17
• Loan losses and provisions for Q1 FY18 were ₹ 286 Crs as against ₹ 180 Crs in Q1 FY17. During the quarter, thecompany took an additional charge of ₹ 42 Crs across its consumer and infrastructure finance businesses.Adjusted for this additional charge loan loss & provisions were ₹ 244 Crs, and have grown 36%.
• Profit after tax for Q1 FY18 42% to ₹ 602 Crs from ₹ 424 Crs in Q1 FY17
• Return on Assets and Return on Equity for Q1 FY18 were 1.0% and 6.1% respectively
• Gross NPA and Net NPA as of 30 Jun 2017 stood at 1.70% and 0.53% respectively. The provisioning coverageratio stood at 69% as of 30 Jun 2017. During the quarter, as required by RBI guidelines, the company hasmoved its NPA recognition policy from 120 days overdue to 90 days overdue. The comparable GNPA and NNPAat 120 days overdue stood at 1.44% and NNPA of 0.42% as of 30 Jun 2017 vs GNPA 1.47% & NNPA of 0.41% asof 30th June 2016
• Capital adequacy ratio (including Tier II capital) as of 30 Jun 2017 stood at 20.15%. Tier I capital stood at14.20%. During the quarter, the company raised ₹ 600 Crs by way of Tier II bonds to augment its capital base.

OTHER UPDATES FOR Q1 FY18
16
• Deposit book crossed a milestone of ₹ 5,000 crore and stood at ₹ 5,095 crore as of 30 June 2017 at 10% ofoverall borrowings book. Retail deposit average size is at 2.93 lacs with weighted tenor of 33 months
• During the quarter, the Company received AAA rating from ICRA. The company has now AAA rating fromCRISIL, ICRA, CARE & India Ratings
• During the quarter, the operations have been certified with CMMi SVC Level 3 (CMMi for Services).Capability Maturity Model Integration (CMMi) is best practice model for operations which has been developedby Carnegie Mellon University (USA) and administered by CMMi institute (USA)
• The Company has been ranked as one of the Company to Work in India, for the fifth year in a row byGreat Places to Work Institute.
• The Board of Directors has approved, subject to the approval of shareholders, issue of securities for anaggregate amount up to ₹ 4,500 crore through Qualified Institutional Placement to Qualified InstitutionalBuyers in accordance with SEBI (Issue of Capital and Disclosure Requirements) Regulations, 2009

FINANCIAL STATEMENT SUMMARY
17* Not annualized
Financials snapshot Q1'17 YoY FY'17 FY'16 YoY FY'15
Assets under finance (AUF) 65,121 47,923 36% 56,832 42,756 33% 31,199
Assets under management (AUM) 68,883 49,608 39% 60,194 44,229 36% 32,410
Total Interest & fee Income 3,165 2,282 39% 10,003 7,333 36% 5,418
Interest expenses 1,078 883 22% 3,803 2,927 30% 2,248
Net Interest Income (NII) 2,087 1,399 49% 6,200 4,406 41% 3,170
Operating Expenses 876 567 54% 2,564 1,898 35% 1,428
Loan Losses & Provision 286 180 59% 818 543 51% 385
Profit before tax 925 652 42% 2,818 1,965 43% 1,357
Income tax 323 228 42% 981 686 43% 459
Profit after tax 602 424 42% 1,837 1,279 44% 898
Ratios Q1'17 FY'17 FY'16 FY'15
Total Opex to NII 42.0% 40.5% 41.4% 43.1% 45.0%
Total Opex to Total Income 27.7% 24.8% 25.6% 25.9% 26.4%
Loan loss to AUF* 0.4% 0.4% 1.4% 1.3% 1.2%
Return on Average AUF* 1.0% 0.9% 3.7% 3.5% 3.3%
Earning per share - Basic (Rs.) * 11.0 7.9 34.0 24.2 18.0
Return on Average Equity * 6.1% 5.5% 21.6% 20.9% 20.4%
₹ in Crores

39% YoY
FINANCIAL PERFORMANCE TRENDS Q1 FY18
18
Revenue (` Crore)
AUM (` Crore)
Net Interest Income (NII) (` Crore) 49% YoY
48% YoY 39% YoY
* Q1 FY18 AUM Includes 2,021 Crore of IPO financing. Adjusted for this AUM would have grown by 35%
*

FINANCIAL PERFORMANCE TRENDS Q1 FY18
19
Operating expenses % of NII
Net NPA & Provisioning coverage**
Loan loss provision (₹ Crore)*
Profit Before Tax (` Crore)
**The net NPA & provisioning coverage numbers from Q1 FY178 are at 90 days over-dues while the same for previous quarters are at 120 days over-due.
59% YoY
42% YoY
*In Q1FY18 Company took an additional charge of ₹42 crore across its consumer and infrastructure finance businesses. Adjusted for this additional charge, loan losses and provisions were ₹244 crore and have grown 36%

Earnings per share Basic (₹)
FINANCIAL PERFORMANCE TRENDS Q1 FY18
20
Capital adequacy ratio 40% YoY

CREDIT QUALITY PORTFOLIO COMPOSITION
21
CD loan portfolio Two & Three wheeler loan portfolio
Lifestyle finance loan portfolio Digital product finance loan portfolio
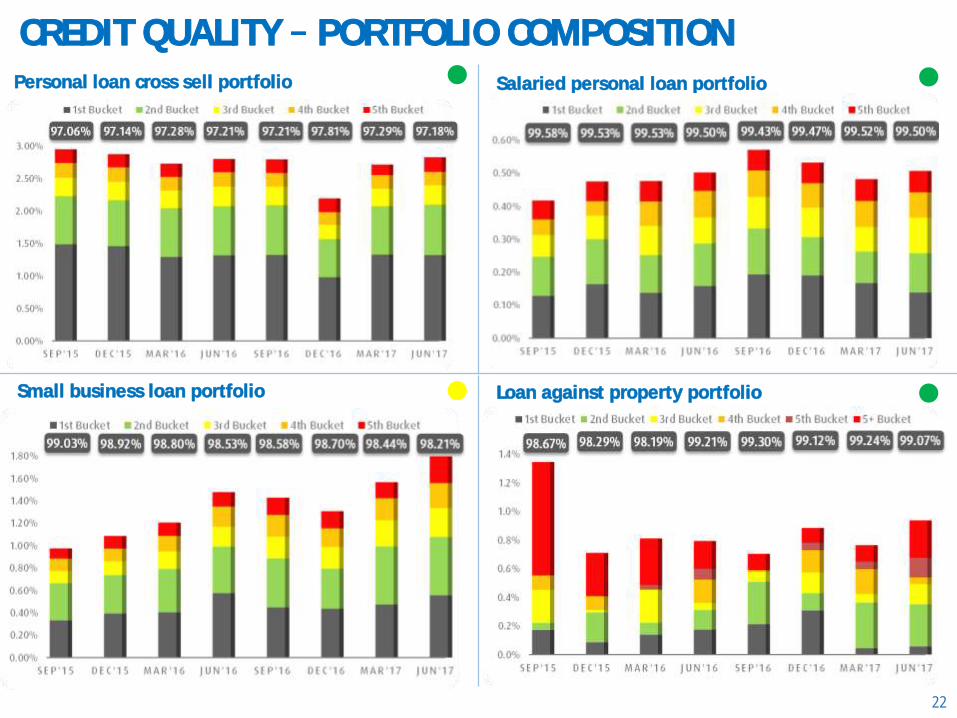
CREDIT QUALITY PORTFOLIO COMPOSITION
22
Small business loan portfolio
Personal loan cross sell portfolio Salaried personal loan portfolio
Loan against property portfolio

CREDIT QUALITY PORTFOLIO COMPOSITION
23
Home loans portfolio Rural Lending portfolio

CREDIT QUALITY PROVISIONING COVERAGE
24
PCR Provisioning Coverage Ratio
Business Segment (Values in ₹ Crs)
AUM(Crs.)
GNPA(Crs.)
NNPA PCR (%) GNPA NNPA
Consumer Business 31,468 711 201 72% 2.26% 0.65%
SME Business 23,410 390 139 64% 1.91% 0.69%
Commercial Business 10,089 5 4 34% 0.05% 0.04%
Rural Business 3,916 29 8 72% 0.75% 0.21%
Bajaj Finance 68,883 1,136 352 69% 1.70% 0.53%
DISCLAIMER
25
This presentation has been prepared by and is the sole responsibility of Bajaj Finance Limited (together with its subsidiaries, referred to as the Company or
. By accessing this presentation, you are agreeing to be bound by the trailing restrictions.
This presentation does not constitute or does not intend to constitute or form part of any offer or invitation or inducement to sell, or any solicitation of any
offer or recommendation to purchase, any securities of the Company, nor shall it or any part of it or the fact of its distribution form the basis of, or be relied
on in connection with, any contract or commitment therefor. In particular, this presentation is not intended to be a prospectus or offer document under the
applicable laws of any jurisdiction, including India. No representation or warranty, express or implied, is made as to, and no reliance should be placed on, the
fairness, accuracy, completeness or correctness of the information or opinions contained in this presentation. Such information and opinions are in all events
not current after the date of this presentation. There is no obligation to update, modify or amend this communication or to otherwise notify the recipient if
information, opinion, projection, forecast or estimate set forth herein, changes or subsequently becomes inaccurate. However, the Company may alter,
modify or otherwise change in any manner the content of this presentation, without obligation to notify any person of such change or changes.
These materials are being given solely for your information and may not be copied, reproduced or redistributed to any other person in any manner. The
distribution of these materials in certain jurisdictions may be restricted by law and persons into whose possession these materials comes should inform
themselves about and observe any such restrictions. Certain statements contained in this presentation that are not statements of historical fact constitute
-looking statements. You can generally identify forward-looking statements by terminology such as
or other
words or phrases of similar import. These forward-looking statements involve known and unknown risks, uncertainties, assumptions and other factors that
may cause the actual results, performance or achievements to be materially different from any future results, performance or achievements
expressed or implied by such forward-looking statements or other projections. Important factors that could cause actual results, performance or
achievements to differ materially include, among others: (a) material changes in the regulations governing the businesses; (b) the Company's
ability to comply with the capital adequacy norms prescribed by the RBI; (c) decreases in the value of the Company's collateral or delays in enforcing the
Company's collateral upon default by borrowers on their obligations to the Company; (d) the Company's ability to control the level of NPAs in the Company's
portfolio effectively; (e) internal or external fraud, operational errors, systems malfunctions, or cyber security incidents; (f) volatility in interest rates and
other market conditions; and (g) any adverse changes to the Indian economy.
This presentation is for general information purposes only, without regard to any specific objectives, financial situations or informational needs of any
particular person. The information contained in this presentation is only current as of its date and the Company does not undertake any obligation to update
the information as a result of new information, future events or otherwise.
BAJAJ FINANCE LIMITED Q1 FY18 Presentation
THANK YOU

ANNEXURES
27

GLOSSARY2W Two Wheeler IIP Index of Industrial Production
3W Three Wheeler IRR Internal Rate of Return
ACMF Auto Components Manufacturer Financing LAP Loan Against Property
AR Assets Receivable LAS Loan Against Securities
ARU Activation, Retention & Usage MF Mutual Fund
ASC Authorized Service Centers MM Million
AUF Assets Under Finance MSME Micro, Small & Medium Enterprise
AUM Assets Under Management NII Net Interest Income
B2B Business to Business NNPA Net Non Performing Assets
B2C Business to Customer NTB New to Bajaj Finance
BL Business Loan Opex Operating Expenses
CAGR Compounded Annual Growth Rate PAT Profit After Tax
CIF Cards in Force PBT Profit Before Tax
CPI Consumer Price Index POS Point of Sale
EMI Existing Member Identification PPC Products Per Customer
EPS Earnings Per Share RBI Reserve Bank of India
FIG Financial Institutions Group ROA Return on Assets
FII Foreign Institutional Investor ROE Return on Equity
FPI Foreign Portfolio Investment SME Small & Medium Enterprise
GNPA Gross Non Performing Assets TAT Turn Around Time
HL Home Loan TTD Through the Door
IFA Independent Financial Advisor WPI Wholesale Price Index

Product Per Customer (PPC)
29
Product per Customer (PPC) is a measure of cumulative products bought by a customer over vintages
* Base product is included in the PPC calculation
* PPC does not include short tenor & renewable loans (viz. PO, LAS & Retailer finance), TW, infra and Rural lending sourcing
Products offered
PPCBenchmark
PPC(12 MOB)
PPC(18 MOB)
PPC(24 MOB)
16 3 2.42* 2.74* 3.01*
Products offered
PPCBenchmark
PPC(12 MOB)
PPC(18 MOB)
PPC(24 MOB)
14 5 4.98* 5.06* 4.93*
Retail
Product offerings Retail
Loan Products
- Consumer durable finance, Digital finance,
Lifestyle finance, Personal Loan, Salaried Personal
Loans, Salaried Home Loans
Fee Products
EMI Card, Credit Card, EMI Card Preferred, Life
Insurance, Health Insurance, Mutual Fund, Fixed
Deposit, Extended Warranty Insurance, Credit Vidya,
Retail Financial Fitness report
Product offerings – SME
Loan Products
Business loans, Loan against property, Home
loans, Construction equipment loans, Securities
lending
Fee Products
EMI Card, EMI Card Preferred, Life Insurance,
Health Insurance, Mutual Fund, CRISIL ratings,
Property search services, Property fitness report,
SME financial fitness report
SME
Product Per Customer (PPC)
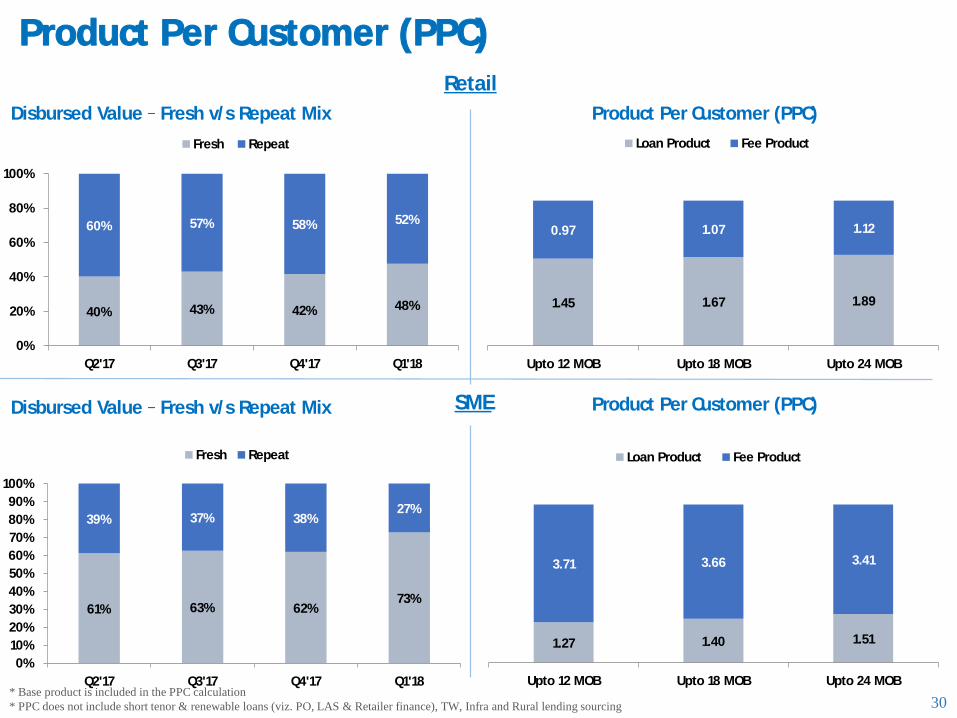
30
Retail
SME
Disbursed Value Fresh v/s Repeat Mix Product Per Customer (PPC)
Disbursed Value Fresh v/s Repeat Mix Product Per Customer (PPC)
* Base product is included in the PPC calculation
* PPC does not include short tenor & renewable loans (viz. PO, LAS & Retailer finance), TW, Infra and Rural lending sourcing
1.27 1.40 1.51
3.71 3.66 3.41
Upto 12 MOB Upto 18 MOB Upto 24 MOB
Loan Product Fee Product
1.45 1.67 1.89
0.97 1.07 1.12
Upto 12 MOB Upto 18 MOB Upto 24 MOB
Loan Product Fee Product
40% 43% 42% 48%
60% 57% 58% 52%
0%
20%
40%
60%
80%
100%
Q2'17 Q3'17 Q4'17 Q1'18
Fresh Repeat
61% 63% 62%73%
39% 37% 38%27%
0%
10%
20%
30%
40%
50%
60%
70%
80%
90%
100%
Q2'17 Q3'17 Q4'17 Q1'18
Fresh Repeat

31
ALM STRATEGY
Loan Book (` Crs) Behaviourilised ALM (` Crs)
Borrowings Jun ` 53,569 Crs) Borrowings Mar ₹ 49,250 Crs)

32
Consumer Finance provision coverage
Consumer Durables :
3-5 Bucket - 75%
Above 5 - 100%
2 and 3 Wheeler :
3 5 Bucket 40%
6 - 12 Bucket - 60%
Above 12 - 100%
Personal Loan Cross Sell :
3 - 5 Bucket - 75%
Above 5 - 100%
Salaried Personal Loan :
3 - 5 Bucket 75%
Above 5 - 100%
SME Finance
provision coverage
Home Loan / Loan against Property :
3-5 Bucket - 15%
6 12 Bucket - 25%
13-18 Bucket 40%
18-24 Bucket 60%
Above 24 - 100%
Unsecured Business & Professional Loans :
3-5 Bucket 75%
Above 5 100%
Commercial Lending provision coverage
6 12 Bucket 10%
12 18 Bucket 20%
18 24 Bucket 30%
Above 24 100%
Graded provision on secured portfolio
Securities Lending
Above 5 - 100%
Bajaj Finance provides a general provision of 0.40% on all standard assets (0.50% on Mortgages)
NPA PROVISIONING STANDARDS


