UNITED STATES SECURITIES AND EXCHANGE COMMISSION WASHINGTON, D.C. 20549 FORM 6-K REPORT OF FOREIGN ISSUER PURSUANT TO RULE 13a-16 OR 15d-16 UNDER THE SECURITIES EXCHANGE ACT OF 1934 For the six months ended June 30, 2016 Commission file number: 1-10110 BANCO BILBAO VIZCAYA ARGENTARIA, S.A. (Exact name of Registrant as specified in its charter) BANK BILBAO VIZCAYA ARGENTARIA, S.A. (Translation of Registrant’s name into English) Calle Azul, 4 28050 Madrid Spain (Address of principal executive offices) Ricardo Gómez Barredo Calle Azul, 4 28050 Madrid Spain Telephone number +34 91 537 7000 Fax number +34 91 537 6766 (Name, telephone, e-mail and /or facsimile number and address of Company contact person) Indicate by check mark whether the registrant files or will file annual reports under cover of Form 20-F or Form 40-F: Form 20-F X Form 40-F Indicate by check mark if the registrant is submitting the Form 6-K in paper as permitted by Regulation S-T Rule 101(b)(1): Yes No X Indicate by check mark if the registrant is submitting the Form 6-K in paper as permitted by Regulation S-T Rule 101(b)(7): Yes No X
Transcript
UNITED STATES SECURITIES AND EXCHANGE COMMISSION
WASHINGTON, D.C. 20549
FORM 6-K
REPORT OF FOREIGN ISSUER PURSUANT TO RULE 13a-16 OR 15d-16
UNDER THE SECURITIES EXCHANGE ACT OF 1934
For the six months ended June 30, 2016
Commission file number: 1-10110
BANCO BILBAO VIZCAYA ARGENTARIA, S.A. (Exact name of Registrant as specified in its charter)
BANK BILBAO VIZCAYA ARGENTARIA, S.A. (Translation of Registrant’s name into English)
Calle Azul, 4
28050 Madrid
Spain (Address of principal executive offices)
Ricardo Gómez Barredo
Calle Azul, 4
28050 Madrid
Spain
Telephone number +34 91 537 7000
Fax number +34 91 537 6766 (Name, telephone, e-mail and /or facsimile number and address of Company contact person)
Indicate by check mark whether the registrant files or will file annual reports under cover of Form 20-F or Form 40-F:
Form 20-F X Form 40-F
Indicate by check mark if the registrant is submitting the Form 6-K in paper as permitted by Regulation S-T Rule 101(b)(1):
Yes No X
Indicate by check mark if the registrant is submitting the Form 6-K in paper as permitted by Regulation S-T Rule 101(b)(7):
Other liabilities 90,117 483 1.08% 97,085 403 0.84%
Equity 55,135 - - 53,016 - -
Total average liabilities (2) 742,490 5,338 1.44% 661,606 3,570 1.09%
(1) Rates have been presented on a non-taxable equivalent basis.
(2) Foreign activity represents the 45.3% of the total average liabilities for the six months period ended June 30, 2016.
19
Changes in Net Interest Income-Volume and Rate Analysis
The following tables allocate changes in our net interest income between changes in volume and changes in rate
for the six months ended June 30, 2016 compared to the six months ended June 30, 2015 and for the six months
ended June 30, 2015 compared to the six months ended June 30, 2014. Volume and rate variance have been
calculated based on movements in average balances over the period and changes in interest rates on average interest-
earning assets and average interest-bearing liabilities. The only out-of-period items and adjustments excluded from
the following table are interest payments on loans which are made in a period other than the period in which they are
due. Loan fees were included in the computation of interest income.
For the Six Months Ended June 30, 2016/June 30, 2015
Increase (Decrease) Due to Changes in
Volume (1) Rate (1) (2) Net Change
(In Millions of Euros)
Cash and balances with central banks and other demand
deposits - 3 4
Securities portfolio and derivatives 27 584 611
Loans and advances to central banks 89 (53) 37
Loans and advances to credit institutions 5 38 43
Loans and advances to customers
In euros 185 (448) (263)
In other currencies 1,659 915 2,574
Other assets 15 17 32
Interest income 3,037
Deposits from central banks and credit institutions 97 244 341
Customer deposits
In euros 96 (242) (146)
In other currencies 268 1,186 1,454
Debt securities issued 56 (17) 38
Other liabilities (28) 108 80
Interest expense 1,768
Net interest income 1,269
(1) The volume effect is calculated as the result of the average interest rate of the earlier period multiplied by the difference
between the average balances of both periods. (2) The rate effect is calculated as the result of the average balance of the earlier period multiplied by the difference between the
average interest rates of both periods.
20
For the Six Months Ended June 30, 2015/June 30, 2014
Increase (Decrease) Due to Changes in
Volume (1) Rate (1) (2) Net Change
(In Millions of Euros)
Cash and balances with central banks and other demand
deposits 2 (2) -
Securities portfolio and derivatives 402 (631) (228)
Loans and advances to central banks (63) 15 (48)
Loans and advances to credit institutions 39 (69) (30)
Loans and advances to customers
In euros 226 (552) (326)
In other currencies 2,106 (1,838) 268
Other assets 10 18 29
Interest income (335)
Deposits from central banks and credit institutions 71 (140) (68)
Customer deposits
In euros 192 (587) (394)
In other currencies 349 (426) (77)
Debt securities issued 44 (153) (110)
Other liabilities 105 (161) (57)
Interest expense (706)
Net interest income 371
(1) The volume effect is calculated as the result of the average interest rate of the earlier period multiplied by the difference
between the average balances of both periods. (2) The rate effect is calculated as the result of the average balance of the earlier period multiplied by the difference between the
average interest rates of both periods.
Interest Earning Assets—Margin and Spread
The following table analyzes the levels of our average earning assets and illustrates the comparative gross and
net yields and spread obtained for each of the years indicated.
Six Months Ended June 30,
2016 (*) 2015 (*)
(In Millions of Euros, Except
Percentages)
Average interest earning assets 689,307 615,680
Gross yield(1) 3.99% 3.47%
Net yield(2) 3.70% 3.23%
Net interest margin (3) 2.43% 2.31%
Average effective rate paid on all interest-bearing liabilities 1.79% 1.40%
Spread(4) 2.19% 2.07%
(*) Ratios are annualized.
(1) Gross yield represents total interest income divided by average interest earning assets. (2) Net yield represents total interest income divided by total average assets. (3) Net interest margin represents net interest income as percentage of average interest earning assets. (4) Spread is the difference between gross yield and the average cost of interest-bearing liabilities.
21
ASSETS
Interest-Bearing Deposits in Other Banks
As of June 30, 2016, interbank deposits (excluding deposits with central banks) represented 3.93% of our total
assets. Of such interbank deposits, 24.5% were held outside of Spain and 75.5% in Spain. We believe that our
deposits are generally placed with highly rated banks and have a lower risk than many loans we could make in
Spain. However, such deposits are subject to the risk that the deposit banks may fail or the banking system of certain
of the countries in which a portion of our deposits are made may face liquidity or other problems.
Securities Portfolio
As of June 30, 2016, our total securities portfolio (consisting of investment securities and loans and receivables) was
carried on our consolidated balance sheet at a carrying amount (equivalent to its market or appraised value as of
such date) of €147,886 million, representing 19.8% of our total assets. €47,453 million, or 32.1%, of our securities
portfolio consisted of Spanish Treasury bonds and Treasury bills. The average yield for the six months ended June
30, 2016 on the investment securities that BBVA held was 4.0%, compared with an average yield of approximately
2.5% earned on loans and advances for the six months ended June 30, 2015. See Notes 10 and 12 to the Interim
Consolidated Financial Statements. For a discussion of our investments in affiliates, see Note 16 to the Interim
Consolidated Financial Statements. For a discussion of the manner in which we value our securities, see Notes 2.2.1
and 8 to the Interim Consolidated Financial Statements.
The following tables analyze the carrying amount and fair value of debt securities as of June 30, 2016 and
December 31, 2015, respectively. The trading portfolio is not included in the tables below because the amortized
costs and fair values of these items are the same. See Note 10 to the Interim Consolidated Financial Statements.
As of June 30, 2016
Amortized cost Fair Value (1) Unrealized Gains Unrealized Losses
(In Millions of Euros)
DEBT SECURITIES -
AVAILABLE FOR SALE PORTFOLIO
Domestic- 31,934 33,151 1,248 (31)
Spanish Government and other government
agencies debt securities 29,102 30,226 1,135 (11)
Other debt securities 2,832 2,925 113 (20)
Issued by Central Banks - - - -
Issued by credit institutions 1,357 1,419 63 -
Issued by other institutions 1,476 1,506 50 (20)
Foreign- 52,349 53,011 1,389 (727)
Mexico 11,577 11,706 279 (149)
Mexican Government and other government
agencies debt securities 9,597 9,748 232 (80)
Other debt securities 1,980 1,958 47 (69)
Issued by Central Banks - - - -
Issued by credit institutions 86 90 4 -
Issued by other institutions 1,894 1,867 43 (69)
The United States 14,952 14,895 125 (182)
U.S. Treasury and other U.S. government
agencies debt securities 1,288 1,296 12 (4)
States and political subdivisions debt
securities 6,103 6,140 47 (10)
22
Other debt securities 7,562 7,459 65 (168)
Issued by Central Banks - - - -
Issued by credit institutions 79 80 1 -
Issued by other institutions 7,483 7,379 64 (168)
Turkey 6,269 6,325 137 (81)
Turkey Government and other government
agencies debt securities 5,732 5,788 130 (74)
Other debt securities 537 537 7 (7)
Issued by Central Banks - - - -
Issued by credit institutions 475 476 6 (6)
Issued by other institutions 61 61 1 (1)
Other countries 19,551 20,085 848 (314)
Other foreign governments and other
government agencies debt securities 7,121 7,588 551 (84)
Other debt securities 12,430 12,497 297 (230)
Issued by Central Banks 1,911 1,912 1 -
Issued by credit institutions 3,290 3,348 137 (78)
Issued by other institutions 7,229 7,237 159 (151)
TOTAL AVAILABLE FOR SALE
PORTFOLIO 84,283 86,162 2,637 (758)
HELD TO MATURITY PORTFOLIO
Domestic- 9,899 10,051 152 -
Spanish Government and other
government agencies debt securities 9,227 9,377 150 -
Other domestic debt securities 672 674 2 -
Issued by Central Banks - - - -
Issued by credit institutions 515 516 2 -
Issued by other institutions 157 158 1 -
Foreign- 9,396 9,590 194 -
Foreign government and other
government agency debt securities 8,358 8,536 178 -
Other debt securities 1,038 1,054 17 -
TOTAL HELD TO MATURITY PORTFOLIO 19,295 19,641 346 -
TOTAL DEBT SECURITIES 103,578 105,803 2,983 (758)
(1) Fair values for listed securities are determined on the basis of their quoted prices at the end of the period. Fair values are
used for unlisted securities based on our estimates and valuation techniques. See Note 8 to the Consolidated Financial
Statements.
23
As of December 31, 2015
Amortized cost Fair Value (1) Unrealized Gains Unrealized Losses
(In Millions of Euros)
DEBT SECURITIES -
AVAILABLE FOR SALE PORTFOLIO
Domestic- 43,500 45,668 2,221 (53)
Spanish Government and other government
agencies debt securities 38,763 40,799 2,078 (41)
Other debt securities 4,737 4,869 144 (11)
Issued by Central Banks - - - -
Issued by credit institutions 2,702 2,795 94 -
Issued by other institutions 2,035 2,074 50 (11)
Foreign- 62,734 62,641 1,132 (1,226)
Mexico 12,627 12,465 73 (235)
Mexican Government and other government
agencies debt securities 10,284 10,193 70 (160)
Other debt securities 2,343 2,272 4 (75)
Issued by Central Banks - - - -
Issued by credit institutions 260 254 1 (7)
Issued by other institutions 2,084 2,019 3 (68)
The United States 13,890 13,717 63 (236) U.S. Treasury and other U.S. government
agencies debt securities 2,188 2,177 4 (15)
States and political subdivisions debt
securities 4,629 4,612 9 (26)
Other debt securities 7,073 6,927 50 (195)
Issued by Central Banks - - - -
Issued by credit institutions 71 75 5 (1)
Issued by other institutions 7,002 6,852 45 (194)
Turkey 13,414 13,265 116 (265) Turkey Government and other government
agency debt securities 11,801 11,682 111 (231)
Other debt securities 1,613 1,584 4 (34)
Issued by Central Banks - - - -
Issued by credit institutions 1,452 1,425 3 (30)
Issued by other institutions 162 159 1 (4)
Other countries 22,803 23,194 881 (490) Other foreign governments and other
government agencies debt securities 9,778 10,356 653 (76)
Other debt securities 13,025 12,838 227 (414)
Issued by Central Banks 2,277 2,273 - (4)
Issued by credit institutions 3,468 3,488 108 (88)
Issued by other institutions 7,280 7,077 119 (322)
TOTAL AVAILABLE FOR SALE
PORTFOLIO 106,234 108,310 3,354 (1,278)
HELD TO MATURITY PORTFOLIO
Domestic- - - - -
Foreign- - - - -
TOTAL HELD TO MATURITY PORTFOLIO - - - -
TOTAL DEBT SECURITIES 106,234 108,310 3,354 (1,278)
24
(1) Fair values for listed securities are determined on the basis of their quoted prices at the end of the period. Fair values are
used for unlisted securities based on our estimates and valuation techniques. See Note 8 to the Consolidated Financial
Statements.
The following tables analyze the carrying amount and fair value of our ownership of equity securities as of June 30,
2016 and December 31, 2015, respectively. See Note 10 to the Interim Consolidated Financial Statements:
As of June 30, 2016
Amortized cost Fair Value (1) Unrealized Gains Unrealized Losses
(1) Valuation adjustments are made up of impairment losses, accrued interests and fees and hedging derivatives and others.
Loans by Type of Customer
The following table shows, by domicile and type of customer, our net loans and advances at each of the dates
indicated. The classification by type of customer is based principally on regulatory authority requirements in each
country.
28
As of June 30, As of December 31, As of June 30,
2016 2015 2015
(In Millions of Euros)
Domestic
Government 23,767 23,549 24,911
Agriculture 1,070 1,064 1,023
Industrial 14,270 15,079 14,745
Real estate and construction 16,252 18,621 19,479
Commercial and financial 12,113 11,557 12,913
Loans to individuals (1) 105,094 105,157 108,195
Other 18,124 17,200 17,985
Total Domestic 190,690 192,227 199,251
Foreign
Government 14,487 15,062 14,861
Agriculture 3,093 3,251 2,702
Industrial 42,568 41,834 26,087
Real estate and construction 20,680 20,343 15,372
Commercial and financial 32,746 32,019 22,119
Loans to individuals 90,240 89,132 72,022
Other 38,763 38,989 26,389
Total Foreign 242,577 240,630 179,553
Total Loans and Advances 433,267 432,856 378,804
Impairment losses (17,396) (18,691) (17,712)
Total net lending 415,872 414,165 361,092
(1) Includes mortgage loans to households for the acquisition of housing.
The following table sets forth a breakdown, by currency, of our net loan portfolio as of June 30, 2016,
December 31, 2015 and June 30, 2015:
As of June 30,
2016
As of December
31, 2015
As of June 30,
2015
(In Millions of Euros)
In euros 205,175 204,549 199,587
In other currencies 210,697 209,616 161,505
Total net lending 415,872 414,165 361,092
As of June 30, 2016, loans by BBVA and its subsidiaries to associates and jointly controlled companies
amounted to €471 million, compared with €710 million as of December 31, 2015. Loans outstanding to the Spanish
government and its agencies amounted to €23,767 million, or 5.5% of our total loans and advances as of June 30,
2016, compared with €23,549 million, or 5.4% of our total loans and advances as of December 31, 2015. None of
our loans to companies controlled by the Spanish government are guaranteed by the government and, accordingly,
we apply normal credit criteria in extending credit to such entities. Moreover, we carefully monitor such loans
because governmental policies necessarily affect such borrowers.
Diversification in our loan portfolio is our principal means of reducing the risk of loan losses. We also
carefully monitor our loans to borrowers in sectors or countries experiencing liquidity problems. Our exposure to
our five largest borrowers as of June 30, 2016, excluding government-related loans, amounted to €25,387 million or
approximately 5.9% of our total outstanding loans and advances. As of June 30, 2016 there did not exist any
29
concentration of loans exceeding 10% of our total outstanding loans and advances, other than by category as
disclosed in the table above.
Maturity and Interest Sensitivity
The following table sets forth an analysis by maturity of our total loans and advances to customers by
domicile of the office that issued the loan and the type of customer as of June 30, 2016. The determination of
maturities is based on contract terms.
Maturity
Due in One Year or
Less
Due After One Year
Through Five Years
Due After Five
Years Total
(In Millions of Euros)
Domestic
Government 11,242 7,703 4,822 23,767
Agriculture 399 444 227 1,070
Industrial 5,919 4,977 3,375 14,270
Real estate and construction 5,093 4,438 6,722 16,252
Commercial and financial 6,755 3,442 1,916 12,113
Loans to individuals 10,968 20,173 73,952 105,094
Other 6,673 6,261 5,190 18,124
Total Domestic 47,048 47,439 96,202 190,690
Foreign -
Government 1,831 1,999 10,657 14,487
Agriculture 1,681 893 519 3,093
Industrial 15,621 17,158 9,788 42,568
Real estate and construction 6,918 9,395 4,367 20,680
Commercial and financial 19,863 10,038 2,844 32,746
Loans to individuals 18,669 23,149 48,422 90,240
Other 12,085 18,098 8,580 38,763
Total Foreign 76,669 80,731 85,178 242,577
Total Loans and Advances(1) 123,816 128,170 181,380 433,267
__________________________________
(1) Includes accrued interests and fees and hedging derivatives valuation adjustments.
The following table sets forth a breakdown of our fixed and variable rate loans which had a maturity of one year
or more as of June 30, 2016.
Interest Sensitivity of Outstanding Loans and Advances
Maturing in One Year or More
Domestic Foreign Total
(In Millions of Euros)
Fixed rate 15,251 87,664 102,916
Variable rate 128,390 78,244 206,634
Total loans and advances 143,642 165,908 309,550
30
Impairment Losses on Loans and Advances
For a discussion of loan loss reserves, see “Operating and Financial Review and Prospects—Critical
Accounting Policies—Impairment losses on financial assets” ” in the 2015 20-F and Note 2.2.1 to the Interim
Consolidated Financial Statements.
The following table provides information, by domicile of customer, regarding our loan loss reserve and
movements of loan charge-offs and recoveries for periods indicated.
As of and for the
Six Months
Ended June
30,
As of and for the
Year Ended
December 31,
As of and for the
Six Months
Ended June
30,
2016 2015 2015
(In Millions of Euros, Except Percentages)
Loan loss reserve at beginning of period:
Domestic 12,364 9,835 9,835
Foreign 6,378 4,439 4,439
Total loan loss reserve at beginning of period 18,742 14,274 14,274
Loans charged off:
Total domestic (1) (1,853) (3,318) (1,286)
Total foreign (2) (1,178) (1,921) (996)
Total Loans charged off: (3,032) (5,239) (2,282)
Provision for possible loan losses:
Domestic (3)
641 5,936 5,215
Foreign (3)
1,594 5,374 1,285
Total Provision for possible loan losses 2,235 11,310 6,500
Effect of foreign currency translation (132) (862) (274)
Other (374) (741) (482)
Loan loss reserve at end of period:
Domestic 10,364 12,364 12,079
Foreign 7,075 6,378 5,657
Total Loan loss reserve at end of period 17,439 18,742 17,736
Loan loss reserve as a percentage of total loans and
receivables at end of period 3.71% 4.10% 4.44%
Net loan charge-offs as a percentage of total loans and
receivables at end of period 0.65% 1.15% 0.57%
_________________________________
(1) Domestic loans charged off in the six months ended June 30, 2016 were mainly related to the real estate sector. Loans
charged off in 2015 were also mainly related to the real estate sector. (2) Foreign loans charged off in the six months ended June 30, 2016 include €993 million related to real estate loans and loans
to individuals and others and €118 million related to commercial and financial loans. Loans charged off in 2015 include
€1,904 million related to real estate loans and loans to individuals and others and €16 million related to commercial and
financial loans. (3) The above table includes amounts related to the acquisition of Garanti and Catalunya Banc. See Note 18 to the Interim
Consolidated Financial Statements.
31
When the recovery of any recognized amount is considered to be remote, this amount is removed from the
consolidated balance sheet, without prejudice to any actions taken by the consolidated entities in order to collect the
amount until their rights extinguish in full through expiry, forgiveness or for other reasons.
The loans charged off amounted to €3,032 million during the six months ended June 30, 2016 compared with
€2,282 million during the six months ended June 30, 2015.
Our loan loss reserves as a percentage of total loans and advances decreased to 3.7% as of June 30, 2016 from
4.1% as of December 31, 2015.
Impaired Loans
As described in Note 2.2.1 to the Interim Consolidated Financial Statements, loans are considered to be
impaired loans when there are reasonable doubts that the loans will be recovered in full and/or the related interest
will be collected for the amounts and on the dates initially agreed upon, taking into account the guarantees received
by the consolidated entities to ensure (in part or in full) the performance of the loans.
Amounts collected in relation to impaired loans and receivables are used to recognize the related accrued interest
and any excess amount is used to reduce the unpaid principal. The approximate amount of interest income on our
impaired loans which was included in profit attributable to parent company for the six months ended June 30,
2016 and 2015 was €130.9 million and €117.6 million, respectively.
The following table provides information regarding our impaired loans, by domicile and type of customer, as of
the dates indicated:
As of June 30, As of December 31,
2016 2015
(In Millions of Euros, Except Percentages)
Impaired loans
Domestic 17,641 19,481
Public sector 215 191
Other resident sector 17,425 19,290
Foreign 6,595 5,876
Public sector 18 21
Other non-resident sector 6,577 5,855
Total impaired loans 24,236 25,358
Total loan loss reserve (17,439) (18,742)
Impaired loans net of reserves 6,797 6,616
Our total impaired loans amounted to €24,236 million as of June 30, 2016, a 4.4% decrease compared with
€25,358 million as of December 31, 2015. This decrease is mainly attributable to a decline in domestic impaired
loans, particularly in the real estate and construction sectors.
As mentioned in Note 2.2.1 to the Interim Consolidated Financial Statements, our loan loss reserve includes
loss reserve for impaired assets and loss reserve for unimpaired assets but which present an inherent loss. As of June
30, 2016, the loan loss reserve amounted to €17,439 million, a 6.9% decrease compared with €18,742 million as of
December 31, 2015. This decrease in our loan loss reserve is mainly due to the improved performance in Spain.
The following table provides information, by domicile and type of customer, regarding our impaired loans and
the loan loss reserves to customers taken for each impaired loan category, as of June 30, 2016.
32
Impaired Loans Loan Loss Reserve
Impaired Loans as a
Percentage of Loans by
Category
(In Millions of Euros)
Domestic:
Government 215 (45) 0.91%
Other sectors 17,425 (8,323) 10.44%
Agriculture 92 (32) 8.59%
Industrial 1,394 (796) 9.77%
Real estate and construction 6,757 (3,703) 41.58%
Commercial and other
Financial 1,195 (655) 9.86%
Loans to individuals 6,042 (2,025) 5.75%
Other 1,945 (1,110) 10.73%
Total Domestic 17,641 (8,368) 9.25%
Foreign:
Government 18 (9) 0.12%
Other sectors 6,577 (3,354) 2.88%
Agriculture 112 (60) 3.63%
Industrial 1,466 (572) 3.44%
Real estate and construction 391 (182) 1.89%
Commercial and other
financial 566 (323) 1.73%
Loans to individuals 2,835 (1,545) 3.14%
Other 1,207 (672) 3.11%
Total Foreign 6,595 (3,364) 2.72%
General reserve (5,707)
Total impaired loans 24,236 (17,439) 5.96%
Troubled Debt Restructurings
As of June 30, 2016, “troubled debt restructurings”, as described in Appendix X to our Interim Consolidated
Financial Statements, totaling €9,970 million were not considered impaired loans.
Potential Problem Loans
The identification of “Potential problem loans” is based on the analysis of historical non-performing asset ratio
trends, categorized by products/clients and geographical locations. This analysis is focused on the identification of
portfolios with non-performing asset ratio higher than our average non-performing asset ratio. Once these portfolios
are identified, we segregate such portfolios into groups with similar characteristics based on the activities to which
they are related, geographical location, type of collateral, solvency of the client and loan to value ratio.
The non-performing asset ratio in our domestic real estate and construction portfolio was 41.6% as of June 30,
2016 (compared with 41.5% as of December 31, 2015), substantially higher than the average non-performing asset
ratio for all of our domestic activities (9.3%) and the average non-performing asset ratio for all of our consolidated
activities (6.0%). Within such portfolio, construction loans and property development loans (which exclude mainly
33
infrastructure and civil construction) had a non-performing asset ratio of 48.9% as of such date (compared with
47.3% as of December 31, 2015). Given such non-performing asset ratio, we performed an analysis in order to
define the level of loan provisions attributable to these loan portfolios (see Note 2.2.1 to our Interim Consolidated
Financial Statements). The table below sets forth additional information on our domestic real estate and construction
portfolio “Potential problem loans” as of June 30, 2016:
Book Value
Allowance for Loan
Losses
% of Loans in Each
Category to Total
Loans to Customers
(In Millions of Euros, Except Percentages)
Domestic(1)
Doubtful Loans 5,598 3,148 1.3%
Substandard loans 580 131 0.1%
Of which:
Troubled debt restructurings 85 5 0.0%
(1) Potential problem loans outside of Real Estate Activity in Spain as of June 30, 2016 were not significant.
Foreign Country Outstandings
The following table sets forth, as of the dates indicated, the aggregate amounts of our cross-border outstandings
(which consist of loans, interest-bearing deposits with other banks, acceptances and other monetary assets
denominated in a currency other than the home-country currency of the office where the item is booked) where
outstandings in the borrower’s country exceeded 1% of our total assets as of June 30, 2016 and December 31, 2015.
Cross-border outstandings do not include loans in local currency made by our subsidiary banks to customers in other
countries to the extent that such loans are funded in the local currency or hedged. As a result, they do not include the
vast majority of the loans made by our subsidiaries in South America, Mexico and United States or other regions
which are not listed below.
As of June 30, 2016 As of December 31, 2015
Amount
% of total
assets Amount
% of total
assets
(In Millions of Euros, Except %)
United Kingdom 6,746 0.9% 7,306 1.0%
Mexico 1,941 0.3% 2,134 0.3%
Other OECD 10,594 1.5% 10,098 1.4%
Total OECD 19,281 2.6% 19,538 2.7%
Central and South America 3,958 0.5% 3,434 0.5%
Other 4,673 0.6% 4,888 0.7%
Total 27,912 3.7% 27,860 3.8%
The Bank of Spain requires that minimum reserves be maintained for cross-border risk arising with respect to
loans and other outstandings to countries, or residents of countries, falling into certain categories established by the
Bank of Spain on the basis of the level of perceived transfer risk. The category that a country falls into is determined
by us, subject to review by the Bank of Spain.
34
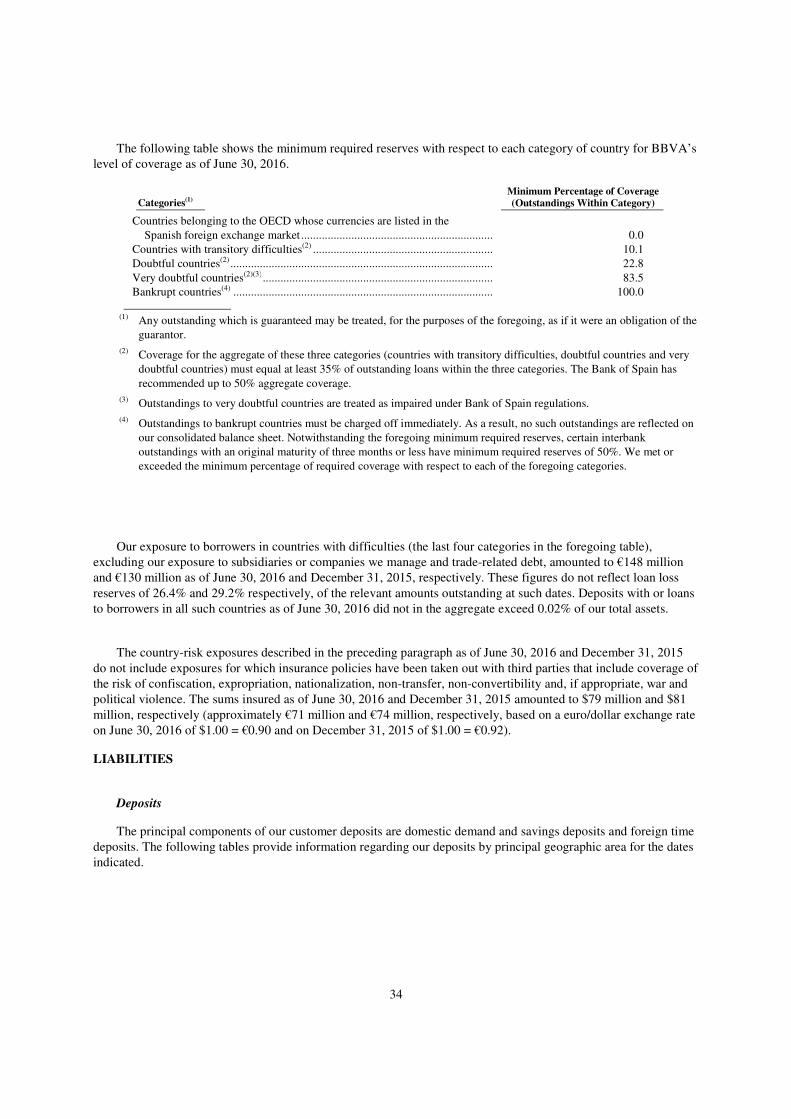
The following table shows the minimum required reserves with respect to each category of country for BBVA’s
level of coverage as of June 30, 2016.
Categories(1) Minimum Percentage of Coverage (Outstandings Within Category)
Countries belonging to the OECD whose currencies are listed in the
(1) Any outstanding which is guaranteed may be treated, for the purposes of the foregoing, as if it were an obligation of the
guarantor.
(2) Coverage for the aggregate of these three categories (countries with transitory difficulties, doubtful countries and very
doubtful countries) must equal at least 35% of outstanding loans within the three categories. The Bank of Spain has
recommended up to 50% aggregate coverage.
(3) Outstandings to very doubtful countries are treated as impaired under Bank of Spain regulations.
(4) Outstandings to bankrupt countries must be charged off immediately. As a result, no such outstandings are reflected on
our consolidated balance sheet. Notwithstanding the foregoing minimum required reserves, certain interbank
outstandings with an original maturity of three months or less have minimum required reserves of 50%. We met or
exceeded the minimum percentage of required coverage with respect to each of the foregoing categories.
Our exposure to borrowers in countries with difficulties (the last four categories in the foregoing table),
excluding our exposure to subsidiaries or companies we manage and trade-related debt, amounted to €148 million
and €130 million as of June 30, 2016 and December 31, 2015, respectively. These figures do not reflect loan loss
reserves of 26.4% and 29.2% respectively, of the relevant amounts outstanding at such dates. Deposits with or loans
to borrowers in all such countries as of June 30, 2016 did not in the aggregate exceed 0.02% of our total assets.
The country-risk exposures described in the preceding paragraph as of June 30, 2016 and December 31, 2015
do not include exposures for which insurance policies have been taken out with third parties that include coverage of
the risk of confiscation, expropriation, nationalization, non-transfer, non-convertibility and, if appropriate, war and
political violence. The sums insured as of June 30, 2016 and December 31, 2015 amounted to $79 million and $81
million, respectively (approximately €71 million and €74 million, respectively, based on a euro/dollar exchange rate
on June 30, 2016 of $1.00 = €0.90 and on December 31, 2015 of $1.00 = €0.92).
LIABILITIES
Deposits
The principal components of our customer deposits are domestic demand and savings deposits and foreign time
deposits. The following tables provide information regarding our deposits by principal geographic area for the dates
indicated.
35
As of June 30, 2016
Customer
Deposits
Bank of Spain and
Other Central
Banks
Other Credit
Institutions Total
(In Millions of Euros)
Total Domestic 164,739 26,522 8,959 200,220
Foreign
Western Europe 37,808 101 38,093 76,002
Mexico 53,688 376 5,678 59,742
South America 39,403 2,408 6,803 48,614
The United States 45,865 270 3,799 49,934
Turkey 59,014 1680 1,366 62,060
Other 5,767 1,351 4,420 11,538
Total Foreign 241,545 6,186 60,159 307,890
Total 406,284 32,709 69,118 508,111
As of December 31, 2015
Customer
Deposits
Bank of Spain and
Other Central
Banks
Other Credit
Institutions Total
(In Millions of Euros)
Total Domestic 168,689 19,014 8,262 195,965
Foreign
Western Europe 35,770 101 39,896 75,767
Mexico 51,422 11,254 1,643 64,319
South America 44,469 3,341 4,423 52,233
The United States 62,988 619 7,391 70,998
Turkey 36,036 4,348 1,786 42,170
Other 3,988 1,411 5,142 10,541
Total Foreign 234,673 21,073 60,281 316,027
Total 403,362 40,087 68,543 511,992
For an analysis of our deposits, including non-interest bearing demand deposits, interest-bearing demand
deposits, saving deposits and time deposits, see Note 22.1 to the Interim Consolidated Financial Statements.
As of June 30, 2016 the maturity of our time deposits (excluding interbank deposits) in denominations of
$100,000 (approximately €89,658 considering the noon buying rate as of June 30, 2016) or greater was as follows:
As of June 30, 2016
Domestic Foreign Total
(In Millions of Euros)
3 months or under ....................................................................................................... 5,491 43,931 49,422
Over 3 to 6 months ..................................................................................................... 4,770 8,767 13,536
Over 6 to 12 months ................................................................................................... 7,335 10,151 17,487
Over 12 months .......................................................................................................... 9,773 17,540 27,313
Total ........................................................................................................................... 27,369 80,389 107,758
Time deposits from Spanish and foreign financial institutions amounted to €35,423 million as of June 30, 2016,
substantially all of which were in excess of $100,000 (approximately €89,658 considering the noon buying rate as of
June 30, 2016).
36
Large denomination deposits may be a less stable source of funds than demand and savings deposits because
they are more sensitive to variations in interest rates. For a breakdown by currency of customer deposits as of June
30, 2016, December 31, 2015 and June 30, 2015, see Note 22.2 to the Interim Consolidated Financial Statements.
Short-term Borrowings
Securities sold under agreements to repurchase and promissory notes issued by us constituted the only categories of
short-term borrowings that equaled or exceeded 30% of stockholders’ equity as of June 30, 2016, December 31,
2015 and June 30, 2015.
As of and for the Six Months Ended June 30,
2016
As of and for the Year Ended December 31,
2015
As of and for the Six Months Ended June 30,
2015
Amount Average rate Amount Average rate Amount Average rate
(In Millions of Euros, Except Percentages)
Securities sold under agreements to
repurchase (principally Spanish
Treasury bills) As of end of period ................................ 36,879 1.2% 50,342 1.0% 40,680 0.7%
Average during period ........................... 38,638 1.3% 47,954 0.9% 41,708 0.6%
Maximum quarter-end balance .............. 40,396 - 50,342 - 44,380 -
Bank promissory notes
As of end of period ................................ 1,092 1.5% 516 0.3% 458 1.2%
Average during period ........................... 856 0.9% 2,239 1.0% 1,053 1.9%
Maximum quarter-end balance .............. 1,092 - 3,354 - 1,667 -
Bonds and Subordinated debt
As of end of period ................................ 15,210 3.1% 14,741 3.4% 11,786 3.9%
Average during period ........................... 14,844 3.2% 15,320 2.2% 13,436 3.1%
Maximum quarter-end balance .............. 15,210 - 15,693 - 13,734 -
Total short-term borrowings as of
end of period ........................................ 53,182 1.8% 65,598 1.5% 52,924 1.4%
Return Ratios
The following table sets out our return ratios:
As of and for the Six Months Ended
June 30, 2016
As of and for the year ended
December 31, 2015
As of and for the Six Months Ended
June 30, 2015
(In Percentages)
Return on equity (1) 7.2% 5.3% 9.8%
Return on assets (2) 0.7% 0.5% 0.8%
Equity to assets ratio (3) 7.4% 7.7% 8.0%
(1) Represents profit attributable to parent company for the period as a percentage of average stockholders’ equity for the period.
For June 30, 2016 and June 30, 2015 data, profit attributable to parent company is annualized by multiplying the profit
attributable to parent company for the period by two.
(2) Represents profit attributable to parent company as a percentage of average total assets for the period. For June 30, 2016 and
June 30, 2015 data, profit attributable to parent company is annualized by multiplying the profit attributable to parent
company for the period by two.
(3) Represents average stockholders´ equity over average total assets.
37
OPERATING AND FINANCIAL REVIEW AND PROSPECTS
Factors Affecting the Comparability of our Results of Operations and Financial Condition
Trends in Exchange Rates
We are exposed to foreign exchange rate risk in that our reporting currency is the euro, whereas certain of our
subsidiaries and investees keep their accounts in other currencies, principally Mexican pesos, U.S. dollars, Turkish liras,
Argentine pesos, Chilean pesos, Colombian pesos, Venezuelan bolivar and Peruvian new soles. For example, if Latin
American currencies, the U.S. dollar or the Turkish lira depreciate against the euro, when the results of operations of our
subsidiaries in the countries using these currencies are included in our consolidated financial statements, the euro value of
their results declines, even if, in local currency terms, their results of operations and financial condition have remained the
same. By contrast, the appreciation of Latin American currencies, the U.S. dollar or the Turkish lira against the euro would
have a positive impact on the results of operations of our subsidiaries in the countries using these currencies when their
results of operations are included in our consolidated financial statements. Accordingly, changes in exchange rates may
limit the ability of our results of operations, stated in euro, to fully show the performance in local currency terms of our
subsidiaries.
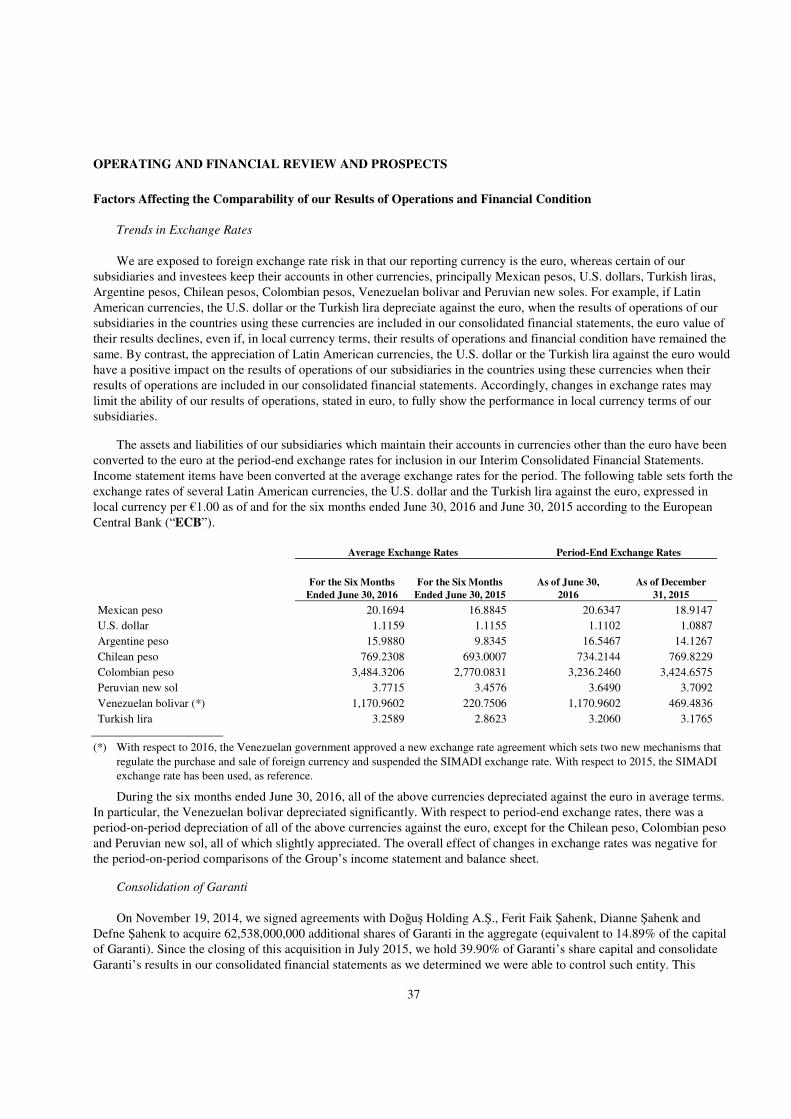
The assets and liabilities of our subsidiaries which maintain their accounts in currencies other than the euro have been
converted to the euro at the period-end exchange rates for inclusion in our Interim Consolidated Financial Statements.
Income statement items have been converted at the average exchange rates for the period. The following table sets forth the
exchange rates of several Latin American currencies, the U.S. dollar and the Turkish lira against the euro, expressed in
local currency per €1.00 as of and for the six months ended June 30, 2016 and June 30, 2015 according to the European
Gains or losses on financial assets and liabilities designated at fair value
through profit or loss, net 24 17 40.8
Gains or losses on financial assets and liabilities held for trading, net 106 161 (33.7)
Gains or losses from hedge accounting, net (171) - n.m.(1)
Net gains (losses) on financial assets and liabilities 642 827 (22.2)
(1) Not meaningful.
Net exchange differences decreased 14.0% from €620 million for the six months ended June 30, 2015 to €533 million
for the six months ended June 30, 2016 due primarily to the evolution of foreign currencies and exchange rate
management, including hedging arrangements.
Other operating income and expenses
Other operating income amounted to €715 million for the six months ended June 30, 2016, a 31.0% increase compared
to €546 million for the six months ended June 30, 2015, due mainly to the change in the consolidation method of Garanti
and dividends received from CNCB.
Other operating expenses for the six months ended June 30, 2016 amounted to €1,186 million, a 30.2% increase
compared to the €911 million recorded for the six months ended June 30, 2015, due primarily to the change in the
consolidation method of Garanti and adverse effects of high inflation in Turkey and Argentina, and the contribution to the
new SRF (the aggregate of the national resolution funds), compared with the contribution made in 2015 to the FROB,
which was recorded in the fourth quarter of the year. These factors were partially offset by lower contributions to deposit
guarantee funds in other countries in which the BBVA Group operates.
43
Income and expenses on insurance and reinsurance contracts
Income on insurance and reinsurance contracts for the six months ended June 30, 2016 was €1,958 million, a 13.5%
increase compared with the €1,725 million gain recorded for the six months ended June 30, 2015, mainly as a result of the
performance of BBVA Seguros in Spain and the change in the consolidation method of Garanti.
Expenses on insurance and reinsurance contracts for the six months ended June 30, 2016 were €1,446 million, a 17.3%
increase compared with the €1,233 million gain recorded for the six months ended June 30, 2015 mainly as a result of the
impact of the depreciation of the Mexican peso and other currencies in South America against the Euro, increased claims in
Spain as a result of greater activity and the change in the consolidation method of Garanti.
Administration costs
Administration costs for the six months ended June 30, 2016 amounted to €5,644 million, a 14.6% increase compared
with the €4,927 million recorded for the six months ended June 30, 2015, mainly due to the change in the consolidation
method of Garanti and the higher contribution of Catalunya Banc, partially offset by the effect of exchange rates in Mexico
and South America.
The table below provides a breakdown of personnel expenses for the six months ended June 30, 2016 and June 30,
2015. Beginning January 1, 2016, we have modified the sub-captions included in administration costs. As a result, the
breakdown shown below is not directly comparable with the sub-captions included in the 2015 20-F under administration
costs.
For the Six Months Ended June 30,
2016 2015 Change
(In Millions of Euros) (In %)
Wages and salary 2,587 2,221 16.5
Social security costs 403 348 15.8
Defined contribution plan expense 45 44 2.3
Defined benefit plan expense 34 33 3.0
Other personnel expenses 255 242 5.4
Personnel expenses 3,324 2,888 15.1
Wages and salary expenses increased 16.5% from €2,221 million for the six months ended June 30, 2015 to €2,587
million for the six months ended June 30, 2016, mainly as a result of the change in the consolidation method of Garanti.
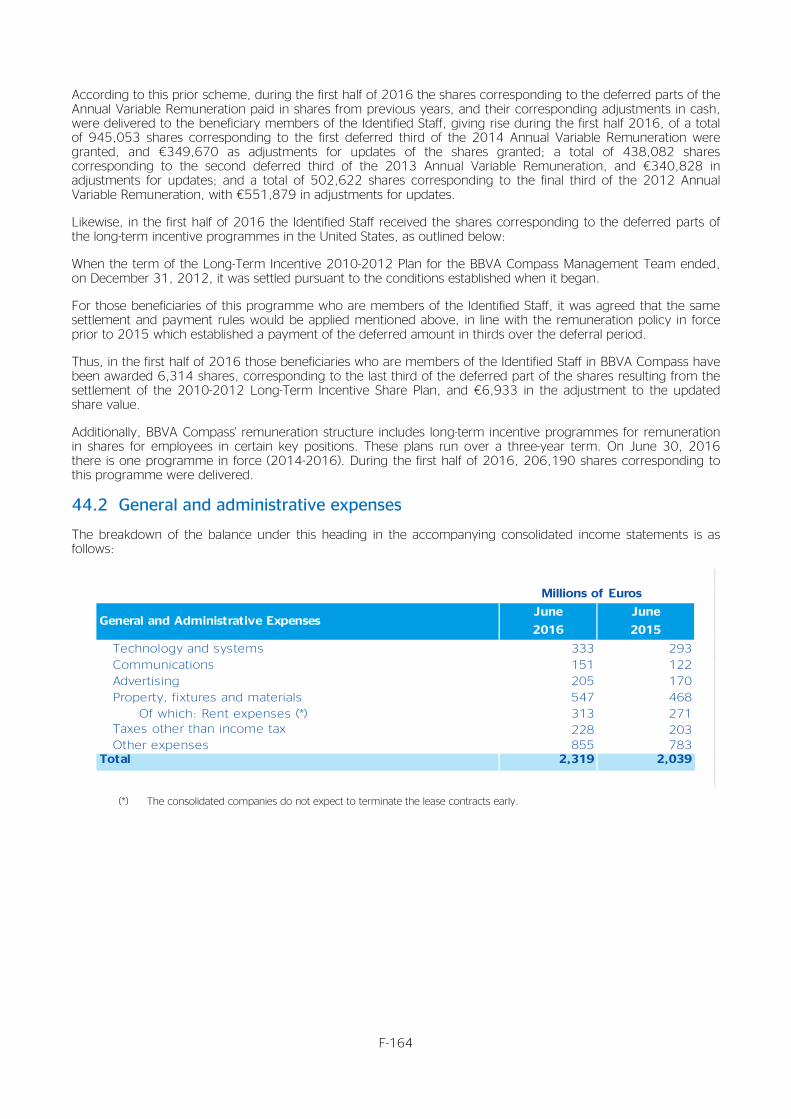
The table below provides a breakdown of general and administrative expenses for the six months ended June 30, 2016
and June 30, 2015:
For the Six Months Ended June
30,
2016 2015 Change
(In Millions of Euros) (In %)
Technology and systems 333 293 13.6
Communications 151 122 24.2
Advertising 205 170 20.9
Property, fixtures and materials 547 468 16.9
Of which:
Rent expenses 313 271 15.5
Taxes other than income tax 228 203 12.1
Other expenses 855 783 9.2
General and administrative expenses 2,319 2,039 13.7
44
Technology and systems expenses increased 13.7% from €293 million for the six months ended June 30, 2015 to €333
million for the six months ended June 30, 2016, mainly due to the change in the consolidation method of Garanti and
higher investments in technology. Property, fixtures and materials expenses increased from €468 million for the six months
ended June 30, 2016 to €547 million mainly as a result of the change in the consolidation method of Garanti and the higher
contribution of Catalunya Banc.
Depreciation
Depreciation for the six months ended June 30, 2016 was €689 million, a 20.5% increase compared with the €572
million recorded for the six months ended June 30, 2015, mainly due to the change in the consolidation method of Garanti
and the higher contribution of Catalunya Banc, and to a lesser extent, the amortization of software and hardware.
Provisions (net)
Provisions (net) for the six months ended June 30, 2016 was €262 million, a 33.2% decrease compared with the €392
million recorded for the six months ended June 30, 2015, largely as a result of a decrease in the costs related to early
retirements and contributions to pension funds.
Impairment losses on financial assets (net)
Impairment losses on financial assets (net) for the six months ended June 30, 2016 was a loss of €2,110 million, a
1.3% decrease compared with the €2,137 million loss recorded for the six months ended June 30, 2015 mainly as a result of
lower additions to non-performing assets in Spain, higher recovery of written-off assets of the Real Estate Activity in Spain
segment and the impact of the depreciation of the majority of our operating currencies against the euro. These effects were
partially offset by the change in the consolidation method of Garanti, and to a lesser extent, increased losses in the United
States following downgrades in the energy and metals and mining sectors and increased provisions in Garanti’s subsidiary
in Romania. The Group’s non-performing asset ratio was 6.1% as of June 30, 2016, compared to 5.8% as of December 31,
2015.
Impairment losses on other assets (net)
Impairment losses on other assets (net) for the six months ended June 30, 2016 amounted to €99 million, a 22.7%
decrease compared to the €128 million recorded for the six months ended June 30, 2015, due to lower impairments losses
on real estate investment properties in Spain.
Gains (losses) on derecognized assets not classified as non-current assets held for sale
Gains (losses) on derecognized assets not classified as non-current assets held for sale for the six months ended June
30, 2016 amounted to a gain of €37 million, a 60.9% increase compared to a gain of €23 million recognized for the six
months ended June 30, 2015, mainly as a result of disposal of investments in subsidiaries and, to a lesser extent, losses
from the sale of certain assets of Unnim in 2015.
Negative goodwill
Negative goodwill for the six months ended June 30, 2016 was nil, compared to a negative goodwill of €22 million
recognized for the six months ended June 30, 2015. Negative goodwill for the six months ended June 30, 2015 was
attributable to the acquisition of Catalunya Banc in April 2015.
Gains (losses) in non-current assets held for sale not classified as discontinued operations
Gains (losses) in non-current assets held for sale not classified as discontinued operations for the six months ended
June 30, 2016 amounted to a loss of €75 million, compared to a gain of €791 million for the six months ended June 30,
2015. The gains in the first six months of 2015 were mainly attributable to the sale of a 6.4% stake in CNCB.
45
Operating profit before tax
As a result of the foregoing, operating profit before tax for the six months ended June 30, 2016 was €3,391 million, a
13.0% decrease from the €3,899 million recorded for the six months ended June 30, 2015.
Tax expense ( income) related to profit or loss from continuing operations
Tax expense (income) related to profit or loss from continuing operations for the six months ended June 30, 2016 was
an expense of €920 million, compared with an expense of €941 million recorded for the six months ended June 30, 2015,
due mainly to the lower operating profit before tax.
Profit from continuing operations
As a result of the foregoing, profit from continuing operations for the six months ended June 30, 2016 was €2,471
million, a 16.5% decrease from the €2,958 million recorded for the six months ended June 30, 2015.
Profit from discontinued operations (net)
There was no profit from discontinued operations for the six months ended June 30, 2016 or June 30, 2015.
Profit
As a result of the foregoing, profit for the six months ended June 30, 2016 was €2,471 million, a 16.5% decrease from
the €2,958 million recorded for the six months ended June 30, 2015.
Profit attributable to parent company
Profit attributable to parent company for the six months ended June 30, 2016 was €1,832 million, a 33.6% decrease
from the €2,759 million recorded for the six months ended June 30, 2015.
Profit attributable to non-controlling interests
Profit attributable to non-controlling interests for the six months ended June 30, 2016 was €639 million, a 219.5%
increase compared with the €200 million registered for the six months ended June 30, 2015, mainly as a result of the
change in the consolidation method of Garanti and, to a lesser extent, stronger performance of our Peruvian and
Argentinian operations where there are minority shareholders, partially offset by the depreciation of the Venezuelan
bolivar.
46
Results of Operations by Operating Segment
The information contained in this section is presented under management criteria.
The tables set forth below reconcile the income statement of our operating segments presented in this section to the consolidated income statement of the Group. The
“Adjustments” column reflects the differences between the Group income statement and the income statement calculated in accordance with management operating
segment reporting criteria, which are the following:
• The treatment of Garanti: Since July 2015, we hold 39.90% of Garanti’s share capital, and we have fully consolidated Garanti’s results in our consolidated
financial statements. Information from January 1 through June 30, 2015 has been calculated and is presented under management criteria according to which the
assets, liabilities and income statement of Garanti are included in every line item of the balance sheet and the income statement based on our 25.01% interest in
Garanti during such period. For purposes of the Group financial statements the participation in Garanti was accounted under “Share of profit or loss of entities
accounted for using the equity method” during such period.
• The creation of a line item on the income statement called “Profit from corporate operations” which is in place of “Profit from discontinued operations” that
includes the gains from the sale of our 6.43% participation in CNCB during the six months ended June 30, 2015.
47
For the Six Months Ended June 30, 2016
Banking
Activity in
Spain
Real
Estate
Activity in
Spain
Turkey Rest of
Eurasia Mexico
South
America
United
States
Corporate
Center Total
Adjustments
Group
Income
(In Millions of Euros)
Net interest income 1,943 42 1,606
86
2,556
1,441 938
(247)
8,365 - 8,365
Net fees and commissions 771 2 392
92
556
299 306
(68)
2,350 - 2,350
Net gains (losses) on financial assets and
liabilities and net exchange differences 390 - 128
Profit attributable to parent company 619 (209) 324 74 968 394 178 (518) 1,832 - 1,832
(1) Comprises the following income statement line items contained in the Interim Consolidated Financial Statements: “Gains or (-) losses on derecognition of financial assets and liabilities
not measured at fair value through profit or loss, net”; “Gains or (-) losses on financial assets and liabilities designated at fair value through profit or loss, net”; “Gains or (-) losses on
financial assets and liabilities held for trading, net” and “Gains or (-) losses from hedge accounting, net” and “exchange differences, net”. (2) Includes “share of profit or loss of entities accounted for using the equity method”; “income on insurance and reinsurance contracts” and “expenses on insurance and reinsurance”. (3) For Group Income (derived from the Group income statement) this line represents “Profit from discontinued operations” and for operating segments (presented in accordance with
management criteria) it represents “Profit from corporate operations”.
48
For the Six Months Ended June 30, 2015
Banking
Activity in
Spain
Real Estate
Activity in
Spain
Turkey Rest of
Eurasia Mexico
South
America
United
States
Corporate
Center Total
Adjustments
Group
Income
(In Millions of Euros)
Net interest income 1,980 (12) 425 85 2,731 1,652 883 (224) 7,521 (425) 7,096
Net fees and commissions 810 1 98 90 605 360 316 (64) 2,216 (97) 2,119
Net gains (losses) on financial assets and
liabilities
and net exchange differences(1) 674 1 (22) 89 110 306 107 159 1,425 21 1,446
Other operating income and expenses (net) (2) 244 (54) 9 - 119 (22) 16 80 392 166 558
Profit attributable to parent company 731 (301) 174 43 1,045 475 276 315 2,759 - 2,759
(1) Comprises the following income statement line items contained in the Interim Consolidated Financial Statements: “Gains or (-) losses on derecognition of financial assets and liabilities
not measured at fair value through profit or loss, net”; “Gains or (-) losses on financial assets and liabilities designated at fair value through profit or loss, net”; “Gains or (-) losses on
financial assets and liabilities held for trading, net” and “Gains or (-) losses from hedge accounting, net” and “exchange differences, net”. (2) Includes “share of profit or loss of entities accounted for using the equity method”; “income on insurance and reinsurance contracts” and “expenses on insurance and reinsurance”. (3) For Group Income (derived from the Group income statement) this line represents “Profit from discontinued operations” and for operating segments (presented in accordance with
management criteria) it represents “Profit from corporate operations”.
49
Results of Operations by Operating Segment for the Six Months Ended June 30, 2016 Compared to the Six Months
Ended June 30, 2015
BANKING ACTIVITY IN SPAIN
For the Six Months Ended June 30,
2016 2015 Change
(In Millions of Euros) (In %)
Net interest income 1,943 1,980 (1.9)
Net fees and commissions 771 810 (4.8)
Net gains (losses) on financial assets and liabilities and net exchange differences 390 674 (42.1)
Other operating income and expenses (net) (20)
209
81
163
n.m.(1)
Income and expenses (net) on insurance and reinsurance contracts 28.1
Gross income 3,293 3,709 (11.2)
Administration costs (1,642) (1,452) 13.0
Depreciation (158) (169) (6.2)
Net margin before provisions 1,493 2,088 (28.5)
Impairment losses on financial assets (net) (509) (775) (34.4)
Provisions (net) and other gains (losses) (87) (272) (67.9)
Operating profit/(loss) before tax 897 1,041 (13.8)
Tax expense (income) related to profit or loss from continuing operations (276) (308) (10.2)
Profit from continuing operations 621 733 (15.3)
Profit from corporate operations (net) - - -
Profit 621 733 (15.3)
Profit attributable to non-controlling interests (2) (2) 3.2
Profit attributable to parent company 619 731 (15.3)
(1) Not meaningful.
The acquisition of Catalunya Banc in the second quarter of 2015 affects the comparability of our results for the periods
discussed herein. See “―Factors Affecting the Comparability of our Results of Operations and Financial Conditions.”
Net interest income
Net interest income of this operating segment for the six months ended June 30, 2016 was €1,943 million, a 1.9%
decrease compared with the €1,980 million recorded for the six months ended June 30, 2015, mainly as a result of
declining yields on loans, which was partially offset by an increase in loan origination. The decline in net interest income
was despite the fact that we consolidated Catalunya Banc for the full period in the six months ended June 30, 2016
compared with three months during the prior period.
Net fees and commissions
Net fees and commissions of this operating segment for the six months ended June 30, 2016 amounted to €771 million,
a 4.8% decrease compared with the €810 million recorded for the six months ended June 30, 2015, primarily due to the
lower contribution from fees and commissions arising from securities services, including investment banking.
50
Net gains (losses) on financial assets and liabilities and net exchange differences
Net gains (losses) on financial assets and liabilities and net exchange differences of this operating segment for the six
months ended June 30, 2016 was a gain of €390 million, a 42.1% decrease compared with the €674 million gain recorded
for the six months ended June 30, 2015, as a result of lower ALCO portfolio sales, in the context of difficult market
conditions, partially offset with the positive net exchange differences and the sale of our stake in VISA Europe Ltd. to Visa
Inc., which generated €138 million gain.
Other operating income and expenses (net)
Other operating income and expenses (net) of this operating segment for the six months ended June 30, 2016 was a
loss of €20 million compared with the €81 million gain recorded for the six months ended June 30, 2015 mainly as a result
of the annual contribution to the Single Resolution Fund, which had a negative effect of €107 million in this operating
segment. The 2015 contribution to the FROB was made in the fourth quarter of that year.
Income and expenses (net) on insurance and reinsurance contracts
Income and expenses (net) on insurance and reinsurance contracts of this operating segment for the six months ended June
30, 2016 was a gain of €209 million, a 28.1% increase compared with the €163 million gain recorded for the six months
ended June 30, 2015.
Administration costs
Administration costs of this operating segment for the six months ended June 30, 2016 were €1,642 million, a 13.0%
increase compared with the €1,452 million recorded for the six months ended June 30, 2015, mainly as a result of the
acquisition of Catalunya Banc and its integration costs.
Impairment losses on financial assets (net)
Impairment losses on financial assets (net) of this operating segment for the six months ended June 30, 2016 was €509
million, a 34.4% decrease from the €775 million recorded for the six months ended June 30, 2015, which is mainly
attributable to the improvement of the credit risk quality in Spain. Impairment losses on financial assets (net) of this
operating segment recorded higher provisions for the six months ended June 30, 2015 than in the six months ended June
30, 2016.
Provisions (net) and other gains (losses)
Provisions (net) and other gains (losses) of this operating segment for the six months ended June 30, 2015 were a loss
of €87 million, a 68.0% decrease compared with the €272 million loss recorded for the six months ended June 30, 2015,
mainly due to the lower contingencies related to Catalunya Banc.
Operating profit before tax
As a result of the foregoing, the operating profit before tax of this operating segment for the six months ended June 30,
2016 was €897 million, down 13.8% from an operating profit before tax of €1,041 million recorded for the six months
ended June 30, 2015.
Tax expense (income) related to profit or loss from continuing operations
Tax expense (income) related to profit or loss from continuing operations of this operating segment for the six months
ended June 30, 2016 was an expense of €276 million, a 10.4% decrease compared with a €308 million expense recorded
for the six months ended June 30, 2015, primarily as a result of the lower operating profit before tax.
51
Profit attributable to parent company
As a result of the foregoing, profit attributable to parent company of this operating segment for the six months ended
June 30, 2016 was €619 million, a 15.3% decrease from the €731 million recorded for the six months ended June 30, 2015.
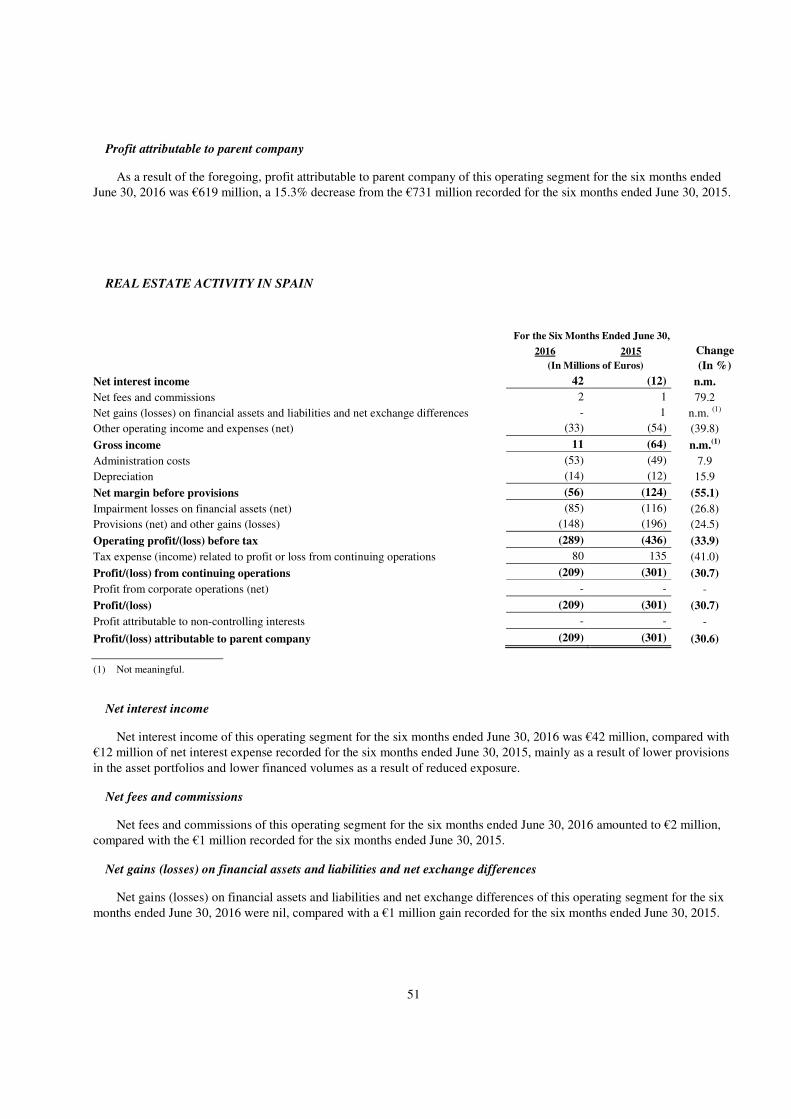
REAL ESTATE ACTIVITY IN SPAIN
For the Six Months Ended June 30,
2016 2015 Change
(In Millions of Euros) (In %)
Net interest income 42 (12) n.m.
Net fees and commissions 2 1 79.2
Net gains (losses) on financial assets and liabilities and net exchange differences - 1 n.m. (1)
Other operating income and expenses (net) (33) (54) (39.8)
Gross income 11 (64) n.m.(1)
Administration costs (53) (49) 7.9
Depreciation (14) (12) 15.9
Net margin before provisions (56) (124) (55.1)
Impairment losses on financial assets (net) (85) (116) (26.8)
Provisions (net) and other gains (losses) (148) (196) (24.5)
Operating profit/(loss) before tax (289) (436) (33.9)
Tax expense (income) related to profit or loss from continuing operations 80 135 (41.0)
Profit/(loss) from continuing operations (209) (301) (30.7)
Profit from corporate operations (net) - - -
Profit/(loss) (209) (301) (30.7)
Profit attributable to non-controlling interests - - -
Profit/(loss) attributable to parent company (209) (301) (30.6)
(1) Not meaningful.
Net interest income
Net interest income of this operating segment for the six months ended June 30, 2016 was €42 million, compared with
€12 million of net interest expense recorded for the six months ended June 30, 2015, mainly as a result of lower provisions
in the asset portfolios and lower financed volumes as a result of reduced exposure.
Net fees and commissions
Net fees and commissions of this operating segment for the six months ended June 30, 2016 amounted to €2 million,
compared with the €1 million recorded for the six months ended June 30, 2015.
Net gains (losses) on financial assets and liabilities and net exchange differences
Net gains (losses) on financial assets and liabilities and net exchange differences of this operating segment for the six
months ended June 30, 2016 were nil, compared with a €1 million gain recorded for the six months ended June 30, 2015.
52
Other operating income and expenses (net)
Other operating income and expenses (net) of this operating segment for the six months ended June 30, 2016 was an
expense of €33 million, a 39.8% decrease compared with the €45 million expense recorded for the six months ended June
30, 2015, mainly as a result of lower costs related to the administration and sale of properties.
Administration costs
Administration costs of this operating segment for the six months ended June 30, 2016 were €53 million, a 7.9%
increase compared with the €49 million recorded for the six months ended June 30, 2015, primarily as a result of increased
general expenses due to higher volume of technical reports and real estate valuations.
Impairment losses on financial assets (net)
Impairment losses on financial assets (net) of this operating segment for the six months ended June 30, 2016 was €85
million, a 26.8% decrease compared with the €116 million recorded for the six months ended June 30, 2015, mainly
attributable to higher recovery of written-off assets as well as lower losses from real estate asset collateral.
Provisions (net) and other gains (losses)
Provisions (net) and other losses of this operating segment for the six months ended June 30, 2016 were €148 million,
a 24.5% decrease compared with the €196 million recorded for the six months ended June 30, 2015, as a result of lower
needs for loan-loss and real estate provisions as a result of improved asset quality.
Operating profit / (loss) before tax
As a result of the foregoing, the operating loss before tax of this operating segment for the six months ended June 30,
2016 was €289 million, a 33.9% decrease compared with the €436 million loss recorded for the six months ended June 30,
2015.
Tax expense (income) related to profit or loss from continuing operations
Tax expense (income) related to profit or loss from continuing operations of this operating segment for the six months
ended June 30, 2016 amounted to a benefit of €80 million, a 41.0% decrease compared with the €135 million benefit
recorded for the six months ended June 30, 2015, primarily as a result of the lower operating loss before tax.
Profit / (loss) attributable to parent company
As a result of the foregoing, loss attributable to parent company of this operating segment for the six months ended
June 30, 2016 was €209 million, a 30.6% decrease compared with the €300 million loss recorded for the six months ended
June 30, 2015.
TURKEY
In accordance with IFRS 8, information for the Turkey operating segment is presented under management criteria,
pursuant to which Garanti’s information has been proportionally consolidated based on our 25.01% interest in Garanti
during the six-month period ended June 30, 2015. Since July 2015, we hold 39.90% of Garanti’s share capital and we have
fully consolidated Garanti’s results in our consolidated financial statements. Information from January 1 through June 30,
2015 is presented under management criteria according to which the assets, liabilities and income statement of Garanti are
included in every line item of the balance sheet and the income statement based on our 25.01% interest in Garanti during
such period.
53
For the Six Months Ended June 30,
2016 2015 Change
(In Millions of Euros) (In %)
Net interest income 1,606 425 277.8
Net fees and commissions 392 98 300.0
Net gains (losses) on financial assets and liabilities and net exchange differences 128 (22) n.m.(1)
Other operating income and expenses (net) (6)
34
2
7
n.m.(1)
Income and expenses on insurance and reinsurance contracts n.m.(1)
Gross income 2,154 510 n.m.(1)
Administration costs (745) (203) 267.5
Depreciation (88) (19) n.m.(1).
Net margin before provisions 1,321 289 n.m.(1)
Impairment losses on financial assets (net) (301) (71) n.m.(1)
Provisions (net) and other gains (losses) 1 1 n.m (1)
Operating profit/(loss) before tax 1,022 219 n.m.(1)
Tax expense (income) related to profit or loss from continuing operations (203) (44) n.m.(1)
Profit from continuing operations 819 174 n.m.(1)
Profit from corporate operations (net) - - -
Profit 819 174 n.m.(1)
Profit attributable to non-controlling interests (495) - -
Profit attributable to parent company 324 174 85.8
(1) Not meaningful.
As indicated above, during the six-month period ended June 30, 2016, Garanti was fully consolidated by us following
the acquisition of an additional 14.89% stake in Garanti in July 2015, whereas it was proportionally consolidated by us
based on our 25.01% interest during the prior period. Such consolidation affects the comparability of our results for the
periods discussed herein for all the accounting lines items of the income statement. Additionally, during the six months
ended June 30, 2016, the Turkish lira depreciated against the Euro in average terms, resulting in a negative exchange rate
effect on our income statement for the six months ended June 30, 2016. See “―Factors Affecting the Comparability of our
Results of Operations and Financial Condition―Trends in Exchange Rates.”
Net interest income
Net interest income of this operating segment for the six months ended June 30, 2016 was €1,606 million, a 277.8%
increase compared to the €425 million recorded for the six months ended June 30, 2015, mainly as a result of the change in
the consolidation method of Garanti, which more than offset the adverse impact of exchange rates, as well as volumes and
yields on loans and decreased cost of deposits.
Net fees and commissions
Net fees and commissions of this operating segment amounted to €392 million for the six months ended June 30, 2016,
a 300.0% increase from the €98 million recorded for the six months ended June 30, 2015, mainly due to the change in the
consolidation method of Garanti, which more than offset the negative effect of the temporary suspension of account
maintenance and administration fees (which was ordered by the Turkish Council of State in January 2016) and the
depreciation of the Turkish lira. In particular, there was an increase in fees for payment and collection services as a result
of the implementation of improvements in payment systems.
Net gains (losses) on financial assets and liabilities and net exchange differences
Net gains (losses) on financial assets and liabilities and net exchange differences of this operating segment for the six
months ended June 30, 2016 was a gain of €128 million compared to the €22 million loss recorded for the six months
ended June 30, 2015, as a result of capital gains from the divestment ALCO portfolios, €87 million gross of tax received in
54
connection with the purchase of VISA Europe Ltd. by VISA Inc. in November 2015 and gains on financial assets due to
the performance of the Global Markets unit.
Other operating income and expenses (net)
Other operating income and expenses (net) of this operating segment for the six months ended June 30, 2016 was a loss
of €6 million, compared with the €2 million gain recorded for the six months ended June 30, 2015 mainly as a result of
the impact of the depreciation of the Turkish lira on cost headings denominated in that currency, the high inflation rate
and the investments made in the upgrading, modernization and digitalization of traditional channels
Income and expenses (net) on insurance and reinsurance contracts
Income and expenses (net) on insurance and reinsurance contracts of this operating segment for the six months ended
June 30, 2016 was a gain of €34 million, compared with the €7 million gain recorded for the six months ended June 30,
2015 mainly attributable to the change in the consolidation method of Garanti.
Administration costs
Administration costs of this operating segment for the six months ended June 30, 2016 were €745 million, a 267.5%
increase from the €203 million recorded for the six months ended June 30, 2015, mainly as a result of the change in the
consolidation method of Garanti and, to a lesser extent, the high level of inflation and the 30% increase in the minimum
wage since January 2016. This increase was partially offset by the depreciation of the Turkish lira.
Impairment losses on financial assets (net)
Impairment losses on financial assets (net) of this operating segment for the six months ended June 30, 2016 was a loss
of €301 million, compared to a €71 million loss recorded for the six months ended June 30, 2015, mainly as a result of the
change in the consolidation method of Garanti, which was partially offset by the depreciation of the Turkish lira and, to a
lesser extent, increased provisions related to the subsidiary in Romania. This operating segment’s non-performing asset
ratio was 2.7% as of June 30, 2016, compared to 2.8% as of December 31, 2015.
Operating profit before tax
As a result of the foregoing, the operating profit before tax of this operating segment for the six months ended June 30,
2016 was €1,022 million, compared to €219 million recorded for the six months ended June 30, 2015. A significant portion
of our operating profit for this operating segment is attributable to our 100% consolidation of Garanti, but as we hold only
39.90% of this entity, the majority of its operating profit is allocable to its other shareholders and is recorded under “Profit
attributable to non-controlling interests”.
Tax expense ( income) related to profit or loss from continuing operations
Tax expense (income) related to profit or loss from continuing operations of this operating segment for the six months
ended June 30, 2016 was an expense of €203 million, compared with a €44 million expense recorded for the six months
ended June 30, 2015, mainly as a result of the change in the consolidation method of Garanti and the resulting increase
in operating profit before tax.
Profit attributable to parent company
As a result of the foregoing, profit attributable to parent company of this operating segment for the six months ended
June 30, 2016 was €324 million, an 85.8% increase from the €174 million recorded for the six months ended June 30,
2015. A significant portion of our operating profit for this operating segment is attributable to our 100% consolidation of
Garanti, but as we hold only 39.90% of this entity, the majority of its operating profit is allocable to its other
shareholders and is recorded under “Profit attributable to non-controlling interests”.
55
REST OF EURASIA
For the Six Months Ended June 30,
2016 2015 Change
(In Millions of Euros) (In %)
Net interest income 86 85 1.1
Net fees and commissions 92 90 1.6
Net gains (losses) on financial assets and liabilities and net exchange
differences 60 89
(32.5)
Other operating income and expenses (net) 42 - n.m.
Gross income 281 265 5.9
Administration costs (164) (169) (2.9)
Depreciation (6) (7) (14.6)
Net margin before provisions 111 89 24.4
Impairment losses on financial assets (net) (9) (28) (68.9)
Provisions (net) and other gains (losses) 2 5 (67.5)
Operating profit/(loss) before tax 104 66 56.6
Tax expense or (-) income related to profit or loss from continuing operation (28) (23) 22.6
Profit from continuing operations 75 43 72.4
Profit from corporate operations (net) - - -
Profit 75 43 72.4
Profit attributable to non-controlling interests - - -
Profit attributable to parent company 75 43 72.4
(1) Not meaningful.
Net interest income
Net interest income of this operating segment for the six months ended June 30, 2016 was €86 million, a 1.1% increase
compared to the €85 million recorded for the six months ended June 30, 2015.
Net fees and commissions
Net fees and commissions of this operating segment amounted to €92 million for the six months ended June 30, 2016,
a 1.6% increase from the €90 million recorded for the six months ended June 30, 2015.
Net gains (losses) on financial assets and liabilities and net exchange differences
Net gains (losses) on financial assets and liabilities and net exchange differences of this operating segment for the six
months ended June 30, 2016 was a gain of €60 million, a 32.5% decrease compared to the €89 million gain recorded for
the six months ended June 30, 2015, as a result of the lower contribution from trading income.
Other operating income and expenses (net)
Other operating income and expenses (net) of this operating segment for the six months ended June 30, 2016 was
income of €42 million, compared no other operating income and expenses (net) of this operating segment for the six
months ended June 30, 2015. This increase is due to the dividend received from CNCB.
56
Administration costs
Administration costs of this operating segment for the six months ended June 30, 2016 were €164 million, a 2.9%
decrease from the €169 million recorded for the six months ended June 30, 2015, as a result of lower personnel expenses.
Impairment losses on financial assets (net)
Impairment losses on financial assets (net) of this operating segment for the six months ended June 30, 2016 was €9
million, a 68.9% decrease from the €28 million recorded for the six months ended June 30, 2015, mainly as a result of
higher impairment losses in Portugal related to mortgage loans. This operating segment’s non-performing asset ratio
decreased to 2.7% as of June 30, 2016, from 2.6% as of December 31, 2015.
Operating profit before tax
As a result of the foregoing, the operating profit before tax of this operating segment for the six months ended June 30,
2016 was €104 million, a 56.6% increase from the €66 million recorded for the six months ended June 30, 2015.
Tax expense (income) related to profit or loss from continuing operations
Tax expense (income) related to profit or loss from continuing operations of this operating segment for the six months
ended June 30, 2016 was an expense of €28 million, a 22.6% increase compared with a €23 million expense recorded for
the six months ended June 30, 2015, primarily as a result of the increased operating profit before tax and higher income
subject to zero or low tax rates.
Profit attributable to parent company
As a result of the foregoing, profit attributable to parent company of this operating segment for the six months ended
June 30, 2016 was €75 million, a 74.7% increase from the €43 million recorded for the six months ended June 30, 2015.
MEXICO
For the Six Months
Ended June 30,
2016 2015 Change
(In Millions of
Euros) (In %)
Net interest income 2,556 2,731 (6.4)
Net fees and commissions 556 605 (8.1)
Net gains (losses) on financial assets and liabilities and net exchange differences 97 110 (11.6)
Other operating income and expenses (net) (114)
214
(126)
245
(10.0)
Income and expenses (net) on insurance and reinsurance contracts (12.8)
Gross income 3,309 3,565 (7.2)
Administration costs (1,077) (1,205) (10.7)
Depreciation (121) (108) 12.0
Net margin before provisions 2,112 2,252 (6.2)
Impairment losses on financial assets (net) (788) (852) (7.5)
Provisions (net) and other gains (losses) (24) (16) 47.9
Operating profit/(loss) before tax 1,300 1,384 (6.1)
Tax expense (income) related to profit or loss from continuing operations (331) (338) (2.2)
Profit from continuing operations 968 1,045 (7.4)
Profit from corporate operations (net) - - -
Profit 968 1,045 (7.4)
Profit attributable to non-controlling interests - - -
Profit attributable to parent company 968 1,045 (7.4)
57
In the six months ended June 30, 2016, the Mexican peso depreciated against the euro in average terms, resulting in a
negative exchange rate effect on our income statement for the six months ended June 30, 2015. See “―Factors Affecting
the Comparability of our Results of Operations and Financial Condition―Trends in Exchange Rates.”
Net interest income
Net interest income of this operating segment in the six months ended June 30, 2016 was €2,556 million, a 6.4%
decrease compared to the €2,731 million recorded in the six months ended June 30, 2015, mainly due to the impact of the
depreciation of the Mexican peso, which more than offset the higher volumes in lending and fund gathering.
Net fees and commissions
Net fees and commissions of this operating segment amounted to €556 million for the six months ended June 30, 2016,
an 8.1% decrease from the €605 million recorded for the six months ended June 30, 2015, mainly as a result of the
depreciation of the Mexican peso, which more than offset the increase in fees from credit cards (mainly from cash
advances), fees from securities services and maintenance and administration fees for current accounts.
Net gains (losses) on financial assets and liabilities and net exchange differences
Net gains (losses) on financial assets and liabilities and net exchange differences of this operating segment for the six
months ended June 30, 2016, was a gain of €97 million, an 11.6% decrease compared to the €110 million gain recorded for
the six months ended June 30, 2015, mainly as a result of the impact of the depreciation of the Mexican peso, which more
than offset the higher contribution from trading income, in particular in our Global Markets unit, and due to an increase in
the volume of exchange rate operations with customers.
Other operating income and expenses (net)
Other operating income and expenses (net) of this operating segment for the six months ended June 30, 2016 was a loss
of €114 million, a 10.0% decrease compared with the €126 million loss recorded for the six months ended June 30, 2015
mainly as a result of the depreciation of the Mexican peso and the contribution to the local deposit guarantee fund
(IPAB).
Income and expenses (net) on insurance and reinsurance contracts
Income and expenses (net) on insurance and reinsurance contracts of this operating segment for the six months ended
June 30, 2016 was a gain of €214 million, a 12.8% decrease compared with the €245 million gain recorded for the six
months ended June 30, 2015, primarily as a result of the depreciation of the Mexican peso.
Administration costs
Administration costs of this operating segment for the six months ended June 30, 2016 were €1,077 million, a 10.7%
decrease from the €1,205 million recorded for the six months ended June 30, 2015, mainly as a result of the impact of the
depreciation of the Mexican peso, which more than offset an increase in wages, due to inflation, and general expenses,
mainly as a result of the change of headquarters and the ongoing renovation and remodeling of branch offices.
Impairment losses on financial assets (net)
Impairment losses on financial assets (net) of this operating segment for the six months ended June 30, 2016 was €788
million, a 7.5% decrease from the €852 million recorded for the six months ended June 30, 2015, mainly as a result of the
impact of the depreciation of the Mexican peso, which more than offset a higher growth activity. This operating segment’s
non-performing asset ratio decreased to 2.5% as of June 30, 2016, from 2.6% as of December 31, 2015.
58
Operating profit before tax
As a result of the foregoing, the operating profit before tax of this operating segment for the six months ended June 30,
2016 was €1,300 million, a 6.1% decrease from the €1,384 million recorded for the six months ended June 30, 2015.
Tax expense (income) related to profit or loss from continuing operations
Tax expense (income) related to profit or loss from continuing operations of this operating segment for the six months
ended June 30, 2016 was an expense of €331 million, a 2.2% decrease compared with a €338 million expense recorded for
the six months ended June 30, 2015, mainly as a result of the decreased operating profit before tax.
Profit attributable to parent company
As a result of the foregoing, profit attributable to parent company of this operating segment for the six months ended
June 30, 2016 was €968 million, a 7.4% decrease from the €1,045 million recorded for the six months ended June 30,
2015.
SOUTH AMERICA
For the Six Months Ended June 30,
2016 2015 Change
(In Millions of Euros) (In %)
Net interest income 1,441 1,652 (12.8)
Net fees and commissions 299 360 (17.0)
Net gains (losses) on financial assets and liabilities and net exchange differences 319 306 4.3
Other operating income and expenses (net) (127)
67
(106)
84
20.1
Income and expenses (net) on insurance and reinsurance contracts (19.4)
Gross income 1,999 2,296 (12.9)
Administration costs (874) (958) (8.8)
Depreciation (47) (53) (11.6)
Net margin before provisions 1,078 1,285 (16.1)
Impairment losses on financial assets (net) (245) (310) (20.9)
Provisions (net) and other gains (losses) (29) (45) (36.8)
Operating profit/(loss) before tax 804 929 (13.5)
Tax expense (income) related to profit or loss from continuing operations (271) (272) (0.6)
Profit from continuing operations 533 657 (18.9)
Profit from corporate operations (net) - - -
Profit 533 657 (18.9)
Profit attributable to non-controlling interests (139) (182) (23.5)
Profit attributable to parent company 394 475 (17.1)
In the six months ended June 30, 2016 all the currencies of this region depreciated in period-average terms against the
euro compared to the six months ended June 30, 2015 with the Venezuelan bolivar experiencing particularly large declines
against the euro. This resulted in a negative impact on the results of operations of the South America operating segment for
the six months ended June 30, 2016 expressed in euro. See “―Factors Affecting the Comparability of our Results of
Operations and Financial Condition―Trends in Exchange Rates”.
59
Net interest income
Net interest income of this operating segment in the six months ended June 30, 2016 was €1,441 million, a 12.8%
decrease compared to the €1,652 million recorded in the six months ended June 30, 2015, mainly as a result of the impact
of the depreciation of the Venezuelan bolivar and Argentine peso, which more than offset the impact of the increased
activity and growing customer spreads.
Net fees and commissions
Net fees and commissions of this operating segment amounted to €299 million in the six months ended June 30, 2016,
a 17.0% decrease from the €360 million recorded in the six months ended June 30, 2015, mainly as a result of the impact of
the depreciation of the Venezuelan bolivar and Argentine peso, which more than offset the increase in fees related to bills,
receivables, checks and credit cards, particularly in Argentina, Colombia and Venezuela.
Net gains (losses) on financial assets and liabilities and net exchange differences
Net gains (losses) on financial assets and liabilities and net exchange differences of this operating segment in the six
months ended June 30, 2016 was a gain of €319 million, a 4.3% increase compared to the €306 million gain recorded in the
six months ended June 30, 2015, primarily due to the performance in Argentina, following the removal of foreign exchange
controls in the country, and to a lesser extent the impact of the depreciation of the Argentine peso.
Other operating income and expenses (net)
Other operating income and expenses (net) of this operating segment for the six months ended June 30, 2016 was a
loss of €127 million, compared with the €106 million loss recorded for the six months ended June 30, 2015 mainly as a
result of increased operating expenses resulting from the high rate of inflation in some countries in the region, the adverse
impact of cost units denominated in U.S. dollars, as a result of the dollar’s appreciation against euro, and certain
investments in the region, which more than offset the impact of the depreciation of the Venezuelan bolivar, the Argentine
peso and other currencies in the region.
Income and expenses (net) on insurance and reinsurance contracts
Income and expenses (net) on insurance and reinsurance contracts of this operating segment for the six months ended
June 30, 2016 was a gain of €67 million, a 19.4% decrease compared with the €84 million gain recorded for the six
months ended June 30, 2015 mainly as a result of the impact of the depreciation of the Venezuelan bolivar, the Argentine
peso and other currencies in the region against the euro.
Administration costs
Administration costs of this operating segment in the six months ended June 30, 2016 were €874 million, an 8.8%
decrease from the €958 million recorded in the six months ended June 30, 2015, mainly as a result of the impact of the
depreciation of the Venezuelan bolivar and Argentine peso, which more than offset the impact of inflation in certain
countries in the region and higher personnel and general expenses as denominated in local currencies.
Impairment losses on financial assets (net)
Impairment losses on financial assets (net) of this operating segment in the six months ended June 30, 2016 was €245
million, a 20.9% decrease from the €310 million recorded in the six months ended June 30, 2015, mainly as a result of the
depreciation of all the currencies of this region, especially the Venezuelan bolivar and, a lesser extent, a decrease in
provisions, particularly in Colombia and Chile. This operating segment’s non-performing asset ratio was 2.7% as of June
30, 2016, compared to 2.3% as of December 31, 2015.
Operating profit before tax
As a result of the foregoing, the operating profit before tax of this operating segment in the six months ended June 30,
2016 was €804 million, a 13.5% decrease from the €929 million recorded in the six months ended June 30, 2015.
60
Tax expense (income) related to profit or loss from continuing operations
Tax expense (income) related to profit or loss from continuing operations of this operating segment in the six months
ended June 30, 2016 was an expense of €271 million, a 3.1% decrease compared with a €272 million expense recorded in
the six months ended June 30, 2015, mainly as a result of lower operating profit before tax, the effect of hyperinflation in
Venezuela and higher tax expense in Colombia.
Profit attributable to parent company
As a result of the foregoing, profit attributable to parent company of this operating segment in the six months ended
June 30, 2016 was €394 million, a 17.1% decrease from the €475 million recorded in the six months ended June 30, 2015.
UNITED STATES
For the Six Months Ended June 30,
2016 2015 Change
(In Millions of Euros) (In %)
Net interest income 938 883 6.3
Net fees and commissions 306 316 (3.2)
Net gains (losses) on financial assets and liabilities and net exchange differences 93 107 (12.8)
Other operating income and expenses (net) (8) 16 n.m.(1)
Gross income 1,330 1,321 0.7
Administration costs (811) (777) 4.4
Depreciation (94) (104) (9.6)
Net margin before provisions 424 440 (3.6)
Impairment losses on financial assets (net) (149) (62) 137.9
Provisions (net) and other gains (losses) (35) 3 n.m.(1)
Operating profit/(loss) before tax 240 381 (37.1)
Tax expense (income) related to profit or loss from continuing operations (62) (105) (41.1)
Profit from continuing operations 178 276 (35.5)
Profit from corporate operations (net) - - -
Profit 178 276 (35.5)
Profit attributable to non-controlling interests - - -
Profit attributable to parent company 178 276 (35.5)
(1) Not meaningful.
In the six months ended June 30, 2016, the U.S. dollar depreciated against the euro in average terms, resulting in a
negative exchange rate effect on our income statement. See “―Factors Affecting the Comparability of our Results of
Operations and Financial Condition―Trends in Exchange Rates”.
Net interest income
Net interest income of this operating segment for the six months ended June 30, 2016 was €938 million, a 6.3%
increase compared to the €883 million recorded for the six months ended June 30, 2015, as a result of the increased activity
and stable cost of deposits while the yield on new loan production grew.
Net fees and commissions
Net fees and commissions of this operating segment amounted to €306 million for the six months ended June 30, 2016,
a 3.2% decrease from the €316 million recorded for the six months ended June 30, 2015, as a result of the lower
61
commissions from securities services and, to a lesser extent, lower commissions in the Global Markets unit, partially offset
by higher commissions from mutual funds.
Net gains (losses) on financial assets and liabilities and net exchange differences
Net gains (losses) on financial assets and liabilities and net exchange differences of this operating segment for the six
months ended June 30, 2016 was a gain of €93 million, a 12.8% decrease compared to the €107 million gain recorded for
the six months ended June 30, 2015, mainly as a result of the difficult situation in the markets and lower sales of ALCO
portfolios.
Other operating income and expenses (net)
Other operating income and expenses (net) of this operating segment for the six months ended June 30, 2016 was a
loss of €8 million, compared to the €16 million gain recorded for the six months ended June 30, 2015 , mainly as a result of
lower income as a result of the sale of Capital Investment Counsel and lower dividends from the Federal Reserve System.
Administration costs
Administration costs of this operating segment for the six months ended June 30, 2016 were €811 million, a 4.4%
increase from the €777 million recorded for the six months ended June 30, 2015, mainly as a result of the increase in
headcount as a result of certain acquisitions.
Impairment losses on financial assets (net)
Impairment losses on financial assets (net) of this operating segment for the six months ended June 30, 2016 was €149
million, a 137.9% increase from the €62 million recorded for the six months ended June 30, 2015, mainly as a result of the
growth in activity, and particularly to the rise in provisions following the rating downgrades on some companies that
operate in energy, metal and mining sectors. This operating segment’s non-performing asset ratio was 1.6% as of June 30,
2016, compared to 0.9% as of December 31, 2015.
Operating profit before tax
As a result of the foregoing, the operating profit before tax of this operating segment for the six months ended June 30,
2016 was €240 million, a 37.1% decrease from the €381 million recorded for the six months ended June 30, 2015.
Tax expense (income) related to profit or loss from continuing operations
Tax expense (income) related to profit or loss from continuing operations of this operating segment for the six months
ended June 30, 2016 was an expense of €62 million, a 41.1% decrease compared with a €105 million expense recorded for
the six months ended June 30, 2015, mainly due to the lower operating profit before tax.
Profit attributable to parent company
As a result of the foregoing, profit attributable to parent company of this operating segment for the six months ended
June 30, 2016 was €178 million, a 35.5% increase from the €276 million recorded for the six months ended June 30, 2015.
62
CORPORATE CENTER
For the Six Months Ended June 30,
2016 2015 Change
(In Millions of Euros) (In %)
Net interest income (247) (224) 10.0
Net fees and commissions (68) (64) 6.1
Net gains (losses) on financial assets and liabilities and net exchange differences 88 (159) (44.7)
Other operating income and expenses (net) 82 80 3.4
Gross income (144) (49) 191.7
Administration costs (278) (314) (11.5)
Depreciation (161) (118) 35.6
Net margin before provisions (583) (482) 20.9
Impairment losses on financial assets (net) (26) 5 n.m.(1)
Provisions (net) and other gains (losses) (78) (61) 27.7
Operating profit/(loss) before tax (686) (538) 27.7
Tax expense (income) related to profit or loss from continuing operations 172 141 22.0
Profit/(loss) from continuing operations (515) (397) 29.7
Profit/(loss) from corporate operations (net) - 727 -
Profit/(loss) (515) 330 n.m.(1)
Profit/(loss) attributable to non-controlling interests (3) (15) (81.7)
Profit/(loss) attributable to parent company (518) 315 n.m.(1)
(1) Not meaningful.
Net interest income
Net interest income of this operating segment for the six months ended June 30, 2016 was an expense of €247 million,
a 10.0% increase compared to the €224 million expense recorded for the six months ended June 30, 2015, primarily as a
result of higher funding cost due to the increased stake in Garanti
Net fees and commissions
Net fees and commissions of this operating segment amounted to an expense of €68 million for the six months ended
June 30, 2016, compared to an expense of €64 million recorded for the six months ended June 30, 2015, mainly due to
lower fees and commissions in funds.
Net gains (losses) on financial assets and liabilities and net exchange differences
Net gains (losses) on financial assets and liabilities and net exchange differences of this operating segment for the six
months ended June 30, 2016 was a gain of €88 million compared to the €159 million gain recorded for the six months
ended June 30, 2015, when there were capital gains from sales of our holdings in industrial and financial companies
booked in this operating segment.
Other operating income and expenses (net)
Other operating income and expenses (net) of this operating segment for the six months ended June 30, 2016 was
income of €82 million, a 3.4% increase compared to the €80 million of income recorded for the six months ended June 30,
2015.
63
Administration costs
Administration costs of this operating segment for the six months ended June 30, 2016 were €278 million, an 11.5%
decrease from the €314 million recorded for the six months ended June 30, 2015 due to lower restructuring costs.
Impairment losses on financial assets (net)
Impairment losses on financial assets (net) of this operating segment for the six months ended June 30, 2016 was a loss
of €26 million, compared to the gain of €5 million recorded for the six months ended June 30, 2015. This change was
primarily a result of higher impairment of debt securities and higher country risk loan-loss provisions.
Provisions (net) and other gains (losses)
Provisions (net) and other gains (losses) of this operating segment for the six months ended June 30, 2016 was a €78
million loss, an increase of 27.9% compared to the loss of €61 million recorded for the six months ended June 30, 2015,
mainly due to higher provisions for early retirements.
Operating profit / (loss) before tax
As a result of the foregoing, the operating loss before tax of this operating segment for the six months ended June 30,
2016 was a loss of €686 million, a 27.7% increase from the €538 million loss recorded for the six months ended June 30,
2015.
Tax expense (income) related to profit or loss from continuing operations
Tax expense (income) related to profit or loss from continuing operations of this operating segment for the six months
ended June 30, 2016 was a benefit of €172 million, a 22.0% increase compared with a €141 million benefit recorded for the
six months ended June 30, 2015. We recorded income related to profit in both periods in this operating segment as a result
of its operating loss before tax during such periods.
Profit from corporate operations (net)
There was no profit from corporate operations for this operating segment for the six months ended June 30, 2016,
compared to €727 million gain for the six months ended June 30, 2015. Profit from corporate operations gains for the six
months ended June 30, 2015 resulted from the sale of the 6.43% stake in CNCB.
Profit / (loss) attributable to parent company
As a result of the foregoing, profit attributable to parent company of this operating segment for the six months ended
June 30, 2016 was a loss of €518 million, compared to a profit of €315 million recorded for the six months ended June 30,
2015.
Liquidity and Capital Resources
Liquidity risk management and controls are explained in Note 7.5 to the Interim Consolidated Financial
Statements. In addition, information on encumbered assets is provided in Note 7.6 to the Interim Consolidated
Financial Statements and information on outstanding contractual maturities of assets and liabilities is provided in
Note 7.7 to the Interim Consolidated Financial Statements. For information concerning our short-term borrowing,
see “Selected Statistical Information—Liabilities—Short-term Borrowings”.
Liquidity and finance management of the BBVA Group’s balance sheet seeks to fund the growth of the banking
business at suitable maturities and costs, using a wide range of instruments that provide access to a large number of
alternative sources of finance.
A core principle in the BBVA Group’s liquidity and finance management is the financial independence of its
banking subsidiaries. This aims to ensure that the cost of liquidity is correctly reflected in price formation.
64
Accordingly, we maintain a liquidity pool at an individual entity level at each of Banco Bilbao Vizcaya Argentaria,
S.A. and our banking subsidiaries, including BBVA Compass, BBVA Bancomer and our Latin American
subsidiaries. The only exception to this principle are Garanti, which is not included in such pool yet, and Banco
Bilbao Vizcaya Argentaria (Portugal), S.A., which is funded by Banco Bilbao Vizcaya Argentaria, S.A. Banco
Bilbao Vizcaya Argentaria (Portugal), S.A. represented 0.64% of our total consolidated assets and 0.54% of our
total consolidated liabilities as of June 30, 2016.
The table below shows the composition of the liquidity pool of Banco Bilbao Vizcaya Argentaria, S.A. and
each of our significant subsidiaries as of June 30, 2016:
BBVA
Eurozone (1)
BBVA
Bancomer
BBVA
Compass
Garanti
Bank Others
(In Millions of Euros)
Cash and balances with central banks 5,118 5,887 2,825 6,091 5,791
Assets for credit operations with central banks 53,773 7,012 2,.522 7,090 5,080
Central governments issues 33,855 5,051 9,775 7,090 5,004
Of Which: Spanish government securities 30,601 - - - -
Other issues 19,917 1,960 181 - 76
Loans - - 14,566 - -
Other non-eligible liquid assets 6,798 888 452 1,662 801
Accumulated available balance 65,689 13,787 27,799 14,842 11,672
Average balance (2) 67,887 13,385 26,908 13,679 11,589
(1) Includes Banco Bilbao Vizcaya Argentaria, S.A. and Banco Bilbao Vizcaya Argentaria (Portugal), S.A.
(2) Average balance for the six months ended June 30, 2016, based on the beginning and the day-end balances during each period.
As indicated above, BBVA Group’s liquidity and finance management is based on the principle of the financial
autonomy of the entities that make it up. This approach helps limit liquidity risk by reducing the Group’s
vulnerability in periods of high risk. The decentralized management helps avoid possible contagion in the event of a
crisis that initially affecting only one or various BBVA Group entities; such entities must cover their liquidity needs
independently in the markets where they operate. Liquidity Management Units (“LMUs”) have been set up for this
reason in the geographical areas within the Eurozone where our main foreign subsidiaries and the parent company of
the Group (Banco Bilbao Vizcaya Argentaria, S.A.) operate to manage BBVA Portugal and the recent Catalunya
Banc acquisition, among others.
The Finance Division, through balance sheet management, manages the BBVA Group’s liquidity and funding.
It plans and executes the funding of the long-term structural gap of each LMU and proposes to the ALCO the
actions to adopt in this regard in accordance with the policies and limits established by the Standing Committee.
The Bank manages liquidity and funding risk by using the Loan-to-Stable-Customer-Deposits (“LtSCD”) ratio.
The aim is to preserve a stable funding structure in the medium term for each LMU with the goal of maintaining an
adequate volume of stable customer funds at each LMU to achieve a sound liquidity profile. Such stable funds in
each LMU are calculated by analyzing the behavior of the balance sheets of the different customer segments
identified as likely to provide stability to the funding structure, and by prioritizing established relationships and
reducing funding lines of less stable customers.
For the purpose of establishing the (maximum) target levels for LtSCD in each LMU and providing an optimal
funding structure reference in terms of risk appetite, the Structural Risk team (which is part of our Global Risk
Management) identifies and assesses the economic and financial variables that condition the funding structures in
the various geographical areas. The behavior of LtSCD in each LMU reflects that the funding structure remained
65
robust in 2016, given that all of our LMUs maintained levels of self-funding with stable customer funds which were
higher than required levels.
The second core element in liquidity and funding risk management is to achieve proper diversification of the
funding structure, avoiding excessive reliance on short-term funding and establishing a maximum level of short-term
borrowing comprising both wholesale funding as well as less stable funds from non-retail customers.
The third element promotes the short-term resilience of the liquidity risk profile, making sure that each LMU
has sufficient collateral to address the risk of wholesale markets closing. “Basic Capacity” is a short-term liquidity
risk management and control metric that is defined as the relationship between the available explicit assets and the
maturities of wholesale liabilities and volatile funds, at different terms, with special relevance being given to 30-day
maturities.
Our principal source of funds is our customer deposit base, which consists primarily of demand, savings and
time deposits. In addition to relying on our customer deposits, we also access the interbank market (overnight and
time deposits) and domestic Spanish and international capital markets for our additional liquidity requirements. To
access the capital markets, we have in place a series of domestic Spanish and international programs for the issuance
of commercial paper and medium- and long-term debt. Another source of liquidity is the generation of cash flow
from our operations. Finally, we supplement our funding requirements with borrowings from the Bank of Spain and
from the ECB or the respective central banks of the countries where our subsidiaries are located. See Note 9 to the
Interim Consolidated Financial Statements for information on our borrowings from central banks.
The following table shows the balances as of June 30, 2016 and December 31, 2015 of our principal sources
of funds (including accrued interest, hedge transactions and issue expenses):
As of June 30, As of December 31,
2016 2015
(In Millions of Euros)
Deposits from central banks 32,709 40,087
Deposits from credit institutions 69,118 68,543
Customer deposits 406,284 403,362
Debt certificates 75,498 81,980
Other financial liabilities 14,137 12,141
Total 597,746 606,113
Customer deposits
Customer deposits amounted to €406,284 million as of June 30, 2016, compared to €403,362 million as of
December 31, 2015. The increase from December 31, 2015 to June 30, 2016 was primarily due to the acquisition of
the additional stake in Garanti and Catalunya Banc.
Our customer deposits, excluding assets sold under repurchase agreements amounted to €387,643 million as of
June 30, 2016 compared to €380,095 million as of December 31, 2015.
Amounts due to credit institutions
Amounts due to credit institutions, including central banks, amounted to €101,827 million as of June 30, 2016,
compared to €108,630 million as of December 31, 2015. The decrease as of June 30, 2016 compared to December
31, 2015 was mainly related to the lower volume of deposits from central banks.
66
As of June 30, As of December 31, As of June 30,
2016 2015 2015
(In Millions of Euros)
Deposits from credit institutions 69,118 68,543 54,338
Deposits from central banks 32,709 40,087 36,195
Total Deposits from credit institutions 101,827 108,630 90,533
Capital markets
We make debt issuances in the domestic and international capital markets in order to finance our activities and
as of June 30, 2016, we had €58,614 million of senior debt outstanding, comprising €57,270 million in bonds and
debentures and €1,345 million in promissory notes and other securities, compared to €66,165 million, €65,517
million and €648 million outstanding as of December 31, 2015, respectively. See Note 22.3 to the Interim
Consolidated Financial Statements.
In addition, we had a total of €15,460 million in subordinated debt and €962 million in preferred securities
outstanding as of June 30, 2016, compared to €14,324 million and €974 million as of December 31, 2015,
respectively.
The breakdown of the outstanding subordinated debt and preferred securities by entity issuer, maturity, interest
rate and currency is disclosed in Appendix VI of the Interim Consolidated Financial Statements.
The following is a breakdown as of June 30, 2016, of the maturities of our deposits from credit institutions and
subordinated liabilities, disregarding any valuation adjustments and accrued interest (regulatory equity instruments
have been classified according to their contractual maturity):
Consolidated income statement ......................................................................................................................................F-6
Consolidated statements of recognized income and expenses ...........................................................................................F-8
Consolidated statements of changes in equity ..................................................................................................................F-9
Consolidated statements of cash flows.......................................................................................................................... F-12
NOTES TO THE ACCOMPANYING CONSOLIDATED FINANCIAL STATEMENTS
1. Introduction, basis for the presentation of the interim consolidated financial statements, internal control of financial information and other information. ...................................................................................................................... F-13
2. Principles of consolidation, accounting policies and measurement bases applied and recent IFRS pronouncements .. F-16 3. BBVA Group ...................................................................................................................................................... F-40 4. Shareholder remuneration system ....................................................................................................................... F-44 5. Earnings per share ............................................................................................................................................. F-45 6. Operating segment reporting .............................................................................................................................. F-46 7. Risk management .............................................................................................................................................. F-49 8. Fair value ....................................................................................................................................................... F-92 9. Cash and cash balances at centrals and banks and other demands deposits ......................................................... F-101 10. Financial assets and liabilities held for trading ...................................................................................................... F-101 11. Financial assets and liabilities designated at fair value through profit or loss ........................................................... F-105 12. Available-for-sale financial assets ......................................................................................................................... F-105 13. Loans and receivables ...................................................................................................................................... F-110 14. Held-to-maturity investments ............................................................................................................................. F-113 15. Derivatives hedge accounting and fair value changes of the hedged items in portfolio hedge of interest rate risk ..... F-115 16. Investments in subsidiaries, joint ventures and associates .................................................................................... F-118 17. Tangible assets ................................................................................................................................................. F-120 18. Intangible assets ............................................................................................................................................... F-121 19. Tax assets and liabilities ..................................................................................................................................... F-123 20. Other assets and liabilities .................................................................................................................................. F-127 21. Non-current assets and disposal groups classified as held for sale ......................................................................... F-128 22. Financial liabilities at amortized cost ................................................................................................................... F-128 23. Liabilities under reinsurance and insurance contracts ........................................................................................... F-133 24. Provisions ...................................................................................................................................................... F-135 25. Post-employment commitments and others ........................................................................................................ F-136 26. Common stock ................................................................................................................................................. F-144 27. Share premium ................................................................................................................................................. F-145 28. Retained earnings, revaluation reserves and other reserves ................................................................................. F-146 29. Treasury shares ................................................................................................................................................ F-148 30. Accumulated other comprehensive income ........................................................................................................ F-149 31. Non-controlling interests .................................................................................................................................... F-149 32. Capital base and capital management ................................................................................................................ F-150 33. Commitments and guarantees given .................................................................................................................. F-153 34. Other contingent assets and liabilities ................................................................................................................. F-153 35. Purchase and sale commitments and future payment obligations ......................................................................... F-154 36. Transactions on behalf of third parties ................................................................................................................ F-154 37. Interest income and expense ............................................................................................................................. F-155
F-2
38. Dividend income ............................................................................................................................................... F-158 39. Share of profit or loss of entities accounted for using the equity method ............................................................... F-158 40. Fee and commission income ............................................................................................................................. F-158 41. Fee and commission expenses .......................................................................................................................... F-159 42. Gains (losses) on financial assets and liabilities (net) ............................................................................................. F-159 43. Other operating income and expenses and insurance and reinsurance contracts incomes and expenses ................. F-160 44. Administration costs .......................................................................................................................................... F-161 45. Depreciation ..................................................................................................................................................... F-165 46. Provisions or reversal of provisions..................................................................................................................... F-165 47. Impairment or reversal of impairment on financial assets not measured at fair value through profit or loss .............. F-165 48. Impairment or reversal of impairment on non-financial assets ............................................................................... F-166 49. Gains (losses) on derecognized of non financial assets and subsidiaries, net .......................................................... F-166 50. Profit or loss from non-current assets and disposal groups classified as held for sale not qualifying as discontinued
operations ...................................................................................................................................................... F-167 51. Consolidated statements of cash flows ............................................................................................................... F-167 52. Accountant fees and services ............................................................................................................................. F-168 53. Related-party transactions .................................................................................................................................. F-168 54. Remuneration and other benefits received by the Board of Directors and members of the Bank’s Senior Management ....
...................................................................................................................................................... F-170 55. Other information ............................................................................................................................................. F-174 56. Subsequent events ........................................................................................................................................... F-176 APPENDIX I Additional information on consolidated subsidiaries and consolidated structured entities composing the BBVA
Group ......................................................................................................................................................... A-1 APPENDIX II Additional information on investments in subsidiaries, joint ventures and associates in the BBVA Group ........ A-11 APPENDIX III Changes and notification of investments and divestments in the BBVA Group in the six month ended June 30,
2016 ....................................................................................................................................................... A-12 APPENDIX IV Fully consolidated subsidiaries with more than 10% owned by non-Group shareholders as of June 30, 2016 .....
....................................................................................................................................................... A-15 APPENDIX V BBVA Group’s structured entities. Securitization funds ............................................................................... A-16 APPENDIX VI Details of the outstanding subordinated debt and preferred securities issued by the Bank or entities in the Group
consolidated as of June 30, 2016 and December 31, 2015 ................................................................................. A-17 APPENDIX VII Consolidated balance sheets held in foreign currency as of June 30, 2016 and December 31, 2015 ......... A-21 APPENDIX VIII Information on data derived from the special accounting registry ............................................................. A-22 APPENDIX IX Quantitative information on refinancing and restructuring operations and other requirement under Bank of Spain
Circular 6/2012 ................................................................................................................................................. A-28 APPENDIX X Additional information on Sovereign Risk .................................................................................................. A-37 APPENDIX XI Additional information on Risk Concentration ........................................................................................... A-40 APPENDIX XII – Reconciliation of Financial Statements .................................................................................................. A-48
GLOSSARY
F-3
Unaudited consolidated balance sheets as of June 30, 2016 and December 31, 2015
Millions of Euros
ASSETS NotesJune
2016
December
2015
CASH, CASH BALANCES AT CENTRAL BANKS AND OTHER DEMAND
DEPOSITS 9 25,127 29,282
FINANCIAL ASSETS HELD FOR TRADING 10 84,532 78,326
Derivatives 46,579 40,902
Equity instruments 3,804 4,534
Debt securities 34,051 32,825
Loans and advances to central banks - -
Loans and advances to credit institutions - -
Loans and advances to customers 98 65
FINANCIAL ASSETS DESIGNATED AT FAIR VALUE THROUGH PROFIT OR
The accompanying Notes 1 to 56 and Appendix I to XII are an integral part of the consolidated balance sheet as of June 30, 2016 and December 31, 2015.
F-6
Unaudited consolidated income statements for the six months ended June 30, 2016 and 2015.
Millions of Euros
NotesJune
2016
June
2015
INTEREST INCOME 37 13,702 10,665
INTEREST EXPENSES 37 (5,338) (3,570)
NET INTEREST INCOME 8,365 7,096
DIVIDEND INCOME 38 301 236
SHARE OF PROFIT OR LOSS OF ENTITIES ACCOUNTED FOR USING
THE EQUITY METHOD 39 1 195
FEE AND COMMISSION INCOME 40 3,313 2,801
FEE AND COMMISSION EXPENSES 41 (963) (682)
GAINS OR (-) LOSSES ON DERECOGNITION OF FINANCIAL ASSETS
AND LIABILITIES NOT MEASURED AT FAIR VALUE THROUGH PROFIT
OR LOSS, NET 42 683 649
GAINS OR (-) LOSSES ON FINANCIAL ASSETS AND LIABILITIES
DESIGNATED AT FAIR VALUE THROUGH PROFIT OR LOSS, NET 42 24 17
GAINS OR (-) LOSSES ON FINANCIAL ASSETS AND LIABILITIES HELD
FOR TRADING, NET 42 106 161
GAINS OR (-) LOSSES FROM HEDGE ACCOUNTING, NET 42 (171) -
EXCHANGE DIFFERENCES (NET) 533 620
OTHER OPERATING INCOME 43 715 546
OTHER OPERATING EXPENSES 43 (1,186) (911)
INCOME ON INSURANCE AND REINSURANCE CONTRACTS 43 1,958 1,725
EXPENSES ON INSURANCE AND REINSURANCE CONTRACTS 43 (1,446) (1,233)
GROSS INCOME 12,233 11,219
ADMINISTRATION COSTS 44 (5,644) (4,927)
Personnel expenses (3,324) (2,888)
Other administrative expenses (2,319) (2,039)
DEPRECIATION 45 (689) (572)
PROVISIONS OR (-) REVERSAL OF PROVISIONS 46 (262) (392)
IMPAIRMENT OR (-) REVERSAL OF IMPAIRMENT ON FINANCIAL
ASSETS NOT MEASURED AT FAIR VALUE THROUGH PROFIT OR LOSS 47 (2,110) (2,137)
Financial assets measured at cost - -
Available- for-sale financial assets (133) (3)
Loans and receivables (1,977) (2,134)
Held to maturity investments - -
NET OPERATING INCOME 3,528 3,192
The accompanying Notes 1 to 56 and Appendix I to XII are an integral part of the consolidated income statement corresponding to the six months ended June 30, 2016 and 2015.
F-7
Unaudited consolidated income statements for the six months ended June 30, 2016 and 2015.
Millions of Euros
(Continued) NotesJune
2016
June
2015
NET OPERATING INCOME 3,528 3,192
IMPAIRMENT OR (-) REVERSAL OF IMPAIRMENT OF INVESTMENTS IN
SUBSIDARIES, JOINT VENTURES AND ASSOCIATES - -
IMPAIRMENT OR (-) REVERSAL OF IMPAIRMENT ON NON-FINANCIAL
ASSETS 48 (99) (128)
Tangible assets (19) (25)
Intangible assets - (3)
Other assets (80) (100)
GAINS (LOSSES) ON DERECOGNIZED OF NON FINANCIAL ASSETS
AND SUBSIDIARIES, NET 49 37 23
Of which: Investments in subsidiaries, joint ventures and associates 29 (25)
NEGATIVE GOODWILL RECOGNISED IN PROFIT OR LOSS 18 - 22
PROFIT OR (-) LOSS FROM NON-CURRENT ASSETS AND DISPOSAL
GROUPS CLASSIFIED AS HELD FOR SALE NOT QUALIFYING AS
DISCONTINUED OPERATIONS
50 (75) 791
OPERATING PROFIT BEFORE TAX 3,391 3,899
TAX EXPENSE OR (-) INCOME RELATED TO PROFIT OR LOSS FROM
CONTINUING OPERATION 20 (920) (941)
PROFIT FROM CONTINUING OPERATIONS 2,471 2,958
PROFIT FROM DISCONTINUED OPERATIONS (NET) 50 - -
PROFIT 2,471 2,958
Attributable to minority interest [non-controlling interests] 31 639 200
Attributable to owners of the parent 1,832 2,759
Euros
NotesJune
2016
June
2015
EARNINGS PER SHARE 5 0.27 0.41
Basic earnings per share from continued operations 0.27 0.41
Diluted earnings per share from continued operations 0.27 0.41
Basic earnings per share from discontinued operations - -
Diluted earnings per share from discontinued operations - -
The accompanying Notes 1 to 56 and Appendix I to XII are an integral part of the consolidated income statement corresponding to the six months ended June 30, 2016 and 2015.
F-8
Unaudited consolidated statements of recognized income and expenses for the six months ended June 30, 2016 and 2015.
Millions of Euros
June
2016
June
2015 (*)
PROFIT RECOGNIZED IN INCOME STATEMENT 2,471 2,958
OTHER RECOGNIZED INCOME (EXPENSES) (1,003) (3,390)
ITEMS NOT SUBJECT TO RECLASSIFICATION TO INCOME STATEMENT (84) 3
Actuarial gains and losses from defined benefit pension plans (117) 5
Non-current assets available for sale - -
Entities under the equity method of accounting - -
Income tax related to items not subject to reclassification to income statement 33 (2)
ITEMS SUBJECT TO RECLASSIFICATION TO INCOME STATEMENT (919) (3,393)
Hedge of net investments in foreign operations [effective portion] (53) (104)
Valuation gains or (-) losses taken to equity (53) (104)
Transferred to profit or loss - -
Other reclassifications - -
Foreign currency translation (932) (1,252)
Valuation gains or (-) losses taken to equity (932) (1,253)
Transferred to profit or loss - 1
Other reclassifications - -
Cash flow hedges [effective portion] 138 (83)
Valuation gains or (-) losses taken to equity 158 (60)
Transferred to profit or loss (20) (23)
Transferred to initial carrying amount of hedged items - -
Other reclassifications - -
Available-for-sale financial assets 82 (2,297)
Valuation gains or (-) losses taken to equity 551 (1,093)
Transferred to profit or loss (469) (1,211)
Other reclassifications - 7 Non-current assets held for sale - -
Valuation gains or (-) losses taken to equity - -
Transferred to profit or loss - -
Other reclassifications - -
Entities accounted for using the equity method (82) (319)
Income tax (72) 662
TOTAL RECOGNIZED INCOME/EXPENSES 1,468 (431)
Attributable to minority interest [non-controlling interests] 614 (630)
Attributable to the parent company 854 199
The accompanying Notes 1 to 56 and Appendix I to XII are an integral part of the consolidated statement of recognized income and expenses for the six months ended June 30, 2016 and 2015.
F-9
Unaudited consolidated statements of changes in equity for the six months ended June 30, 2016 and 2015.
JUNE 2016Valuatio n
adjustmentsR est
Balances as of January 1, 2016 3,120 23,992 - 35 22,588 22 (98) (309) 2 ,642 (1,352) (3 ,349) (1,346) 9 ,495 55,439
Other increases o (-) decreases in equity - - - 11 (30) - (2) - - (147) - - (4) (172)
Balances as of June 30, 2016 3,175 23,992 - 21 23,797 21 (133) (166) 1,832 (777) (4 ,327) (1,371) 9 ,898 55,962
(- ) T reasury
shares
P ro fit o r lo ss
at tributable to
o wners o f the
parent
Interim
div idends
A ccumulated
o ther
co mprehensive
inco me
Other
reserves
N o n-co nt ro lling interest
T o ta l
Equity
inst ruments
issued o ther
than capita l
Other EquityR etained
earnings
R evaluat io n
reserves
M illio ns o f euro s
C apita l
(N o te 26)
Share
P remium
(N o te 27)
The accompanying Notes 1 to 56 and Appendix I to XII are an integral part of the total consolidated statement of changes in equity for the six months ended June 30, 2016.
F-10
Unaudited consolidated statements of changes in equity for the six months ended June 30, 2016 and 2015 (continued).
JUNE 2015Valuatio n
adjustmentsR est
Balances as of January 1, 2015 3,024 23,992 - 66 20 ,281 23 633 (350) 2 ,618 (841) (348) (53) 2 ,564 51,609
Other increases o r (-) decreases in equity - - - 7 (101) - - - - (78) - - (14) (186)
Balances as of June 30, 2015 3,090 23,992 - 26 21,603 23 934 (75) 2 ,759 (175) (2 ,907) (882) 2 ,610 50,997
C apita l
(N o te 26)
Share
P remium
(N o te 27)
Equity
inst ruments
issued o ther
than capita l
Other EquityR etained
earnings
R evaluat io n
reserves
Other
reserves
(- ) T reasury
shares
P ro fit o r lo ss
at tributable to
o wners o f the
parent
Interim
div idends
A ccumulated
o ther
co mprehensive
inco me
N o n-co nt ro lling interest
T o ta l
M illio ns o f euro s
The accompanying Notes 1 to 56 and Appendix I to XII are an integral part of the total consolidated statement of changes in equity for the six months ended June 30, 2015.
F-11
Unaudited consolidated statements of cash flows for the six months ended June 30, 2016 and 2015.
Millions of Euros
NotesJune
2016
June
2015
A) CASH FLOW FROM OPERATING ACTIVITIES (1) 51 (5,449) 2,086
1. Profit for the year 2,471 2,958
2. Adjustments to obtain the cash flow from operating activities: 2,576 1,789
Depreciation and amortization 689 572
Other adjustments 1,887 1,217
3. Net increase/decrease in operating assets (13,584) (7,718)
Financial assets held for trading (7,853) 1,516
Other financial assets designated at fair value through profit or loss (1) (158)
Available-for-sale financial assets 4,787 334Loans and receivables (10,279) (8,946)
Other operating assets (238) (464)
4. Net increase/decrease in operating liabilities 4,008 5,998
Financial liabilities held for trading 4,110 (623)
Other financial liabilities designated at fair value through profit or loss 16 62
Financial liabilities at amortized cost (1,195) 5,983
Other operating liabilities 1,077 576
5. Collection/Payments for income tax (920) (941)
B) CASH FLOWS FROM INVESTING ACTIVITIES (2) 51 (1,703) (1,867)
1. Investment (2,189) (2,177)
Tangible assets (178) (563)
Intangible assets (182) (154)
Investments in joint ventures and associates - (158)
Subsidiaries and other business units (77) (1,302)
Non-current assets held for sale and associated liabilities - -
Held-to-maturity investments (1,752) -
Other settlements related to investing activities - -
2. Divestments 486 310
Tangible assets 57 86
Intangible assets - -
Investments in joint ventures and associates 69 2
Subsidiaries and other business units - 1
Non-current assets held for sale and associated liabilities 360 133
Held-to-maturity investments - -
Other collections related to investing activities - 88
The accompanying Notes 1 to 56 and Appendix I to XII are an integral part of the consolidated statement of cash flows for the six months ended June 30, 2016 and 2015.
F-12
Unaudited consolidated statements of cash flows the six months ended June 30, 2016 and 2015.
Millions of Euros
(Continued) NotesJune
2016
June
2015
C) CASH FLOWS FROM FINANCING ACTIVITIES (3) 51 53 1,215
D) EFFECT OF EXCHANGE RATE CHANGES (4) (1,119) (4,988)
E) NET INCREASE/DECREASE IN CASH OR CASH EQUIVALENTS (8,218) (3,554)
F) CASH AND CASH EQUIVALENTS AT BEGINNING OF THE YEAR 43,466 31,430
G) CASH AND CASH EQUIVALENTS AT END OF THE PERIOD (E+F) 35,248 27,876
Millions of Euros
COMPONENTS OF CASH AND EQUIVALENT AT END OF THE YEAR NotesJune
2016
June
2015
Cash 6,261 5,107
Balance of cash equivalent in central banks (**) 28,987 22,769
Other financial assets - -
Less: Bank overdraft refundable on demand - -
TOTAL CASH AND CASH EQUIVALENTS AT END OF THE PERIOD 9,13 35,248 27,876
(*) “Balance of cash equivalent in central banks” include short term deposits in central banks in the heading “Loans and receivables” in the accompanying consolidated financial statements (see Note 13).
The accompanying Notes 1 to 56 and Appendix I to XII are an integral part of the consolidated statement of cash flows for the six months ended June 30, 2016 and 2015.
F-13
Notes to the interim consolidated financial statements
1. Introduction, basis for the presentation of the interim consolidated financial statements, internal control of financial information and other information.
1.1 Introduction
Banco Bilbao Vizcaya Argentaria, S.A. (hereinafter “the Bank” or “BBVA") is a private-law entity subject to the laws and regulations governing banking entities operating in Spain. It carries out its activity through branches and agencies across the country and abroad.
The Bylaws and other public information are available for inspection at the Bank’s registered address (Plaza San Nicolás, 4 Bilbao) as on its web site (www.bbva.com).
In addition to the activities it carries out directly, the Bank heads a group of subsidiaries, joint venture and associates which perform a wide range of activities and which together with the Bank constitute the Banco Bilbao Vizcaya Argentaria Group (hereinafter, “the Group” or “the BBVA Group”). In addition to its own separate financial statements, the Bank is therefore required to prepare the Group’s consolidated financial statements.
As of June 30, 2016, the BBVA Group had 370 consolidated entities and 97 entities accounted for using the equity method (see Notes 3 and 16 Appendix I to V).
The consolidated financial statements of the BBVA Group for the year ended December 31, 2015 were approved by the shareholders at the Annual General Meetings (“AGM”) on March 11, 2016.
1.2 Basis for the presentation of the interim consolidated financial statements
The BBVA Group’s interim consolidated financial statements are presented in accordance with the International Financial Reporting Standards endorsed by the European Union applicable as of June 30, 2016, considering the Bank of Spain Circular 4/2004, of 22 December (and as amended thereafter), and with any other legislation governing financial reporting applicable to the Group and incompliance with IFRS-IASB.
The BBVA Group’s accompanying interim consolidated financial statements for the six months ended June 30, 2016, and their corresponding notes, were prepared by the Group’s Directors (through the Board of Directors held on July 28, 2016) by applying the principles of consolidation, accounting policies and valuation criteria described in Note 2, so that they present fairly the Group’s total consolidated equity and financial position as of June 30, 2016, together with the consolidated results of its operations and cash flows generated during the six months ended June 30, 2016.
These interim consolidated financial statements were prepared on the basis of the accounting records kept by the Bank and each of the other entities in the Group. Moreover, they include the adjustments and reclassifications required to harmonize the accounting policies and valuation criteria used by the Group (see Note 2.2).
All effective accounting standards and valuation criteria with a significant effect in the consolidated financial statements were applied in their preparation.
The amounts reflected in the accompanying consolidated financial statements are presented in millions of euros, unless it is more appropriate to use smaller units. Some items that appear without a total in these consolidated financial statements do so because of how the units are expressed. Also, in presenting amounts in millions of euros, the accounting balances have been rounded up or down. It is therefore possible that the totals appearing in some tables are not the exact arithmetical sum of their component figures.
The percentage changes in amounts have been calculated using figures expressed in thousands of euros.
F-14
1.3 Comparative information
As of June 2016, the consolidated financial statements of BBVA Group are prepared in accordance with the presentation models required by Circular 5/2015 of the Comisión Nacional del Mercado de Valores. The aim is to adapt the content of the public financial information from the credit institutions and formats of the financial statements established mandatory by the European Union regulation for the credit institution.
The information included in the accompanying consolidated financial statements and the explanatory notes referring to December 31, 2015 and June 30, 2015 are presented exclusively for the purpose of comparison with the information for June 30, 2016. In order to facility the comparison, the financial statements and the information referred of those dates of 2015, has been restated according to the new models mentioned in the previous paragraph. As shown in Annex XII attached, the presentation of the consolidated financial statements in accordance with these new formats has no significant impact on the financial statements included in the consolidated financial statements for the year ended December 31, 2015.
In the first six months ended June 30, 2016, the BBVA Group operating segments have not been significant changes with regard to the existing structure in 2015 (Note 6). The information related to operating segments as of December 31, 2015 and June 30, 2015 has been restated for comparability purposes, as required by IFRS 8 “Operating segments”.
1.4 Seasonal nature of income and expenses
The nature of the most significant activities carried out by the BBVA Group’s entities is mainly related to traditional activities carried out by financial institutions, which are not significantly affected by seasonal factors within the same year.
1.5 Responsibility for the information and for the estimates made
The information contained in the BBVA Group’s consolidated financial statements is the responsibility of the Group’s Directors.
Estimates have to be made at times when preparing these interim consolidated financial statements in order to calculate the recorded amount of some assets, liabilities, income, expenses and commitments. These estimates relate mainly to the following:
• Impairment on certain financial assets (see Notes 7, 12, 13,14 and 16).
• The assumptions used to quantify certain provisions (see Notes 24 and 25) and for the actuarial calculation of post-employment benefit liabilities and commitments (see Note 25).
• The useful life and impairment losses of tangible and intangible assets (see Notes 17, 18, 20 and 21).
• The valuation of goodwill and price allocation of business combinations (see Note 18).
• The fair value of certain unlisted financial assets and liabilities (see Notes 7, 8, 10, 11 and 12).
• The recoverability of deferred tax assets (See Note 19).
• The Exchange rate and the inflation rate of Venezuela (see Notes 2.2.16 and 2.2.20).
Although these estimates were made on the basis of the best information available as of June 30, 2016 on the events analyzed, future events may make it necessary to modify them (either up or down) over the coming years. This would be done prospectively in accordance with applicable standards, recognizing the effects of changes in the estimates in the corresponding consolidated income statement.
1.6 BBVA Group’s Internal Control over financial reporting
The financial information prepared by the BBVA Group is subject to an Internal Control Financial Reporting (hereinafter “ICFR"), which provides reasonable assurance with respect to its reliability and integrity of the consolidated financial information and to ensure that the transactions are processed in accordance with applicable laws and regulations.
F-15
The ICFR was developed by the BBVA Group’s management in accordance with framework established by the “Committee of Sponsoring Organizations of the Treadway Commission” (hereinafter, "COSO"). The COSO framework stipulates five components that must form the basis of the effectiveness and efficiency of systems of internal control:
• Establishment of an appropriate control framework to monitor these activities.
• Assessment of the risks that could arise during the preparation of financial information.
• Design the necessary controls to mitigate the most critical risks.
• Establishment of an appropriate system of information flows to detect and report system weaknesses or flaws.
• Monitoring of the controls to ensure they perform correctly and are effective over time.
The ICFR is a dynamic framework that evolves continuously over time to reflect the reality of the BBVA Group’s business and processes at any time, together with the risks affecting it and the controls designed to mitigate these risks. It is subject to continuous evaluation by the internal control units located in the BBVA Group’s different entities.
These internal control units are integrated into the framework of the BBVA Group’s internal control model which is based in two pillars:
• A control system with three lines of defense:
– The first line is made up of the Group's business units, which are responsible for identifying risks associated with their processes and for executing any measures established by higher management levels.
– The second line consists of the specialized control units (Legal Compliance, Global Accounting & Information Management/Internal Financial Control, Internal Risk Control, IT Risk, Fraud & Security, and Operations Control). This line defines the models and control policies for their areas of responsibility and monitor the design, the correct implementation and effectiveness of controls
– The third line is the Internal Audit unit, which conducts an independent review of the model, verifying the compliance and effectiveness of the model.
• A committee structure called Corporate Assurance that streamlines the communication to the management and the management of internal control issues at a Group level and also in each of the geographies where the Group operates.
The internal control units comply with a common and standard methodology established at Group level, as set out in the following diagram:
F-16
The Internal Control Units, ICFR Model is subject to annual evaluations by the Group’s Internal Audit Unit and external auditors. It is also supervised by the Audit and Compliance Committee of the Bank’s Board of Directors.
The BBVA Group also complies with the requirements of the Sarbanes-Oxley Act (hereafter “SOX”) for consolidated financial statements as a listed company in the Securities Exchange Commission (“SEC”). The main senior executives of the Group take part in the design, compliance and implementation of the internal control model to make it efficient and to ensure quality and accuracy of the financial information.
1.7 Mortgage market policies and procedures
The information on “Mortgage market policies and procedures” (for the granting of mortgage loans and for debt issues secured by such mortgage loans) required by Bank of Spain Circular 5/2011, applying Royal Decree 716/2009, dated April 24 (which developed certain aspects of Act 2/1981, dated March 25, on the regulation of the mortgage market and other mortgage and financial market regulations), can be found in Appendix IX.
2. Principles of consolidation, accounting policies and measurement bases applied and recent IFRS pronouncements
The Glossary includes the definition of some of the financial and economic terms used in Note 2 and subsequent Notes.
2.1 Principles of consolidation
In terms of its consolidation, in accordance with the criteria established by the IFRS, the BBVA Group is made up of four types of entities: subsidiaries, joint ventures, associates and structured entities, defined as follows:
• Subsidiaries
Subsidiaries are entities controlled by the Group (for definition of the criterion for control, see Glossary).The financial statements of the subsidiaries are fully consolidated with those of the Bank. The share of non-controlling interests from subsidiaries in the Group’s consolidated total equity is presented under the heading “Non-controlling interests” in the consolidated balance sheet. Their share in the profit or loss for the period or year is presented under the heading “Attributable to minority interest” in the accompanying consolidated income statement (see Note 31).
Note 3 includes information related to the main subsidiaries in the Group as of June 30, 2016. Appendix I includes other significant information on these entities.
• Joint ventures
Joint ventures are those entities over which there is a joint arrangement to joint control with third parties other than the Group (for definitions of joint arrangement, joint control and joint venture, refer to Glossary).
The investments in joint ventures are accounted for using the equity method (see Note 16). Appendix II shows the main figures for joint ventures accounted for using the equity method.
• Associates
Associates are entities in which the Group is able to exercise significant influence (for definition of significant influence, see Glossary). Significant influence is deemed to exist when the Group owns 20% or more of the voting rights of an investee directly or indirectly, unless it can be clearly demonstrated that this is not the case.
However, certain entities in which the Group owns 20% or more of the voting rights are not included as Group associates, since the Group does not have the ability to exercise significant influence over these entities. Investments in these entities, which do not represent material amounts for the Group, are classified as “Available-for-sale financial assets”.
In contrast, some investments in entities in which the Group holds less than 20% of the voting rights are accounted for as Group associates, as the Group is considered to have the ability to exercise significant influence over these entities. As of June 30, 2016 and December 31, 2016, these entities are not significant in the Group.
Appendix II shows the most significant information related to the associates (see Note 16), which are accounted for using the equity method.
F-17
• Structured Entities
A structured entity is an entity that has been designed so that voting or similar rights are not the dominant factor in deciding who controls the entity, such as when the voting rights relate to administrative matters only and the relevant activities are directed by means of contractual arrangements (see Glossary).
In those cases where the Group sets up entities or has a holding in such entities, in order to allow its customers access to certain investments, to transfer risks or for other purposes, in accordance with internal criteria and procedures and with applicable regulations, the Group determines whether control over the entity in question actually exists and therefore whether it should be subject to consolidation.
Such methods and procedures determine whether there is control by the Group, considering how the decisions are made about the relevant activities, assesses whether the Group has all power over the relevant elements, exposure, or rights, to variable returns from involvement with the investee and the ability to use power over the investee to affect the amount of the investor’s returns.
– Structured entities subject to consolidation
To determine if a structured entity is controlled by the Group, and therefore should be consolidated into the Group, the existing contractual rights (different from the voting rights) are analyzed. For this reason, an analysis of the structure and purpose of each investee is performed and, among others, the following factors will be considered:
- Evidence of the current ability to manage the relevant activities of the investee according to the specific business needs (including any decisions that may arise only in particular circumstances).
- Potential existence of a special relationship with the investee.
- Implicit or explicit Group commitments to support the investee.
- The ability to use the Group´s power over the investee to affect the amount of the Group’s returns.
There are cases where the Group has a high exposure to variable returns and retains decision-making power over the investee, either directly or through an agent.
The main structured entities of the Group are the so-called asset securitization funds, to which the BBVA Group transferred loans and receivables portfolios, and other vehicles, which allow the Group’s customers to gain access to certain investments or to allow for the transfer of risks and other purposes (See Appendix I and V). The BBVA Group maintains the decision-making power over the relevant activities of these vehicles and financial support through securitized market standard contractual. The most common ones are: investment positions in equity note tranches, funding through subordinated debt, credit enhancements through derivative instruments or liquidity lines, management rights of defaulted securitized assets, “clean-up” call derivatives, and asset repurchase clauses by the grantor.
For these reasons, the loans and receivable portfolios related to the vast majority of the securitizations carried out by the Bank or Group subsidiaries are not deregistered in the books of said entity and the issuances of the related debt securities are registered as liabilities within the Group’s consolidated balance sheet.
– Non-consolidated structured entities
The Group owns other vehicles also for the purpose of allowing access to customers to certain investment, transfer risks, and other purposes, but without the Group having control of the vehicles and are not consolidated in accordance with IFRS 10. The balance of assets and liabilities of these vehicles is not material in relation to the Group’s consolidated financial statements.
As of June 30, 2016, there was no material financial support from the Bank or subsidiaries to unconsolidated structured entities.
The Group does not consolidate any of the mutual funds it managed since the necessary control conditions are not met (see definition of control in the Glossary). Particularly, the BBVA Group does not act as arranger but as agent since it operates the mutual funds on behalf and for the benefit of investors or parties (arranger of arrangers) and, for this reason it does not control the mutual funds when exercising its authority for decision making.
On the other hand, the mutual funds managed by the Group are not considered structured entities (generally, retail funds without corporate identity over which investors have participations which gives them ownership of said managed equity). These funds are not dependent on a capital structure that could prevent them to carry out activities without additional financial support, being in any case insufficient as far as the activities themselves are concerned. Additionally, the risk of the investment is absorbed by the fund participants, and the Group is only exposed when it becomes a participant, and as such, there is no other risk for the Group.
F-18
In all cases, results of equity method investees acquired by the BBVA Group in a particular period are included taking into account only the period from the date of acquisition to the financial statements date. Similarly, the results of entities disposed of during any year are included taking into account only the period from the start of the year to the date of disposal.
The financial statements of subsidiaries, associates and joint ventures used in the preparation of the consolidated financial statements of the Group relate to the same date of presentation than the consolidated financial statements. If financial statements at those same dates are not available, the most recent will be used, as long as these are not older than three months, and adjusting to take into account the most significant transactions. As of June 30, 2016, save for the case of the financial statements of 5 non-material associates and joint-ventures for which the financial statements were as of April, 2016, all of the financial statements of all Group entities were available.
Our banking subsidiaries, associates and joint venture around the world, are subject to supervision and regulation from a variety of regulatory bodies in relation to, among other aspects, the satisfaction of minimum capital requirements. The obligation to satisfy such capital requirements may affect the ability of such entities to transfer funds in the form of cash dividends, loans or advances. In addition, under the laws of the various jurisdictions where such entities are incorporated, dividends may only be paid out through funds legally available for such purpose. Even when the minimum capital requirements are met and funds are legally available, the relevant regulator or other public administrations could discourage or delay the transfer of funds to the Group in the form of cash, dividends, loans or advances for prudential reasons.
2.2 Accounting policies and valuation criteria applied
The accounting standards and policies and the valuation criteria applied in preparing these consolidated financial statements may differ from those used by some of the entities within the BBVA Group. For this reason, necessary adjustments and reclassifications have been made in the consolidation process to standardize these principles and criteria and comply with the EU-IFRS.
The accounting standards and policies and valuation criteria used in preparing the accompanying consolidated financial statements are as follows:
2.2.1 Financial instruments
Measurement of financial instruments and recognition of changes in subsequent fair value
All financial instruments are initially accounted for at fair value which, unless there is evidence to the contrary, shall be the transaction price.
Excluding all the financial assets held for trading and trading derivatives, all the changes in the fair value of the financial instruments arising from the accrual of interests and similar items are recognized under the headings “Interest income” or “Interest expenses”, as appropriate, in the accompanying consolidated income statement for the year in which the change occurred (see Note 37). The dividends received from other entities, other than associate entities and joint venture entities, are recognized under the heading “Dividend income” in the accompanying consolidated income statement for the year in which the right to receive them arises (see Note 38).
The changes in fair value after the initial recognition, for reasons other than those mentioned in the preceding paragraph, are treated as described below, according to the categories of financial assets and liabilities.
“Financial assets held for trading” and “Financial assets and liabilities designated at fair value through profit or loss”
The assets and liabilities recognized under these headings of the consolidated balance sheets are measured upon acquisition at fair value and changes in the fair value (gains or losses) are recognized as their net value under the heading “Gains (losses) on financial assets and liabilities (net)” in the accompanying consolidated income statements (see Note 42). Except those interests derivatives designated as economic hedges on interest rate are registered in interest income or expense (Note 37), depending on where the result of the hedging instrument. However, changes in fair value resulting from variations in foreign exchange rates are recognized under the heading “Exchange differences (net)" in the accompanying consolidated income statements.
F-19
“Available-for-sale financial assets”
Assets recognized under this heading in the consolidated balance sheets are measured at their fair value. Subsequent changes in fair value (gains or losses) are recognized temporarily for their amount net of tax effect, under the heading “Accumulated other comprehensive income- Available-for-sale financial assets” in the consolidated balance sheets.
Changes in the value of non-monetary items resulting from changes in foreign exchange rates are recognized temporarily under the heading “Accumulated other comprehensive income- Items that may be reclassified to profit or loss - Exchange differences” in the accompanying consolidated balance sheets. Changes in foreign exchange rates resulting from monetary items are recognized under the heading “Exchange differences (net)" in the accompanying consolidated income statements.
The amounts recognized under the headings “Accumulated other comprehensive income- Items that may be reclassified to profit or loss - Available-for-sale financial assets” and “Accumulated other comprehensive income- Items that may be reclassified to profit or loss - Exchange differences” continue to form part of the Group's consolidated equity until the corresponding asset is derecognized from the consolidated balance sheet or until an impairment loss is recognized in the corresponding financial instrument. If these assets are sold, these amounts are derecognized and included under the headings “Gains (losses) on financial assets and liabilities (net)” or “Exchange differences (net)", as appropriate, in the consolidated income statement for the year in which they are derecognized.
The net impairment losses in “Available-for-sale financial assets” over the year are recognized under the heading “Impairment losses on financial assets (net) – Other financial instruments not at fair value through profit or loss” (see Note 47) in the consolidated income statements for that period.
“Loans and receivables”, “Held-to-maturity investments” and “Financial liabilities at amortized cost”
Assets and liabilities recognized under these headings in the accompanying consolidated balance sheets are measured once acquired at “amortized cost” using the “effective interest rate” method. This is because the consolidated entities generally intend to hold such financial instruments to maturity.
Net impairment losses of assets recognized under these headings arising in each period are recognized under the heading “Impairment or (-) reversal of impairment on financial assets not measured at fair value through profit or loss – loans and receivables”, “Impairment or (-) reversal of impairment on financial assets not measured at fair value through profit or loss - held to maturity investments” or “Impairment or (-) reversal of impairment on financial assets not measured at fair value through profit or loss – financial assets measured at cost” (see note 47) in the consolidated income statement for that period.
“Derivatives-Hedge Accounting” and “Fair value changes of the hedged items in portfolio hedges of interest-rate risk”
Assets and liabilities recognized under these headings in the accompanying consolidated balance sheets are measured at fair value.
Changes occurring subsequent to the designation of the hedging relationship in the measurement of financial instruments designated as hedged items as well as financial instruments designated as hedge accounting instruments are recognized as follows:
• In fair value hedges, the changes in the fair value of the derivative and the hedged item attributable to the hedged risk are recognized under the heading “Gains or losses from hedge accounting, net” in the consolidated income statement, with a corresponding item under the headings where hedging items ("Hedging derivatives") and the hedged items are recognized, as applicable. Almost all of the hedges used by the Group are for interest-rate risks. Therefore, the valuation changes are recognized under the headings “Interest income” or “Interest expenses”, as appropriate, in the accompanying consolidated income statement (see Note 37).
• In fair value hedges of interest rate risk of a portfolio of financial instruments (portfolio-hedges), the gains or losses that arise in the measurement of the hedging instrument are recognized in the consolidated income statement, and the gains or losses that arise from the change in the fair value of the hedged item (attributable to the hedged risk) are also recognized in the consolidated income statement (in both cases under the heading “Gains or losses from hedge accounting, net”, using, as a balancing item, the headings "Fair value changes of the hedged items in portfolio hedges of interest rate risk" in the consolidated balance sheets, as applicable.
F-20
• In cash flow hedges, the gain or loss on the hedging instruments relating to the effective portion are recognized temporarily under the heading "”Accumulated other comprehensive income - Items that may be reclassified to profit or loss - Hedging derivatives. Cash flow hedges” in the consolidated balance sheets, with a balancing entry under the heading “Hedging derivatives” of the Assets or Liabilities of the Consolidated Financial Statements as applicable. These differences are recognized in the accompanying consolidated income statement at the time when the gain or loss in the hedged instrument affects profit or loss, when the forecast transaction is executed or at the maturity date of the hedged item (See Note 37).
• Differences in the measurement of the hedging items corresponding to the ineffective portions of cash flow hedges are recognized directly in the heading “Gains or (-) losses from hedge accounting, net” in the consolidated income statement (See Note 42).
• In the hedges of net investments in foreign operations, the differences attributable to the effective portions of hedging items are recognized temporarily under the heading "Accumulated other comprehensive income - Items that may be reclassified to profit or loss – Hedging of net investments in foreign transactions" in the consolidated balance sheets with a balancing entry under the heading “Hedging derivatives” of the Assets or Liabilities of the Consolidated Financial Statements as applicable. These differences in valuation are recognized under the heading “Exchange differences (net)" in the consolidated income statement when the investment in a foreign operation is disposed of or derecognized.
Other financial instruments
The following exceptions are applicable with respect to the above general criteria:
• Equity instruments whose fair value cannot be determined in a sufficiently objective manner and financial derivatives that have those instruments as their underlying asset and are settled by delivery of those instruments are recorded in the consolidated balance sheet at acquisition cost; this may be adjusted, where appropriate, for any impairment loss (see Note 8).
• Accumulated other comprehensive income arising from financial instruments classified at the consolidated balance sheet date as “Non-current assets and disposal groups classified as held for sale” are recognized with the corresponding entry under the heading “Accumulated other comprehensive income- Items that may be reclassified to profit or loss – Non-current assets and disposal groups classified as held for sale” in the accompanying consolidated balance sheets.
Impairment losses on financial assets
Definition of impaired financial assets carried at amortized cost
A financial asset is considered impaired – and therefore its carrying amount is adjusted to reflect the effect of impairment – when there is objective evidence that events have occurred, which:
• In the case of debt instruments (loans and advances and debt securities), reduce the future cash flows that were estimated at the time the instruments were acquired. So they are considered impaired when there are reasonable doubts that the carrying amounts will be recovered in full and/or the related interest will be collected for the amounts and on the dates initially agreed.
• In the case of equity instruments, it means that their carrying amount may not be fully recovered.
As a general rule, the carrying amount of impaired financial assets is adjusted with a charge to the consolidated income statement for the period in which the impairment becomes known. The recoveries of previously recognized impairment losses are reflected, if appropriate, in the consolidated income statement for the year in which the impairment is reversed or reduced.
In general, amounts collected on impaired loans and receivables are used to recognize the related accrued interest and any excess amount is used to reduce the unpaid principal.
When the recovery of any recognized amount is considered remote, such amount is written-off on the consolidated balance sheet, without prejudice to any actions that may be taken in order to collect the amount until the rights extinguish in full either because it is time-barred debt, the debt is forgiven, or other reasons.
F-21
According to the Group’s established policy, the recovery of a recognized amount is considered remote and, therefore, derecognized from the consolidated balance sheet in the following cases:
• Any loan (except for those carrying an sufficient guarantee) to a debtor in bankruptcy and/or in the last phases of a “concurso de acreedores” (the Spanish equivalent of a Chapter 11 bankruptcy proceeding), and
• Financial assets (bonds, debentures, etc.) whose issuer’s solvency had undergone a notable and irreversible deterioration.
Additionally, loans and advances classified as impaired secured loans are written off in the balance sheet within a maximum period of four years of their classification as impaired (non-guaranteed amount), while impaired unsecured loans (such as certain commercial and consumer loans, credit cards, etc.) in the non-guaranteed amount are written off within two years of their classification as impaired.
Impairment on financial assets
The impairment on financial assets is determined by type of instrument and other circumstances that could affect it, taking into account the guarantees received by the owners of the financial instruments to assure (in part or in full) the performance of the financial assets. The BBVA Group recognizes impairment charges directly against the impaired financial asset when the likelihood of recovery is deemed remote, and uses an offsetting or allowance account when it recognizes non-performing loan provisions for the estimated losses.
Impairment of debt securities measured at amortized cost
With regard to impairment losses arising from insolvency risk of the obligors (credit risk), a debt instrument, mainly Loans and receivables, is impaired due to insolvency when a deterioration in the ability to pay by the obligor is evidenced, either due to past due status or for other reasons.
The BBVA Group has developed policies, methods and procedures to estimate incurred losses on outstanding credit risk. These policies, methods and procedures are applied in the study, approval and execution of debt instruments and Commitments and guarantees given; as well as in identifying the impairment and, where appropriate, in calculating the amounts necessary to cover estimated losses.
The amount of impairment losses on debt instruments measured at amortized cost is calculated based on whether the impairment losses are determined individually or collectively. First it is determined whether there is objective evidence of impairment individually for individually significant debt instrument, and collectively for debt instrument that are not individually significant. In the case where the Group determines that no objective evidence of impairment in the case of debt instrument analyzed individually will be included in a group of debt instrument with similar risk characteristics and collectively impaired is analyzed.
In determining whether there is objective evidence of impairment the Group uses observable data on the following aspects:
• Significant financial difficulties of the obligors.
• Ongoing delays in the payment of interest or principal.
• Refinancing of credit conditions by the obligors.
• Bankruptcy or reorganization / liquidation are considered likely.
• Disappearance of the active market for a financial asset because of financial difficulties.
• Observable data indicating a reduction in future cash flows from the initial recognition such as adverse changes in the payment status of the counterparty (delays in payments, reaching credit cards limits, etc.)
• National or local economic conditions that are linked to "defaults" (unemployment, falling property prices, etc.).
Impairment losses on financial assets individually evaluated for impairment
The amount of the impairment losses incurred on financial assets represents the excess of their respective carrying amounts over the present values of their expected future cash flows. These cash flows are discounted using the original effective interest rate. If a financial asset has a variable interest rate, the discount rate for measuring any impairment loss is the current effective rate determined under the contract.
F-22
The following is to be taken into consideration when estimating the future cash flows of debt instruments:
• All the amounts that are expected to be recovered over the remaining life of the debt instrument; including, where appropriate, those which may result from the collateral and other credit enhancements provided for the debt instrument (after deducting the costs required for foreclosure and subsequent sale). Impairment losses include an estimate for the possibility of collecting accrued, past-due and uncollected interest.
• The various types of risk to which each debt instrument is subject.
• The circumstances in which collections will foreseeably be made.
Impairment losses on financial assets collectively evaluated for impairment
Impairment losses on financial assets collectively evaluated for impairment are calculated by using statistical procedures, and they are deemed equivalent to the portion of losses incurred on the date that the accompanying consolidated financial statements are prepared that has yet to be allocated to specific asset. The BBVA Group estimates impairment losses through statistical processes that apply historical data and other specific parameters that, although having been generated as of closing date for these consolidated financial statements, have arisen on an individual basis following the reporting date.
With respect to financial assets that have no objective evidence of impairment, the Group applies statistical methods using historical experience and other specific information to estimate the losses that the Group has incurred as a result of events that have occurred as of the date of preparation of the consolidated financial statements but have not been known and will be apparent, individually after the date of submission of the information. This calculation is an intermediate step until these losses are identified on an individual level, at which these financial instruments will be segregated from the portfolio of financial assets without objective evidence of impairment.
The incurred loss is calculated taking into account three key factors: exposure at default, probability of default and loss given default.
• Exposure at default (EAD) is the amount of risk exposure at the date of default by the counterparty.
• Probability of default (PD) is the probability of the counterparty failing to meet its principal and/or interest payment obligations. The PD is associated with the rating/scoring of each counterparty/transaction. In addition, the PD calculation includes the following parameters:
The definition of default used includes amounts past due by 90 days or more and cases in which there is no default but there are doubts as to the solvency of the counterparty (subjective doubtful assets).
• Loss given default (LGD) is the estimate of the loss arising in the event of default. It depends mainly on the characteristics of the counterparty, and the valuation of the guarantees or collateral associated with the asset.
In order to calculate the LGD at each balance sheet date, the Group evaluates the whole amount expected to be obtained over the remaining life of the financial asset, including the estimated cash flows from the sale of the collateral by estimating its sale price (in the case of real estate collateral, the Group takes into account declines in property values which could affect the value of such collateral) and its estimated cost of sale.
In the event of a default, the group becomes contractually entitled to the property at the end of the foreclosure process or properties purchased from borrowers in distress, and is recognized in the financial statements. After the initial recognition of these assets classified as " Non-current assets and disposal groups held for sale and liabilities included in these groups" (see note 2.2.4) or "Other assets - Inventories" (see Note 2.2.6), they are valued at the lower of their carrying amount and their fair value less their estimated selling price.
In addition, to identify the possible incurred but not reported losses (IBNR) in the unimpaired portfolio, an additional parameter called "LIP" (loss identification period) has to be introduced. The LIP parameter is the period between the time at which the event that generates a given loss occurs and the time when the loss is identified at an individual level. The analysis of the LIPs is carried out on the basis of uniform risk portfolios.
As of June 30, 2016 and 2015, as well as December 31, 2015, the Group’s internal incurred losses model for credit risk shows no material differences when compared to the provisions calculation using Bank of Spain requirements.
Impairment of other debt instruments classified as financial assets available for sale
The impairment losses on other debt instruments included in the “Available-for-sale financial asset” portfolio are equal to the excess of their acquisition cost (net of any principal repayment), after deducting any impairment loss previously recognized in the consolidated income statement over their fair value.
F-23
When there is objective evidence that the negative differences arising on measurement of these debt instruments are due to impairment, they are no longer considered as “Accumulated other comprehensive income - Items that may be reclassified to profit or loss - Available-for-sale financial assets” and are recognized in the consolidated income statement.
If all, or part of the impairment losses are subsequently recovered, the amount is recognized in the consolidated income statement for the year in which the recovery occurred, up to the amount previously recognized in the income statement.
Impairment of equity instruments
The amount of the impairment in the equity instruments is determined by the category where they are recognized:
• Equity instruments classified as available for sale: When there is objective evidence that the negative differences arising on measurement of these equity instruments are due to impairment, they are no longer registered as “Accumulated other comprehensive income - Items that may be reclassified to profit or loss - Available-for-sale financial assets” and are recognized in the consolidated income statement. In general, the Group considers that there is objective evidence of impairment on equity instruments classified as available-for-sale when significant unrealized losses have existed over a sustained period of time due to a price reduction of at least 40% or over a period of more than 18 months.
When applying this evidence of impairment, the Group takes into account the volatility in the price of each individual equity instrument to determine whether it is a percentage that can be recovered through its sale on the market; other different thresholds may exist for certain equity instruments or specific sectors.
In addition, for individually significant investments, the Group compares the valuation of the most significant equity instruments against valuations performed by independent experts.
Any recovery of previously recognized impairment losses for an investment in an equity instrument classified as available for sale is not recognized in the consolidated income statement, but under the heading " Accumulated other comprehensive income - Items that may be reclassified to profit or loss - Available-for-sale financial assets" in the consolidated balance sheet (see Note 30).
• Equity instruments measured at cost: The impairment losses on equity instruments measured at acquisition cost are equal to the excess of their carrying amount over the present value of expected future cash flows discounted at the market rate of return for similar equity instruments. In order to determine these impairment losses, save for better evidence, an assessment of the equity of the investee is carried out (excluding Accumulated other comprehensive income due to cash flow hedges) based on the last approved (consolidated) balance sheet, adjusted by the unrealized gains at measurement date.
Impairment losses are recognized in the consolidated income statement for the year in which they arise as a direct reduction of the cost of the instrument. These impairment losses may only be recovered subsequently in the event of the sale of these assets.
2.2.2 Transfers and derecognition of financial assets and liabilities
The accounting treatment of transfers of financial assets is determined by the form in which risks and benefits associated with the financial assets involved are transferred to third parties. Thus the financial assets are only derecognized from the consolidated balance sheet when the cash flows that they generate are extinguished, when their implicit risks and benefits have been substantially transferred to third parties or when the control of financial asset is transferred even with no physical transfer or substantial retention of such assets. In the latter case, the financial asset transferred is derecognized from the consolidated balance sheet, and any right or obligation retained or created as a result of the transfer is simultaneously recognized.
The Group is considered to have transferred substantially all the risks and benefits if such risks and benefits account for the majority of the risks and benefits involved in ownership of the transferred financial assets. If substantially all the risks and benefits associated with the transferred financial asset are retained:
• The transferred financial asset is not derecognized from the consolidated balance sheet and continues to be measured using the same criteria as those used before the transfer.
• A financial liability is recognized at the amount equal to the amount received, which is subsequently measured at amortized cost or fair value with changes in the income statement, whichever the case.
• Both the income generated on the transferred (but not derecognized) financial asset and the expenses of the new financial liability continue to be recognized.
F-24
2.2.3 Financial guarantees
Financial guarantees are considered to be those contracts that require their issuer to make specific payments to reimburse the holder of the financial guarantee for a loss incurred when a specific borrower breaches its payment obligations on the terms – whether original or subsequently modified – of a debt instrument, irrespective of the legal form it may take. Financial guarantees may take the form of a deposit, bank guarantee, insurance contract or credit derivative, among others.
In their initial recognition, financial guarantees are recognized as liabilities in the consolidated balance sheet at fair value, which is generally the present value of the fees, commissions and interest receivable from these contracts over the term thereof, and the Group simultaneously recognize a corresponding asset in the consolidated balance sheet for the amount of the fees and commissions received at the inception of the transactions and the amounts receivable at the present value of the fees, commissions and interest outstanding.
Financial guarantees, irrespective of the guarantor, instrumentation or other circumstances, are reviewed periodically so as to determine the credit risk to which they are exposed and, if appropriate, to consider whether a provision is required for them. The credit risk is determined by application of criteria similar to those established for quantifying impairment losses on debt instruments measured at amortized cost (see Note 2.2.1).
The provisions recognized for financial guarantees considered impaired are recognized under the heading “Provisions - Provisions for contingent risks and commitments” on the liability side in the consolidated balance sheets (see Note 24). These provisions are recognized and reversed with a charge or credit, respectively; to “Provisions or reversal of provision” in the consolidated income statements (see Note 46).
Income from financial guarantees is recorded under the heading “Fee and commission income” in the consolidated income statement and is calculated by applying the rate established in the related contract to the nominal amount of the guarantee (see Note 40).
2.2.4 Non-current assets and disposal groups held for sale and liabilities included in disposal groups classified as held for sale
The heading “Non-current assets and disposal groups held for sale and liabilities included in disposal groups classified as held for sale” in the consolidated balance sheets includes the carrying amount of assets that are not part of the BBVA Group’s operating activities. The recovery of this carrying amount is expected to take place through the price obtained on its disposal (see Note 21).
This heading includes individual items and groups of items (“disposal groups”) and disposal groups that form part of a major operating segment and are being held for sale as part of a disposal plan (“discontinued operations”). The individual items include the assets received by the subsidiaries from their debtors, in full or partial settlement of the debtors’ payment obligations (assets foreclosed or donated in repayment of debt and recovery of lease finance transactions), unless the Group has decided to make continued use of these assets. The BBVA Group has units that specialize in real estate management and the sale of this type of asset.
Symmetrically, the heading “Liabilities included in disposal groups classified as held for sale” in the consolidated balance sheets reflects the balances payable arising from disposal groups and discontinued operations.
Profit or loss from non-current assets and disposal groups classified as held for sale are generally measured, at the acquisition date and at any later date deemed necessary, at either their carrying amount or the fair value of the property (less costs to sell), whichever is lower. The book value at acquisition date of the Profit or loss from non-current assets and disposal groups classified as held for sale from foreclosures or recoveries is defined as the balance pending collection on those assets that originated said purchases (net of provisions). Fair value of non-current assets and disposable instruments held for sale from foreclosures or recoveries is based, mainly, in appraisals or valuations made by independent experts on a yearly based or less should there be evidence of impairment. Profit or loss from non-current assets and disposal groups classified as held for sale are not depreciated while included under this heading.
Gains and losses generated on the disposal of assets and liabilities classified as non-current held for sale, and liabilities included in disposal groups classified as held for sale as well as impairment losses and, where pertinent, the related recoveries, are recognized in “Profit or (-) loss from non-current assets and disposal groups classified as held for sale not qualifying as discontinued operations” in the consolidated income statement (see note 50). The remaining income and expense items associated with these assets and liabilities are classified within the relevant consolidated income statement headings.
F-25
Income and expenses for discontinued operations, whatever their nature, generated during the year, even if they have occurred before their classification as discontinued operations, are presented net of the tax effect as a single amount under the heading “Profit from discontinued operations” in the consolidated income statement, whether the business remains on the balance sheet or is derecognized from the balance sheet. As long as an asset remains in this category, it will not be amortized. This heading includes the earnings from their sale or other disposal.
2.2.5 Tangible assets
Property, plant and equipment for own use
This heading includes the assets under ownership or acquired under lease finance, intended for future or current use by the BBVA Group and that it expects to hold for more than one year. It also includes tangible assets received by the consolidated entities in full or partial settlement of financial assets representing receivables from third parties and those assets expected to be held for continuing use.
Property, plant and equipment for own use are presented in the consolidated balance sheets at acquisition cost, less any accumulated depreciation and, where appropriate, any estimated impairment losses resulting from comparing this net carrying amount of each item with its corresponding recoverable amount.
Depreciation is calculated using the straight-line method, on the basis of the acquisition cost of the assets less their residual value; the land on which the buildings and other structures stand is considered to have an indefinite life and is therefore not depreciated.
The tangible asset depreciation charges are recognized in the accompanying consolidated income statements under the heading "Depreciation" (see Note 45) and are based on the application of the following depreciation rates (determined on the basis of the average years of estimated useful life of the various assets):
Type of Assets Annual Percentage
Building for own use 1% - 4%
Furniture 8% - 10%
Fixtures 6% - 12%
Office supplies and hardware 8% - 25%
The BBVA Group’s criteria for determining the recoverable amount of these assets, in particular buildings for own use, is based on independent appraisals that are no more than 3-5 years old at most, unless there are indications of impairment.
At each reporting date, the Group entities analyze whether there are internal or external indicators that a tangible asset may be impaired. When there is evidence of impairment, the Group analyzes whether this impairment actually exists by comparing the asset’s net carrying amount with its recoverable amount (as the higher between its recoverable amount less disposal costs and its value in use). When the carrying amount exceeds the recoverable amount, the carrying amount is written down to the recoverable amount and depreciation charges going forward are adjusted to reflect the asset’s remaining useful life.
Similarly, if there is any indication that the value of a tangible asset has been recovered, the consolidated entities will estimate the recoverable amounts of the asset and recognize it in the consolidated income statement, recording the reversal of the impairment loss registered in previous years and thus adjusting future depreciation charges. Under no circumstances may the reversal of an impairment loss on an asset raise its carrying amount above that which it would have if no impairment losses had been recognized in prior years.
Running and maintenance expenses relating to tangible assets held for own use are recognized as an expense in the year they are incurred and recognized in the consolidated income statements under the heading "Administration costs - Other administrative expenses - Property, fixtures and equipment" (see Note 44.2).
Other assets leased out under an operating lease
The criteria used to recognize the acquisition cost of assets leased out under operating leases, to calculate their depreciation and their respective estimated useful lives and to recognize the impairment losses on them, are the same as those described in relation to tangible assets for own use.
F-26
Investment properties
The heading “Tangible assets - Investment properties” in the consolidated balance sheets reflects the net values (purchase cost minus the corresponding accumulated depreciation and, if appropriate, estimated impairment losses) of the land, buildings and other structures that are held either to earn rentals or for capital appreciation through sale and that are neither expected to be sold off in the ordinary course of business nor are destined for own use (see Note 17).
The criteria used to recognize the acquisition cost of investment properties, calculate their depreciation and their respective estimated useful lives and recognize the impairment losses on them, are the same as those described in relation to tangible assets held for own use.
The BBVA Group’s criteria for determining the recoverable amount of these assets is based on independent appraisals that are no more than one year old at most, unless there are indications of impairment.
2.2.6 Inventories
The balance under the heading “Other assets - Inventories” in the consolidated balance sheets mainly includes the land and other properties that the BBVA Group’s real estate entities hold for development and sale as part of their real estate development activities (see Note 20).
The cost of inventories includes those costs incurred in during their acquisition and development, as well as other direct and indirect costs incurred in getting them to their current condition and location.
In the case of the cost of real-estate assets accounted for as inventories, the cost is comprised of: the acquisition cost of the land, the cost of urban planning and construction, non-recoverable taxes and costs corresponding to construction supervision, coordination and management. Borrowing cost incurred during the year form part of cost, provided that the inventories require more than a year to be in a condition to be sold.
Properties purchased from customers in distress, which the Group manages for sale, are measured at the acquisition date and any subsequent time, at either their related carrying amount or the fair value of the property (less costs to sell), whichever is lower. The carrying amount at acquisition date of these properties is defined as the balance pending collection on those assets that originated said purchases (net of provisions).
Impairment
The amount of any subsequent adjustment due to inventory valuation for reasons such as damage, obsolescence, reduction in sale price to its net realizable value, as well as losses for other reasons and, if appropriate, subsequent recoveries of value up to the limit of the initial cost value, are registered under the heading " Impairment or (-) reversal of impairment on non-financial assets ” in the accompanying consolidated income statements (see Note 48) for the year in which they are incurred.
In the case of real-Estate assets above mentioned, if the fair value less costs to sell is lower than the carrying amount of the loan recognized in the consolidated balance sheet, a loss is recognized under the heading "Impairment or (-) reversal of impairment on non-financial assets" in the consolidated income statement for the period (see Note 48). In the case of real-estate assets accounted for as inventories, the BBVA Group’s criterion for determining their net realizable value is mainly based on independent appraisals no more than one year old, or less if there are indications of impairment.
Inventory sales
In sale transactions, the carrying amount of inventories is derecognized from the consolidated balance sheet and recognized as an expense under the income statement heading "Other operating expenses – Changes in inventories” in the year in which the income from its sale is recognized. This income is recognized under the heading “Other operating income – Financial income from non-financial services” in the consolidated income statements (see Note 43).
2.2.7 Business combinations
A business combination is a transaction, or any other deal, by which the Group obtains control of one or more businesses. It is accounted for by applying the acquisition method.
F-27
According to this method, the acquirer has to recognize the assets acquired and the liabilities and contingent liabilities assumed, including those that the acquired entity had not recognized in the accounts. The method involves the measurement of the consideration received for the business combination and its allocation to the assets, liabilities and contingent liabilities measured according to their fair value, at the purchase date, as well as the recognition of any non-controlling participation (minority interests) that may arise from the transaction.
In a business combination achieved in stages, the acquirer shall remeasure its previously held equity interest in the acquiree at its acquisition-date fair value and recognize the resulting gain or loss, if any, in profit or loss under the heading “Gains (losses) on derecognized of non-financial assets and subsidiaries, net” of the Consolidated Income Statements. In prior reporting periods, the acquirer may have recognized changes in the value of its equity interest in the acquiree in other comprehensive income. If so, the amount that was recognized in other comprehensive income shall be recognized on the same basis as would be required if the acquirer had disposed directly of the previously held equity interest.
In addition, the acquirer shall recognize an asset in the consolidated balance sheet under the heading “Intangible asset - Goodwill” if on the acquisition date there is a positive difference between:
• the sum of the consideration transferred, the amount of all the non-controlling interests and the fair value of stock previously held in the acquired business; and
• the fair value of the assets acquired and liabilities assumed.
If this difference is negative, it shall be recognized directly in the income statement under the heading “Gain on Bargain Purchase in business combinations”.
Non-controlling interests in the acquired entity may be measured in two ways: either at their fair value; or at the proportional percentage of net assets identified in the acquired entity. The method of valuing non-controlling interest may be elected in each business combination. So far, the BBVA Group has always elected for the second method.
2.2.8 Intangible assets
Goodwill
Goodwill represents a portion of consideration transferred in advance by the acquiring entity for the future economic benefits from assets that cannot be individually identified and separately recognized. Goodwill is never amortized. It is subject periodically to an impairment analysis, and is written off if it is clear that there has been impairment.
Goodwill is assigned to one or more cash-generating units that expect to be the beneficiaries of the synergies derived from the business combinations. The cash-generating units represent the Group’s smallest identifiable asset groups that generate cash flows for the Group and that are largely independent of the flows generated from the Group’s other assets or groups of assets. Each unit or units to which goodwill is allocated:
• is the lowest level at which the entity manages goodwill internally;
• is not larger than an operating segment.
The cash-generating units to which goodwill has been allocated are tested for impairment (including the allocated goodwill in their carrying amount). This analysis is performed at least annually or more frequently if there is any indication of impairment.
For the purpose of determining the impairment of a cash-generating unit to which a part of goodwill has been allocated, the carrying amount of that cash-generating unit, adjusted by the theoretical amount of the goodwill attributable to the non-controlling interests, in the event they are not valued at fair value, is compared with its recoverable amount.
The recoverable amount of a cash-generating unit is equal to the fair value less sale costs and its value in use, whichever is greater. Value in use is calculated as the discounted value of the cash flow projections that the unit’s management estimates and is based on the latest budgets approved for the coming years. The main assumptions used in its calculation are: a sustainable growth rate to extrapolate the cash flows indefinitely, and the discount rate used to discount the cash flows, which is equal to the cost of the capital assigned to each cash-generating unit, and equivalent to the sum of the risk-free rate plus a risk premium inherent to the cash-generating unit being evaluated for impairment.
F-28
If the carrying amount of the cash-generating unit exceeds the related recoverable amount, the Group recognizes an impairment loss; the resulting loss is apportioned by reducing, first, the carrying amount of the goodwill allocated to that unit and, second, if there are still impairment losses remaining to be recognized, the carrying amount of the remainder of the assets. This is done by allocating the remaining loss in proportion to the carrying amount of each of the assets in the unit. In the event the non-controlling interests are measured at fair value, the deterioration of goodwill attributable to non-controlling interests will be recognized. In any case, an impairment loss recognized for goodwill shall not be reversed in a subsequent period.
They are recognized under the heading "Impairment or (-) reversal of impairment on non-financial assets – Intangible assets” in the consolidated income statements (see Note 48).
Other intangible assets
These assets may have an indefinite useful life if, based on an analysis of all relevant factors, it is concluded that there is no foreseeable limit to the period over which the asset is expected to generate net cash flows for the consolidated entities. In all other cases they have a finite useful life.
Intangible assets with a finite useful life are amortized according to the duration of this useful life, using methods similar to those used to depreciate tangible assets. The defined useful time intangible asset is made up mainly of IT applications acquisition costs which have a useful life of 3 to 5 years. The depreciation charge of these assets is recognized in the accompanying consolidated income statements under the heading "Depreciation" (see Note 45).
The consolidated entities recognize any impairment loss on the carrying amount of these assets with charge to the heading “Impairment or (-) reversal of impairment on non - financial assets- Intangible assets” in the accompanying consolidated income statements (see note 48). The criteria used to recognize the impairment losses on these assets and, where applicable, the recovery of impairment losses recognized in prior years, are similar to those used for tangible assets.
2.2.9 Insurance and reinsurance contracts
The assets of the BBVA Group’s insurance subsidiaries are recognized according to their nature under the corresponding headings of the consolidated balance sheets and the initial recognition and valuation is carried out according to the criteria set out in IFRS 4.
The heading “Reinsurance assets” in the accompanying consolidated balance sheets includes the amounts that the consolidated insurance subsidiaries are entitled to receive under the reinsurance contracts entered into by them with third parties and, more specifically, the share of the reinsurer in the technical provisions recognized by the consolidated insurance subsidiaries.
The heading “Liabilities under insurance contracts” in the accompanying consolidated balance sheets includes the technical provisions for direct insurance and inward reinsurance recognized by the consolidated insurance subsidiaries to cover claims arising from insurance contracts in force at period-end (see Note 23).
The income or expenses reported by the BBVA Group’s consolidated insurance subsidiaries on their insurance activities is recognized, in accordance with their nature, in the corresponding items of the consolidated income statements.
The consolidated insurance entities of the BBVA Group recognize the amounts of the premiums written to the income statement and a charge for the estimated cost of the claims that will be incurred at their final settlement to their consolidated income statements. At the close of each year the amounts collected and unpaid, as well as the costs incurred and unpaid, are accrued.
The most significant provisions registered by consolidated insurance entities with respect to insurance policies issued by them are set out by their nature in Note 23.
F-29
According to the type of product, the provisions may be as follows:
• Life insurance provisions:
Represents the value of the net obligations undertaken with the life insurance policyholder. These provisions include:
– Provisions for unearned premiums. These are intended for the accrual, at the date of calculation, of the premiums written. Their balance reflects the portion of the premiums received until the closing date that has to be allocated to the period from the closing date to the end of the insurance policy period.
– Mathematical reserves: Represents the value of the life insurance obligations of the insurance entities at year-end, net of the policyholder’s obligations, arising from life insurance contracted.
• Non-life insurance provisions:
– Provisions for unearned premiums. These provisions are intended for the accrual, at the date of calculation, of the premiums written. Their balance reflects the portion of the premiums received until year-end that has to be allocated to the period between the year-end and the end of the policy period.
– Provisions for unexpired risks: The provision for unexpired risks supplements the provision for unearned premiums by the amount by which that provision is not sufficient to reflect the assessed risks and expenses to be covered by the consolidated insurance subsidiaries in the policy period not elapsed at year-end.
• Provision for claims:
This reflects the total amount of the outstanding obligations arising from claims incurred prior to year-end. Insurance subsidiaries calculate this provision as the difference between the total estimated or certain cost of the claims not yet reported, settled or paid, and the total amounts already paid in relation to these claims.
• Provision for bonuses and rebates:
This provision includes the amount of the bonuses accruing to policyholders, insurees or beneficiaries and the premiums to be returned to policyholders or insurees, as the case may be, based on the behavior of the risk insured, to the extent that such amounts have not been individually assigned to each of them.
• Technical provisions for reinsurance ceded:
Calculated by applying the criteria indicated above for direct insurance, taking account of the assignment conditions established in the reinsurance contracts in force.
• Other technical provisions:
Insurance entities have recognized provisions to cover the probable mismatches in the market reinvestment interest rates with respect to those used in the valuation of the technical provisions.
The BBVA Group controls and monitors the exposure of the insurance subsidiaries to financial risk and, to this end, uses internal methods and tools that enable it to measure credit risk and market risk and to establish the limits for these risks.
2.2.10 Tax assets and liabilities
Expenses on corporate income tax applicable to the BBVA Group’s Spanish entities and on similar income taxes applicable to consolidated foreign entities are recognized in the consolidated income statement, except when they result from transactions on which the profits or losses are recognized directly in equity, in which case the related tax effect is also recognized in equity. The total corporate income tax expense is calculated by aggregating the current tax arising from the application of the corresponding tax rate to the tax for the year (after deducting the tax credits or discounts allowable for tax purposes) and the change in deferred tax assets and liabilities recognized in the consolidated income statement.
Deferred tax assets and liabilities include temporary differences, defined as the amounts to be payable or recoverable in future years arising from the differences between the carrying amount of assets and liabilities and their tax bases (the “tax value”), and tax loss and tax credit or discount carry forwards. (see Note 19).
The "Tax Assets" line item in the accompanying consolidated balance sheets includes the amount of all the assets of a tax nature, and distinguishes between: "Current” (amounts recoverable by tax in the next twelve months) and "Deferred" (which includes the amount of tax to be recovered in future years, including those arising from tax losses or credits for deductions or rebates that can be compensated). The "Tax Liabilities" line item in the accompanying consolidated balance sheets includes the amount of all the liabilities of a tax nature, except for provisions for taxes, broken down into: "Current” (income tax payable on taxable profit for the year and other
F-30
taxes payable in the next twelve months) and "Deferred" (the amount of corporate tax payable in subsequent years).
Deferred tax liabilities attributable to taxable temporary differences associated with investments in subsidiaries, associates or joint venture entities are recognized as such, except where the Group can control the timing of the reversal of the temporary difference and it is unlikely that it will reverse in the future. Deferred tax assets are recognized to the extent that it is considered probable that the consolidated entities will have sufficient taxable profits in the future against which the deferred tax assets can be utilized and are not from the initial recognition (except in the case of a business combination) of other assets or liabilities in a transaction that does not affect the fiscal outcome or the accounting result.
The deferred tax assets and liabilities recognized are reassessed by the consolidated entities at each balance sheet date in order to ascertain whether they are still current, and the appropriate adjustments are made on the basis of the findings of the analyses performed. In those circumstances in which it is unclear how a specific requirement of the tax law applies to a particular transaction or circumstance, and the acceptability of the definitive tax treatment depends on the decisions taken by the relevant taxation authority in future, the entity recognizes current and deferred tax liabilities and assets considering whether it is probable or not that a taxation authority will accept an uncertain tax treatment. Thus, if the entity concludes that it is not probable that the taxation authority will accept an uncertain tax treatment, the entity uses the amount expected to be paid to (recovered from) the taxation authorities.
The income and expenses directly recognized in equity that do not increase or decrease taxable income are accounted for as temporary differences.
2.2.11 Provisions, contingent assets and contingent liabilities
The heading “Provisions” in the consolidated balance sheets includes amounts recognized to cover the BBVA Group’s current obligations arising as a result of past events. These are certain in terms of nature but uncertain in terms of amount and/or settlement date. The settlement of these obligations is deemed likely to entail an outflow of resources embodying economic benefits (see Note 24). The obligations may arise in connection with legal or contractual provisions, valid expectations formed by Group entities relative to third parties in relation to the assumption of certain responsibilities or through virtually certain developments of particular aspects of the regulations applicable to the operation of the entities; and, specifically, future legislation to which the Group will certainly be subject. The provisions are recognized in the consolidated balance sheets when each and every one of the following requirements is met:
• They represent a current obligation that has arisen from a past event;
• At the date referred to by the consolidated financial statements, there is more probability that the obligation will have to be met than that it will not;
• It is probable that an outflow of resources embodying economic benefits will be required to settle the obligation; and
• The amount of the obligation can be reasonably estimated.
Among other items, these provisions include the commitments made to employees by some of the Group entities (mentioned in section 2.2.12), as well as provisions for tax and legal litigation.
Contingent assets are possible assets that arise from past events and whose existence is conditional on, and will be confirmed only by, the occurrence or non-occurrence of events beyond the control of the Group. Contingent assets are not recognized in the consolidated balance sheet or in the consolidated income statement; however, they will be disclosed, should they exist, in the Notes to the consolidated financial statements, provided that it is probable that these assets will give rise to an increase in resources embodying economic benefits.
Contingent liabilities are possible obligations of the Group that arise from past events and whose existence is conditional on the occurrence or non-occurrence of one or more future events beyond the control of the Group. They also include the existing obligations of the Group when it is not probable that an outflow of resources embodying economic benefits will be required to settle them; or when, in extremely rare cases, their amount cannot be measured with sufficient reliability.
Contingent liabilities are not recognized in the consolidated balance sheet or the income statement (excluding contingent liabilities from business combination) but are reported in the consolidated financial statements.
F-31
2.2.12 Pensions and other post-employment commitments
Below is a description of the most significant accounting criteria relating to the commitments to employees, in terms of post-employment benefits and other long-term commitments, of certain BBVA Group entities in Spain and abroad (see Note 25).
Commitments valuation: assumptions and actuarial gains/losses recognition
The present values of these commitments are quantified based on an individual member data. Current employee costs are calculated using the projected unit credit method, which sees each period of service as giving rise to an additional unit of benefit/commitment and measures each unit separately to build up the final obligation.
The actuarial assumptions should take into account that:
• They are unbiased, in that they are not unduly aggressive or excessively conservative.
• They are compatible with each other and adequately reflect the existing economic relations between factors such as inflation, foreseeable wage increases, discount rates and the expected return on plan assets, etc. The future levels of wages and benefits are based on market expectations at the consolidated balance sheet date for the period over which the obligations are to be settled.
• The rate used to discount the commitments is determined by reference to market yields at the date referred to by the consolidated financial statements on high quality bonds.
The BBVA Group recognizes actuarial gains or losses originating in the commitments assumed with staff taking early retirement, benefits awarded for seniority and other similar items under the heading “Provisions or reversal of provisions” of the consolidated income statement for the period in which these differences occur (see Note 46). The BBVA Group recognizes the actuarial gains or losses arising on all other defined-benefit post-employment commitments directly under the heading "Accumulated other comprehensive income – Items that will not be reclassified to profit or loss - Other adjustments" of equity in the accompanying consolidated balance sheets (see Note 30).
Post-employment benefit commitments
Pensions
The BBVA Group’s post-employment benefit commitments are either defined-contribution or defined-benefit.
• Defined-contribution commitments: The amounts of these commitments are established as a percentage of certain remuneration items and/or as a fixed pre-established amount. The contributions made in each period by the BBVA Group’s entities for these commitments are recognized with a charge to the heading “Administration costs - Personnel expenses - Defined-contribution plan expense” in the consolidated income statements (see Note 44.1).
• Defined-benefit commitments: Some of the BBVA Group’s entities have defined-benefit commitments for the permanent disability and death of certain current employees and early retirees, as well as defined-benefit retirement commitments applicable only to certain groups of current employees, or employees taking early retirement and retired employees. These commitments are either funded by insurance contracts or recognized as provisions.
The amounts recognized under the heading “Provisions – Provisions for pensions and similar obligations” are the differences, at the date of the consolidated financial statements, between the present values of the commitments for defined-benefit commitments and the fair value of plan assets (see Note 25).
Payments made by the Group’s entities for defined-benefit commitments covering current employees are charged to the heading “Administration cost - Personnel expenses - Defined benefit plan expense” in the accompanying consolidated income statements (see Note 44.1).
Early retirement
The BBVA Group has offered certain employees in Spain the option of taking early retirement (that is earlier than the age stipulated in the collective labor agreement in force) and has recognized the corresponding provisions to cover the cost of the commitments related to this item. The present values of early retirement obligations are quantified based on an individual member data and are recognized under the heading “Provisions – Provisions for pensions and similar obligations” in the accompanying consolidated balance sheets (see Note 25).
F-32
The early retirement commitments in Spain include the compensation and indemnities and contributions to external pension funds payable during the period of early retirement. The commitments relating to this group of employees after they have reached normal retirement age are dealt with in the same way as pension commitments as mentioned in the previous section.
Other post-employment welfare benefits
Some of the BBVA Group’s entities have welfare benefit commitments whose effects extend beyond the date of retirement of the employees entitled to the benefits. These commitments relate to certain current employees and retirees, depending upon the employee group to which they belong.
The present values of post-employment welfare benefits are quantified based on an individual member data and are recognized under the heading “Provisions – Provisions for pensions and similar obligations” in the consolidated balance sheets (see Note 25).
Other commitments to employees
Some of the BBVA Group’s entities are obliged to deliver goods and services to groups of employees. The most significant of these, in terms of the type of compensation and the event giving rise to the commitments, are as follows: loans to employees, life insurance, study assistance and long-service awards.
Some of these commitments are measured using actuarial studies, so that the present values of the vested obligations for commitments with personnel are quantified based on an individual member data. They are recognized under the heading “Provisions” in the accompanying consolidated balance sheets (see Note 24).
The cost of these benefits provided by Spanish entities in the BBVA Group to active employees are recognized under the heading “Administration costs - personnel expenses - Other personnel expenses” in the consolidated income statements (see Note 44.1).
Other commitments for current employees accrue and are settled on a yearly basis, so it is not necessary to register a provision in this regard.
Provided they constitute the delivery of such equity instruments following the completion of a specific period of services, equity-settled share-based payment transactions are recognized as an expense for services being provided by employees, by way of a balancing entry under the heading “Stockholders’ equity – Other equity” in the consolidated balance sheet. These services are measured at fair value for the employees services received, unless such fair value cannot be calculated reliably. In such case, they are measured by reference to the fair value of the equity instruments granted, taking into account the date on which the commitments were granted and the terms and other conditions included in the commitments.
When the initial compensation agreement includes what may be considered market conditions among its terms, any changes in these conditions will not be reflected in the consolidated income statement, as these have already been accounted for in calculating the initial fair value of the equity instruments. Non-market vesting conditions are not taken into account when estimating the initial fair value of equity instruments, but they are taken into account when determining the number of equity instruments to be issued. This will be recognized on the consolidated income statement with the corresponding increase in total equity.
2.2.14 Termination benefits
Termination benefits are recognized in the accounts when the BBVA Group agrees to terminate employment contracts with its employees and has established a detailed plan or has raised a valid expectation in those affected that it will carry out the restructuring by starting to implement that plan or announcing its main features to those affected by it.
2.2.15 Treasury stock
The value of common stock issued by the BBVA Group’s entities and held by them - basically, shares and derivatives on the Bank’s shares held by some consolidated entities that comply with the requirements to be recognized as equity instruments - are recognized as a decrease to net equity, under the heading "Stockholders’ funds - Treasury stock" in the consolidated balance sheets (see 29).
F-33
These financial assets are recognized at acquisition cost, and the gains or losses arising on their disposal are credited or debited, as appropriate, to the heading “Stockholders’ funds - Retained earnings” in the consolidated balance sheets (see Note 28).
2.2.16 Foreign-currency transactions and exchange differences
The BBVA Group’s functional currency, and thus the currency in which the consolidated financial statements are presented, is the euro. Thus, all balances and transactions denominated in currencies other than the euro are deemed to be denominated in “foreign currency”.
Conversion to euros of the balances held in foreign currency is performed in two consecutive stages:
• Conversion of the foreign currency to the functional currency (currency of the main economic environment in which the entity operates); and
• Conversion to euros of the balances held in the functional currencies of the entities whose functional currency is not the euro.
Conversion of the foreign currency to the functional currency
Transactions denominated in foreign currencies carried out by the consolidated entities (or accounted for using the equity method) are initially accounted for in their respective currencies. Subsequently, the monetary balances in foreign currencies are converted to their respective functional currencies using the exchange rate at the close of the financial year. In addition,
• Non-monetary items valued at their historical cost are converted to the functional currency at the exchange rate in force on the purchase date.
• Non-monetary items valued at their fair value are converted at the exchange rate in force on the date on which such fair value was determined.
• Income and expenses are converted at the period’s average exchange rates for all the operations carried out during the period. When applying this criterion the BBVA Group considers whether significant variations have taken place in exchange rates during the financial year which, owing to their impact on the statements as a whole, require the application of exchange rates as of the date of the transaction instead of such average exchange rates.
The exchange differences produced when converting the balances in foreign currency to the functional currency of the consolidated entities are generally recognized under the heading "Exchange differences (net)" in the consolidated income statements. However, the exchange differences in non-monetary items, measured at fair value, are recognized temporarily in equity under the heading “Accumulated other comprehensive income - - Items that may be reclassified to profit or loss - Exchange differences” in the consolidated balance sheets.
Conversion of functional currencies to euros
The balances in the financial statements of consolidated entities whose functional currency is not the euro are converted to euros as follows:
• Assets and liabilities: at the average spot exchange rates as of the date of each of the consolidated financial statements.
• Income and expenses and cash flows are converted by applying the exchange rate in force on the date of the transaction, and the average exchange rate for the financial year may be used, unless it has undergone significant variations.
• Equity items: at the historical exchange rates.
The exchange differences arising from the conversion to euros of balances in the functional currencies of the consolidated entities whose functional currency is not the euro are recognized under the heading “Accumulated other comprehensive income – Items that may be reclassified to profit or loss - Exchange differences” in the consolidated balance sheets. Meanwhile, the differences arising from the conversion to euros of the financial statements of entities accounted for by the equity method are recognized under the heading " Accumulated other comprehensive income - Items that may be reclassified to profit or loss - Entities accounted for using the equity method" until the item to which they relate is derecognized, at which time they are recognized in the income statement.
F-34
The breakdown of the main consolidated balances in foreign currencies as of June 30, 2016 and December 31, 2015, with reference to the most significant foreign currencies, is set forth in Appendix VII.
Venezuela
Local financial statements of the Group subsidiaries in Venezuela are expressed in Venezuelan Bolivar, and converted into euros for the consolidated financial statements, as indicated below, since Venezuela is a country with strong exchange restrictions and has different rates officially published:
• On February 10, 2015, the Venezuelan government announced the creation of a new foreign-currency system called SIMADI.
• The Group used the SIMADI exchange rate from March 2015 for the conversion of the financial statements of the Group companies located in Venezuela for their consolidated financial statements. The SIMADI exchange rate started to reflect the exchange rate of actual transactions increasing rapidly to approximately 200 Venezuelan bolivars per U,S. dollar (approximately 218 Venezuelan bolivars per euro), however, from May, and during the second half of 2015 the trend was confirmed, the SIMADI exchange rate had hardly fluctuated, reaching as of December 31, 2015 216.3 Venezuelan bolivars per euro, which could be considered unrepresentative of the convertibility of the Venezuelan currency.
• In February 2016, the Venezuelan government approved a new exchange rate agreement which sets two new mechanisms that regulate the purchase and sale of foreign currency and the suspension of the SIMADI exchange rate.
• As of December 31, 2015 and June 30, 2016, the Board of Directors considers that the use of the new exchanges rates and, previously, SIMADI for converting bolivars into euros in preparing the consolidated financial statements does not reflect the true picture of the financial statements of the Group and the financial position of the Group subsidiaries in Venezuela.
• Consequently, as of December 31, 2015 and June 30, 2016, the Group has used in the conversion of the financial statements of these foreign exchange rates amounting to 469 and 1,170 Venezuelan bolivars per euro, respectively. These exchanges rates have been calculated taking into account the estimated evolution of inflation in Venezuela at those dates (170% and 133.6%, respectively) by the Research Service of the Group (see Note 2.2.20).
2.2.17 Recognition of income and expenses
The most significant criteria used by the BBVA Group to recognize its income and expenses are as follows.
• Interest income and expenses and similar items:
As a general rule, interest income and expenses and similar items are recognized on the basis of their period of accrual using the effective interest rate method. The financial fees and commissions that arise on the arrangement of loans and advances (basically origination and analysis fees) are deferred and recognized in the income statement over the expected life of the loan. The direct costs incurred in originating these loans and advances can be deducted from the amount of financial fees and commissions recognized. These fees are part of the effective interest rate for the loans and advances. Also dividends received from other entities are recognized as income when the consolidated entities’ right to receive them arises.
However, when a loan is deemed to be impaired individually or is included in the category of instruments that are impaired because their recovery is considered to be remote, the recognition of accrued interest in the consolidated income statement is discontinued. This interest is recognized for accounting purposes as income, as soon as it is received.
• Commissions, fees and similar items.
• Income and expenses relating to commissions and similar fees are recognized in the consolidated income statement using criteria that vary according to the nature of such items. The most significant items in this connection are:
- Those relating to financial assets and liabilities measured at fair value through profit or loss, which are recognized when collected/paid.
- Those arising from transactions or services that are provided over a period of time, which are recognized over the life of these transactions or services.
- Those relating to single acts, which are recognized when this single act is carried out.
• Non-financial income and expenses:
F-35
These are recognized for accounting purposes on an accrual basis.
• Deferred collections and payments:
These are recognized for accounting purposes at the amount resulting from discounting the expected cash flows at market rates.
2.2.18 Sales and income from the provision of non-financial services
The heading “Other operating income” in the consolidated income statements includes the proceeds of the sales of assets and income from the services provided by the Group entities that are not financial institutions. In the case of the Group, these entities are mainly real estate and service entities (see Note 43).
2.2.19 Leases
Lease contracts are classified as finance leases from the inception of the transaction, if they substantially transfer all the risks and rewards incidental to ownership of the asset forming the subject-matter of the contract. Leases other than finance leases are classified as operating leases.
When the consolidated entities act as the lessor of an asset in finance leases, the aggregate present values of the lease payments receivable from the lessee plus the guaranteed residual value (normally the exercise price of the lessee’s purchase option on expiration of the lease agreement) are recognized as financing provided to third parties and, therefore, are included under the heading “Loans and receivables” in the accompanying consolidated balance sheets.
When the consolidated entities act as lessors of an asset in operating leases, the acquisition cost of the leased assets is recognized under "Tangible assets – Property, plant and equipment – Other assets leased out under an operating lease" in the consolidated balance sheets (see Note 17). These assets are depreciated in line with the criteria adopted for items of tangible assets for own use, while the income arising from the lease arrangements is recognized in the consolidated income statements on a straight-line basis within "Other operating expenses" (see Note 43).
If a fair value sale and leaseback results in an operating lease, the profit or loss generated from the sale is recognized in the consolidated income statement at the time of sale. If such a transaction gives rise to a finance lease, the corresponding gains or losses are accrued over the lease period.
The assets leased out under operating lease contracts to other entities in the Group are treated in the consolidated financial statements as for own use, and thus rental expense and income is eliminated and the corresponding depreciation is recognized.
2.2.20 Entities and branches located in countries with hyperinflationary economies
In order to assess whether an economy is under hyperinflation, the country’s economic environment is evaluated, analyzing whether certain circumstances exist, such as:
• The country’s population prefers to keep its wealth or savings in non-monetary assets or in a relatively stable foreign currency;
• Prices may be quoted in a relatively stable foreign currency;
• Interest rates, wages and prices are linked to a price index;
• The cumulative inflation rate over three years is approaching, or exceeds, 100%.
The fact that any of these circumstances is present will not be a decisive factor in considering an economy hyperinflationary, but it does provide some reasons to consider it as such.
F-36
Since 2009, the economy of Venezuela can be considered hyperinflationary under the above criteria. As a result, the financial statements of the BBVA Group’s entities located in Venezuela have therefore been adjusted to correct for the effects of inflation in accordance with IAS 29 “ Financial Reporting in Hyperinflationary Economies“.
The breakdown of the General Price Index and the inflation index used as of June 30, 2016 and December 31, 2015 for the inflation restatement of the financial statements of the Group companies located in Venezuela is as follows:
General Price Index June 2016 (**) December 2015 (*)
GPI 2,357.90
Average GPI 1,460.50
Inflation of the period 133.6% 170.0%
(*) At the date of preparation of these consolidated financial statements in 2015, the Venezuelan government had not released the official inflation figures. The Group has estimated the inflation rate applicable to December 31, 2015, based on the best estimate of BBVA Research of the Group (170%) in line with other estimates made by various international organizations. Subsequently, at the publication of the consolidated financial statements, the official inflation figures was published, ending at 180.9%
(**) As of June 30, 2016, the Venezuelan government had not released the official inflation figures since December 2015, as in the Annual Report of 2015, the group estimated the inflation rate applicable at (133.6%)
The losses recognized under the heading “Profit attributable to the parent company” in the accompanying consolidated income statement as a result of the adjustment for inflation on net monetary position of the Group entities in Venezuela amounted to €38.5 million (€24 million in June 2015).
2.3 Recent IFRS pronouncements
Changes introduced in the first semester of 2016
The following modifications to the IFRS standards or their interpretations (hereinafter “IFRIC”) came into force after January 1, 2016. They have not had a significant impact on the BBVA Group’s consolidated financial statements corresponding to the period ended June 30, 2016.
Amended IFRS 11 - “Joint Arrangements”
The amendments made to IFRS 11 require the acquirer of an interest in a joint operation in which the activity constitutes a business to apply all of the principles on business combinations accounting in IFRS 3 and other IFRSs. These modifications will be applied to the accounting years starting on or after January 1, 2016, although early adoption is permitted.
Amended IAS 16 - “Property, Plant and Equipment” and Amended IAS 38 – “Intangible Assets”.
The amendments made to IAS 16 and IAS 38 exclude, as general rule, as depreciation method to be used, those methods based on revenue that is generated by an activity that includes the use of an asset, because the revenue generated by an activity that includes the use of an asset generally reflects factors other than the consumption of the economic benefits of the asset.
Amended IAS 27 – “Separate financial statements”
Changes to IAS 27 allow entities to use the equity method to account for investment in subsidiaries, joint ventures and associates, in their separate financial statements.
Annual improvements cycle to IFRSs 2012-2014
The annual improvements cycle to IFRSs 2012-2014 includes minor changes and clarifications to IFRS 5 – Noncurrent assets held for sale and discontinued operations, IFRS 7 – Financial instruments: Information to disclose, IAS 19 – Employee benefits and IAS 34 – interim financial information.
Amended IAS 1 – Presentation of Financial Statements
The amendments made to IAS 1 further encourage companies to apply professional judgment in determining what information to disclose in their financial statements, in determining when line items are disaggregated and additional headings and subtotals included in the statement of financial position and the statement of profit or loss
F-37
and other comprehensive income, and in determining where and in what order information is presented in the financial disclosures.
Amended IFRS 10 - “Consolidated Financial Statements”, Amended IFRS 12 – “Disclosure of interests in other
entities” and Amended IAS 28 – “Investments in Associates and Joint Ventures”
The amendments to IFRS 10, IFRS 12 and IAS 28 introduce clarifications to the requirements when accounting for investment entities in three aspects:
• The amendments confirm that a parent entity that is a subsidiary of an investment entity has the possibility to apply the exemption from preparing consolidated financial statements
• The amendments clarify that if an investment entity has a subsidiary whose main purpose is to support the investment entity’s investment activities by providing investment-related services or activities, to the entity or other parties, and that is not itself an investment entity, it shall consolidate that subsidiary; but if that subsidiary is itself an investment entity, the investment entity parent shall measure the subsidiary at fair value through profit or loss.
• The amendments require a non-investment entity investor to retain, when applying the equity method, the fair value measurement applied by an investment entity associate or joint venture to its interests in subsidiaries.
This Standard came into force on January 1, 2016, but endorsement by the European Union is expected on the 3
rd Quarter of 2016.
Standards and interpretations issued but not yet effective as of June 30, 2016
New International Financial Reporting Standards together with their interpretations had been published at the date of preparation of the accompanying consolidated financial statements, but are not obligatory as of June 30, 2016. Although in some cases the IASB permits early adoption before they come into force, the BBVA Group has not done so as of this date, as it is still analyzing the effects that will result from them.
IFRS 9 - “Financial instruments”
As of July, 24, 2014, IASB issued the IFRS 9 which will replace IAS 39. The new standard introduces significant differences with respect to the current regulation with regards to financial assets; among others, the approval of a new classification model based on two single categories of amortized cost and fair value, the elimination of the current “Held-to-maturity-investments” and “Available-for-sale financial assets” categories, impairment analyses only for assets measured at amortized cost and non-separation of embedded derivatives in contracts of financial assets. With regard to financial liabilities, the classification categories proposed by IFRS 9 are similar to those contained in IAS 39, so there should not be very significant differences save for the requirement to recognize changes in fair value related to own credit risk as a component of equity, in the case of financial liabilities designated at fair value through profit or loss. Hedge accounting requirements also differs from the current IAS 39 due to the new focus on the economic risk management.
Impairment requirements will apply to financial assets measured at amortized cost and at fair value through other comprehensive income, and to lease receivables and certain loan commitments and financial guarantee contracts. At initial recognition, an allowance is required for expected credit losses resulting from default events that may occur within the next 12 months ("12 month expected credit losses").In the event of a significant increase in credit risk, an allowance is required for expected credit losses resulting from all possible default events over the expected life of the financial instrument (“lifetime expected credit losses”).The assessment of whether the credit risk has increased significantly since initial recognition should be performed for each reporting period by considering the change in the risk of default occurring over the remaining life of the financial instrument. The assessment of credit risk, and the estimation of expected credit losses, should be performed so that they are probability-weighted and unbiased and shall include all available information that is relevant to the assessment, including information about past events, current conditions and reasonable and supportable expectations of future events and economic conditions at the reporting date. As a result, the goal is for the recognition and measurement of impairment to be more proactive and forward-looking than under the current incurred loss model of IAS 39. Theoretically, an increase in the total level of impairment allowances is expected, since all financial assets will be assessed for at least 12 month expected credit losses and the population of financial assets to which lifetime expected credit losses will be applied is expected to be larger than the population for which there is objective evidence of impairment under IAS 39
IFRS 9 will also affect hedge accounting, because the focus of the Standard is different from that of the current IAS 39, as it tries to align the accounting requirements with economic risk management. IFRS 9 will also permit to apply hedge accounting to a wider range of risks and hedging instruments. The Standard does not address the accounting for the macro hedging strategies. To avoid any conflict between the current macro hedge accounting
F-38
and the new general hedge accounting requirements, IFRS 9 includes an accounting policy choice to continue applying hedge accounting according to IAS 39.
The IASB has established January 1, 2018, as the mandatory application date, with the possibility of early adoption.
During 2015 and the first semester of 2016, the Group has been analyzing this new Standard and the implications it will have in 2018 on the classification of portfolios and the valuation models for financial instruments, focusing on impairment loss models for financial assets through expected loss models.
In 2016, the Group will continue working on the definition of accounting policies, on the implementation of the Standard, which has implications both on the financial statements and on the Group´s daily operations (initial and subsequent risk assessment, changes in systems, management metrics, etc.), and also on the models used for the presentation of financial statements.
As of the date of preparation of these Consolidated Financial Statements, the Group does not have an estimation of the quantitative impact that this Standard will have on January 1, 2018 when it will come into force. The Group expects to have a parallel calculation during 2017 in order to have comparative information for the previous year when the Standard comes into effect.
The IASB modified IFRS 7 in December 2011 to include new disclosures on financial instruments that entities will have to provide as soon as they apply IFRS 9 for the first time.
IFRS 15 - “Revenue from contracts with customers”
IFRS 15 contains the principles that an entity shall apply to account for revenue and cash flows arising from a contract with a customer.
The core principle of IFRS 15 is that a company should recognize revenue to depict the transfer of promised goods or services to the customer in an amount that reflects the consideration to which the company expects to be entitled in exchange for those goods or services, in accordance with contractually agreed. It is considered that the good or service is transferred when the customer obtains control over it.
The new Standard replaces IAS 18 - Revenue IAS 11 - Construction Contracts, IFRIC 13 - Customer Loyalty Programmes, IFRIC 15 - Agreements for the Construction of Real Estate, IFRIC 18 - Transfers of Assets from Customers and SIC 31 – Revenue-Transactions Involving Advertising Services
This Standard will be applied to the accounting years starting on or after January 1, 2018, although early adoption is permitted.
IFRS 15 – “Clarifications to IFRS 15 Revenue from Contracts with Customers”
The amendments to the Revenue Standard clarify how some of the underlying principles of the new Standard should be applied. Specifically, they clarify how to:
• Identify a performance obligation (the promise to transfer a good or a service to a customer) in a contract;
• Determine whether a company is a principal (the provider of a good or service) or an agent (responsible for arranging for the good or service to be provided); and
• Determine whether the revenue from granting a license should be recognized at a point in time or over time.
In addition to the clarifications, the amendments include two additional reliefs to reduce cost and complexity for a company when it first applies the new Standard.
The amendments will be applied at the same time as the IFRS 15, i.e. to the accounting periods beginning on or after January 1, 2018, although early application is permitted.
F-39
Amended IFRS 10 – “Consolidated financial statements” and Amended IAS 28 - “Investments in Associates and Joint Ventures”
The amendments to IFRS 10 and IAS 28 establish that when an entity sells or transfers assets are considered a business (including its consolidated subsidiaries) to an associate or joint venture of the entity, the latter will have to recognize any gains or losses derived from such transaction in its entirety. Notwithstanding, if the assets sold or transferred are not considered a business, the entity will have to recognize the gains or losses derived only to the extent of the interests in the associate or joint venture with unrelated investors.
These changes will be applicable to accounting periods beginning on the effective date, still to be determined, although early adoption is allowed.
.IAS 12 – “Income Taxes. Recognition of Deferred Tax Assets for Unrealized Losses”
The amendments made to IAS 12 clarify the requirements on recognition of deferred tax assets for unrealized losses on debt instruments measured at fair value. The following aspects are clarified:
• An unrealized loss on a debt instrument measured at fair value gives rise to a deductible temporary difference regardless of whether the holder expects to recover its carrying amount by holding the debt instrument until maturity or by selling the debt instrument.
• An entity assesses the utilization of deductible temporary differences in combination with other deductible temporary differences. In circumstances in which tax laws restricts the utilization of tax losses, an entity would assess a deferred tax asset in combination with other deferred tax assets of the appropriate type.
• An entity’s estimate of future taxable profit can include amounts from recovering assets for more than their carrying amounts if there is sufficient evidence to conclude that it is probable that the entity will achieve this.
• An entity’s estimate of future taxable profit excludes tax deductions resulting from the reversal of deductible temporary difference.
These modifications will be applied to the accounting periods beginning on or after January 1, 2017, although early application is permitted.
IFRS 16 – “Leases”
On January 13, 2016 the IASB issued the IFRS 16 which will replace IAS 17. The new standard introduces a single lessee accounting model and will require a lessee to recognize assets and liabilities for all leases with a term of more than 12 months, unless the underlying asset is of low value. A lessee will be required to recognize a right-of–use asset representing its right to use the underlying leased asset and a lease liability representing its obligation to make lease payments.
With regard to lessor accounting, IFRS 16 substantially carries forward the lessor accounting requirements in IAS 17. Accordingly, a lessor will continue to classify its leases as operating leases or finance leases, and account for those two types of leases differently.
The standard will be applied to the accounting years starting on or after January 1, 2019, although early application is permitted if IFRS 15 is also applied.
IAS 7 – “Statement of Cash Flows. Disclosure Initiative”
The amendments to IAS 7 introduce the following new disclosure requirements related to changes in liabilities arising from financing activities, to the extent necessary to enable users of financial statements to evaluate changes in those liabilities: changes from financing cash flows; changes arising from obtaining or losing control of subsidiaries or other businesses; the effect of changes in foreign exchange rates; changes in fair values; and other changes.
Liabilities arising from financing activities are liabilities for which cash flows were, or future cash flows will be, classified in the statement of cash flows as cash flows arising from financing activities. Additionally, the disclosure requirements also apply to changes in financial assets if cash flows from those financial assets were, or future cash flows will be, included in cash flows from financing activities.
These modifications will be applied to the accounting periods beginning on or after January 1, 2017, although early application is permitted.
IFRS 2 – “Classification and Measurement of Share-based Payment Transactions”
The amendments made to IFRS 2 provide requirements on three different aspects:
F-40
• When measuring the fair value of a cash-settled share-based payment vesting conditions, other than market conditions, shall be taken into account by adjusting the number of awards included in the measurement of the liability arising from the transaction.
• A transaction in which an entity settles a share-base payment arrangement net by withholding a specified portion of the equity instruments to meet a statutory tax withholding obligation will be classified as equity settled in its entirety if, without the net settlement feature, the entire share-based payment would otherwise be classified as equity-settled.
• In case of modification of a share-based payment from cash-settled to equity-settled, the modification will be accounted for derecognizing the original liability and recognizing in equity the fair value of the equity instruments granted to the extent that services have been rendered up to the modification date; any difference will be recognized immediately in profit or loss
These modifications will be applied to the accounting periods beginning on or after January 1, 2018, although early application is permitted.
3. BBVA Group
The BBVA Group is an international diversified financial group with a significant presence in retail banking, wholesale banking, asset management and private banking. The Group also operates in other sectors such as insurance, real estate, operational leasing, etc.
Appendix I and II provide relevant information as of June 30, 2016 on the Group’s subsidiaries, consolidated structured entities, and investments in associate entities and joint venture entities. Appendix III shows the main changes in investments for the year ended June 30, 2016, and Appendix IV gives details of the consolidated subsidiaries and which, based on the information available, are more than 10% owned by non-Group shareholders as of June 30, 2016.
The following table sets forth information related to the Group’s total assets as of June 30, 2016 and December 31, 2015, broken down by the Group’s entities according to their activity:
Millions of Euros
Contribution to Consolidated Group Total Assets.
Entities by Main Activities
June
2016
December
2015
Banks and other financial services 713,697 718,204
Insurance and pension fund managing companies 26,413 25,741
Other non-financial services 5,930 6,133
Total 746,040 750,078
The total assets and results of operations broken down by the geographical areas, in which the BBVA Group operates, are included in Note 6.
The BBVA Group’s activities are mainly located in Spain, Mexico, South America, the United States and Turkey, with active presence in other countries, as shown below:
• Spain
The Group’s activity in Spain is mainly through Banco Bilbao Vizcaya Argentaria, S.A., which is the parent company of the BBVA Group (including Catalunya Banc). The Group also has other entities that operate in Spain’s banking sector, insurance sector, real estate sector, services and as operational leasing entities.
• Mexico
The BBVA Group operates in Mexico, not only in the banking sector, but also in the insurance sector through Grupo Financiero Bancomer.
F-41
• South America
The BBVA Group’s activities in South America are mainly focused on the banking and insurance sectors, in the following countries: Argentina, Chile, Colombia, Peru, Paraguay, Uruguay and Venezuela. It has a representative office in Sao Paulo (Brazil).
The Group owns more than 50% of most of the entities based in these countries. Appendix I shows a list of the entities which, although less than 50% owned by the BBVA Group as of June 30, 2016, are consolidated (see Note 2.1).
• United States
The Group’s activity in the United States is mainly carried out through a group of entities with BBVA Compass Bancshares, Inc. at their head, the New York BBVA branch and a representative office in Silicon Valley (California).
• Turkey
The Group’s activity in Turkey is mainly carried out through the Garanti Group.
• Rest of Europe
The Group’s activity in Europe is carried out through banks and financial institutions in Ireland, Switzerland, Italy, Netherlands, Romania, Russia and Portugal, branches in Germany, Belgium, France, Italy and the United Kingdom, and representative offices in Russia.
• Asia-Pacific
The Group’s activity in this region is carried out through branches (in Taipei, Seoul, Tokyo, Hong Kong Singapore and Shanghai) and representative offices (in Beijing, Mumbai, Abu Dhabi, Sydney and Jakarta).
Changes in the Group in the first semester 2016
Mergers
The BBVA Group, at its Board of Directors meeting held on March 31, 2016, adopted a resolution to begin a merger process of BBVA S.A. (absorbing company), Catalunya Banc, S.A., Banco Depositario BBVA, S.A. and Unoe Bank, S.A. This transaction is part of the corporate reorganization of its banking subsidiaries in Spain.
These transactions have no impact in the consolidated financial statements both from the accounting and the solvency stand points. The BBVA Group owns 99.09% of the share capital of Catalunya Banc, S.A. and 100% of the Banco Depositario BBVA, S.A and Unoe Bank, S.A.
Changes in the Group in 2015
During 2015, it was registered the full consolidation of Garanti since the date of effective control (third quarter) and the acquisition of Catalunya Banc (second quarter). These effects impact on the period-on-period comparison of all the income statements was affected with the previous first semester results.
Investments
Acquisition of an additional 14.89% of Garanti
On November 19, 2014, the Group signed a new agreement with Dogus Holding AS, Ferit Faik Sahenk, Dianne Sahenk and Defne Sahenk (hereinafter "Dogus") to, among other terms, the acquisition of 62,538,000,000 additional shares of Garanti (equivalent to 14.89% of the capital of this entity) for a maximum total consideration of 8.90 Turkish lira per batch (Garanti traded in batches of 100 shares each).
In the same agreement stated that if the payment of dividends for the year 2014 was executed by Dogus before the closing of the acquisition, that amount would be deducted from the amount payable by BBVA. On April 27, 2015, Dogus received the amount of the dividend paid to shareholders of Garanti, which amounted to Turkish Liras 0.135 per batch.
On July 27, 2015, after obtaining all the required regulatory approvals, the Group has materialized said participation increase after the acquisition of the new shares. Now the Group's interest in Garanti is 39.9%.
F-42
The total price effectively paid by BBVA amounts to 8,765 TL per batch (amounting to approximately TL 5,481 million and €1,857 million applying a 2.9571 TL/EUR exchange rate).
In accordance with the IFRS-IASB accounting rules, and as a consequence of the agreements reached, the BBVA Group shall, at the date of effective control, measure at fair value its previously acquired stake of 25.01% in Garanti (classified as a joint venture accounted for using the equity method) and shall consolidate Garanti in the consolidated financial statements of the BBVA Group, beginning on the above-mentioned effective control date.
Measuring the above-mentioned stake in Garanti Bank at fair value resulted in a negative impact in “Gains or (-) losses on derecognition of non-financial assets and subsidiaries, net” in the consolidated income statement of the BBVA Group for the second semester of 2015, which resulted in a net negative impact in the Profit attributable to owners of the parent of the BBVA Group in 2015 amounting to €1,840 million. Such accounting impact does not translate into any additional cash outflow from BBVA. Most of this impact is generated by the exchange rate differences due to the depreciation of the TL against Euro since the initial acquisition by BBVA of the 25.01% stake in Garanti Bank up to the date of effective control. As of December 31, 2015, these exchange rate differences were already registered as Other Comprehensive Income deducting the stock shareholder’s equity of the BBVA Group.
The agreements with the Dogus group include an agreement for the management of the bank and the appointment by the BBVA Group of the majority of the members of its Board of Directors (7 of 10). The 39.9% stake in Garanti is consolidated in the BBVA Group, because of these management agreements.
As of June 30, 2016, Garanti Group has total assets of €91,041 million, of which €57,975million are loans to customers, and a volume of customer deposits of €76,311million.
The Group estimate according to the acquisition method, the comparison between the fair values assigned to the assets acquired and the liabilities assumed from Garanti, along with the identified intangible assets, and cash payment made by the BBVA Group in consideration of the transaction generated a goodwill of €618 million (at exchange rate of June 30,2016), which is registered under the heading "Intangible assets - Goodwill" in the accompanying consolidated balance sheets as of June 30, 2016 (see Note 18.1).
Acquisition of Catalunya Banc
On July 21, 2014, the Management Commission of the Banking Restructuring Fund (known as “FROB”) accepted BBVA´s bid in the competitive auction for the acquisition of Catalunya Banc, S.A. (“Catalunya Banc”).
On April 24, 2015, once the necessary authorizations have been obtained and all the agreed conditions precedent have been fulfilled, BBVA announced that it acquired 1,947,166,809 shares of Catalunya Banc, S.A. (approximately 98.4% of its share capital) for a price of approximately €1,165 million.
As of June 30, 2016, Catalunya Banc contributed with a volume of assets of approximately €37,885 million, of which approximately €18,666 million corresponded to "Loans and advances to customers". "Financial Liabilities at amortized cost” amounted to approximately €32,531million.
As of December 31, 2015, according to the purchase method, the comparison between the fair values assigned to the assets acquired and the liabilities assumed from Catalunya Banc, and the cash payment made to the FROB in consideration of the transaction generated a difference of €26 million, which is registered under the heading “Negative goodwill recognized in profit or loss” in the accompanying consolidated income statement as of December 31, 2015. According to the IFRS 3, there is a period, up to a year, to complete the necessary adjustments to the calculation of initial acquisition (see Note 18.1). After the deadline, there has not been any significant adjustment that involves amending the calculation recorded in the year 2015.
Divestitures
Partial sale of China CITIC Bank Corporation Limited (CNCB)
On January 23, 2015 the Group BBVA signed an agreement to sell 4.9% in China CITIC Bank Corporation Limited (CNCB) to UBS AG, London Branch (UBS), who entered into transactions pursuant to which such CNCB shares will be transferred to a third party and the ultimate economic benefit of ownership of such CNCB shares will be transferred to Xinhu Zhongbao Co., Ltd (Xinhu) (the Relevant Transactions). On March 12, 2015, after having obtained the necessary approvals, BBVA completed the sale.
The selling price to UBS is HK$ 5.73 per share, amounting to a total of HK$ 13,136 million, equivalent to approximately €1,555 million (with an exchange rate of EUR/HK$=8.45 as of the date of the closing).
F-43
In addition to the above mentioned 4.9%, during the first semester of 2015 various sales were made in the market to total a 6.34% participation sale. The impact of these sales on the consolidated financial statements of the BBVA Group was a gain net of taxes of approximately €705 million. This gain gross of taxes was recognized under "Profit or loss from non-current assets and disposal groups classified as held for sale not qualifying as discontinued operations” (See Note 50).
As of June 30, 2016, BBVA holds a 3.11% (€832 million) interest in CNCB, this participation is recognized under the heading “Available for sale financial assets”.
Sale of the participation in Citic International Financial Holding (CIFH)
On December 23, 2014, the BBVA Group signed an agreement to sell its participation of 29.68% in Citic International Financial Holdings Limited (hereinafter “CIFH”), to China CITIC Bank Corporation Limited (hereinafter “CNCB”). CIFH is a non-listed subsidiary of CNCB domiciled in Hong Kong. The selling price is HK$8,162 million. The closing of such agreement is subject to the relevant regulatory approvals. The estimated impact on the attributable profit of the consolidated financial statements of the BBVA Group will not be significant.
On August 27, BBVA completed the sale of this participation. The impact on the consolidated financial statements of the BBVA Group was not significant.
F-44
4. Shareholder remuneration system
Shareholder remuneration system
Since 2011, a shareholder remuneration system called the “Dividend Option” was implemented.
Under this remuneration scheme, BBVA offers its shareholders the possibility to receive all or part of their remuneration in the form of newly-issued ordinary shares; whilst maintaining the possibility for BBVA shareholders to receive their entire remuneration in cash by selling their free allocation rights to BBVA (in execution of the commitment assumed by BBVA to acquire the free allocation rights attributed to the shareholders at a guaranteed fixed price) or by selling their free allocation rights on the market at the prevailing market price at that time.
On March 31, 2016, the Board of Directors approved the execution of the first of the share capital increases charged to voluntary reserves, as agreed by the AGM held on March 11, 2016 to implement the Dividend Option. As a result of this increase, the Bank’s share capital increased by €55,702,125.43 (113,677,807 shares at a €0.49 par value each). 82.13% of the right owners have opted to receive newly-issued BBVA ordinary shares. The other 17.87% of the right owners opted to sell the rights of free allocation assigned to them to BBVA, and as a result, BBVA acquired 1,137,500,965 rights for a total amount of €146,737,624.49. The price at which BBVA has acquired such rights of free allocation (in execution of said commitment) was €0.129 per right.
On September 30, 2015, the Board of Directors approved the execution of the second of the share capital increases charged to voluntary reserves, as agreed by the AGM held on March 13, 2015 to implement the Dividend Option. As a result of this increase, the Bank’s share capital increased by €30,106,631.94 (61,442,106 shares at a €0.49 par value each). 89.65% of the right owners opted to receive newly issued ordinary shares. The other 10.35% of the right owners opted to sell the rights of free allocation assigned to them to BBVA, and as a result, BBVA acquired 652,564,118 rights for a total amount of €52,205,129.44. The price at which BBVA acquired such rights of free allocation was €0.08 per right, registered in “Total Equity- Interim dividends” of the consolidated balance sheet as of December 31, 2015.
On March 25, 2015, the Board of Directors approved the execution of the first of the share capital increases charged to voluntary reserves, as agreed by the AGM held on March 13, 2015 to implement the Dividend Option. As a result of this increase, the Bank’s share capital increased by €39,353,896.26 (80,314,074 shares at a €0.49 par value each). 90.31% of the right owners opted to receive newly-issued BBVA ordinary shares. The other 9.69% of the right owners opted to sell the rights of free allocation assigned to them to BBVA, and as a result, BBVA acquired 602,938,646 rights for a total amount of €78,382,023.98. The price at which BBVA acquired such rights of free allocation was €0.13 per right, registered in “Total Equity- Interim dividends” of the consolidated balance sheet as of December 31, 2015.
Dividends
The Board of Directors, at its meeting held on June 22, 2016, approved the distribution in cash of €0.08 (€0.0648 withholding tax) per BBVA share, as gross interim dividend against 2016 results. The dividend is expected to be paid on July 11, 2016.
F-45
The interim accounting statements prepared in accordance with legal requirements evidencing the existence of sufficient liquidity for the distribution of the interim dividend in the amount approved, are as follows:
Millions of Euros
Available Amount for Interim Dividend Payments May 31,
2016
Profit of BBVA, S.A. at each of the dates indicated, after the provision for income tax 1,371
Less -
Estimated provision for Legal Reserve 11Acquisition by the bank of the free allotment rights in
2016 capital increase 147
Additional Tier I capital instruments remuneration 114Interim dividends for 2016 already paid -
Maximum amount distributable 1,099
Amount of proposed interim dividend 518
BBVA cash balance available to the date 2,614
The first amount of the 2016 interim dividend which was paid to the shareholders on July 11, 2016, after deducting the treasury shares held by the Group’s entities, amounted to €517 million, and is recognized under the heading “Stockholders’ funds – Interim dividends” of the interim balance sheet as of June 30, 2016 (see Note 22.4).
The Board of Directors, at its meeting held on December 22, 2015, approved the distribution in cash of €0.08 (€0.0648 withholding tax) per BBVA share, as gross interim dividend against 2015 results. The dividend was paid on January 12, 2016.
The total amount of the second dividend of 2015, which was paid to the shareholders on January 12, 2016, after deducting the treasury shares held by the Group’s companies, amounted to €506 million and was recognized under the heading “Stockholders’ funds – Interim dividends” charged in the “Financial liabilities at amortized cost – Other financial liabilities (see Note 22.4) of the consolidated balance sheet as of December 31, 2015.
The Board of Directors, at its meeting held on July 1, 2015, approved the distribution in cash of €0.08 (€0.064 withholding tax) per BBVA share, as gross interim dividend against 2015 results. The dividend was paid on July 16, 2015.
The first amount of the 2015 interim dividend which was paid to the shareholders on July 16, 2015, after deducting the treasury shares held by the Group’s entities, amounted to €504 million, and was recognized under the heading “Stockholders’ funds – Interim dividends” of the consolidated balance sheet as of December 31, 2015.
5. Earnings per share
Basic and diluted earnings per share are calculated in accordance with the criteria established by IAS 33. For more information see Glossary of terms.
The Bank issued additional share capital in 2016 and 2015 (see “Dividend Option” Program in 2015 in Note 26). In accordance with IAS 33, when events, other than the conversion of potential shares, have changed the number of shares outstanding without a corresponding change in resources, the weighted average number of shares outstanding during the period and for all the periods presented shall be adjusted. The prior year weighted average number of shares is adjusted by applying a corrective factor.
F-46
The calculation of earnings per share is as follows:
Basic and Diluted Earnings per ShareJune
2016
June
2015 (*)Numerator for basic and diluted earnings per share (millions of euros)
Profit attributable to parent company 1,832 2,759Adjustment: Additional Tier 1 securities (1) (114) (96)
Profit adjusted (millions of euros) (A) 1,718 2,663
Profit from discontinued operations (net of non-controlling interest) (B) - -
Denominator for basic earnings per share (number of shares outstanding)
Weighted average number of shares outstanding (2) 6,447 6,264Weighted average number of shares outstanding x corrective factor (3) 6,447 6,473
Adjusted number of shares - Basic earning per share (C) 6,447 6,473
Adjusted number of shares - diluted earning per share (D) 6,447 6,473
Earnings per share 0.27 0.41
Basic earnings per share from continued operations (Euros per share)A-B/C 0.27 0.41Diluted earnings per share from continued operations (Euros per share)A-B/D 0.27 0.41Basic earnings per share from discontinued operations (Euros per share)B/C - -Diluted earnings per share from discontinued operations (Euros per share)B/D - -
(1) Remuneration in the period related to contingent convertible securities, recognized in equity (Note 4 and 22.3)
(2) Weighted average number of shares outstanding (millions of euros), excluded weighted average of treasury shares during the period.
(3) Corrective factor, due to the capital increase with pre-emptive subscription right, applied for the previous years.
(*) Data recalculated due to the mentioned corrective factor.
As of June 30, 2016 and 2015, there were no other financial instruments or share options awarded to employees that could potentially affect the calculation of the diluted earnings per share for the years presented. For this reason, basic and diluted earnings per share are the same for both dates.
6. Operating segment reporting
The information about operating segments is provided in accordance with IFRS 8. Operating segment reporting represents a basic tool in the oversight and management of the BBVA Group’s various activities. The BBVA Group compiles reporting information on disaggregated business activities. These business activities are then aggregated in accordance with the organizational structure determined by the BBVA Group management into operating segments and, ultimately, the reportable segments themselves.
During 2016, there have not been significant changes in the reporting structure of the operating segments of the BBVA Group compared to the structure existing at the end of 2015. The structure of the operating segment is as follows:
• Banking activity in Spain
Includes, as in previous years, the Retail Network in Spain, Corporate and Business Banking (CBB), Corporate & Investment Banking (CIB), BBVA Seguros and Asset Management units in Spain. It also includes the portfolios, finance and structural interest-rate positions of the euro balance sheet. Since April 2015 it also includes the activity, balance sheet and earnings of Catalunya Banc.
F-47
• Real estate activity in Spain
Covers specialist management of real-estate assets in the country (excluding buildings for own use), including: foreclosed real-estate assets from residential mortgages and developers; as well as lending to developers. Since April 24, 2015 it also includes these same assets and loans from Catalunya Banc.
• The United States
Includes the Group´s business activity in the country through the BBVA Compass group and the BBVA New York branch.
• Turkey
Includes the activity of the Garanti Group.
• Mexico
Includes all the banking, real-estate and insurance businesses in the country.
• South America
Basically includes BBVA´s banking and insurance businesses in the region.
• Rest of Eurasia
Includes business activity in the rest of Europe and Asia, i.e. the Group´s retail and wholesale businesses in the area.
Lastly, the Corporate Center comprised of the rest of the items that have not been allocated to the operating segments. It includes: the costs of the head offices that have a corporate function; management of structural exchange-rate positions; specific issues of capital instruments to ensure adequate management of the Group’s global solvency; portfolios and their corresponding results, whose management is not linked to customer relations, such as industrial holdings; certain tax assets and liabilities; funds due to commitments with employees; goodwill and other intangibles. It also comprises the result from certain corporate operations carried out by the Group in 2015. In the second semester of 2015, some operating results, related with technology, from the Corporate Center to the business area to the Banking activity in Spain were reclassified. This reclassification occurred as a result of the transfer, during 2015, of management skills, resources and responsibilities, in terms of technology, the Corporate Center to the business area Banking Activity in Spain The balance for June 2015 has been restated to facilitate comparison with June 2016.
The breakdown of the BBVA Group’s total assets by operating segments as of June 30, 2016 and December 31, 2015 is as follows:
Millions of Euros
Total Assets by Operating SegmentsJune
2016
December
2015
Banking Activity in Spain 345,640 339,775
Real Estate Activity in Spain 14,988 17,122
United States 86,614 86,454
Turkey 90,520 89,003
Mexico 93,097 99,594
South America 71,224 70,661
Rest of Eurasia 19,495 23,469
Subtotal Assets by Operating Segments 721,579 726,079
Corporate Center and other adjustments 24,461 23,999Total Assets BBVA Group 746,040 750,078
F-48
The attributable profit and main earning figures in the consolidated income statements for the six months period ended June 30, 2016 by operating segments are as follows:
Millions of Euros
Operating Segments
Main Margins and Profits by
Operating Segments
BBVA
Group
Banking
Activity in
Spain
Real Estate
Activity in
Spain
United
StatesTurkey Mexico
South
America
Rest
of
Eurasia
Corporate
Center
Adjustments
(*)
June 2016
Net interest income 8,365 1,943 42 938 1,606 2,556 1,441 86 (247) -
(1) Gross Income less Administrative Cost and Amortization
(*) From the third quarter of 2015, BBVA consolidated Garanti (39.9% owned). In prior periods, Garanti's revenues and costs are reflected in our segment information only in the proportion of BBVA´s ownership (25.01%). This column includes adjustments resulting from the accounting of the investment in Garanti group using the equity method (versus reflecting the revenues and costs of Garanti only in proportion of BBVA´s ownership Garanti as stated in the management information). This column also includes inter-segment adjustments (see Note 2).
F-49
7. Risk management
7.1 General risk management and control model ............................................................................... 49
7.1.1 Governance and organization .................................................................................................... 50
The BBVA Group has an overall control and risk management model (hereinafter 'the model') tailored to their individual business, their organization and the geographies in which they operate, allowing them to develop their activity in accordance with their strategy and policy control and risk management defined by the governing bodies of the Bank and adapt to a changing economic and regulatory environment, tackling risk management globally and adapted to the circumstances of each instance. The model establishes a system of appropriate risk management regarding risk profile and strategy of the Group.
This model is applied comprehensively in the Group and consists of the basic elements listed below:
• Governance and organization.
• Risk appetite.
• Decisions and processes.
F-50
• Assessment, monitoring and reporting.
• Infrastructure.
The Group encourages the development of a risk culture to ensure consistent application of the control and risk management Model in the Group, and to ensure that the risk function is understood and assimilated at all levels of the organization.
7.1.1 Governance and organization
The governance model for risk management at BBVA is characterized by a special involvement of its corporate bodies, both in setting the risk strategy and in the ongoing monitoring and supervision of its implementation.
Thus, as developed below, the corporate bodies are the ones that approve this risk strategy and corporate policies for the different types of risk, being the risk function responsible for the management, its implementation and development, reporting to the governing bodies.
The responsibility for the daily management of the risks lies on the businesses which abide in the development of their activity to the policies, standards, procedures, infrastructure and controls, based on the framework set by the governing bodies, which are defined by the function risk.
To perform this task properly, the risk function in the BBVA Group is configured as a single, comprehensive and independent role of commercial areas.
Corporate governance system
BBVA Group has developed a corporate governance system that is in line with the best international practices and adapted to the requirements of the regulators in the countries in which its various business units operate.
The Board of Directors (hereinafter also referred to as "the Board") approves the risk strategy and supervises the internal control and management systems. Specifically, the risk strategy approved by the Board includes, at least, the Group's risk appetite statement, the fundamental metrics and the basic structure of limits by geographies, types of risk and asset classes, as well as the bases of the control and risk management model. The Board ensures that the budget is in line with the approved risk appetite statement.
On the basis established by the Board, the Executive Committee approves specific corporate policies for each type of risk. Furthermore, the Executive Committee approves the Group's risk limits and monitors them, being informed of both limits excess occurrences and, where applicable, the appropriate corrective measures taken.
Lastly, the Board has set up a Board committee focus in risks, the Risk Committee. This Risk Committee is responsible for analyzing and regularly monitoring risks within the remit of the corporate bodies and assists the Board and the SC in determining and monitoring the risk strategy and the corporate policies, respectively. Another task of special relevance it carries out is detailed control and monitoring of the risks that affect the Group as a whole, which enables it to supervise the effective integration of the risk strategy management and the application of corporate policies approved by the corporate bodies.
The head of the risk function in the executive hierarchy is the Group’s Chief Risk Officer (“CRO”), who carries out its functions with independence, authority, capacity and resources to do so. He is appointed by the Board of the Bank as a member of its Senior Management, and has direct access to its corporate bodies (Board, Executive Committee and Risk Committee), who reports regularly on the status of risks to the Group.
The CRO, for the utmost performance of its functions, is supported by a cross composed set of units in corporate risk and the specific risk units in the geographical and / or business areas of the Group structure. Each of these units is headed by a Risk Officer for the geographical and/or business area who, within his/her field of competence, carries out risk management and control functions and is responsible for applying the corporate policies and rules approved at Group level in a consistent manner, adapting them if necessary to local requirements and reporting to the local corporate bodies.
F-51
The Risk Officers of the geographical and/or business areas report both to the Group's CRO and to the head of their geographical and/or business area. This dual reporting system aims to ensure that the local risk management function is independent from the operating functions and that it is aligned with the Group's corporate risk policies and goals.
Organizational structure and committees
The risk management function, as defined above, consists of risk units from the corporate area, which carry out cross-cutting functions, and risk units from the geographical and/or business areas.
• The corporate area's risk units develop and present the Group's risk appetite proposal, corporate policies, rules and global procedures and infrastructures to the CRO, within the action framework approved by the corporate bodies, ensure their application, and report either directly or through the CRO to the Bank's corporate bodies. Their functions include
– Management of the different types of risks at Group level in accordance with the strategy defined by the corporate bodies.
– Risk planning aligned with the risk appetite principles defined by the Group.
– Monitoring and control of the Group's risk profile in relation to the risk appetite approved by the Bank's corporate bodies, providing accurate and reliable information with the required frequency and in the necessary format.
– Prospective analyses to enable an evaluation of compliance with the risk appetite in stress scenarios and the analysis of risk mitigation mechanisms.
– Management of the technological and methodological developments required for implementing the Model in the Group.
– Design of the Group's Internal Risk Control model and definition of the methodology, corporate criteria and procedures for identifying and prioritizing the risk inherent in each unit's activities and processes.
– Validation of the models used and the results obtained by them in order to verify their adaptation to the different uses to which they are applied.
• The risk units in the business units develop and present to the Risk Officer of the geographical and/or business area the risk appetite proposal applicable in each geographical and/or business area, independently and always within the Group's risk appetite. They also ensure that the corporate policies and rules approved consistently at a Group level are applied, adapting them if necessary to local requirements; they are provided with appropriate infrastructures for managing and controlling their risks; and they report to their corporate bodies and/or to senior management, as appropriate.
The local risk units thus work with the corporate area risk units in order to adapt to the risk strategy at Group level and share all the information necessary for monitoring the development of their risks.
The risk function has a decision-making process to perform its functions, underpinned by a structure of committees, where the Global Risk Management Committee (GRMC) acts as the highest committee within Risk. It proposes, examines and, where applicable, approves, among others, the internal risk regulatory framework and the procedures and infrastructures needed to identify, assess, measure and manage the material risks faced by the Group in its businesses. The members of this Committee are the Group's CRO and the heads of the risk units of the corporate area and of the most representative geographical and/or business areas.
The GRMC carries out its functions assisted by various support committees which include:
• Global Technical Operations Committee: It is responsible for decision-making related to wholesale credit risk admission in certain customer segments.
• Monitoring, Assessment & Reporting Committee: It guarantees and ensures the appropriate development of aspects related to risk identification, assessment, monitoring and reporting, with an integrated and cross-cutting vision.
• Asset Allocation Committee: The executive body responsible for analysis and decision-making on all credit risk matters related to the processes intended for obtaining a balance between risk and return in accordance with the Group's risk appetite.
• Technology & Analytics Committee: It ensures an appropriate decision-making process regarding the development, implementation and use of the tools and models required to achieve an appropriate management of those risks to which the BBVA Group is exposed.
F-52
• Corporate Technological Risks and Operational Control Committee: It approves the Technological Risks and Operational Control Management Frameworks in accordance with the General Risk Management Model's architecture and monitors metrics, risk profiles and operational loss events.
• Global Markets Risk Unit Global Committee: It is responsible for formalizing, supervising and communicating the monitoring of trading desk risk in all the Global Markets business units.
• Corporate Operational and Outsourcing Risk Admission Committee: It identifies and assesses the operational risks of new businesses, new products and services, and outsourcing initiatives.
• Retail Risk Committee: It ensures the alignment of the practices and processes of the retail credit risk cycle with the approved risk tolerance and with the business growth and development objectives established in the corporate strategy of the Group
Each geographical and/or business area has its own risk management committee (or committees), with objectives and contents similar to those of the corporate area, which perform their duties consistently and in line with corporate risk policies and rules.
Under this organizational scheme, the risk management function ensures the risk strategy, the regulatory framework, and standardized risk infrastructures and controls are integrated and applied across the entire Group. It also benefits from the knowledge and proximity to customers in each geographical and/or business area, and transmits the corporate risk culture to the Group's different levels.
Internal Risk Control and Internal Validation
The Group has a specific Internal Risk Control unit whose main function is to ensure there is an adequate internal regulatory framework in place, together with a process and measures defined for each type of risk identified in the Group, (and for other types of risk that could potentially affect the Group, to oversee their application and operation, and to ensure that the risk strategy is integrated into the Group's management. The Internal Risk Control unit is independent from the units that develop risk models, manage running processes and controls. Its scope is global both geographically and in terms of type of risk.
The Director of Group Internal Control Risk is responsible for the function, and reports its activities and work plans to the CRO and the Risk Committee of the Board, besides attending to it on issues deemed necessary.
For this purpose, the Risk area also has a Technical area independent from the units that develop risk models, manage running processes and controls, which gives the Risk Committee of the Board the necessary technical support to better perform their functions.
The unit has a structure of teams at both corporate level and in the most relevant geographical areas in which the Group operates. As in the case of the corporate area, local units are independent of the business areas that execute the processes, and of the units that execute the controls. They report functionally to the Internal Risk Control unit. This unit's lines of action are established at Group level, and it is responsible for adapting and executing them locally, as well as for reporting the most relevant aspects.
Additionally, the Group has an Internal Validation unit, also independent rom the units that develop risk models and of those who use them to manage. Its functions include, among others, review and independent validation, internally, of the models used for the control and management of the Group's risks.
7.1.2 Risk appetite
The Group's risk appetite, approved by the Board, determines the risks (and their level) that the Group is willing to assume to achieve its business targets. These are expressed in terms of capital, financial structure, profitability, recurrent earnings, cost of risk or other metrics. The definition of the risk appetite has the following goals:
• To express the Group's strategy and the maximum levels of risk it is willing to assume, at both Group and geographical and/or business area level.
• To establish a set of guidelines for action and a management framework for the medium and long term that prevent actions from being taken (at both Group and geographical and/or business area level) which could compromise the future viability of the Group.
• To establish a framework for relations with the geographical and/or business areas that, while preserving their decision-making autonomy, ensures they act consistently, avoiding uneven behavior.
• To establish a common language throughout the organization and develop a compliance-oriented risk culture.
F-53
• Alignment with the new regulatory requirements, facilitating communication with regulators, investors and other stakeholders, thanks to an integrated and stable risk management framework.
Risk appetite is expressed through the following elements:
• Risk appetite statement: sets out the general principles of the Group's risk strategy and the target risk profile.
BBVA's risk policy aims to maintain the risk profile set out in the Group's risk appetite statement, which is reflected in a series of metrics (fundamental metrics and limits).
• Fundamental metrics: they reflect, in quantitative terms, the principles and the target risk profile set out in the risk appetite statement.
• Limits: they establish the risk appetite at geographical and/or business area, legal entity and risk type level, or any other level deemed appropriate, enabling its integration into management.
The corporate risk area works with the various geographical and/or business areas to define their risk appetite, which will be coordinated with and integrated into the Group's risk appetite to ensure that its profile fits as defined.
The BBVA Group assumes a certain degree of risk to be able to provide financial services and products to its customers and obtain attractive returns for its shareholders. The organization must understand, manage and control the risks it assumes.
The aim of the organization is not to eliminate all risks faced, but to assume a prudent level of risks that allows it to generate returns while maintaining acceptable capital and fund levels and generating recurrent earnings.
The risk appetite defined by the Group expresses the levels and types of risk that the Bank is willing to assume to be able to implement its strategic plan with no relevant deviations, even in situations of stress. The risk appetite is integrated in the management and determines the basic lines of activity of the Group, because it sets the framework within the budget is developed.
Fundamental metrics
Those metrics that characterize the Group's objective behavior (as defined in the statement), enabling the expression of the risk culture at all levels in a structured and understandable manner. They summarize the Group's goals, and are therefore useful for communication to the stakeholders.
The fundamental metrics are strategic in nature. They are disseminated throughout the Group, understandable and easy to calculate, and objectifiable at business and/or geographical area level, so they can be subject to future projections.
F-54
Limits
Limits are metrics that determine the Group’s strategic positioning for the different types of risk: credit, ALM (Asset Liability Management), liquidity, markets, operational. They differ from the fundamental metrics in the following respects:
• They are levers, not the result. They are a management tool related to a strategic positioning that must be geared toward ensuring compliance with the fundamental metrics, even in an adverse scenario.
• Risk metrics: a higher level of specialization, they do not necessarily have to be disseminated across the Group.
• Independent of the cycle: they can include metrics with little correlation with the economic cycle, thus allowing comparability that is isolated from the specific macroeconomic situation.
Thus, they are levers for remaining within the thresholds defined in the fundamental metrics and are used for day-to-day risk management. They include tolerance limits, sub-limits and alerts established at the level of business and/or geographical areas, portfolios and products. During 2016, the Risk Appetite metrics evolved in line with the set profile.
7.1.3 Decisions and processes
The transfer of risk appetite to ordinary management is supported by three basic aspects:
• A standardized set of regulations
• Risk planning
• Integrated management of risks over their life cycle
Standardized regulatory framework
The corporate GRM area is responsible for proposing the definition and development of the corporate policies, specific rules, procedures and schemes of delegation based on which risk decisions should be taken within the Group.
This process aims for the following objectives:
• Hierarchy and structure: well-structured information through a clear and simple hierarchy creating relations between documents that depend on each other.
• Simplicity: an appropriate and sufficient number of documents.
• Standardization: a standardized name and content of document.
• Accessibility: ability to search for, and easy access to, documentation through the corporate risk management library.
The approval of corporate policies for all types of risks corresponds to the corporate bodies of the Bank, while the corporate risk area endorses the remaining regulations.
Risk units of geographical and / or business areas continue to adapt to local requirements the regulatory framework for the purpose of having a decision process that is appropriate at local level and aligned with the Group policies. If such adaptation is necessary, the local risk area must inform the corporate GRM area, which must ensure the consistency of the set of regulations at the level of the entire Group, and thus must give its approval prior to any modifications proposed by the local risk areas.
Risk planning
Risk planning ensures that the risk appetite is integrated into management, through a cascade process for establishing limits, in which the function of the corporate area risk units and the geographical and/or business areas is to guarantee the alignment of this process against the Group's risk appetite.
It has tools in place that allow the risk appetite defined at aggregate level to be assigned and monitored by business areas, legal entities, types of risk, concentrations and any other level considered necessary.
F-55
The risk planning process is present within the rest of the Group's planning framework so as to ensure consistency among all of them.
Daily risk management
All risks must be managed integrally during their life cycle, and be treated differently depending on the type.
The risk management cycle is composed of 5 elements:
• Planning: with the aim of ensuring that the Group's activities are consistent with the target risk profile and guaranteeing solvency in the development of the strategy.
• Assessment: a process focused on identifying all the risks inherent to the activities carried out by the Group.
• Formalization: includes the risk origination, approval and formalization stages.
• Monitoring and reporting: continuous and structured monitoring of risks and preparation of reports for internal and/or external (market, investors, etc.) consumption.
• Active portfolio management: focused on identifying business opportunities in existing portfolios and new markets, businesses and products.
7.1.4 Assessment, monitoring and reporting
Assessment, monitoring and reporting is a cross-cutting element that should ensure that the Model has a dynamic and proactive vision to enable compliance with the risk appetite approved by the corporate bodies, even in adverse scenarios. The materialization of this process covers all the categories of material risks and has the following objectives:
• Assess compliance with the risk appetite at the present time, through monitoring of the fundamental management metrics and limits.
• Assess compliance with the risk appetite in the future, through the projection of the risk appetite variables, in both a baseline scenario determined by the budget and a risk scenario determined by the stress tests.
• Identify and assess the risk factors and scenarios that could compromise compliance with the risk appetite, through the development of a risk repository and an analysis of the impact of those risks.
• Act to mitigate the impact in the Group of the identified risk factors and scenarios, ensuring this impact remains within the target risk profile.
• Supervise the key variables that are not a direct part of the risk appetite, but that condition its compliance. These can be either external or internal.
The following phases need to be developed for undertaking this process:
• Identification of risk factors, aimed at generating a map with the most relevant risk factors that can compromise the Group's performance in relation to the thresholds defined in the risk appetite.
• Impact evaluation. This involves evaluating the impact that the materialization of one (or more) of the risk factors identified in the previous phase could have on the risk appetite metrics, through the occurrence of a given scenario.
• Response to undesired situations and realignment measures. Exceeding the parameters will trigger an analysis of the realignment measures to enable dynamic management of the situation, even before it occurs.
• Monitoring. The aim is to avoid losses before they occur by monitoring the Group's current risk profile and the identified risk factors.
• Reporting. This aims to provide information on the assumed risk profile by offering accurate, complete and reliable data to the corporate bodies and to senior management, with the frequency and completeness appropriate to the nature, significance and complexity of the risks.
7.1.5 Infrastructure
The infrastructure is an element that must ensure that the Group has the human and technological resources needed for effective management and supervision of risks in order to carry out the functions set out in the Group's risk Model and the achievement of their objectives.
F-56
With respect to human resources, the Group's risk function will have an adequate workforce, in terms of number, skills and experience.
With regards to technology, the Group ensures the integrity of management information systems and the provision of the infrastructure needed for supporting risk management, including tools appropriate to the needs arising from the different types of risks for their admission, management, assessment and monitoring.
The principles that govern the Group risk technology are:
• Standardization: the criteria are consistent across the Group, thus ensuring that risk handling is standardized at geographical and/or business area level.
• Integration in management: the tools incorporate the corporate risk policies and are applied in the Group's day-to-day management.
• Automation of the main processes making up the risk management cycle.
• Appropriateness: provision of adequate information at the right time.
Through the “Risk Analytics” function, the Group has a corporate framework in place for developing the measurement techniques and models. It covers all the types of risks and the different purposes and uses a standard language for all the activities and geographical/business areas and decentralized execution to make the most of the Group's global reach. The aim is to continually evolve the existing risk models and generate others that cover the new areas of the businesses that develop them, so as to reinforce the anticipation and proactiveness that characterize the Group's risk function.
Also the risk units of geographical and / or business areas shall ensure that they have sufficient means from the point of view of resources, structures and tools to develop a risk management in line with the corporate model.
7.1.6 Risk culture
BBVA considers risk culture to be an essential element for consolidating and integrating the other components of the Model. The culture transfers the implications that are involved in the Group's activities and businesses to all the levels of the organization. The risk culture is organized through a number of levers, including the following:
• Communication: promotes the dissemination of the Model, and in particular the principles that must govern risk management in the Group, in a consistent and integrated manner across the organization, through the most appropriate channels. GRM has a number of communication channels to facilitate the transmission of information and knowledge among the various teams in the function and the Group, adapting the frequency, formats and recipients based on the proposed goal, in order to strengthen the basic principles of the risk function. The risk culture and the management model thus emanate from the Group's corporate bodies and senior management and are transmitted throughout the organization.
• Training: its main aim is to disseminate and establish the model of risk management across the organization, ensuring standards in the skills and knowledge of the different persons involved in the risk management processes.
Well defined and implemented training ensures continuous improvement of the skills and knowledge of the Group's professionals, and in particular of the GRM area, and is based on four aspects that aim to develop each of the needs of the GRM group by increasing its knowledge and skills in different fields such as: finance and risks, tools and technology, management and skills, and languages.
• Motivation: the aim in this area is for the incentives of the risk function teams to support the strategy for managing those teams and the function's values and culture at all levels. Includes compensation and all those elements related to motivation – working environment, etc. which contribute to the achievement Model objectives.
7.2 Risk factors
As mentioned earlier, BBVA has processes in place for identifying risks and analyzing scenarios that enable the Group to manage risks in a dynamic and proactive way.
The risk identification processes are forward looking to ensure the identification of emerging risks and take into account the concerns of both the business areas, which are close to the reality of the different geographical areas, and the corporate areas and senior management.
F-57
Risks are captured and measured consistently using the methodologies deemed appropriate in each case. Their measurement includes the design and application of scenario analyses and stress testing and considers the controls to which the risks are subjected.
As part of this process, a forward projection of the risk appetite variables in stress scenarios is conducted in order to identify possible deviations from the established thresholds. If any such deviations are detected, appropriate measures are taken to keep the variables within the target risk profile.
To this extent, there are a number of emerging risks that could affect the Group’s business trends. These risks are described in the following main blocks:
• Macroeconomic and geopolitical risks
According to the latest information available, global growth remains stable at slightly above 3% year-on- year.
The uncertainty of the global economic outlook has increased recently with the victory of the yes vote in the referendum for the United Kingdom to leave the European Union. In the most likely scenario, the impact of Brexit on the global economy would be temporary and of uncertain but limited strength: greatest in the United Kingdom, somewhat less so in the Eurozone and more limited in the rest of the world.
In general, the growth of the developing economies has not been sufficient to offset the slowdown in emerging markets. The performance of the Chinese economy, with vulnerabilities derived from the high level of debt, will continue to determine global growth prospects, in particular for emerging economies.
The remaining events that make up the uncertainties for 2016 and 2017, which could affect the valuation of the Group's holdings in certain countries:
– Geopolitical tensions in some geographies. In particular, the political and economic situation created following recent developments in Turkey since last July 15.
– The risk of a US adjustment scenario. Said adjustment could occur resulting from the decision of the Federal Reserve to postpone interest rate rise again and a forecast of lower growth than previously expected.
These uncertainties have led to a significant increase in the volatility of the financial markets, asset price falls and major currency depreciation in emerging countries.
• Regulatory, legal, tax and reputational risks
– Financial institutions are exposed to a complex and ever-changing regulatory and legal environment defined by governments and regulators. This can affect their ability to grow and the capacity of certain businesses to develop, and result in stricter liquidity and capital requirements with lower profitability ratios. The Group constantly monitors changes in the regulatory framework that allow for anticipation and adaptation to them in a timely manner, adopt best practices and more efficient and rigorous criteria in its implementation.
– The financial sector is under ever closer scrutiny by regulators, governments and society itself. Negative news or inappropriate behavior can significantly damage the Group's reputation and affect its ability to develop a sustainable business. The attitudes and behaviors of the group and its members are governed by the principles of integrity, honesty, long-term vision and best practices through, inter alia, internal control Model, the Code of Conduct, tax strategy and Responsible Business Strategy of the Group.
– The financial sector is exposed to increasing litigation, so the financial institutions face a large number of proceedings which economic consequences are difficult to determine. The Group manages and monitors these proceedings to defend its interests, where necessary allocating the corresponding provisions to cover them, following the expert criteria of internal lawyers and external attorneys responsible for the legal handling of the procedures, in accordance with applicable legislation.
Regarding the consequences of the invalidity of the clauses of limitation of interest rates in mortgage loans with consumers (the so-called “cláusulas suelo”) the legal situation is as follows:
– The Spanish Supreme Court, in a judgment dated 9 May 2013, rendered on a collective claim against BBVA among others, and that is definitive, resolved unanimously that those clauses should be deemed as invalid if they did not comply with certain requirements of material transparency set forth in the referred judgment. In addition, that judgment determined that there were no grounds for the refund of the amounts collected pursuant to those clauses before 9 May 2013.
F-58
– The Supreme Court has also confirmed its criteria in judgments rendered on individual claims of consumers, in which it has reiterated that there are no grounds to refund the amounts collected pursuant to those clauses before 9 May 2013.
In an individual claim, the Provincial Court of Alicante has raised a preliminary ruling to the Court of Justice of the European Union (“CJEU”), for the CJEU to determine if the time limitation for the refund of the amounts set forth by the Supreme Court complies with Directive 93/13/EEC. On 13 July 2016, the opinion of the Advocate-General of the CJEU has been published and in its conclusions it states that the European directive does not oppose to a Member State’s Supreme Court limiting, due to exceptional circumstances, the restorative effects of the invalidity to the date on which its first judgment in this regard is issued.
At this moment, BBVA is not sued in any collective claim in which the refund of the amounts collected before 9 May 2013 is requested. The number of individual claims of consumers in which this refund is requested is quite insignificant.
This notwithstanding, in order to increase transparency and considering the interest that this issue has raised among analysts and investors, it is communicated that the best estimate of the maximum amount subject to potential claim, in case of an adverse judgment of the CJEU, would be approximately 1,200 million euro, although past experience in similar events shows that the impact would probably be lower.
• Business and operational risks
– New technologies and forms of customer relationships: Developments in the digital world and in information technologies pose significant challenges for financial institutions, entailing threats (new competitors, disintermediation…) but also opportunities (new framework of relations with customers, greater ability to adapt to their needs, new products and distribution channels...). Digital transformation is a priority for the Group as it aims to lead digital banking of the future as one of its objectives.
– Technological risks and security breaches: The Group is exposed to new threats such as cyber-attacks, theft of internal and customer databases, fraud in payment systems, etc. that require major investments in security from both the technological and human point of view. The Group gives great importance to the active operational and technological risk management and control. One example was the early adoption of advanced models for management of these risks (AMA - Advanced Measurement Approach).
7.3 Credit risk
Credit risk arises from the probability that one party to a financial instrument will fail to meet its contractual obligations for reasons of insolvency or inability to pay and cause a financial loss for the other party.
It is the most important risk for the Group and includes counterparty risk, issuer risk, settlement risk and country risk management.
The principles underpinning credit risk management in BBVA are as follows:
• Availability of basic information for the study and proposal of risk, and supporting documentation for approval, which sets out the conditions required by the internal relevant body.
• Sufficient generation of funds and asset solvency of the customer to assume principal and interest repayments of loans owed.
• Establishment of adequate and sufficient guarantees that allow effective recovery of the operation, this being considered a secondary and exceptional method of recovery when the first has failed.
Credit risk management in the Group has an integrated structure for all its functions, allowing decisions to be taken objectively and independently throughout the life cycle of the risk.
• At Group level: frameworks for action and standard rules of conduct are defined for handling risk, specifically, the circuits, procedures, structure and supervision.
• At the business area level: they are responsible for adapting the Group's criteria to the local realities of each geographical area and for direct management of risk according to the decision-making circuit:
– Retail risks: in general, the decisions are formalized according to the scoring tools, within the general framework for action of each business area with regard to risks. The changes in weighting and variables of these tools must be validated by the corporate GRM area.
F-59
– Wholesale risks: in general, the decisions are formalized by each business area within its general framework for action with regard to risks, which incorporates the delegation rule and the Group's corporate policies.
7.3.1 Credit risk exposure
In accordance with IFRS 7, “Financial Instruments: Disclosures” the BBVA Group’s maximum credit risk exposure (see definition below) by headings in the balance sheets as of June 30, 2016 and December 31, 2015 is provided below. It does not consider the availability of collateral or other credit enhancements to guarantee compliance with payment obligations. The details are broken down by financial instruments and counterparties.
Millions of Euros
Maximum Credit Risk Exposure NotesJune
2016
December
2015
Financial assets held for trading 10 37,953 37,424
Financial guarantees given 50,127 49,876Loan commitments given, drawable by third parties 108,759 123,620 Government 2,400 2,570
Credit institutions 852 921
Other sectors 105,507 120,129
Other Commitments given 16,685 12,113Total Loan commitments and financial guarantees 33 175,571 185,609
Total Maximum Credit Exposure 873,267 878,984
F-60
The maximum credit exposure presented in the table above is determined by type of financial asset as explained below:
• In the case of financial assets recognized in the consolidated balance sheets, exposure to credit risk is considered equal to its carrying amount (not including impairment losses), with the sole exception of trading and hedging derivatives.
• The maximum credit risk exposure on financial guarantees granted is the maximum that the Group would be liable for if these guarantees were called in, and that is their carrying amount.
• Our calculation of risk exposure for derivatives is based on the sum of two factors: the derivatives fair value and their potential risk (or "add-on").
– The first factor, fair value, reflects the difference between original commitments and fair values on the reporting date (mark-to-market). As indicated in Note 2.2.1, derivatives are accounted for as of each reporting date at fair value in accordance with IAS 39.
– The second factor, potential risk (‘add-on’), is an estimate of the maximum increase to be expected on risk exposure over a derivative fair value (at a given statistical confidence level) as a result of future changes in the fair value over the remaining term of the derivatives.
The consideration of the potential risk ("add-on") relates the risk exposure to the exposure level at the time of a customer’s default. The exposure level will depend on the customer’s credit quality and the type of transaction with such customer. Given the fact that default is an uncertain event which might occur any time during the life of a contract, the BBVA Group has to consider not only the credit exposure of the derivatives on the reporting date, but also the potential changes in exposure during the life of the contract. This is especially important for derivatives, whose valuation changes substantially throughout their terms, depending on the fluctuation of market prices.
F-61
The breakdown by counterparty and product of loans and advances, net of impairment losses, classified in the different headings of the assets, as of June 30, 2016 and December 31, 2015 is shown below:
June 2016 Central banksGeneral
governmentsCredit institutions
Other financial
corporations
Non-financial
corporationsHouseholds Total
On demand and sho rt no tice - 908 - 412 9,035 3,148 13,503
C redit card debt - 1 - 1 1,895 14,671 16,569
T rade receivables 2,942 - 850 19,794 1,546 25,132
F inance leases - 278 - 34 7,750 463 8,526
R everse repurchase lo ans 956 664 10,262 4,983 - - 16,864
Other term lo ans 13,153 31,217 10,044 6,536 133,794 168,678 363,422
A dvances that are no t lo ans 205 2,165 8,985 2,394 1,356 453 15,557Loans and advances 14,313 38,176 29,290 15,210 173,624 188,960 459,573
of which: mortgage loans [Loans co llateralized by immovable property] 4,659 253 633 43,456 133,134 182,135
of which: o ther collateralized loans 3,777 11,746 6,476 23,892 6,116 52,007
of which: credit fo r consumption 44,679 44,679
of which: lending for house purchase 126,966 126,966
of which: pro ject finance loans 20,876 20,876
Millions of euros
December 2015 Central banksGeneral
governmentsCredit institutions
Other financial
corporations
Non-financial
corporationsHouseholds Total
On demand and sho rt no tice - 783 - 38 8,356 2,050 11,228
C redit card debt - 1 - 2 1,892 15,057 16,952
T rade receivables 3,055 - 800 19,605 411 23,871
F inance leases - 301 - 420 7,534 1,103 9,357
R everse repurchase lo ans 149 326 11,676 4,717 9 - 16,877
Other term lo ans 10,017 31,971 8,990 5,968 134,952 168,729 360,626
A dvances that are no t lo ans 7,664 2,108 8,713 2,261 919 863 22,528Loans and advances 17,830 38,544 29,379 14,206 173,267 188,213 461,438
of which: mortgage loans [Loans co llateralized by immovable property] 4,483 264 656 43,961 135,102 184,466
of which: o ther collateralized loans 3,868 12,434 6,085 22,928 6,131 51,446
of which: credit fo r consumption 40,906 40,906
of which: lending for house purchase 126,591 126,591
of which: pro ject finance loans 21,141 21,141
Millions of euros
F-62
7.3.2 Mitigation of credit risk, collateralized credit risk and other credit enhancements
In most cases, maximum credit risk exposure is reduced by collateral, credit enhancements and other actions which mitigate the Group’s exposure. The BBVA Group applies a credit risk hedging and mitigation policy deriving from a banking approach focused on relationship banking. The existence of guarantees could be a necessary but not sufficient instrument for accepting risks, as the assumption of risks by the Group requires prior evaluation of the debtor’s capacity for repayment, or that the debtor can generate sufficient resources to allow the amortization of the risk incurred under the agreed terms.
The policy of accepting risks is therefore organized into three different levels in the BBVA Group:
• Analysis of the financial risk of the operation, based on the debtor’s capacity for repayment or generation of funds;
• The constitution of guarantees that are adequate, or at any rate generally accepted, for the risk assumed, in any of the generally accepted forms: monetary, secured, personal or hedge guarantees; and finally,
• Assessment of the repayment risk (asset liquidity) of the guarantees received.
The procedures for the management and valuation of collaterals are set out in the Corporate Policies (retail and wholesale), which establish the basic principles for credit risk management, including the management of collaterals assigned in transactions with customers.
The methods used to value the collateral are in line with the best market practices and imply the use of appraisal of real-estate collateral, the market price in market securities, the trading price of shares in mutual funds, etc. All the collaterals assigned must be properly drawn up and entered in the corresponding register. They must also have the approval of the Group’s legal units.
The following is a description of the main types of collateral for each financial instrument class:
• Financial instruments held for trading: The guarantees or credit enhancements obtained directly from the issuer or counterparty are implicit in the clauses of the instrument.
• Trading and hedging derivatives: In derivatives, credit risk is minimized through contractual netting agreements, where positive- and negative-value derivatives with the same counterparty are offset for their net balance. There may likewise be other kinds of guarantees, depending on counterparty solvency and the nature of the transaction.
• Other financial assets designated at fair value through profit or loss and Available-for-sale financial assets: The guarantees or credit enhancements obtained directly from the issuer or counterparty are inherent to the structure of the instrument.
• Loans and receivables:
– Loans and advances to credit institutions: These usually only have the counterparty’s personal guarantee.
– Loans and advances to customers: Most of these loans and advances are backed by personal guarantees extended by the own customer. There may also be collateral to secure loans and advances to customers (such as mortgages, cash collaterals, pledged securities and other collateral), or to obtain other credit enhancements (bonds, hedging, etc.).
– Debt securities: The guarantees or credit enhancements obtained directly from the issuer or counterparty are inherent to the structure of the instrument.
Collateralized loans granted by the Group as of June 30, 2016 and December 31, 2015 excluding balances deemed impaired, is broken down in Note 13.2.
• Financial guarantees, other contingent risks and drawable by third parties: These have the counterparty’s personal guarantee.
F-63
7.3.3 Credit quality of financial assets that are neither past due nor impaired
The BBVA Group has tools (“scoring” and “rating”) that enable it to rank the credit quality of its operations and customers based on an assessment and its correspondence with the probability of default (“PD”) scales. To analyze the performance of PD, the Group has a series of tracking tools and historical databases that collect the pertinent internally generated information, which can basically be grouped together into scoring and rating models.
Scoring
Scoring is a decision-making model that contributes to both the arrangement and management of retail loans: consumer loans, mortgages, credit cards for individuals, etc. Scoring is the tool used to decide to originate a loan, what amount should be originated and what strategies can help establish the price, because it is an algorithm that sorts transactions by their credit quality. This algorithm enables the BBVA Group to assign a score to each transaction requested by a customer, on the basis of a series of objective characteristics that have statistically been shown to discriminate between the quality and risk of this type of transactions. The advantage of scoring lies in its simplicity and homogeneity: all that is needed is a series of objective data for each customer, and this data is analyzed automatically using an algorithm.
There are three types of scoring, based on the information used and on its purpose:
• Reactive scoring: measures the risk of a transaction requested by an individual using variables relating to the requested transaction and to the customer’s socio-economic data available at the time of the request. The new transaction is approved or rejected depending on the score.
• Behavioral scoring: scores transactions for a given product in an outstanding risk portfolio of the entity, enabling the credit rating to be tracked and the customer’s needs to be anticipated. It uses transaction and customer variables available internally. Specifically, variables that refer to the behavior of both the product and the customer.
• Proactive scoring: gives a score at customer level using variables related to the individual’s general behavior with the entity, and to his/her payment behavior in all the contracted products. The purpose is to track the customer’s credit quality and it is used to pre-grant new transactions.
Rating
Rating tools, as opposed to scoring tools, do not assess transactions but focus on the rating of customers instead: companies, corporations, SMEs, public authorities, etc. A rating tool is an instrument that, based on a detailed financial study, helps determine a customer’s ability to meet his/her financial obligations. The final rating is usually a combination of various factors: on one hand, quantitative factors, and on the other hand, qualitative factors. It is a middle road between an individual analysis and a statistical analysis.
The main difference between ratings and scorings is that the latter are used to assess retail products, while ratings use a wholesale banking customer approach. Moreover, scorings only include objective variables, while ratings add qualitative information. And although both are based on statistical studies, adding a business view, rating tools give more weight to the business criterion compared to scoring tools.
For portfolios where the number of defaults is very low (sovereign risk, corporates, financial entities, etc.) the internal information is supplemented by “benchmarking” of the external rating agencies (Moody’s, Standard & Poor’s and Fitch). To this end, each year the PDs compiled by the rating agencies at each level of risk rating are compared, and the measurements compiled by the various agencies are mapped against those of the BBVA master rating scale.
Once the probability of default of a transaction or customer has been calculated, a "business cycle adjustment" is carried out. This is a means of establishing a measure of risk that goes beyond the time of its calculation. The aim is to capture representative information of the behavior of portfolios over a complete economic cycle. This probability is linked to the Master Rating Scale prepared by the BBVA Group to enable uniform classification of the Group’s various asset risk portfolios.
F-64
The table below shows the abridged scale used to classify the BBVA Group’s outstanding risk as of June 30, 2016:
External rating Internal rating
Standard&Poor's List Reduced List (22 groups) AverageMinimum
from >=Maximum
AAA AAA 1 - 2
AA+ AA+ 2 2 3
AA AA 3 3 4
AA- AA- 4 4 5
A+ A+ 5 5 6
A A 8 6 9
A- A- 10 9 11
BBB+ BBB+ 14 11 17
BBB BBB 20 17 24
BBB- BBB- 31 24 39
BB+ BB+ 51 39 67
BB BB 88 67 116
BB- BB- 150 116 194
B+ B+ 255 194 335
B B 441 335 581
B- B- 785 581 1,061
CCC+ CCC+ 1,191 1,061 1,336
CCC CCC 1,500 1,336 1,684
CCC- CCC- 1,890 1,684 2,121
CC+ CC+ 2,381 2,121 2,673
CC CC 3,000 2,673 3,367
CC- CC- 3,780 3,367 4,243
Probability of default
(basic points)
These different levels and their probability of default were calculated by using as a reference the rating scales and default rates provided by the external agencies Standard & Poor’s and Moody’s. These calculations establish the levels of probability of default for the BBVA Group’s Master Rating Scale. Although this scale is common to the entire Group, the calibrations (mapping scores to PD sections/Master Rating Scale levels) are carried out at tool level for each country in which the Group has tools available.
F-65
The table below outlines the distribution of exposure, including derivatives, by internal ratings, to corporates, financial entities and institutions (excluding sovereign risk), of BBVA, S.A., Bancomer, Compass and subsidiaries in Spain as of June 30, 2016 and December 31, 2015:
7.3.4 Past due but not impaired and impaired secured loans risks
The table below provides details by counterpart and by product of past due risks but not considered to be impaired, as of June 30, 2016 and December 31, 2015, listed by their first past-due date; as well as the breakdown of the debt securities and loans and advances individually and collectively estimated, and the specific allowances for individually estimated and for collectively estimated (see Note 2.2.1):
T OT A L 3,445 825 404 25,439 12,573 (3,851) (9 ,015) (6 ,024) (26,143)
Lo ans and advances by pro duct, by co llateral and by subo rdinat io n
On demand (call) and short no tice (current account) 134 13 7 634 204 (106) (324)
Credit card debt 389 74 126 689 161 (24) (503)
Trade receivables 98 26 22 628 179 (119) (330)
Finance leases 136 29 21 529 222 (31) (276)
Reverse repurchase loans 1 - - 1 1 - (1)
Other term loans 2,685 682 227 22,764 11,747 (3,540) (7,477)
Advances that are not loans 2 - - 113 13 (10) (89)
of which: mortgage loans (Loans co llateralized by immovable property) 1,342 266 106 16,526 9,767 (1,705) (5,172)
of which: o ther co llateralized loans 589 102 27 1,129 809 (182) (157)
of which: credit for consumption 957 164 220 1,543 404 (129) (1,010)
of which: lending for house purchase 616 174 110 5,918 4,303 (293) (1,322)
of which: pro ject finance loans 3 - 1 276 66 (32) (178)
Accumulated
write-offsDecember 2015
Impaired assets
(*)
Carrying amount
of the impaired
assets
Specific
allowances for
financial assets,
individually
estimated
Specific
allowances for
financial assets,
collectively
estimated
Collective
allowances for
incurred but not
reported losses
(*) In the appendix XI there is a breakdown of the impaired loans and advances by geographical areas.
F-68
The breakdown of loans and advances of loans and receivables, impaired and accumulated impairment by sectors as of June 30, 2016 and December 31, 2015 is as follows:
Millions of Euros
June 2016 Non-performing
Accumulated impairment
or Accumulated changes in
fair value due to credit
risk
Non-performing
loans and
advances as a %
of the total
General governments 218 (78) 0.6%
Credit institutions 24 (43) 0.1%
Other financial corporations 48 (96) 0.3%
Non-financial corporations 15,069 (10,848) 8.2%
Agriculture, forestry and fishing 204 (164) 4.9%
Mining and quarrying 226 (137) 6.2%
Manufacturing 1,804 (1,537) 5.3%
Electricity, gas, steam and air conditioning supply 789 (333) 4.4%
Water supply 41 (22) 4.8%
Construction 5,598 (3,321) 27.5%
Wholesale and retail trade 1,761 (1,249) 6.0%
Transport and storage 686 (598) 6.9%
Accommodation and food service activities 500 (247) 6.5%
Information and communication 110 (83) 1.9%
Real estate activities 1,550 (1,226) 9.3%
Professional, scientific and technical activities 407 (365) 5.4%
Administrative and support service activities 211 (137) 6.7%
Public administration and defence, compulsory social security 16 (12) 2.5%
Education 25 (19) 2.4%
Human health services and social work activities 82 (80) 1.7%
Arts, entertainment and recreation 87 (46) 5.9%
Other services 972 (1,273) 6.4%
Households 8,877 (6,373) 4.5%
LOANS AND ADVANCES 24,236 (17,439) 5.2%
F-69
Millions of Euros
December 2015 Non-performing
Accumulated impairment
or Accumulated changes in
fair value due to credit
risk
Non-performing
loans and
advances as a %
of the total
General governments 194 (67) 0.5%
Credit institutions 25 (51) 0.1%
Other financial corporations 67 (162) 0.5%
Non-financial corporations 16,254 (12,321) 8.8%
Agriculture, forestry and fishing 231 (180) 5.4%
Mining and quarrying 192 (114) 4.7%
Manufacturing 1,947 (1,729) 5.8%
Electricity, gas, steam and air conditioning supply 250 (395) 1.4%
Water supply 44 (23) 5.2%
Construction 6,585 (4,469) 30.1%
Wholesale and retail trade 1,829 (1,386) 6.3%
Transport and storage 616 (607) 6.4%
Accommodation and food service activities 567 (347) 7.0%
Information and communication 110 (100) 2.3%
Real estate activities 1,547 (1,194) 9.1%
Professional, scientific and technical activities 944 (454) 12.8%
Administrative and support service activities 224 (148) 6.9%
Public administration and defense, compulsory social security 18 (25) 2.8%
Education 26 (19) 2.6%
Human health services and social work activities 82 (91) 1.8%
Arts, entertainment and recreation 100 (63) 6.6%
Other services 942 (977) 6.1%
Households 8,817 (6,140) 4.5%
LOANS AND ADVANCES 25,358 (18,742) 5.5%
The changes in the first semester of 2016 and the first semester of 2015 of impaired financial assets and guarantees are as follow:
F-70
Changes in Impaired Financial Assets and Contingent RisksJune
Amounts written-off (2,966) (2,257)Exchange differences and other 164 (20)
Balance at the end 25,114 26,006
Millions of Euros
(*) Includes the balance amounts attributable to Catalunya Banc upon its consolidation in April 2015 of €3,969 million and Garanti Group in July 2015 of €1,845 million.
(**) Reflects the total amount of impaired loans derecognized from the balance sheet throughout the period as a result of mortgage foreclosures and real estate assets received in lieu of payment as well as monetary recoveries. See Notes 20 and 21 to the consolidated financial statement for additional information
The changes in the semester of 2016 and the first semester of 2015 in financial assets derecognized from the accompanying consolidated balance sheet as their recovery is considered unlikely (hereinafter "write-offs"), is shown below:
Changes in Impaired Financial Assets Written-Off from the Balance SheetJune
2016
June
2015
Balance at the beginning 26,143 23,583
Acquisition of subsidiaries in the year -
Increase: 3,184 2,821
Decrease: (990) (3,370)
Re-financing or restructuring (20) (8)Cash recovery (Note 47) (263) (213)
Foreclosed assets (112) (68)Sales of written-off (7) (40)
Debt forgiveness (433) (2,679)Time-barred debt and other causes (155) (362)Net exchange differences (450) 1,306
Balance at the end 27,889 24,340
Millions of Euros
As indicated in Note 2.2.1, although they have been derecognized from the consolidated balance sheet, the BBVA Group continues to attempt to collect on these written-off financial assets, until the rights to receive them are fully extinguished, either because it is time-barred financial asset, the financial asset is condoned, or other reasons
F-71
7.3.5 Impairment losses
Below are the changes in the six months ended June 30, 2016 and 2015, in the provisions recognized on the accompanying consolidated balance sheets to cover estimated impairment losses in loans and advances and debt securities, according to the different headings under which they are classified in the accompanying consolidated balance sheet:
Millions of Euros
June 2016 Opening balance
Increases due to
amounts set aside for
estimated loan losses
during the period
Decreases due to
amounts reversed for
estimated loan losses
during the period
Decreases due to
amounts taken
against allowances
Transfers between
allowancesOther adjustments Closing balance
Recoveries recorded
directly to the
statement of profit or
loss
Value adjustments
recorded directly to the
statement of profit or
loss
Specific allowances for financial assets, individually
Total (14,348) (3,424) 1,075 2,282 35 (3,435) (17,814) 213 1,157
F-73
7.3.6 Refinancing and restructuring transactions
Group policies and principles with respect to refinancing and restructuring operations
Refinancing and restructuring operations (see definition in the Glossary) are carried out with customers who have requested such an operation in order to meet their current loan payments if they are expected, or may be expected, to experience financial difficulty in making the payments in the future.
The basic aim of a refinancing and restructuring operation is to provide the customer with a situation of financial viability over time by adapting repayment of the loan incurred with the Group to the customer’s new situation of fund generation. The use of refinancing and restructuring for other purposes, such as to delay loss recognition, is contrary to BBVA Group policies.
The BBVA Group’s refinancing and restructuring policies are based on the following general principles:
• Refinancing and restructuring is authorized according to the capacity of customers to pay the new installments. This is done by first identifying the origin of the payment difficulties and then carrying out an analysis of the customers’ viability, including an updated analysis of their economic and financial situation and capacity to pay and generate funds. If the customer is a company, the analysis also covers the situation of the industry in which it operates.
• With the aim of increasing the solvency of the operation, new guarantees and/or guarantors of demonstrable solvency are obtained where possible. An essential part of this process is an analysis of the effectiveness of both the new and original guarantees.
• This analysis is carried out from the overall customer or group perspective.
• Refinancing and restructuring operations do not in general increase the amount of the customer’s loan, except for the expenses inherent to the operation itself.
• The capacity to refinance and restructure loan is not delegated to the branches, but decided on by the risk units.
• The decisions made are reviewed from time to time with the aim of evaluating full compliance with refinancing and restructuring policies.
These general principles are adapted in each case according to the conditions and circumstances of each geographical area in which the Group operates, and to the different types of customers involved.
In the case of retail customers (private individuals), the main aim of the BBVA Group’s policy on refinancing and restructuring loan is to avoid default arising from a customer’s temporary liquidity problems by implementing structural solutions that do not increase the balance of customer’s loan. The solution required is adapted to each case and the loan repayment is made easier, in accordance with the following principles:
• Analysis of the viability of operations based on the customer’s willingness and ability to pay, which may be reduced, but should nevertheless be present. The customer must therefore repay at least the interest on the operation in all cases. No arrangements may be concluded that involve a grace period for both principal and interest.
• Refinancing and restructuring of operations is only allowed on those loans in which the BBVA Group originally entered into.
• Customers subject to refinancing and restructuring operations are excluded from marketing campaigns of any kind.
In the case of non-retail customers (mainly companies, enterprises and corporates), refinancing/restructuring is authorized according to an economic and financial viability plan based on:
• Forecasted future income, margins and cash flows over a sufficiently long period (around five years) to allow entities to implement cost adjustment measures (industrial restructuring) and a business development plan that can help reduce the level of leverage to sustainable levels (capacity to access the financial markets).
• Where appropriate, the existence of a divestment plan for assets and/or operating segments that can generate cash to assist the deleveraging process.
• The capacity of shareholders to contribute capital and/or guarantees that can support the viability of the plan.
F-74
In accordance with the Group’s policy, the conclusion of a loan refinancing and restructuring operation does not imply the loan is reclassified from "impaired" or "potential problem" to outstanding risk; such a reclassification must be based on the analysis mentioned earlier of the viability and sufficiency of the new guarantees provided.
The Group maintains the policy of including risks related to refinanced and restructured loans as either:
• "Impaired assets", as although the customer is up to date with payments, they are classified as impaired for reasons other than their default when there are significant doubts that the terms of their refinancing may not be met;
• "Potential problem assets", because there is some material doubt as to possible non-compliance with the refinanced loan; or.
• "Normal-risk assets" (although as mentioned in the table in the following section, they continue to be classified as "normal-risk assets with special monitoring" until the conditions established for their consideration as outstanding risk are met).
The conditions established for “normal-risk assets with special monitoring” to be reclassified out of this special monitoring category are as follows:
• The customer must have paid past-due amounts (principal and interest) since the date of the renegotiation or restructuring of the loan;
• At least two years must have elapsed since completion of the renegotiation or restructuring of the loan;
• The customer must have paid at least 20% of the outstanding principal amount of the loan as well as all the past-due amounts (principal and interest) that were outstanding as of the date of the renegotiation or restructuring of the loan; and
• It is unlikely that the customer will have financial difficulties and, therefore, it is expected that the customer will be able to meet its loan payment obligations (principal and interest) in a timely manner.
The BBVA Group’s refinancing and restructuring policy provides for the possibility of two modifications in a 24 month period for loans that are not in compliance with the payment schedule.
The internal models used to determine allowances for loan losses consider the restructuring and renegotiation of a loan, as well as re-defaults on such a loan, by assigning a lower internal rating to restructured and renegotiated loans than the average internal rating assigned to non-restructured/renegotiated loans. This downgrade results in an increase in the probability of default (PD) assigned to restructured/renegotiated loans (with the resulting PD being higher than the average PD of the non- renegotiated loans in the same portfolios).”
For quantitative information on refinancing and restructuring operations see Appendix IX.
7.4 Market risk
7.4.1 Market risk portfolios
Market risk originates as a result of movements in the market variables that impact the valuation of traded financial products and assets. The main risks generated can be classified as follows:
• Interest-rate risk: This arises as a result of exposure to movements in the different interest-rate curves involved in trading. Although the typical products that generate sensitivity to the movements in interest rates are money-market products (deposits, interest-rate futures, call money swaps, etc.) and traditional interest-rate derivatives (swaps and interest-rate options such as caps, floors, swaptions, etc.), practically all the financial products are exposed to interest-rate movements due to the effect that such movements have on the valuation of the financial discount.
• Equity risk: This arises as a result of movements in share prices. This risk is generated in spot positions in shares or any derivative products whose underlying asset is a share or an equity index. Dividend risk is a sub-risk of equity risk, arising as an input for any equity option. Its variation may affect the valuation of positions and it is therefore a factor that generates risk on the books.
F-75
• Exchange-rate risk: This is caused by movements in the exchange rates of the different currencies in which a position is held. As in the case of equity risk, this risk is generated in spot currency positions, and in any derivative product whose underlying asset is an exchange rate. In addition, the quanto effect (operations where the underlying asset and the instrument itself are denominated in different currencies) means that in certain transactions in which the underlying asset is not a currency, an exchange-rate risk is generated that has to be measured and monitored.
• Credit-spread risk: Credit spread is an indicator of an issuer's credit quality. Spread risk occurs due to variations in the levels of spread of both corporate and government issues, and affects positions in bonds and credit derivatives.
• Volatility risk: This occurs as a result of changes in the levels of implied price volatility of the different market instruments on which derivatives are traded. This risk, unlike the others, is exclusively a component of trading in derivatives and is defined as a first-order convexity risk that is generated in all possible underlying assets in which there are products with options that require a volatility input for their valuation.
The metrics developed to control and monitor market risk in BBVA Group are aligned with best practices in the market and are implemented consistently across all the local market risk units.
Measurement procedures are established in terms of the possible impact of negative market conditions on the trading portfolio of the Group's Global Markets units, both under ordinary circumstances and in situations of heightened risk factors.
The standard metric used to measure market risk is Value at Risk (“VaR”), which indicates the maximum loss that may occur in the portfolios at a given confidence level (99%) and time horizon (one day). This statistic value is widely used in the market and has the advantage of summing up in a single metric the risks inherent to trading activity, taking into account how they are related and providing a prediction of the loss that the trading book could sustain as a result of fluctuations in equity prices, interest rates, foreign exchange rates and commodity prices. The market risk analysis considers risks, such as credit spread, basis risk, volatility and correlation risk.
Most of the headings on the Group's consolidated balance sheet subject to market risk are positions whose main metric for measuring their market risk is VaR. This table shows the accounting lines of the consolidated balance sheet as of December 31, 2015 in which there is a market risk in trading activity subject to this measurement:
June 2016 Headings of the balance sheet under market risk
RELATION OF RISK METRICS TO BALANCE SHEET OF GROUP'S
CONSOLIDATED POSITION
VaR Others (*)
Assets subject to market risk
Financial assets held for trading 73,084 2,195Available for sale financial assets 7,527 35,205
Of which: Equity instruments - 3,474Hedging derivatives 437 2,280
Liabilities subject to market risk
Financial liabilities held for trading 50,668 1,873Hedging derivatives 1,182 1,327
Millions of EurosMain market risk metrics
(*) Includes mainly assets and liabilities managed by COAP.
Although the prior table shows details the financial positions subject to market risk, it should be noted that the data are for information purposes only and do not reflect how the risk is managed in trading activity, where it is not classified into assets and liabilities.
With respect to the risk measurement models used in BBVA Group, the Bank of Spain has authorized the use of the internal model to determine bank capital requirements deriving from risk positions on the BBVA S.A. and BBVA Bancomer trading book, which jointly account for around 75% of the Group’s trading-book market risk. For the rest of the geographical areas (mainly South America, Garanti and BBVA Compass), bank capital for the risk positions in the trading book is calculated using the standard model.
F-76
The current management structure includes the monitoring of market-risk limits, consisting of a scheme of limits based on VaR, economic capital (based on VaR measurements) and VaR sub-limits, as well as stop-loss limits for each of the Group’s business units.
The model used estimates VaR in accordance with the "historical simulation" methodology, which involves estimating losses and gains that would have taken place in the current portfolio if the changes in market conditions that took place over a specific period of time in the past were repeated. Based on this information, it infers the maximum expected loss of the current portfolio within a given confidence level. This model has the advantage of reflecting precisely the historical distribution of the market variables and not assuming any specific distribution of probability. The historical period used in this model is two years. The historical simulation method is used in BBVA S.A., BBVA Bancomer, BBVA Chile, Compass Bank and Garanti.
VaR figures are estimated following two methodologies:
• VaR without smoothing, which awards equal weight to the daily information for the previous two years. This is currently the official methodology for measuring market risks for the purpose of monitoring compliance with risk limits.
• VaR with smoothing, which gives a greater weight to more recent market information. This metric supplements the previous one.
In the case of South America (except BBVA Chile), a parametric methodology is used to measure risk in terms of VaR.
At the same time, and following the guidelines established by the Spanish and European authorities, BBVA incorporates metrics in addition to VaR with the aim of meeting the Bank of Spain's regulatory requirements with respect to the calculation of bank capital for the trading book. Specifically, the new measures incorporated in the Group since December 2011 (stipulated by Basel 2.5) are:
• VaR: In regulatory terms, the VaR charge incorporates the stressed VaR charge, and the sum of the two (VaR and stressed VaR) is calculated. This quantifies the losses associated with the movements of the two risk factors inherent to market operations (interest rates, FX, RV, credit...). Both VaR and stressed VaR are rescaled by a regulatory multiplier set at three and by the square root of ten to calculate the capital charge.
• Specific Risk: Incremental Risk Capital (“IRC”) Quantification of the risks of default and downgrading of the credit ratings of the bond and credit derivative positions in the portfolio. The specific capital risk by IRC is a charge exclusively used in the geographical areas with the internal model approved (BBVA S.A. and Bancomer). The capital charge is determined according to the associated losses (at 99.9% in a 1-year horizon under the hypothesis of constant risk) due to the rating migration and/or default state the issuer of an asset. In addition, the price risk is included in sovereign positions for the items specified.
• Specific Risk: Securitization and correlation portfolios. Capital charge for securitizations and the correlation portfolio to include the potential losses associated at the level of rating a specific credit structure (rating). Both are calculated by the standard method. The scope of the correlation portfolios refers to the FTD-type market operation and/or tranches of market CDOs and only for positions with an active market and hedging capacity.
Validity tests are performed regularly on the risk measurement models used by the Group. They estimate the maximum loss that could have been incurred in the positions with a certain level of probability (backtesting), as well as measurements of the impact of extreme market events on risk positions (stress testing). As an additional control measure, backtesting is conducted at trading desk level in order to enable more specific monitoring of the validity of the measurement models.
Market risk in the first semester of 2016
The Group’s market risk remains at low levels compared with the risk aggregates managed by BBVA, particularly in terms of credit risk. This is due to the nature of the business and the Group’s policy of minimal proprietary trading. During the first semester of 2016 the average VaR was €32 million, above 2015 figure mainly due to the incorporation of Garanti figures, with a high on February 12, of €39 m. The evolution in the BBVA Group’s market risk during the second semester of 2015 and the first semester of 2016, measured as VaR without smoothing (see Glossary) with a 99% confidence level and a 1-day horizon (shown in millions of Euros) is as follows:
F-77
By type of market risk assumed by the Group's trading portfolio, the main risk factor for the Group continues to be that linked to interest rates, with a weight of 60% of the total at the end of the first semester of 2016 (this figure includes the spread risk). The relative weight has increased compared with the close of 2015 (48%). Exchange-rate risk accounts for 14%, decreasing its proportion with respect to December 2015 (21%), while equity, volatility and correlation risk have decreased, with a weight of 26% at the close of the first semester of 2016 (vs. 32% at the close of 2015).
As of June 30, 2016, and the close of 2015 the balance of VaR was €31 million, and €24 million, respectively. These figures can be broken down as follows:
Millions of Euros
VaR by Risk FactorInterest/Spread
RiskCurrency Risk Stock-market Risk
Vega/Correlation
Risk
Diversification
Effect(*)Total
June 2016
VaR average in the period 32
VaR max in the period 33 15 3 10 (21) 39
VaR min in the period 26 7 4 11 (21) 27
End of period VaR 33 8 4 10 (23) 31
December 2015
VaR average in the period 24
VaR max in the period 32 5 3 9 (18) 30
VaR min in the period 20 6 3 9 (17) 21End of period VaR 21 9 3 11 (20) 24
(*) The diversification effect is the difference between the sum of the average individual risk factors and the total VaR figure that includes the implied correlation between all the variables and scenarios used in the measurement.
Validation of the model
The internal market risk model is validated on a regular basis by backtesting in both BBVA S.A. and Bancomer.
The aim of backtesting is to validate the quality and precision of the internal market risk model used by BBVA Group to estimate the maximum daily loss of a portfolio, at a 99% level of confidence and a 250-day time horizon, by comparing the Group's results and the risk measurements generated by the internal market risk model. These tests showed that the internal market risk model of both BBVA, S.A. and Bancomer is adequate and precise.
Two types of backtesting have been carried out during the second semester of 2015 and the first semester of 2016:
F-78
• "Hypothetical" backtesting: the daily VaR is compared with the results obtained, not taking into account the intraday results or the changes in the portfolio positions. This validates the appropriateness of the market risk metrics for the end-of-day position.
• "Real" backtesting: the daily VaR is compared with the total results, including intraday transactions, but discounting the possible minimum charges or fees involved. This type of backtesting includes the intraday risk in portfolios.
In addition, each of these two types of backtesting was carried out at the level of risk factor or business type, thus making a deeper comparison of the results with respect to risk measurements.
For the period between the second half of 2015 and the first semester of 2016, it was carried out the backtesting of the internal VaR calculation model, comparing the daily results obtained with the estimated risk level estimated by the internal VaR calculation model. At the end of the semester the comparison showed the internal VaR calculation model was working correctly, within the "green" zone (0-4 exceptions), thus validating the internal VaR calculation model, as has occurred each year since the internal market risk model was approved for the Group.
Stress test analysis
A number of stress tests are carried out on BBVA Group's trading portfolios. First, global and local historical scenarios are used that replicate the behavior of an extreme past event, such as for example the collapse of Lehman Brothers or the "Tequilazo" crisis. These stress tests are complemented with simulated scenarios, where the aim is to generate scenarios that have a significant impact on the different portfolios, but without being anchored to any specific historical scenario. Finally, for some portfolios or positions, fixed stress tests are also carried out that have a significant impact on the market variables affecting these positions.
Historical scenarios
The historical benchmark stress scenario for the BBVA Group is Lehman Brothers, whose sudden collapse in September 2008 led to a significant impact on the behavior of financial markets at a global level. The following are the most relevant effects of this historical scenario:
• Credit shock: reflected mainly in the increase of credit spreads and downgrades in credit ratings.
• Increased volatility in most of the financial markets (giving rise to a great deal of variation in the prices of different assets (currency, equity, debt).
• Liquidity shock in the financial systems, reflected by a major movement in interbank curves, particularly in the shortest sections of the euro and dollar curves.
Simulated scenarios
Unlike the historical scenarios, which are fixed and therefore not suited to the composition of the risk portfolio at all times, the scenario used for the exercises of economic stress is based on Resampling methodology. This methodology is based on the use of dynamic scenarios are recalculated periodically depending on the main risks held in the trading portfolios. On a data window wide enough to collect different periods of stress (data are taken from 1-1-2008 until today), a simulation is performed by resampling of historic observations, generating a loss distribution and profits to analyze most extreme of births in the selected historical window. The advantage of this resampling methodology is that the period of stress is not predetermined, but depends on the portfolio maintained at each time, and making a large number of simulations (10,000 simulations) allows a richer information for the analysis of expected shortfall than what is available in the scenarios included in the calculation of VaR.
The main features of this approach are: a) the generated simulations respect the correlation structure of the data, b) flexibility in the inclusion of new risk factors and c) to allow the introduction of a lot of variability in the simulations (desirable to consider extreme events).
F-79
The impact of the stress test under multivariable simulation of the risk factors of the portfolio (Expected shortfall 95% to 20 days) as of June 30, 2016 is as follows:
Millions of Euros
Europe Bancomer Peru Venezuela Argentina Colombia Chile
Expected Shortfall (107) (34) (11) - (6) (2) (11)
7.4.2 Structural risk
The Assets and Liabilities Committee (ALCO) is the key body for the management of structural risks relating to liquidity/funding, interest rates and currency rates. Every month, with representatives from the areas of Finance, Risks and Business Areas, this committee monitors the above risks and is presented with proposals for managing them for its approval. These management proposals are made proactively by the Finance area, taking into account the risk appetite framework and with the aim of guaranteeing recurrent earnings and preserving the entity's solvency. All the balance-sheet management units have a local ALCO, assisted constantly by the members of the Corporate Center. There is also a corporate ALCO where the management strategies in the Group's subsidiaries are monitored and presented.
Structural interest-rate risk
The structural interest-rate risk (“SIRR”) is related to the potential impact that variations in market interest rates have on an entity's net interest income and equity. In order to properly measure SIRR, BBVA takes into account the main sources that generate this risk: repricing risk, yield curve risk, option risk and basis risk, which are analyzed from two complementary points of view: net interest income (short term) and economic value (long term).
ALCO monitors the interest-rate risk metrics and the Finance area carries out the management proposals for the structural balance sheet. The management objective is to ensure the stability of net interest income and book value in the face of changes in market interest rates, while respecting the internal solvency and limits in the different balance-sheets and for BBVA Group as a whole; and complying with current and future regulatory requirements.
BBVA's structural interest-rate risk management control and monitoring is based on a set of metrics and tools that enable the entity's risk profile to be monitored correctly. A wide range of scenarios are measured on a regular basis, including sensitivities to parallel movements in the event of different shocks, changes in slope and curve, as well as delayed movements. Other probabilistic metrics based on statistical scenario-simulating methods are also assessed, such as income at risk (“IaR”) and economic capital (“EC”), which are defined as the maximum adverse deviations in net interest income and economic value, respectively, for a given confidence level and time horizon. Impact thresholds are established on these management metrics both in terms of deviations in net interest income and in terms of the impact on economic value. The process is carried out separately for each currency to which the Group is exposed, and the diversification effect between currencies and business units is considered after this.
In order to guarantee its effectiveness, the model is subjected to regular internal validation, which includes backtesting. In addition, the banking book’s interest-rate risk exposures are subjected to different stress tests in order to reveal balance sheet vulnerabilities under extreme scenarios. This testing includes an analysis of adverse macroeconomic scenarios designed specifically by BBVA Research, together with a wide range of potential scenarios that aim to identify interest-rate environments that are particularly damaging for the entity. This is done by generating extreme scenarios of a breakthrough in interest rate levels and historical correlations, giving rise to sudden changes in the slopes and even to inverted curves.
The model is necessarily underpinned by an elaborate set of hypotheses that aim to reproduce the behavior of the balance sheet as closely as possible to reality. Especially relevant among these assumptions are those related to the behavior of “accounts with no explicit maturity”, for which stability and remuneration assumptions are established, consistent with an adequate segmentation by type of product and customer, and prepayment estimates (implicit optionality). The hypotheses are reviewed and adapted regularly to signs of changes in behavior, kept properly documented and reviewed on a regular basis in the internal validation processes.
F-80
The impacts on the metrics are assessed both from a point of view of economic value (gone concern) and from the perspective of net interest income, for which a dynamic model (going concern) consistent with the corporate assumptions of earnings forecasts is used.
The table below shows the profile of average sensitivities to net interest income and value of the main entities in BBVA Group in the first half of 2016:
Sensitivity to Interest-Rate Analysis -
June 2016
100 Basis-
Point Increase
100 Basis-
Point
Decrease
100 Basis-
Point Increase
100 Basis-
Point
Decrease
Europe 14.76% (5.24%) 4.70% (3.86%)
Mexico 2.17% (2.04%) (3.06%) 3.24%
USA 8.79% (7.99%) 0.14% (7.61%)
Turkey (6.83%) 4.64% (2.74%) 3.68%
South America 2.46% (2.47%) (2.87%) 3.11%
BBVA Group 4.31% (2.51%) 2.47% (2.68%)
Impact on Net Interest Income
(*)
Impact on Economic Value
(**)
(*) Percentage of "1 year" net interest income forecast for each unit.
(**) Percentage of core capital for each unit.
In the first half of 2016 in Europe has remained expansionary monetary policy, which pushed interest rates lower, towards more negative levels in the short term rates. In USA, Fed’s reference interest rate has remained constant in this period, while Mexico has continued the upward cycle started at the end of 2015, as in the major economies of South America.
The BBVA Group in all its Balance Sheet Management Units ("BSMUs") maintains a positive sensitivity in its net interest income to an increase in interest rates. Turkey, helps to diversify the Group's net exposure due to the opposite direction of its position on Europe. The higher sensitivities in the net interest income, relatively speaking, are observed in mature markets (Europe and USA), where, however, the negative sensitivity in their net interest income to decrease in interest rates is limited by the plausible downward trend in interest rates. The Group maintains a moderate risk profile, according to its target risk, through effective management of its balance sheet structural risk.
Structural exchange-rate risk
In BBVA Group, structural exchange-rate risk arises from the consolidation of holdings in subsidiaries with functional currencies other than the euro. Its management is centralized in order to optimize the joint handling of permanent foreign currency exposures, taking into account the diversification.
The corporate Assets and Liabilities Management unit, through ALCO, designs and executes hedging strategies with the main purpose of controlling the potential negative effect of exchange-rate fluctuations on capital ratios and on the equivalent value in euros of the foreign-currency earnings of the Group's subsidiaries, considering transactions according to market expectations and their cost.
The risk monitoring metrics included in the system of limits are integrated into management and supplemented with additional assessment indicators. At corporate level they are based on probabilistic metrics that measure the maximum deviation in the Group’s Capital, CET1 (“Common Equity Tier 1”) ratio, and net attributable profit. The probabilistic metrics make it possible to estimate the joint impact of exposure to different currencies taking into account the different variability in currency rates and their correlations.
The suitability of these risk assessment metrics is reviewed on a regular basis through backtesting exercises. The final element of structural exchange-rate risk control is the analysis of scenarios and stress with the aim of identifying in advance possible threats to future compliance with the risk appetite levels set, so that any necessary preventive management actions can be taken. The scenarios are based both on historical situations simulated by the risk model and on the risk scenarios provided by BBVA Research.
As for the market, in the first half of 2016 it is noteworthy the weakness of the US dollar and the Mexican peso and, on the contrary, the outperformance of the currencies of Andean area and Turkish lira, favored by the recovery of prices in raw materials, especially oil, and lower uncertainty about the growth in these economies after the delay of expected rate hikes by the Federal Reserve and better perspectives in China.
F-81
The Group's structural exchange-rate risk exposure level has decreased since the end of 2015 mostly due to the increased hedging, focused on Mexican peso and Turkish lira. The risk mitigation level in capital ratio due to the book value of BBVA Group's holdings in foreign currency stood at around 70% and hedging of foreign-currency earnings in the first half of 2016 stood at 47%. CET1 ratio sensitivity to the appreciation of 1% in the euro exchange rate for each currency is: US Dollar: +1.2 bps; Mexican peso -0.2 bps; Turkish Lira -0.1 bps; other currencies: -0.2 bps.
Structural equity risk
BBVA Group's exposure to structural equity risk stems basically from investments in industrial and financial companies with medium- and long-term investment horizons. This exposure is mitigated through net short positions held in derivatives of their underlying assets, used to limit portfolio sensitivity to potential falls in prices.
Structural management of equity portfolios is the responsibility of the Group's units specializing in this area. Their activity is subject to the corporate risk management policies for equity positions in the equity portfolio. The aim is to ensure that they are handled consistently with BBVA's business model and appropriately to its risk tolerance level, thus enabling long-term business sustainability.
The Group's risk management systems also make it possible to anticipate possible negative impacts and take appropriate measures to prevent damage being caused to the entity. The risk control and limitation mechanisms are focused on the exposure, annual operating performance and economic capital estimated for each portfolio. Economic capital is estimated in accordance with a corporate model based on Monte Carlo simulations, taking into account the statistical performance of asset prices and the diversification existing among the different exposures.
Backtesting is carried out on a regular basis on the risk measurement model used.
In the market, the performance of European stock markets in the first half of 2016 has been negative, especially in the last part of the period, affected by the initial shock in the financial markets after the Brexit, due to the policy uncertainty that this process entails and its potential impact on the Eurozone growth expectations. This effect has led to a deterioration of capital gains accumulated in the Group's equity portfolios as of the end of June, although it is fading away as main equity indices have recovered pre-Brexit levels in July.
Structural equity risk, measured in terms of economic capital, has decreased significantly in the period as a result of the lower value of exposures and dividend payment, along with reduced positioning in some sectors.
Stress tests and analyses of sensitivity to different simulated scenarios are carried out periodically to analyze the risk profile in more depth. They are based on both past crisis situations and forecasts made by BBVA Research. This checks that the risks are limited and that the tolerance levels set by the Group are not at risk.
The aggregate sensitivity of the BBVA Group’s consolidated equity to a 1% fall in the price of shares of the companies making up the equity portfolio stood at around -€39 million as of June 30, 2016. This estimate takes into account the exposure in shares valued at market prices, or if not applicable, at fair value (except for the positions in the Treasury Area portfolios) and the net delta-equivalent positions in options on the same underlyings.
7.4.3 Financial Instruments compensation
Financial assets and liabilities may be netted, i.e. they are presented for a net amount on the consolidated balance sheet only when the Group's entities satisfy with the provisions of IAS 32-Paragraph 42, so they have both the legal right to net recognized amounts, and the intention of settling the net amount or of realizing the asset and simultaneously paying the liability.
In addition, the Group has presented as gross amounts assets and liabilities on the consolidated balance sheet for which there are master netting arrangements in place, but for which there is no intention of settling net. The most common types of events that trigger the netting of reciprocal obligations are bankruptcy of the entity, surpassing certain level of indebtedness threshold, failure to pay, restructuring and dissolution of the entity.
F-82
In the current market context, derivatives are contracted under different framework contracts being the most widespread developed by the International Swaps and Derivatives Association (“ISDA”) and, for the Spanish market, the Framework Agreement on Financial Transactions (“CMOF”). Almost all portfolio derivative transactions have been concluded under these framework contracts, including in them the netting clauses mentioned in the preceding paragraph as "Master Netting Agreement", greatly reducing the credit exposure on these instruments. Additionally, in contracts signed with professional counterparties, the collateral agreement annexes called Credit Support Annex (“CSA”) are included, thereby minimizing exposure to a potential default of the counterparty.
Moreover, in transactions involving assets purchased or sold under a purchase agreement there is a high volume transacted through clearing houses that articulate mechanisms to reduce counterparty risk, as well as through the signature of various master agreements for bilateral transactions, the most widely used being the Global Master Repurchase Agreement (GMRA), published by International Capital Market Association (“ICMA”), to which the clauses related to the collateral exchange are usually added within the text of the master agreement itself.
A summary of the effect of the compensation (via netting and collateral) for derivatives and securities operations is presented below as of June 30, 2016:
Repurchase, securities lending and similar agreements 35 53,013 3,492 49,521 52,204 7 (2,689)
Total Liabillities 119,794 20,385 99,409 86,362 9,358 3,690
Gro ss A mo unts N o t Of fset in the
C o ndensed C o nso lidated B alance
Sheets (D )
7.5 Liquidity risk
Management of liquidity and structural finance within the BBVA Group is based on the principle of the financial autonomy of the entities that make it up. This approach helps prevent and limit liquidity risk by reducing the Group’s vulnerability in periods of high risk. This decentralized management avoids possible contagion due to a crisis that could affect only one or several BBVA Group entities, which must cover their liquidity needs independently in the markets where they operate. Liquidity Management Units (LMUs) have been set up for this reason in the geographical areas where the main foreign subsidiaries operate, and also for the parent BBVA S.A., within the Euro currency scope, specifically BBVA Portugal and Catalunya Banc.
Finance Division, through Balance Sheet Management, manages BBVA Group's liquidity and funding. It plans and executes the funding of the long-term structural gap of each LMUs and proposes to ALCO the actions to adopt in this regard in accordance with the policies and limits established by the Executive Committee.
The Bank's target behavior in terms of liquidity and funding risk is characterized through the Loan-to-Stable-Customer-Deposits (LtSCD) ratio. The aim is to preserve a stable funding structure in the medium term for each of the LMUs making up BBVA Group, taking into account that maintaining an adequate volume of stable customer funds is key to achieving a sound liquidity profile. These stable funds in each LMU are calculated by analyzing the behavior of the balance sheets of the different customer segments identified as likely to provide stability to the funding structure, and by prioritizing an established relationship and applying bigger haircuts to the funding lines of less stable customers.
For the purpose of establishing the (maximum) target levels for LtSCD in each LMU and providing an optimal funding structure reference in terms of risk appetite, GRM-Structural Risks identifies and assesses the economic and financial variables that condition the funding structures in the various geographical areas. The behavior of the indicators reflects that the funding structure remained robust in 2016, in the sense that all the LMUs maintain levels of self-funding with stable customer funds higher than the required levels.
F-83
June 2016 December 2015
Group (average) 117% 116%
Eurozone 119% 116%
Bancomer 115% 110%
Compass 111% 112%
Garanti 120% 128%
Other LMUs 110% 111%
LtSCD by LMU
The second core element in liquidity and funding risk management is to achieve proper diversification of the funding structure, avoiding excessive reliance on short-term funding and establishing a maximum level of short-term borrowing comprising both wholesale funding as well as less stable funds from non-retail customers.
The third element promotes the short-term resilience of the liquidity risk profile, making sure that each LMU has sufficient collateral to address the risk of wholesale markets closing. Basic Capacity is the short-term liquidity risk management and control metric that is defined as the relationship between the available explicit assets and the maturities of wholesale liabilities and volatile funds, at different terms, with special relevance being given to 30-day maturities.
Each entity maintains an individual liquidity fund, both Banco Bilbao Vizcaya Argentaria SA and its subsidiaries, including BBVA Compass, BBVA Bancomer, Garanti Bank and the Latin American subsidiaries. The table below shows the liquidity available by instrument as of June 30, 2016 for the most significant entities:
Millions of Euros
June 2016BBVA
Eurozone (1)
BBVA
Bancomer
BBVA
Compass Garanti Bank Others
Cash and balances with central banks 5,118 5,887 2,825 6,091 5,791
Assets for credit operations with central banks 53,773 7,012 24,522 7,090 5,080
Central governments issues 33,855 5,051 9,775 7,090 5,004
Of Which: Spanish government securities 30,601 - - - -
Other issues 19,917 1,960 181 - 76
Loans - - 14,566 - -
Other non-eligible liquid assets 6,798 888 452 1,662 801
ACCUMULATED AVAILABLE BALANCE 65,689 13,787 27,799 14,842 11,672
AVERAGE BALANCE 67,887 13,385 26,908 13,679 11,589
(1) It includes Banco Bilbao Vizcaya Argentaria, S.A., Catalunya Banc, S.A. and Banco Bilbao Vizcaya Argentaria (Portugal), S.A.
The above metrics are completed with a series of indicators with thresholds levels that aim to avoid the concentration of wholesale funding by product, counterparty, market and term, as well as to promote diversification by geographical area. In addition, reference thresholds are established on a series of advance indicators that make it possible to anticipate stress situations in the markets and adopt, if necessary, preventive actions.
Stress analyses are also a basic element of the liquidity and funding risk monitoring system, as they help anticipate deviations from the liquidity targets and limits set out in the risk appetite as well as establish tolerance ranges at different management levels. They also play a key role in the design of the Liquidity Contingency Plan and in defining the specific measures for action for realigning the risk profile.
For each of the scenarios, a check is carried out whether the Bank has a sufficient liquid assets to meet the liquidity commitments/outflows in the various periods analyzed. The analysis considers four scenarios, one core and three crisis-related: systemic crisis; unexpected internal crisis with a considerable rating downgrade and/or affecting the ability to issue in wholesale markets and the perception of business risk by the banking intermediaries and the bank's customers; and a mixed scenario, as a combination of the two aforementioned scenarios. Each scenario considers the following factors: liquidity existing on the market, customer behavior and sources of funding, impact of rating downgrades, market values of liquid assets and collateral, and the interaction between liquidity requirements and the performance of the bank's asset quality.
The results of these stress analyses carried out regularly reveal that BBVA has a sufficient buffer of liquid assets to deal with the estimated liquidity outflows in a scenario such as a combination of a systemic crisis and an
F-84
unexpected internal crisis, during a period longer than 3 months for every LMUs, including a major downgrade in the bank's rating (by up to three notches).
In addition to the behavior of the main indicators for all the LMUs in the Group, BBVA has established a level of requirement for compliance with the LCR ratio within the plan to adapt risk management to regulatory capital adequacy ratios, both for the Group as a whole and for each of the LMUs individually. The internal levels required are geared to comply sufficiently and efficiently in advance with the implementation of the regulatory requirement of 2018, at a level above 100%.
Throughout the first half of 2016 the level of the LCR for BBVA Group is estimated to have remained above 100%. At the European level the LCR ratio was effective beginning October 1, 2015, with an initial required level of 60%, and a phased-in level of up to 100% in 2018. Regulatory developments by the European authorities are pending in terms of the information to be reported to the supervisor and for public disclosure.
F-85
Below is a matrix of residual maturities by contractual periods based on supervisory prudential reporting as of June 30, 2016:
Millions of Euros
June 2016
Contractual MaturitiesDemand Up to 1 Month 1 to 3 Months 3 to 6 Months 6 to 9 Months 9 to 12 Months 1 to 2 Years 2 to 3 Years 3 to 5 Years Over 5 Years Total
Cash, cash balances at central banks and other demand deposits 25,711 - - - - - - - - - 25,711
Contractual MaturitiesDemand Up to 1 Month 1 to 3 Months 3 to 6 Months 6 to 9 Months 9 to 12 Months 1 to 2 Years 2 to 3 Years 3 to 5 Years Over 5 Years Total
The matrix shows the retail nature of the funding structure, with a loan portfolio been mostly funded by customer deposits. On the outflows side of the matrix, the “demand” maturity bucket mainly contains the retail customers sight accounts whose behavior shows a high level of stability. According to internal methodology they are considered to remain for a minimum of three years.
Long and short term wholesale funding markets were stable in 2016. The ECB carried out the new program Targeted Longer-Term Refinancing Operations (TLTRO II), based on four quarterly targeted 4 years refinancing operations, with the aim of boosting channeled lending and improving financial conditions for the whole European economy. In the first auction the Euro LMU took €23.7 billion after amortizing €14 billion in previous TLTRO auctions. In addition, over the whole year the Euro LMU made issues in the public market for €3,950 million.
The liquidity position of all the subsidiaries outside Europe has continued to be comfortable, maintaining a solid liquidity position in all the jurisdictions in which the Group operates.
In this context, BBVA has maintained its objective of strengthening the funding structure of the different Group entities based on growing their self-funding from stable customer funds, while guaranteeing a sufficient buffer of fully available liquid assets, diversifying the various sources of funding available, and optimizing the generation of collateral available for dealing with stress situations in the markets.
F-86
7.6 Asset encumbrance
As of June 30, 2016, the encumbered (those provided as collateral for certain liabilities) and unencumbered assets are broken down as follows:
Millions of Euros
June 2016Book value of Encumbered
assets
Market value of Encumbered
assets
Book value of non-
encumbered assets
Market value of non-
encumbered assets
Equity instruments 1,772 1,772 8,497 8,497
Debt Securities 48,617 48,769 102,120 102,120
Loans and Advances and other assets 95,273 - 489,762 -
Encumbered assets Unencumbered assets
The committed value of "Loans and Advances and other assets" corresponds mainly to loans linked to the issue of covered bonds, territorial bonds or long-term securitized bonds (see Note 22.3) as well as those used as a guarantee to access certain funding transactions with central banks. Debt securities and equity instruments respond to underlying that are delivered in repos with different types of counterparties, mainly clearing houses or credit institutions, and to a lesser extent central banks. Collateral provided to guarantee derivative operations is also included as committed assets.
As of June 30, 2016, collateral pledge mainly due to repurchase agreements and securities lending, and those which could be committed in order to obtain funding are provided below:
Millions of Euros
June 2016
Collateral received
Fair value of encumbered
collateral received or own
debt securities issued
Fair value of collateral
received or own debt
securities issued available for
encumbrance
Nominal amount of collateral
received or own debt
securities issued not available
for encumbrance
Collateral received 20,440 6,816 469
Equity instruments 46 2 -
Debt securities 20,394 4,969 170
Loans and Advances and other assets - 1,846 299
Own debt securities issued other than own covered bonds or
ABSs 3 125 -
F-87
The guarantees received in the form of reverse repos or security lending transactions are committed by their use in repos, as is the case with debt securities
As of June 30, 2016, financial liabilities issued related to encumbered assets in financial transactions as well as their book value were as follows:
June 2016
Sources of encumbrance
Matching liabilities,
contingent liabilities or
securities lent
Assets, collateral received
and own
debt securities issued other
than covered bonds and ABSs
encumbered
Book value of financial liabilities 138,261 162,461
Derivatives 11,620 12,747
Loans and Advances 98,280 114,886
Outstanding subordinated debt 28,361 34,828
Other sources 2,282 3,643
Millions of Euros
F-88
7.7 Operational Risk
Operational risk is defined as one that could potentially cause losses due to human errors, inadequate or faulty internal processes, system failures or external events. This definition includes legal risk but excludes strategic and/or business risk and reputational risk.
Operational risk is inherent to all banking activities, products, systems and processes. Its origins are diverse (processes, internal and external fraud, technology, human resources, commercial practices, disasters, suppliers). Operational risk management is a part of the BBVA Group global risk management structure.
Operational risk management framework
Operational risk management in the Group is based on the value-adding drivers generated by the advanced measurement approach (AMA), as follows:
• Active management of operational risk and its integration into day-to-day decision-making means:
– Knowledge of the real losses associated with this type of risk.
– Identification, prioritization and management of real and potential risks.
– The existence of indicators that enable the Bank to analyze operational risk over time, define warning signals and verify the effectiveness of the controls associated with each risk.
The above helps create a proactive model for making decisions about control and business, and for prioritizing the efforts to mitigate relevant risks in order to reduce the Group's exposure to extreme events.
• Improved control environment and strengthened corporate culture.
• Generation of a positive reputational impact.
Operational Risk Management Principles
Operational risk management in BBVA Group should:
• Be aligned with the risk appetite statement set out by the Board of BBVA.
• Anticipate the potential operational risks to which the Group would be exposed as a result of new or modified products, activities, processes, systems or outsourcing decisions, and establish procedures to enable their evaluation and reasonable mitigation prior to their implementation.
• Establish methodologies and procedures to enable a regular reassessment of the relevant operational risks to which the Group is exposed in order to adopt appropriate mitigation measures in each case, once the identified risk and the cost of mitigation (cost/benefit analysis) have been considered, while preserving the Group's solvency at all times.
• Identify the causes of the operational losses sustained by the Group and establish measures to reduce them. Procedures must therefore be in place to enable the capture and analysis of the operational events that cause those losses.
• Analyze the events that have caused operational risk losses in other institutions in the financial sector and promote, where appropriate, the implementation of the measures needed to prevent them from occurring in the Group.
• Identify, analyze and quantify events with a low probability of occurrence and high impact in order to evaluate their mitigation. Due to their exceptional nature, it is possible that such events may not be included in the loss database or, if they are, they have impacts that are not representative.
• Have an effective system of governance in place, where the functions and responsibilities of the areas and bodies involved in operational risk management are clearly defined.
These principles reflect BBVA Group's vision of operational risk, on the basis that the resulting events have an ultimate cause that should always be identified, and that the impact of the events is reduced significantly by controlling that cause.
Irrespective of the adoption of all the possible measures and controls for preventing or reducing both the frequency and severity of operational risk events, BBVA ensures at all times that sufficient capital is available to cover any expected or unexpected losses that may occur.
F-89
7.8 Risk concentration
Policies for preventing excessive risk concentration
In order to prevent the build-up of excessive concentrations of credit risk at the individual, country and sector levels, BBVA Group maintains maximum permitted risk concentration indices updated at individual and portfolio sector levels tied to the various observable variables within the field of credit risk management.
The limit on the Group’s exposure or financial commitment to a specific customer therefore depends on the customer’s credit rating, the nature of the risks involved, and the Group’s presence in a given market, based on the following guidelines:
• The aim is, as much as possible, to reconcile the customer's credit needs (commercial/financial, short-term/long-term, etc.) with the interests of the Group.
• Any legal limits that may exist concerning risk concentration are taken into account (relationship between risks with a customer and the capital of the entity that assumes them), the markets, the macroeconomic situation, etc.
Risk concentrations by geography
The breakdown of the main figures in the most significant foreign currencies in the accompanying consolidated balance sheets is set forth in Appendix XI.
Sovereign risk concentration
Sovereign risk management
The risk associated with the transactions involving sovereign risk is identified, measured, controlled and tracked by a centralized unit integrated in the BBVA Group’s Risk Area. Its basic functions involve the preparation of reports in the countries where sovereign risk exists (called “financial programs”), tracking such risks, assigning ratings to these countries and, in general, supporting the Group in terms of reporting requirements for any transactions involving sovereign risk. The risk policies established in the financial programs are approved by the relevant risk committees.
The country risk unit tracks the evolution of the risks associated with the various countries to which the Group are exposed (including sovereign risk) on an ongoing basis in order to adapt its risk and mitigation policies to any macroeconomic and political changes that may occur. Moreover, it regularly updates its internal ratings and forecasts for these countries. The internal rating assignment methodology is based on the assessment of quantitative and qualitative parameters which are in line with those used by certain multilateral organizations such as the International Monetary Fund (IMF) and the World Bank (WB), rating agencies and export credit organizations.
For additional information on sovereign risk in Europe see Appendix X
Valuation and impairment methods
The valuation methods used to assess the instruments that are subject to sovereign risks are the same ones used for other instruments included in the relevant portfolios and are detailed in Note 8.
Specifically, the fair value of sovereign debt securities of European countries has been considered equivalent to their listed price in active markets (Level 1 as defined in Note 8).
Risk related to the developer and Real-Estate sector in Spain
One of the main Group activities of the Group in Spain is focused on developer and mortgage loans. The policies and strategies established by the Group to deal with risks related to the developer and real-estate sector are explained below:
F-90
Policies and strategies established by the Group to deal with risks related to the developer and real-estate sector
BBVA has teams specializing in the management of the Real-Estate Sector risk, given its economic importance and specific technical component. This specialization is not only in the Risk-Acceptance teams, but throughout the handling, commercial, problem risks and legal, etc. It also includes the research department of the BBVA Group (BBVA Research), which helps determine the medium/long-term vision needed to manage this portfolio. Specialization has been increased and the management teams in the areas of recovery and the Real Estate Unit itself have been reinforced.
The policies established to address the risks related to the developer and real-estate sector, aim to accomplish, among others, the following objectives: to avoid concentration in terms of customers, products and regions; to estimate the risk profile for the portfolio; and to anticipate possible worsening of the portfolio.
Specific policies for analysis and admission of new developer risk transactions
In the analysis of new operations, the assessment of the commercial operation in terms of the economic and financial viability of the project has been one of the constant points that have helped ensure the success and transformation of construction land operations for customers’ developments.
With regard the participation of the Risk Acceptance teams, they have a direct link and participate in the committees of areas such as Recoveries and the Real Estate Unit. This guarantees coordination and exchange of information in all the processes.
The following strategies have been implemented with customers in the developer sector: avoidance of large corporate transactions, which had already reduced their share in the years of greatest market growth; non active participation in the second-home market; commitment to public housing financing; and participation in land operations with a high level of urban development security, giving priority to land open to urban development.
Risk monitoring policies
The base information for analyzing the real estate portfolios is updated monthly. The tools used include the so-called “watch-list”, which is updated monthly with the progress of each client under watch, and the different strategic plans for management of special groups. There are plans that involve an intensification of the review of the portfolio for financing land, while, in the case of ongoing promotions, they are classified based on the rate of progress of the projects.
These actions have enabled BBVA to identify possible impairment situations, by always keeping an eye on BBVA’s position with each customer (whether or not as first creditor). In this regard, key aspects include management of the risk policy to be followed with each customer, contract review, deadline extension, improved collateral, rate review (repricing) and asset purchase.
Proper management of the relationship with each customer requires knowledge of various aspects such as the identification of the source of payment difficulties, an analysis of the company’s future viability, the updating of the information on the debtor and the guarantors (their current situation and business course, economic-financial information, debt analysis and generation of funds), and the updating of the appraisal of the assets offered as collateral.
BBVA has a classification of debtors in accordance with legislation in force in each country, usually categorizing each one’s level of difficulty for each risk.
Based on the information above, a decision is made whether to use the refinancing tool, whose objective is to adjust the structure of the maturity of the debt to the generation of funds and the customer’s payment capacity.
As for the policies relating to risk refinancing with the developer and real-estate sector, they are the same as the general policies used for all of the Group’s risks (see Note 7.3.6). In the developer and real estate sector, they are based on clear solvency and viability criteria for projects, with demanding terms for additional guarantees and legal compliance, given a refinancing tool that standardizes criteria and variables when considering any refinancing operation.
In the case of refinancing, the tools used for enhancing the Bank’s position are: the search for new intervening parties with proven solvency and initial payment to reduce the principal debt or outstanding interest; the improvement of the debt bond in order to facilitate the procedure in the event of default; the provision of new or additional collateral; and making refinancing viable with new conditions (period, rate and repayments), adapted to a credible and sufficiently verified business plan.
F-91
Policies applied in the management of real estate assets in Spain
The policy applied for managing these assets depends on the type of real-estate asset, as detailed below.
• In the case of completed homes, the final aim is the sale of these homes to private individuals, thus reducing the risk and beginning a new business cycle. Here, the strategy has been to help subrogation (the default rate in this channel of business is notably lower than in any other channel of residential mortgages) and to support customers’ sales directly, using BBVA’s own channel (BBVA Services and our branches), creating incentives for sale and including sale orders for BBVA. In exceptional case we have even accepted partial haircuts, with the aim of making the sale easier.
• In the case of ongoing home construction, the strategy has been to help and promote the completion of the construction in order to transfer the investment to completed homes. The whole developer Works in Progress portfolio has been reviewed and classified into different stages with the aim of using different tools to support the strategy. This includes the use of developer accounts-payable financing as a form of payment control, the use of project monitoring supported by the Real Estate Unit itself, and the management of direct suppliers for the works as a complement to the developer’s own management.
• With respect to land, the fact that the vast majority of the risk is urban land simplifies the management. Urban management and liquidity control to tackle urban planning costs are also subject to special monitoring.
For quantitative information about the risk related to the developer and Real-Estate sector in Spain see Appendix XI.
F-92
8. Fair value
8.1 Fair value of financial instrument
The fair value of financial instrument is defined as the price that would be received to sell an asset or paid to transfer a liability in an orderly transaction between market participants at the measurement date. It is therefore a market-based measurement and not specific to each entity.
All financial instruments, both assets and liabilities are initially recognized at fair value, which at that point is equivalent to the transaction price, unless there is evidence to the contrary in an active market. Subsequently, depending on the type of financial instrument, it may continue to be recognized at amortized cost or fair value through adjustments in the income statement or equity.
When possible, the fair value is determined as the market price of a financial instrument. However, for many of the financial assets and liabilities of the Group, especially in the case of derivatives, there is no market price available, so its fair value is estimated on the basis of the price established in recent transactions involving similar instruments or, in the absence thereof, by using mathematical measurement models that are sufficiently tried and trusted by the international financial community. The estimates of the fair value derived from the use of such models take into consideration the specific features of the asset or liability to be measured and, in particular, the various types of risk associated with the asset or liability. However, the limitations inherent in the measurement models and possible inaccuracies in the assumptions and parameters required by these models may mean that the estimated fair value of an asset or liability does not exactly match the price for which the asset or liability could be exchanged or settled on the date of its measurement.
The process for determining the fair value established in the Group to ensure that trading portfolio assets are properly valued, BBVA has established, at a geographic level, a structure of New Product Committees responsible for validating and approving new products or types of financial assets and liabilities before being contracted. The members of these Committees, responsible for valuation, are independent from the business (see Note 7).
These areas are required to ensure, prior to the approval stage, the existence of not only technical and human resources, but also adequate informational sources to measure the fair value these financial assets and liabilities, in accordance with the rules established by the Global Valuation Area and using models that have been validated and approved by the Department of Methodologies that reports to Global Risk Management.
Additionally, for financial assets and liabilities that show significant uncertainty in inputs or model parameters used for assessment, criteria is established to measure said uncertainty and activity limits are set based on these. Finally, these measurements are compared, as much as possible, against other sources such as the measurements obtained by the business teams or those obtained by other market participants:
• Level 1: Measurement using market observable quoted prices for the financial instrument in question, secured from independent sources and trading in referred to active markets - according to the Group policies. This level includes listed debt securities, listed equity instruments, some derivatives and mutual funds.
• Level 2: Measurement that applies techniques using inputs drawn from observable market data.
• Level 3: Measurement using techniques where some of the material inputs are not derived from market observable data. As of June 30, 2016, the affected instruments accounted for approximately 0.09% of financial assets and 0.01% of the Group’s financial liabilities registered at fair value. Model selection and validation is undertaken by control areas outside the market units.
F-93
Below is a comparison of the carrying amount of the Group’s financial instruments in the accompanying consolidated balance sheets and their respective fair values.
Millions of Euros
June 2016 December 2015
Carrying
AmountFair Value
Carrying
AmountFair Value
ASSETS-
Cash and balances with central banks 9 25,127 25,127 29,282 29,282
Financial assets held for trading 10 84,532 84,532 78,326 78,326
Financial assets designated at fair value through profit or loss 11 2,148 2,148 2,311 2,311
Not all financial assets and liabilities are recorded at fair value, so below we provide the information on financial instruments recorded at fair value and subsequently the information of those recorded at cost (including their fair value), although this value is not used when accounting for these instruments.
8.1.1 Fair value of financial instrument recognized at fair value, according valuation criteria
The following table shows the main financial instruments carried at fair value in the accompanying consolidated balance sheets, broken down by the measurement technique used to determine their fair value:
F-94
Millions of Euros
June 2016
Level 1 Level 2 Level 3 Level 1 Level 2 Level 3
ASSETS-
Financial assets held for trading 10 38,721 45,604 207 37,922 40,240 164
December 2015Fair Value of financial Instruments by
LevelsNotes
The heading “Available-for-sale financial assets” in the accompanying consolidated balance sheets as of June 30, 2016 and December 31, 2015 additionally includes €578 million and €600 million for equity instruments, respectively, accounted for at cost, as indicated in the section of this Note entitled “Financial instruments at cost”.
In 2016 and 2015, financial instruments carried at fair value corresponding to the companies that belong to Banco Provincial Group in Venezuela whose balance is denominated in bolivar fuerte are classified under Level 3 in the above tables (see Note 2.2.20.)
The following table sets forth the main valuation techniques, hypothesis and inputs used in the estimation of fair value of the financial instruments classified under Levels 2 and 3, based on the type of financial asset and liability and the corresponding balances as of June 30, 2016:
F-95
Financial Instruments
Level 2
Fair Value
(Millions of
euros)
Valuation technique(s) Unobservable inputs
Loans and advances
Financial assets held for trading 98
Debt securities
Financial assets held for trading 481Financial assets designated at fair value
through profit or loss -Active price in inactive market
Available-for-sale financial assets 17,559
Comparable pricing
(Observable price in a similar market)
Equity Instruments
Financial assets held for trading 10Financial assets designated at fair value
through profit or loss -
Available-for-sale financial assets 198-
Other financial liabilities
Financial liabilities designated at fair value
through profit or loss 2,501
Derivatives
Derivatives
Financial assets held for trading 45,016
Financial liabilities held for trading 45,359
Hedging derivatives
Assets 3,546
Liability 3,119
Present-value method
(Discounted future cash flows)
- Prepayment rates
- Issuer credit risk
- Current market interest rates
• Commodit ies: D isco unt ed cash f lo ws and moment
ad just ment
• Credit products: D ef ault mo d el and Gaussian co p ula
• Exchange rate products: D isco unt ed cash f lo ws, B lack,
Local V ol and M o ment ad just ment
• Fixed income products: D iscount ed cash f lows
• Equity inst ruments: Lo cal - V ol , B lack, M o ment ad just ment
and D isco unt ed cash f lo ws
• Interest rate products:
- Interest rate swaps, Call money Swaps y FRA: D isco unt ed cash
f lows
- Caps/Floors: B lack, Hull - W hit e y SA B R
- Bond options: B lack
- Swapt ions: B lack, Hul l- W hit e y LGM
- Interest rate opt ions: B lack, Hul l- W hit e y SA B R
- Constant M aturity Swaps: SA B R
- Exchange rates
- M arket quoted future prices
- M arket interest rates
- Underlying assests prices: shares, funds,
commodities
- M arket observable vo latilities
- Issuer credit spread levels
- Quoted dividends
- M arket listed correlations
Comparable pricing
(Observable price in a similar market)
- Brokers quotes
- Market operations
- NAVs published
Present-value method
(Discounted future cash flows)
- Prepayment rates
- Issuer credit risk
- Current market interest rates
- Brokers/dealers quotes
- External contributing prices
- Market benchmarks
Present-value method
(Discounted future cash flows)
- Prepayment rates
- Issuer credit risk
- Current market interest rates
Financial Instruments
Level 3Fair Value (Millions of euros) Valuation technique(s) Unobservable inputs
Debt securities
Financial assets held for trading 30
Available-for-sale financial assets 359
Comparable pricing
(Comparison with prices of similar instruments)- P rices o f similar instruments or market benchmark
Equity Instruments
Financial assets held for trading 100
Available-for-sale financial assets 39
Comparable pricing
(Comparison with prices of similar instruments)- P rices o f similar instruments or market benchmark
Derivatives
Trading derivatives
Financial assets held for trading 77
Financial liabilities held for trading 32
Hedging derivatives
Liability 55
Equity OTC Options : Heston
- Vo latility of vo latility
- Interest rate yields
- Dividends
- Assets correlation
Interest rate options: Libor Market Model- Beta
- Correlation rate/credit
- Credit default volatility
Present-value method
(Discounted future cash flows)
- Credit spread
- Recovery rates
- Interest rates
- M arket benchmark
- Default correlation
Credit Option: Gaussian Copula
- Correlation default
- Credit spread
- Recovery rates
- Interest rate yields
Net Asset Value - NAV provided by the administrator o f the fund
F-96
Quantitative information of unobservable inputs used to calculate Level 3 valuations is presented below:
(*) Range is not provided as it would be too wide to take into account the diverse nature of the different positions.
The main techniques used for the assessment of the main financial instruments classified in Level 3, and its main unobservable inputs, are described below:
• The net present value (net present value method): This technique uses the future cash flows of each debt security, which are established in the different contracts, and discounted to their present value. This technique often includes many observable inputs, but may also include unobservable inputs, as described below.
– Credit Spread: This input represents the difference in yield of a debt security and the reference rate, reflecting the additional return that a market participant would require to take the credit risk of that debt security. Therefore, the credit spread of the debt security is part of the discount rate used to calculate the present value of the future cash flows.
– Recovery rate: This input represents the percentage of principal and interest recovered from a debt instrument that has defaulted.
• Comparable prices (similar asset prices): This input represents the prices of comparable financial instruments and benchmarks are used to calculate its yield from the entry price or current rating making further adjustments to account for differences that may exist between financial instrument being valued and the comparable financial instrument. It can also be assumed that the price of the financial instrument is equivalent to the other.
• Net asset value: This input represents the total value of the financial assets and liabilities of a fund and is published by the fund manager thereof.
• Gaussian copula: This input is dependent on credit instruments referenced by the CDS, the joint density function to integrate to value is constructed by a Gaussian copula that relates the marginal densities by a normal distribution, usually extracted from the correlation matrix of events approaching default by CDS issuers.
• Black 76: variant of Black Scholes model, which main application is the valuation of bond options, caps floors and swaptions to directly model the behavior of the Forward and not the own Spot.
• Heston: This model, typically applied to equity OTC options, assumes stochastic behavior of volatility. According to which, the volatility follows a process that reverts to a long-term level and is correlated with the underlying equity instrument. As opposed to local volatility models, in which the volatility evolves deterministically, the Heston model is more flexible, allowing it to be similar to that observed in the short term today.
• Libor market model: This model assumes that the dynamics of the interest rate curve can be modeled based on the set of forward contracts that compose the interest rate option. The correlation matrix is parameterized on the assumption that the correlation between any two forward contracts decreases at a constant rate, beta, (to the extent of the difference in their respective due dates. The input “Credit default volatility” is a volatility input of the credit factor dynamic. The multifactorial frame of this model makes it ideal for the valuation of instruments sensitive to the slope or curve, including interest rate option.
F-97
Adjustments to the valuation for risk of default
The credit valuation adjustments (“CVA”) and debit valuation adjustments (“DVA”) are a part of derivative instrument valuations, both financial assets and liabilities, to reflect the impact in the fair value of the credit risk of the counterparty and its own, respectively.
These adjustments are calculated by estimating Exposure At Default, Probability of Default and Loss Given Default, for all derivative products on any instrument at the legal entity level (all counterparties under a same ISDA / CMOF) in which BBVA has exposure.
As a general rule, the calculation of CVA is done through simulations of market and credit variables to calculate the expected positive exposure, given the Exposure at Default and multiplying the result by the Loss Given Default of the counterparty. Consequently, the DVA is calculated as the result of the expected negative exposure given the Exposure at Default and multiplying the result by the Loss Given Default of the counterparty. Both calculations are performed throughout the entire period of potential exposure.
The information needed to calculate the exposure at default and the loss given default come from the credit markets (Credit Default Swaps or iTraxx Indexes), where rating is available. For those cases where the rating is not available, BBVA implements a mapping process based on the sector, rating and geography to assign probabilities of both probability of default and loss given default, calibrated directly to market or with an adjustment market factor for the probability of default and the historical expected loss.
The amounts recognized in the Consolidated balance sheet as of June 30, 2016 related to the valuation adjustments to the credit assessment of the derivative asset as “Credit Valuation Adjustments” (“CVA”) and the derivative liabilities were -€238 million and €218 million respectively. The impact recorded under “Gains or (-) losses on financial assets and liabilities held for trading, net” in the consolidated income statement corresponding to the mentioned adjustments was a net impact of €17 and 16 million during the first semester of 2016 and 2015 respectively.
Financial assets and liabilities classified as Level 3
The changes in the balance of Level 3 financial assets and liabilities included in the accompanying consolidated balance sheets are as follows:
Millions of Euros
June 2016 December 2015
Assets Liabilities Assets Liabilities
Balance at the beginning 463 182 601 98
Group incorporations - - 148 -
Changes in fair value recognized in profit and loss (*) 21 (11) 124 (100)
Changes in fair value not recognized in profit and loss 144 1 27 (123)
Acquisitions, disposals and liquidations (44) 43 (510) 89
Net transfers to Level 3 8 (78) 145 -
Exchange differences and others 15 (41) (71) 219
Balance at the end 607 96 463 182
Financial Assets Level 3
Changes in the Period
(*) Profit or loss that is attributable to gains or losses relating to those financial assets and liabilities held as of June 30, 2016 and December 31, 2015. Valuation adjustments are recorded under the heading “Gains (losses) on financial assets and liabilities (net)”.
For the six months ended June 30, 2016, the profit/loss on sales of financial instruments classified as Level 3 recognized in the accompanying income statement was not material.
Transfers between levels
The Global Valuation Area, in collaboration with the Technology and Methodology Area, has established the rules for a proper financials assets held for trading classification according to the fair value hierarchy defined by international accounting standards.
On a monthly basis, any new assets added to the portfolio are classified, according to this criterion, by the accounting subsidiary. Then, there is a quarterly review of the portfolio in order to analyze the need for a change in classification of any of these assets.
F-98
The financial instruments transferred between the different levels of measurement in the first semester of 2016 are at the following amounts in the accompanying consolidated balance sheets as of June 30, 2016:
Financial liabilities held for trading 2 - - - - 78
Total 2 - - - - 78
Transfer Between LevelsLevel I Level 2 Level 3
The amount of financial instruments that were transferred between levels of valuation during the first semester of 2016 is not material relative to the total portfolios, basically corresponding to the above revisions of the classification between levels because these financial instruments had modified some of its features. Specifically:
• The transfers between Level 1 and 2 represents debt securities, which are either no longer listed on an active market (transfer from Level 1 to 2) or are just starting to be listed (transfer from Level 2 to 1).
• The transfers from Level 2 to Level 3 are due mainly to equity instruments and debt securities for which observable inputs are not available.
• The transfers from Level 3 to Level 2 are entirely in equity instruments, for which observable inputs are available.
Sensitivity Analysis
Sensitivity analysis is performed on financial instruments with significant unobservable inputs (financial instruments included in level 3), in order to obtain a reasonable range of possible alternative valuations. This analysis is carried out on a monthly basis, based on the criteria defined by the Global Valuation Area taking into account the nature of the methods used for the assessment and the reliability and availability of inputs and proxies used. In order to establish, with a sufficient degree of certainty, the valuating risk that is incurred in such assets without applying diversification criteria between them.
As of June 30, 2016, the effect on profit for the period and total equity of changing the main unobservable inputs used for the measurement of Level 3 financial instruments for other reasonably possible unobservable inputs, taking the highest (most favorable input) or lowest (least favorable input) value of the range deemed probable, would be as follows:
Millions of Euros
Financial Assets Level 3
Sensitivity Analysis
Most Favorable
Hypothesis
Least Favorable
Hypothesis
Most Favorable
Hypothesis
Least Favorable
Hypothesis
ASSETS
Financial assets held for trading
Debt securities 5 (10) - -
Equity instruments 5 (16) - -
Derivatives 11 (11) - -
Available-for-sale financial assets
Debt securities - - 4 (3)
LIABILITIES-
Financial liabilities held for trading - - - -
Total 21 (36) 4 (3)
Potential Impact on
Consolidated Income Statement Potential Impact on Total Equity
F-99
8.1.2 Fair value of financial instruments carried at cost
The valuation technique used to calculate the fair value of financial assets and liabilities carried at cost are presented below:
• The fair value of "Cash and cash balances at central banks and other demand deposits" approximates their book value, as it is mainly short-term balances.
• The fair value of the "Loans and receivables" and "financial liabilities at amortized cost" was estimated using the method of discounted expected future cash flows using market interest rates at the end of each year. Additionally, factors such as prepayment rates and correlations of default are taken into account.
The following table presents the fair value of key financial instruments carried at amortized cost in the accompanying consolidated balance sheets, broken down according to the method of valuation used for the estimation:
Millions of Euros
June 2016 December 2015
Level 1 Level 2 Level 3 Level 1 Level 2 Level 3
ASSETS-
Cash and cash balances at central banks9 24,862 - 264 28,961 - 322
Loans and receivables 13 15,486 8,548 449,883 17,830 7,681 455,029
The main valuation techniques and inputs used to estimate the fair value of financial instruments accounted for at cost and classified in levels 2 and 3 is shown below. These are broken down by type of financial instrument and the balances correspond to those as of June 30, 2016:
Financial Instruments
Level 2
Fair Value
(Millions of
euros)
Valuation technique(s) Unobservable inputs
Loans and receivables
Debt securities 8,548
Financial Instruments
Level 3
Fair Value
(Millions of
euros)
Valuation technique(s) Unobservable inputs
Loans and receivables
Loans and advances to credit institutions 33,062
Loans and advances to customers 415,469
Debt securities 1,352
Financial liabilities at amortized cost
Deposits from central banks 32,662
Deposits from credit institutions 69,387
Customer deposits 406,178
Debt certificates 79,359
Other financial liabilities 14,273
- Credit spread
- Interest rates
Present-value method
(Discounted future cash flows)
- Credit spread
- Prepayment rates
- Market interest rates
Present-value method
(Discounted future cash flows)
- Credit spread
- Prepayment rates
- Market interest rates
Present-value method
(Discounted future cash flows)
F-100
Financial instruments at cost
As of June 30, 2016 and December 31, 2015, there were equity instruments and certain discretionary profit-sharing arrangements in some entities which were recognized at cost in the Group’s consolidated balance sheets because their fair value could not be reliably determined, as they were not traded in organized markets and reliable unobservable inputs are not available. On the above dates, the balances of these financial instruments recognized in the portfolio of available-for-sale financial assets amounted to €578 million and €600 million, respectively.
The table below outlines the financial instruments carried at cost that were sold in the six months period ended June 30, 2016 and 2015:
Millions of Euros
Sales of Financial Instruments at CostJune
2016
December
2015
Amount of Sale (A) 6 33Carrying Amount at Sale Date (B) 4 22
Gains/Losses (A-B) 1 11
8.2 Assets measured at fair value on a non-recurring basis
As indicated in Note 2.2.4, non-current assets held for sale are measured at the lower of their fair value less costs to sell and its carrying amount. As of June 30, 2016 nearly the entire book value of the non-current assets held for sale from foreclosures or recoveries approximate their fair value (see Note 16).The global valuation of the portfolio of assets has been carried out using a statistical methodology based on real estate and local macroeconomic variables.
Real estate properties have been appraised individually considering a hypothetical stand-alone sale and not as part of a real estate portfolio type of sale.
The portfolio of assets held for sale by type of asset as of June 30, 2016 and December 2015 is provided below by hierarchy of fair value measurements:
Millions of Euros
June 2016 December 2015
Level 2 Level 3 Total Level 2 Level 3 Total
Non-current assets and disposal groups classif ied as held for sale
Housing 1,875 335 2,210 2,192 98 2,291
Offices, warehouses and other 480 103 583 353 53 406
Land 9 127 136 12 236 248
TOTAL 2,364 565 2,929 2,557 388 2,945
Fair Value at Non-current assets and
disposal groups classified as held for sale
by levels
Since the amount classified in Level 3 (€565 million) is not significant compared to the total consolidated assets and that the inputs used in the valuation are very diverse depending on the type and geographic location, they have not been disclosed.
F-101
9. Cash and cash balances at centrals and banks and other demands deposits
The breakdown of the balance under the headings “Cash and cash balances at central banks and other demands deposits” and "Financial liabilities at amortized cost – Deposits from central banks" in the accompanying consolidated balance sheets is as follows:
Millions of Euros
Cash and cash balances at central banksJune
2016
December
2015
Cash on hand 6,261 7,192
Cash balances at central banks 14,692 18,445
Other demand deposits 4,173 3,646
Total 25,127 29,282
Millions of Euros
Financial liabilities measured at amortised cost
Deposits from Central BanksNotes
June
2016
December
2015
Deposits from Central Banks (*) 30,073 20,956Repurchase agreements 35 2,583 19,065
Accrued interest until expiration 53 66Total 22 32,709 40,087
* It is explained by participation in TLTRO program (See Note 7.5).
10. Financial assets and liabilities held for trading
10.1 Breakdown of the balance
The breakdown of the balance under these headings in the accompanying consolidated balance sheets is as follows:
Millions of Euros
Financial Assets and Liabilities Held-for-TradingJune
Short positions 12,145 13,053Total Liabilities 58,753 55,203
F-102
10.2 Debt securities
The breakdown by type of issuer of the balance under this heading in the accompanying consolidated balance sheets is as follows:
Millions of Euros
Financial Assets Held-for-Trading
Debt securities by issuer
June
2016
December
2015
Issued by Central Banks 359 214
Spanish government bonds 7,945 7,419
Foreign government bonds 22,196 21,821Issued by Spanish financial institutions 255 328
Issued by foreign financial institutions 1,671 1,438
Other debt securities 1,625 1,606Total 34,051 32,825
10.3 Equity instruments
The breakdown of the balance under this heading in the accompanying consolidated balance sheets is as follows:
Millions of Euros
Financial Assets Held-for-Trading
Equity instruments by Issuer
June
2016
December
2015
Shares of Spanish companies
Credit institutions 672 804
Other sectors 888 1,234Subtotal 1,560 2,038
Shares of foreign companies
Credit institutions 79 255
Other sectors 2,166 2,241Subtotal 2,245 2,497
Total 3,805 4,534
F-103
10.4 Derivatives
The derivatives portfolio arises from the Group’s need to manage the risks it is exposed to in the normal course of business and also to market products amongst the Group’s customers. As of June 30, 2016 and December 31, 2015, trading derivatives were mainly contracted in over-the-counter (OTC) markets, with counterparties which are mainly foreign credit institutions, and related to foreign-exchange, interest-rate and equity risk.
Below is a breakdown of the net positions by transaction type of the fair value and notional amounts of derivatives recognized in the accompanying consolidated balance sheets, divided into organized and OTC markets:
Millions of Euros
Derivatives by type of risk / by product or
by type of market - June 2016Assets Liabilities
Notional amount -
Total
Interest rate 31,950 31,412 1,374,957
OTC options 4,175 4,234 214,907
OTC other 27,775 27,178 1,136,614
Organized market options - - -
Organized market other - - 23,436
Equity 2,557 1,981 98,401
OTC options 1,031 729 50,162
OTC other 107 128 3,999
Organized market options 1,418 1,124 41,109
Organized market other 1 - 3,131
Foreign exchange and gold 11,581 12,722 438,370
OTC options 404 477 38,202
OTC other 11,162 12,222 397,309
Organized market options 1 - 117
Organized market other 14 24 2,742
Credit 449 468 37,178
Credit default swap 436 436 33,201
Credit spread option 1 - 700
Total return swap - 32 1,791
Other 12 - 1,486
Commodities 15 15 48
Other 27 10 1,071
DERIVATIVES 46,579 46,609 1,950,026
of which: OTC - credit institutions 29,926 32,547 940,593
of which: OTC - other financial corporations 7,913 8,404 775,133
of which: OTC - other 7,302 4,506 163,755
F-104
Millions of Euros
Derivatives by type of risk / by product or
by type of market - December 2015Assets Liabilities
Notional amount -
Total
Interest rate 22,425 23,152 1,289,986
OTC options 3,291 3,367 208,175
OTC other 19,134 19,785 1,069,909
Organized market options - - -
Organized market other - - 11,902
Equity 3,223 3,142 108,108
OTC options 1,673 2,119 65,951
OTC other 112 106 4,535
Organized market options 1,437 918 34,475
Organized market other 1 - 3,147
Foreign exchange and gold 14,706 15,367 439,546
OTC options 387 458 41,706
OTC other 14,305 14,894 395,327
Organized market options 1 - 109
Organized market other 13 16 2,404
Credit 500 441 33,939
Credit default swap 436 412 30,283
Credit spread option - - 300
Total return swap - 28 1,831
Other 64 - 1,526
Commodities 31 37 118
Other 16 10 675
DERIVATIVES 40,902 42,149 1,872,373
of which: OTC - credit institutions 23,385 28,343 974,604
of which: OTC - other financial corporations 9,938 8,690 688,880
of which: OTC - other 6,122 4,177 156,828
F-105
11. Financial assets and liabilities designated at fair value through profit or loss
The breakdown of the balance under these headings in the accompanying consolidated balance sheets is as follows:
Millions of Euros
Financial assets and liabilities designated at fair
value through profit or loss
June
2016
December
2015
ASSETS-
Loans and advances to credit institutions - 62
Debt securities 161 173
Unit-linked products 144 163
Other securities 17 9
Equity instruments 1,988 2,075
Unit-linked products 1,858 1,960
Other securities 130 115
Total Assets 2,148 2,311
LIABILITIES-
Customer deposits - -
Other financial liabilities 2,501 2,649
Unit-linked products 2,501 2,649
Total Liabilities 2,501 2,649
As of June 30, 2016 and December 31, 2015 the most significant balances within financial assets and liabilities designated at fair value through profit or loss related to assets and liabilities linked to insurance products where the policyholder bears the risk ("Unit-Link"). This type of product is sold only in Spain, through BBVA Seguros SA, insurance and reinsurance and in Mexico through Seguros Bancomer S.A. de CV.
Since the liabilities linked to insurance products in which the policyholder assumes the risk are valued the same way as the assets associated to these insurance products, there is no credit risk component borne by the Group in relation to these liabilities.
The breakdown of the balance by the main financial instruments in the accompanying consolidated balance sheets is as follows:
Millions of Euros
Available-for-Sale Financial AssetsJune
2016
December
2015
Debt securities 86,343 108,448
Impairment losses (182) (139)
Subtotal 86,161 108,310
Equity instruments 4,683 5,262
Impairment losses (206) (146)
Subtotal 4,477 5,116
Total 90,638 113,426
The amount of "Available for sale financial assets - debt securities" decreases in the first semester of 2016, mainly due to the reclassification of certain debt securities to "Held to maturity investments", corresponding mostly to Government Bonds (see note 14).
F-106
12.2 Debt securities
The breakdown of the balance under the heading “Debt securities” of the accompanying financial statements, broken down by the nature of the financial instruments, is as follows:
Millions of Euros
Available-for-sale financial assets
Debt Securities
June 2016
Amortized
Cost (*)
Unrealized
Gains
Unrealized
Losses
Book
Value
Domestic Debt Securities
Spanish Government and other government agency debt securities 29,102 1,135 (11) 30,226Other debt securities 2,832 113 (20) 2,925
Issued by Central Banks - - - -Issued by credit institutions 1,357 63 - 1,419Issued by other issuers 1,476 50 (20) 1,506
Subtotal 31,934 1,248 (31) 33,151
Foreign Debt Securities
Mexico 11,577 279 (149) 11,706
Mexican Government and other government agency debt securities 9,597 232 (80) 9,748Other debt securities 1,980 47 (69) 1,958
Issued by Central Banks - - - -Issued by credit institutions 86 4 - 90Issued by other issuers 1,894 43 (69) 1,867
The United States 14,952 125 (182) 14,895
Government securities 7,391 60 (14) 7,436
US Treasury and other US Government agencies 1,288 12 (4) 1,296
States and political subdivisions 6,103 47 (10) 6,140Other debt securities 7,562 65 (168) 7,459
Issued by Central Banks - - - -Issued by credit institutions 79 1 - 80Issued by other issuers 7,483 64 (168) 7,379
Turkey 6,269 137 (81) 6,325
Turkey Government and other government agency debt securities 5,732 130 (74) 5,788
Other debt securities 537 7 (7) 537Issued by Central Banks - - - -Issued by credit institutions 475 6 (6) 476Issued by other issuers 61 1 (1) 61
Other countries 19,551 848 (314) 20,085
Other foreign governments and other government agency debt securities 7,121 551 (84) 7,588
Other debt securities 12,430 297 (230) 12,497Issued by Central Banks 1,911 1 - 1,912Issued by credit institutions 3,290 137 (78) 3,348Issued by other issuers 7,229 159 (151) 7,237
Subtotal 52,349 1,389 (727) 53,011
Total 84,283 2,637 (758) 86,162
(*) The amortized cost includes portfolio gains/losses linked to insurance contracts in which the policyholder assumes the risk in case of redemption.
F-107
Millions of Euros
Available-for-sale financial assets
Debt Securities
December 2015
Amortized
Cost (*)
Unrealized
Gains
Unrealized
Losses
Book
Value
Domestic Debt Securities
Spanish Government and other government agency
debt securities 38,763 2,078 (41) 40,799
Other debt securities 4,737 144 (11) 4,869
Issued by Central Banks - - - -Issued by credit institutions 2,702 94 - 2,795Issued by other issuers 2,035 50 (11) 2,074
Subtotal 43,500 2,221 (53) 45,668
Foreign Debt Securities
Mexico 12,627 73 (235) 12,465
Mexican Government and other government agency debt securities 10,284 70 (160) 10,193Other debt securities 2,343 4 (75) 2,272
Issued by Central Banks - - - -Issued by credit institutions 260 1 (7) 254Issued by other issuers 2,084 3 (68) 2,019
The United States 13,890 63 (236) 13,717
Government securities 6,817 13 (41) 6,789US Treasury and other US Government agencies 2,188 4 (15) 2,177States and political subdivisions 4,629 9 (26) 4,612
Other debt securities 7,073 50 (195) 6,927Issued by Central Banks - - - -Issued by credit institutions 71 5 (1) 75Issued by other issuers 7,002 45 (194) 6,852
Turkey 13,414 116 (265) 13,265
Turkey Government and other government agency debt securities 11,801 111 (231) 11,682
Other debt securities 1,613 4 (34) 1,584Issued by Central Banks - - - -Issued by credit institutions 1,452 3 (30) 1,425Issued by other issuers 162 1 (4) 159
Without rating 2,670 3.10% 2,789 2.57%Total 86,161 100.0% 108,310 100.0%
June 2016 December 2015
12.3 Equity instruments
The breakdown of the balance under the heading "Equity instruments" of the accompanying financial statements as of June 30, 2016 and December 31, 2015 is as follows:
Millions of Euros
Available-for-sale financial assets
Equity Instruments
June 2016
Amortized
Cost
Unrealized
Gains
Unrealized
Losses
Book
Value
Equity instruments listed
Listed Spanish company shares 3,390 2 (1,070) 2,323
Credit institutions - - - -
Other entities 3,390 2 (1,070) 2,323
Listed foreign company shares 1,103 300 (50) 1,354
United States 549 5 - 554Mexico 1 - - 1Turkey 21 13 (6) 27Other countries 130 91 (1) 220
Subtotal 775 113 (8) 880
Total 5,204 522 (610) 5,116
12.4 Gains/losses
The changes in the gains/losses, net of taxes, recognized under the equity heading “Accumulated other comprehensive income – Items that may be reclassified to profit or loss- Available-for-sale financial assets” in the accompanying consolidated balance sheets are as follows:
Millions of Euros
Accumulated other comprehensive income-Items that may be reclassified
to profit or loss-
Available-for-Sale Financial Assets
June
2016
June
2015
Balance at the beginning 1,674 3,816
Valuation gains and losses 418 (1,003)Income tax (5) 610
Amounts transferred to income (401) (1,202)
Other reclassifications - 7Balance at the end 1,686 2,228
Of which:
Debt securities 2,229 1,747
Equity instruments (543) 481
During the first semester 2016, the losses recognized for certain Debt securities from Brazil and Colombia in the heading “Impairment or reversal of impairment on financial assets not measured at fair value through profit or loss- Available- for-sale financial assets” in the accompanying consolidated income statement amounted to €125 million (Note 47). In the first semester of 2015 the impairment was €2 million.
F-110
For the rest of debt securities, the 84.3% of the unrealized losses recognized under the heading "Accumulated other comprehensive income - Items that may be reclassified to profit or loss– Available-for-sale financial assets” and originating in debt securities were generated over more than twelve months. However, no impairment was recognized, as following an analysis of these unrealized losses we concluded that they were temporary due to the following reasons: the interest payment dates of all the fixed-income securities have been satisfied; and because there is no evidence that the issuer will not continue to meet its payment obligations, nor that future payments of both principal and interest will not be sufficient to recover the cost of the debt securities.
The losses recognized, for equity instruments Available-for-Sale, under the heading “Impairment or reversal of impairment on financial assets not measured at fair value through profit or loss - Available- for-sale financial assets” in the accompanying consolidated income statement amounted to €8 and €1 million in the first semester of 2016 and 2015 respectively (see Note 47).
As of June 30, the Group has analyzed the unrealized losses recognized under the heading “Accumulated other comprehensive income - Items that may be reclassified to profit or loss– Available-for-sale financial assets” resulting from equity instruments generated over a period of more than 12 months and with a fall of more 20% in their price, as a first approximation to the existence of possible impairment. As of 30 June, 2016, the unrealized losses recognized under the heading “Accumulated other comprehensive income - Items that may be reclassified to profit or loss– Available-for-sale financial assets” resulting from equity instruments generated over a period of more than 18 months or with a fall of more 40% in their price are not significant.
13. Loans and receivables
The breakdown of the balance under this heading in the accompanying consolidated balance sheets, according to the nature of the financial instrument, is as follows:
Millions of Euros
Loans and Receivables NotesJune
2016
December
2015
Loans and advances to central banks 13.1 14,313 17,830
Loans and advances to credit institutions 13.1 29,290 29,317
Loans and advances to customers 13.2 415,872 414,165
Debt securities 13.3 11,068 10,516
Total 470,543 471,828
13.1 Loans and advances to credit institutions
The breakdown of the balance under this heading in the accompanying consolidated balance sheets, according to their nature, is as follows:
Millions of Euros
Loans and Advances to Central Banks and Credit
InstitutionsNotes
June
2016
December
2015
Loans and advances to central banks 14,294 17,821
Loans and advances to credit institutions 29,265 29,301
Deposits with agreed maturity 6,405 6,732
Other accounts 12,513 10,820
Reverse repurchase agreements 35 10,347 11,749
Total gross 7.3.1 43,559 47,122
Valuation adjustments 44 24
Impairment losses 7.3.4 (43) (51)
Accrued interests and fees 87 75
Derivatives – Hedge accounting and others - -
Total net 43,603 47,146
F-111
13.2 Loans and advances to customers
The breakdown of the balance under this heading in the accompanying consolidated balance sheets, according to their nature, is as follows:
Millions of Euros
Loans and Advances to Customers NotesJune
2016
December
2015
Mortgage secured loans 143,328 144,203
Operating assets mortgage loans 9,246 6,813
Home mortgages 118,197 120,164
Rest of mortgages 15,885 17,226
Other loans secured with security interest 59,824 57,041
Cash guarantees 1,420 479
Secured loan (pledged securities) 759 734
Rest of secured loans (*) 57,645 55,828
Unsecured loans 134,550 137,322
Credit lines 13,740 13,758
Commercial credit 13,582 13,434
Receivable on demand and other 10,670 9,226
Credit cards 15,098 15,360
Finance leases 9,146 9,032
Reverse repurchase agreements 35 5,641 5,036
Financial paper 1,028 1,063
Impaired assets 7.3.4 24,212 25,333
Total gross 430,819 430,808
Valuation adjustments (14,948) (16,643)
Impairment losses 7.3.4 (17,396) (18,691)
Derivatives – Hedge accounting and others 1,428 1,199
Rest of valuation adjustments 1,020 849
Total net 415,872 414,165
(*) Includes loans with cash collateral, other financial assets with partial collateral.
For the six months ended June 30, 2016, 33% of "Loans and advances to customers" with maturity greater than one year have fixed-interest rates and 67% have variable interest rates.
F-112
The heading “Loans and receivables – Loans and advances to customers” in the accompanying consolidated balance sheets also includes certain secured loans that, as mentioned in Appendix IX and pursuant to the Mortgage Market Act, are linked to long-term mortgage-covered bonds. This heading also includes some loans that have been securitized. The balances recognized in the accompanying consolidated balance sheets corresponding to these securitized loans are as follows:
Millions of Euros
Securitized LoansJune
2016
December
2015
Securitized mortgage assets 28,889 28,955
Other securitized assets 3,488 3,666
Commercial and industrial loans 1,047 751
Finance leases 125 154
Loans to individuals 1,936 2,067
Other 381 694
Total 32,377 32,621
Of which:
Liabilities associated to assets retained on the balance sheet (*) 6,297 7,619
(*) These liabilities are recognized under "Financial liabilities at amortized cost - Debt securities" in the accompanying consolidated balance sheets (Note 22.3).
13.3 Debt securities
The breakdown of the balance under this heading in the accompanying consolidated balance sheets, according to the issuer of the debt security, is as follows:
Millions of Euros
Debt securities NotesJune
2016
December
2015
Government 4,152 3,275
Credit institutions 122 125
Other sectors (*) 6,812 7,126
Total gross 7.3.1 11,086 10,526
Impairment losses (18) (10)
Total net 11,068 10,516
For the six months ended June 30, 2016 some debt securities were reclassified from "Available-for-sale financial assets" to “Loans and receivables-Debt securities”.
The following table shows the fair value and carrying amounts of these reclassified financial assets:
Millions of Euros
Debt Securities reclassified to "Loans and
receivables" from "Available-for-sale financial
assets"
Carrying Amount Fair Value Carrying Amount Fair Value
BBVA S.A. 862 862 843 858
Total 862 862 843 858
As of Reclassification date As of June 30, 2016
The following table presents the amount recognized in the first semester 2016 income statement from the valuation at amortized cost of the reclassified financial assets, as well as the impact recognized on the income
F-113
statement and under the heading “Total Equity - Accumulated other comprehensive income”, as of June 30, 2016, if the reclassification was not performed.
Millions of Euros
Recognized in Effect of not Reclassifying
Effect on Income Statement and Other
Comprehensive Income
Income
StatementIncome Statement
Equity
"Valuation
Adjustments"
BBVA S.A. 10 10 9
Total 10 10 9
14. Held-to-maturity investments
The breakdown of the balance under this heading in the accompanying consolidated balance sheets, according to the according to the issuer of the financial instrument, is as follows:
Millions of Euros
Held-to-Maturity Investments (*)June
2016
Domestic Debt Securities
Spanish Government and other government agency debt securities 9,227
Other Domestic Securities 672
Credit institutions 527
Other resident 157
Valuation adjustments (12)
Subtotal 9,899
Foreign Debt Securities
Government and other government agency debt securities 8,358
Others securities 1,038
Credit institutions 975
Other non resident 63
Subtotal 9,396
Total 19,295
(*) As of December, 2015 the Group BBVA has not registered any balances in this heading.
For the six months ended June 30, 2016, some debt securities were reclassified from "Available-for-sale financial assets" to “Held-to-maturity investments”. This reclassification has been carried out once past the two-year penalty established in IAS-39 standard (penalization which meant not being able to keep maturity portfolio due to the significant sales that occurred in the year 2013) and since the intention the Group regarding how to manage such securities, is held to maturity.
F-114
As of June 30, 2016, the credit ratings of the issuers of debt securities classified as held-to-maturity investments were as follows:
The fair value carrying amount of these financials asset on the date of the reclassification becomes its new amortized cost. The previous gain on that asset that has been recognized in “Accumulated other comprehensive income – Items that may be reclassified to profit or loss - Available for sale financial assets” is amortized to profit or loss over the remaining life of the held-to-maturity investment using the effective interest method. Any difference between the new amortized cost and maturity amount is also amortized over the remaining life of the financial asset using the effective interest method, similar to the amortization of a premium and a discount. This reclassification was triggered by a change in the Group´s strategy regarding the management of these securities.
The following table presents the amount recognized in the 2016 income statement from the valuation at amortized cost of the reclassified financial assets, as well as the impact recognized on the income statement and under the heading “Total Equity - Accumulated other comprehensive income”, as of June 30, 2016, if the reclassification was not performed.
Millions of Euros
Ef fect o f no t R eclassifying
Effect on Income Statement and
Other Comprehensive Income
Income
StatementIncome Statement
Equity
"Accumulated other
comprehensive
BBVA S.A. 105 105 (39)
TURKIYE GARANTI BANKASI A.S 182 182 169
Total 287 287 130
R eco gnized in
F-115
15. Derivatives hedge accounting and fair value changes of the hedged items in portfolio hedge of interest rate risk
The balance of these headings in the accompanying consolidated balance sheets is as follows:
Millions of Euros
Derivatives – Hedge accounting and fair value
changes of the hedged items in portfolio hedge of
interest rate risk
June
2016
December
2015
ASSETS-
Derivatives – Hedge accounting 3,628 3,538
LIABILITIES-
Derivatives – Hedge accounting 3,280 2,726
As of June, 2016 and December 2015, the main positions hedged by the Group and the derivatives designated to hedge those positions were:
• Fair value hedging:
– Available-for-sale fixed-interest debt securities: The interest rate risk of these securities is hedged using interest rate derivatives (fixed-variable swaps).
– Long-term fixed-interest debt securities issued by the Bank: the interest rate risk of these securities is hedged using interest rate derivatives (fixed-variable swaps).
– Fixed-interest loans: The equity price risk of these instruments is hedged using interest rate derivatives (fixed-variable swaps).
– Fixed-interest deposit portfolio hedges: in order to provide stability to net interest income and to protect the economic value of the balance sheet from interest rate fluctuations, hedging of cash flow and fair value portfolio hedges are put in place.
• Cash-flow hedges: Most of the hedged items are floating interest-rate loans and asset hedges linked to the inflation of the available for sale portfolio. This risk is hedged using foreign-exchange, interest-rate swaps, inflation and FRA’s (“Forward Rate Agreement”).
• Net foreign-currency investment hedges: The risks hedged are foreign-currency investments in the Group’s foreign subsidiaries. This risk is hedged mainly with foreign-exchange options and forward currency purchases.
Note 7 analyze the Group’s main risks that are hedged using these derivatives.
F-116
The details of the net positions by hedged risk of the fair value of the hedging derivatives recognized in the accompanying consolidated balance sheets are as follows:
Millions of Euros
Derivatives - Hedge accounting
Breakdown by type of risk and type of hedge
June 2016
Assets LiabilitiesNotional amount -
Total hedging
Interest rate 1,585 1,560 56,663
OTC options 319 319 1,716OTC other 1,267 1,241 54,948Organized market options - - -Organized market other - - -
Equity 5 65 1,926
OTC options - 64 727
OTC other 5 1 1,198
Organized market options - - -
Organized market other - - -
Foreign exchange and gold 904 522 3,127
OTC options - - 1
OTC other 904 522 3,126
Organized market options - - -
Organized market other - - -
Credit - - -
OTC options - - -
OTC other - - -
Organized market options - - -
Organized market other - - -
Commodities - - -
Other - - -
FAIR VALUE HEDGES 2,495 2,147 61,716
Interest rate 234 329 14,522
OTC options - - -
OTC other 232 329 14,212
Organized market options - - -
Organized market other 1 - 310
Equity - - -
OTC options - - -
OTC other - - -
Organized market options - - -
Organized market other - - -
Foreign exchange and gold 146 54 4,950
OTC options 68 27 3,096
OTC other 79 28 1,853Organized market options - - -Organized market other - - -
Credit - - -
OTC options - - -
OTC other - - -
Organized market options - - -
Organized market other - - -
Commodities - - -
Other - - -
CASH FLOW HEDGES 380 383 19,472
HEDGE OF NET INVESTMENTS IN A FOREIGN
OPERATION 185 125
PORTFOLIO FAIR VALUE HEDGES OF INTEREST
RATE RISK 523 368 15,329
PORTFOLIO CASH FLOW HEDGES OF INTEREST
RATE RISK 46 257 2,345
DERIVATIVES-HEDGE ACCOUNTING 3,628 3,280 98,861
of which: OTC - credit institutions 3,409 2,971 45,517
of which: OTC - other financial corporations 201 222 49,605
of which: OTC - other 16 86 3,429
F-117
Millions of Euros
Derivatives - Hedge accounting
Breakdown by type of risk and type of hedge
December 2015
Assets LiabilitiesNotional amount
- Total hedging
Interest rate 1,660 875 55,767
OTC options 187 128 1,390OTC other 1,473 747 54,377Organized market options - - -Organized market other - - -
Equity 12 74 2,500
OTC options - 72 791
OTC other 12 2 1,709
Organized market options - - -
Organized market other - - -
Foreign exchange and gold 675 389 3,335
OTC options - - 1OTC other 675 388 3,334Organized market options - - -Organized market other - - -
Credit - - -
Commodities - - -
Other - - -
FAIR VALUE HEDGES 2,347 1,337 61,602
Interest rate 204 319 13,593
OTC options - - -
OTC other 204 318 13,329Organized market options - - -Organized market other - 1 264
Equity - - -
Foreign exchange and gold 242 34 2,382
OTC options 42 12 1,493
OTC other 200 22 889
Organized market options - - -
Organized market other - - -
Credit - - -
Commodities - - -
Other - - -
CASH FLOW HEDGES 446 353 15,974
HEDGE OF NET INVESTMENTS IN A FOREIGN
OPERATION 47 304
PORTFOLIO FAIR VALUE HEDGES OF INTEREST RATE
RISK 697 732 17,919
PORTFOLIO CASH FLOW HEDGES OF INTEREST RATE
RISK - - -
DERIVATIVES-HEDGE ACCOUNTING 3,538 2,726 100,858
of which: OTC - credit institutions 3,413 2,366 49,776
of which: OTC - other financial corporations 95 256 47,881
of which: OTC - other 29 103 2,936
The cash flows forecasts for the coming years for cash flow hedging recognized on the accompanying consolidated balance sheet as of June 30, 2016 are:
Millions of Euros
Cash Flows of Hedging Instruments3 Months or
Less
From 3 Months
to 1 Year
From 1 to 5
Years
More than 5
YearsTotal
Receivable cash inflows 88 1,346 1,487 971 3,892
Payable cash outflows 55 1,148 1,485 1,028 3,717
The above cash flows will have an impact on the Group’s consolidated income statements until 2050.
During the six months ended June 30, 2016 and 2015 there was no reclassification in the accompanying consolidated income statements of any amount corresponding to cash flow hedges that was previously recognized in equity.
The amount for derivatives designated as accounting hedges that did not pass the effectiveness test during the six months ended June 30, 2016 and 2015 was not material.
F-118
16. Investments in subsidiaries, joint ventures and associates
16.1 Associates and joint venture entities
The breakdown of the balance of “Investments in joint ventures and associates” (see note 2.1) in the accompanying consolidated balance sheets is as follows:
Millions of Euros
Associates Entities and joint ventures.
Breakdown by entities
June
2016
December
2015
Joint ventures
Fideicomiso 1729 invex enajenacion de cartera 60 66
Fideicomiso F 403853 5 BBVA Bancomer ser.zibata 36 44
PSA Finance Argentina compañia financiera S.A. 18 23
Other joint ventures 87 111
Subtotal 201 243
Associates Entities
Metrovacesa, S.A. 488 351
Metrovacesa Suelo y Promoción, S.A. 208 -
Atom Bank PLC 53 -
Brunara SICAV, S.A. 52 54
Servired Sociedad Española de Medios de Pago, S.A 9 92
Other associates 120 139
Subtotal 929 636
Total 1,131 879
Details of the joint ventures and associates of June 30, 2016 are shown in Appendix II.
The following is a summary of the changes in the six months ended June 30, 2016 and as of December 31, 2015 under this heading in the accompanying consolidated balance sheets:
Millions of Euros
Associates Entities and joint ventures.
Changes in the Year
June
2016
June
2015
Balance at the beginning 879 4,509
Acquisitions and capital increases 418 407
Disposals and capital reductions (28) (6)
Transfers and changes of consolidation method (7) (2)
Share of profit and loss (Note 38) 1 195
Exchange differences (22) (210)
Dividends, valuation adjustments and others (110) (233)Balance at the end 1,131 4,660
The changes in the six months ended June 30, 2016, are mainly as result of the capital increase of Metrovacesa in February 2016 in which the Group subscribed through debt capitalization and property granting; and through a subsequent Split in March 2016 of Metrovacesa Suelo y Promoción, S.A..
Appendix III provides notifications on acquisitions and disposals of holdings in subsidiaries, joint ventures and associates, in compliance with Article 155 of the Corporations Act and Article 53 of the Securities Market Act 24/1988
16.2 Other information about associates and joint ventures
If these entities had been consolidated rather than accounted for using the equity method, the change in each of the lines of balance sheet and the consolidated income statement would not be significant.
As of June 30, 2016 there was no financial support agreement or other contractual commitment to associates and joint ventures entities from the holding or the subsidiaries that are not recognized in the financial statements (see Note 53.2).
As of June 30, 2016 there was no contingent liability in connection with the investments in joint ventures and associates (see Note 53.2).
F-119
16.3 Impairment
As described in IAS 36, when there is indicator of impairment, the book value of the associates and joint venture entities should be compared with their recoverable amount, being the latter calculated as the higher between the value in use and the fair value minus the cost of sale. As of June 30, 2016 and 2015, there was no significant impairments recognized.
F-120
17. Tangible assets
The breakdown of the balance and changes of this heading in the accompanying consolidated balance sheets, according to the nature of the related items, is as follows:
Millions of Euros
Tangible Assets. Breakdown by Type of Asset
Cost Value, Amortizations and impairments
June
2016
December
2015
Property plant and equipment
For own use
Land and Buildings 5,872 5,858
Work in Progress 326 545
Furniture, Fixtures and Vehicles 7,505 7,628
Accumulated depreciation (5,758) (5,654)
Impairment (350) (354)
Subtotal 7,595 8,021
Leased out under an operating lease
Assets leased out under an operating lease 939 668
Accumulated depreciation (223) (202)
Impairment (11) (10)
Subtotal 705 456
Subtotal 8,300 8,477
Investment property
Building rental 1,874 2,013
Other 313 378
Accumulated depreciation (115) (116)
Impairment (756) (808)
Subtotal 1,317 1,467
Total 9,617 9,944
The main activity of the Group is carried out through a network of bank branches located geographically as shown in the following table:
Number of Branches
Branches by Geographical LocationJune
2016
December
2015
Spain 3,788 3,811
Mexico 1,821 1,818
South America 1,673 1,684
The United States 677 669
Turkey 1,146 1,109
Rest of Eurasia 48 54
Total 9,153 9,145
The following table shows the detail of the net carrying amount of the tangible assets corresponding to Spanish and foreign subsidiaries as of June 30, 2016 and December 31, 2015:
Millions of Euros
Tangible Assets by Spanish and Foreign Subsidiaries
Net Assets Values
June
2016
December
2015
BBVA and Spanish subsidiaries 4,459 4,584
Foreign subsidiaries 5,159 5,360
Total 9,617 9,944
F-121
18. Intangible assets
18.1 Goodwill
The breakdown of the balance under this heading in the accompanying consolidated balance sheets, according to the cash-generating units (CGUs), is as follows:
Millions of Euros
Breakdown by CGU and Changes during
the first semester of 2016
Balance at the
BeginningAdditions (*)
Exchange
DifferencesImpairment Other
Balance
at the End
United States 5,328 - (103) - - 5,225
Mexico 602 - (50) - - 552
Colombia 176 - 10 - - 186
Chile 62 - 3 - - 65
Turkey 622 - (6) - 2 618
Other 20 8 - - - 27
Total 6,811 8 (146) - 2 6,674
(*) Corresponding to the acquisition of the entity “Holvi Payment Service OY”.
Millions of Euros
Goodwill. Breakdown by CGU and
Changes of the year 2015
Balance at the
Beginning Additions
Exchange
DifferenceImpairment Rest
Balance at the
End
The United States 4,767 12 549 - - 5,328
Turkey - 672 (50) - - 622
Mexico 638 - (35) - - 602
Colombia 208 - (31) - - 176
Chile 65 - (3) - - 62
Rest 20 - (1) - - 20
Total 5,697 684 429 - - 6,811
Millions of Euros
Breakdown by CGU and Changes during
the first semester of 2015
Balance at the
BeginningAdditions (*)
Exchange
DifferencesImpairment Other
Balance
at the End
The United States 4,767 12 406 - - 5,184
Mexico 638 - 12 - - 650
Colombia 208 - 1 - - 209
Chile 65 - 2 - - 68
Other 20 - - - - 20
Total 5,697 12 421 - - 6,130
(*) Corresponding to the acquisition of the entity “4D Internet Solutions Inc.” also knows as “Spring Studio”.
Impairment Test
As described in Note 2.2.8, the cash-generating units (CGUs) to which goodwill has been allocated are periodically tested for impairment by including the allocated goodwill in their carrying amount. This analysis is performed at least annually and whenever there is any indication of impairment.
As of June 30, 2016 and 2015, no indicators of impairment have been identified in any of the main CGUs.
F-122
Goodwill in business combinations 2015
Catalunya Banc
As stated in Note 3, in the six month ended June 30, 2015 the Group acquired 98.4% of the share capital of the Catalunya Banc.
Shown below are details of the carrying amount of the consolidated assets and liabilities of Catalunya Banc prior to its acquisition and the corresponding fair values, gross of tax, which have been estimated in accordance with the IFRS-3 acquisition method.
Valuation and calculation of badwill for the acquisition of stake in
Catalunya Banc
Carrying
AmountFair Value
Acquisition cost (A) - 1,165
Cash on hand 616 616
Financial assets held for trading 341 341
Available-for-sale financial assets 1,845 1,853
Loans and receivables 37,509 36,766
Held-to-maturity investments (*) - -
Fair value changes of the hedged items in portfolio hedge of interest rate risk
23 23
Derivatives – Hedge accounting 845 845
Non-current assets and disposal groups classified as held for sale 274 193
Investments in subsidiaries, joint ventures and associates 209 293
Tangible assets 908 626
Intangible assets 7 129
Other assets 581 498
Financial Liabilities Held for Trading (332) (332)
Financial liabilities at Amortized Cost (41,271) (41,501)Fair value changes of the hedged items in portfolio hedge of interest rate risk
(490) (490)
Derivatives – Hedge accounting (535) (535)Provisions (1,248) (1,667)Other liabilities (84) (84)Deferred tax 3,312 3,630 Total fair value of assets and liabilities acquired (B) - 1,205
Non controlling Interest Catalunya Banc Group (**) (C) 2 2
Non controlling Interest after purchase (D) - 12
Badwill (A)-(B)+(C )+(D) - (26)
Millions of Euros
(*) After the purchase, it has been reclassified under the heading “Available-for-sale financial assets”
(**) It corresponds to non-controlling interests that Catalunya Banc held, prior to integration in the BBVA Group
Because the resulting goodwill was negative, the net fair value of identifiable assets acquired and lesser liabilities assumed was initially estimated as of June 30, 2015 in an amount of 22 million euros but subsequently the calculation was modified to 26 million euros a gain was recognized in the accompanying consolidated income statement for 2015 under the heading “Badwill” (see Note 2.2.7).
The calculation of this amount was subject to change, since the estimate of all the fair values has been reviewed and, according to IFRS-3, they may be modified during a period of one year from the acquisition date (April 2015). After the deadline, there are not been significant changes in that amount recorded in the year 2015.
Garanti Bank
As stated in Note 3, in the year ended December 31, 2015 the Group acquired 14.89% of the share capital of the Garanti Bank.
Shown below are details of the carrying amount of the consolidated assets and liabilities of Garanti Bank prior to its acquisition and the corresponding fair values, gross of tax, which have been estimated in accordance with the IFRS-3 acquisition method.
F-123
Valuation and calculation of goodwill in Garanti BankCarrying
AmountFair Value
Acquisition cost (A) - 5,044
Cash on hand 8,915 8,915
Financial assets held for trading 419 419
Available-for-sale financial assets 14,618 14,773
Loans and receivables 58,495 58,056
Non-current assets and disposal groups classified as held for sale - 3
Investments in subsidiaries, joint ventures and associates 14 21
Hedging Derivatives 785 1,399
Non-current assets held for sale 11 1,542
Other assets 3,715 3,651 Financial liabilities at Amortized Cost (70,920) (70,920)Provisions (394) (698)Other liabilities (6,418) (6,418)Deferred tax 263 109 Total fair value of assets and liabilities acquired (B) 9,503 10,852
Non controlling Interest Garanti Group (C) 5,669 5,669
Non controlling Interest after purchase (D) - 811
Goodwill (A)-(B)+(C )+(D) - 672
Millions of Euros
The estimate as of December 31, 2015, in accordance with the acquisition method, which compares the fair value assigned to the acquired assets and liabilities of Garanti Bank along with the intangible assets identifies, as well as the cash payment carried out by the Group related to the transaction generates a goodwill.
As of June 30, 2016, the calculation of this amount was subject to change, since the estimate of all the fair values was being reviewed and, according to IFRS-3, they may be modified during a period of one year from the acquisition date (July 2015). Subsequent to the abovementioned date, the Group has finalized said process without significant changes.
18.2 Other intangible assets
The breakdown of the balance and changes of this heading in the accompanying consolidated balance sheets, according to the nature of the related items, is as follows:
Other intangible assets with a infinite useful life 612 632Other intangible assets with a definite useful life 721 801
Total 3,262 3,464
The amortization amounts included under this heading for the six months ended June 30, 2016 and 2015 are detailed in Note 45.
19. Tax assets and liabilities
19.1 Consolidated tax group
Pursuant to current legislation, the BBVA Consolidated Tax Group includes the Bank (as the parent company) and its Spanish subsidiaries that meet the requirements provided for under Spanish legislation regulating the taxation regime for the consolidated profit of corporate groups.
F-124
The Group’s non-Spanish other banks and subsidiaries file tax returns in accordance with the tax legislation in force in each country.
19.2 Years open for review by the tax authorities
The years open to review in the BBVA Consolidated Tax Group as of June 30, 2016 are 2010 and subsequent years for the main taxes applicable.
The remainders of the Spanish consolidated entities in general have the last four years open for inspection by the tax authorities for the main taxes applicable, except for those in which there has been an interruption of the limitation period due to the start of an inspection.
In view of the varying interpretations that can be made of some applicable tax legislation, the outcome of the tax inspections of the open years that could be conducted by the tax authorities in the future could give rise to contingent tax liabilities which cannot be reasonably estimated at the present time. However, the Group considers that the possibility of these contingent liabilities becoming actual liabilities is remote and, in any case, the tax charge which might arise therefore would not materially affect the Group’s accompanying consolidated financial statements.
19.3 Reconciliation
The reconciliation of the Group’s corporate income tax expense resulting from the application of the Spanish corporation income tax rate and the income tax expense recognized in the accompanying consolidated income statements is as follows:
Millions of Euros
Reconciliation of Taxation at the Spanish Corporation Tax
Rate to the Tax Expense Recorded for the Period Amount
Effective Tax
%Amount
Effective Tax
%
Profit or (-) loss before tax 3,391 3,899
From continuing operations 3,391 3,899
From discontinued operations - -
Taxation at Spanish corporation tax rate 30% 1,017 1,170
Revenues with lower tax rate (dividends) (43) (46)
Equity accounted earnings (1) (83)
Other effects 82 5
Current income tax 920 941
Of which: -
Continuing operations 920 941
Discontinued operations - -
June 2016 June 2015
(*) Calculated by applying the difference between the tax rate in force in Spain and the one applied to the Group’s earnings in each jurisdiction.
F-125
The effective income tax rate for the Group in the first semester 2016 and 2015 is as follows:
Millions of Euros
Effective Tax RateJune
2016
June
2015
Income from:
Consolidated Tax Group (43) 1,138
Other Spanish Entities 53 61
Foreign Entities 3,381 2,700
Total 3,391 3,899
Income tax and other taxes 920 941
Effective Tax Rate 27.13% 24.13%
19.4 Income tax recognized in equity
In addition to the income tax expense recognized in the accompanying consolidated income statements, the Group has recognized the following income tax charges for these items in the consolidated total equity:
Millions of Euros
Tax recognized in total equityJune
2016
December
2015
Charges to total equity
Debt securities (991) (593)
Equity instruments 297 113
Subtotal (694) (480)
Total (694) (480)
19.5 Deferred taxes
The balance under the heading "Tax assets" in the accompanying consolidated balance sheets includes deferred tax assets. The balance under the “Tax liabilities” heading includes to the Group’s various deferred tax liabilities. The details of the most important tax assets and liabilities are as follows:
Millions of Euros
Tax assets and liabilitiesJune
2016
December
2015
Tax assets-
Current tax assets 1,164 1,901
Deferred tax assets 16,168 15,878
Pensions 1,082 1,022
Financial Instruments 1,644 1,474
Impairment losses 1,380 1,346
Other 1,497 1,535
Secured tax assets (*) 9,533 9,536
Tax losses 1,032 965
Total 17,332 17,779
Tax Liabilities-
Current tax liabilities 664 1,238
Deferred tax liabilities 3,585 3,483
Financial Instruments 2,056 1,907
Charge for income tax and other taxes 1,529 1,576
Total 4,249 4,721
F-126
(*) Laws guaranteeing the deferred tax assets have been approved in Spain and Portugal in 2013 and 2014.
The most significant movements in the first half of 2016 compared to the year 2015 derived from the followings concepts:
Millions of Euros
Guaranteed tax assets and liabilities June 2016 December 2015
Changes in the PeriodDeferred
Assets
Deferred
Liabilities
Deferred
Assets
Deferred
Liabilities
Balance at the beginning 15,878 3,483 10,391 3,177
Pensions 60 - 120 -
Financials Instruments 170 149 554 (189)
Other assets (38) - 95 -
Impairment losses 34 - 305 -
Guaranteed Tax assets (*) (3) - 4,655 -
Tax Losses 67 - (242) -
Charge for income tax and other taxes - (47) - 495
Balance at the end 16,168 3,585 15,878 3,483 (*) Acquisition of Catalunya Bank S.A in 2015.
Of the deferred tax assets contained in the above table, the detail of the items and amounts guaranteed by the Spanish and Portuguese governments, broken down by the items that originated those assets is as follows:
Millions of Euros
Secured tax assetsJune
2016
December
2015
Pensions 1,904 1,904
Impairment losses 7,629 7,632
Total 9,533 9,536
As of June 30, 2016, non-guaranteed net deferred tax assets of the above table amounted to €3,050 million (€2,859 million as of December 31, 2015), which broken down by major geographies is as follows:
• Spain: Net deferred tax assets recognized in Spain totaled €1,653 million as of June 30, 2016 (€1,437 million as of December 31, 2015). €1,030 million of the figure recorded in the six months ended June 30, 2016 for net deferred tax assets related to tax credits and tax loss carry forwards and €623 million relate to temporary differences.
• Mexico: Net deferred tax assets recognized in Mexico amounted to €630 million as of June 30, 2016 (€608 million as of December 31, 2015). 99.97 % of deferred tax assets as of June 30, 2016 relate to temporary differences. The remainders are tax credits carry forwards.
• South America: Net deferred tax assets recognized in South America amounted to €328 million as of June 30, 2016 (€330 million as of December 31, 2015). All the deferred tax assets relate to temporary differences.
• United States: Net deferred tax assets recognized in the United States amounted to €238 million as of June 30, 2016 (€300 million as of December 31, 2015). All the deferred tax assets relate to temporary differences.
• Turkey: Net deferred tax assets recognized in Turkey amounted to €183 million as of June 30, 2016 (152 million as of December 31, 2015). The first semester of 2016, all the deferred tax assets correspond to €2 million of tax credits related to tax losses carry forwards and deductions and €181 million relate to temporary differences.
Based on the information available as of June 30, 2016, including historical levels of benefits and projected results available to the Group for the coming years, it is considered that sufficient taxable income will be generated for the recovery of above mentioned unsecured deferred tax assets when they become deductible according to the tax laws.
As of June 30, 2016 and December 31, 2015, the estimated amount of temporary differences associated with investments in subsidiaries, joint ventures and associates, which were not recognized deferred tax liabilities in the accompanying consolidated balance sheets taxes, amounted to 716 and 656 million euros respectively.
F-127
20. Other assets and liabilities
The breakdown of the balance under these headings in the accompanying consolidated balance sheets is as follows:
Transactions in progress 69 52Accruals 2,506 2,609
Unpaid accrued expenses 1,903 2,009
Other accrued expenses and deferred income 603 600
Other items 2,413 1,949Total Liabilities 4,988 4,610
The heading "Inventories" includes the net book value of land and building purchases that the Group’s Real estate entities have available for sale or as part of their business. Balances under this heading include mainly real estate assets acquired by these entities from distressed customers (mostly in Spain), net of their corresponding losses. The impairment included under the heading “Impairment or reversal of impairment on non-financial assets” of the accompanying consolidated financial statements were €80 million, €100 million for the first semester of 2016 and 2015 respectively (see Note 48).The roll-forward of our inventories from distressed customers is provided below:
Millions of Euros
Inventories from Distressed CustomersJune
2016
June
2015
Gross value
Balance at the beginning 9,446 9,119
Business combinations and disposals (*) - 580
Acquisitions 132 338
Disposals (551) (428)
Others (162) 141
Balance at the end 8,865 9,750
Accumulated impairment losses (5,166) (5,316)
Carrying amount 3,699 4,434
(*) Mainly assets from Catalunya Banc acquisition in 2015.
F-128
21. Non-current assets and disposal groups classified as held for sale
The composition of the balance under the heading “Non-current assets and disposal groups classified as held for sale” in the accompanying consolidated balance sheets, broken down by the origin of the assets, is as follows:
Millions of Euros
Non-current assets and disposal groups classified as held for sale
Breakdown by items
June
2016
December
2015
Foreclosures and recoveries 3,972 3,991
Foreclosures 3,783 3,775
Recoveries from financial leases 189 216
Other assets from: 411 706
Property, plant and equipment 219 267
Operating leases 29 47
Investment properties (*) 163 392
Business sale - Assets 41 37
Accrued amortization (*) (56) (80)
Impairment losses (1,216) (1,285)
Total Non-current assets and disposal groups classified as
held for sale3,152 3,369
(*) Net of accumulated amortization until reclassified as non-current assets and disposal groups held for sale.
22. Financial liabilities at amortized cost
The breakdown of the balance under these headings in the accompanying consolidated balance sheets is as follows:
Millions of Euros
Financial liabilities measured at amortised cost NotesJune
2016
December
2015
Deposits 508,110 511,992
Deposits from Central Banks 9 32,709 40,087
Deposits from Credit Institutions 22.1 69,118 68,543
Customer deposits 22.2 406,284 403,362
Debt securities issued 22.3 75,498 81,980
Other financial liabilities 22.4 14,137 12,141
Total 597,745 606,113
F-129
22.1 . Deposits from credit institutions
The breakdown of the balance under this heading in the consolidated balance sheets, according to the nature of the financial instruments, is as follows:
Millions of Euros
Deposits from credit institutions NotesJune
2016
December
2015
Reciprocal accounts 242 160
Deposits with agreed maturity 35,423 37,859
Demand deposits 4,862 4,121
Other accounts 143 149
Repurchase agreements 35 28,298 26,069
Subtotal 68,968 68,358
Accrued interest until expiration 149 185
Total 69,118 68,543
The breakdown by geographical area and the nature of the related instruments of this heading in the accompanying consolidated balance sheets is as follows:
Deposits from Credit institutions
June 2016
Demand Deposits
& Reciprocal
Accounts
Deposits with
Agreed Maturity
Repurchase
AgreementsTotal
Spain 919 6,545 1,495 8,959
Rest of Europe 1,314 15,708 21,071 38,093
Mexico 173 720 4,785 5,678
United States 207 2,999 593 3,799
South America 2,053 4,749 1 6,803
Turkey 328 1,026 12 1,366
Rest of the world 141 3,934 345 4,420
Total 5,135 35,681 28,302 69,118
Millions of Euros
Deposits from Credit Institutions
December 2015
Demand Deposits
& Reciprocal
Accounts
Deposits with
Agreed Maturity
Repurchase
AgreementsTotal
Spain 951 6,718 593 8,262
Rest of Europe 801 15,955 23,140 39,896
Mexico 54 673 916 1,643
South America 212 3,779 432 4,423
United States 1,892 5,497 2 7,391
Turkey 355 1,423 8 1,786
Rest of the world 53 4,108 981 5,142
Total 4,318 38,153 26,072 68,543
Millions of Euros
F-130
22.2 . Customer deposits
The breakdown of this heading in the accompanying consolidated balance sheets, by type of financial instrument, is as follows:
Millions of Euros
Customer deposits NotesJune
2016
December
2015
General Governments 30,588 25,343
Of which:
Repurchase agreements 35 - 7,556
Current accounts 109,615 112,273
Savings accounts 83,354 82,975
Fixed-term deposits 161,988 165,125
Repurchase agreements 35 18,641 15,711
Subordinated deposits 236 285
Other accounts 759 812
Accumulated other comprehensive income 1,102 839Total 406,284 403,362
Of which:
In Euros 199,490 203,053
In foreign currency 206,794 200,309
Of which:
Deposits from other creditors without valuation adjustment 405,549 402,689
Accrued interests 735 673
The breakdown by geographical area of this heading in the accompanying consolidated balance sheets, by type of instrument is as follows:
Customer Deposits
June 2016Demand Deposits
Deposits with
Agreed Maturity
Repurchase
AgreementsTotal
Spain 97,146 65,568 2,025 164,739
Rest of Europe 6,334 21,089 10,385 37,808
Mexico 36,299 11,456 5,933 53,688
The United States 23,960 21,618 287 45,865
Turkey 43,903 15,111 - 59,014
South America 10,461 28,931 11 39,403
Rest of the world 692 5,075 - 5,767
Total 218,795 168,848 18,641 406,284
Millions of Euros
Customer Deposits
December 2015Demand Deposits
Deposits with
Agreed Maturity
Repurchase
AgreementsTotal
Spain 86,564 70,816 11,309 168,689
Rest of Europe 5,514 22,833 7,423 35,770
Mexico 36,907 10,320 4,195 51,422
South America 24,574 19,591 304 44,469
The United States 47,071 15,893 24 62,988
Turkey 9,277 26,744 15 36,036
Rest of the world 357 3,631 - 3,988Total 210,264 169,828 23,270 403,362
Millions of Euros
F-131
22.3 . Debt securities issued (including bonds and debentures)
The breakdown of the balance under this heading, by currency, is as follows:
Millions of Euros
Debt securities issuedJune
2016
December
2015
In Euros 44,903 51,449
Promissory bills and notes 568 456
Non-convertible bonds and debentures at floating interest rates 3,504 3,375
Non-convertible bonds and debentures at fixed interest rates 5,343 6,389
Mortgage Covered bonds 23,121 28,740
Hybrid financial instruments 557 384
Securitization bonds made by the Group 3,547 4,580
Accrued interest and others (*) 1,169 1,425
Subordinated liabilities 7,094 6,100
Convertible 4,000 3,000
Convertible perpetual securities 4,000 3,000
Non-convertible 3,053 3,041
Preferred Stock 361 358
Other subordinated liabilities 2,692 2,683
Accrued interest and others (*) 41 59
In Foreign Currency 30,596 30,531
Promissory bills and notes 777 192
Non-convertible bonds and debentures at floating interest rates 1,164 1,240
Non-convertible bonds and debentures at fixed interest rates 13,481 13,553
Mortgage Covered bonds 147 146
Hybrid financial instruments 2,217 2,392
Securitization bonds made by the Group 2,750 3,039
Accrued interest and others (*) 270 254
Subordinated liabilities 9,790 9,715
Convertible 1,413 1,439
Convertible perpetual securities 1,413 1,439
Non-convertible 7,720 7,818
Preferred Stock 600 616
Other subordinated liabilities 7,120 7,202
Accrued interest and others (*) 657 458
Total 75,498 81,980
(*) Hedging operations and issuance costs
Most of the foreign currency issues are denominated in U.S. dollars.
Promissory notes were issued by BBVA Banco de Financiación, S.A., BBVA Senior Finance, S.A.U. and BBVA US Senior, S.A.U. The promissory notes issued by BBVA Banco de Financiación, S.A., BBVA Senior Finance, S.A.U. and BBVA US Senior, S.A.U., are guaranteed jointly, severally and irrevocably by the Bank.
The senior debt issued by BBVA Senior Finance, S.A.U., BBVA U.S. Senior, S.A.U. and BBVA Global Finance, Ltd. are guaranteed jointly, severally and irrevocably by the Bank (included within “Non-convertible bonds and debentures at floating interest rates” and “Non-convertible bonds and debentures at fixed interest rates” in the table above).
F-132
Of the above, the issuances of BBVA International Preferred, S.A.U., BBVA Subordinated Capital, S.A.U., BBVA Global Finance, Ltd., Caixa Terrassa Societat de Participacions Preferents, S.A.U. and CaixaSabadell Preferents, S.A.U., are jointly, severally and irrevocably guaranteed by the Bank. The balance variances are mainly due to the following transactions:
Convertible perpetual securities
On April 8, 2016, BBVA carried out the fourth issuance of perpetual securities eventually convertible into new ordinary shares of BBVA, (additional tier I capital instruments) without pre-emption rights, for a total amount of €1,000 million. These securities are listed in the Global Exchange Market of the Irish Stock Exchange. This issuance was targeted only at qualified foreign investors and in any case would not be made or subscribed in Spain or by Spanish-resident investors.
On February, 10 2015, BBVA carried out the third issuance of perpetual securities eventually convertible into new ordinary shares of BBVA, (additional tier I capital instruments) without pre-emption rights, for a total amount of €1,500 million. These securities are listed in the Global Exchange Market of the Irish Stock Exchange. This issuance was targeted only at qualified foreign investors and in any case would not be made or subscribed in Spain or by Spanish-resident investors.
These perpetual securities issued are convertible into new ordinary shares of BBVA if the common equity Tier 1 (CET 1) of the individual or consolidated Bank is below the 5.125%, among other assumptions.
These issues are redeemable, total or partially, at BBVA´s election after, at least, five years from the issue date, in accordance with the terms of each issue and with prior consent of the Bank of Spain or any other relevant authority.
Preferred securities
The breakdown by issuer of the balance under this heading in the accompanying consolidated balance sheets is as follows:
Preferred Securities by IssuerJune
2016
December
2015
BBVA International Preferred, S.A.U. (*) 828 842 Unnim Group (**) 111 109
Compass Group 21 22
BBVA Colombia, S.A. 1 1 Total 962 974
Millions of Euros
(*) Listed on the London and New York stock exchanges.
(**) Unnim Group: Issuances prior to the acquisition by BBVA.
These issues were fully subscribed at the moment of the issue by investors outside the Group and are redeemable at the issuer company’s option after five years from the issue date, depending on the terms of each issue and with prior consent from the Bank of Spain.
Amortization of preferred securities
In addition, on February, 27, 2015 BBVA Capital Finance, S.A.U., BBVA International Limited, Caixa de Manlleu Preferents, S.A.U., Caixa Terrassa Societat de Participacions Preferents, S.A.U. CaixaSabadell Preferents, S.A.U. carried out the early redemption of following issuances which amounted to €46 million.
Other subordinated liabilities
On February 27, 2015, BBVA announced the early redemption of some issuances that amounted to €36 million.
F-133
22.4 Other financial liabilities
The breakdown of the balance under this heading in the accompanying consolidated balance sheets is as follows:
Millions of Euros
Other financial liabilitiesJune
2016
December
2015
Creditors for other financial liabilities 4,136 3,303
Collection accounts 3,375 2,369
Creditors for other payment obligations 6,108 5,960
Dividend payable but pending payment (Note 4) 518 509 Total 14,137 12,141
23. Liabilities under reinsurance and insurance contracts
The Group has insurance subsidiaries mainly in Spain and Latin America (mostly in Mexico). The main product offered by the insurance subsidiaries is life insurance to cover the risk of death (risk insurance) and life-savings insurance. Within life and accident insurance, a distinction is made between freely sold products and those offered to customers who have taken mortgage or consumer loans, which cover the principal of those loans in the event of the customer’s death.
There are two types of life-saving insurance products: individual insurance, which seeks to provide the customer with savings for retirement or other events, and group insurance, which is taken out by employers to cover their commitments to their employees.
The insurance business is affected by different risks, including those that are related to the BBVA Group such as credit risk, market risk, liquidity risk and operational risk and the methodology for risk measurement applied in the insurance activity is similar (see Note 7), although it has a differentiated management due to the particular characteristics of the insurance business, such as the coverage of contracted obligations and the long term of the commitments. Additionally, the insurance business generates certain specific risks, of a probabilistic nature:
• Technical risk: arises from deviations in the estimation of the casualty rate of insurances, either in terms of numbers, the amount of such claims and the timing of its occurrence.
• Biometric risk: depending on the deviations in the expected mortality behavior or the survival of the insured persons.
The insurance industry is highly regulated in each country. In this regard, it should be noted that the insurance industry is undergoing a gradual regulatory transformation through new capital regulations risk-based, which have already been published in several countries.
The most significant provisions recognized by consolidated insurance subsidiaries with respect to insurance policies issued by them are under the heading “Liabilities under “Insurance and reinsurance contracts” in the accompanying consolidated balance sheets.
The breakdown of the balance under this heading is as follows:
Millions of Euros
Liabilities under Insurance and Reinsurance Contracts
Technical Reserve and Provisions
June
2016
December
2015
Mathematical reserves 7,971 8,101
Provision for unpaid claims reported 706 697
Provisions for unexpired risks and other provisions 658 609Total 9,335 9,407
The cash flows of those Liabilities under Reinsurance and reinsurance contracts are shown below:
F-134
Maturity Up to 1 Year 1 to 3 Years 3 to 5 Years Over 5 Years Total
Liabilities under Insurance and Reinsurance Contracts 1,656 1,362 1,490 4,827 9,335
Millions of Euros
The modeling methods and techniques used to calculate the mathematical reserves for the insurance products are actuarial and financial methods and modeling techniques approved by the respective country’s insurance regulator or supervisor. The most important insurance entities are located in Spain and Mexico (which together account for approximately 95% of the insurance revenues), where the modeling methods and techniques are reviewed by the insurance regulator in Spain (General Directorate of Insurance) and Mexico (National Insurance and Bonding Commission), respectively. The modeling methods and techniques used to calculate the mathematical reserves for the insurance products are based on IFRS and primarily involve the valuation of the estimated future cash flows, discounted at the technical interest rate for each policy. To ensure this technical interest rate, asset-liability management is carried out, acquiring a portfolio of securities that generate the cash flows needed to cover the payment commitments assumed with the customers.
The table below shows the key assumptions used in the calculation of the mathematical reserves for insurance products in Spain and Mexico, respectively:
Spain Mexico Spain Mexico
Individual life insurance (1)
GKM80/GKM95/95%
PASEM HombreOwn tables
Tables of the Comision Nacional
De Seguros y Fianzas 2000-
individual
1.42%-1.91% 2.5%
Group insurance(2) PERM/F2000
Tables of the Comision Nacional
De Seguros y Fianzas 2000-
group
1.56%-3.62% 5.5%
MATHEMATICAL RESERVESMortality table Average technical interest type
(1) Provides coverage in the case of one or more of the following events: death and disability
(2) Insurance policies purchased by companies (other than Group BBVA entities) on behalf of their employees
The table below shows the mathematical reserves by type of product as of June 30, 2016 and December 31, 2015:
Millions of Euros
Technical Reserves by type of insurance product June
2016
December
2015
Mathematical reserves 7,971 8,101
Individual life insurance (1) 4,755 4,294
Savings 3,849 3,756
Risk 905 526
Others - 12
Group insurance (2) 3,216 3,807
Savings 3,037 3,345
Risk 179 462
Others - -
Provision for unpaid claims reported 706 697
Provisions for unexpired risks and other provisions 658 609Total 9,335 9,407
(1) Provides coverage in the event of death or disability
(2) The insurance policies purchased by employers (other than BBVA Group) on behalf of its employees
F-135
The table below shows the contribution of each insurance product to the Group’s income (see Note 43) for the six months ended June 30, 2016 and 2015:
Millions of Euros
Revenues by type of insurance productJune
2016
June
2015
Life insurance 282 277
Individual 120 129
Savings 2 43
Risk 118 86
Group insurance 162 148
Savings 14 11
Risk 148 137
Non-Life insurance 230 215
Home insurance 77 69
Other non-life insurance products 153 146Total 512 492
The heading “Assets under reinsurance and insurance contracts” in the accompanying consolidated balance sheets includes the amounts that the consolidated insurance entities are entitled to receive under the reinsurance contracts entered into by them with third parties and, more specifically, the share of the reinsurer in the technical provisions recognized by the consolidated insurance subsidiaries. As of June 30, 2016 and December 31, 2015 the balance is €489 million and €511 million, respectively.
24. Provisions
The breakdown of the balance under this heading in the accompanying consolidated balance sheets, based on type of provisions, is as follows:
Millions of Euros
Provisions. Breakdown by concepts NotesJune
2016
December
2015
Pensions and other post employment defined benefit obligations 25 6,243 6,299
Other long term employee benefits - -
Pending legal issues and tax litigation 595 616
Commitments and guarantees given 921 714
Other provisions (*): 1,116 1,223
Of which Catalunya Banc Group 392 397
Of which Garanti Group 96 105Total 8,875 8,852
(*) Provisions corresponding to different concepts and different geographies that are not individually significant individually, except originated of the Purchase Price Agreement of Catalunya Banc and Garanti Group (See Note 18.1).
Ongoing legal proceedings and litigation
Several entities of the Group are party to legal actions in a number of jurisdictions (including, among others, Spain, Mexico and United States) arising in the ordinary course of business. According to the procedural status of these actions and the assessment by the respective lawyers, BBVA considers that none of such actions is material, individually or in the aggregate, and none is expected to result in a material adverse effect on the Group's financial position, results of operations or liquidity, either individually or in the aggregate. The Group´s Management believes that adequate provisions have been made in respect of such legal actions and considers that the possible contingencies that may arise from such on-going legal actions are not material enough to require disclosure to the markets.
F-136
25. Post-employment commitments and others
As stated in Note 2.2.12, the Group has assumed commitments with employees including defined contribution and defined benefit plans (see Glossary), healthcare and other post-employment benefits.
Employees are covered by defined contribution plans in practically all of the countries, in which the Group operates, with the plans in Spain and Mexico being the most significant. Most defined benefit plans are closed to new employees and with liabilities relating largely to retired employees, the most significant being those in Spain, Mexico, the United States and Turkey. In Mexico, the Group provides medical benefits to a closed group of employees and their family members, both active service and in retirement.
The breakdown of the balance sheet net defined benefit liability as of June 30, 2016 and December 31, 2015 is provided below:
Millions of Euros
Net Defined Benefit Liability (asset) on the Balance
Sheet
June
2016
December
2015
Pension commitments 5,415 5,306
Early retirement commitments 2,688 2,855
Medical benefits commitments 963 1,023
Total commitments 9,066 9,184
Pension plan assets 1,967 1,974
Early retirement plan assets - -
Medical benefit plan assets 1,087 1,149Total plan assets 3,054 3,124
Total net liability / asset on the balance sheet 6,013 6,060
Of which: -
Net asset on the balance sheet (*) (230) (238)
Net liability on the balance sheet (**) 6,243 6,299
(*) Recorded under the heading “Other Assets - Other” of the consolidated balance sheet (See Note 20)
(**) Recorded under the heading “Provisions - Provisions for pensions and similar obligations” of the consolidated balance sheet (See Note 24)
The amounts relating to post-employment benefits charged to consolidated income statement for the six months ended June 30, 2016 and 2015 are as follows:
Millions of Euros
Consolidated Income Statement Impact NotesJune
2016
June
2015
Interest and similar expenses 37.2 53 54
Interest expense 154 151
Interest income (101) (97)
Personnel expenses 79 77
Defined contribution plan expense 44.1 45 44
Defined benefit plan expense 44.1 34 33
Provisions (net) 46 195 309
Early retirement expense 131 336
Past service cost expense 4 6
Remeasurements (*) 25 -
Other provision expenses 35 (33)
Total impact on Consolidated Income Statement: Debit (Credit) 326 439
(*) Actuarial losses (gains) on remeasurement of the net defined benefit liability relating to early retirements in Spain and other similar benefits (see Note 2.2.12).
The amounts relating to post-employment benefits charged to the balance sheet as of June 30, 2016 and 2015 are as follows:
F-137
Millions of Euros
Equity Impact NotesJune
2016
December
2015
Defined benefit plans 164 128
Post-employment medical benefits - 7
Total impact on equity: Debit (Credit) (*) 2.2.12 164 135
(*) Actuarial gains (losses) on remeasurement of the net defined benefit liability relating to pension commitments before income taxes.
25.1 Defined benefit plans
Defined benefit pension commitments relate mainly to employees who have already retired or taken early retirement, certain closed groups of active employees still accruing defined benefit pensions, and in-service death and disability benefits provided to most active employees. For the latter the Group pays the required premiums to fully insure the related liability. The change in these pension commitments during the six months ended June 30, 2016 and 2015 is presented below.
June 2016 June 2015
Pension Commitments
Defined
Benefit
Obligation
Plan AssetsNet Liability
(asset)
Defined
Benefit
Obligation
Plan AssetsNet Liability
(asset)
Balance at the beginning 9,184 3,124 6,060 8,240 2,555 5,685
Current service cost 34 - 34 33 - 33
Interest income or expense 154 101 53 151 97 52
Contributions by plan participants 2 2 - - - -
Employer contributions - 10 (10) - 2 (2)
Past service costs (1) 135 - 135 282 - 282
Remeasurements: 227 38 189 (1) - (1)
Return on plan assets (2) - - - - - -
From changes in demographic assumptions - - - - - -
From changes in financial assumptions 229 - 229 - - -
Other actuarial gain and losses (2) 38 (40) (1) - (1)
Business combinations and disposals - - - 173 - 173
Effect on changes in foreign exchange rates (154) (167) 13 29 71 (41)
Other effects 37 34 3 (4) 1 (4)Balance at the end 9,066 3,054 6,013 8,396 2,681 5,715
Of which
Spain 6,436 380 6,056 5,910 - 5,910
Mexico 1,441 1,637 (195) 1,712 1,993 (281)
The United States 358 324 34 396 353 43
Turkey 452 350 102 - - -
Millions of Euros
(1) Including gains and losses arising from settlements.
(2) Excluding interest, which is recorded under "Interest income or expense".
The balance under the heading “Provisions - Pensions and other post-employment defined benefit obligations” of the accompanying consolidated balance sheet as of June 30, 2016 includes €390 million relating to post-employment benefit commitments to former members of the Board of Directors and the Bank’s Management Committee.
The most significant commitments are those in Spain and Mexico and, to a lesser extent, in the United States and Turkey. The remaining commitments are located mostly in Portugal and South America. Unless otherwise required by local regulation, all defined benefit plans have been closed to new entrants, who instead are able to participate in the Group´s defined contribution plans. Both the costs and the present value of the commitments are determined by independent qualified actuaries using the “projected unit credit” method.
In order to guarantee the good governance of these plans, the Group has established specific benefits committees. These benefit committees include members from the different areas of the business to ensure that all decisions are made taking into consideration all of the associated impacts. Both the costs and the present value of the commitments are determined by independent qualified actuaries using the “projected unit credit” method.
F-138
The following table sets out the key actuarial assumptions used in the valuation of these commitments:
2016
Actuarial Assumptions Spain Mexico USA Turkey
Discount rate 1.50% 9.30% 4.30% 10.30%
Rate of salary increase 1.50% 4.75% 3.00% 8.60%
Rate of pension increase - 2.13% - 7.10%
Medical cost trend rate - 6.75% - 9.94%
Mortality tablesPERM/F 2000P EMSSA 97 RP 2014 CSO2001
In addition to the commitments to employees shown above, the Group has other less material commitments. These include long-service awards, which consist of either an established monetary award or some vacation days granted to certain groups of employees when they complete a given number of years of service. As of June 30, 2016 and December 31, 2015 the actuarial liabilities for the outstanding awards amounted to €44 million and €39 million, respectively. These commitments are recorded under the heading "Provisions - Other provisions" of the accompanying consolidated balance sheet (see Note 24).
As described above, the Group maintains both pension and medical benefit commitments with their employees.
Post-employment commitments and other long-term benefits
These pension commitments relate mostly to pensions where the employees are already receiving payment, and which have been determined based on salary and years of service in accordance with the specific plan rules. For most plans pension payments are due on retirement, death and long term disability.
In addition, during the six months ended June 30, 2016, Group entities in Spain offered certain employees the option to take early retirement (that is, earlier than the age stipulated in the collective labor agreement in force). This offer was accepted by 259 employees (695 during the six months ended June 30, 2015). These commitments include both the liability for the benefit payments due as well as the contributions payable to external pension funds during the early retirement period. As of June 30, 2016 and December 31, 2015 the value of these commitments amounted to €2,688 and €2,855 million respectively.
F-139
The change in the defined benefit plan obligations and plan assets during the six months ended June 30, 2016 was as follows:
Millions of Euros
Defined Benefit Obligation
Pensions and others-
June 2016Spain Mexico USA Turkey Rest
Balance at the beginning 6,491 518 365 435 356
Current service cost 5 3 2 11 -
Interest income or expense 54 21 7 21 6
Contributions by plan participants - - 0 2 -
Employer contributions - - - - -
Past service costs (1) 135 - - - -
Remeasurements: 206 - - - 21
Return on plan assets (2) - - - - -
From changes in demographic assumptions - - - - -
From changes in financial assumptions 208 - - - 21
Other actuarial gain and losses (2) - - - -
Benefit payments (489) (21) (7) (14) (6)
Settlement payments - - - - -
Business combinations and disposals - - - - -
Effect on changes in foreign exchange rates (2) (43) (7) (3) (13)
Other effects 36 - (2) - 2Balance at the end 6,436 478 358 452 365
Millions of Euros
Plan Assets
Pensions and others-
June 2016Spain Mexico USA Turkey Rest
Balance at the beginning 380 596 329 337 333
Current service cost - - - - -
Interest income or expense - 25 6 17 4
Contributions by plan participants - - - 2 -
Employer contributions - - - 6 5
Past service costs (1) - - - - -
Remeasurements: - - - - 38
Return on plan assets (2) - - - - -
From changes in demographic assumptions - - - - -
From changes in financial assumptions - - - - -
Other actuarial gain and losses - - - - 38
Benefit payments (34) (21) (6) (8) (5)
Settlement payments - - - - -
Business combinations and disposals - - - - -
Effect on changes in foreign exchange rates - (50) (6) (3) (11)
Other effects 34 - 1 - -
Balance at the end 380 550 324 350 362
Millions of Euros
Net Liability (asset)
Pensions and others-
June 2016Spain Mexico USA Turkey Rest
Balance at the beginning 6,111 (78) 36 98 23
Current service cost 5 3 2 11 -
Interest income or expense 54 (4) 1 5 2
Contributions by plan participants - - - - -
Employer contributions - - - (6) (5)
Past service costs (1) 135 - - - -
Remeasurements: 206 - - - (17)
Return on plan assets (2) - - - - -
From changes in demographic assumptions - - - - -
From changes in financial assumptions 208 - - - 21
Other actuarial gain and losses (2) - - - (38)
Benefit payments (455) - (1) (5) (1)
Settlement payments - - - - -
Business combinations and disposals - - - - -
Effect on changes in foreign exchange rates (2) 7 (1) (1) (2)
Other effects 2 - (3) - 2
Balance at the end 6,056 (72) 34 102 3
Of which
Vested benefit obligation relating to current employees 98
Vested benefit obligation relating to retired employees 2,904
(1) Including gains and losses arising from settlements.
(2) Excluding interest, which is recorded under "Interest income or expense".
F-140
The change in net defined benefit plan liabilities (assets) during the six months ended June 30, 2015 was as follows:
Pensions and others-
June 2015Spain Mexico USA
Rest of the
world
Balance at the beginning 5,830 574 362 392
Current service cost 8 4 2 2
Interest income or expense 61 25 7 8
Contributions by plan participants - - - -
Employer contributions - - - -
Past service costs (1) 287 (5) - -
Remeasurements: - - - (1)
Return on plan assets (2) - - - -
From changes in demographic assumptions - - - -
From changes in financial assumptions - - - -
Other actuarial gain and losses - - - (1)
Benefit payments (447) (32) (6) (5)
Settlement payments - - - -
Business combinations and disposals 173 - - -
Effect on changes in foreign exchange rates 2 10 31 (32)
Other effects (4) - - -Balance at the end 5,910 576 396 364
Pensions and others-
June 2015Spain Mexico USA
Rest of the
world
Balance at the beginning - 668 324 323
Current service cost - - - -
Interest income or expense - 30 7 4
Contributions by plan participants - - - -
Employer contributions - - - 2
Past service costs (1) - - - -
Remeasurements: - - - -
Return on plan assets (2) - - - -
From changes in demographic assumptions - - - -
From changes in financial assumptions - - - -
Other actuarial gain and losses - - - -
Benefit payments - (21) (5) (4)
Settlement payments - - - -
Business combinations and disposals - - - -
Effect on changes in foreign exchange rates - 12 27 10
Other effects - 1 - -
Balance at the end - 689 353 335
Spain Mexico USARest of the
world
Balance at the beginning 5,830 (94) 38 70
Current service cost 8 4 2 2
Interest income or expense 61 (5) - 3
Contributions by plan participants - - - -
Employer contributions - - - (2)
Past service costs (1) 287 (5) - -
Remeasurements: - - - (1)
Return on plan assets (2) - - - - From changes in demographic assumptions - - - -
From changes in financial assumptions - - - -
Other actuarial gain and losses - - - (1)
Benefit payments (447) (11) (1) (1)
Settlement payments - - - -
Business combinations and disposals 173 - - -
Effect on changes in foreign exchange rates 2 (2) 4 (41)
Other effects (4) (1) - -
Balance at the end 5,910 (113) 43 29
Of which
Vested benefit obligation relating to current employees 196
Vested benefit obligation relating to retired employees 5,714
Defined Benefit Obligation
Millions of Euros
Millions of Euros
Millions of Euros
Plan Assets
Net Liablitiy (asset)
(1) Includes gains and losses from settlements.
(2) Excludes interest which is reflected in the line item “Interest income and expenses”.
In Spain, local regulation requires that pension and death benefit commitments must be funded, either through the assets held for a qualified pension plan or an insurance contract.
F-141
These insurance contracts meet the requirements of the accounting standard regarding the non-recoverability of contributions. However, a significant number of the insurance contracts are with BBVA Seguros, S.A. and Catalunya Caixa Vida –consolidated subsidiaries – and consequently these policies cannot be considered plan assets under IAS 19. For this reason, the liabilities insured under these policies are fully recognized under the heading "Provisions – Pensions and other post-employment defined benefit obligations" of the accompanying consolidated balance sheet (see Note 24), while the related assets held by the insurance company are included within the Group´s consolidated assets (registered according to the classification of the corresponding financial instruments). As of June 30, 2016 the value of these separate assets was €3,039 million, representing direct rights of the insured employees held in the consolidated balance sheet, hence these benefits are effectively fully funded,
On the other hand, some pension commitments have been funded through insurance contracts with insurance companies not related to the Group, and can therefore be considered qualifying insurance policies and plan assets under IAS 19. In this case the accompanying consolidated balance sheet reflects the value of the obligations net of the fair value of the qualifying insurance policies. As of June 30, 2016 and December 31, 2015, the fair value of the aforementioned insurance policies (€380 and €380 million, respectively) exactly match the value of the corresponding obligations and therefore no amount for this item has been recorded in the accompanying consolidated balance sheet.
Pensions benefits are paid by the insurance companies with whom BBVA has insurance contracts and to whom all insurance premiums have been paid. The premiums are determined by the insurance companies using “cash flow matching” techniques to ensure that benefits can be met when due, guaranteeing both the actuarial and interest rate risk.
In Mexico, there is a defined benefit plan for employees hired prior to 2001. Other employees participate in a defined contribution plan. External funds/trusts have been constituted locally to meet benefit payments as required by local regulation.
In The United States there are mainly two defined benefit plans, both closed to new employees, who instead are able to join a defined contribution plan. External funds/trusts have been constituted locally to fund the plans, as required by local regulation.
In 2008, the Turkish government passed a law to unify the different existing pension systems under a single umbrella of Social Security. Such system provides for the transfer of the various prior funds established.
The financial sector is in this stage at present, maintaining these pension commitments managed by external pension funds (foundations) established for that purpose.
The foundation that maintains the assets and liabilities relating to employees of Garanti in Turkey, as per the local regulatory requirements, has registered an obligation amounting to €36 million as of December 31, 2015 pending future social security transfer.
Furthermore, the Group has set up a defined benefit pension plan for employees, additional to the social security benefits, reflected in the consolidated balance sheet.
F-142
Medical benefit commitments
The change in defined benefit obligations and plan assets during the six months ended June 30, 2016 and 2015 was as follows:
Millions of Euros
June 2016 June 2015
Medical Benefits Commitments
Defined
Benefit
Obligation
Plan assetsNet liability
(asset)
Defined
Benefit
Obligation
Plan assetsNet liability
(asset)
Balance at the beginning 1,022 1,149 (127) 1,083 1,240 (157)
Current service cost 12 - 12 16 - 16
Interest income or expense 44 50 (6) 50 57 (7)
Contributions by plan participants - - - - - -
Employer contributions - - - - - -
Past service costs (1) - - - - - -
Remeasurements: - - - - - -
Return on plan assets (2) - - - - - -
From changes in demographic assumptions - - - - - - From changes in financial assumptions - - - - - -
Other actuarial gain and losses - - - - - -
Benefit payments (15) (15) - - (15) -
Settlement payments (1) - (1) (16) - (1)
Business combinations and disposals - - - - - -
Effect on changes in foreign exchange rates (86) (97) 11 18 22 (4)
Other effects - - - - - -Balance at the end 977 1,087 (110) 1,151 1,303 (153)
(1) Including gains and losses arising from settlements.
(2) Excluding interest, which is recorded under "Interest income or expense".
The valuation of these benefits and their accounting treatment in the accompanying consolidated financial statements follow the same methodology as that employed in the valuation of pension commitments.
In Mexico there is a medical benefit plan for employees hired prior to 2007. New employees from 2007 are covered by medical insurance policy. An external trust has been constituted locally to fund the plan, in accordance with local legislation and Group policy.
In Turkey employees are currently provided with medical benefits through a foundation in collaboration with the social security system, although local legislation prescribes the future unification of this and similar systems into the general social security system itself.
Estimated benefit payments
The estimated benefit payments over the next ten years for all the entities in Spain, Mexico, United States and Turkey are as follows:
The majority of the Group´s defined benefit plans are funded by plan assets held in external funds/trusts legally separate from the Group sponsoring entity. However, in accordance with local regulation, some commitments are not externally funded and covered through internally held provisions, principally those relating to early retirements in Spain.
F-143
Plan assets are those assets which will be used to directly settle the assumed commitments and which meet the following conditions: they are not part of the Group sponsoring entity´s assets, they are available only to pay post-employment benefits and they cannot be returned to the Group sponsoring entity.
To manage the assets associated with defined benefit plans, BBVA Group has established investment policies designed according to criteria of prudence and minimizing the financial risks associated with plan assets.
The investment policy consists of investing in a low risk and diversified portfolio of assets with maturities consistent with the term of the benefit obligation and which, together with contributions made to the plan, will be sufficient to meet benefit payments when due, thus mitigating the plans‘ risks.
In those countries where plan assets are held in pension funds or trusts, the investment policy is developed consistently with local regulation. When selecting specific assets, current market conditions, the risk profile of the assets and their future market outlook are all taken into consideration. In all the cases, the selection of assets takes into consideration the term of the benefit obligations as well as short-term liquidity requirements.
The risks associated with these commitments are those which give rise to a deficit in the defined benefit plan. A deficit could arise from factors such as a fall in the market value of plan assets, an increase in long-term interest rates leading to a decrease in the fair value of fixed income securities, or a deterioration of the economy resulting in more write-downs and credit rating downgrades.
The table below shows the allocation of plan assets of the main companies of the BBVA Group as of June 30, 2016:
Millions of Euros
Plan Assets Breakdown June 2016
Cash or cash equivalents 81
Other debt securities (Government bonds) 2,170
Property, fixtures and materials 1
Mutual funds 1
Asset-backed securities 58
Insurance contracts 5
Other 8
Total 2,324
Of which:
Bank account in BBVA 20
Debt securities issued by BBVA 5
In addition to the above there are plan assets relating to the previously mentioned insurance contracts in Spain and the foundation in Turkey.
The following table provides details of investments in Level 1 (listed securities) as of June 30, 2016:
Millions de euros
Investments in listed markets June 2016
Cash or cash equivalents 81
Other debt securities (Government bonds) 2,170
Mutual funds 1
Asset-backed securities 58
Total 2,310
Of which:
Bank account in BBVA 20
Debt securities issued by BBVA 5
The remainders of the assets are mainly invested in Level 2 assets in in accordance with the classification established under IFRS 13 (mainly insurance contracts). As of December 31, 2015, almost all of the assets related to employee’s commitments corresponded to fixed income securities.
F-144
25.2 Defined contribution commitments
Certain Group entities sponsor defined contribution plans. Some of these plans allow employees to make contributions which are then matched by the employer.
Contributions are recognized as and when they are accrued, with a charge to the consolidated income statement in the corresponding financial year. No liability is therefore recognized in the accompanying consolidated balance sheet (See Note 44.1).
26. Common stock
As of June 30, 2016, BBVA’s common stock amounted to €3,175,375,383.25 divided into 6,480,357,925 fully subscribed and paid-up registered shares, all of the same class and series, at €0.49 par value each, represented through book-entry accounts. All of the Bank shares carry the same voting and dividend rights, and no single stockholder enjoys special voting rights. Each and every share is part of the Bank’s common stock.
The Bank’s shares are traded on the Spanish stock market, as well as on the London and Mexico stock markets. BBVA American Depositary Shares (ADSs) traded on the New York Stock Exchange. Also, as of June 30, 2016, the shares of BBVA Banco Continental, S.A., Banco Provincial S.A., BBVA Colombia, S.A., BBVA Chile, S.A., and BBVA Banco Frances, S.A. were listed on their respective local stock markets. BBVA Banco Frances, S.A. is also listed on the Latin American market (Latibex) of the Madrid Stock Exchange and on the New York Stock Exchange.
As of June 30, 2016, State Street Bank and Trust Co., Chase Nominees Ltd and The Bank of New York Mellon SA NV in their capacity as international custodian/depositary banks, held 12.39%, 4.70%, and 5.33% of BBVA common stock, respectively. Of said positions held by the custodian banks, BBVA is not aware of any individual shareholders with direct or indirect holdings greater than or equal to 3% of BBVA common stock outstanding.
On 5 July, 2016, the Blackrock, Inc. reported to the Spanish Securities and Exchange Commission (CNMV) that, it now has an indirect holding of BBVA common stock totaling 5,264%, of which 4,735% are voting rights attributed to shares and 0,529% are voting rights through financial instruments.
BBVA is not aware of any direct or indirect interests through which control of the Bank may be exercised. BBVA has not received any information on stockholder agreements including the regulation of the exercise of voting rights at its annual general meetings or restricting or placing conditions on the free transferability of BBVA shares. No agreement is known that could give rise to changes in the control of the Bank.
The changes in the heading “Common Stock” of the accompanying consolidated balance sheets are due to the following common stock increases:
Capital IncreaseNumber of
Shares
Common Stock
(Millions of Euros)
As of December 31, 2014 6,171,338,995 3,024
Dividend option - January 2015 53,584,943 26
Dividend option - April 2015 80,314,074 39
Dividend option - October 2015 61,442,106 30
As of December 31, 2015 6,366,680,118 3,120
Dividend option - April 2016 113,677,807 56
As of June 30, 2016 6,480,357,925 3,175
“Dividend Option” Program in 2016:
The AGM held on March 11, 2016 under Third Point of the Agenda, adopted four resolutions on capital increase to be charged to reserves, to once again implement the program called the “Dividend Option” (see Note 4), pursuant to article 297.1 a) of the Spanish Corporate Enterprises Act, conferring on the Board of Directors the authority to indicate the date on which said capital increases should be carried out, within one year of the date of the AGM, including the power not to implement any of the resolutions, when deemed advisable.
F-145
On March 31, 2016, the Board of Directors of BBVA approved the execution of the first of the capital increases charged to reserves agreed by the aforementioned AGM. As a result of this increase, the Bank’s capital increased by €55,702,125.43 through the issue and circulation of 113,677,807 shares with a €0.49 par value each.
“Dividend Option” Program in 2015:
The AGM held on March 13, 2015 under Point Four of the Agenda, adopted four resolutions on capital increase to be charged to reserves, to once again implement the program called the “Dividend Option” (see Note 4), pursuant to article 297.1 a) of the Spanish Corporate Enterprises Act, conferring on the Board of Directors the authority to indicate the date on which said capital increases should be carried out, within one year of the date of the AGM, including the power not to implement any of the resolutions, when deemed advisable.
Formerly, on December 17, 2014, Board of Directors of BBVA approved the execution of the third of the capital increases charged to reserves agreed by the aforementioned AGM. As of January 14, 2015, the Bank’s common stock increased by €26,256,622.07 through the issue and circulation of 53,584,943 ordinary shares with a €0.49 par value each, of the same class and series as the shares currently in circulation, without issuance premium and represented by book entries.
On March 25, 2015, the Board of Directors of BBVA approved the execution of the first of the capital increases charged to reserves agreed by the aforementioned AGM. As a result of this increase, the Bank’s capital increased by €39,353,896.26 through the issue and circulation of 80,314,074 shares with a €0.49 par value each.
Likewise, on September 30, 2015, the Board of Directors of BBVA approved the execution of the second of the capital increases charged to reserves agreed by the aforementioned AGM. As a result of this increase, the Bank’s capital increased by €30,106,631.94 through the issue and circulation of 61,442,106 shares with a €0.49 par value each.
Convertible and/or exchangeable securities:
At the AGM held on March 16, 2012 the shareholders resolved, in Point Five of the Agenda, to delegate to the Board of Directors the authority to issue bonds, convertible and/or exchangeable into BBVA shares, for a maximum total of €12 billion. The authority include the right to establish the different aspects and conditions of each issue; to exclude the pre-emptive subscription right of shareholders in accordance with the Corporations Act; to determine the basis and methods of conversion and/or exchange; and to increase the Banks common stock as required to address the conversion commitments.
During 2014 and 2013 respectively, BBVA, exercising the authority delegated by the AGM held on March 16, 2012 under point Five of its Agenda, issued perpetual securities eventually convertible into new ordinary shares of BBVA, (Additional level I capital instruments) without pre-emption rights, for a total amount of €1,500 million and $1,500 million (€1,378 million as of December 31, 2015). Similarly on February 10, 2015, BBVA issued perpetual securities eventually convertible into new ordinary shares of BBVA, (Additional level I capital instruments) without pre-emption rights, for a total amount of €1,500 million. On April 8, 2016, BBVA SA has agreed to carry out an issue of perpetual contingent convertible securities, convertible into issued ordinary shares of BBVA, without pre-emption rights, for a total amount of €1,000 million.
Other securities:
At the AGM held on March 13, 2015, in Point Three of the agenda, the shareholders resolve to delegate to the Board of Directors, the authority to issue, within the three-year maximum period stipulated by law, on one or several occasions, directly or through subsidiaries, with the full guarantee of the Bank, any type of fixed-income securities, documented in obligations, bonds of any kind, promissory notes, all type of covered bonds, warrants, mortgage participation, mortgage transfers certificates and preferred securities (that are totally or partially exchangeable for shares already issued by the Bank or by another company, in the market or which can be settled in cash), or any other fixed-income securities, in euros or any other currency, that can be subscribed in cash or in kind, registered or bearer, unsecured or secured by any kind of collateral, including a mortgage guarantee, with or without incorporation of rights to the securities (warrants), subordinate or otherwise, for a limited or indefinite period of time, up to a maximum nominal amount of €250 billion.
27. Share premium
As of June 30, 2016 and December 31, 2015, the balance under this heading in the accompanying consolidated balance sheets was €23,992 million. During the six months ended June 30, 2016 there were no changes.
F-146
The amended Spanish Corporation Act expressly permits the use of the share premium balance to increase capital and establishes no specific restrictions as to its use.
28. Retained earnings, revaluation reserves and other reserves
The breakdown of the balance under this heading in the accompanying consolidated balance sheet is as follows:
Retained earnings, revaluation reserves and other reserves.
Breakdown by conceptsNotes
June
2016
December
2015
Legal reserve 28.1 624 605
Restricted reserve for retired capital 28.2 224 213
Reserves for balance revaluations 20 22
Voluntary reserves 8,396 6,971
Total reserves holding company 9,264 7,811
Consolidation reserves attributed to the Bank and dependents consolidated companies. 14,420
14,701
Total 23,685 22,512
Millions of Euros
28.1 Legal reserve
Under the amended Corporations Act, 10% of any profit made each year must be transferred to the legal reserve. The transfer must be made until the legal reserve reaches 20% of the common stock.
The legal reserve can be used to increase the common stock provided that the remaining reserve balance does not fall below 10% of the increased capital. While it does not exceed 20% of the common stock, it can only be allocated to offset losses exclusively in the case that there are not sufficient reserves available.
28.2 Restricted reserves
As of June 30, 2016 and December 31, 2015, the Bank’s restricted reserves are as follows:
Restricted ReservesJune
2016
December
2015
Restricted reserve for retired capital 88 88
Restricted reserve for Parent Company shares and loans for those shares 134
123
Restricted reserve for redenomination of capital in euros 2 2
Total 224 213
Millions of Euros
The restricted reserve for retired capital resulted from the reduction of the nominal par value of the BBVA shares made in April 2000.
The most significant heading corresponds to restricted reserves related to the amount of shares issued by the Bank in its possession at each date, as well as the amount of customer loans outstanding at those dates that were granted for the purchase of, or are secured by, the Bank’s shares.
Finally, pursuant to Law 46/1998 on the Introduction of the Euro, a restricted reserve is recognized as a result of the rounding effect of the redenomination of the Bank’s common stock in euros.
F-147
28.3 Retained earnings, revaluation reserves and other reserves by entity
The breakdown, by company or corporate group, under the heading “Reserves” in the accompanying consolidated balance sheets is as follows:
Catalunya Banc Group and Unnim Real Estate (189) (403)
Bilbao Vizcaya Holding S.A 104 73
BBVA Autorenting, S.A. (38) (49)
Other 81 1
Subtotal 23,818 22,610
Reserves or accumulated losses of investments in
joint ventures and associates
Metrovacesa (139) (143)
Other 6 45
Subtotal (133) (98)
Total 23,685 22,512
Millions of Euros
For the purpose of allocating the reserves and accumulated losses to the consolidated entities and to the parent company, the transfers of reserves arising from the dividends paid and transactions between these entities are taken into account in the period in which they took place.
F-148
29. Treasury shares
In the six months ended June 30, 2016 and 2015 the Group entities performed the following transactions with shares issued by the Bank:
June 2016 June 2015
Treasury StockNumber of
Shares
Millions of
Euros
Number of
Shares
Millions of
Euros
Balance at beginning 38,917,665 309 41,510,698 350
+ Purchases 196,240,388 1,012 207,345,203 1,793
- Sales and other changes (206,800,398) (1,150) (240,558,916) (2,063)
+/- Derivatives on BBVA shares - - - (5)
+/- Other changes - (5) - -Balance at the end 28,357,655 166 8,296,985 75
Of which:
Held by BBVA, S.A. 6,497,039 33 2,838,648 27
Held by Corporación General Financiera, S.A. 21,860,616 133 5,426,095 48
Held by other subsidiaries - - 32,242 -
Average purchase price in Euros 5.16 8.64
Average selling price in Euros 5.56 8.60
Net gain or losses on transactions (Stockholders ' funds-Reserves) (34) 2
The percentages of treasury stock held by the Group in the six months ended June 30, 2016 and 2015 are as follows:
The number of BBVA shares accepted by the Group in pledge of loans as of June 30, 2016 and December 31, 2015 is as follows:
Shares of BBVA Accepted in PledgeJune
2016
December
2015
Number of shares in pledge 95,753,170 92,703,291
Nominal value 0.49 0.49
% of share capital 1.48% 1.46%
The number of BBVA shares owned by third parties but under management of a company within the Group as of June 30, 2016 and December 31, 2015 is as follows:
Shares of BBVA Owned by Third Parties but
Managed by the Group
June
2016
December
2015
Number of shares owned by third parties 93,545,132 92,783,913
Nominal value 0.49 0.49
% of share capital 1.44% 1.46%
F-149
30. Accumulated other comprehensive income
The breakdown of the balance under this heading in the accompanying consolidated balance sheets is as follows:
Millions of Euros
Accumulated other comprehensive incomeJune
2016
December
2015
Items that will not be reclassified to profit or loss (943) (859)
Actuarial gains or (-) losses on defined benefit pension plans (943) (859)
Non-current assets and disposal groups classified as held for sale - -Share of other recognized income and expense of investments in subsidiaries, joint ventures and associates - -
Other adjustments - -
Items that may be reclassified to profit or loss (3,384) (2,490)
Hedge of net investments in foreign operations [effective portion] (338) (274)
Non-current assets and disposal groups classified as held for sale - -Share of other recognized income and expense of investments in subsidiaries, joint ventures and associates (18) 64
Total (4,327) (3,349)
The balances recognized under these headings are presented net of tax.
The main variation is related to the conversion to euros of the financial statements balances from consolidated entities whose functional currency is not euros. In this regard, the increase in item "Foreign currency translation" in the above table in the first semester of 2016 is related to the depreciation of the exchange rates of the functional currencies against the euro.
31. Non-controlling interests
The breakdown by groups of consolidated entities of the balance under the heading “Non-controlling interests” of total equity in the accompanying consolidated balance sheets is as follows:
Millions of Euros
Non-Controlling InterestJune
2016
December
2015
BBVA Colombia Group 61 58BBVA Chile Group 335 314BBVA Banco Continental Group 926 913BBVA Banco Provincial Group 88 100BBVA Banco Francés Group 207 220Garanti Group (Note 3) 6,826 6,460Other companies 84 85Total 8,527 8,149
F-150
These amounts are broken down by groups of consolidated entities under the heading “Profit - Attributable to non-controlling interests” in the accompanying consolidated income statements:
Millions of Euros
Profit attributable to Non-Controlling InterestsJune
2016
June
2015
BBVA Colombia Group 5 7BBVA Chile Group 14 25BBVA Banco Continental Group 92 105BBVA Banco Provincial Group (6) 7BBVA Banco Francés Group 34 37Garanti Group (Note 3) 495 -Other companies 6 19Total 639 200
Dividends distributed to non-controlling interests of the Group during the six months ended June 30, 2016 are: BBVA Banco Continental €90 million, BBVA Chile €12 million, BBVA Banco Francés €12 million, Garanti Group €106 million, BBVA Colombia €4 million, and other Spanish entities accounted for €4 million.
32. Capital base and capital management
Capital base
As of June 30, 2016 and December 31, 2015, equity is calculated in accordance with current regulation on minimum capital base requirements for Spanish credit institutions –both as individual entities and as consolidated group– and how to calculate them, as well as the various internal capital adequacy assessment processes they should have in place and the information they should disclose to the market.
The minimum capital base requirements established by the current regulation are calculated according to the Group’s exposure to credit and dilution risk, counterparty and liquidity risk relating to the trading portfolio, exchange-rate risk and operational risk. In addition, the Group must fulfill the risk concentration limits established in said regulation and the internal corporate governance obligations.
The European Central Bank (ECB), following the Supervisory Review and Evaluation Process (SREP) conducted in 2015, has required that BBVA Group maintain a CET1 phased-in ratio of 9.5% at both individual and consolidated levels.
The ECB’s decision establishes that the required CET1 ratio of 9.5% includes:
• the minimum CET1 ratio required by Pillar 1; for these purposes Pillar 1 corresponds to the minimum CET1 ratio required by Article 92(1)(a) of Regulation (EU) No. 575/2013.
• the ratio required by Pillar 2 corresponds to the CET1 ratio required in excess of the minimum CET1 ratio, in accordance with Article 16(2)(a) of Regulation (EU) No. 1024/2013; and
• the capital conservation buffer which will be required starting on January 1, 2016 by Article 44 of Act 10/2014 and its implementing regulations.
Additionally, given that the Entity was included in 2014 on the list of global systemically important financial institutions, in 2016 BBVA will apply, at the consolidated level, a G-SIB buffer of 0.25%, bringing the total minimum requirement for phased-in CET1 in 2016 at the consolidated level to 9.75%.
However, since BBVA has been excluded from the list of global systemically important financial institutions in 2015 (which is updated every year by the Financial Stability Board (FSB)), as of January 1, 2017, the G-SIB buffer will only apply to BBVA in 2016, (notwithstanding the possibility that the FSB or the supervisor may include BBVA on it in the future).
Moreover, the supervisor has informed BBVA that it is included on the list of other systemically important financial institutions, and a D-SIB buffer of 0.5% of the fully-loaded ratio applies at the consolidated level. It will be implemented gradually from January 1, 2016 to January 1, 2019 by an increase of 0.125% annually. However, BBVA will not have to meet the D-SIB buffer in 2016, since the capital requirement for 2016 under the G-SIB buffer is greater than that for the D-SIB buffer. The D-SIB buffer shall therefore only apply beginning in January 1, 2017.
F-151
The Group’s bank capital in accordance with the aforementioned applicable regulation, considering entities scope required by the above regulation, as of June 30, 2016 and December 31, 2015 is shown below: (please note that the information for the latter period has been adapted to the new presentation format for comparison purposes):
Eligible capital resources
Reconciliation of total
equity with regulatory
capital June 2016 (*)
Reconciliation of total
equity with regulatory
capital December 2015
Capital 3,175 3,120
Share premium 23,992 23,992
Retained earnings, revaluation reserves and other reserves 23,685 22,512
Other equity instruments (net) 21 35
Treasury shares (166) (309)
Attributable to the parent company 1,832 2,642
Attributable dividend (777) (1,352)
Total Equity 51,762 50,640
Aaccumulated other comprehensive income (4,327) (3,349)
Non-controlling interests 8,527 8,149
Shareholders´ equity 55,962 55,440
Shares and other eligible preferred securities 6,179 5,302
Deductions (6,028) (4,411)
Intangible assets (5,679) (3,901)
Fin. treasury shares (90) (95)
Indirect treasury shares (260) (415)
Equity not eligible at solvency level (470) (828)
Temporary CET 1 adjustments (494) (788)
Capital gains from the Available-for-sale debt instruments
portfolio(711) (796)
Capital gains from the Available-for-sale equity portfolio 217 8
Differences from solvency and accounting level 25 (40)
Other adjustments and deductions (1,904) (1,647)
Common Equity Tier 1 (CET 1) 47,559 48,554
Additional Tier 1 before Regulatory Adjustments 6,179 5,302
Total Regulatory Adjustments of Aditional Tier 1 (3,374) (5,302)
Tier 1 50,364 48,554
Tier 2 11,742 11,646
Other deductions - -
Total Capital (Total Capital=Tier 1 + Tier 2) 62,106 60,200
- -
Total Minimum equity required (**) 38,557 38,125
Millions of Euros
(*) Provisional data
Variations in the amount of Tier 1 Common Equity in the above table are mainly explained by the organic generation of capital in the first semester leaning against the recurrence of the results and the efficient management and allocation of capital line with the strategic objectives of the Group.
Additionally, there is a negative effect on the minority interests and deductions due to the regulatory phase-in calendar of 60% in 2016 compared with 40% in 2015.
During the first semester of the year, BBVA Group has completed the additional Tier 1 capital recommended by the Regulator (1.5% of Risk-Weighted Assets) with the issuance of perpetual securities eventually convertible into shares, classified as additional Tier 1 equity instruments (contingent convertible) under the solvency rules and contributing to the ratio of Tier 1 stood at 12.7%
Finally, the total capital ratio is located at 15.7% reflecting the effects discussed above.
F-152
The increase in minimum capital requirements is mainly due to the consideration of the aforementioned new prudential capital requirements applicable to BBVA.
A reconciliation of the balance sheet to the accounting and regulatory scope (provisional data) as of June 30, 2016 is provided below:
Millions of Euros
Public balance sheet headingsPublic balance
sheet
Insurance
companies and
real estate
companies
Jointly-
controlled
entities and
other
adjustments
Regulatory
balance sheet
Cash and balances with central banks and other
demand deposits 25,127 - 151 25,278
Financial assets held for trading 84,532 (1,086) 2,416 85,862
Other financial assets designated at fair value
through profit or loss 2,148 (2,148) - -
Available for sale financial assets 90,638 (20,939) 25 69,724
Loans and receivables 470,543 (1,281) 1,777 471,039
Held to maturity investments 19,295 - - 19,295
Fair value changes of the hedged items in portfolio hedges of interest rate risk
83 - - 83
Hedging derivatives 3,628 (126) (9) 3,493
Non-current assets held for sale3,152 (18) (42) 3,092
Investments in entities accounted for using the equity method 1,131 4,517 (150) 5,498
Other 45,763 (2,223) 1,688 45,228
Total assets 746,040 (23,304) 5,856 728,592
Capital management
Capital management in the BBVA Group has a twofold aim:
• Maintain a level of capitalization according to the business objectives in all countries in which it operates and, simultaneously,
• Maximize the return on shareholders’ funds through the efficient allocation of capital to the different units, a good management of the balance sheet and appropriate use of the various instruments forming the basis of the Group’s equity: shares, preferred securities and subordinate debt.
This capital management is carried out determining the capital base and the solvency ratios established by the prudential and minimum capital requirements also have to be met for the entities subject to prudential supervision in each country.
The current regulation allows each entity to apply its own internal ratings-based (IRB) approach to risk assessment and capital management, subject to Bank of Spain approval. The BBVA Group carries out an integrated management of these risks in accordance with its internal policies and its internal capital estimation model has received the Bank of Spain’s approval for certain portfolios (see Note 7).
F-153
33. Commitments and guarantees given
The breakdown of the balance under these headings in the accompanying consolidated balance sheets is as follows:
Millions of euros
Loan commitments and financial guarantees June
2016
December
2015
Financial guarantees given
Collateral, bank guarantees and indemnities 39,419 39,971Rediscounts, endorsements and acceptances 654 538Letter of credit and others 10,054 9,367
Total financial guarantees given 50,127 49,876
Loan Commitments given
Balances drawable by third parties: 108,759 123,620Credit institutions 852 921Government and other government agencies 2,400 2,570Other resident sectors 27,345 27,334Non-resident sector 78,162 92,795
Other contingent liabilities 16,685 12,113Total loan commitments given 125,444 135,733
Total Loan commitments and financial guarantees 175,571 185,609
Non performing financial guarantees given amounted €622 and €664 million as of June 30, 2016 and December 31, 2015, respectively.
Since a significant portion of the amounts above will expire without any payment being made by the consolidated entities, the aggregate balance of these commitments cannot be considered the actual future requirement for financing or liquidity to be provided by the BBVA Group to third parties.
In the six months ended June 30, 2016 and in 2015 no issuance of debt securities carried out by associates of the BBVA Group, joint venture entities or non-Group entities have been guaranteed.
34. Other contingent assets and liabilities
As of June 30, 2016 and December 31, 2015 there were no material contingent assets or liabilities other than those disclosed in the accompanying notes to the financial statements.
F-154
35. Purchase and sale commitments and future payment obligations
The breakdown of purchase and sale commitments of the BBVA Group as of June 30, 2016 and December 31, 2015 is as follows:
Millions of Euros
Purchase and Sale Commitments NotesJune
2016
December
2015
Financial instruments sold with repurchase commitments 49,522 68,401
Central Banks 9 2,583 19,065
Credit Institutions 22.1 28,298 26,069
General governments 22.2 - 7,556
Other resident sectors 22.2 12,157 11,092
Non-resident sectors 22.2 6,484 4,619
Financial instruments purchased with resale commitments 16,186 16,935
Central Banks 9 198 149
Credit Institutions 13.1 10,347 11,749
General governments 13.2 664 326
Other resident sectors 13.2 4,547 3,952
Non-resident sectors 13.2 430 758
A breakdown of the maturity of other payment obligations, not included in previous notes, due after June 30, 2016 is provided below:
Millions of Euros
Maturity of Future Payment Obligations Up to 1 Year 1 to 3 Years 3 to 5 Years Over 5 Years Total
As of June 30, 2016 and December 31, 2015 the details of the most significant items under this heading are as follows:
Millions of Euros
Transactions on Behalf of Third PartiesJune
2016
December
2015
Financial instruments entrusted by third parties 678,667 664,911Conditional bills and other securities received for collection 16,315 15,064Securities lending 3,875 4,125
698,858 684,100
F-155
As of June 30, 2016 and December 31, 2015 the customer funds managed by the BBVA Group are as follows:
Millions of Euros
Customer Funds by TypeJune
2016
December
2015
Asset management by type of customer (*):
Collective investment 53,487 54,419Pension funds 32,061 31,542Customer portfolios managed on a discretionary basis 41,198 42,074Of which:
Portfolios managed on a discretionary 17,421 19,919Other resources 3,370 3,786
Customer resources distributed but not managed by type of
The breakdown of the interest and similar income recognized in the accompanying consolidated income statement is as follows:
Millions of Euros
Interest Income
Breakdown by Origin
June
2016
June
2015
Central Banks 99 62Loans and advances to credit institutions 161 102
Loans and advances to customers 10,635 8,310
General governments 213 294
Resident sector 1,521 1,690
Non resident sector 8,901 6,326
Debt securities 2,135 1,563
Held for trading 494 505
Available-for-sale financial assets 1,641 1,059
Adjustments of income as a result of hedging transactions (208) (161)
Insurance activity 569 507
Other income 311 282Total 13,702 10,665
The amounts recognized in consolidated equity in connection with hedging derivatives and the amounts derecognized from consolidated equity and taken to the consolidated income statement during both periods are given in the accompanying “Consolidated statements of recognized income and expenses”.
F-156
The following table shows the adjustments in income resulting from hedge accounting, broken down by type of hedge:
Millions of Euros
Adjustments in Income Resulting from Hedge AccountingJune
The change in the balance under the headings “Interest and similar income” and “Interest and similar expenses” in the accompanying consolidated income statements is the result of exchange rate effect, changing prices (price effect) and changing volume of activity (volume effect), as can be seen below:
June 2016
/June 2015
June 2015 /
June 2014
Interest Income and Expenses
Change in the Balance
Volume
Effect (1)
Price Effect
(2)Total Effect
Volume
Effect (1)
Price Effect
(2)Total Effect
Cash and balances with central banks and other demand deposits - 3 4 2 (2) -
Securities portfolio and derivatives 27 584 611 402 (631) (228)
Loans and advances to Central Banks 89 (53) 37 (63) 15 (48)
Loans and advances to credit institutions 5 38 43 39 (69) (30)
Loans and advances to customers In Euros 185 (448) (263) 226 (552) (326)
In other currencies 1,659 915 2,574 2,106 (1,838) 268
Other assets 15 17 32 10 18 29 Interest income 3,037 (335)
Deposits from central banks and credit institutions 97 244 341 71 (140) (68)
(1) The volume effect is calculated as the result of the interest rate of the initial period multiplied by the difference between the average balances of both periods.
(2) The price effect is calculated as the result of the average balance of the last period multiplied by the difference between the interest rates of both periods.
F-158
38. Dividend income
The balances for this heading in the accompanying consolidated income statements correspond to dividends on shares and equity instruments other than those from shares in entities accounted for using the equity method (see Note 39), as can be seen in the breakdown below:
Millions of Euros
Dividend IncomeJune
2016
June
2015
Dividends from:Financial assets held for trading 106 89Available-for-sale financial assets 195 147
Total 301 236
39. Share of profit or loss of entities accounted for using the equity method
“Investments in Entities Accounted for Using the Equity Method” amounted to €1 million for the first semester of 2016 compared with the €195 million recorded for the first semester of 2015, mainly as a result of the decrease in the contribution from Garanti Group due to the change in consolidation method (see Note 3).
40. Fee and commission income
The breakdown of the balance under this heading in the accompanying consolidated income statements is as follows:
Millions of Euros
Fee and Commission IncomeJune
2016
June
2015
Bills receivables 27 38
Demand accounts 224 176
Credit and debit cards 1,293 937
Checks 100 115
Transfers and others payment orders 278 187
Insurance product commissions 88 61
Commitment fees 121 84
Contingent risks 201 154
Asset Management 415 416
Securities fees 171 143
Custody securities 60 67
Other fees and commissions 335 424
Total 3,313 2,801
F-159
41. Fee and commission expenses
The breakdown of the balance under this heading in the accompanying consolidated income statements is as follows:
Millions of Euros
Fee and Commission ExpensesJune
2016
June
2015
Commissions for selling insurance 30 37
Credit and debit cards 613 414
Transfers and others payment orders 51 39
Other fees and commissions 269 192
Total 963 682
42. Gains (losses) on financial assets and liabilities (net)
The breakdown of the balance under this heading, by source of the related items, in the accompanying consolidated income statements is as follows:
Millions of Euros
Gains or losses on financial assets and liabilities
Breakdown by Heading of the Balance Sheet
June
2016
June
2015
Gains or losses on derecognition of financial assets and liabilities not measured at fair value through profit or loss, net 683 649
Available-for-sale financial assets 469 613
Loans and receivables 77 37
Other 137 (1)
Gains or losses on financial assets and liabilities designated at fair value through profit or loss, net 24 17
Gains or losses on financial assets and liabilities held for trading, net 106 161
Gains or losses from hedge accounting, net (171) -Total 642 826
The breakdown of the balance under this heading in the accompanying income statements by the nature of financial instruments is as follows:
Millions of Euros
Gains or losses on financial assets and liabilities
Breakdown by nature of the Financial Instrument
June
2016
June
2015
Debt instruments 510 303
Equity instruments (149) 160
Loans and advances to customers 33 40
Derivatives 249 316
Costumer deposits 3 (6)
Other (4) 14Total 642 826
F-160
The breakdown of the balance of the impact of the derivatives (trading and hedging) under this heading in the accompanying consolidated income statements is as follows:
In addition, in the six months ended June 30, 2016 and 2015, under the heading “Gains or losses on financial assets and liabilities held for trading, net” of the consolidated income statement, net amounts of positive €253 million and positive €105 million, respectively, were recognized for transactions with foreign exchange trading derivatives.
43. Other operating income and expenses and insurance and reinsurance contracts incomes and expenses
The breakdown of the balance under the headings “Other operating income” and “Income on insurance and reinsurance contracts” in the accompanying consolidated income statements is as follows:
Millions of Euros
Other operating income and income on insurance
and reinsurance contracts
June
2016
June
2015
Other operating income 716 546
Financial income from non-financial services 447 358 Of which: Real estate companies 296 267
Rest of other operating income 268 189
Of which: from rented buildings 39 43
Income on insurance and reinsurance contracts 1,958 1,725
Total 2,673 2,271
F-161
The breakdown of the balance under the heading “Other operating expenses” and “Expenses on insurance and reinsurance contracts” in the accompanying consolidated income statements is as follows:
Millions of Euros
Other operating expenses and expenses on insurance and
reinsurance contracts
June
2016
June
2015
Other operating expenses 1,186 911
Change in inventories 312 264
Of Which: Real estate companies 258 233
Rest of other operating expenses 874 647
Expenses on insurance and reinsurance contracts 1,446 1,233
Total 2,632 2,144
44. Administration costs
44.1 Personnel expenses
The breakdown of the balance under this heading in the accompanying consolidated income statements is as follows:
Millions of euros
Personnel Expenses NotesJune
2016
June
2015
Wages and salaries 2,587 2,221
Social security costs 403 348 Defined contribution plan expense 25 45 44 Defined benefit plan expense 25 34 33
Other personnel expenses 255 242
Total 3,324 2,888
F-162
The breakdown of the average number of employees in the BBVA Group in the six months ended June 30, 2016 and 2015 by professional categories and geographical areas, is as follows:
Other non-banking companies 17,077 17,038 Total 137,463 110,583
Of Which:Men 63,053 52,056 Women 74,410 58,527
BBVA, S.A. 25,077 25,754
(*) Increases due to changes of scope (see Note 3).
The breakdown of the number of employees in the BBVA Group as of June 30, 2016 and 2015 by category and gender, is as follows:
Number of Employees at the period end June 2016 June 2015
Professional Category and Gender Male Female Male Female
Management Team 1,389 353 1,546 358
Other line personnel 38,881 38,978 31,942 29,132
Clerical staff 22,770 34,939 20,288 30,962
Total 63,040 74,270 53,776 60,452
43.1.1 Share-based employee remuneration
The amounts recognized under the heading “Personnel expenses - Other personnel expenses” in the consolidated income statements for the six months ended June 30, 2016 and 2015 corresponding to the plans for remuneration based on equity instruments in each year, amounted to €20 and €16 million, respectively. These amounts have been recognized with a corresponding entry under the heading “Stockholders’ funds - Other equity instruments” in the accompanying consolidated balance sheets, net of tax effect.
F-163
The characteristics of the Group's remuneration plans based on equity instruments are described below.
System of Variable Remuneration in Shares
In BBVA, the annual variable remuneration applying to all employees consists of a one incentive only, paid in cash, awarded once a year and linked to the achievement of previously established goals and to a sound risk management based on the design of incentives that are aligned with the company’s long-term interests and that take into account current and future risks (hereinafter, the “Annual Variable Remuneration”).
Nevertheless, the remuneration policy of the BBVA Group, in force since 2015, has a specific settlement and payment scheme of the Annual Variable Remuneration applicable to those employees, including the executive directors and members of the BBVA Senior Management, performing professional activities that may have a significant impact on the risk profile of the Group or engaged in control functions (hereinafter, the "Identified Staff"), that includes, among others, the payment in shares of part of their Annual Variable Remuneration.
This remuneration policy was approved for the directors by the Annual General Meeting, March 13, 2015.
The specific settlement and payment scheme for the Annual Variable Remuneration of executive directors and members of the Senior Management is described in Note 54, while the rules listed below are applicable to the rest of the Identified Staff:
• The Annual Variable Remuneration of members of the Identified Staff will be paid in equal parts in cash and
BBVA shares.
• The payment of 40% of the Annual Variable Remuneration, - 50% in the case of the executive directors and the members of the Senior Management - both in cash and in shares, will be deferred in its entirety for three years. Its accrual and payment will be subject to compliance with a series of multi-year indicators related to share performance and the Group’s basic control and risk management metrics measuring solvency, liquidity and profitability, which will be calculated throughout the deferral period (hereinafter “Multi-year Performance Indicators”). These Multi-year Performance Indicators may lead to a reduction in the amount deferred, and might even bring it down to zero, but they will not be used under any circumstances to increase the aforementioned deferred remuneration.
• All the shares delivered to these beneficiaries would be unavailable for a period of time after they have vested, according to the rules explained in the previous paragraph. This withholding will be applied against the net amount of the shares, after deducting any tax accruing on the shares received.
• A prohibition is also established against hedging with unavailable vested shares and shares pending reception.
• Moreover, circumstances have been established in which the payment of the deferred Annual Variable Remuneration may be limited or impeded ("malus" clauses), as well as the adjustment to update these deferred parts.
• Finally, the variable component of the remuneration corresponding to any one financial year of those in the Identified Staff will be limited to an upper threshold of 100% of the fixed component of the total remuneration, unless the General Meeting should resolve to raise this limit which, in any event, may not exceed 200% of the fixed component of the total remuneration.
In this regard, the Annual General Meeting held on March 14, 2014 resolved, in line with applicable legislation, the application of the maximum level of variable remuneration up to 200% of the fixed remuneration for a specific group of employees whose professional activities have a material impact on the Group’s risk profile or are engaged in control functions. Additionally, the General Meeting held on March 13, 2015, resolved to enlarge this group, whose variable remuneration will be subject to the maximum threshold of 200% of the fixed component of their total remuneration. This is entirely consistent with the Recommendations Report issued by the BBVA's Board of Directors on February 3, 2015.
According to the settlement and payment scheme mentioned above, in the first half of 2016 a number of 5,187,750 shares corresponding to the initial payment of 2015 Annual Variable Remuneration were delivered to the beneficiary members of the Identified Staff.
Additionally, the remuneration policy prevailing until 2014 provided a specific settlement and payment scheme for the variable remuneration of the Identified Staff that established a deferral period of three years for the Annual Variable Remuneration, being the deferred amount paid in thirds over this period.
F-164
According to this prior scheme, during the first half of 2016 the shares corresponding to the deferred parts of the Annual Variable Remuneration paid in shares from previous years, and their corresponding adjustments in cash, were delivered to the beneficiary members of the Identified Staff, giving rise during the first half 2016, of a total of 945,053 shares corresponding to the first deferred third of the 2014 Annual Variable Remuneration were granted, and €349,670 as adjustments for updates of the shares granted; a total of 438,082 shares corresponding to the second deferred third of the 2013 Annual Variable Remuneration, and €340,828 in adjustments for updates; and a total of 502,622 shares corresponding to the final third of the 2012 Annual Variable Remuneration, with €551,879 in adjustments for updates.
Likewise, in the first half of 2016 the Identified Staff received the shares corresponding to the deferred parts of the long-term incentive programmes in the United States, as outlined below:
When the term of the Long-Term Incentive 2010-2012 Plan for the BBVA Compass Management Team ended, on December 31, 2012, it was settled pursuant to the conditions established when it began.
For those beneficiaries of this programme who are members of the Identified Staff, it was agreed that the same settlement and payment rules would be applied mentioned above, in line with the remuneration policy in force prior to 2015 which established a payment of the deferred amount in thirds over the deferral period.
Thus, in the first half of 2016 those beneficiaries who are members of the Identified Staff in BBVA Compass have been awarded 6,314 shares, corresponding to the last third of the deferred part of the shares resulting from the settlement of the 2010-2012 Long-Term Incentive Share Plan, and €6,933 in the adjustment to the updated share value.
Additionally, BBVA Compass' remuneration structure includes long-term incentive programmes for remuneration in shares for employees in certain key positions. These plans run over a three-year term. On June 30, 2016 there is one programme in force (2014-2016). During the first half of 2016, 206,190 shares corresponding to this programme were delivered.
44.2 General and administrative expenses
The breakdown of the balance under this heading in the accompanying consolidated income statements is as follows:
Millions of Euros
General and Administrative ExpensesJune
2016
June
2015
Technology and systems 333 293
Communications 151 122
Advertising 205 170
Property, fixtures and materials 547 468
Of which: Rent expenses (*) 313 271Taxes other than income tax 228 203Other expenses 855 783
Total 2,319 2,039
(*) The consolidated companies do not expect to terminate the lease contracts early.
F-165
45. Depreciation
The breakdown of the balance under this heading in the accompanying consolidated income statements is as follows:
Millions of Euros
Depreciation NotesJune
2016
June
2015
Tangible assets 17 345 287
For own use 333 276
Investment properties 12 11
Assets leased out under financial lease - -
Other Intangible assets 18.2 344 285
Total 689 572
46. Provisions or reversal of provisions
In the six months ended June 30, 2016 and 2015 the net provisions charged to in this heading of the income statement were as follows:
Millions of Euros
Provisions or reversal of provisions NotesJune
2016
June
2015
Pensions and other post employment defined benefit obligations 25 195 309
Commitments and guarantees given 13 1
Pending legal issues and tax litigation 27 11
Other Provisions 27 71
Total 262 392
47. Impairment or reversal of impairment on financial assets not measured at fair value through profit or loss
The breakdown of Impairment or reversal of impairment on financial assets not measured at fair value through profit or loss by the nature of those assets in the accompanying consolidated income statements is as follows:
Millions of Euros
Impairment or reversal of impairment on financial assets not
measured at fair value through profit or lossNotes
June
2016
June
2015
Available-for-sale financial assets 12 133 3
Debt securities 125 2
Other equity instruments 8 1Loans and receivables 7.3.5 1,977 2,134
Of which: Recovery of written-off assets 7.3.4 263 213Total 2,110 2,137
F-166
48. Impairment or reversal of impairment on non-financial assets
The impairment losses on non-financial assets broken down by the nature of those assets in the accompanying consolidated income statements are as follows:
Millions of Euros
Impairment or reversal of impairment on non-financial assets NotesJune
2016
June
2015
Intangible assets 18.1 - -
Other intangible assets 18.2 - 3
Tangibles assets for own use 17 9 16
Investment properties 17 10 9
Inventories 20 80 100
Total 99 128
49. Gains (losses) on derecognized of non-financial assets and subsidiaries, net
The breakdown of the balance under this heading in the accompanying consolidated income statements is as follows:
Millions of Euros
Gains or losses on derecognition of non-financial assets and
investments in subsidiaries, joint ventures and associates, net
June
2016
June
2015
Gains
Disposal of investments in subsidiaries 29 (25)
Disposal of tangible assets and other 32 51
Losses:
Disposal of investments in subsidiaries - -
Disposal of tangible assets and other (24) (3)
Total 37 23
F-167
50. Profit or loss from non-current assets and disposal groups classified as held for sale not qualifying as discontinued operations
The main items included in the balance under this heading in the accompanying consolidated income statements are as follows:
Millions of Euros
Profit or loss from non-current assets and disposal groups
classified as held for sale not qualifying as discontinued
operations
NotesJune
2016
June
2015
Gains on sale of real estate 19 12
Impairment of non-current assets held for sale 21 (94) (99)
Gains on sale of investments classified as non current assets held for sale - -
Gains on sale of equity instruments classified as non current assets held for sale (*) - 878
Total (75) 791
(*) Includes various sales in CNCB (see Note 3)
51. Consolidated statements of cash flows
Cash flows from operating activities decreased in the six months ended June 30, 2016 by €5,449 million (compared with an increase of €2,086 million in six months ended June 30 2015). The most significant reason for the change occurred under the heading “Loans and receivables” and “Financial assets held for trading”.
The variances in cash flows from investing activities decreased in the six months ended June 30, 2016 by €1,703 million (€1,867 million decrease in same period of 2015). The most significant reason for the change occurred under the heading “Held-to-maturity investments” as a result of the acquisition of held to maturity portfolio by the end of the first half of 2016.
The variances in cash flows from financing activities increased in the six months ended June 30, 2016 by €53 million (€1,215 million increase in same period of 2015).
F-168
52. Accountant fees and services
The details of the fees for the services contracted by entities of the BBVA Group in the six months ended June 30, 2016 with their respective auditors and other audit entities are as follows:
Millions of Euros
Fees for Audits Conducted June 2016
Audits of the companies audited by firms belonging to the Deloitte
worldwide organization and other reports related with the audit (*)15.2
Other reports required pursuant to applicable legislation and tax regulations issued by the national supervisory bodies of the countries in which the Group operates, reviewed by firms belonging to the Deloitte worldwide organization
1.7
Fees for audits conducted by other firms 0.4
Total
Of which:
Spain -
Mexico -
USA 0.1
(*) Including fees pertaining to annual statutory audits (€11.6 million).
In the six months ended June 30, 2016, other entities in the BBVA Group contracted other services (other than audits) as follows:
Millions of Euros
Other Services Contracted June 2016
Firms belonging to the Deloitte worldwide organization 0.5
Other firms 13.4
The services provided by the auditors meet the independence requirements established under Audit of Accounts Law RD 1/2011 and under the Sarbanes-Oxley Act of 2002 adopted by the Securities and Exchange Commission (SEC); accordingly they do not include the performance of any work that is incompatible with the auditing function.
53. Related-party transactions
As financial institutions, BBVA and other entities in the Group engage in transactions with related parties in the normal course of their business. All of these transactions are not material and are carried out under normal market conditions. As date of June 30, 2016 and 2015, the following are the transactions with related parties:
53.1 Transactions with significant shareholders
As of June 30, 2016 and 2015, there were no shareholders considered significant (see Note 26).
F-169
53.2 Transactions with BBVA Group entities
The balances of the main aggregates in the accompanying consolidated balance sheets arising from the transactions carried out by the BBVA Group with associates and joint venture entities accounted for using the equity method are as follows:
Millions of Euros
Balances arising from transactions with Entities of the GroupJune
2016
December
2015
Assets:
Loans and advances to credit institutions 5 122 Loans and advances to customers 471 710
Financial guarantees given 1,654 1,671Contingent commitments 11 28
The balances of the main aggregates in the accompanying consolidated income statements resulting from transactions with associates and joint venture entities that are accounted for under the equity method are as follows:
Millions of Euros
Balances of Income Statement arising from transactions with
Entities of the Group
June
2016
June
2015
Income statement:
Financial incomes 15 28Financial costs - 2Fee and Commission Income 4 5Fee and Commission Expenses 27 19
There were no other material effects in the consolidated financial statements arising from dealings with these entities, other than the effects from using the equity method (see Note 2.1) and from the insurance policies to cover pension or similar commitments, as described in Note 25; and the futures transactions arranged by BBVA Group with these entities, associates and joint ventures.
In addition, as part of its normal activity, the BBVA Group has entered into agreements and commitments of various types with shareholders of subsidiaries and associates, which have no material effects on the accompanying consolidated financial statements.
53.3 Transactions with members of the Board of Directors and Senior Management
The information on the remuneration of the members of the BBVA Board of Directors and Senior Management is included in Note 54.
As of June 30, 2016 there were no loans granted by the Group’s entities to the members of the Board of Directors. As of December 31, 2015, the amount availed against the loans by the Group’s entities to the members of the Bank’s Board of Directors was €200 thousand. As of June 30, 2016 and December 31, 2015 the amount availed against the loans by the Group’s entities to the members of Senior Management (excluding the executive directors) amounted to €6,107 and €6,641 thousand, respectively.
F-170
As of June 30, 2016, there were no loans granted to parties related to the members of the Board of Directors and as of December 31, 2015, the amount availed against the loans to parties related to the members of the Bank’s Board of Directors was €10,000 thousand. As of June 30, 2016 and December 31, 2015 the amount availed against the loans to parties related to members of the Senior Management amounted to €83 and €113 thousand, respectively.
As of June 30, 2016 and December 31, 2015 no guarantees had been granted to any member of the Board of Directors.
As of June 30, 2016 and December 31, 2015 no guarantees had been granted to any member of the Senior Management
As of June 30, 2016 and December 31, 2015 the amount availed against commercial loans and guarantees arranged with parties related to the members of the Bank’s Board of Directors and the Senior Management totaled €8 and €1,679 thousand, respectively.
53.4 Transactions with other related parties
In the six months ended June 30, 2016 and December 31, 2015 the Group did not conduct any transactions with other related parties that are not in the ordinary course of its business, which were carried out at arm's-length market conditions and of marginal relevance; whose information is not necessary to give a true picture of the BBVA Group’s consolidated net equity, result of operations and financial condition.
54. Remuneration and other benefits received by the Board of Directors and members of the Bank’s Senior Management
• Remuneration for non-executive directors received in the first half of 2016
The remuneration paid to the non-executive members of the Board of Directors during the first half of 2016 is indicated below. The figures are given individually for each non-executive director and itemized:
Thousands of Euros
Remuneration for non-executive
directors
Board of
Directors
Executive
Committee
Audit &
Compliance
Committee
Risks
Committee
Remuneration
Committee
Appointments
Committee
Technology and
Cybersecurity
Committee
Total
Tomás Alfaro Drake 64 - 36 - 11 51 4 165
José Miguel Andrés Torrecillas 64 - 89 53 - 10 - 217
José Antonio Fernández Rivero 64 42 - 53 11 10 - 180
Belén Garijo López 64 - 36 - 11 - - 111
Sunir Kumar Kapoor (1) 43 - - - - - 4 46
Carlos Loring Martínez de Irujo 64 42 18 27 27 - - 177
Lourdes Máiz Carro 64 - 36 - - 10 - 110
José Maldonado Ramos 64 83 - - - 20 - 168
José Luis Palao García-Suelto 64 - - 53 11 10 - 139
Juan Pi Llorens 64 - 18 27 37 - 4 150
Susana Rodríguez Vidarte 64 83 - 53 - 20 - 222
James Andrew Stott (2) 43 - - 53 11 - 4 111
Total (3) 729 250 232 321 118 132 14 1,797
(1) Mr Sunir Kumar Kapoor was appointed director upon resolution of the General Meeting held on March 11, 2016.
(2) Mr James Andrew Stott was appointed director upon resolution of the General Meeting held on March 11, 2016.
(3) Includes the amounts for the different memberships of the committees during the first half of 2016. The composition of these committees was changed in March 31, 2016. In addition, Mr Ramón Bustamante y de la Mora and Mr Ignacio Ferrero Jordi, that ceased as directors on March 11, 2016, received the total amount of €70 thousand and €85 thousand, respectively, for their membership of the Board of Directors and the different Board Committees.
Moreover, during the first half of 2016, €132 thousand was paid in healthcare and casualty insurance premiums for non-executive members of the Board of Directors.
F-171
• Remuneration of executive directors received in the first half of 2016
The remuneration scheme for the executive directors is in line with the general model applied to BBVA’s senior managers. This comprises a fixed remuneration and a variable remuneration, made up of a single incentive (hereinafter the "Annual Variable Remuneration").
Thus, during the first half of 2016, the executive directors were paid the fixed remuneration corresponding to the first six months of the year, and the Annual Variable Remuneration corresponding to 2015 which payment vested during the first quarter of the year 2016, according to the settlement and payment system, approved by the General Meeting on March 13, 2015 as part of the remuneration policy for BBVA directors (hereinafter the "Settlement and Payment System"). The Settlement and Payment System determines that:
• The Annual Variable Remuneration will be paid in equal parts in cash and in BBVA shares.
• 50% of the Annual Variable Remuneration, in cash and in shares, will be deferred in its entirety for a three-year period, and its accrual and vesting shall be subject to compliance with a series of multi-year indicators.
• All the shares delivered to these beneficiaries pursuant to the rules explained in the previous paragraph will be unavailable for a period of time after they have vested. This withholding will be applied against the net amount of the shares, after discounting the necessary part to pay the tax accruing on the shares received.
• A prohibition is also established against hedging with unavailable vested shares and shares pending delivery.
• Moreover, circumstances have been established in which vesting of the deferred Annual Variable Remuneration payable may be limited or impeded ("malus" clauses).
• The deferred parts of the Annual Variable Remuneration will be adjusted to update under the terms established by the Board of Directors.
Likewise, in application of the settlement and payment system of the Annual Variable Remuneration from 2014, 2013 and 2012, under the applicable policy for those years, the executive directors have received the deferred parts of the Annual Variable Remuneration of those years, which vested in the first quarter of year 2016.
Pursuant to the above, the remuneration paid to the executive directors during the first half of 2016 is shown below. The figures are given individually for each executive director and itemized:
Total 2,337 1,526 1,180 5,043 230,071 136,384 366,455
(1) Amounts corresponding to 50% of 2015 Annual Variable Remuneration.
(2) Amounts corresponding to the sum of the deferred parts of the Annual Variable Remuneration from previous years (2014, 2013 and
2012), and their respective updated cash adjustments, payment or delivery of which was made in the first half of 2016, in application of the settlement and payment system, as broken down below:
- 1st third of deferred Annual Variable Remuneration from 2014
Under this item, the executive directors received: €302 thousand and 37,392 BBVA shares in the case of the Group Executive Chairman; €95 thousand and 11,766 BBVA shares in the case of the CEO; and €30 thousand and 3,681 BBVA shares in the case of the executive director Head of GERPA.
F-172
- 2nd third of deferred Annual Variable Remuneration from 2013
Under this item, the executive directors received €289 thousand and 29,557 BBVA shares in the case of the Group Executive Chairman; €78 thousand and 7,937 BBVA shares in the case of the CEO; and €17 thousand and 1,768 BBVA shares in the case of the executive director Head of GERPA.
- 3rd third of deferred Annual Variable Remuneration from 2012
Under this item, the Group Executive Chairman received €301 thousand and 36,163 BBVA shares, while the CEO received €68 thousand and 8,120 BBVA shares.
The executive directors will receive, during the first quarter of each of the next two years, the amounts that in each case correspond in application of the settlement of the deferred Annual Variable Remuneration of previous years (2014 and 2013), and subject to the conditions established in the applicable settlement and payment system.
Likewise, during the first half of 2016, the executive directors received payment in kind, including insurance premiums, and others amounting to an overall total of €228 thousand, of which €17 thousand was paid to the Group Executive Chairman; €130 thousand to the CEO; and €81 thousand to the executive director Head of GERPA.
• Remuneration of the members of the Senior Management received in the first half of 2016
During the first half of 2016, the remuneration paid to the members of the BBVA Senior Management as a whole, excluding the executive directors, is shown below.
Thousands of Euros
Remuneration of members of the Senior ManagementFixed
Remuneration
2015 Annual
Variable
Remuneration in
cash (1)
Deferred
Variable
Remuneration in
cash (2)
Total Cash
2015 Annual
Variable
Remuneration in
BBVA Shares (1)
Deferred Variable
Remuneration in
BBVA Shares (2)
Total Shares
Total Members of the Senior Management (*) 5,696 3,461 1,782 10,939 521,946 206,258 728,204
(*) This section includes aggregate information regarding the members of the BBVA Group Senior Management, excluding executive directors, who were members of the Senior Management at 30th June 2016 (18 members).
(1) Amounts corresponding to 50% of 2015 Annual Variable Remuneration.
(2) Amounts corresponding to the sum of the deferred parts of the Annual Variable Remuneration of previous years (2014, 2013 and 2012), and their corresponding adjustments for updating in cash, payment or delivery of which was made in the first half of 2016, to the members of the Senior Management who had generated this right, as broken down below:
- 1st third of deferred Annual Variable Remuneration from 2014
Overall amount of €679 thousand and 84,211 BBVA shares.
- 2nd third of deferred Annual Variable Remuneration from 2013
Overall amount of €588 thousand and 60,244 BBVA shares.
- 3rd third of deferred Annual Variable Remuneration from 2012
Overall amount of €515 thousand and 61,803 BBVA shares.
During the first quarter of each of the next two years, Senior Management will receive the amounts that in each case correspond under the settlement and payment system of the variable remuneration applicable to each of them, stemming from the settlement of the deferred Annual Variable Remuneration from previous years (2014 and 2013) and subject to the conditions the system establishes.
Moreover, during the first half of 2016, all the members of the Senior Management, with the exception of the executive directors, received remuneration in kind, including insurance premiums and others for a total overall amount of €528 thousand.
F-173
• System of Remuneration in Shares with Deferred Delivery for non-executive directors
BBVA has a remuneration system in shares with deferred delivery for its non-executive directors, which was approved by the General Meeting, 18th March 2006 and extended under General Meeting resolutions in March 11, 2011 and in March 11, 2016, for a further 5-year period in each case.
This System is based on the annual allocation to non-executive directors of a number of "theoretical shares", equivalent to 20% of the total remuneration in cash received by each of them in the previous year, according to the closing prices of the BBVA share during the sixty trading sessions prior to the Annual General Meeting approving the corresponding financial statements for each year.
These shares, where applicable, will be delivered to each beneficiary on the date they leave the position as director for any reason other than dereliction of duty.
The number of “theoretical shares” allocated to the non-executive directors in the first semester of 2016 as beneficiaries of the system of deferred delivery of shares, corresponding to 20% of the total remuneration received in cash by said directors for these during 2015, is as follows:
Theoretical shares
allocated in 2016
Theoretical shares
accumulated to
30th June 2016
Tomás Alfaro Drake 11,363 62,452José Miguel Andrés Torrecillas 9,808 9,808José Antonio Fernández Rivero 12,633 91,046Belén Garijo López 6,597 19,463Carlos Loring Martínez de Irujo 10,127 74,970Lourdes Máiz Carro 5,812 8,443José Maldonado Ramos 11,669 57,233José Luis Palao García-Suelto 11,070 51,385Juan Pi Llorens 9,179 32,374Susana Rodríguez Vidarte 14,605 78,606
Total (1) 102,863 485,780
(1) In addition, in the first semester of 2016 Mr Ramón Bustamante y de la Mora and Mr Ignacio Ferrero Jordi, who ceased as directors on March 11, 2016, were allocated 8,709 and 11,151 theoretical shares, respectively.
• Pension commitments
The commitments undertaken regarding pension benefits for the CEO and the executive director Head of GERPA, pursuant to the Company Bylaws and their respective contracts with the Bank, include a pension system covering retirement, disability and death.
The CEO’s contractual conditions determine that he will retain the pension system to which he was entitled previously as senior manager in the Group, with the benefits and the provisions being adjusted to the new remuneration conditions of the position that he currently holds.
The executive director Head of GERPA retains the same pension system he has had since his appointment in 2013, comprising a defined-contributions system of 20% a year on the fixed remuneration received during the period to cover retirement commitments, as well as the provisions covering death and disability.
To such end, the provisions recorded as of 30th June 2016 to cover pension commitments undertaken for the
CEO stood at €14,969 thousand, of which, during the first half of 2016 and according to applicable accounting regulations, €1,151 thousand have been provisioned against earnings of the year and €820 thousand against equity, in order to adapt the interest rate assumption used in the valuation of pension commitments in Spain. In the case of the executive director Head of GERPA, the provisions recorded as of 30th June 2016 stood at €515
F-174
thousand of which, during the first half of 2016, €155 thousand have been provisioned against earnings of the year. In both cases, these amounts include the provisions covering retirement, as well as death and disability.
There are no other pension obligations in the name of other executive directors.
The provisions recorded at 30th June 2016 for pension commitments for members of the Senior Management, excluding executive directors, stood at €61,172 thousand, of which, during the first half of 2016, €3,039 thousand have been provisioned against earnings of the year and €2,993 thousand against equity, in order to adapt the interest rate assumption used in the valuation of pension commitments in Spain. These amounts include the provisions covering retirement, as well as death and disability
• Extinction of contractual relationship
The Bank has no commitments to pay severance indemnity to executive directors other than to the executive director Head of GERPA, whose contract recognizes his right to receive an indemnity equivalent to two times his fixed remuneration should he cease to hold his position on grounds other than his own will, death, retirement, disability or dereliction of duty.
The contractual conditions of the CEO with regard to his pension arrangements determine that in the event he ceases to hold his position on grounds other than his own will, retirement, disability or dereliction of duty, he will take early retirement with a pension that he may receive as a lifelong annuity or as a capital lump sum, at his own choice. The annual amount will be calculated as a function of the provisions which, according to the actuarial criteria applicable at any time, the Bank may have made to that date to cover the retirement pension commitments provided for in his contract, without this commitment in any way obliging the Bank to set aside additional provisions. Moreover, this pension may not be greater than 75% of the pensionable base should the event occur before he reaches the age of 55, or 85% of the pensionable base should the event occur after having reached the age of 55.
55. Other information
55.1 Environmental impact
Given the activities BBVA Group entities engage in, the Group has no environmental liabilities, expenses, assets, provisions or contingencies that could have a significant effect on its consolidated equity, financial situation and profits. Consequently, as of June 30, 2016, there is no item in the Group’s accompanying consolidated financial statements that requires disclosure in an environmental information report pursuant to Ministry of Economy Order JUS/206/2009 dated January 28, and consequently no specific disclosure of information on environmental matters is included in these financial statements.
55.2 Reporting requirements of the Spanish National Securities Market Commission (CNMV)
Dividends paid in the year
Excluding other shareholder remuneration such as the “Dividend Option”, in the six month ended June 30, 2016, a cash basis dividend was paid on January 11, 2016. In the six month ended June 30, 2015, there has been no cash dividend, regardless of the year in which they were accrued. See Note 4 for a complete analysis of all remuneration awarded to shareholders during the six months ended June 30, 2016 and 2015.
F-175
Earnings and ordinary income by operating segment
The detail of the consolidated profit for the six months ended June 30, 2016 and 2015 for each operating segment is as follows:
Millions of Euros
Profit Attributable by Operating SegmentsJune
2016
June
2015 (*)
Banking Activity in Spain 619 731
Real Estate Activity in Spain (209) (301)
Turkey 324 174
Rest of Eurasia 75 43
Mexico 968 1,045
South America 394 475
Rest of Eurasia 178 276
Subtotal operating segments 2,350 2,444
Corporate Center (518) 315Profit attributable to parent company 1,832 2,759
Non-assigned income - -Elimination of interim income (between segments) - -Other gains (losses) (**) 639 200
Income tax and/or profit from discontinued operations 920 941Operating profit before tax 3,391 3,899
(*) In the second semester of 2015, some operating results, related with technology, from the Corporate Center to the business area to the Banking activity in Spain were reclassified. This reclassification occurred as a result of the transfer, during 2015, of management skills, resources and responsibilities, in terms of technology, the Corporate Center to the business area Banking Activity in Spain The balance for June 2015 has been restated to facilitate comparison with June 2016
(**) Profit attributable to non-controlling interests.
For the six months ended June 30, 2016 and 2015 the detail of the BBVA Group’s Gross income for each operating segment, which is made up of the “Interest and similar income”, “Dividend income”, “Fee and commission income”, “Gains (losses) on financial assets and liabilities (net)” and “Other operating income”, is as follows:
Millions of Euros
Gross income by Operating SegmentsJune
2016
June
2015 (*)
Banking Activity in Spain 3,293 3,709
Real Estate Activity in Spain 11 (64)
Turkey (**) 2,154 510
Rest of Eurasia 281 265
Mexico 3,309 3,565
South America 1,999 2,296
The United States 1,330 1,321
Corporate Center (144) (49)
Adjustments and eliminations of ordinary profit between segments (***) - (335)Total Ordinary Profit BBVA Group 12,233 11,219
(*) The balance for June 2015 has been restated to facilitate comparison with June 2016 (see Note 1.3).
(**) The information is presented under management criteria according to which the assets and liabilities of Garanti Group are integrated proportionally based on our 25.01% interest in Garanti until July 2015, since then, as a consequence of the agreement detailed in Note 3, it is fully consolidated in the financial statements of the BBVA Group.
(***) Includes adjustments made to take account of the fact that in the consolidated financial statements, Garanti is accounted for using the equity method instead of using management criteria referred to above.
F-176
Interest and income by geographical area
The breakdown of the balance of “Interest and Similar Income” in the accompanying consolidated income statements by geographical area is as follows:
Millions of Euros
Interest Income
Breakdown by Geographical Area
June
2016
June
2015
Domestic market 2,882 3,255
Foreign 10,820 7,410
European Union 283 84
Other OECD countries 8,330 5,175
Other countries 2,206 2,151
Total 13,702 10,665
56. Subsequent events
From July 1, 2016 to the date of preparation of these consolidated financial statements, no other subsequent events not mentioned above in these financial statements have taken place that significantly affect the Group’s earnings or its equity position. The most relevant one is mentioned in Note 4 (Dividend payment) of the consolidated financial interim statements.
Appendices
A-1
APPENDIX I Additional information on consolidated subsidiaries and consolidated structured entities composing the BBVA Group
Additional Information on Consolidated Subsidiaries and consolidated structured entities composing the BBVA Group
% of Voting Rights Millions of Euros(*)
Controlled by the Bank Affiliate Entity Data
Company Location Activity Direct Indirect Total
Net
Carrying
Amount
Assets
30.06.16
Liabilities
30.06.16
Equity
30.06.16
Profit
(Loss)
30.06.16
4D INTERNET SOLUTIONS, INC UNITED STATES FINANCIAL SERVICES - 100.00 100.00 21 21 - 25 (4)
FIDEICOMISO F/403112-6 DE ADMINISTRACION DOS LAGOS MEXICO REAL ESTATE - 100.00 100.00 10 10 - 10 -
FIDEICOMISO HARES BBVA BANCOMER F/ 47997-2 MEXICO REAL ESTATE - 100.00 100.00 15 16 1 14 1FIDEICOMISO N.989, EN THE BANK OF NEW YORK MELLON, S.A. INSTITUCION
FTA TDA-22 MIXTO CATALUNYA BANC SA (CX) Dec-04 64 18
Millions of Euros
Securitization Fund (not consolidated) CompanyOrigination
Date
Total Securitized
Exposures at the
Origination Date
Total Securitized
Exposures as of June
30, 2016
FTA TDA13 BBVA, S.A. Dec-00 84 47
FTA TDA-18 MIXTO BBVA, S.A. Nov-03 91 88
2 PS RBS (ex ABN)
BBVA SOCIEDAD DE LEASING
INMOBILIARIO, S Sep-01 8 5
Millions of Euros
A-17
APPENDIX VI Details of the outstanding subordinated debt and preferred securities issued by the Bank or entities in the Group consolidated as of June 30, 2016 and December 31, 2015
Outstanding as of June 30, 2016 and December 31, 2015 of subordinated issues
Issuer Entity and Issued Date CurrencyJune
2016
December
2015
Prevailing Interest
Rate
as of June 30,
2016
Maturity
Date
Issues in Euros
BBVA
February-07 EUR 255 255 4.50% 16-Feb-22
March-08 EUR 125 125 6.03% 3-Mar-33
July-08 EUR 100 100 6.20% 4-Jul-23
February-14 EUR 1,500 1,500 7.00% Perpetual
February-15 EUR 1,500 1,500 6.75% Perpetual
April-16 EUR 1,000 - 8.88% Perpetual
Various EUR 325 310
Subtotal EUR 4,805 3,789
BBVA GLOBAL FINANCE, LTD. (*)
October-01 EUR 10 10 6.08% 10-Oct-16
October-01 EUR 46 46 0.35% 15-Oct-16
November-01 EUR 53 53 0.45% 02-Nov-16
December-01 EUR 56 56 0.44% 20-Dec-16
Subtotal EUR 165 165
BBVA SUBORDINATED CAPITAL, S.A.U. (*)
October-05 EUR 99 99 0.55% 13-Oct-20
April-07 EUR 68 68 0.57% 4-Apr-22
May-08 EUR 50 50 3.00% 19-May-23
July-08 EUR 20 20 6.11% 22-Jul-18
April-14 EUR 1,500 1,500 3.50% 11-Apr-24
Subtotal EUR 1,737 1,737
TURKIYE GARANTI BANKASI A.S
February-09 EUR - 50 - 31-Mar-21
Subtotal EUR - 50
Others - 1
Total issued in Euros 6,708 5,742
(*)'The issuances of BBVA International, Ltd., BBVA Capital Finance, S.A.U., BBVA International Preferred, S.A.U, BBVA Subordinated Capital, S.A.U.
and BBVA Global Finance, Ltd, are jo intly, severally and unconditionally guaranteed by the Bank
Millions of Euros
A-18
Outstanding as of June 30, 2016 and December 31, 2015 of subordinated issues (Continued)
Issuer Entity and Issued Date CurrencyJune
2016
December
2015
Prevailing Interest
Rate
as of June 30,
2016
Maturity
Date
Issues in foreign currency
BBVA
May-13 USD 1,351 1,378 9.00% Perpetual
Subtotal USD 1,351 1,378
BBVA GLOBAL FINANCE, LTD. (*)
December-95 USD 180 183 7.00% 01-Dec-25
BANCO BILBAO VIZCAYA ARGENTARIA, CHILE USD
Different issues CLP 586 558 Various
Subtotal CLP 586 558
BBVA BANCOMER, S.A. de C.V.
May-07 USD 447 456 6.01% 17-May-22
April-10 USD 895 912 7.25% 22-Apr-20
March-11 USD 1,119 1,140 6.50% 10-Mar-21
July-12 USD 895 912 6.75% 30-Sep-22
September-12 USD 447 456 6.75% 30-Sep-22
November-14 USD 179 182 5.35% 12-Nov-29
Subtotal USD 3,982 4,058
BBVA URUGUAY
December-14 USD 14 14 4.66% 16-Dic-24
Subtotal USD 14 14
BBVA PARAGUAY
November-14 USD 18 18 6.75% 05-Nov-21
November-15 USD 22 23 6.70% 22-Nov-22
Subtotal USD 40 42
TEXAS REGIONAL STATUTORY TRUST I
February-04 USD 45 46 3.13% 17-Mar-34
Subtotal USD 45 46
(*) The issuances of BBVA Global Finance, Ltd, are jointly, severally and unconditionally guaranteed by the Bank
Millions of Euros
A-19
Outstanding as of June 30, 2016 and December 31, 2015 of subordinated issues
Issuer Entity and Issued Date CurrencyJune
2016
December
2015
Prevailing Interest
Rate
as of June 30,
2016
Maturity
Date
STATE NATIONAL CAPITAL TRUST I
July-03 USD 14 14 3.32% 30-Sep-33
Subtotal USD 14 14
STATE NATIONAL STATUTORY TRUST II
March-04 USD 9 9 3.07% 17-Mar-34
Subtotal USD 9 9
TEXASBANC CAPITAL TRUST I
June-04 USD 23 23 2.88% 23-Jul-34
Subtotal USD 23 23
COMPASS BANK
March-05 USD 204 204 5.50% 01-Apr-20
March-06 USD 62 63 5.90% 01-Apr-26
September-07 USD 315 321 6.40% 01-Oct-17
April-15 USD 622 633 3.88% 10-Apr-25
Subtotal 1,199 1,221
BBVA COLOMBIA, S.A.
September-11 COP 63 58 12.42% 19-Sep-21
September-11 COP 52 48 12.67% 19-Sep-26
September-11 COP 49 45 12.26% 19-Sep-18
February-13 COP 32 30 11.58% 19-Feb-23
February-13 COP 33 31 11.87% 19-Feb-28
November-14 COP 29 26 12.47% 26-Nov-34
November-14 COP 29 47 12.35% 26-Nov-29
Subtotal 287 285
April-15 USD 362 366 4.88% 21-Apr-25
Subtotal 362 366
BANCO CONTINENTAL, S.A.
December-06 USD 27 28 3.02% 15-Feb-17
May-07 USD 18 18 6.00% 14-May-27
September-07 USD 18 18 1.69% 24-Sep-17
February-08 USD 18 18 6.47% 28-Feb-28
October-10 USD 180 184 7.38% 07-Oct-40
October-13 USD 41 41 6.53% 08-Oct-28
September-14 USD 269 274 5.25% 22-Sep-29
Subtotal USD 571 582
May-07 PEN 11 11 5.85% 07-May-22
June-07 PEN 20 20 3.47% 18-Jun-32
November-07 PEN 18 18 3.56% 19-Nov-32
July-08 PEN 16 15 3.06% 08-Jul-23
September-08 PEN 17 17 3.09% 09-Sep-23
December-08 PEN 10 10 4.19% 15-Dec-33
Subtotal 93 90
Total issues in foreign currencies(Millions of Euros) 8,755 8,868
Millions of Euros
A-20
Outstanding as of June 30, 2016 and December 31, 2015 of preferred issues
June 2016 December 2015
Issuer Entity and Issued Date CurrencyAmount Issued
(Millions)Currency
Amount Issued
(Millions)BBVA
December 2007 EUR 14 EUR 14
BBVA International Preferred, S.A.U.
September 2005 EUR 86 EUR 86
September 2006 EUR 164 EUR 164
Abril 2007 USD 540 USD 551
July 2007 GBP 38 GBP 43
Phoenix Loan Holdings Inc.
November 2000 USD 21 USD 22
Caixa Terrasa Societat de Participacion
August 2005 EUR 75 EUR 75
Caixasabadell Preferents, S.A.
July 2006 EUR 90 EUR 90
Others - 1 - 1
A-21
APPENDIX VII Consolidated balance sheets held in foreign currency as of June 30, 2016 and December 31, 2015
Millions of Euros
June 2016 USDMexican
PesosTurkish Lira
Other Foreign
Currencies
Total Foreign
Currencies
Assets -
Cash, cash balances at central banks and other demand deposits 10,647 4,070 553 3,364 18,633
Financial assets held for trading 6,360 17,156 358 4,076 27,950
APPENDIX VIII Information on data derived from the special accounting registry
Information required pursuant to Circular 5/2011 of the Bank of Spain is indicated as follows.
a) Mortgage market policies and procedures
The Bank has express policies and procedures in place regarding its activities in the mortgage market, which provide for full compliance with applicable regulations.
The mortgage origination policy is based in principles focused on assessing the adequate ratio between the amount of the loan, and the payments, and the income of the applicant. Applicants must in all cases prove sufficient repayment ability (present and future) to meet their repayment obligations, for both the mortgage debt and for other debts detected in the financial system, and even those from an estimate of their current expenses deduced from socio-demographic information. Therefore, the applicant’s repayment ability is a key aspect within the credit decision-making tools and retail risk acceptance manuals, and has a high weighting in the final decision.
During the mortgage risk transaction analysis process, documentation supporting the applicant’s income (payroll, etc.) is required, and the applicant’s position in the financial system is checked through automated database queries (internal and external). This information is used for calculation purposes in order to determine the level of indebtedness/compliance with the remainder of the system. This documentation is kept in the transaction’s file.
In addition, the mortgage origination policy assesses the adequate ratio between the amount of the loan and the appraisal value of the mortgaged asset. If an appropriate level is not exceeded, additional collateral is required to reinforce the transaction’s hedging. The policy also establishes that the property to be mortgaged be appraised by an independent appraisal company as established by Circular 3/2010. BBVA selects those companies whose reputation, standing in the market and independence ensure that their appraisals adapt to the market reality in each region. Each appraisal is reviewed and checked before the loan is granted by BBVA staff and, in those cases where the loan is finally granted, it is kept in the transaction’s file.
As for issues related to the mortgage market, the Group’s Finance Division annually defines the wholesale finance issue strategy, and more specifically mortgage bond issues, such as mortgage covered bonds or mortgage securitization. The Assets and Liabilities Committee (“ALCO”) tracks the budget monthly. The volume and type of assets in these transactions is determined in accordance with the wholesale finance plan, the trend of the Bank’s “Loans and receivables” outstanding balances and market conditions.
The Board of the Bank authorizes each of the issues of Mortgage Transfer Certificate and/or Mortgage Participation issued by BBVA to securitize loans and mortgage loans, as well as the establishment of a Base Prospectus for the issue of fixed-income securities through which the mortgage-covered bonds are implemented, based on the agreements for the issue of fixed-income securities approved by the Annual General Meeting.
As established in article 24 of Royal Decree 716/2009, the volume of outstanding mortgage-covered bonds issued by a bank may not exceed 80% of a calculation base determined by adding the outstanding principal of all the loans and mortgage loans in the bank’s portfolio that are eligible and are not covered by the issue of Mortgage Bonds, Mortgage Participations or Mortgage Transfer Certificates. For these purposes, in accordance with the aforementioned Royal Decree 716/2009, in order to be eligible, loans and mortgage loans must: (i) be secured by a first mortgage on the freehold; (ii) the loan’s amount may not exceed 80% of the appraisal value for home mortgages, and 60% for other mortgage lending; (iii) be established on assets exclusively and wholly owned by the mortgagor; (iv) have been appraised by an independent appraisal company unrelated to the Group and authorized by the Bank of Spain; and (v) the mortgaged property must be covered at least by a current damage insurance policy.
A-23
The Bank has set up a series of controls for mortgage covered bonds, which regularly control the total volume of issued mortgage covered bonds issued and the remaining eligible collateral, to avoid exceeding the maximum limit set by Royal Decree 716/2009, and outlined in the preceding paragraph. In the case of securitizations, the preliminary portfolio of loans and mortgage loans to be securitized is checked according to an agreed procedures engagement, by the Bank’s external auditor as required by the Spanish Securities and Exchange Commission. There is also a series of filters through which some mortgage loans and credits are excluded in accordance with legal, commercial and risk concentration criteria.
b) Quantitative information on activities in the mortgage market
The quantitative information on activities in the mortgage market required by Bank of Spain Circular 5/2011 is shown below.
b.1) Ongoing operations
Millions of Euros
Mortgage loans.
Eligibility for the purpose of the mortgage market
June
2016
December
2015
Nominal value of outstanding loans and mortgage loans (A) 95,593 98,555
Minus: Nominal value of all outstanding loans and mortgage loans that form part of the
portfolio, but have been mobilized through mortgage bond holdings or mortgage transfer
certificates. (B) (26,150) (25,650)
Nominal value of outstanding loans and mortgage loans, excluding securitized loans (A)-(B) 69,443 72,905
Of which:
Loans and mortgage loans which would be eligible if the calculation limits set forth in
Article 12 of Spanish Royal Decree 716/2009 were not applied. (C) 39,423 40,373
Minus: Loans and mortgage loans which would be eligible but, according to the criteria set
forth in Article 12 of Spanish Royal Decree 716/2009, cannot be used to collateralize any
issuance of mortgage bonds. (D) (1,848) (2,213)
Eligible loans and mortgage loans that, according to the criteria set forth in Article 12 of
Spanish Royal Decree 716/2009, can be used as collateral for the issuance of mortgage
bonds (C)-(D) 37,575 38,160
Issuance limit: 80% of eligible loans and mortgage loans that can be used as collateral (E ) 30,060 30,528
Issued Mortgage-covered bonds (F) 25,601 28,362
Outstanding Mortgage-covered bonds 21,406 25,220
Capacity to issue mortgage-covered bonds (E)-(F) 4,459 2,166
Memorandum items:
Percentage of overcollateralization across the portfolio 271% 257%
Percentage of overcollateralization across the eligible used portfolio 147% 135%
Nominal value of available sums (committed and unused) from all loans and mortgage loans. 2,047 1,999
Of which:
Potentially eligible 1,350 1,361
Ineligible 697 638
Nominal value of all loans and mortgage loans that are not eligible, as they do not meet
the thresholds set in Article 5.1 of Spanish Royal Decree 716/2009, but do meet the rest of the eligibility requirements indicated in Article 4 of the Royal Decree. 22,706 25,350
Nominal value of the replacement assets subject to the issue of mortgage-covered bonds. - -
A-24
Millions of Euros
Mortgage loans.
Eligibility for the purpose of the mortgage market
June
2016
December
2015
Total loans (1) 95,593 98,555
Issued mortgage participations (2) - -
Of which: recognized on the balance sheet - -
Issued mortgage transfer certificates (3) 26,150 25,650
Of which: recognized on the balance sheet 26,115 25,612
Mortgage loans as collateral of mortgages bonds (4) - -
Loans supporting the issuance of mortgage-covered bonds 1-2-3-4 69,443 72,905
Non elegible loans 30,020 32,532
Comply requirements to be elegible except the limit provided for under the article 5.1 of the Spanish Royal Decree 716/2009 22,706 25,350Rest 7,314 7,182
Elegible loans 39,423 40,373
That can not be used as collateral for issuances 1,848 2,213
That can be used as collateral for issuances 37,575 38,160Loans used to collateralize mortgage bonds - -Loans used to collateralize mortgage-covered bonds 37,575 38,160
A-25
Millions of Euros
Mortgage loans. Classification of the nominal
values according to different characteristics
Total
mortgage
loans
Eligible (*)
Eligible that
can be used as
collateral for
issuances (**)
Total
mortgage
loans
Eligible (*)
Eligible that
can be used as
collateral for
issuances (**)
TOTAL 69,443 39,423 37,575 72,905 40,373 38,160
By source of the operations
Originated by the bank 61,830 33,887 32,098 64,852 34,629 32,477
Subrogated by other institutions 523 450 448 554 459 457
Rest 7,090 5,086 5,029 7,499 5,285 5,226
By Currency
In euros 68,970 39,138 37,297 72,331 40,013 37,811
In foreign currency 473 285 278 574 360 349
By payment situation
Normal payment 53,218 34,051 33,520 56,192 34,987 34,330
Other situations 16,225 5,372 4,055 16,713 5,386 3,830
By residual maturity
Up to 10 years 17,744 11,194 10,297 18,457 11,536 10,402
10 to 20 years 25,014 18,094 17,543 24,926 17,896 17,317
20 to 30 years 16,737 7,803 7,469 18,399 8,379 7,963
Over 30 years 9,948 2,332 2,266 11,123 2,562 2,478
4 T o ta l 142 ,364 13 ,463 40 ,760 10,115 356 ,829 8,002 7 ,363
R eal estate mo rtgage
securedR est o f secured lo ans (a ) Unsecured lo ans
Specif ic
co verage
R eal estate mo rtgage
securedR est o f secured lo ans (a ) Unsecured lo ans
Specif ic
co verage
R eal estate mo rtgage
securedR est o f secured lo ans (a ) Unsecured lo ans
Specif ic
co verage
R eal estate mo rtgage
securedR est o f secured lo ans (a ) Unsecured lo ans
JUNE 2016
BALANCE OF FORBEARANCE
(Millions of Euros)
(a) Includes mortgage-backed real estate operations with loan to value ratio of greater than 1, and secured operations, other than transactions secured by real estate mortgage regardless of their loan to value ratio.
(*) Number of operations does not include Garanti Bank
A-29
N OR M A L
N umber o f
o perat io ns
Gro ss
amo unt
N umber o f
o perat io nsGro ss amo unt
N umber o f
o perat io ns
Gro ss
amo unt
1 Go vernment agencies 47 65 18 709 35 18
2 Other legal ent it ies and
individual ent repreneurs 5,258 2,123 1,426 547 14,917 2,557
Of which: Financing the construction
and property development 1,790 787 82 51 472 156
3 Other individuals 46,362 2,645 9,783 1,000 87,763 1,358
4 T o tal 51,667 4 ,833 11,227 2 ,256 102,715 3 ,933
P OT EN T IA L P R OB LEM LOA N S
N umber o f
o perat io ns
Gro ss
amo unt
N umber o f
o perat io nsGro ss amo unt
N umber o f
o perat io ns
Gro ss
amo unt
1 Go vernment agencies 2 2 1 14 5 2 3
2 Other legal ent it ies and
individual ent repreneurs 4,492 1,510 1,179 402 11,539 1,751 584
Of which: Financing the construction
and property development 498 446 129 108 108 119 159
3 Other individuals 14,250 1,434 9,883 1,632 14,509 161 201
4 T o tal 18,744 2 ,946 11,063 2 ,048 26,053 1,914 788
IM P A IR ED
N umber o f
o perat io ns
Gro ss
amo unt
N umber o f
o perat io nsGro ss amo unt
N umber o f
o perat io ns
Gro ss
amo unt
1 Go vernment agencies 5 4 2 1 31 13 6
2 Other legal ent it ies and
individual ent repreneurs 10,172 4,138 6,467 4,047 17,612 2,925 5,672
Of which: Financing the construction
and property development 3,466 2,105 2,077 2,346 2,318 834 2,910
3 Other individuals 31,502 2,129 12,693 2,042 80,652 772 1,454
4 T o tal 41,679 6 ,271 19,162 6 ,090 98,295 3 ,710 7 ,132
T OT A L
N umber o f
o perat io ns
Gro ss
amo unt
N umber o f
o perat io nsGro ss amo unt
N umber o f
o perat io ns
Gro ss
amo unt
1 Go vernment agencies 54 71 21 723 71 33 9
2 Other legal ent it ies and
individual ent repreneurs 19,922 7,771 9,072 4,996 44,068 7,233 6,256
Of which: Financing the construction
and property development 5,754 3,337 2,288 2,505 2,898 1,109 3,069
3 Other individuals 92,114 6,208 32,359 4,674 182,924 2,291 1,655
4 T o tal 112,090 14,049 41,452 10,394 227,063 9 ,557 7 ,920
DECEMBER 2015
BALANCE OF FORBEARANCE
(Millions of Euros)
R eal estate mo rtgage
securedR est o f secured lo ans (a) Unsecured lo ans
R eal estate mo rtgage
securedR est o f secured lo ans (a) Unsecured lo ans
Specif ic
co verage
R eal estate mo rtgage
securedR est o f secured lo ans (a) Unsecured lo ans
Specif ic
co verage
R eal estate mo rtgage
securedR est o f secured lo ans (a) Unsecured lo ans
Specif ic
co verage
a) Includes mortgage-backed real estate operations with loan to value ratio of greater than 1, and secured operations, other than transactions secured by real estate mortgage regardless of their loan to value ratio.
b) Number of operations does not include Garanti Bank
A-30
In addition to the restructuring and refinancing transactions mentioned in this section, loans that were not considered impaired or renegotiated have been modified based on the criteria set out in paragraph 59 (c) of IAS 39. These loans have not been classified as renegotiated or impaired, since they were modified for commercial or competitive reasons (for instance, to improve our relationship with the client) rather than for economic or legal reasons relating to the borrower's financial situation.
The table below provides a roll forward of refinanced assets as of June 30, 2016 and 2015 is as follows:
The non performing ratio of the renegotiated portfolio is defined as the impaired balance of renegotiated loans that shows signs of difficulties as of the closing of the reporting period, divided by the total payment outstanding in that portfolio.
As of June 30, 2016, the non performing ratio for each of the portfolios of renegotiated loans is as follows:
June 2016
NPL ratio renegotiated loan portfolio
Ratio of Impaired loans -
Past due
Government agencies 6%
Commercial 57%
Of which: Construction and developer 85%
Other consumer 39%
55% of the renegotiated loans classified as impaired was for reasons other than default (delinquency).
A-31
b) Quantitative information on the concentration of risk by activity
Loans and advances to customers by activity (carrying amount)
Government agencies 151,867 75,347 14,957 49,585 11,978
Central Administration 106,194 49,007 14,610 30,660 11,917
Other 45,673 26,340 347 18,925 61
Other financial institutions 44,853 16,688 12,924 12,063 3,178
Non-financial institutions and individual entrepreneurs 253,159 73,469 27,141 95,907 56,642
Construction and property development 24,414 6,795 342 11,618 5,659
Construction of civil works 15,242 7,817 2,222 3,706 1,497
Other purposes 213,503 58,857 24,577 80,583 49,486
Large companies 151,459 35,464 23,098 56,188 36,709
SMEs and individual entrepreneurs 62,044 23,393 1,479 24,395 12,777
Other households and NPISHs 183,914 99,644 3,852 62,630 17,788
Housing 127,797 86,431 3,086 31,680 6,600
Consumer 46,185 7,098 618 28,083 10,386
Other purposes 9,932 6,115 148 2,867 802
SUBTOTAL 726,502 277,995 100,557 241,144 106,806
Less: Valuation adjustments due to impairment of assets not attributable to specific operations
(4,459)
TOTAL 722,043
(*) The definition of risk for the purpose of this statement includes the following items on the public balance sheet: Loans and advances to credit institutions, Loans and advances to customers, Debt securities, Equity instruments, Other equity securities, Derivatives, Trading Derivatives, Derivatives – Hedge accounting derivatives, Investments in subsidiaries, joint ventures and associates and guarantees given and Contingent risks. The amounts included in this table are net of impairment losses.
Government agencies 151,919 74,931 14,393 50,242 12,354
Central Administration 107,118 48,617 13,786 32,401 12,314
Other 44,801 26,314 607 17,840 40
Other financial institutions 46,744 16,768 13,623 13,324 3,029
Non-financial institutions and individual entrepreneurs 248,207 72,710 26,561 94,632 54,305
Construction and property development 23,484 5,862 278 11,946 5,397
Construction of civil works 15,540 8,687 2,149 3,497 1,207
Other purposes 209,183 58,161 24,134 79,188 47,701
Large companies 144,990 34,358 22,399 52,704 35,529
SMEs and individual entrepreneurs 64,193 23,803 1,734 26,484 12,172
Other households and NPISHs 182,335 100,510 3,832 61,084 16,910
Housing 127,261 88,185 3,103 29,794 6,179
Consumer 42,221 6,728 649 24,799 10,044
Other purposes 12,853 5,597 80 6,490 686
SUBTOTAL 710,311 277,932 96,146 239,956 96,276
Less: Valuation adjustments due to impairment of assets not attributable to specific operations
(4,313)
TOTAL 705,998
(*) The definition of risk for the purpose of this statement includes the following items on the public balance sheet: Loans and advances to credit institutions, Loans and advances to customers, Debt securities, Equity instruments, Derivatives, Derivatives, Derivatives – Hedge accounting, Investments in subsidiaries, joint ventures and associates and guarantees given. The amounts included in this table are net of impairment losses.
A-37
APPENDIX X Additional information on Sovereign Risk
Sovereign risk exposure
The table below provides a breakdown of exposure to financial assets (excluding derivatives and equity instruments), as of June 30, 2016 and December 31, 2015 by type of counterparty and the country of residence of such counterparty. The below figures do not take into account accumulated other comprehensive income, impairment losses or loan-loss provisions:
Millions of Euros
Risk Exposure by CountriesSo vereign
R isk ( *)
F inancia l
Inst itut io ns
Other
Secto rsTotal %
Spain 74,022 7,924 174,953 256,899 41.7%
Italy 11,989 1,505 1,461 14,955 2.4%
Rest of Europe 1,204 3,099 9,144 13,448 2.2%
United Kingdom 13 6,912 6,533 13,459 2.2%
France 504 7,001 3,235 10,741 1.7%
Portugal 599 30 4,861 5,490 0.9%
Germany 517 1,677 2,099 4,292 0.7%
Ireland - 101 802 903 0.1%
Turkey 11,645 3,490 57,123 72,257 11.7%
Greece - - 56 56 -
Subtotal Europe 100,493 31,740 260,266 392,499 63.7%
Mexico 29,086 1,863 45,168 76,117 12.3%
The United States 16,249 3,825 61,551 81,625 13.2%
Venezuela 151 163 565 879 0.1%
Other countries 4,040 4,924 56,286 65,249 10.6%
Total Other Countries 49,525 10,774 163,571 223,870 36.3%
Total Exposure to Financial Instruments 150,018 42,513 423,837 616,369 100.0%
June 2016
Millions of Euros
Risk Exposure by CountriesSo vereign
R isk ( *)
F inancia l
Inst itut io ns
Other
Secto rsTotal %
Spain 74,020 7,323 177,348 258,690 42.8%
Turkey 12,037 3,374 54,161 69,572 11.5%
Italy 10,694 724 1,858 13,276 2.2%
France 1,029 5,796 3,025 9,850 1.6%
Portugal 704 19 4,711 5,433 0.9%
Germany 560 1,473 1,588 3,621 0.6%
United Kingdom 4 7,466 6,547 14,017 2.3%
Ireland 1 96 934 1,031 0.2%
Greece - - 57 57 0.0%
Rest of Europe 1,278 2,668 8,769 12,715 2.1%
Subtotal Europe 100,327 28,938 258,998 388,262 64.2%
Mexico 22,192 5,676 46,438 74,306 12.3%
The United States 11,378 3,834 61,738 76,950 12.7%
Venezuela 152 146 845 1,144 0.2%
Other countries 3,711 4,470 55,717 63,897 10.6%
Total Rest of Countries 37,433 14,126 164,738 216,297 35.8%
Total Exposure to Financial Instruments 137,760 43,064 423,735 604,559 100.0%
December 2015
(*) In addition, as of June 31, 2016 and December 31, 2015, undrawn lines of credit, granted mainly to the Spanish
government or government agencies and amounted to €2,418 million and, €2,584 million, respectively.
A-38
The exposure to sovereign risk set out in the above table includes positions held in government debt securities in countries where the Group operates. They are used for ALCO’s management of the interest-rate risk on the balance sheets of the Group’s entities in these countries, as well as for hedging of pension and insurance commitments by insurance entities within the BBVA Group.
Sovereign risk exposure in Europe
The table below provides a breakdown of the exposure of the Group’s credit institutions to European sovereign risk as of June 30, 2016 and December 31, 2015 by type of financial instrument and the country of residence of the counterparty, under EBA (European Banking Authority) requirements:
(1) This table shows sovereign risk balances with EBA criteria. Therefore, sovereign risk of the Group’s insurance companies (€11,674 million as of June 30, 2016) is not included.
(2) Includes credit derivatives CDS (Credit Default Swaps) shown at fair value.
(1) This table shows sovereign risk balances with EBA criteria. Therefore, sovereign risk of the Group’s insurance companies (€6,300 million as of December 31, 2015) is not included.
(2) Includes credit derivatives CDS (Credit Default Swaps) shown at fair value.
A-39
As it can be seen in the above tables, exposure to sovereign risk in Europe is concentrated in Spain. As of June 30, 2016, and December 31, the breakdown of total exposure faced by the Group’s credit institutions to Spain and other countries, by maturity of the financial instruments, is as follows:
APPENDIX XI Additional information on Risk Concentration
a) Concentration of risk on activities in the real-estate market in Spain
The following quantitative information on real-estate activities in Spain has been prepared using the reporting models required by Bank of Spain Circular 5/2011, of November 30.
As of June 30, 2016 and December 31, 2015, exposure to the construction sector and real-estate activities in Spain stood at €16,468 and €18,744 million, respectively. Of that amount, risk from loans to construction and real-estate development activities accounted for €8,585 and €9,681 million, respectively, representing 5.4% and 6.0% of loans and advances to customers of the balance of business in Spain (excluding the government and other government agencies) and 1.2% and 1.3% of the total assets of the Consolidated Group.
Lending for real estate development of the loans as of June 30, 2016 and December 31, 2015 is shown below:
Millions of Euros
June 2016
Financing Allocated by credit institutions to Construction and
Real Estate Development and lending for house purchase
Gross
Amount
Drawn Over
the Guarantee
Value
Accumulated
impairment
Financing to construction ans real estate development
(including land) (Business in Spain) 8,585 3,588 (3,279)
Of which: Impaired assets 5,599 2,802 (3,148)
Memorandum item:
Write-offs 2,114
Memorandum item:
Total loans and advances to customers, excluding the Public Sector (Business in Spain) 159,685
Total consolidated assets (total business) 746,040
Impairment and provisions for normal exposures (4,906)
Millions of Euros
December 2015
Financing Allocated by credit institutions to Construction and
Real Estate Development and lending for house purchase
Gross
Amount
Drawn Over
the
Guarantee
Value
Accumulate
d
impairment
Financing to construction ans real estate development
(including land) (Business in Spain) 9,681 4,132 (3,801)
Of which: Impaired assets 6,231 3,087 (3,600)
Memorandum item:
Write-offs 1,741
Memorandum item:
Sector (Business in Spain) 161,416
Total consolidated assets (total business) 750,078Impairment and provisions for normal exposures (4,549)
A-41
The following is a description of the real estate credit risk based on the types of associated guarantees:
Millions of Euros
Financing Allocated by credit institutions to
Construction and Real Estate Development and lending
Buildings under construction 673 688Homes 650 660Other 24 28
Land 2,728 2,895Urbanized land 1,420 1,541Rest of land 1,307 1,354
Total 8,585 9,681
As of June 30, 2016 and December 31, 2015, 51% and 51% of loans to developers were guaranteed with buildings (81.5% and 83.2%, are homes), and only 31.8% and 29.9% by land, of which 52.0% and 53.2 are in urban locations, respectively.
The information on the retail mortgage portfolio risk (housing mortgage) as of June 30, 2016, and December 31, 2015 is as follows:
Millions of Euros
Financing Allocated by credit institutions to
Construction and Real Estate Development and lending
for house purchase June 2016
Gross amountOf which:
impaired loans
Houses purchase loans 89,473 4,831
Without mortgage 1,543 43
With mortgage 87,930 4,789
A-42
Millions of Euros
Financing Allocated by credit institutions to
Construction and Real Estate Development and lending
for house purchase December 2015
Gross amountOf which:
impaired loans
Houses purchase loans 91,150 4,869
With mortgage 1,480 24
Without mortgage 89,670 4,845
The loan to value (LTV) ratio of the above portfolio is as follows:
of which: Impaired loans 202 392 771 991 2,489 4,845
Total risk over the amount of the last valuation available (Loan To Value -LTV)
Outstanding home mortgage loans as of June 30, 2016, and December 31, 2015 had an average LTV of 46% and 46% respectively.
A-43
The breakdown of foreclosed, acquired, purchased or exchanged assets from debt from loans relating to business in Spain, as well as the holdings and financing to non-consolidated entities holding such assets is as follows:
Millions of Euros
Information about Assets Received in Payment of Debts
(Business in Spain)
Gross
ValueProvisions
Of wich:
Valuation
adjustments on
impaired
assets, at the
time of
foreclosure
Carrying
Amount
Real estate assets from loans to the construction and real
estate development sectors in Spain.8,815 5,372 2,791 3,443
Buildings under construction 745 422 204 323Homes 714 400 191 314
Other 31 22 13 9
Land 5,212 3,444 1,897 1,768Urbanized land 3,632 2,404 1,366 1,228
Rest of land 1,580 1,040 531 540
Real estate assets from mortgage financing for households for
the purchase of a home 4,937 2,687 1,143 2,250
Rest of foreclosed real estate assets 1,368 678 148 690
Foreclosed equity instruments895 532 433 363
Total 16,138 9,261 4,562 6,877
December 2015
A-44
As of June 30, 2016, and December 31, 2015, the gross book value of the Group’s real-estate assets from corporate financing of real-estate construction and development was €8,815 and €8,938 million, respectively, with an average coverage ratio of 60.9% and 60.0%, respectively.
The gross book value of real-estate assets from mortgage lending to households for home purchase as of June 30, 2016 and December 31, 2015, amounted to €4,482 and €4,937 million, respectively, with an average coverage ratio of 56.5% and 54.4%, respectively.
As of June 30, 2016, and December 31, 2015, the gross book value of the BBVA Group’s total real-estate assets (business in Spain), including other real-estate assets received as debt payment, was €14,749 and €15,243 million, respectively. The coverage ratio was 58.7% and 57.3%, respectively.
A-45
b) Concentration of risk by geography
Below is a breakdown of the balances of financial instruments registered in the accompanying consolidated balance sheets by their concentration in geographical areas and according to the residence of the customer or counterparty. It does not take into account impairment losses or loan-loss provisions:
Total Risks in Financial Instruments 327,841 125,597 113,801 128,973 101,800 81,278 13,288 892,578
(*) Equity instruments are shown net of valuation adjustment.
The breakdown of the main figures in the most significant foreign currencies in the accompanying consolidated balance sheets is set forth in Appendix VII.
A-47
The breakdown of loans and advances in the heading of Loans and receivables, impaired by geographical area as of June 30, 2016 and December 31, 2015 is as follows:
Millions of Euros
Impaired Financial Assets by geographic area June 2016 December 2015
Spain 18,063 19,921
Rest of Europe 745 790
Mexico 1,233 1,277
South America 1,421 1,162
United States 1,017 579
Turkey 1,757 1,628
Rest of the world - -
IMPAIRED RISKS 24,236 25,358
A-48
APPENDIX XII – Reconciliation of Financial Statements
Current format Previous format
Millions of Euros Millions of Euros
ASSETSDecember
2015 ASSETS
December
2015
CASH, CASH BALANCES AT CENTRAL BANKS AND OTHER DEMAND DEPOSITS (1) 29,282 CASH AND BALANCES WITH CENTRAL BANKS 43,467
FINANCIAL ASSETS HELD FOR TRADING 78,326 FINANCIAL ASSETS HELD FOR TRADING 78,326
Derivatives 40,902 Loans and advances to credit institutions -
Equity instruments 4,534 Loans and advances to customers 65
Debt securities 32,825 Debt securities 32,825
Loans and advances to central banks - Equity instruments 4,534
Loans and advances to credit institutions - Trading derivatives 40,902
Loans and advances to customers 65
OTHER FINANCIAL ASSETS DESIGNATED AT FAIR VALUE THROUGH PROFIT OR LOSS 2,311 OTHER FINANCIAL ASSETS DESIGNATED AT FAIR VALUE THROUGH PROFIT OR LOSS 2,311
Equity instruments 2,075 Loans and advances to credit institutions 62
Debt securities 173 Loans and advances to customers -
Loans and advances to central banks - Debt securities 173
Loans and advances to credit institutions 62 Equity instruments 2,075
FAIR VALUE CHANGES OF THE HEDGED ITEMS IN PORTFOLIO HEDGES OF INTEREST
RATE RISK 45
FAIR VALUE CHANGES OF THE HEDGED ITEMS IN PORTFOLIO HEDGES OF INTEREST RATE RISK 45 HEDGING DERIVATIVES 3,538
INVESTMENTS IN SUBSIDARIES, JOINT VENTURES AND ASSOCIATES 879 NON-CURRENT ASSETS HELD FOR SALE 3,369
Joint ventures 243 INVESTMENTS IN ENTITIES ACCOUNTED FOR USING THE EQUITY METHOD 879
Associates 636 Associates 636
REINSURANCE ASSETS 511 Joint ventures 243
TANGIBLE ASSETS 9,944 INSURANCE CONTRACTS LINKED TO PENSIONS -
Property, plants and equipment 8,477 REINSURANCE ASSETS 511
For own use 8,021 TANGIBLE ASSETS 9,944
Other assets leased out under an operating lease 456 Property, plants and equipment 8,477
Investment properties 1,467 For own use 8,021
INTANGIBLE ASSETS 10,275 Other assets leased out under an operating lease 456
Goodwill 6,811 Investment properties 1,467
Other intangible assets 3,464 INTANGIBLE ASSETS 10,275
TAX ASSETS 17,779 Goodwill 6,811
Current 1,901 Other intangible assets 3,464
Deferred 15,878 TAX ASSETS 17,779
OTHER ASSETS 8,566 Current 1,901
Insurance contracts linked to pensions - Deferred 15,878
Inventories 4,303 OTHER ASSETS 8,566
Rest 4,263 Inventories 4,303
NON-CURRENT ASSETS AND DISPOSAL GROUPS HELD FOR SALE (3) 3,369 Rest 4,263
TOTAL ASSETS 750,078 TOTAL ASSETS 750,078
(1) The main differences with regard to the heading " Cash and deposits with central banks" are the inclusion of the balances deposited in Credit Institutions and the reclassification of Loans
at central banks to the heading Loans and Receivables
(2) The main differences with regard to the heading "Loans and receivables" are the inclusion of
loans at central banks and the reclassification of balances deposited in Credit institutions to the heading "Cash, cash balances at central banks and other demand deposits"
(3) Corresponding to the heading "Non-current assest held-for-sale" of the previous format
A-49
Current format Previous format
Millions of Euros Millions of Euros
LIABILITIESDecember
2015LIABILITIES
December
2015
FINANCIAL LIABILITIES HELD FOR TRADING 55,203 FINANCIAL LIABILITIES HELD FOR TRADING 55,203
Trading derivatives 42,149 Deposits from central banks -
Short positions 13,053 Deposits from credit institutions -
Deposits from central banks - Customer deposits -
Deposits from credit institutions - Debt certificates -
Customer deposits - Trading derivatives 42,149
Debt certificates - Short positions 13,053
Other financial liabilities - Other financial liabilities -
OTHER FINANCIAL LIABILITIES DESIGNATED AT FAIR VALUE THROUGH PROFIT OR
LOSS 2,649
OTHER FINANCIAL LIABILITIES DESIGNATED AT FAIR VALUE THROUGH PROFIT OR
LOSS 2,649
Deposits from central banks - Deposits from central banks -
Deposits from credit institutions - Deposits from credit institutions -
Customer deposits - Customer deposits -
Debt certificates - Debt certificates -
Other financial liabilities 2,649 Subordinated liabilities -
Of which: Subordinated liabilities (1) - Other financial liabilities 2,649
FINANCIAL LIABILITIES AT AMORTIZED COST 606,113 FINANCIAL LIABILITIES AT AMORTIZED COST 606,113
Deposits from central banks 40,087 Deposits from central banks 40,087
Deposits from credit institutions 68,543 Deposits from credit institutions 68,543
(1) The heading of Reserves are disclosed in three headings under the current format: Retained earnings, Revaluation Reserves and Other Reserves(2) Accumulated other comprehensive income correponds to the heading Valuation Adjustment, with a higher breakdown and different order of the subheadings
A-51
Current format Previous format
Millions of Euros Millions of Euros
STATEMENT OF PROFIT OR LOSSJune
2015STATEMENT OF PROFIT OR LOSS
June
2015
INTEREST AND SIMILAR INCOME 10,665 INTEREST AND SIMILAR INCOME 10,665
INTEREST AND SIMILAR EXPENSES (3,570) INTEREST AND SIMILAR EXPENSES (3,570)
NET INTEREST INCOME 7,096 NET INTEREST INCOME 7,096
DIVIDEND INCOME 236 DIVIDEND INCOME 236
SHARE OF PROFIT OR LOSS OF ENTITIES ACCOUNTED FOR USING THE
EQUITY METHOD 195
SHARE OF PROFIT OR LOSS OF ENTITIES ACCOUNTED FOR USING
THE EQUITY METHOD 195
FEE AND COMMISSION INCOME 2,801 FEE AND COMMISSION INCOME 2,801
FEE AND COMMISSION EXPENSES (682) FEE AND COMMISSION EXPENSES (682)
NET GAINS (LOSSES) ON FINANCIAL ASSETS AND LIABILITIES NET GAINS (LOSSES) ON FINANCIAL ASSETS AND LIABILITIES (1) 826
GAINS OR (-) LOSSES ON FINANCIAL ASSETS AND LIABILITIES
DESIGNATED AT FAIR VALUE THROUGH PROFIT OR LOSS, NET17 Financial instruments held for trading 161
GAINS OR (-) LOSSES ON FINANCIAL ASSETS AND LIABILITIES HELD FOR
TRADING, NET161 Other financial instruments at fair value through profit or loss 17
GAINS OR (-) LOSSES ON DERECOGNITION OF FINANCIAL ASSETS AND
LIABILITIES NOT MEASURED AT FAIR VALUE THROUGH PROFIT OR LOSS,
NET
649 Other financial instruments not at fair value through profit or loss 649
GAINS OR (-) LOSSES FROM HEDGE ACCOUNTING, NET - Rest -
General and administrative expenses (2,039) General and administrative expenses (2,039)
DEPRECIATION (572) DEPRECIATION AND AMORTIZATION (572)
PROVISIONS OR (-) REVERSAL OF PROVISIONS (392) PROVISIONS (NET) (392)
IMPAIRMENT OR (-) REVERSAL OF IMPAIRMENT ON FINANCIAL ASSETS
NOT MEASURED AT FAIR VALUE THROUGH PROFIT OR LOSS(2,137) IMPAIRMENT LOSSES ON FINANCIAL ASSETS (NET) (2,137)
(Financial assets measured at cost) -
(Available- for-sale financial assets) (3)
(Loans and receivables (2,134) Loans and receivables (2,134)
(Held to maturity investments) - Other financial instruments not at fair value through profit or loss (3)
NET OPERATING INCOME 3,192 NET OPERATING INCOME 3,192
(1) The heading net gains (losses) on financial assets and liabilities was eliminated but the breakdown is maintained(2) The headings Other operating income and Other operating expenses of the previous format are broken down in four headings under the new format, separating the income and expenses covered by insurance and reinsurance contracts.
A-52
Current format Previous format
Millions of Euros Millions of Euros
(Continued)June
2015(Continued)
June
2015
NET OPERATING INCOME 3,192 NET OPERATING INCOME 3,192
IMPAIRMENT OR (-) REVERSAL OF IMPAIRMENT ON NON-FINANCIAL
ASSETS(128) IMPAIRMENT LOSSES ON OTHER ASSETS (NET) (128)
Tangible assets (25)
Intangible assets (3) Goodwill and other intangible assets (3)
Other assets (100) Other assets (125)
GAINS (LOSSES) ON DERECOGNIZED OF NON FINANCIAL ASSETS AND
SUBSIDIARIES, NET23
GAINS (LOSSES) ON DERECOGNIZED OF NON FINANCIAL ASSETS
AND SUBSIDIARIES, NET23
NEGATIVE GOODWILL RECOGNISED IN PROFIT OR LOSS 22 22
PROFIT OR (-) LOSS FROM NON-CURRENT ASSETS AND DISPOSAL
GROUPS CLASSIFIED AS HELD FOR SALE NOT QUALIFYING AS
DISCONTINUED OPERATIONS
791GAINS (LOSSES) IN NON-CURRENT ASSETS HELD FOR SALE NOT
CLASSIFIED AS DISCONTINUED OPERATIONS791
OPERATING PROFIT BEFORE TAX 3,899 OPERATING PROFIT BEFORE TAX 3,899
TAX EXPENSE OR (-) INCOME RELATED TO PROFIT OR LOSS FROM
CONTINUING OPERATION(941) INCOME TAX (941)
PROFIT FROM CONTINUING OPERATIONS 2,958 PROFIT FROM CONTINUING OPERATIONS 2,958
PROFIT FROM DISCONTINUED OPERATIONS (NET) - PROFIT FROM DISCONTINUED OPERATIONS (NET) -
PROFIT 2,958 PROFIT 2,958
Attributable to minority interest [non-controlling interests] 200 Profit attributable to parent company 2,759
Attributable to owners of the parent 2,759 Profit attributable to non-controlling interests 200
A-53
Glossary
Additional Tier 1 Capital
Includes: Preferred stock and convertible perpetual securities and deductions
Adjusted acquisition cost
The acquisition cost of the securities less accumulated amortizations, plus interest accrued, but not net of any other valuation adjustments.
Amortized cost
The amortized cost of a financial asset is the amount at which it was measured at initial recognition minus principal repayments, plus or minus, as warranted, the cumulative amount taken to profit or loss using the effective interest rate method of any difference between the initial amount and the maturity amount, and minus any reduction for impairment or change in measured value.
Associates Companies in which the Group has a significant influence, without having control. Significant influence is deemed to exist when the Group owns 20% or more of the voting rights of an investee directly or indirectly.
Available-for-sale financial assets
Available-for-sale (AFS) financial assets are debt securities that are not classified as held-to-maturity investments or as financial assets designated at fair value through profit or loss (FVTPL) and equity instruments that are not subsidiaries, associates or jointly controlled entities and have not been designated as at FVTPL.
Basic earnings per share
Calculated by dividing “Profit attributable to Parent Company” corresponding to ordinary shareholders of the entity by the weighted average number of shares outstanding throughout the year (i.e., excluding the average number of treasury shares held over the year).
Basis risk Risk arising from hedging exposure to one interest rate with exposure to a rate that reprices under slightly different conditions.
Business combination A business combination is a transaction, or any other event, through which a single entity obtains the control of one or more businesses.
Cash flow hedges Those that hedge the exposure to variability in cash flows attributable to a particular risk associated with a recognized asset or liability or a highly probable forecast transaction and could affect profit or loss.
Commissions
Income and expenses relating to commissions and similar fees are recognized in the consolidated income statement using criteria that vary according to their nature. The most significant income and expense items in this connection are: · Fees and commissions relating linked to financial assets and liabilities measured at fair value through profit or loss, which are recognized when collected · Fees and commissions arising from transactions or services that are provided over a period of time, which are recognized over the life of these transactions or services. · Fees and commissions generated by a single act are accrued upon execution of that act.
A-54
Consolidation method
Method used for the consolidation of the accounts of the Group’s subsidiaries. The assets and liabilities of the Group entities are incorporated line-by-line on the consolidate balance sheets, after conciliation and the elimination in full of intragroup balances, including amounts payable and receivable. Group entity income statement income and expense headings are similarly combined line by line into the consolidated income statement, having made the following consolidation eliminations: a) income and expenses in respect of intragroup transactions are eliminated in full. b) profits and losses resulting from intragroup transactions are similarly eliminated. The carrying amount of the parent's investment and the parent's share of equity in each subsidiary are eliminated.
Consolidated statements of cash flows
The indirect method has been used for the preparation of the consolidated statement of cash flows. This method starts from the entity’s consolidated profit and adjusts its amount for the effects of transactions of a non-cash nature, any deferrals or accruals of past or future operating cash receipts or payments, and items of income or expense associated with cash flows classified as investment or finance. As well as cash, short-term, highly liquid investments subject to a low risk of changes in value, such as cash and deposits in central banks, are classified as cash and equivalents. When preparing these financial statements the following definitions have been used: · Cash flows: Inflows and outflows of cash and equivalents. · Operating activities: The typical activities of credit institutions and other activities that cannot be classified as investment or financing activities. · Investing activities: The acquisition, sale or other disposal of long-term assets and other investments not included in cash and cash equivalents or in operating activities. · Financing activities: Activities that result in changes in the size and composition of the Group’s equity and of liabilities that do not form part of operating activities.
Consolidated statements of changes in equity
The consolidated statements of changes in equity reflect all the movements generated in each year in each of the headings of the consolidated equity, including those from transactions undertaken with shareholders when they act as such, and those due to changes in accounting criteria or corrections of errors, if any. The applicable regulations establish that certain categories of assets and liabilities are recognized at their fair value with a charge to equity. These charges, known as “Valuation adjustments” (see Note 31), are included in the Group’s total consolidated equity net of tax effect, which has been recognized as deferred tax assets or liabilities, as appropriate.
Consolidated statements of recognized income and expenses
The consolidated statements of recognized income and expenses reflect the income and expenses generated each year. Such statement distinguishes between income and expenses recognized in the consolidated income statements and “Other recognized income (expenses)” recognized directly in consolidated equity. “Other recognized income (expenses)” include the changes that have taken place in the year in the “Valuation adjustments” broken down by item. The sum of the changes to the heading “Other comprehensive income ” of the consolidated total equity and the consolidated profit for the year comprise the “Total recognized income/expenses of the year”.
Contingencies Current obligations of the entity arising as a result of past events whose existence depends on the occurrence or non-occurrence of one or more future events independent of the will of the entity.
A-55
Contingent commitments
Possible obligations of the entity that arise from past events and whose existence depends on the occurrence or non-occurrence of one or more future events independent of the entity’s will and that could lead to the recognition of financial assets.
Control
An investor controls an investee when it is exposed, or has rights, to variable returns from its involvement with the investee and has the ability to affect those returns through its power over the investee. An investor controls an investee if and only if the investor has all the following: a) Power; An investor has power over an investee when the investor has existing rights that give it the current ability to direct the relevant activities, i.e. the activities that significantly affect the investee’s returns. b) Returns; An investor is exposed, or has rights, to variable returns from its involvement with the investee when the investor’s returns from its involvement have the potential to vary as a result of the investee’s performance. The investor’s returns can be only positive, only negative or both positive and negative. c) Link between power and returns; An investor controls an investee if the investor not only has power over the investee and exposure or rights to variable returns from its involvement with the investee, but also has the ability to use its power to affect the investor’s returns from its involvement with the investee.
Correlation risk Correlation risk is related to derivatives whose final value depends on the performance of more than one underlying asset (primarily, stock baskets) and indicates the existing variability in the correlations between each pair of assets.
Credit Valuation Adjustment (CVA)
An adjustment to the valuation of OTC derivative contracts to reflect the creditworthiness of OTC derivative counterparties.
Current service cost Current service cost is the increase in the present value of a defined benefit obligation resulting from employee service in the current period.
Current tax assets Taxes recoverable over the next twelve months.
Current tax liabilities Corporate income tax payable on taxable profit for the year and other taxes payable in the next twelve months.
Debit Valuation Adjustment (DVA)
An adjustment made by an entity to the valuation of OTC derivative liabilities to reflect within fair value the entity’s own credit risk.
Debt certificates
Obligations and other interest-bearing securities that create or evidence a debt on the part of their issuer, including debt securities issued for trading among an open group of investors, that accrue interest, implied or explicit, whose rate, fixed or benchmarked to other rates, is established contractually, and take the form of securities or book-entries, irrespective of the issuer.
Deferred tax assets Taxes recoverable in future years, including loss carry forwards or tax credits for deductions and tax rebates pending application.
Defined benefit plans
Post-employment obligation under which the entity, directly or indirectly via the plan, retains the contractual or implicit obligation to pay remuneration directly to employees when required or to pay additional amounts if the insurer, or other entity required to pay, does not cover all the benefits relating to the services rendered by the employees when insurance policies do not cover all of the corresponding post-employees benefits.
Defined contribution plans
Defined contribution plans are retirement benefit plans under which amounts to be paid as retirement benefits are determined by contributions to a fund together with investment earnings thereon. The employer's obligations in respect of its employees current and prior years' employment service are discharged by contributions to the fund.
Deposits from central banks
Deposits of all classes, including loans and money market operations, received from the Bank of Spain and other central banks.
Deposits from credit institutions
Deposits of all classes, including loans and money market operations received, from credit entities.
A-56
Deposits from customers
Redeemable cash balances received by the entity, with the exception of debt certificates, money market operations through counterparties and subordinated liabilities, which are not received from either central banks or credit entities. This category also includes cash deposits and consignments received that can be readily withdrawn.
Derivatives The fair value in favor (assets) or again (liabilities) of the entity of derivatives not designated as accounting hedges.
Derivatives - Hedging derivatives
Derivatives designated as hedging instruments in an accounting hedge. The fair value or future cash flows of those derivatives is expected to offset the differences in the fair value or cash flows of the items hedged.
Diluted earnings per share
Calculated by using a method similar to that used to calculate basic earnings per share; the weighted average number of shares outstanding, and the profit attributable to the parent company corresponding to ordinary shareholders of the entity, if appropriate, is adjusted to take into account the potential dilutive effect of certain financial instruments that could generate the issue of new Bank shares (share option commitments with employees, warrants on parent company shares, convertible debt instruments, etc.).
Dividends and retributions
Dividend income collected announced during the year, corresponding to profits generated by investees after the acquisition of the stake.
Early retirements Employees that no longer render their services to the entity but which, without being legally retired, remain entitled to make economic claims on the entity until they formally retire.
Economic capital Methods or practices that allow banks to consistently assess risk and attribute capital to cover the economic effects of risk-taking activities.
Effective interest rate
Discount rate that applied to the cash flows estimated over the expected life of the instrument based on its contractual period as well as its anticipated amortization, but without taking the future losses of credit risk into consideration, equals the fair value of a financial instrument.
Employee expenses
All compensation accrued during the year in respect of personnel on the payroll, under permanent or temporary contracts, irrespective of their jobs or functions, irrespective of the concept, including the current costs of servicing pension plans, own share based compensation schemes and capitalized personnel expenses. Amounts reimbursed by the state Social Security or other welfare entities in respect of employee illness are deducted from personnel expenses.
Equity
The residual interest in an entity's assets after deducting its liabilities. It includes owner or venturer contributions to the entity, at incorporation and subsequently, unless they meet the definition of liabilities, and accumulated net profits or losses, fair value adjustments affecting equity and, if warranted, non-controlling interests.
Equity instruments An equity instrument that evidences a residual interest in the assets of an entity, that is after deducting all of its liabilities.
Equity instruments issued other than capital
Includes equity instruments that are financial instruments other than “Capital” and “Equity component of compound financial instruments”.
Equity Method
Is a method of accounting whereby the investment is initially recognized at cost and adjusted thereafter for the post-acquisition change in the investor’s share of the investee’s net assets. The investor’s profit or loss includes its share of the investee’s profit or loss and the investor’s other comprehensive income includes its share of the investee’s other comprehensive income.
Exchange/translation differences
Exchange differences (P&L): Includes the earnings obtained in currency trading and the differences arising on translating monetary items denominated in foreign currency to the functional currency. Exchange differences (valuation adjustments): those recorded due to the translation of the financial statements in foreign currency to the functional currency of the Group and others recorded against equity.
Exposure at default EAD is the amount of risk exposure at the date of default by the counterparty.
A-57
Fair value The price that would be received to sell an asset or paid to transfer a liability in an orderly transaction between market participants at the measurement date.
Fair value hedges
Derivatives that hedge the exposure to changes in the fair value of assets and liabilities or firm commitments that have not be recognized, or of an identified portion of said assets, liabilities or firm commitments, attributable to a specific risk, provided it could affect the income statement.
Financial guarantees
Contracts that require the issuer to make specified payments to reimburse the holder for a loss it incurs when a specified debtor fails to make payment when due in accordance with the original or modified terms of a debt instrument, irrespective of its instrumentation. These guarantees may take the form of deposits, technical or financial guarantees, insurance contracts or credit derivatives.
Financial guarantees given
Transactions through which the entity guarantees commitments assumed by third parties in respect of financial guarantees granted or other types of contracts.
Financial instrument A financial instrument is any contract that gives rise to a financial asset of one entity and to a financial liability or equity instrument of another entity.
Financial liabilities at amortized cost
Financial liabilities that do not meet the definition of financial liabilities designated at fair value through profit or loss and arise from the financial entities' ordinary activities to capture funds, regardless of their instrumentation or maturity.
Goodwill Goodwill acquired in a business combination represents a payment made by the acquirer in anticipation of future economic benefits from assets that are not able to be individually identified and separately recognized.
Gross Income Sum of net interest income, dividend income, share of profit or loss entities accounted for using the equity method, net fee and commission income, net gains and losses on financial assets and liabilities, net exchange differences and net other operating income.
Hedges of net investments in foreign operations
Foreign currency hedge of a net investment in a foreign operation.
Held for trading (assets and liabilities)
Financial assets and liabilities acquired or incurred primarily for the purpose of profiting from variations in their prices in the short term. This category also includes financial derivatives not qualifying for hedge accounting, and in the case of borrowed securities, financial liabilities originated by the firm sale of financial assets acquired under repurchase agreements or received on loan (“short positions”).
Held-to-maturity investments
Held-to-maturity investments are financial assets traded on an active market, with fixed maturity and fixed or determinable payments and cash flows that an entity has the positive intention and financial ability to hold to maturity.
Impaired financial assets
A financial asset is deemed impaired, and accordingly restated to fair value, when there is objective evidence of impairment as a result of one or more events that give rise to: a) A measurable decrease in the estimated future cash flows since the initial recognition of those assets in the case of debt instruments (loans and receivables and debt securities). b) A significant or prolonged drop in fair value below cost in the case of equity instruments.
Income from equity instruments
Dividends and income on equity instruments collected or announced during the year corresponding to profits generated by investees after the ownership interest is acquired. Income is recognized gross, i.e., without deducting any withholdings made, if any.
Insurance contracts linked to pensions
The fair value of insurance contracts written to cover pension commitments.
Inventories
Assets, other than financial instruments, under production, construction or development, held for sale during the normal course of business, or to be consumed in the production process or during the rendering of services. Inventories include land and other properties held for sale at the real estate development business.
A-58
Investment properties Investment property is property (land or a building—or part of a building—or both) held (by the owner or by the lessee under a finance lease) to earn rentals or for capital appreciation or both, rather than for own use or sale in the ordinary course of business.
Joint arrangement An arrangement of which two or more parties have joint control.
Joint control The contractually agreed sharing of control of an arrangement, which exists only when decisions about the relevant activities require the unanimous consent of the parties sharing control.
Joint operation
A joint arrangement whereby the parties that have joint control of the arrangement have rights to the assets of the arrangement and obligations for the liabilities. A joint venturer shall recognize the following for its participation in a joint operation: a) its assets, including any share of the assets of joint ownership; b) its liabilities, including any share of the liabilities incurred jointly; c) income from the sale of its share of production from the joint venture; d) its share of the proceeds from the sale of production from the joint venturer; and e) its expenses, including any share of the joint expenses. A joint venturer shall account for the assets, liabilities, income and expenses related to its participation in a joint operation in accordance with IFRS applicable to the assets, liabilities, income and expenses specific question.
Joint venture
A joint arrangement whereby the parties that have joint control of the arrangement have rights to the net assets of the arrangement. A joint venturer shall recognize its interest in a joint venture as an investment and shall account for that investment using the equity method in accordance with IAS 28 Investments in Associates and Joint Ventures.
Leases
A lease is an agreement whereby the lessor conveys to the lessee in return for a payment or series of payments the right to use an asset for an agreed period of time, a stream of cash flows that is essentially equivalent to the combination of principal and interest payments under a loan agreement. a) A lease is classified as a finance lease when it substantially transfers all the risks and rewards incidental to ownership of the asset forming the subject-matter of the contract. b) A lease will be classified as operating lease when it is not a financial lease.
Liabilities included in disposal groups classified as held for sale
The balance of liabilities directly associated with assets classified as non-current assets held for sale, including those recognized under liabilities in the entity's balance sheet at the balance sheet date corresponding to discontinued operations.
Liabilities under insurance contracts
The technical reserves of direct insurance and inward reinsurance recorded by the consolidated entities to cover claims arising from insurance contracts in force at period-end.
Loans and advances to customers
Loans and receivables, irrespective of their type, granted to third parties that are not credit entities.
Loans and receivables
Financial instruments with determined or determinable cash flows and in which the entire payment made by the entity will be recovered, except for reasons attributable to the solvency of the debtor. This category includes both the investments from the typical lending activity (amounts of cash available and pending maturity by customers as a loan or deposits lent to other entities, and unlisted debt certificates), as well as debts contracted by the purchasers of goods, or users of services, that form part of the entity’s business. It also includes all finance lease arrangements in which the consolidated subsidiaries act as lessors.
Loss given default (LGD)
It is the estimate of the loss arising in the event of default. It depends mainly on the characteristics of the counterparty, and the valuation of the guarantees or collateral associated with the asset.
Mortgage-covered bonds
Financial asset or security created from mortgage loans and backed by the guarantee of the mortgage loan portfolio of the entity.
A-59
Net Operating Income
Gross income less administrative costs, amortization, provisions and impairment losses on financial assets.
Non performing financial guarantees given
The balance of non performing risks, whether for reasons of default by customers or for other reasons, for financial guarantees given. This figure is shown gross: in other words, it is not adjusted for value corrections (loan loss reserves) made.
Non-Performing Loans (NPL)
The balance of non performing risks, whether for reasons of default by customers or for other reasons, for exposures on balance loans to customers. This figure is shown gross: in other words, it is not adjusted for value corrections (loan loss reserves) made.
Non-controlling interests
The net amount of the profit or loss and net assets of a subsidiary attributable to associates outside the group (that is, the amount that is not owned, directly or indirectly, by the parent), including that amount in the corresponding part of the consolidated earnings for the period.
Non-current assets and disposal groups held for sale
A non-current asset or disposal group, whose carrying amount is expected to be realized through a sale transaction, rather than through continuing use, and which meets the following requirements: a) it is immediately available for sale in its present condition at the balance sheet date, i.e. only normal procedures are required for the sale of the asset. b) the sale is considered highly probable.
Non-monetary assets Assets and liabilities that do not provide any right to receive or deliver a determined or determinable amount of monetary units, such as tangible and intangible assets, goodwill and ordinary shares subordinate to all other classes of capital instruments.
Option risk Risks arising from options, including embedded options.
Other financial assets/liabilities at fair value through profit or loss
Instruments designated by the entity from the inception at fair value with changes in profit or loss. An entity may only designate a financial instrument at fair value through profit or loss, if doing so more relevant information is obtained, because: a) It eliminates or significantly reduces a measurement or recognition inconsistency (sometimes called "accounting mismatch") that would otherwise arise from measuring assets or liabilities or recognizing the gains and losses on them on different bases. It might be acceptable to designate only some of a number of similar financial assets or financial liabilities if doing so a significant reduction (and possibly a greater reduction than other allowable designations) in the inconsistency is achieved. b) The performance of a group of financial assets or financial liabilities is managed and evaluated on a fair value basis, in accordance with a documented risk management or investment strategy, and information about the group is provided internally on that basis to the entity´s key management personnel. These are financial assets managed jointly with “Liabilities under insurance contracts” measured at fair value, in combination with derivatives written with a view to significantly mitigating exposure to changes in these contracts' fair value, or in combination with financial liabilities and derivatives designed to significantly reduce global exposure to interest rate risk. These headings include customer loans and deposits effected via so-called unit-linked life insurance contracts, in which the policyholder assumes the investment risk.
Other Reserves
This heading is broken down as follows: i) Reserves or accumulated losses of investments in subsidiaries, joint ventures and associate: include the accumulated amount of income and expenses generated by the aforementioned investments through profit or loss in past years. ii) Other: includes reserves different from those separately disclosed in other items and may include legal reserve and statutory reserve.
A-60
Other retributions to employees long term
Includes the amount of compensation plans to employees long term
Own/treasury shares The amount of own equity instruments held by the entity.
Past service cost It is the change in the present value of the defined benefit obligation for employee service in prior periods, resulting in the current period from the introduction of, or changes to, post-employment benefits or other long-term employee benefits.
Post-employment benefits
Retirement benefit plans are arrangements whereby an enterprise provides benefits for its employees on or after termination of service.
Potential problem risk
All debt instruments and contingent risks which do not meet the criteria to be classified individually as non-performing or written-off, but show weaknesses that may entail for the entity the need to assume losses greater than the hedges for impairment of risks subject to special monitoring.
Probability of default (PD)
It is the probability of the counterparty failing to meet its principal and/or interest payment obligations. The PD is associated with the rating/scoring of each counterparty/transaction.
Property, plant and equipment/tangible assets
Buildings, land, fixtures, vehicles, computer equipment and other facilities owned by the entity or acquired under finance leases.
Provisions Provisions include amounts recognized to cover the Group’s current obligations arising as a result of past events, certain in terms of nature but uncertain in terms of amount and/or cancellation date.
Provisions for contingent liabilities and commitments
Provisions recorded to cover exposures arising as a result of transactions through which the entity guarantees commitments assumed by third parties in respect of financial guarantees granted or other types of contracts, and provisions for contingent commitments, i.e., irrevocable commitments which may arise upon recognition of financial assets.
Provisions for pensions and similar obligation
Constitutes all provisions recognized to cover retirement benefits, including commitments assumed vis-à-vis beneficiaries of early retirement and analogous schemes.
Provisions or (-) reversal of provisions
Provisions recognized during the year, net of recoveries on amounts provisioned in prior years, with the exception of provisions for pensions and contributions to pension funds which constitute current or interest expense.
Recurring revenues Include net interest margin and income and expenses relating to commissions and similar fees.
Refinanced Operation An operation which is totally or partially brought up to date with its payments as a result of a refinancing operation made by the entity itself or by another company in its group.
Refinancing Operation
An operation which, irrespective of the holder or guarantees involved, is granted or used for financial or legal reasons related to current or foreseeable financial difficulties that the holder(s) may have in settling one or more operations granted by the entity itself or by other companies in its group to the holder(s) or to another company or companies of its group, or through which such operations are totally or partially brought up to date with their payments, in order to enable the holders of the settled or refinanced operations to pay off their loans (principal and interest) because they are unable, or are expected to be unable, to meet the conditions in a timely and appropriate manner.
Renegotiated Operation
An operation whose financial conditions are modified when the borrower is not experiencing financial difficulties, and is not expected to experience them in the future, i.e. the conditions are modified for reasons other than restructuring.
Renewal Operation
An operation arranged to replace another one granted previously by the entity itself, when the borrower is not experiencing financial difficulties, and is not expected to experience them in the future, i.e. the operation is arranged for reasons other than refinancing.
Repricing risk Risks related to the timing mismatch in the maturity and repricing of assets and liabilities and off-balance sheet short and long-term positions.
A-61
Restructured Operation
An operation whose financial conditions are modified for economic or legal reasons related to the holder's (or holders') current or foreseeable financial difficulties, in order to enable payment of the loan (principal and interest), because the holder is unable, or is expected to be unable, to meet those conditions in a timely and appropriate manner, even if such modification is provided for in the contract. In any event, the following are considered restructured operations: operations in which a haircut is made or assets are received in order to reduce the loan, or in which their conditions are modified in order to extend their maturity, change the amortization table in order to reduce the amount of the installments in the short term or reduce their frequency, or to establish or extend the grace period for the principal, the interest or both; except when it can be proved that the conditions are modified for reasons other than the financial difficulties of the holders and, are similar to those applied on the market on the modification date for operations granted to customers with a similar risk profile.
Retained earnings Accumulated net profits or losses recognized in the income statement in prior years and retained in equity upon distribution.
Securitization fund A fund that is configured as a separate equity and administered by a management company. An entity that would like funding sells certain assets to the securitization fund, which, in turn, issues securities backed by said assets.
Share premium The amount paid in by owners for issued equity at a premium to the shares' nominal value.
Short positions Financial liabilities arising as a result of the final sale of financial assets acquired under repurchase agreements or received on loan.
Significant influence
Is the power to participate in the financial and operating policy decisions of the investee but is not control or joint control of those policies. If an entity holds, directly or indirectly (i.e. through subsidiaries), 20 per cent or more of the voting power of the investee, it is presumed that the entity has significant influence, unless it can be clearly demonstrated that this is not the case. Conversely, if the entity holds, directly or indirectly (i.e. through subsidiaries), less than 20 per cent of the voting power of the investee, it is presumed that the entity does not have significant influence, unless such influence can be clearly demonstrated. A substantial or majority ownership by another investor does not necessarily preclude an entity from having significant influence. The existence of significant influence by an entity is usually evidenced in one or more of the following ways: a) representation on the board of directors or equivalent governing body of the investee; b) participation in policy-making processes, including participation in decisions about dividends or other distributions; c) material transactions between the entity and its investee; d) interchange of managerial personnel; or e) provision of essential technical information.
Stockholders' funds Contributions by stockholders, accumulated earnings recognized in the income statement and the equity components of compound financial instruments.
Structured credit products
Special financial instrument backed by other instruments building a subordination structure.
A-62
Structured Entities
A structured entity is an entity that has been designed so that voting or similar rights are not the dominant factor in deciding who controls the entity, such as when any voting rights relate to administrative tasks only and the relevant activities are directed by means of contractual arrangements. A structured entity often has some or all of the following features or attributes: a) restricted activities. b) a narrow and well-defined objective, such as to effect a tax-efficient lease, carry out research and development activities, provide a source of capital or funding to an entity or provide investment opportunities for investors y passing on risks and rewards associated with the assets of the structured entity to investors. c) insufficient equity to permit the structured entity to finance its activities without subordinated financial support. d) financing in the form of multiple contractually linked instruments to investors that create concentrations of credit or other risks (tranches).
Subordinated liabilities
Financing received, regardless of its instrumentation, which ranks after the common creditors in the event of a liquidation.
Subsidiaries
Companies over which the Group exercises control. An entity is presumed to have control over another when it possesses the right to oversee its financial and operational policies, through a legal, statutory or contractual procedure, in order to obtain benefits from its economic activities. Control is presumed to exist when the parent owns, directly or indirectly through subsidiaries, more than one half of an entity's voting power, unless, exceptionally, it can be clearly demonstrated that ownership of more than one half of an entity's voting rights does not constitute control of it. Control also exists when the parent owns half or less of the voting power of an entity when there is: a) an agreement that gives the parent the right to control the votes of other shareholders; b) power to govern the financial and operating policies of the entity under a statute or an agreement; power to appoint or remove the majority of the members of the board of directors or equivalent governing body and control of the entity is by that board or body; c) power to cast the majority of votes at meetings of the board of directors or equivalent governing body and control of the entity is by that board or body.
Tax liabilities All tax related liabilities except for provisions for taxes.
Territorials bonds Financial assets or fixed asset security issued with the guarantee of portfolio loans of the public sector of the issuing entity
Tier 1 Capital Includes: Common stock, parent company reserves, reserves in consolidated companies, non-controlling interests, deduction and others and attributed net income
Tier 2 Capital Includes: Subordinated, preferred shares, generic countable and non- controlling interest
Unit-link
This is life insurance in which the policyholder assumes the risk. In these policies, the funds for the technical insurance provisions are invested in the name of and on behalf of the policyholder in shares of Collective Investment Institutions and other financial assets chosen by the policyholder, who bears the investment risk.
A-63
Value at Risk (VaR)
Value at Risk (VaR) is the basic variable for measuring and controlling the Group’s market risk. This risk metric estimates the maximum loss that may occur in a portfolio’s market positions for a particular time horizon and given confidence level VaR figures are estimated following two methodologies: · 'VaR without smoothing, which awards equal weight to the daily information for the immediately preceding last two years. This is currently the official methodology for measuring market risks vis-à-vis limits compliance of the risk. · VaR with smoothing, which weighs more recent market information more heavily. This is a metric which supplements the previous one. VaR with smoothing adapts itself more swiftly to the changes in financial market conditions, whereas VaR without smoothing is, in general, a more stable metric that will tend to exceed VaR with smoothing when the markets show less volatile trends, while it will tend to be lower when they present upturns in uncertainty.
Yield curve risk Risks arising from changes in the slope and the shape of the yield curve.